Embed Size (px)
Citation preview
Inlet temperature driven supercritical bifurcation of
combustion instabilities in a Lean Premixed
Prevaporized combustor
Xiao Hana,b, Davide Laerab, Aimee S. Morgansb, Yuzhen Lina,Chi Zhanga,∗, Xin Huia, Chih-Jen Sungc
aNational Key Laboratory of Science and Technology on Aero-EngineAero-thermodynamics, Co-innovation Center for Advanced Aero-Engine, School ofEnergy and Power Engineering, Beihang University, Beijing, 100083, P. R. China
bDepartment of Mechanical Engineering, Imperial College London, London SW7 2AZ,UK
cDepartment of Mechanical Engineering, University of Connecticut, Storrs, CT 06269,USA
Abstract
The present article reports experimental observation and analyses of asupercritical bifurcation of combustion instabilities triggered by the air inlettemperature (Ta). The studies are performed with a pressurised kerosenefuelled Lean Premixed Prevaporized (LPP) combustor operated under ele-vated temperature. Unlike some previous studies, starting from an unstablecondition of the system, the amplitude of combustion instabilities suddenlydecrease when Ta exceeds a critical value of Ta=570 K. When the tempera-ture is lowered back the system returns to being unstable without featuringany hysteresis behaviour, as expected in case of a supercritical bifurcation.The unstable flames feature a periodic axial motion of lift-off and re-ignition,characterized as Helmholtz mode. The phase difference between chemilumi-nescence and pressure signals is found to increase with Ta, exceeding 90degrees (out of phase) for temperatures higher than 570 K. A low ordernetwork framework is conducted, illustrating that when Ta is increased astability shift of this mode is predicted at Ta near 570 K, in good agreementwith the experimental observations. The impact of Ta on the spray charac-teristics is also examined, finding that higher Ta promotes fuel evaporation
∗Corresponding author: [email protected]
Preprint submitted to Experimental Thermal and Fluid Science June 28, 2019

and reduces equivalence ratio fluctuation at the exit of the swirler.
Keywords:LPP Combustor, Spray Flame, Supercrtical Bifurcation, Inlet Temperature,Combustion Instabilities
1. Introduction1
Modern gas turbines for power generation and aero-engines are usually2
operated with lean premixed prevaporized (LPP) combustors to reduce the3
NOx emissions [1]. One of the main design challenges of the lean combus-4
tion process is to suppress instabilities that arise in this type of device, these5
typically result in a resonant coupling between pressure fluctuations (p′) and6
heat release rate oscillations (q′) produced by the combustion [2]. This kind7
of coupling is unfortunately promoted in these configurations as they feature8
flame properties that are more sensitive to perturbations. Combustion insta-9
bilities are an undesirable behaviour that needs to be avoided since they have10
many detrimental effects such as augmented vibrations, increased heat load11
to the combustor walls, flame flashback or blowout and they lead in extreme12
cases to mechanical failure [3, 4].13
In practice, combustion instabilities of a given combustor are highly sensi-14
tive to many operating conditions, such as equivalence ratio [5], stratification15
ratio [6], inlet mass flow rate [7, 8], temperature [9, 10], etc. It has been pre-16
viously observed that oscillations amplitudes can change dramatically when17
combustor operation parameters pass through some critical values [11]. In18
dynamical system theory, this behaviour is usually called ”bifurcation” and19
the parameter values at which they occur is called the bifurcation point (or20
Hopf point) [12]. Figure 1 shows two diagrams, describing the bifurcation21
dynamics as a function of a control parameter R. The nonlinear behaviour22
around the Hopf bifurcation point determines two different types of bifur-23
cation: Fig. 1(a) shows a supercritical bifurcation, which is characterised24
by a gradual increase of the amplitude when the control parameter reaches25
the bifurcation point. The second bifurcation type shown in Fig. 1(b) is a26
subcritical bifurcation which features a sudden jump when the control pa-27
rameter exceeds the Hopf bifurcation value. Upon reaching the limit cycle28
equilibrium, the system stays in the high amplitude branch even for values29
of R lower than the one corresponding to the Hopf point, until the fold point30
is reached.31
2

The above-described bifurcation phenomena for a thermoacoustic system32
have been studied numerically and experimentally in recent decades with a33
focus on gaseous laminar flames [13], swirling turbulent flames [9, 10] in lon-34
gitudinal systems, such as a Rijke tube [14, 15], and recently, also for annular35
combustors [16]. According to these studies, a variation of certain operat-36
ing conditions induces a modification of the nonlinear flame response to the37
incoming acoustic perturbations, the Flame Describing Function (FDF), the38
interaction between p′ and q′ is consequently altered, leading to a drift of39
the thermoacoustic status of the combustion system. Two physical mecha-40
nisms can lead to bifurcations: (1) the change of flame dynamics leading to41
a modification of the gain of the FDF [10, 17, 18]; (2) change of convection42
time, i.e., variation in the FDF phase [5, 19, 20]. These two effects are now43
discussed below.44
The link between flame shape transitions and the thermoacoustic bifur-45
cation behaviour of a combustor is discussed by multiple authors, e.g., see46
the experimental work of Broda et al. [9] and the LES study by Huang et47
al. [10]. They have found that the instability triggered by increasing the48
inlet air temperature and the equivalence ratio is linked to a modification of49
the flame shape which is characterised by a more enhanced penetration of50
the heat release zone in the corner recirculation zone. Different flame shapes51
and locations in stable and unstable cases were also observed by Moeck et52
al. [17]. A nonlinear model based on perturbation of equivalence ratio and53
flame speed was proposed to reproduce the phenomenon. For the impact of54
the convection time, the first study was performed by Janus et al. [19]. A55
theoretical model was defined and successfully reproduced the experimental56
results revealing the importance of the convection time to described inlet57
temperature-triggered bifurcation phenomena. A recent study of the equiv-58
alence ratio-triggered bifurcation also emphasises the importance of convec-59
tion time, while keeping nearly constant the gain of the FDF in varying60
conditions [5]. An instability region prediction method based on the ratio of61
convection time to the oscillation period Cn = τ/T has been developed and62
validated [21].63
A smaller group of studies deal with systems where the fuel is injected as64
a spray, a configuration more common in practical combustors but charac-65
terised by an increased level of complexity. Indeed, the spray dynamics and66
its evaporation is found to have a direct impact on the flame properties [22–67
25]. Some early experiments of hysteresis phenomena in combustion are68
reported by Providakis et al [26] showing two different time-averaged flame69
3

Figure 1: Examples of bifurcation diagrams with the variation of a control parameter R.(a) Supercritical bifurcation and (b) subcritical bifurcation [18]. As the control parameterR is increased, the system follows the red arrow path. As it is decreased, the systemfollows the blue arrow path. (For interpretation of the references to colour in this figurelegend, the reader is referred to the web version of this article.)
shapes at the same fuel split ratio when operated with different routines.70
These two flames have found to be characterised by different thermoacoustic71
properties [27] and the transition between the two states is observed to be72
triggered by acoustic field perturbations [28]. As discussed for gaseous flames,73
large-scale flame dynamics characterise the thermoacoustic oscillations. Both74
global motions involving flame lift-off and re-ignition [29] and local flame sur-75
face dynamics within the combustor corner region [30] have been observed.76
Given the intrinsic partially premixed nature of spray flames, the impact77
of equivalence ratio fluctuations on the thermoacoustic stability is also non-78
negligible. Han et al. [31] have found with the increase of inlet temperature,79
the amplitude of combustion instabilities drop non-linearly. However, due80
to limited conditions, a comprehensive conclusion was not obtained and the81
relation between inlet air temperature and combustion instabilities in spray82
flames still remains unanswered.83
In the present study, we aim to fill this gap by presenting experiments and84
modelling analysis of a kerosene-fuelled LPP combustor. The combustor is85
operated at elevated pressure and varying inlet temperatures. This article is86
organised as follows. At first, the experiment setup and results are presented.87
Spectra of the multiple signals and images of flame dynamics are shown. The88
phase relationship between the heat release rate and pressure is also analysed.89
Further analysis is conducted using low order network analysis and spray90
property estimation.91
4

Figure 2: Schematic view of the a) combustion test rig with pressure and optical measure-ments locations indicated, b) the setup of equivalence ratio fluctuation measurements.
2. Experimental setup92
In the present work, a centrally-staged LPP combustor with the pilot93
stage and main stage is used, fuelled with Chinese kerosene RP-31. Air is94
injected through two different coaxial swirlers (diagonal and axial) with the95
main air mass flow passing through the diagonal passage. Further informa-96
tion on this system can be found in Ref [33].97
Experiments are conducted at the High-pressure High-temperature Com-98
bustion Test Rig of Beihang University. This rig shown in Fig. 2 is designed99
for emission and combustion instability experiments of gas turbine combus-100
tors operated with a maximum air mass flow rate of 2 kg/s, which could be101
pre-heated to a maximum temperature of 850 K at 3MPa of total pressure.102
The air is compressed and stored in high-pressure tanks and then preheated103
using a heat exchanger without vitiation. The inlet consists of a perforated104
plate with an aperture ratio of 6%. The burnt gas exit is choked by an orifice.105
The inlet air mass flow rate ma is measured by a standard ASME orifice with106
an accuracy of 1%, while the fuel for the pilot and main stages of the com-107
bustor is measured by two Coriolis force flowmeters with an accuracy of 1%.108
The inlet temperature Ta and total pressure are continuously monitored by109
1This fuel has properties similar to the Jet-A [32].
5

a thermocouple and a total pressure probe just upstream of the combustor.110
Dynamic pressure sensors (PCB 112A22) are installed in positions up-111
stream and within the combustor, as shown in Fig. 2(a). Two sensors (PCB112
S112A22) are installed in the fuel supply lines for the pilot and main stage113
allowing to monitor the pressure fluctuations upstream of fuel injectors. PCB114
S112A22 is similar to 112A22, but is able to make direct contact with the115
fuel. The measuring range of the sensors is 0-345 kPa. A photomultiplier116
(PMT) of Hamamatsu H9306 is used to measure the global CH∗ chemilumi-117
nescence emissions as representative of heat release rate [34]. For most of the118
hydrocarbon molecules, absorption of 3.39 µm He-Ne laser occurs and can be119
used as a quantitative method to measure the mole fraction of either liquid120
or gaseous fuel [35]. Spray equivalence ratio fluctuations are measured at the121
outlet of the main stage (before combustion), as shown within Fig. 2(a). The122
incident laser is reflected to pass through the edge of the main stage channel123
and then received by an infrared detector module (IDM, Hamamatsu C12495-124
211S), as shown in Fig. 2(b). As no calibration is conducted, we only take125
the data for qualitative analysis in the present paper. The fuel mass flow126
rates for the two stages obtained by the Coriolis force flowmeters are also127
sampled. All data are collected by a DAQ system (National Instruments,128
NI9215) with a sampling frequency fs =8192 Hz and with a total length of129
30000 points for each condition. An intensified high-speed camera (Photron,130
Fastcam SA4) is used to capture the flame dynamics. The image dimension131
is 120 mm × 100 mm, corresponding to 768 × 640 pixels (length × height).132
A total of 4659 snapshots are obtained at a sampling rate of 6000 fps. Both133
the PMT and high-speed camera are equipped with CH∗ filters (430±5 nm).134
Table 1: Operating conditions for experiments.
ma Ta Pa FAR SRkg/s K MPa0.5 560→ 617→ 530 ∼0.50 0.021 30%
This work focuses on the effect of inlet temperature on combustion in-135
stabilities. During the experiments, the air mass flow rate ma is fixed at 0.5136
kg/s, while the inlet temperature Ta varies from 530 K to 617 K, with the137
operating pressure Pa at about 0.5 MPa. Considering the complexity of the138
heat exchanger and the large mass flow rate, it is very difficult to increase139
the inlet temperature continuously. Therefore a step of about 10 K is chosen,140
which is the minimum step that was achievable. The operating conditions141
6

are summarised in Tab. 1. The fuel to air ratio (FAR) is fixed at 0.021, corre-142
sponding to a total equivalence ratio of 0.31 with a staging ratio of 30%, i.e.,143
30% of the fuel enters through the pilot and the rest is injected in the main144
stage. The temperature is at first increased from 560 K to 617 K and then145
decreased back to 530 K to verify the presence of hysteresis phenomena. In146
total, ten operating conditions with different inlet temperatures have been147
recorded.148
3. Experimental results149
3.1. Characteristics of combustion oscillations150
Figure 3: Combustion oscillation amplitude as a function of inlet temperature. (a) Ampli-tude of the fluctuation of P ′4, (b) global intensity of CH* (normalised ) and (c) equivalenceratio (arbitrary scale). The dash line marks the critical inlet temperature of the bifurca-tion. The hollow black symbols mark the path of increasing inlet temperature, while thesolid blue symbols mark the path of decreasing temperature. A and B mark Ta=556 Kand Ta=573 K.
The system bifurcation map as a function of the air inlet temperature Ta151
is shown in Fig. 3, reporting (a) amplitude of the pressure fluctuations in all152
7

tested points, (b) the normalised fluctuation of global intensity of CH* and153
(c) equivalence ratio. The original data comes from P4 sensor, which is lo-154
cated in the combustor chamber and close to the flame. Chemiluminescence155
of CH* sampled by PMT is used as the indicator of heat release rate q′, while156
the infrared absorption signal is used as the representative of equivalence ra-157
tio φ′. The above data are post-processed via the Fast Fourier transform158
(FFT) method. Each data is divided into 6 segments and calculated sepa-159
rately. Figure 3 is then plotted with the mean amplitude of each parameter.160
The uncertainties of oscillation are marked as error bars. The scattering of161
the amplitude is within 35%, which is normal and also observed in other con-162
figurations, as combustion instabilities are nonlinear phenomenon [6, 14, 15].163
For conditions above 570 K, the error bars are not visible as the amplitude164
is too small. By varying the inlet air temperature a supercritical bifurcation165
is clearly observed in Figs 3. Inlet air temperature Ta is set at 560 K at166
first and increases step-by-step to 617 K (marked as the hollow black sym-167
bols in Fig. 3). Then the Ta drops back to 530 K (marked as the solid blue168
symbols in Fig. 3). It is found with Ta=560 K, the combustor is unstable169
with a high amplitude of 1.8 kPa. Once increasing the Ta beyond 570 K,170
the amplitude drops to near-zero until 617 K. As the Ta decreases back, the171
amplitude remains low until 570 K is reached. Further reduction of Ta to172
530 K leads to a progressive increase of the amplitude of the oscillations,173
following the similar path back to the previous status, without the hysteresis174
phenomena (as indicated by the blue arrows in Fig. 3 plots). This behaviour175
of combustion instabilities as a function of inlet air temperature meets the176
description of supercritical bifurcation mentioned above. A Hopf bifurcation177
point of Tair,Hopf ≈ 570 K is found (indicated with the dashed vertical line in178
Fig. 3), above which the system stabilises. Finally, strong combustion insta-179
bilities characterised by high amplitudes of pressure fluctuations p′ together180
with large oscillations of q′ and φ′ are found when the inlet air temperature181
is set to the lowest Ta of 530 K. Therefore, two representative test conditions182
crossing the bifurcation line are chosen for further discussion, as marked with183
A and B in Fig. 3. Condition A is unstable with Ta=560 K while B is stable184
with Ta=573 K.185
Figure 4(a-b) reports a further analysis of the pressure signals recorded186
by the P4 sensor for condition A and B. In each subfigure, the time series are187
shown in the top half while the spectrum (left), phase space reconstruction188
(middle), and probability distribution (right). The phase space is recon-189
structed following the method proposed in [36, 37]. Firstly, an embedding190
8

0.01 0.02 0.03 0.04 0.05 0.06 0.07
-10
-5
0
5
10
0 250 500 750 1000
0
1
2
3
4
-10
-10
0
0 -10
10
010 10 -10 0 10
0
0.2
0.4
0.6
(a)
0.01 0.02 0.03 0.04 0.05 0.06 0.07
-10
-5
0
5
10
0 250 500 750 1000
0
1
2
3
4
-10
-10
0
0 -10
10
010 10 -10 0 10
0
0.2
0.4
0.6
(b)
Figure 4: Pressure fluctuation of P4 sensor for conditions of (a) Ta = 556 K and (b)Ta = 573 K (marked as A and B in Fig. 3). In each subfigure, the time series are shown inthe top half while the spectrum (left), phase space reconstruction (middle), and probabilitydistribution (right) are shown below.
9

0 200 400 600 800 10000
0.1
0.2
0.3
0.4
0.5
(a)
0 200 400 600 800 10000
0.5
1
1.5
2
(b)
0 200 400 600 800 10000
0.5
1
1.5
2
(c)
0 200 400 600 800 10000
0.5
1
1.5
2
(d)
0 200 400 600 800 10000
0.5
1
1.5
2
(e)
0 200 400 600 800 10000
0.5
1
1.5
2
(f)
Figure 5: Spectra of the condition with Ta = 556 K. (a) normalised heat release ratefluctuation q′/¯q and (b) equivalence ratio fluctuation Φ′. Pressure fluctuation of fuelsupply lines of (c) the pilot stage and (d) the main stage. Mass flow rate fluctuation offuel supply lines of (e) the pilot stage and (f) the main stage.
10

dimension order of 3 is set for this study, trying to avoid the trajectories col-191
lapsing to show them clearly. Secondly, the time lag τlc is calculated to shift192
the signals apart. The auto-correlation function of the original signal P4′ is193
pre-plotted and then the time where the auto-correlation value drops to zero194
for the first time is chosen as τlc. Different time lags of τlc = 6/fs ≈ 0.73195
ms and τlc = 7/fs ≈ 0.85 ms are chosen conditions A and B, respectively.196
The differences are clear. With Ta = 556 K, a periodic signal is found with197
a main frequency 368 Hz and harmonic frequency 737 Hz. A clear annulus198
trajectory with some noise (caused by the non-linearity of the flame) is also199
found in the phase space plot, indicating a strong limit cycle type oscillation200
of the combustion system. A dual-peak probability distribution with wide201
pressure fluctuation range is found for condition A. On the contrary, the202
pressure signal in condition B features white noise characteristics with no203
discrete frequency peak. The trajectory in the phase space also collapses to204
a stable point. The distribution of P4′ in condition B follows a typical Gaus-205
sian distribution (normal distribution). These features indicate a combustion206
system that is thermoacoustically stable.207
Spectra of heat release rate fluctuations q′/¯q and of equivalence rate oscil-208
lations φ′ recorded at the condition A are shown in Fig. 5 (a) and (b). Both209
plots are dominated by the same oscillation with a peak frequency at 368210
Hz. As observed for the pressure signal P4′ (Fig. 4(a)), the spectrum of the211
heat release rate oscillations signal (Fig. 5(a)) shows a harmonic peak at 737212
Hz. This second peak is also found in the spectrum of φ′ (Fig. 5(b)). Spectra213
of the pressure recordings in fuel supply lines shown in Fig. 5 (c-f) revealing214
that the oscillations in both the pilot and the main stage (Fig. 5(c) and 5(d))215
are consistent with the one in the main chamber (Fig. 4(a)). In contrast, no216
peak is found in the spectra of the fuel mass flow rates shown in Fig. 5(e) and217
5(f). The pressure drop of liquid fuel in the pilot nozzle and the main stage218
injectors are of the order of 2.5 bar and 0.5 bar level, respectively, whereas219
the pressure fluctuations in the fuel supply are of merely 1 kPa level, suffi-220
cient to acoustically decouple the two systems. The fuel mass flow rate could221
then be considered constant in both stages. As a consequence, it is possible222
to conclude that the equivalence ratio oscillations φ′ found in Fig. 5(b) are223
mainly due to the velocity fluctuation of the inlet air.224
3.2. Flame dynamics225
The CH* chemiluminescence of flame is captured by the intensified high-226
speed camera with a CH* filter. The flame dynamics recorded under the un-227
11

Figure 6: Phase-averaged flame snapshots of the case with an inlet temperature of 556 K(condition A). Flow from the left to the right.
stable case for Ta=556 K (condition A in Fig. 3) are now discussed. Figure 6228
reports flame snapshots at six different times during the instability cycles.229
Experimental images are phase-averaged over 60 cycles. As already experi-230
enced in previous studies of spray flames [29, 38], a periodic axial movement231
with flame lift-off and re-ignition is clearly observed: (1) at θ=0◦ (Fig. 6(a))232
the flame appears attached to the injector; (2) Then it moves downstream233
with a subsequential lift-off from the injector at θ=60◦-180◦ (Fig. 6(b-d)).234
(3) Finally, at θ=240◦(Fig. 6(e)) the flame re-ignites downstream of the in-235
jector. At θ=300◦(Fig. 6(f)) the new flame kernel expands while the lifted236
flame tends to disappear.237
To better highlight the flame coherent structures at specific frequencies, a238
pixel-to-pixel Fourier transform method is performed on the flame snapshots.239
The dynamics of the mode at 368 Hz (the main frequency) and 737 Hz (the240
first harmonic) are shown in Fig. 7: the absolute values of the FFT results241
(Figs. 7(a,c)) indicate the global structures of the flame mode. The coherent242
flame structures are better shown by the normalised imaginary part of the243
two frequency shown in Figs. 7 (b,d). Both representations clearly confirm244
the axial periodic movement of the flame. The difference is that the mode245
in Fig. 7 (b) (f=368 Hz) is characterised by a length λ=100 mm, twice than246
that obtained in Fig. 7 (d) (f=737 Hz).247
Finally, space-integrating the intensity of the flame images, the time-248
signal of the total heat release rate Q′ can be retrieved. The signals of P4′
249
12

Figure 7: The pixel-to-pixel Fourier transform of flame images of the case with the inlettemperature of 556 K. (a) Normalised absolute value and (b) normalized imaginary partof flame dynamics at domain frequency at 368 Hz. (c) Normalised absolute value and (d)normalised imaginary part of flame dynamics at a harmonic frequency of 737 Hz.
13

-1.5
-1
-0.5
0
0.5
1
1.5
(a)
70 75 80 85-1.5
-1
-0.5
0
0.5
1
1.5
(b)
Figure 8: Phase relationship of P4′ and intensity fluctuation of flame images Q′. Unstable
cases: (a) Ta = 530 K, (b) Ta = 556 K.
14
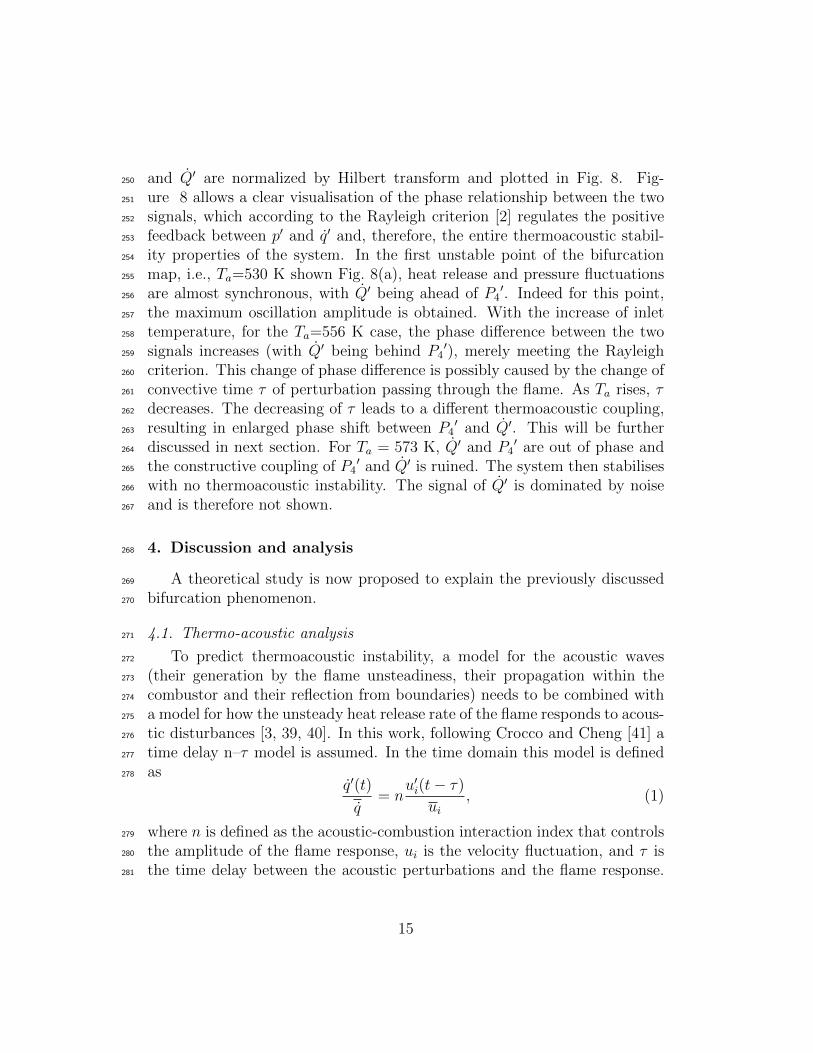
and Q′ are normalized by Hilbert transform and plotted in Fig. 8. Fig-250
ure 8 allows a clear visualisation of the phase relationship between the two251
signals, which according to the Rayleigh criterion [2] regulates the positive252
feedback between p′ and q′ and, therefore, the entire thermoacoustic stabil-253
ity properties of the system. In the first unstable point of the bifurcation254
map, i.e., Ta=530 K shown Fig. 8(a), heat release and pressure fluctuations255
are almost synchronous, with Q′ being ahead of P4′. Indeed for this point,256
the maximum oscillation amplitude is obtained. With the increase of inlet257
temperature, for the Ta=556 K case, the phase difference between the two258
signals increases (with Q′ being behind P4′), merely meeting the Rayleigh259
criterion. This change of phase difference is possibly caused by the change of260
convective time τ of perturbation passing through the flame. As Ta rises, τ261
decreases. The decreasing of τ leads to a different thermoacoustic coupling,262
resulting in enlarged phase shift between P4′ and Q′. This will be further263
discussed in next section. For Ta = 573 K, Q′ and P4′ are out of phase and264
the constructive coupling of P4′ and Q′ is ruined. The system then stabilises265
with no thermoacoustic instability. The signal of Q′ is dominated by noise266
and is therefore not shown.267
4. Discussion and analysis268
A theoretical study is now proposed to explain the previously discussed269
bifurcation phenomenon.270
4.1. Thermo-acoustic analysis271
To predict thermoacoustic instability, a model for the acoustic waves272
(their generation by the flame unsteadiness, their propagation within the273
combustor and their reflection from boundaries) needs to be combined with274
a model for how the unsteady heat release rate of the flame responds to acous-275
tic disturbances [3, 39, 40]. In this work, following Crocco and Cheng [41] a276
time delay n–τ model is assumed. In the time domain this model is defined277
as278
q′(t)
q= n
u′i(t− τ)
ui, (1)
where n is defined as the acoustic-combustion interaction index that controls279
the amplitude of the flame response, ui is the velocity fluctuation, and τ is280
the time delay between the acoustic perturbations and the flame response.281
15

Depending on the combustion system, different physical mechanisms are re-282
sponsible for the fluctuations of heat release oscillations and each one of them283
is characterized by a different characteristic timescale [3]. One strength of284
the time delay model proposed by Crocco is that the value assumed for τ285
can be chosen to describe the physical influence of the specific driving mech-286
anism. This work is focused on combustion instabilities occurring in gas287
turbine combustors [42]. Experimental tests [43] show that for these flames288
the main cause of heat release fluctuations (q′) is due to oscillations of the289
equivalence ratio φ′ which are caused by fluctuations of the air flow rate at290
the fuel injectors. Mathematically, this results in291
q′
q∼φ′inj(t− τ)
φinj, (2)
where inj refers to the injection location. The equivalence ratio fluctuations292
at the injection point can be derived from its definition293
φ′inj(t− τ)
φinj∼
[m′f (t− τ)
mf
− m′a(t− τ)
ma
], (3)
where mf is the mass flow rate of the fuel and ma is the mass flow rate of294
the air, ma=ρinjuinjAinj. Experimentally was observed that the injector is295
choked (i.e., m′f=0), so the equivalence ratio fluctuations depend only on296
m′a. Furthermore, neglecting the mean flow it is possible to conclude that297
equivalence ratio fluctuations, and, due to Eq. 2, heat release rate fluctuations298
are mainly influenced by velocity fluctuations. Following these assumptions,299
Eq. 2 combined with Eq. 3 results300
q′
q= −n
u′inj(t− τ)
uinj. (4)
The thermo-acoustic analysis can be carried out in the frequency do-301
main [3, 39, 44]. Applying the harmonic analysis to Eq. 4, in the limit of302
small perturbations [39], the linear Flame Transfer Function (FTF) is derived303
TL =uinj/uinj
ˆq/q= −ne−iωτ . (5)
An analytical approximation of the time delay τ of Eq. 5 will be proposed.304
In this stage, only the main stage of the LPP combustor sketched in Fig. 9305
16

Figure 9: Schematic of convection time from the fuel injection to the flame tip.
will be considered, since it delivers the major part of the air and the fuel in306
the combustor. Under the hypothesis of neglecting the injector lags and the307
chemical reaction times [3], the time delay τ correlated to the heat release308
rate driving mechanism can be assumed to be comprised of two parts:309
τ = τm + τf . (6)
where τm is the mixing time and τf is the convection time of perturbation310
moving from the flame base to the flame tip. Since the majority of the311
mixing happens in the main stage, it can be estimated as the ratio between312
the distance between the fuel injector and the exit of the swirlor Lm=23 mm313
(see Fig. 9) over the axial velocity Um inside the main stage, i.e., τm = Lm/Um314
. Following [21], τf can be assumed to be computed as τf = Lf/Uf , where315
Lf is the length from the flame base to the flame tip, a constant flame length316
of 80 mm is chosen. Uf is the axial velocity of the fluid velocity at the flame317
location. Considering the converging exit of the main stage, it is mainly318
controlled by the exit area Aexit and changes with different inlet temperatures319
Ta. The axial velocity inside the main stage Um is then estimated as 0.38320
times of Uf . The estimated convection time for all the inlet air temperature321
Ta is listed in Tab. 2.322
The defined FTF is now coupled in the open source low order network323
solver OSCILOS2 [45, 46] to predict the instability of the system for the differ-324
ent operative conditions. This code has been widely used for thermo-acoustic325
analyses and validated, e.g., see Refs. [47, 48] for atmospheric condition and326
[49] for high pressure configuration, and [46] for annular combustors. It rep-327
2http://www.oscilos.com
17

Table 2: Estimated convective time of cases with Ta ranging from 530 K to 617 K.
Ta (K) f (Hz) τm (ms) τf (ms) τ (ms) Status530 358 0.87 1.17 2.04 unstable
556 (Case A) 368 0.83 1.12 1.95 unstable573 (Case B) / 0.81 1.08 1.89 stable
589 / 0.79 1.05 1.84 stable596 / 0.78 1.04 1.82 stable617 / 0.75 1.01 1.76 stable
Figure 10: Simplified thermoacoustic network geometry used in OSCILOS.
resents the combustor geometry as a network of connected simple modules,328
as shown in Fig. 10. The length and cross-sectional area of each module329
reported in Tab. 3 match the original geometry. The mean flow is accounted330
for, with the mean flow variables assumed constant within each module,331
changing only between modules.332
As it is common practice in low-frequency thermo-acoustic analyses, that333
the acoustic waves are considered linear and one-dimensional. Thus within334
each module acoustic perturbations can be represented as the sum of up-335
stream and downstream travelling waves with different strengths. Linearised336
flow conservation equations are assumed between modules, accounting for337
losses due to the stagnation pressure drop at area expansions [50]. A pressure338
node is assumed at the plenum inlet (indicated in blue in Fig. 10), whereas339
the combustion chamber exit (indicated as choked orifice in Fig. 2) is ap-340
proximated as choked, by imposing an acoustic velocity node [51]. Given the341
compactness of the flame axial extension with respect to the wavelength of342
the measured acoustic modes, the heat release zone is assumed concentrated343
in an infinitely ”thin” flame sheet domain (indicated in red in Fig. 10). The344
18

Table 3: Geometry parameters for low order thermoacoustic model analysis.
Section Name Area (mm2) Length (mm)S1 Heat exchanger plenum 50247 200S2 Measuring section 15175 250S3 Flow straightening section 13860 250S4 Combustor plenum 22776 150S5 Swirler 820 35
S6Flame liner 1 11235 70Flame liner 2 11235→4708 118Flame liner 3 4708 24
linearised flow conservation jump equations proposed by [39] are imposed to345
link the acoustic strengths across this domain.346
-2 -1 0 1 2
0
100
200
300
400
500
600
700
800
900
1000
17.6
35
52.3
69.7
87
104.4
Figure 11: Stability map of Ta = 556 K (Case A), modelling with n=1.85 and τ = 1.9 ms.
At first, the complete stability map of the system is computed considering347
an inlet air temperature of Ta=556 K for which a time delay of τ=1.95 ms348
was estimated (Tab. 8), as shown in Fig. 11. In this analysis, a constant gain349
of n=1.85 is assumed. The complex frequencies, ω = σ + i2πf (with σ the350
growth rate), for which both the inlet and outlet boundary conditions are351
19

satisfied, are identified within OSCILOS. The computed modes are identified352
with white stars, showing that a mode at a frequency f = 367.7 Hz, close353
to the one measured experimentally (368 Hz), is predicted to be unstable354
(with positive growth rate but very close to zero). In Fig.12 the numerical355
mode shape (continuous blue line) of the unstable mode is compared with356
the experimental measurements (rectangular marks) from the six sensors P1357
to P6 along the test rig. The acoustic pressure is normalised with the cor-358
responding amplitude of the P4 sensor. In agreement with the experimental359
measurements, the pressure amplitude remains low in the plenum and fea-360
tures a jump in the combustion chamber where remains almost constant until361
the exit. This implies that the combustor chamber works as the volume of362
the Helmholtz resonator. This behaviour suggests that the combustion in-363
stabilities are coupled with the Helmholtz mode or bulk mode of the system,364
which is a behaviour that has been previously experienced in combustors365
featuring liquid fuel combustion [29, 38].366
0 0.2 0.4 0.6 0.8 1 1.20
0.5
1
1.5
OSCILOS
Experiments
Figure 12: Comparision of mode shape in the condition with Ta = 556 K (Case A).
The impact of the inlet air temperature on the stability of the combus-367
tor is now investigated. The previously described thermoacoustic analysis is368
repeated changing the inlet air temperature Ta and, accordingly, the FTF369
time delays τ . The analysis is repeated for three different values of the FTF370
gain, ranging from 1.7 to 2. Differently from before, only the unstable mode371
around 350 Hz of the system is considered. Results are shown in Fig. 13372
where the dependances of the resonant frequency f and growth rate σ on373
the FTF gain n and time delay τ is shown. Regardless of the value assumed374
20

for the interaction index n, increasing the inlet air temperature, i.e., decreas-375
ing the time delay, results in an increase of the resonant frequency and a376
reduction of the growth rate. This trend is in line with the experimental377
results presented in the previous sections, in which the system features less378
intense oscillation amplitudes for increasing inlet temperature until a stable379
condition is reached. Unfortunately, limit cycle amplitude information can-380
not be captured by the proposed linear analysis, this requires a nonlinear381
flame model [52, 53]. Nevertheless, a more solid validation of the proposed382
model can be achieved by focusing the attention on the condition for which a383
stability shift is predicted. As highlighted in Fig. 13, the system is predicted384
to be unstable until a time delay of τ ≈ 1.9 ms and a Ta ≈ 556 K are imposed385
in the model. This is in good agreement with the conditions observed at the386
Hopf bifurcation in both reported datasets (marked as A in Fig. 3). With387
higher n (higher flame response to acoustic perturbation), the growth rate388
lines move upward, meaning the system is moving towards to the unstable389
region, confirming the robustness of the proposed model.390
1.4 1.6 1.8 2 2.2 2.4300
350
400
450
368 Hz
Ta=678 K Ta=603 K Ta=543 K Ta=493 K Ta=452 K
n=1.7
n=1.85
n=2
1.4 1.6 1.8 2 2.2 2.4-200
-100
0
100
Bifurcation
Case ACase B
Figure 13: Dependence of the predicted frequency and growth rates upon τ for varyinginlet temperatures. The solid symbols stand for the operating conditions, while the hollowsymbols are hypothetical conditions to show a wider range of the trends.
21

4.2. The impact of the spray391
The impact of the spray dynamics and droplets evaporation on the ob-392
served bifurcation behaviour is now discussed.393
In the pilot stage, the spray characteristics are mainly affected by the fuel394
supply pressure which is kept almost constant. Furthermore, the fuel droplets395
enter into the combustion chamber immediately after being ejected. For these396
reasons it is possible to conclude that the impact of the inlet temperature on397
the pilot stage is negligible. The whole process of spray in the main stage398
can be simplified in two parts: a) the injection of fuel, b) the convection and399
vaporisation of the fuel. Based on the summaries of Mellor [54], an emprical400
equation is used to estimate the initial Sauter mean diameter (SMD) of401
droplet dini:402
dini = 0.73(ρadinj)0.5(
σlρaU2
θ
)0.5 + 0.04d0.55inj (µ2l
σlρl)0.45 (7)
where subscripts a stands for inlet air while l stands for liquid fuel. In403
Eq. 7, dinj is the diameter of the fuel injector (0.5 mm), ρa and Uθ are the404
density and velocity magnitude of the inlet air. Please note due to the swirl405
effect, the velocity magnitude that the fuel column faces is determined by406
Uθ = Um/ cos θ , where Um is the axial velocity inside the main stage and θ407
is the angle of the swirler vanes (60◦). The other variables σl, ρl and µl are408
the surface tension (0.027 N/m), density (780 kg/m3) and dynamic viscosity409
(0.001 Pa/s) of the liquid fuel, respectively.410
It is then necessary to estimate the evaporation time τe of the liquid411
droplets. A classical d2 law with convection correlation is used [55] here as412
d2ini − d2exit = τmNu∗Ke (8)
where d2exit is the fuel droplet diameter at the exit of the main stage. Ke413
is the evaporation coefficient while Nu∗ is Nusselt number, which can be414
estimated by the well-known Frossling correlations [56]. The equations for415
the above two parameters are as follows:416
Ke =8λaρacp
ln(1 +B) (9)
Nu∗ = 1 + 0.276Re0.5Pr0.33 (10)
22

where λa and cp is the thermal conductivity and specific heat capacity of air,417
respectively. The Spalding transfer number B = cp(Ta − Tl)/Lv is expressed418
regarding the temperature of air Ta and liquid fuel Tl and latent heat Lv (291419
kJ/kg). It is standard to evaluate the air properties by the “1/3 rule” with420
the reference temperature given by T = 1/3Ta + 2/3Tl. Here the liquid fuel421
temperature Tl is fixed at 300 K. Additive convection effects are taken into422
consideration by Eq. 10, where the Reynolds number Re = ρaUmdl/µa and423
Prandtl number Pr = µacp/λa.424
Finally, the evaporation ratio Revap can be calculated as:425
Revap =me
mf
= 1− d3exitd3l
(11)
450 500 550 600 650 700 75030
40
50
60
70
Bifurcation
450 500 550 600 650 700 75020%
40%
60%
80%
Bifurcation
Figure 14: Results of estimated spray properties with different inlet temperature. Thesquare and triangle symbols represent the SMD of the initial droplet and the evaporationratio Revap. The solid symbols stand for the operating conditions, while the hollow symbolsare hypothetical conditions to show a wider range of the trends.
The estimated spray properties with different inlet temperatures ranging426
from 450 K to 750 K are shown in Fig. 14. The square and triangle symbols427
represent the SMD of the initial droplet and the evaporation ratio Revap. The428
solid symbols stand for the operating conditions, while the hollow symbols429
23

are hypothetical conditions to show a wider range of the trends. With the430
given geometry, the inlet temperature has significant effects on the spray431
properties. With the increase of inlet temperature Ta, the initial SMD of the432
fuel droplet decreases, while the evaporation ratio Revap increases linearly.433
This means that with a higher Ta, more fuel is evaporated at the exit of434
swirler enhancing the premixing process happening in this zone of the system.435
The consequential reduction of the oscillations of the equivalence ratio, one436
of the instability driving mechanisms can then also be assumed to be one of437
the reasons leading to the system stabilisation.438
5. Conclusions439
The present article reports experimental observation and analysis of a440
supercritical bifurcation of combustion instabilities triggered by inlet tem-441
perature. The studies are performed with a kerosene-fuelled LPP combustor442
under elevated temperature and pressure conditions. The inlet temperature443
varies from 530 K to 617 K while all the other parameters keep fixed. The444
combustor features high amplitude oscillations at the low-temperatures from445
530 K to 556 K but becomes thermoacoustically stable suddenly once the446
inlet temperature exceeds 570 K and remains stable beyond that. Repeated447
experiments further confirm that this temperature triggered-bifurcation is448
supercritical without hysteresis behaviour.449
The oscillation characteristics are carefully demonstrated with signals450
sampled from different sensors, as well as the flame dynamics captured by451
a high-speed camera with a CH* filter. For the unstable cases, the flames452
feature a periodic axial motion of lift-off and re-ignition, which is also known453
as Helmholtz mode or bulk mode. The analysis shows that the phase differ-454
ence between chemiluminescence and pressure signals increases with the inlet455
temperature, and exceeds 90◦ when the temperature is higher than 570 K.456
The phase correlation between the heat release rate and pressure is therefore457
thought to be the major reason for the observed bifurcation.458
A thermoacoustic analysis is conducted with a low order network model459
to illustrate the effects of convection time on growth rate and frequency.460
With the increase of temperature, the estimated convection time decreases,461
resulting in a higher frequency and lower growth rate (indicating system to be462
stable). This agrees with the experimental observation. The effects of inlet463
temperature on spray properties are further examined by the estimation of464
SMD and the evaporation ratio of fuel droplets. With a higher Ta, more465
24

fuel is evaporated at the exit of swirler, enhancing the premixing process466
happening in this zone of the system. The consequential reduction of the467
oscillations of the equivalence ratio can then also be assumed to be one of468
the reasons leading to the system stabilisation.469
This study emphasizes the extreme sensitivity of the combustion insta-470
bilities to the inlet temperature and convection time in a complex spray LPP471
combustor. It could also help to improve the design of LPP combustors.472
6. Acknowledgment473
This work was financially supported by the National Natural Science474
Foundation of China (91641109, 51606004) and the European Research Coun-475
cil (grant no.772080) via the ERC Consolidator Grant AFIRMATIVE (2018-476
23).477
References478
[1] L. Li, Y. Lin, Z. Fu, C. Zhang, Emission characteristics of a model479
combustor for aero gas turbine application, Exp. Therm. Fluid Sci. 72480
(2016) 235–248.481
[2] L. Rayleigh, The explanation of certain acoustical phenomena, Roy. Inst.482
Proc. 8 (1878) 536–542.483
[3] T. C. Lieuwen, V. Yang, Combustion instabilities in gas turbine en-484
gines: operational experience, fundamental mechanisms, and modeling,485
American Institute of Aeronautics and Astronautics, 2005.486
[4] Y. M. Al-Abdeli, A. R. Masri, Review of laboratory swirl burners and487
experiments for model validation, Exp. Therm. Fluid Sci. 69 (2015) 178–488
196.489
[5] D. Ebi, A. Denisov, G. Bonciolini, E. Boujo, N. Noiray, Flame dynamics490
intermittency in the bi-stable region near a subcritical hopf bifurcation,491
J. Eng. Gas Turbines Power 140 (2017) 61504.492
[6] X. Han, D. Laera, A. S. Morgans, C.-J. Sung, X. Hui, Y. Lin, Flame493
macrostructures and thermoacoustic instabilities in stratified swirling494
flames, Proc. Combust. Inst. 37 (2019) 5377–5384.495
25

[7] J. Yoon, M.-K. Kim, J. Hwang, J. Lee, Y. Yoon, Effect of fuel–air mix-496
ture velocity on combustion instability of a model gas turbine combustor,497
Appl. Therm. Eng. 54 (2013) 92–101.498
[8] J. Kim, M. Jang, K. Lee, A. Masri, Experimental study of the beating499
behavior of thermoacoustic self-excited instabilities in dual swirl com-500
bustors, Exp. Therm. Fluid Sci. (2019).501
[9] J. Broda, S. Seo, R. Santoro, G. Shirhattikar, V. Yang, An experimen-502
tal study of combustion dynamics of a premixed swirl injector, Proc.503
Combust. Inst. 27 (1998) 1849–1856.504
[10] Y. Huang, V. Yang, Bifurcation of flame structure in a lean-premixed505
swirl-stabilized combustor: transition from stable to unstable flame,506
Combust. Flame 136 (2004) 383–389.507
[11] Y. Huang, V. Yang, Dynamics and stability of lean-premixed swirl-508
stabilized combustion, Prog. Energy Combust. Sci. 35 (2009) 293–364.509
[12] S. H. Strogatz, Nonlinear dynamics and chaos: with applications to510
physics, biology, chemistry, and engineering, CRC Press, 2018.511
[13] K. Kashinath, I. C. Waugh, M. P. Juniper, Nonlinear self-excited ther-512
moacoustic oscillations of a ducted premixed flame: Bifurcations and513
routes to chaos, J. Fluid Mech. 761 (2014) 399–430.514
[14] L. Kabiraj, R. I. Sujith, P. Wahi, Bifurcations of self-excited ducted515
laminar premixed flames, J. Eng. Gas Turbines Power 134 (2012) 031502.516
[15] F. Weng, S. Li, D. Zhong, M. Zhu, Investigation of self-sustained beating517
oscillations in a Rijke burner, Combust. Flame 166 (2016) 181–191.518
[16] K. Prieur, D. Durox, T. Schuller, S. Candel, A hysteresis phenomenon519
leading to spinning or standing azimuthal instabilities in an annular520
combustor, Combust. Flame 175 (2017) 283–291.521
[17] J. Moeck, M. Bothien, S. Schimek, A. Lacarelle, C. Paschereit, Sub-522
critical thermoacoustic instabilites in a premixed combustor, in: 14th523
AIAA/CEAS, AIAA 2008-2946, 2008.524
26

[18] D. Laera, G. Campa, S. Camporeale, A finite element method for a525
weakly nonlinear dynamic analysis and bifurcation tracking of thermo-526
acoustic instability in longitudinal and annular combustors, Appl. En-527
ergy 187 (2017) 216–227.528
[19] M. C. Janus, G. A. Richards, A model for premixed combustion oscilla-529
tions, Tech. rep., USDOE Morgantown Energy Technology Center, WV530
(United States) (1996).531
[20] N. Noiray, D. Durox, T. Schuller, S. Candel, A unified framework for532
nonlinear combustion instability analysis based on the describing func-533
tion, J. Fluid Mech. 615 (2008) 139–167.534
[21] T. Lieuwen, H. Torres, C. Johnson, B. Zinn, A mechanism of combus-535
tion instability in lean premixed gas turbine combustors, J. Eng. Gas536
Turbines Power 123 (2001) 182–189.537
[22] F. Giuliani, P. Gajan, O. Diers, M. Ledoux, Influence of pulsed entries538
on a spray generated by an air-blast injection device: An experimen-539
tal analysis on combustion instability processes in aeroengines, Proc.540
Combust. Inst. 29 (2002) 91–98.541
[23] M. de la Cruz Garcıa, E. Mastorakos, A. Dowling, Investigations on the542
self-excited oscillations in a kerosene spray flame, Combust. Flame 156543
(2009) 374–384.544
[24] S. Tachibana, K. Saito, T. Yamamoto, M. Makida, T. Kitano, R. Kurose,545
Experimental and numerical investigation of thermo-acoustic instability546
in a liquid-fuel aero-engine combustor at elevated pressure: Validity of547
large-eddy simulation of spray combustion, Combust. Flame 162 (2015)548
2621–2637.549
[25] J. A. Sidey, E. Mastorakos, Stabilisation of swirling dual-fuel flames,550
Exp. Therm. Fluid Sci. 95 (2018) 65–72.551
[26] T. Providakis, L. Zimmer, P. Scouflaire, S. Ducruix, Characterization552
of the acoustic interactions in a two-stage multi-injection combustor fed553
with liquid fuel, J. Eng. Gas Turbines Power 134 (2012) 111503.554
27

[27] A. Renaud, S. Ducruix, P. Scouflaire, L. Zimmer, Flame shape transition555
in a swirl stabilised liquid fueled burner, Proc. Combust. Inst 35 (2015)556
3365–3372.557
[28] A. Renaud, S. Ducruix, L. Zimmer, Bistable behaviour and thermo-558
acoustic instability triggering in a gas turbine model combustor, Proc.559
Combust. Inst 36 (2017) 3899–3906.560
[29] J. E. Temme, P. M. Allison, J. F. Driscoll, Combustion instability of a561
lean premixed prevaporized gas turbine combustor studied using phase-562
averaged PIV, Combust. Flame 161 (2014) 958–970.563
[30] S. K. Dhanuka, J. E. Temme, J. F. Driscoll, Lean-limit combustion in-564
stabilities of a lean premixed prevaporized gas turbine combustor, Proc.565
Combust. Inst. 33 (2011) 2961–2966.566
[31] X. Han, X. Hui, C. Zhang, Y. Lin, P. He, C.-J. Sung, Combustion567
instabilities in a lean premixed pre-vaporized combustor at high-pressure568
high-temperature, in: ASME Turbo Expo 2017, GT2017-65190, 2017.569
[32] Y. Mao, L. Yu, Z. Wu, W. Tao, S. Wang, C. Ruan, L. Zhu, X. Lu,570
Experimental and kinetic modeling study of ignition characteristics of571
rp-3 kerosene over low-to-high temperature ranges in a heated rapid572
compression machine and a heated shock tube, Combust. Flame 203573
(2019) 157–169.574
[33] X. Han, X. Hui, H. Qin, Y. Lin, M. Zhang, C.-J. Sung, Effect of the575
diffuser on the inlet acoustic boundary in combustion-acoustic coupled576
oscillation, in: ASME Turbo Expo 2016, GT2016-57046, 2016.577
[34] Y. Hardalupas, M. Orain, Local measurements of the time-dependent578
heat release rate and equivalence ratio using chemiluminescent emission579
from a flame, Combust. Flame 139 (2004) 188–207.580
[35] T. Tsuboi, K. Inomata, Y. Tsunoda, A. Isobe, K.-i. Nagaya, Light ab-581
sorption by hydrocarbon molecules at 3.392 µm of He-Ne laser, Jpn. J.582
Appl. Phys. 24 (1985) 8.583
[36] H. D. Abarbanel, R. Brown, J. J. Sidorowich, L. S. Tsimring, The anal-584
ysis of observed chaotic data in physical systems, Rev. Mod. Phys. 65585
(1993) 1331.586
28
[37] Y. Guan, P. Liu, B. Jin, V. Gupta, L. K. Li, Nonlinear time-series anal-587
ysis of thermoacoustic oscillations in a solid rocket motor, Exp. Therm.588
Fluid Sci. 98 (2018) 217–226.589
[38] B. Ahn, J. Lee, S. Jung, K. T. Kim, Low-frequency combustion insta-590
bilities of an airblast swirl injector in a liquid-fuel combustor, Combust.591
Flame 196 (2018) 424–438.592
[39] A. P. Dowling, S. R. Stow, Acoustic analysis of gas turbine combustors,593
J. Propul. Power 19 (2003) 751–764.594
[40] T. Schuller, D. Durox, S. Candel, A unified model for the prediction595
of laminar flame transfer functions: comparisons between conical and596
v-flame dynamics, Combust. Flame 134 (2003) 21–34.597
[41] L. Crocco, S.-I. Cheng, Theory of combustion instability in liquid pro-598
pellant rocket motors, Tech. rep., Princeton Univ. NJ (1956).599
[42] S. Hermeth, G. Staffelbach, L. Y. Gicquel, V. Anisimov, C. Cirigliano,600
T. Poinsot, Bistable swirled flames and influence on flame transfer func-601
tions, Combust. Flame 161 (2014) 184–196.602
[43] T. Lieuwen, B. T. Zinn, The role of equivalence ratio oscillations in driv-603
ing combustion instabilities in low NOx gas turbines, Proc. Combust.604
Inst. 27 (1998) 1809–1816.605
[44] T. Poinsot, D. Veynante, Theoretical and numerical combustion, RT606
Edwards, Inc., 2005.607
[45] J. Li, A. S. Morgans, Time domain simulations of nonlinear thermoa-608
coustic behaviour in a simple combustor using a wave-based approach,609
J. Sound Vib. 346 (2015) 345–360.610
[46] D. Yang, D. Laera, A. S. Morgans, A systematic study of nonlinear611
coupling of thermoacoustic modes in annular combustorscombutors, J.612
Sound Vib. 456 (2019) 137–161.613
[47] X. Han, J. Li, A. S. Morgans, Prediction of combustion instability614
limit cycle oscillations by combining flame describing function simula-615
tions with a thermoacoustic network model, Combust. Flame 162 (2015)616
3632–3647.617
29

[48] J. Li, Y. Xia, A. S. Morgans, X. Han, Numerical prediction of combus-618
tion instability limit cycle oscillations for a combustor with a long flame,619
Combust. Flame 185 (2017) 28–43.620
[49] Y. Xia, D. Laera, W. P. Jones, A. S. Morgans, Numerical prediction621
of the Flame Describing Function and thermoacoustic limit cycle for a622
pressurized gas turbine combustor, Combust. Sci. Technol. (2019) 979–623
1002.624
[50] P. Davies, Practical flow duct acoustics, J. Sound Vib. 124 (1988) 91–625
115.626
[51] F. Marble, S. Candel, Acoustic disturbance from gas non-uniformities627
convected through a nozzle, J. Sound Vib. 55 (1977) 225–243.628
[52] A. P. Dowling, Nonlinear self-excited oscillations of a ducted flame, J.629
Fluid Mech. 346 (1997) 271–290.630
[53] D. Laera, S. M. Camporeale, A weakly nonlinear approach based on a631
distributed flame describing function to study the combustion dynamics632
of a full-scale lean-premixed swirled burner, J. Eng. Gas Turb. Power633
139 (2017) 091501.634
[54] A. Mellor, Design of modern turbine combustors, Academic Pr., 1990.635
[55] W. Ranz, W. R. Marshall, et al., Evaporation from drops, Chem. Eng.636
Prog. 48 (1952) 141–146.637
[56] N. Froessling, On the evaporation of falling drops, Tech. rep., Army638
Biological Labs Frederick MD (1968).639
30