Embed Size (px)
Citation preview

POSIVA OY
Olki luoto
FI-27160 EURAJOKI, F INLAND
Tel +358-2-8372 31
Fax +358-2-8372 3709
Anna Kronlöf
March 2005
Working Report 2004-45
Injection Grout for Deep Repositories–Low-pH Cementitious Grout for Larger Fractures:
Testing Technical Performance of Materials

March 2005
Working Reports contain information on work in progress
or pending completion.
The conclusions and viewpoints presented in the report
are those of author(s) and do not necessarily
coincide with those of Posiva.
Anna Kron lö f
VTT Bu i l d i ng and T ranspo r t
Work ing Repor t 2004 -45
Injection Grout for Deep Repositories –Low-pH Cementitious Grout for Larger Fractures:
Testing Technical Performance of Materials

TIIVISTELMÄ
Työn tavoitteena oli kehittää vähintään yksi sementtipohjainen injektointiaine ONKA-LOn sekä suomalaisten ja ruotsalaisten ydinjätteen loppusijoitustilojen injektointiin, joka täyttää alla esitetyt vaatimukset: Vaaditut ominaisuudet:
1. pH ≤ 11 2. Tunkeutuvuus bmin ≤ 80 μm 3. Tunkeutuvuus bcrit ≤ 120 μm
Toivotut ominaisuudet: 4. Viskositeetti ≤ 50 mPas 5. Veden erottuminen ≤ 10% 6. Avoin aika ≥ 60 min 7. Leikkauslujuus 6 tunnissa≥ 500 Pa 8. Leikkausjännitys ≤ 5 Pa 9. Puristuslujuus 28 vrk iässä ≥ 4 MPa
Lisäksi esitettiin yleisiä vaatimuksia, joita ei ilmaistu numeerisesti. Niihin kuuluivat säilyvyys sekä, raaka-aineiden saatavuus ja tunnettuus käytännön rakentamisessa.
Työssä tutkittiin neljää injektointi systeemiä (sideaine kombinaatiota) seuraavasti: 1. Tavallinen Portland sementti – silika (silica fume) 2. Masuunikuona 3. Supersulfaattisementti 4. Matala-alkalisementti (LAC)
LAC oli japanilainen sementtituote, joka oli kehitetty matalan pH:n betoneihin. Sen soveltuvuutta injektointiin testattiin varioimatta mineraalikoostumusta. Ainoastaan vesi kiintoainesuhdetta ja hidastimen annostusta modifioitiin. Niissä puitteissa LAC-tuote ei soveltunut injektointiaineeksi.
Muiden systeemien osalta vaatimukset saavutettiin laboratorio-olosuhteissa lukuun otta-matta leikkausjännitystä (reologiaan liittyvä suure). Vaatimus puristuslujuudelle ei kuulunut alkuperäisiin vaatimuksiin. Se asetettiin, kun projekti oli jo ollut käynnissä muutaman kuukauden. Niiden massojen puristuslujuus, jotka valittiin pH testeihin ennen kuin puristuslujuusvaatimus asetettiin, on hieman alhaisempi kuin vaatimus.
Avainsanat: injektointi, injektointiaine, matala pH, tunkeutuvuus, reologia, vedenerot-tuminen, sitoutuminen, leikkauslujuus, puristuslujuus, ONKALO, ydinjätteen loppu-sijoitus, vuotovesien hallinta, kalliorakentaminen


ABSTRACT
The object of the work was to design at least one cement based grout for the injection of ONKALO and the Finnish and Swedish repositories for nuclear waste that would meet given requirements listed below: Required properties:
1. pH ≤ 11 2. Penetration-ability bmin ≤ 80 μm 3. Penetration-ability bcrit ≤ 120 μm
Desired properties: 4. Viscosity ≤ 50 mPas 5. Bleeding ≤ 10% 6. Workability time ≥ 60 min 7. Shear strength at 6 hours ≥ 500 Pa 8. Yield value ≤ 5 Pa 9. Compressive strength at 28 d ≥ 4 MPa
In addition general requirements not expressed numerically were given. Those were durability as well as availability and known history in practical engineering.
The four candidate grouting systems (binder material combinations) studied in this work were as follows:
1. Ordinary Portland Cement - Silica Fume (OPC+SF) 2. Blast furnace slag (Slag) 3. Super sulphate cement (SSC) 4. Low Alkali Cement (LAC)
LAC was cement product developed in Japan for low-pH concrete. Its suitability for grouting was tested without varying the product mineral composition. Mix modifications concerning only water to dry materials ratio as well as retarder dosage were made. Within those limits the product was not found suitable for grouting.
As for the other systems, generally all the requirements were met in laboratory conditions except for the yield value (related to rheology). The compressive strength requirement was not included to the original requirements. It was set after the project had been proceeding for a few months. The compressive strength of the mixes that were selected to the pH tests before the strength requirement was set were slightly below the requirement.
Keywords: grouting, grout, low-pH, penetration-ability, filter test, rheology, bleeding, setting, shear strength, compressive strength, ONKALO, deep repository for nuclear fuel, controlling water inflow, tunnelling


TABLE OF CONTENTS TIIVISTELMÄ ABSTRACT NOTATIONS ................................................................................................................... 3 1 INTRODUCTION ................................................................................................... 5 2 OBJECTIVES ........................................................................................................ 7 3 BACKGROUND TO EXPERIMENTAL STUDIES ................................................. 9
3.1 Background about pH ................................................................................ 9 3.2 Background about injection properties of grouts with high SF content .... 12
4 INTRODUCTION TO EXPERIMENTAL STUDIES .............................................. 15 5 MATERIALS ........................................................................................................ 19 6 METHODS .......................................................................................................... 25 7 MIX MODIFICATION - EXPERIMENTAL STUDIES ........................................... 29
7.1 OPC - SF system: First experiments ....................................................... 29 7.1.1 Experiments ................................................................................. 29 7.1.2 Results and conclusions............................................................... 30
7.2 OPC - SF system: First penetration-ability and pH measurements ......... 33 7.3 OPC - SF system: Ettringite acceleration (ETTA) .................................... 33
7.3.1 Experiments ................................................................................. 33 7.3.2 Results and conclusions............................................................... 36
7.4 OPC - SF system: Penetration-ability and pH with ettringite acceleration (ETTA) ................................................................................. 38 7.4.1 Experiments ................................................................................. 38 7.4.2 Results and conclusions............................................................... 38
7.5 OPC - SF system: Effect of W/DM with ettringite acceleration (ETTA) .... 39 7.5.1 Experiments ................................................................................. 39 7.5.2 Results and conclusions............................................................... 40
7.6 OPC - SF system: Low alkali white cement (WCE) ................................. 43 7.6.1 Experiments ................................................................................. 43 7.6.2 Results and conclusions............................................................... 43
7.7 OPC - SF system: Effect of premixing SF with cement ........................... 44 7.7.1 Experiments ................................................................................. 44 7.7.2 Results and conclusions............................................................... 44
7.8 Slag system: First experiments ................................................................ 45 7.8.1 Experiments ................................................................................. 45 7.8.2 Results and conclusions............................................................... 46
7.9 Slag and Super Sulphate Cement systems (SSC): Activation of slag ..... 50 7.9.1 Experiments ................................................................................. 50 7.9.2 Results and conclusions on Slag system and ETTA - slag
batch SL15 ................................................................................... 53 7.9.3 Results and conclusions on activation without ETTA - slag
batch SL15 ................................................................................... 55 7.9.4 Results and conclusions on W/DM effect on slag and super
sulphate cement systems - slag batch SL10/3 ............................. 57 7.9.5 Oversized particles ....................................................................... 60
7.10 LAC system: Low Alkali Cement .............................................................. 60 7.10.1 Experiments ................................................................................. 60 7.10.2 Results and conclusions............................................................... 61
7.11 Reference grout ....................................................................................... 63 8 MIXES FOR PILOT TESTS ................................................................................. 65 9 EXAMINATION OF RESULTS ............................................................................ 67
9.1 pH ............................................................................................................ 67
1

2
9.1.1 Compositions of mixes tested for pH ............................................ 67 9.1.2 Effect of alkalis on pH................................................................... 70 9.1.3 Effect of Ca, Mg, Si, Fe, Al and SO3 on pH .................................. 73 9.1.4 Effect of curing temperature on pH .............................................. 76
9.2 Penetration-ability .................................................................................... 76 9.2.1 Comparison of filter pump and penetration-ability
(Bmin and Bcrit) methods ................................................................. 76 9.2.2 Effect of water / dry materials ratio on penetration-ability
(Bmin and Bcrit) ............................................................................... 79 9.2.3 Effect of rheology on penetration-ability (Bmin and Bcrit) ................ 80 9.2.4 Observations on “cake build-up” phenomena in
penetration-ability test (Bmin and Bcrit) ........................................... 81 9.3 Compressive strength .............................................................................. 83 9.4 Setting (shear strength at 6 h) ................................................................. 85
10 CONCLUSIONS .................................................................................................. 87 10.1 Portland cement – silica fume system (OPC – SF) .................................. 87 10.2 Super sulphate cement system (SSC) ..................................................... 87 10.3 Slag system activated with OPC (Slag) ................................................... 87 10.4 Low Alkali Cement system (LAC) ............................................................ 88 10.5 Effect of alkalis (Na2O and K2O) on pH .................................................... 88 10.6 Effect of Ca, Si, Fe, Al, SO3 on pH ........................................................... 88 10.7 Penetration-ability .................................................................................... 88 10.8 Compressive strength .............................................................................. 89 10.9 Setting (shear strength at 6 h) ................................................................. 89
11 SUMMARY .......................................................................................................... 91 12 FUTURE NEEDS ................................................................................................ 95
12.1 Requirements (open time) ....................................................................... 95 12.2 Mixing order ............................................................................................. 95 12.3 Superplasticizer ....................................................................................... 96 12.4 Glass and alkalis ...................................................................................... 96 12.5 Binder development ................................................................................. 96 12.6 Ettringite acceleration (ETTA) control ...................................................... 97 12.7 Sulphides and sulphates .......................................................................... 97
REFERENCES ............................................................................................................. 99 APPENDICES Appendix 1 Requirements for the low pH cementitious grout .................................... 101 Appendix 2 Determination of the filtration stability ..................................................... 111 Appendix 3 Short manual for the Penetrability meter ................................................ 115 Appendix 4 Details of procedures followed when determining injection properties ... 121 Appendix 5 Experiments and results ......................................................................... 129

NOTATIONS
The notations used in the report are as follows:
Bcrit = critical aperture (related to grout penetration-ability) Bmin = minimum aperture (related to grout penetration-ability) CH = calcium hydroxide CSH = calcium silicate hydrate DM = dry materials (all dry materials including the dry content of slurries) ETTA = ettringite-acceleration G = gypsum HAC = alumina cement (High Alumina Cement) LAC = Low Alkali Cement (product name) OPC = Ordinary Portland Cement (white, grey or SR cement) SF= silica fume SH = silicate hydrate SL = blast furnace slag SP = superplasticizer SR = sulphate resistant SSC = super sulphate cement UF16 = Ultra fin 16 (A commercial injection cement by Cementa, Sweden) W = water (Water from all sources; pure water, water from slurries and other chemicals) WCE = Egyptian white cement (very low alkali content). The ratios such as W/DM or SF/OPC are given as weight units of the dry materials. In the case of GroutAid (a silica slurry product) SF denotes only the dry material content of GroutAid.
In the ratios G/OPC or G/ SL (often in text Gypsum/OPC or Gypsum/SL) gypsum denotes only the gypsum added while making the mix. All gypsum that is a part of the original OPC product is considered to be OPC only.
Note: OPC = Ordinary Portland cement (white, grey or sulphate resistant). In literature also PC is used. PC (Portland Cement) = OPC.
3

4

1 INTRODUCTION
Posiva and SKB are planning to deposit spent nuclear fuel in deep repositories. Use of common construction materials, as steel and concrete, are foreseen. With respect to the long-term safety a suitable chemical environment is vital. The use of low-pH products is necessary in order to get leachates with sufficiently low pH (< 11).
A pre-study was carried out in 2001, followed by feasibility study in 2002 – mid 2003. The present work is based on the outcome of those earlier studies as well as the outcome of related studies, which are compiled to the summary report of the project "Injection Grout for Deep Repositories". The aim of the whole project "The injection grout for deep repository" was to achieve some (at least one) well-quantified, tested and approved low-pH injection grouts to be used for smaller fractures (<100 µm) and one for larger fractures (> 100 µm) in future repositories. The whole project, which is a joint project between Swedish Nuclear Fuel and Waste Management Co (later SKB) and Nuclear Waste Management Organisation of Japan (later NUMO) and Posiva Oy (later Posiva), was further divided into four sub-projects:
1. Low-pH cementitious injection grout for larger fractures 2. Non-cementitious low-pH injection grout for smaller fractures 3. Field testing in Finland 4. Field testing in Sweden
The subproject SP1 "Low-pH cementitious injection grouts for larger fractures" was lead by Posiva. The aim was to develop low-pH grout for sealing larger fractures (> 100 µm) in the bedrock of surroundings of the deep repository. It included seven tasks:
1. Setting the requirements for the grouting materials to be developed 2. Selecting materials for grinding and testing 3. Grinding the materials 4. Testing the technical performance of the materials 5. Testing pH and leaching behaviour of the most promising materials 6. Evaluating the environmental acceptance of the materials 7. Evaluating the long-term safety of the materials
The work report presently covers task 4. The objective of Task 4 was to develop injection grouts based on task 2 with a low-pH and injection as well as long-term properties defined in Task 1 and given below (Chapter 2, Objectives) and to select some of the grouts for field testing. The composition of the candidate systems i.e. material combinations were tested experimentally and modified to meet the requirements. Task 4 started in 2003 and was completed by the end of 2004.
The mechanism of the pH behaviour of grouts is not fully understood and the understanding of injection properties is not on such a level that the composition of grouting materials could be selected without modifying of the grout recipe based on detailed laboratory tests. The work has been an experimental mix design project, which has been directed by a set of grout requirements given concerning the pH of the leachate and the injection performance defined as viscosity, bleeding, shear strength and
5

6
penetration-ability as well as material selection restrictions based on long-term safety aspects (Appendix 1).
According to the brief literature review and information gathered through discussions with product suppliers, it became evident that neither are there commonly accepted theories about grout behaviour during grouting nor good understanding about how mix design affects the behaviour. Each grouting cement behaves in its own individual way, depending strongly on its chemical composition, the type and dosage of additives used, duration of the mixing period and ambient temperature. Details of cement products are often kept confidential.
In this work VTT has modified the composition of the four candidate grouting systems e.g. material combinations and performed the necessary laboratory tests. Tested materials were commercially available. Only the fineness of the materials was modified by grinding when needed.
Mixes, which gave the best overall results in the laboratory tests, were selected for pilot field tests.

2 OBJECTIVES
The objective of this work was to design at least one mix that would meet given requirements, as listed below (Table 1) (Appendix 1).
Table 1. Required properties of low-pH cement based grouts.
Order of Importance
Property Requirement Measuring method
Required Properties
pH
≤ 11 Leaching tests
Penetration-ability bmin Penetration-ability bcrit
≤ 80 μm ≤ 120 μm
Penetrability meter at 60 min
Desired
Properties
Viscosity ≤ 50 mPas Rheometry at 60 min Bleed ≤ 10% Measuring glass at 2 hours Workability time Shear strength Yield value
≥ 60 min ≥ 500 Pa ≤ 5 Pa
Determined by penetration-ability and viscosity Fall cone at 6 h Rheometry at 60 min
Compressive strength ≥ 4 MPa Uni-axial compressive strength at 28 d 1)
1) The compressive strength requirement was not included to the original requirements. It was set after the project had been proceeding for a few months.
In addition to the requirements listed in Table 1 the grout should fulfil other, more general requirements that cannot so far be expressed by any numbers (Table 2) (Appendix 1).
Table 2. Other desired properties.
• Material must be available in practice during the construction and operation of the repository
• Material (or at least its components) must have a history of use in cement technology (or practical engineering)
• Durability (chemical and physical) properties of the material needs to be sufficient that the grouted zone maintains its required properties during the expected lifetime
The four candidate systems e.g. material combinations studied in this work were as follows:
1. Ordinary Portland Cement + Silica Fume (OPC+SF) 2. Blast furnace slag (Slag) 3. Super sulphate cement (SSC) 4. Low Alkali Cement (LAC)
1. “OPC+SF” denotes a binder system that is based mainly on OPC+SF. SF was used in a few commercial forms.
7

8
2. “Slag” denotes an OPC activated slag based system. Alkali and water glass activation were not examined, as low-pH was the most important required property and alkali activation was considered an unnecessary risk.
3. “SSC” is a slag based system activated with gypsum (G) and OPC, the content of G being higher than that of OPC. A few experiments on enhancing SSC with alkali activation were made. The systems Slag and SSC are reported here as one parallel system.
4. “LAC” was introduced to the project by NUMO as a product, ground to fixed fineness by the producer. Neither were its mineral composition nor fineness modified in the present experiments.
Originally, according to the project plan, also fly ash was to be studied. However, fly ash was ruled out at an early stage of the work as there were problems foreseen in the delivery and quality stability of the material.
The scientific modelling of the mechanisms of grout behaviour (setting, rheology, penetration-ability, compressive strength, pH) was not included in the objectives of this work (Task 4). All pH measurements were performed by Ulla Vuorinen at VTT Processes and the pH and leaching tests are reported in a separate report (Vuorinen et al. 2004).

3 BACKGROUND TO EXPERIMENTAL STUDIES
3.1 Background about pH
CaO
The goal of the work was to develop injection grouts with low pH (≤ 11) to be used in a repository for spent fuel. According to the work by Lagerblad partly presented in Lagerblag (2001), the use of silica fume was found to be an efficient component for lowering the pH of grout leachate. One of the reaction mechanisms of silica fume is the silicate reaction with Ca(OH)2, which forms 20% of pure Portland cement’s hydration products. Because the equilibrium pH of calcium hydroxide with water is as high as 12.5, it is clear the all Ca(OH)2 needs to be consumed in the reaction in order to lower the pH to 11 or lower.
Silica fume is a very reactive pozzolan. The reaction is fast enough to bind Ca(OH)2 into CSH to a large extent as it forms. Yet, it is likely that a part of the silica fume particles react slowly and remain un-reacted over long periods (years) of time.
It is possible to use also less reactive pozzolans such as blast furnace slag, glass or quartz. Those would first allow Ca(OH)2 precipitation. The Ca(OH)2 crystals would be in contact with pore solution, which would be seen as high pH until the pozzolanic reaction proceeds.
A complete reaction of Ca(OH)2 and silica into CSH does not produce a product with a sufficiently low pH. This is because also CSH with a high Ca/Si -ratio (1.8) yields high pH (Table 3, Stronach & Glasser 1997). According to Table 3 to reach the pH of 11.03 or lower the total Si content composed of all Si sources such as pozzolans, OPC or blast furnace slag, needs to be high enough to produce CSH with the Ca/Si ratio of 1.1 or lower.
As the pozzolanic reactions proceeds the Ca/Si ratio of the CSH decreases which in turn decreases the pH. Therefore the pH does not depend solely on chemical composition (elements) or material combination, but on the composition of reaction products formed, which depends largely on reaction rate and time.
The CSH-reactions takes several months, possible years to be completed. The reaction rate depends on the fineness and chemical composition and content of vitreous material for instance in the case of slag.
9

Table 3. Invariant points in the CaO-SiO2-H2O system at 25°C (Stronach & Glasser 1997).
Solids in equilibrium [Si]aq (mg/L) pH Amorphous SH
Amorphous SH + CSH (0.8) CSH (0.8)
CSH (0.8) + CSH (1.1) CSH (1.1)
CSH (1.1) + CSH (1.8) CH + CSH (1.8)
CH
39.5 117.0 43.4 41.1 31.4 0.7 0.5 0
6.38 10.17 10.88 10.91 11.03 12.43 12.53 12.52
The amount of silica fume needed for pH < 11 depends on the cement composition.
According to the work by Lagerblad partly presented in Lagerblag (2001) approx. 30 w-% silica fume was needed with Aalborg White Cement (SF 30 w%, OPC 70 w%, SF/OPC = 0.43). According to his estimation this would give a CaO/SiO2 ratio of the CSH product lower than 1 and consequently pH below 11. A closer estimation is given in Table 4. According to Table 4 slightly too low SF/OPC ratios was used both by Lagerblad as well as in the preliminary experiments of this work to yield the CaO/SiO2 ratio of 1.
Table 4. Estimation of SF/OPC ratio needed to yield Ca/Si ratio on 1 in the CSH. CaO
cem CaO
Al+Fe react.
CaO in
CSH
CaO in
CSH
SiO2 in CSH
4)
SiO2 in CSH
4)
SiO2 in cem
5)
SF 6)
SF 7)
SiO2 in mix
8) w% w% w% moles w% moles w% w% w% w% 100 g cem 100 g cem SF/OPC SF/OPC
OPC 1) 65 15.0 50 0.89 53 0.89 25 0.28 0.43 46 OPC 2) Aalborg
69.0 3.5 65.5 1.17 66 1.17 25 0.45 0.43 46
UF16 3) 64.6 10.2 54.4 0.97 47 0.97 22.8 0.35 0.30 40 1) Figures from the calculations by Lagerblad based on approximate cement composition. (Unpublished work, Lagerblad 2003). 2) Calculations based on White OPC (from Aalborg plant) chemical composition (Table 6). CaO consumed in Al and Fe reactions was estimated according to Equations 1 and 2. 3) Calculations based on UF16 chemical composition (Table 6).CaO consumed in Al and Fe reactions was estimated according to Equations 1 and 2. 4) The total amount of SiO2 (originating from both OPC and SF) needed to produce Ca/Si ratio of 1 in the CSH. 5) The SiO2 content of the cement. 6) The amount of SF needed to produce Ca/Si ratio of 1 in the CSH. 7) SF/OPC ratio used in the experiments by Lagerblad with white OPC and in the preliminary experiments of this work with UF16 (Unpublished work, Lagerblad 2003). 8) SiO2 content of the mix used in the experiments by Lagerblad with white OPC (Unpublished work, Lagerblad 2003) and in the preliminary experiments of this work with UF16. The reactions of Al, Fe and Si with Ca are given in the Equations 3, 4, 5 and 6.
C3A + 6 H = C3AH6 (1)
10

C4AF +2 CH + 10 H = C3AH6 + C3FH6 (2)
Ca(OH)2 + SiO2 = CSH (1) (3)
CSH (1) + + SiO2 = CSH (2) (4)
where C is CaO S is SiO2 A is Al2O3 Fe is Fe2O3 H is H2O C3A is tri calcium aluminate C3AH6 is tri calcium aluminate hydrate C4AF is tetra calcium aluminate ferrate C3FH6 is tri calcium ferrate hydrate CSH (1) is calcium silicate hydrate with higher Ca/Si content CSH (2) is calcium silicate hydrate with lower Ca/Si content
According to Céline Cau Dit Coumes et al (2004) the total SiO2 content showed good correlation with the equilibrium pH regardless of the composition. The SiO2 content (originating from all sources) needed to yield the pH 11 or less is 55% or more. The reason for this behaviour is not known. This leads to a higher demand for SF than shown in the Table 3 above: According to the “55w% requirement” the minimum SF/OPC would be as high as 0.75 and 0.80 for the white cement used by Lagerblad (2003) and UF16 used in the present work, respectively.
11

• pH mostly controled by silica content in binding
OPC/SF/FA
OPC/MK/FA
OPC/SF
OPC/MK
y = -0.0707x + 14.912
R2= 0.91
10
10.5
11
11.5
12
12.5
13
30 35 40 45 50 55 60 65 70%SiO2 in binding
Equ
ilibr
ium
pH
Figure 1. Equilibrium pH vs. total SiO2 content in the binder material. The silica content (total SiO2) should be 55 w% or more to ensure pH 11or lower. (Cau Dit Coumes et al 2004).
Na2O + K2O
Another mechanism is CSH’s tendency to bind alkali hydroxides, which are responsible for the early age pH peak value of 13.5. When cement paste ages, the early age pH peak value drops from 13.5 to around 12.5. This pH drop is understood to be an indication of alkalis being bound to CSH. This is known to happen also in ordinary Portland cement without pozzolan addition.
3.2 Background about injection properties of grouts with high SF content
In Kronlöf’s work (2003) it was found that with fine cements some other mechanism apart from the traditional particle blocking inhibits penetration. This other mechanism was named “gel blocking”. It dominated the penetration-ability of mixes made with fine SR cement Ultrafin 12. Gel blocking was even more dominating when silica slurry was used with the fine Portland cement Rheocem 900. The mix composition was modified by increasing the water-to-cement ratio from 1.0 to 3.3 and simultaneously increasing silica-to-cement ratio from 0 to 0.3 (as dry materials). This strongly deteriorated the penetration-ability and increased the yield value by tenfold. The conclusion was that the very fine silica fume reacted during the first hours (the open time) and produced gel like grout, which blocked the sieves of the penetration-ability device. According to the work by Lagerblad partly presented in Lagerblag (2001) other fast pozzolans seem to behave similarly. Lagerblad’s conclusion was that the development should be continued on blast furnace slag and periclase based systems as well as wet grinding of quartz to produce a slow pozzolan.
12

13


4 INTRODUCTION TO EXPERIMENTAL STUDIES
The research was planned to proceed in a stepwise manner so that the most interesting systems were to be taken into closer research and less promising were to be ruled out. The results were planned to be examined shortly after testing and the decisions about developing/modifying the systems were to be made continuously. The pH and leaching tests were performed by Ulla Vuorinen only to the most promising grout mixes (Vuorinen et al. 2004).
Mixes were based on the four different preliminary systems that were modified experimentally.
1. Ordinary Portland Cement + Silica Fume (OPC+SF) 2. Blast furnace slag (Slag) 3. Super sulphate cement (SSC) 4. Low Alkali Cement (LAC)
Originally there was also a fifth system based on fly ash, but that was ruled out due to expected problems concerning stability of raw material properties (chemical composition and reactivity) over long periods of time as well as the expected difficulties with the setting time of the mixes. No other systems were ruled out during the work reported presently (Task 4).
The work proceeded through a 15-step procedure each giving necessary knowledge for the next step as listed below. During the process a number of additions were made to the original testing program.
Step 1 – First tests on OPC+SF and Slag systems
The first systems examined were OPC+SF and Slag. SF was used in the form of GroutAid (Chapter 5). The slag was ground by a pilot plant jet mill by CT-Group. The amount of SF was kept to minimum due to its
- detrimental effect to penetration-ability as large quantities - tendency to increase water demand - tendency to retard strength development, if water demand is increased due to
high SF content. - cost.
Slag was activated by OPC only and its content was also kept to minimum for pH reasons.
SP additions and different mixing orders were tested.
The parameters to be tested according to the methods given below (Chapter 6) were: - penetration-ability by filter pump - setting time - bleeding - rheology - chemical characterisation of the mixes based on the information given below
(Chapter 5).
15

Step 2 – First penetration-ability and pH measurements
A few most promising mixes out of the ones tested in step 1 were chosen to be tested for penetration-ability by penetration-ability meter (Chapter 6). Based on their overall injection properties one OPC+SF mix (12) and one slag mix (44) were later chosen for the pH test. - The penetration-ability of OPC+SF mix (12) was within requirements but that of the
slag mix (44) was slightly too poor. - The shear strength at 6 h OPC+SF mix (12) was too low (poor) while that of slag
mix (44) was within requirements. - The preliminary pH of both mixes was too high (poor).
The low shear strength was disturbing, because the early age strength development is temperature sensitive and mix temperature in field conditions might be lower than 12 ºC, which would lower the shear strength respectively. On site the temperature of materials may be lower than 12 ºC and the agitation period shorter. The later would give the reactions less time to proceed at the “agitation temperature” that is slightly higher than the ambient temperature. Therefore in the laboratory a few extra kPa of shear strength over the given requirement was preferred to avoid grouting problems on site.
Step 3 – Checkpoints
- Something needed to be done to lower the pH. Increase of SF was the first obvious choice. Also lower alkali content through material selection was considered.
- Something needed to be done to increase the shear strength at the age of 6 h. Typical accelerators (Cl- and NO3
-) were ruled out due to long-term safety reasons. Commercial shotcrete (spray concrete) accelerator (Meyco SA 161), which is based on aluminium salts and produces ettringite, was suitable from the long-term safety aspect, but it reacted too fast and the mix lost the penetration-ability altogether.
- At this stage superplasiticizers were ruled out as to simplify long-term safety analyses.
- The filter pump was found to be a too approximate method for penetration-ability assessment even in the initial stages of any mix development. Therefore the penetrability meter (determination of Bmin and Bcrit values) was introduced to the test program throughout the mix development.
- Fly ash system was ruled out without testing.
- All other systems were to be continued.
Step 4 - ETTA
A special ettringite acceleration (ETTA) system for low-pH grouting purpose was developed.
Step 5 - OPC+SF system + ETTA
OPC+SF system mixes were developed by using - large content of SF for pH,
16

- large water to dry materials ratio for penetration-ability and viscosity - ETTA for setting (6 h shear strength).
Two mixes with differing SF contents (f63 and f64) were tested for pH, which was within the requirements in both cases.
Step 6 - WCE
Low alkali white cement from Aalborg White Sinai (Egyptian) plant (WCE) was introduced and the two mixes were tested for pH. Alkali content of the cement was found not to be the pH-determining factor.
Step 7 – Pre-mixing
Pre-mixing of components by jet mill was tested with and without dry SF (un-densified, type 938). The aim was to produce a single product and reduce the number of materials to be handled on site. Premixing the un-densified SF with cement instead of using GroutAid deteriorated the penetration-ability.
Step 8 - Low Alkali Cement (LAC)
LAC tested and completed. Low penetration-ability was achieved and therefore LAC was not suitable for grouting.
Step 9 - pH
Correlation between the chemical composition of the mixes and the results of the pH tests was examined. As modelling was outside the scope of this work, this study did produce neither modelling nor validation of any existing model. Yet, the observations offered valuable guidelines for further mix modification.
Step 10 - Compressive strength
The requirement for uni-axial compressive strength was set to ≥ 4 MPa.
First the testing age was not defined because the strength development rate is not critical. The testing age was initially 28 d. Later also 91 d was added to the program.
Setting the requirement was somewhat contradictory because unreasonably high requirement would jeopardise the penetration-ability achieved and a too low requirement might possibly jeopardise the durability of the grout. Further, for the time being there is no knowledge about long-term durability and compressive strength of grouts in different environments. Therefore the requirement bears neither theoretical nor empirical background. It merely expresses that the mixes should differ as little as possible from “ordinary” mixes.
Determining the properties vs. water to dry material ratio (W/DM) was added to testing program. This was done due to the uncertainties about setting the strength requirement (above) as well as needs that stem from practical grouting procedures.
17

18
Step 11 - OPC+SF system completed
The development of OPC+SF system with ETTA was completed. All properties were tested against W/DM.
Step 12 - Slag activation
Slag and SSC activation were developed.
The SF content was increased in order to lower pH compared to that of the slag mix 44. Lower pH is detrimental to slag activation, which delays or stops strength development. Activation with both OPC (Slag system) and gypsum (SSC-system) were studied. The tests were run with the first slag batch delivered from the newly assembled full scale jet mill (SL15, Chapter 5). Unfortunately the slag was not quite as fine nor the reactivity quite as high as it was supposed to be. Yet, the results explained how to activate slag to yield the required compressive strength in low-pH mixes.
Step 13 – Slag and SSC systems completed
The development of slag and SSC systems was completed with a slag batch of relevant fineness. All properties were tested against W/DM.
Step 14 – Reference
A reference mix (superplasiticized UF16-SF mix) of known good performance in practical field conditions was tested. The composition differed largely from the low pH UF16-SF mixes. The reference test offered
• a comparison between the pH and the leachate chemical composition of modifications and the reference mix (Vuorinen et al. 2004),
• a comparison between laboratory tests of mix modifications and the reference mix,
• preliminary information of the behaviour of the mix modifications in field conditions compared to that of the reference test.
Step 15 - First pilot test
Mixes f63 and S20 were tested in field conditions in Finland in Sub-Project 3 (Sievänen et al 2004).

5 MATERIALS
The following materials were used in the experiments. The particle size distributions except that of Injekipsi 1, LAC fine LAC coarse and Rheocem 900 were determined by CT-group by Coulter Counter (Figures 2 and 3 and Table 5). Injekipsi 1, LAC fine, LAC coarse and Rheocem 900 were determined by the producer. The chemical composition is given according to the supplier given information in Table 6.
- Ultrafin 16 (UF16) OPC, SR, micro cement developed for grouting purposes by Cementa
- White Portland cement from Egypt (WCE) OPC, low alkali by Aalborg White from Sinai plant WCE VTT; ground at VTT with a jet mill WCE CT; ground at CT-Group with a jet mill
- White cement (WC10) OPC, low alkali by Aalborg White from Aalborg plant
- Rheocem 900 OPC micro cement developed for grouting purposes by Master Builders
- High alumina cement (HAC) Secar 71 by Lafarge aluminates (HAC) HAC; ground at VTT with a jet mill
- Rapid hardening Portland cement (RC) OPC CEM II A 42.5 R Ground with jet mill by CT-Group
- Injekipsi 1 (G) A gypsum slurry by Kemira, CaSO4 2 H2O. DM content 66.5 – 67.5%. The two water molecules are included on the DM.
- Blast furnace slag (SL) Ground with a jet mill by CT-Group into two finenesses. SL15; d 98% value about 15 µm SL10; d 98% value about 10 µm
- GroutAid (GA) Slurry made of silica fume type UN 920 developed for grouting purposes by Elkem Solid content 48 - 52 % SiO2 typically 95 % of solids Carbon max 2.5 % of solids Loss on ignition max. 3.0 % of solids No surfactants
- Silica fume UN 920 (SF 920) Condensed silica fume, un-densified, type 920
- Silica fume UN 938 (SF 938) Condensed silica fume, un-densified, type 938
- G3 Dry mix of WCE CT, HAC, G and SF 938 all ground and pre-mixed at CT-Group
- G4
19

Dry mix of WCE CT, HAC and G all ground and pre-mixed at CT-Group
- LAC coarse Low Alkali Cement by NUMO, coarse grinding
- LAC fine Low Alkali Cement by NUMO, fine grinding
- SP40 Superplasiticizer, melamine based (sulphonated melamine formaldehyde condensates) Dry material content 40 w%.
- Meyco SA 161 Shotcrete accelerator, aluminium salt
0
20
40
60
80
100
0.1 0.2 0.5 1 2 5 10 20
µm
%
UF16WCE VTTWC10HACInjekipsi 1
0
20
40
60
80
100
0.1 0.2 0.5 1 2 5 10 20µm
%
UF16SL15SL10/1 SL10/2SL10/3RC10/1RC10/2
(a) (b)
Figure 2. Particle size distributions of materials.
0
20
40
60
80
100
0.1 0.2 0.5 1 2 5 10 20
µm
%
UF16WCE CTG3G4
0
20
40
60
80
100
0.1 0.2 0.5 1 2 5 10 20 50
µm
%
UF16
LAC coarse
LAC fine
(a) (b)
Figure 3. Particle size distributions of materials.
20

Table 5. Material fineness. The values are based on particle size measurements made by CT-group except that of Rheocem 900. Ultra
fin 16 HAC WCE
VTT SL10/1 SL15 SL10/2 SL10/3 RC10/1 RC10/2 WCE
CT G3 G4
1) 2) 3) 4) 5) 6) 1) 1) 1) Ground by
Cementa VTT VTT CT CT CT CT CT CT CT CT CT
Median, µm
3.8 3.6 2.4 1.9 2.5 2.2 1.9 2.4 2.8 1.9 5.5 1.8
d98, µm 13.9 15.8 12.8 10.8 14.0 11.7 10.3 11.7 11.8 13.0 17.0 11.5Specific surface area, cm2/g
14406 13141 17341 19023 15465 17059 17925 17740 16584 18895 11218 19862
> 63 µm 7)
0.3
1) Ground by the pilot plant jet mill by CT-Group. 2) Batch no 1 ground by full scale jet mill by CT-Group. (Designated “Ajo säkki 1”). 3) Batch no 2 ground by full scale jet mill by CT CT-Group. (Designated “Säkki 11”). 4) Batch no 3 ground by full scale jet mill by CT CT-Group. (Designated “Säkki 12”). 5) Ground by a pilot plant jet mill by CT-Group. 6) Ground by full scale jet mill by CT-Group. 7) Wash sieving.
21

Table 6a. Chemical composition of the materials used to estimate pH behaviour. Chemical compositions were based on producer information given either in data sheets or/and production quality information of the time period of the material delivery. In case the composition is given as a range of content, the average value is used. The sources of information are given in Table 6b.
Product Producer CaO w%
SiO2 w%
Na2O w%
K20 w%
Al2O3 w%
Mg0 w%
Fe2O3 w%
SO3 w%
S w%
Organic
Dens. kg/m3
Blast furnace slag 1)
CT/Rauta ruukki
37 - 41
35 - 37 0.8 – 1.0
0.8 – 1.0
9 - 10 8 - 11 0.5 - 1.2
1.1-1.5
10)
Blast furnace slag. values used in calculations
39.0 36.0 0.90 0.90 9.50 9.50 1.22 1.3 3000
GroutAid (a) 2)
Elkem >86 <2 6)
GroutAid (b)
Elkem 0.33 96.4 0.2 0.55 0.54 0.3 0.15 0.39 None
GroutAid values used in calculations (DM = 50%)
47.5 1 2200
HAC Range
Lafarge
28.5 - 30.5
0.2 – 0.6
<0.5 8)
68.7 - 70.5
<0.5 0.1 - 0.3
< 0.3
HAC values used in calculations
29.5 0.35 0.5 0 69.6 0 0.2 0 None 3000
Injekipsi 1 Gypsum slurry (a)
Kemira CaSO4·2H20 content 66.5 - 67.5 %. Dispersing chemicals <2% of DM. NH3 < 0.02% used for pH adjustment. NH3 can be left out for request.
Injekipsi 1 Gypsum slurry values used in calculations
21.6 0.0 0.0 0.0 30.9 2320
LAC NUMO/CRIEPI
38.09 18.16 0.13 0.13 16.92 2.25 0.82 22.63
9) 10)
RC10 (Rapid) 3)
Finnsementti Oy
64 21 0.72 1 5.1 3.5 2.8 3 10) 3150
Rheocem 900
Master Builders
67.8 21.2 0.1 0.7 5.4 1.5 3.4 3.8 11) 3150
SF UN 920 (a)
Elkem <0.3 >0.85 <0.4 <2.0
SF UN 920 (b)
Elkem 0.14 96.7 0.23 0.52 0.13 0.26 0.15 0.3 None
SF UN 920 Values used in calculations
96.7 0.23 0.52 2200
SF UN 983 (a)
Elkem >98 <0.1 <0.2
SF UN 983 (b)
Elkem 98.4 0.05 0.25 None
SF UN 983 Values used in calculations
98.4 0.1 0.2 2200
SP40 (a) Scancem Chemicals
5.6
SP40 (b) 4)
Scancem Chemicals
6.2 +/-0.3
12)
SP40 Superplast. Values used in calculations
6.2
Ultra fin 16 5)
Cementa 64.6 22.8 0.09 0.61 3.5 0.9 4.2 2 10 3150
WC10 Aalborg 6)
Aalborg White
69 25 0.18 0.09 1.9 0.57 0.32 2.1 10) 3150
WCE Sinai plant 7)
Aalborg White
67.8 24.1 0.07 2.7 0.26 0.2 3 10) 3150
Mole weight using in calc.
g/mol 56.08 60.09 61.98 94.20 101.96 40.31 159.7 80
1) Iron given as Fe 0.5 - 1.2% Equals to 0.71 – 1.72% of Fe2O3 . Average value is 1.22 o f % Fe2O3 2) SF slurry: DM content 48 - 52 w%. 50% used in calculations.
22

3) Clinker composition. Gypsum taken into account an. Cement includes also ground CaCO3 7w%. It is chemically nearly inert and therefore it is not taken into account in the composition. Alkali content of sample taken May 5.5 2003. Other values are averages in 2003. 4) Typical chemical compositions based on analysis received from the manufacturer (Scancem Chemicals, Norway) in the first part of 2003 5) Typical chemical compositions based on analysis received from the manufacturer (Cementa, Degerhamn, Sweden) in the first part of 2003 6) Cement composition. Alkali content of sample taken May 5.5 2003. Other values are averages in the period Sep. 4. 2002 - 20.6.2003 7) Composition of cement produced in Aug. and Sep. 2003 8) Given as Na20 + K2O 9) LAC may contain minor traces of sulphides (Vuorinen et al. 2004) 10) Grinding aid probably used. The content not given by the producer 11) Grinding aid (salts of alkaloamines) used 0.05%. Organic acids used for retardation 0.5 - 1.5%. 12) All organic
Table 6b. Sources of information in Table 6a. Product Producer Blast furnace slag
CT/Rautaruukki Aki Kyckling. Finnsementti Oy, e-mail Mar. 29.2004 (Finnsementti uses blast furnace slag in cement production.)
GroutAid (a) Elkem Product data sheet : GroutAid® MultiGrout. Product P-2-1 GroutAid (b) Elkem Anne-Marit Tonnesland, Elkem, e-mail Dec.15.2003 HAC Secar 71 Lafarge Secar 71 Product Data Sheet
Reference FC-S71-RE-GB-LAF-10/02 Injekipsi 1 Gypsum slurry
Kemira Safety data sheet Oct.10.2003. Ref 813/4.0/FIN/FIN Correspondence: Hannu Äijälä, Kemira, e-mail Nov.17.2003
LAC NUMO/CRIEPI Harutake Imoto, Central Research Institute of Electric Power Industry (CRIEPI,) e-mail 29.1.2004
RC10 (Rapid)
Finnsementti Oy Satu Kosomaa, Finnsementti Oy, e-mail Sep.2.2003.
Rheocem 900 Master Builders Steve Odell, Laferge Special Cements, e-mail Sep.8.2003 SF UN 920 (a) Elkem Product data sheet: Elkem Microsilica®. Product C2-01. Grade 929 for
construction. The values were considered too inaccurate. Further information (below) was obtained from producer.
SF UN 920 (b)
Elkem Anne-Marit Tonnesland e-mail, Elkem, Dec.15.2003
SF UN 983 (a) Elkem Product specification. Elkem Microsilica® 983. Dec.2002 SF UN 983 (b)
Elkem Anne-Marit Tonnesland e-mail, Elkem, Dec.15.2003
SP40. (a) Scancem Chemicals
Na20 content = 5.6% Product data sheet: SCANCEM SP-40. Scancem. Prod No.2152. A/S Scancem Chemicals Oslo Norway Phone +47 22 87 85 30
SP40 (b) Scancem Chemicals
Terje Nilsen, Elkem, e-mail Sep.2.2003
Ultra fin 16 Cementa Terje Nilsen, Elkem, e-mail Sep.2.2003. WC10 Aalborg
Aalborg White Satu Kosomaa, Finnsementti Oy, e-mail Sep.2.2003. Delivered in Finland by Finnsementti Oy
WCE Sinai plant
Aalborg White Duncan Herford, Aalborg Portland, e-mail Jan.1.2003
23

24

6 METHODS
The following experimental methods were used. Detailed mixing procedures along with sampling for each measurement are given in Chapter 7 for each set of experiments.
Temperature
Of the properties listed in the Table 1 all others except pH and compressive strength were determined at the ambient temperature of 12 ºC (approx. the temperature of Olkiluoto bedrock at a depth of 400-500 m). The compressive strength specimens were cured for the first 24 h at the temperature of 12 ºC followed by curing at 20 ºC until tested. For pH and leach testing samples two procedures have been followed; 1) curing at 20oC until tested and 2) the first two weeks at 20 oC followed by curing at 20 ºC until tested. All materials and equipment were tempered at the ambient temperature of 12 ºC prior testing.
Filtration stability with filter pump
The penetration-ability through a 100 µm filter with a hand-operated pump was measured at the age of 1 h (after mixing and agitation for 1 h at the temperature of 12 °C). Pressure difference over the filter was 1 bar (0.1 MPa) and sieve diameter 30 mm. The volume of the pump was 300 ml, which denotes the maximum penetration-ability through the sieve. The larger the value up to the 300 ml the better is the penetration-ability. A detailed description of the method is given in Appendix 2 (Vattenfall Utveckling AB 1996). Some details of the procedure are given also in Appendix 4.
Penetration-ability with penetrabilitymeter
The penetration-ability through filters with different sieve openings was measured at the age of 1 h (after mixing and agitation for 1 h at the temperature of 12 °C) at the ambient temperature of 20 °C. The penetrabilitymeter was cooled with water (8 - 10 °C) prior to measurement. The change was due to practical reasons: The measurement could not be preformed in the cooled room because the space was limited and the sewerage of the room was not suitable for the test. Pressure difference over the filter was 1 bar (0.1 MPa). The penetration-ability is given as bmin and bcrit values. The smaller the value the better is the penetration-ability. A detailed description of the method is given in Appendix 3 along with some details of the procedure in Appendix 4.
Based to the experience gathered up during the experiments, it can be concluded that the method is not suitable for stiff mixes. If the bcrit values of SF-rich low-pH mixes were approx 250 µm or more the results should not be considered accurate (Appendix 4).
Bleeding (water separation)
Bleeding was measured starting immediately after the 5 min mixing period at the temperature of 12 °C in a 100 ml measuring glass. The height of the specimen was 100 mm. The result was given as volume % of separated water at two hours after mixing. When accelerator was used the bleeding was measured two hours after adding
25

accelerator. The method is modified from the bleeding test in the Technical code BY 1 (1972). Specimen height is as in BY 1, but the volume is smaller.
Early shear strength (fall cone test)
The fall cone test was used for testing setting of the mixes at the age of 6 h (after the start of the mixing procedure) at the temperature of 12 °C. The undisturbed period was 5 h 55 min if all components were added during the 5 min mixing period. The undisturbed period was 5 h if any component was added after the 1 h agitation period. The method gives the early age shear strength. Five individual measurements were made, the highest and lowest vales were excluded and the result given as the average of remaining 3 values (Lojander 1985).
Rheology
The plastic viscosity and yield value was measured at the age of 1 h (after mixing and agitation) at the temperature of 12 °C by co-axial rheometry. The measurement started at 0 rpm and was done in 119 steps of increased shear rate up to 238 rpm and the decreasing shear rate was done the same way back to 0 rpm. Every measurement took 2 seconds and the total time for measuring was 9 min. The data was used to determine the yield value and viscosity applying the Bingham model (Equation 5) and Casson model (Equation 6). In the later the data points are linearized along x1/2 an y1/2 axis. It is used with pseudo plastic materials. The measurements were done with a DIN adapter which complies with DIN 53019 requirements for sample geometry. The DIN adapter has a cylindrical geometry which provides defined shear rates. A measurement loop described above was selected to collected data through the whole measuring time. The data was processed with the Rheocalc software which provides modelling according to several models (Bingham, Casson, Power law, IPC Paste analysis). Together Brookfield DV-III+ Rheometer and the Rheocalc software can be used to predict a materials flow, spray, or pumping behaviour by studying shear rate profiles. The measurements were performed by Juha Hokkanen VTT PRO and data processed by Juha Hokkanen VTT PRO. The results are not published elsewhere.
τ = τo + ηp * γ (5)
(τ)1/2 = τo + ηp * (γ)1/2 (6)
where τ is stress (Pa) τo is yield value (Pa) ηp is plastic viscosity (Pas) γ is shear strain rate (1/s)
Marsh cone
The running time of a few mixes was measured at the age of 1 h (after mixing and agitation) at the temperature of 12 °C using a Marsh cone. (Figure 4) (Technical code BY 1 1972).
26

Compressive strength
The compressive strength was measured by casting the specimen into 40 mm * 40 mm * 160 mm moulds. The specimens were stored at the temperature of 12 °C for 24 h following curing at the temperature of 20 °C, RH 100% until tested at the ages of 28 d and 91 d. The result given is the average of three determinations. The procedure is a modification of the standard SFS-EN196-1. According to the standard the result is given as the average of six determinations. In this work only three determinations were used for practical reasons to save materials. Another difference compared to SFS-EN196-1 was the curing conditions. According to the standard the curing is 20 °C for 24 h and after de-moulding in water. In this work the specimen were kept covered with plastic or glass plate at 12 °C for 24 h in order to make observations of hardening at that temperature. After the 24 h on they were further kept in the moulds covered because several samples were too week to be de-moulded.
Outlet d = 4,8 mm
304Filling height 281 mm
50 mm
d = 151 mm
Figure 4. Schematic illustration of the Marsh cone. The volume of specimen run through the cone was 1 litre. All dimensions in mm.
27

28

7 MIX MODIFICATION - EXPERIMENTAL STUDIES
7.1 OPC - SF system: First experiments
7.1.1 Experiments
Grouting mixes based on the SR cement UF16 and SF in the form of GroutAid were modified to reach the required injection properties. The SF/OPC ratio was constant 0.30 according to calculations shown in Table 4. Material information is given in Chapter 5, the base mix compositions in Table 7 and mixing orders 1, 2 and 4 in Table 8. The aim of testing the mixing orders 1 and 2 was to show if delayed addition of GroutAid would improve the properties by minimizing the effects of “gel blocking” (Kronlöf 2003). The delay was 1 h, as long as the open time requirement. The bases for this set up was a grouting procedure where GroutAid would be added in the nozzle instead of mixing it in the mixer with other components. Mixing order 4 was applied when shotcrete accelerator (Meyco SA 161) was tested. The results are discussed in the up-coming figures below. The mix compositions and test results are given in detail in Appendix 5 in Tables 1, 2 and 3 as follows:
• The effect of W/DM (1 – 2.2) in the rows 1101 – 1104. • The effect of mixing orders 1 and 2 (Table 8) with SP (1%) and without SP with
a constant W/DM of 1.26 in the rows 1107 – 1115. • The effect of shotcrete accelerator (Meyco SA 161) with the mixing order 4
(Table 8) and a constant W/DM of 1.26 in the rows 1118 – 1121. • Comparison of the UF16 cement to a relatively rapidly reacting OPC micro
cement (Rheocem 900) with the mixing orders 1 and 2 in the rows 1125 – 1130.
The accelerator (Meyco SA 161) and more rapid micro cement were applied to overcome the problem of too slow setting (shear strength at the age 6 h after mixing water). The accelerator was added at the end of the delay period for the reasons above, to produce the best possible conditions for the accelerator performance. The testing temperature was 12 C throughout the experiments as described earlier (Chapter 6).
Table 7. The first OPC-SF mix compositions. Binder
OPC -type
SF type
SF /OPC
OPC/DM
SF /DM
Superpl./DM
Mixing order
Water /DM
OPC-SF UF16 or Rheocem 900
Grout Aid'
0.30 0.77 0.23 0% or
1%
1 or 2
1-2.2
29

Table 8. Mixing orders and testing procedures 1, 2, and 4 for the OPC+SF-mixes. Mixing order and testing
procedure 1 Mixing order and testing procedure 2
Mixing order and testing procedure 4
1 Water + dry materials Water + dry materials Water + dry materials 2 Start timing for all tests. Start timing for all tests. Start timing for all tests. 3 Mix 2 min 12 000 rpm 1) Mix 2 min 12 000 rpm 1) Mix 2 min 12 000 rpm 1) 4 Superpl. if any Superpl. if any Superpl. if any 5 Mix GroutAid Mix 3 min 12 000 rpm 1) Mix 3 min 12 000 rpm 1) 6 Mix 3 min 12 000 rpm 1) Do not test yet. Do not test yet. 7 Start bleeding and
shear strength tests Move the mix to agitator Move the mix to agitator
8 Move the mix to agitator Slow agitation for 1h Slow agitation for 1h 9 Slow agitation for 1h Mix GroutAid for 0.5 min Mix GroutAid and shotcrete
accelerator for 0.5 min 10 Test rheology and penetration-
ability at 1h Test rheology and penetration-ability at 1 h. Start bleeding and shear strength tests at 1 h.
Test rheology and penetration-ability at 1 h. Start bleeding and shear strength tests at 1 h.
11 Cast for pH and comp. str. Cast for pH and comp. str. Cast for pH and comp. str. 12 Test bleeding at 2 h and shear
strength at 6 h Test bleeding at 3 h and shear strength at 6 h
Test bleeding at 3 h shear strength at 6 h
13 Test compressive. strength at 28/91 d
Test compressive strength at 28/91 d
Test compressive strength at 28/91 d
14 Selected specimen sent to pH test to be tested at 2 months
Selected specimen sent to pH test to be tested at 2 months
Selected specimen sent to pH test to be tested at 2 months
1) Dispersing equipment. Diameter of the rotator-stabilator aggregate 30 mm. Batch volume 3 litre.
7.1.2 Results and conclusions
The results (given in detail in Appendix 5, Tables 1, 2 and 3, rows 1101 - 1130) were as follows. (The bleeding of all mixes was within the requirements and it is not discussed here):
Effect of W/DM
As W/DM was increased the mix became very clearly more fluid but the shear strength decreased as well (Figure 5a). The three highest shear strength values (with the lowest W/DM values) were higher (better) that the requirement (0.5 kPa) (Step 2 in Chapter 4) but still lower than needed for practical grouting. The large variation of mixes barely affected the penetration-ability measured by the filter pump. Only the very densest mix showed a slightly lower value (Figure 5b). This was due to the obvious insensibility of the method when testing mixes with good penetration-ability. (Appendix 5 in, Tables 1, 2 and 3, rows 1101 – 1104).
30

UF16, SF/OPC = 0.3
0
10
20
30
40
50
0.8 1 1.2 1.4 1.6 1.8 2 2.2
Water / dry materials
Yield, Casson, PaYield, Bingham, PaShear 1st point, PaVisc, Casson, mPasShear str. 6h, kPaShear str. x10, 6h, kPa
1 2 3 4
UF16, SF/OPC = 0.3
0
50
100
150
200
250
300
350
0.8 1 1.2 1.4 1.6 1.8 2 2.2
Water / dry materials
Filte
r pum
p, 1
00 µ
m, m
l
1 2 3 4
(a) (b)
Figure 5a and 5b. Effect of W/DM on early injection properties. The mix numbers are given in the boxes.
Effect of mixing order and SP
Delayed addition of SF (mixing order 2, Table 8) made the mix clearly more fluid. Yet, such a procedure was considered too laborious and so the “mixing everything together” during the 5 min mixing period was preferred. The effect of 1% SP addition was negligible (Figure 6a). The modifications did not effect on the filter pump result probably for the reasons explained above. (The only diverging behaviour of mix 9 was considered to be due to an experimental error, not seen in the parallel test mix 13.) (Figure 6b). (Appendix 5 in, Tables 1, 2 and 3, rows 1107 – 1115).
UF16, SF/OPC = 0.3
0
5
10
15
20
25
10 11 2 12 9 13
Yield, Casson, PaYield, Bingham, PaShear 1st point, PaShear str. 6h, kPaVisc, Casson, mPas
SP, MIX ORD. 1 MIX ORD. 2SP, MIX ORD. 2 MIX ORD. 1
UF16, SF/OPC = 0.3
0
50
100
150
200
250
300
350
10 11 2 12 9 13
Filte
r pum
p 10
0 µm
, ml
SP, MIX ORD. 1 MIX ORD. 1 MIX ORD. 2SP, MIX ORD. 2
(a) (b)
Figure 6a and 6b. Effect of mixing order and SP. Mix numbers are given on x-axis, use of superplasticizer and mixing order in the text boxes. Mixes 2 and 12 as well as 9 and 13 are parallel tests.
31

Effect of shotcrete accelerator
Even though the shotcrete accelerator (Meyco SA 161) was added at the end of the delay period (mixing order 4, Table 8) it totally deteriorated the penetration-ability as well as other properties to a smaller extent. (Figures 7a and 7b). However it did not improve the shear strength development as intended. The accelerating reaction was obviously far too fast for grouting purposes. It did not offer a solution to the low setting rate problem. (Appendix 5 in, Tables 1, 2 and 3, rows 1118 – 1121).
UF16, SF/OPC = 0,3
02468
1012141618
0 0.5 1 1.5Acceleretor, w%
Yield, Casson, PaYield, Bingham, PaShear 1st point, PaShear str. 6h, kPaVisc, Casson, mPas
UF16, SF/OPC = 0.3
0
50
100
150
200
250
300
350
0 0.5 1 1
Accelerator, w%
Filte
r pum
p, 1
00 µ
m, m
l
.5
(a) (b)
Figure 7a and 7b. Effect of shotcrete accelerator (Meyco SA 161)
Effect of fast reacting OPC
The relatively rapidly reacting OPC micro cement (Rheocem 900) was tested in order to find a solution to the slow setting problem, Rheocem 900 was not compatible with GroutAid. The penetration-ability was poor even with high W/DM and delayed SF addition (Figure 8). (Appendix 5, Tables 1, 2 and 3, rows 1125 – 1130).
Rheocem900, SF/OPC = 0.3
0
50
100
150
200
250
300
350
0.8 1 1.2 1.4 1.6 1.8 2 2.2
Water / dry materials
Filte
r pum
p, 1
00 µ
m, m
l
Mix order 1Mix order 2
Figure 8. Effect of fast reacting OPC.
32

Conclusion of the first tests on OPC+SF system
• None of mixing could provide acceptable properties in all respects. The slow setting was alarming from the practical point of view. The bleeding of all mixes was within the requirements.
7.2 OPC - SF system: First penetration-ability and pH measurements
The mixes 10, 11, 12 and 13 from the previous mixing order and SP tests were remixed and tested for penetration-ability by the penetrabilitymeter (Chapter 6). The results were within the requirements (Table 9). Even though the mixing order 2 (delayed SF addition) made the mixes more fluid it did not effect the penetration-ability, neither did the SP addition. The setting (shear strength) was again too low as it was in the first mixes as explained earlier. (Appendix 5, Tables 1, 2 and 3, rows 1134 – 1137).
The mix 12 (W/DM = 1.26) was chosen to be the most promising and it was sent to the pH measurements for the following reasons:
• simple mixing (mixing order1) • no superplasticizer • viscosity within the requirements • shear strength at 6 h was poor, but yet the mix showed some setting unlike the
ones with higher W/DM
The pH was too high (Vuorinen et al. 2004). (pH results will be examined closer in the Chapter 9.1 along with the chemical composition)).
Table 9. Properties of mixes 10, 11, 12 and 13. W/DM = 1.26, SF/OPC = 0.30.
Mix SP, %
Mixing order
Bleeding, %
Shear str, 6h,
kPa
B min µm
B crit, µm
Viscosity Bingham,
mPas
Yield value Bingham.
Pa 10 1 1 0 1.3 38 91 42 23 11 1 2 0 0 48 118 26 7 12 0 1 0 0.2 63 108 55 22 13 0 2 0 0 41 97 23 7
7.3 OPC - SF system: Ettringite acceleration (ETTA)
7.3.1 Experiments
An acceleration system based on early age ettringite reaction was developed for the OPC+SF mixes in order to increase and control the setting rate at the relatively low ambient temperature of 12 ºC. Typical commercial accelerators (Cl- and NO3
-) were ruled out due to long-term safety reasons and shotcrete (spray concrete) accelerator (Meyco SA 161) for penetration-ability reasons. The system was developed for UF16 - GroutAid mixes, which were used throughout the present experiments. The ETTA
33

components were high alumina cement (HAC) (ground at VTT) and gypsum (G) as a slurry (a commercial product). (Chapter 5).
The basis of the system was the accelerating effect of HAC on OPC. The options of adding and not adding gypsum to the mix were examined. Both ETTA components were applied as fine particles (Chapter 5). A number of different mixing orders were tested. The formation of ettringite was not verified experimentally.
The ETTA system was first developed with a constant SF/OPC ratio of 0.26, which is relatively low, in order to observe the early OPC reactions without too much SF interference. W/DM was 1.62. Later higher SF/OPC ratios were examined along with higher W/DM. The results are discussed in the up-coming figures below. The mix compositions and test results are given in detail in Appendix 5 in Tables 1, 2 and 3 as follows:
• The effect of HAC/OPC and mixing order without gypsum in the rows 1141 – 1182.
• The effect of HAC/OPC and mixing order with gypsum (G/OPC = 0.027) in the rows 1184 – 1240.
• The effect of SF/OPC and W/DM. HAC/OPC= 0.075, G/OPC = 0.027 in the rows 1242 – 1252.
• The effect of SF/OPC and W/DM. HAC/OPC= 0.1, G/OPC = 0.027 in the rows 1254 – 1264.
The mixing and testing procedure for mixing orders 11 (without gypsum) and 21 (with gypsum) are outlined in Table 10. The basic mixing orders 11 and 21 were further modified as shown below (Tables 11 and 12).
34

Table 10. Mixing orders and testing procedures 11 and 21 for OPC+SF mixes with ETTA.
Mixing order and testing procedure 11 with OPC+SF system
Mix order 21 and testing procedure with OPC+SF system
1 Water + dry materials (UF16 + HAC)
Water + UF 16 +HAC+ Gypsum slurry
2 Start timing for all tests. Start timing for all tests 3 Mix 2 min 12 000 rpm 1) Mix 2 min 12 000 rpm 1) 4 Superpl. if any Superpl. if any 5 GroutAid GroutAid 6 Mix 3 min 12 000 rpm 1) Mix 3 min 12 000 rpm 1) 7 Start bleeding and
shear strength tests Start bleeding and shear strength tests
8 Move the mix to agitator Move the mix to agitator 9 Slow agitation for 1h Slow agitation for 1h 10 Test rheology and penetration-
ability at 1h Test rheology and penetration-ability at 1h
11 Cast for pH and comp. str. Cast for pH and comp. str. 12 Test bleeding at 2 h and shear
strength at 6 h Test bleeding at 2 h and shear strength at 6 h
13 Test compressive strength at 28/91 d
Test compressive strength at 28/91 d
14 Selected specimen sent to pH test to be tested at 2 months
Selected specimen sent to pH test to be tested at 2 months
1) Dispersing equipment. Diameter of the rotator-stabilator aggregate 30 mm. Batch volume 3 litre.
Table 11. Procedure of mixing orders of ETTA mixes without gypsum slurry. The numbers give the time of addition starting from mixing water.
Mixing order
HAC GroutAid
11 0 min 2 min 10 1 h 2 min 12 0 min 1 h 14 1 h 1 h
Table 12. Procedure of mixing orders of ETTA mixes with gypsum slurry.
Mixing order
HAC Gypsum slurry
GroutAid
21 0 min 0 min 2 min 20 0 min 0 min 1 h 22 1 h 0 min 1 h 24 1 h 1 h 1 h 26 0 min 1 h 1 h
35

7.3.2 Results and conclusions
The results (Appendix 5, Tables 1, 2 and 3) were as follows:
Increasing the HAC content (HAC/OPC) without gypsum accelerated the strength development very clearly (Figures 9a and 9b). The highest values were more than 100 times as high as the requirement (0.5 kPa). Unfortunately penetration-ability measured by the filter pump decreased as well. Out of the four mixing orders the simplest one, 11 (Table 10), gave the best mixes. (Rows 1141 – 1182).
Similar trends were seen from the results with gypsum (Figures 10a and 10b). The effect of mixing order was more dominant than without gypsum. Again the simplest one, 21, was the best. Other mixing orders deteriorated especially the penetration-ability. (Rows 1184 – 1240).
When comparing the results with the best mixing orders 11 and 21 (Table 10), the penetration-ability of the mixes made with gypsum (with the mixing order 21) was better (Figures 11a and 11b).
Increasing the SF content (SF/OPC) while using ETTA (HAC/OPC = 0.75, G/OPC = 0.027) gave also promising results (Figure 12a and 12b). The shear strength vs. W/DM was not quite as high as with smaller SF/OPC, which was expected since the OPC content decreased while SF/OPC increased. (The one poor penetration-ability result is probably due to the large W/DM and low SF/OPC of the mix. Very “lean” and “thin” mixes are unable to carry the particles through the sieve.) (Rows 1242 – 1252) Similar test series was also made with higher HAC dosage (HAC/OPC = 0.1, instead of 0.075), but the results with the lower dosage were slightly better. (Rows 1254 – 1264).
UF16, SF/OPC = 0,26, W/DM=1,62
0
10
20
30
40
50
60
70
80
0.00 0.05 0.10 0.15
HAC/OPC
Shea
r str
. 6h,
kPa
HAC/11HAC/14HAC/10HAC/12
UF16, SF/OPC= 0,26, W/DM=1,62
0
50
100
150
200
250
300
350
0.00 0.05 0.10 0.15HAC/OPC
Filte
r pum
p, 1
h, m
l
HAC/11HAC/14HAC/10HAC/12
(a) (b)
Figure 9a and 9b. Effect of HAC/OPC and mixing order without gypsum.
36

UF16, SF/OPC = 0,26, W/DM=1,62
0
10
20
30
40
50
60
70
80
0.00 0.05 0.10 0.15HAC/ OPC
Shea
r str
. 6h,
kPa
HAC+G/21HAC+G/26HAC+G/20HAC+G/22
UF16, SF/OPC = 0,26, W/DM=1,62
0
50
100
150
200
250
300
350
0.00 0.05 0.10 0.15
HAC/ OPC
Filte
r pum
p, 1
h, m
l
HAC+G/21HAC+G/26HAC+G/20HAC+G/22
(a) (b)
Figure 10a and 10b. Effect of HAC/OPC and mixing order with gypsum.
UF16, SF/OPC = 0,26, W/DM=1,62
0
10
20
30
40
50
60
70
80
0.00 0.05 0.10 0.15HAC/ OPC
Shea
r str
., 6h
, kPa
HAC/11
HAC+G/21
UF16, SF/OPC = 0,26, W/DM=1,62
0
50
100
150
200
250
300
350
0.00 0.05 0.10 0.15HAC/ OPC
Filte
r pum
p, 1
h, m
l
HAC/11
HAC+G/21
(a) (b)
Figure 11a and 11b. Comparison between ETTA mixes with and without gypsum. Mixing orders 11 and 21.
37

No ETTA / ETTAHAC/OPC = 0.075, G/OPC = 0.027
02468
1012141618
0 0.5 1 1.5 2 2.5 3 3.5Water / dry materials
Shea
r str
, 6 h
, kPa
ETTA, 0.3ETTA 0.5ETTA, 0.94ETTA, 1.25No ETTA, 0.3Poly. (ETTA, 0.3)
No ETTA / ETTAHAC/OPC 0.075, G/ OPC = 0.027
0
50
100
150
200
250
300
350
0 0.5 1 1.5 2 2.5 3 3.5Water / dry materials
Filte
r pum
p, 1
h, m
l
ETTA, 0.3ETTA 0.5ETTA, 0.94ETTA, 1.25No ETTA, 0.3
(a) (b)
Figure 12a and 12 b. Effect of increasing SF/OPC from 0.3 to 1.25 and effect of W/DM. HAC/OPC= 0.075, G/OPC = 0.027. Numbers in the legend box denote SF/OPC content.
7.4 OPC - SF system: Penetration-ability and pH with ettringite acceleration (ETTA)
7.4.1 Experiments
The OPC+SF mixes were further modified by increasing the SF content to reach the required pH value ( ≤ 11). The SF/OPC ratios were applied 0.69 an 0.94. The mixing order was no 21 (Table 10). No SP was used. The results are given in the up-coming Table 13. The mix compositions and test results are given in detail in Appendix 5 in Tables 1, 2 and 3 as follows:
• The effect of SF/OPC and W/DM with ETTA (HAC/OPC = 0.075 and 0.10, G/OPC = 0.027) in the rows 1266 – 1270 and
• similarly without gypsum (HAC/OPC = 0.075 and 0.10, G/OPC = 0) in the rows 1272 – 1275.
7.4.2 Results and conclusions
The results in Table 13 showed that several mixes met the requirements except that given to the yield value of the rheology measurements. Especially the penetration-ability results (B min and B crit) were excellent. (Unfortunately those could not be repeated as will be shown below). The mixes f63 and f64 were chosen to be tested for pH. For both mixes the pH decreased with time and both reached eventually required values (≤ 11). The pH decline of f64 was faster than that of f63. (pH will be examined closer in Chapter 9.1). The compressive strength was not measured because it was not defined as a requirement at the time.
38

Table 13. Properties of OPC-SF mixes with ETTA e72 and f63 – f70. The mixing order was no 21 (Table 10). No SP was used.
Mix G/ OPC
HAC/ OPC
SF/ OPC
W/ DM
Bleed-ing, %
Shear str, 6h,
kPa
B minµm
B crit, µm
Viscosity Bingham,
mPas
Yield value
Bingham, Pa
e72 0.027 0.075 0.69 2.0 0 6.5 53 152 f63 0.027 0.075 0.69 2.5 0 3.7 44 65 49.6 20.7 f64 0.027 0.075 0.94 2.9 0 3.4 44 63 40.4 16.4 f65 0.027 0.1 0.69 3.1 0 1.3 43 70 30.7 12.1 f66 0.027 0.1 0.94 2.9 0 2.8 44 68 41.3 22.6
f67 0 0.075 0.69 2.5 0 4.8 44 71 43.8 13 f68 0 0.075 0.94 3.0 0 3.7 43 71 40.4 11.6 f69 0 0.1 0.69 3.2 0 2.2 44 83 26.3 6.5 f70 0 0.1 0.94 2.9 0 4.1 41 85 36.2 12.5
7.5 OPC - SF system: Effect of W/DM with ettringite acceleration (ETTA)
7.5.1 Experiments
When the compressive strength requirement of 4 MPa was set, the effect W/DM on compressive strength was preliminary tested with specimen originally cast but not used in the pH experiments (cast in plastic tubes). Testing age was about 3 months. SF/OPC was 0.3 and no ETTA applied.
After the preliminary compressive strength tests all properties of the f63 and f64 type of mixes were tested against the W/DM. The results are given in the up-coming Table 14. The mix compositions and test results are given in detail in Appendix 5 in Tables 1, 2 and 3 as follows:
• f64 type of mix (SF/OPC = 0.94 with ETTA). Mixes u1, u2 and u3 in the rows 1293 - 1295.
• f63 type of mix (SF/OPC = 0.69 with ETTA). Mixes u4, u5 and u6 in the rows 1297 - 1299.
• f63 type of mix (SF/OPC = 0.69 with ETTA) repeated with a new UF16 batch. Mixes u8, u9 and u10 in the rows 1302 - 1304.
• f63 type of mix without ETTA. Mixes u11, u12 and u13 in the rows 1306 - 1308.
• Different reference tests in the rows 1289 - 1291.
39

Table 14. Mix compositions u1 – u6 and u8 – u13. Mix Mix type OPC type SF type OPC/
DM SF/ DM
Gypsum/OPC
HAC/ OPC
SF/ OPC
Superpl./ DM
Water/DM
SF/OPC = 0,94, with ETTA, W/DM = 2 - 2,5 – 4 u1 f64 UF16 GroutAid 0.49 0.46 0.027 0.075 0.94 0.00 2.01 u2 f64 UF16 GroutAid 0.49 0.46 0.027 0.075 0.94 0.00 2.51 u3 f64 UF16 GroutAid 0.49 0.46 0.027 0.075 0.94 0.00 4.01 SF/OPC = 0,69, with ETTA, W/DM = 2 - 2,5 – 4 u4 f63 UF16 GroutAid 0.56 0.38 0.027 0.075 0.69 0.00 2.00 u5 f63 UF16 GroutAid 0.56 0.38 0.027 0.075 0.69 0.00 2.51 u6 f63 UF16 GroutAid 0.56 0.38 0.027 0.075 0.69 0.00 4.01 SF/OPC = 0,69, with ETTA, W/DM = 2 - 2,5 - 4, new UF16 batch u8 f63 UF16 GroutAid 0.56 0.38 0.027 0.075 0.69 0.00 2.00 u9 f63 UF16 GroutAid 0.56 0.38 0.027 0.075 0.69 0.00 2.51
u10 f63 UF16 GroutAid 0.56 0.38 0.027 0.075 0.69 0.00 4.01 SF/OPC = 0,69, without ETTA, W/DM = 2 - 1,6 - 1,2, new UF16 batch u11 f63 no
ETTA UF16 GroutAid 0.59 0.41 0.00 0.000 0.69 0.00 2.00
u12 f63 no ETTA
UF16 GroutAid 0.59 0.41 0.00 0.000 0.69 0.00 1.60
u13 f63 no ETTA
UF16 GroutAid 0.59 0.41 0.00 0.000 0.69 0.00 1.20
7.5.2 Results and conclusions
Properties of the f63 type mix vs. W/DM are given in Figure 13 and for the f64 type of mix in Figure 14. The bleeding of all mixes was 0%. The bleeding values are not shown in the Figures.
40

Strength
02468
101214161820
1 1.5 2 2.5 3 3.5 4 4.5Water / dry materials
Com
pres
sive
str
28
d an
d 91
d, M
Pa
Est, prev project. Experim. without SF, 1)UF16+SF no ETTA, 3 months, 2)UF16+SF+ETTA (f63 type) 4)UF16+SF+ETTA (f63 type) 5)UF16+SF no ETTA (f63 type) 5)
91 d
28 d
0
2
4
6
8
10
12
14
1.0 1.5 2.0 2.5 3.0 3.5 4.0 4.5Water / dry materials
Shea
r str
, 6h,
kPa
UF16+SF+ETTA (f63 type) 3)UF16+SF+ETTA (f63 type) 4)UF16+SF+ETTA (f63 type) 5)UF16+SF no ETTA (f63 type) 5)Expon. (UF16+SF+ETTA (f63 type) 4))Expon. (UF16+SF no ETTA (f63 type) 5))
(a) (b)
0
50
100
150
200
250
300
350
400
1.0 1.5 2.0 2.5 3.0 3.5 4.0 4.5
Water / dry materials
Pene
trab
ility
, B c
rit a
nd B
min
, µm
UF16+SF+ETTA (f63 type) 3)UF16+SF+ETTA (f63 type) 4)UF16+SF+ETTA (f63 type) 5)UF16+SF no ETTA (f63 type) 5)
B minB crit
0
20
40
60
80
100
120
140
160
1.0 1.5 2.0 2.5 3.0 3.5 4.0 4.5
Water / dry materials
Visc
osity
(mPa
s) a
nd
yiel
d va
lue
(Pa)
UF16+SF+ETTA (f64 type) 4)
UF16+SF+ETTA (f63 type) 5)
UF16+SF no ETTA (f63 type) 5)
Visc.
Yield
(c) (d)
Figure 13a, 13b, 13c and 13d. Properties of the f63 type (SF/OPC = 0.69) mix vs. W/DM. 1) Curve fitted to results without SF. (Kronlöf 2003) 2) Tested with pH cylinders at the age of about 3 months. Experiments 1,2,3 and 4. SF/OPC 0.3, smaller that in f63 and f64. 3) First UF16 batch. Former experiments. Tested for pH (Chapter 7.4). 4) First UF16 batch. Final experiments. 5) New UF16 batch. Final experiments.
41

Strength
02468
101214161820
1 1.5 2 2.5 3 3.5 4 4.5
Water / dry materials
Com
pres
sive
str
, 28
d an
d 9
1 d,
M
Pa
Est, prev project. Experim. without SF, 1)
UF16+SF no ETTA, 3 months, 2)
UF16+SF+ETTA (f64 type) 4)
91 d
28 d
0
2
4
6
8
10
12
14
1.0 1.5 2.0 2.5 3.0 3.5 4.0 4.5Water / dry materials
Shea
r str
, 6h,
kPa
UF16+SF+ETTA (f64 type) 3)
UF16+SF+ETTA (f64 type) 4)
Expon. (UF16+SF+ETTA (f64 type) 4))
(a) (b)
0
50
100
150
200
250
300
350
400
1.0 1.5 2.0 2.5 3.0 3.5 4.0 4.5
Water / dry materials
Pene
trab
ility
, B m
in a
nd B
crit
, µm
UF16+SF+ETTA (f64 type) 3)
UF16+SF+ETTA (f64 type) 4)
b min
b crit
0
20
40
60
80
100
120
140
160
1.0 1.5 2.0 2.5 3.0 3.5 4.0 4.5
Water / dry materials
Visc
osity
(mPa
s) a
nd
yiel
d va
lue
(Pa)
UF16+SF+ETTA (f64 type) 4)
Visc.
Yield
(c) (d)
Figure 14a, 14b, 14c and 14d. Properties of the f64 type mix (SF/OPC = 0.94) vs. W/DM. 1) Curve fitted to results without SF (Kronlöf 2003). 2) Tested with pH cylinders at the age of about 3 months. Experiments 1,2,3 and 4. SF/OPC 0.3, smaller that in f63 and f64. 3) First UF16 batch. Former experiments. Tested for pH (Chapter 7.4). 4) First UF16 batch. Final experiments.
The Figures above can be used to select W/DM ratio for mixes. The W/DM value that gives the mix with the required properties is about 2.5. Yet the compressive strength would be slightly too low. Decreasing the W/DM to 2 would increase the viscosity sharply up to 100 mPas, which clearly exceeds the requirement of 50 mPas.
The dosage of acceleration (ETTA) can be increased or decreased depending on the needs. As the effect on gypsum alone was found relatively small, ETTA dosage could be regulated with HAC only, while keeping the gypsum content constant. More detailed discussion on W/DM and ETTA is given in Chapter 12.7.
42

Note: The excellent penetration-ability results given in Table 13 could not be repeated in the tests reported in Figures 13 and 14. The tests were run with two batches of UF16 to rule out the effect of possible ageing of the cement. Therefore the ones given in Table 13 should be over looked and not be treated as the true penetration-ability behaviour of those mixes. The reason for the disagreement was not found.
7.6 OPC - SF system: Low alkali white cement (WCE)
7.6.1 Experiments
The very low alkali white OPC (WCE) was ground at VTT to micro cement fineness and tested for all the injection properties. SF was used in the form of GroutAid as in the previous mixes (Chapter 5). The experiments and results are listed in Appendix 5, Tables 1, 2 and 3, Rows 1315 – 1319. The aim was to find answers to the following questions:
• How are the pH and leaching affected by the low alkali content of the cement? • Is it possible to achieve penetration-ability using WCE? OPCs are known to
behave very differently in the presence of SF. • Does ETTA work with WCE?
7.6.2 Results and conclusions
The results are given in Table 15. The mixes met the requirements except that given to the yield value of the rheology measurement. Yet, the yield values were lower (better) than in the case of similar UF16 mixes (Table 13) whereas the setting (shear strength at 6 h) was slower which was not desired. More ETTA would be needed on site conditions. Mixes w1 and w2 were chosen to be tested for pH. W1 did not but w2 did reach required value (≤ 11). With both SF/OPC ratios the pH of the WCE mix was higher than that of the comparable UF16 mix, which led to an unexpected conclusion about cement alkali content: The low alkali cement (WCE) did not produce a lower pH mix compared to the higher alkali cement (UF16) but, in fact, reverse. (pH will be examined closer in Chapter 9.1).
Table 15. Properties of mixes w1 – w4. The mixing order was no 21 (Table 10). No SP was used. Mix G/
OPC HAC/OPC
SF/ OPC
W/ DM
Bleed-ing, %
Shear str, 6h,
kPa
B minµm
B crit, µm
Viscosity Bingham,
mPas
Yield value
Bingham, Pa
w1 0.027 0.075 0.69 2.5 0 1.3 49 103 35.3 8.04 w2 0.027 0.075 0.94 2.9 0 1.1 47 102 28.4 7.39 w3 0 0.075 0.69 2.5 0 1.2 49 104 48.5 7.55 w4 0 0.075 0.94 2.95 0 1.0 46 102 33.7 6.21
43

7.7 OPC - SF system: Effect of premixing SF with cement
7.7.1 Experiments
The possibility of pre-mixing the ETTA components and dry un-densified SF with cement was examined. The motivations for the examinations were as follows:
• A single pre-mixed dry product would be practical to handle on site. • A dry SF product might react slower and produce less “gel”, which could
improve penetration-ability. • A low alkali dry product, un-densified, SF type 983 is available (Chapter 5).
Testing its effect on pH and leaching was considered, but the tests were excluded eventually.
The results are given in the up-coming Table 17. The mix compositions and test results are given in detail in Appendix 5 in Tables 1, 2 and 3 in rows 1321 - 1333. The low alkali white OPC (WCE) and gypsum were ground at CT-Group to micro cement fineness. Low alkali SF type 983 was used in the experiments (Chapter 5, Materials). The mixing procedure was the mixing order 211 in Table 16. The aim of the experiments was to find answers to the following questions:
• Can the ETTA components be pre-mixed as dry products prior to adding water. This necessitated the substitution of gypsum slurry with dry gypsum.
• How does dry un-densified SF affect the injection properties compared to GroutAid when mixing dry un-densified SF while making the grout?
• How does the premixing of dry un-densified SF affect the injection properties compared to mixing dry un-densified SF while making the grout?
Table 16. Mixing order and testing procedure 211 for pre-mixed dry products. Mixing order and testing procedure 211
with pre-mixed products 1 Water + all dry materials 2 Start timing for all tests 2 Mix 2 min 12 000 rpm 1) 3 Superpl. if any 4 GroutAid 5 Mix 3 min 12 000 rpm 1) 6 Start bleeding and shear strength tests 7 Move the mix to agitator 8 Slow agitation for 1h 9 Test rheology and penetration-ability at 1h 10 Cast for pH and comp. str. 11 Test bleeding at 2 h and shear strength at 6 h 12 Test compressive strength at 28/91 d 13 Selected specimen sent to pH test to be tested at 2
months 1) Dispersing equipment. Diameter of the rotator-stabilator aggregate 30 mm. Batch volume 3 litre.
7.7.2 Results and conclusions
The results given in Table 17 show that premixing of SF is clearly detrimental to injection properties (w7 vs. w6). The only exceptions were the viscosity and yield value which decreased when pre-mixing dry SF. Yet, the reason for this was the agglomeration of SF on cement particles during the pre-mixing, which is not wanted.
44

The agglomeration is demonstrated by the particle size distributions WCE, G3 and G4 in Figure 3a where G3 is coarser than G4.
When considering the possibility of mixing dry SF in the mixer instead of GroutAid, the result was not quite so clear (mixes w5 and w6). For the behaviour of both mixes w5 and w6 was somewhat obscure, the question was further re-examined with UF16 by comparing the previously presented “traditional” GroutAid mix u2 with u7. The only difference was the use of dry un-densified SF type 920 (the raw material of GroutAid) instead of GroutAid. The SF was added directly to the mixer as GroutAid (Experiment u7. Row 1333). The result showed quite clearly that GroutAid cannot be substituted by dry un-densified SF without deteriorating the penetration-ability.
Table 17. Properties of mixes w5 – w and u2 - u7. HAC/OPC = 0.075, G/OPC = 0.027, SF//OPC = 0.94, W/D = 2.5. No SP was used.
Mix Premixed materials
Premixed dry product
SF-type Bleed-ing, %
Shear str, 6h,
kPa
B min µm
B crit, µm
Viscosity Bingham,
mPas
Yield value Bingham,
Pa
w5 WCE, G, HAC G4 GroutAid 0 5.32 89 269 48.6 17
w6 WCE, G, HAC G4
un-densified type 983
0 3,37 145 297 21 4.8
w7 WCE, G, HAC, SF G3
un-densified type 983. pre-mixed
0 0,9 165 410 16.9 3.6
u2 None GroutAid 0 5.83 46 101 75.8 25.2
u7 None un-densified type 920
0 6.47 163 324 49.4 21.9
7.8 Slag system: First experiments
7.8.1 Experiments
A number of preliminary tests were run to the study the basic injection properties of slag.
The slag used was ground by CT-Group in a pilot plant jet mill. The batch was identified as SL10/1 in Chapter 5. The OPC was Finnish rapid hardening cement ground by CT as well and identified as RC/1. SF was used in form of GroutAid. The mixing orders 1 and 2 are given in Table 18. The results are discussed in the up-coming figures below. The mix compositions and test results are given in detail in Appendix 5 in Tables 1, 2 and 3 as follows:
• The effect of OPC/SL (0.05 - 0.075 - 0.1 - 0.2), no SF, W/DM = 0.82 - 0.92. In the rows 1342 – 1345
• The effect of SP, OPC/SL = 0.1, no SF, W/DM = 0.82. In the rows 1348 -1349 • The effect of OPC type, OPC/SL = 0.15, no SF, W/DM = 0.82.
In the rows 1352 - 1353
45

• The effect of SP, OPC/SL = 0.2, no SF, W/DM = 0.82. In the rows 1357 - 1358
• The effect of mixing order with SP, OPC/SL = 0.2, SF/DM = 0.04, W/DM = 0.83. In the rows 1361 - 1362
• The effect of mixing order without SP, OPC/SL = 0.2. SF/DM = 0.04, W/DM = 0.83. In the rows 1365 – 1366
• The effect of mixing order without SP, OPC/SL = 0.2, SF/DM = 0.14, W/DM = 1.25, In the rows 1369 – 1370
• The effect of W/DM, no SP, OPC/SL = 0.2. SF/DM = 0.14. In the rows 1373 – 1374
• The effect of OPC type, no SP, OPC/SL = 0.2. SF/DM = 0.04, W/DM = 0.83. In the rows 1377 – 1379
Table 18. Mixing orders and testing procedures 1 and 2 for Slag mixes. Mixing order and testing
procedure 1 with Slag systemMixing order and testing procedure 2 with Slag system
1 Water + slag + OPC+ gypsum slurry
Water + slag+ OPC+ gypsum slurry
2 Start timing for all tests Start timing for all tests 3 Mix 2 min 12 000 rpm 1) Mix 2 min 12 000 rpm 1) 4 Superpl. if any Superpl. if any 5 GroutAid Mix 3 min 12 000 rpm 1) 6 Mix 3 min 12 000 rpm 1) Do not test yet 7 Start bleeding and
shear str. tests Move the mix to agitator
8 Move the mix to agitator Slow agitation for 1h 9 Slow agitation for 1h GroutAid. Mix 0.5 min 10 Test rheology and penetration-
ability at 1h Test rheology and penetration-ability at 1 h. Start bleeding and shear strength tests at 1 h.
11 Cast for pH and comp. str. Cast for pH and comp. str. 12 Test bleeding at 2 h and shear
strength at 6 h Test bleeding at 3 h and shear strength at 6 h
13 Test compressive strength at 28/91 d
Test compressive strength at 28/91 d
14 Selected specimen sent to pH test to be tested at 2 months
Selected specimen sent to pH test to be tested at 2 months
1) Dispersing equipment. Diameter of the rotator-stabilator aggregate 30 mm. Batch volume 3 litre.
7.8.2 Results and conclusions
The tests showed that the setting (shear strength at the age of 6 h) was too slow. The attempts to accelerate setting by increasing the OPC/SL ratio (0.05 - 0.2) while keeping the W/SL ratio constant showed that increasing OPC content did not accelerate setting but made the mixes stiffer (Figure 15a and 15b, mixes 7 and 26).
Closer look into mixes with OPC/SL ratio of 0.2, which was the highest ratio used in this work is given in Figures 16a and 16b. The mixes with the lowest ratio 0.05 is treated similarly in Figures 17a and 17b.
46

OPC/SL = 0.05 - 0.2; SF = 0%. Mixing order 1
0
10
20
30
40
50
0.05 0.1 0.15 0.2OPC/SL
Visc, Bingham, mPasYield, Bingham, PaVisc, Casson, mPasYield, Casson, PaShear str. 6h, kPa
W/DM 0.8226
W/DM 0.925
W/DM = 0.907
W/DM 0.82 27
OPC/SL = 0.05 - 0.2; SF = 0%. Mixing order 1
0
50
100
150
200
250
300
350
0.05 0.1 0.15 0.2OPC/SL
Filte
r pum
p, 1
00 µ
m, m
l
(a) (b)
Figure 15a and 15b. Effect of OPC/SL ratio on injection properties. W/DM and mix number are given in the text boxes.
Superplasticizer reduced viscosity as expected. The most striking effect was that of the mixing order: The delayed GroutAid addition (mixing order 2) gave clearly more fluid grout. This was most pronounced in the more Si-rich mixes (mix 46 vs. mix 34 in Figure 16a and mix 44 vs. mix 36 in Figure 17a). A similar effect was seen with the OPC – SF system (Figure 6a). In both systems the effect of mixing order was at least as great as that of 1% superplasticizer dosage. However, mixing order was excluded from the experiments for it was considered to be laborious in field conditions. The implementation of special grouting equipment that allows the addition of GroutAid at the nozzle would facilitate a more favourable mixing order.
47
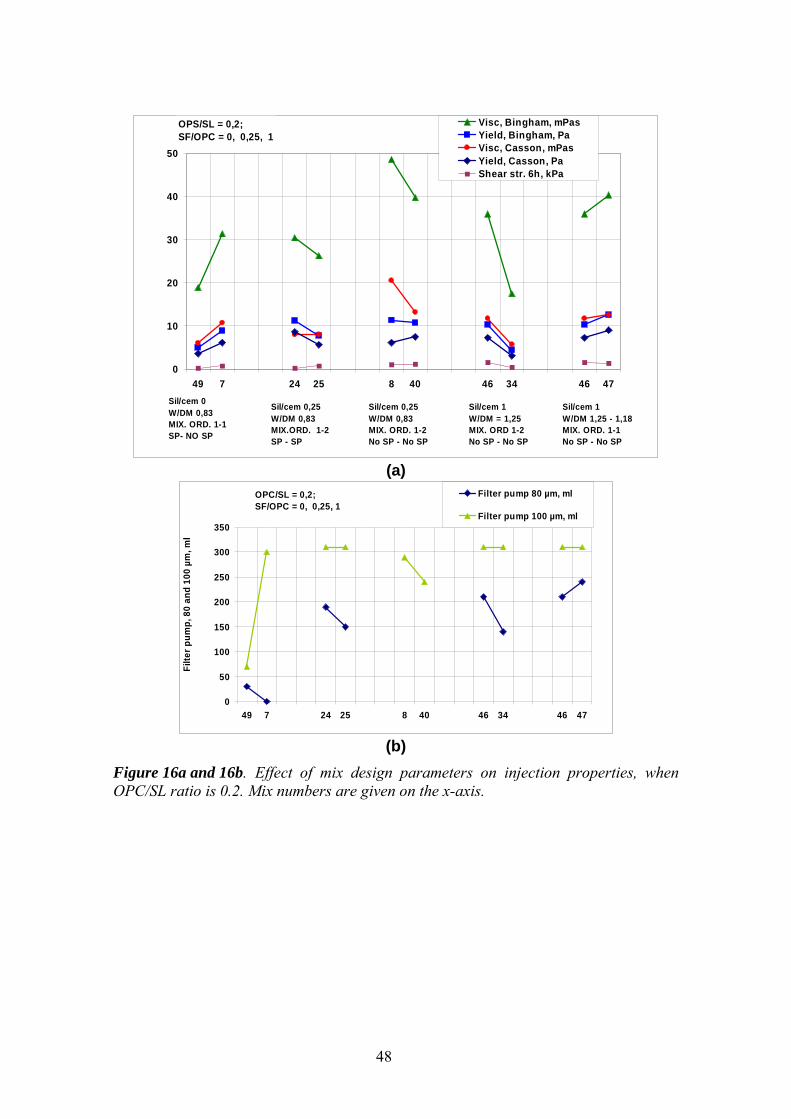
OPS/SL = 0,2; SF/OPC = 0, 0,25, 1
0
10
20
30
40
50
49 7 24 25 8 40 46 34 46 47
Visc, Bingham, mPasYield, Bingham, PaVisc, Casson, mPasYield, Casson, PaShear str. 6h, kPa
Sil/cem 1W/DM 1,25 - 1,18MIX. ORD. 1-1No SP - No SP
Sil/cem 1W/DM = 1,25MIX. ORD 1-2No SP - No SP
Sil/cem 0,25W/DM 0,83MIX. ORD. 1-2No SP - No SP
Sil/cem 0,25W/DM 0,83MIX.ORD. 1-2SP - SP
Sil/cem 0W/DM 0,83MIX. ORD. 1-1SP- NO SP
(a)
OPC/SL = 0,2; SF/OPC = 0, 0,25, 1
0
50
100
150
200
250
300
350
49 7 24 25 8 40 46 34 46 47
Filte
r pum
p, 8
0 an
d 10
0 µm
, ml
Filter pump 80 µm, ml
Filter pump 100 µm, ml
(b)
Figure 16a and 16b. Effect of mix design parameters on injection properties, when OPC/SL ratio is 0.2. Mix numbers are given on the x-axis.
48

OPC//SL = 0.05 SF/OPC = 0, 1 ,4
0
10
20
30
40
50
48 27 29 31 28 30 44 36 44 45
Visc, Bingham, mPasYield, Bingham, PaVisc, Casson, mPasYield, Casson, PaYield str. 6h, kPa
Sil/cem =1W/DM 0,91MIX.ORD 1-2SP - SP
Sil/cem= 1W/DM 0,91MIX.ORD: 1-2No SP - No SP
Sil/cem = 4W/DM 1,36-1,28MIX.ORD. 1-1No SP - No SP
Sil/cem = 0W/DM 0,91MIX.ORD. 1-1SP - No SP
Sil/cem = 4W/DM 1,36MIX.ORD. 1-2No SP - No SP
(a)
OPC/SL = 0,05; SF/OPC = 0, 1, 4
0
50
100
150
200
250
300
350
48 27 29 31 28 30 44 36 44 45
Filte
r pum
p, 8
0 an
d 10
0 µm
, ml
Filter pump 80 um, ml
Filter pump 100 um, ml
(b)
Figure 17a and 17b. Effect of mix design parameters on injection properties, when OPC/SL ratio is 0.05. Mix numbers are given on the x-axis.
The results of the most promising mixes selected to the penetration-ability measurements are given in Table 19. The mixes were relatively fluid, but the penetration-ability was poor as well as the setting. The later was within the requirements (≥ 0.5 kPa), but still too slow for practical grouting. Mix 44 was further selected to the pH test. The pH was found too high. Further pH examination is given in Chapter 9.1.
49

Table 19. Properties of slag mixes 8, 47, 27, 28 and 44. The mixing order was no 1 (Table 18). No SP was used.
Mix OPC/SL
SF/ OPC
W/ DM
Bleed-ing, %
Filter pump
100 µm
Filter pump 80 µm
Shear str, 6h,
kPa
B minµm
B crit, µm
Viscosity Bingham,
mPas
Yield value
Bingham, Pa
8 0.20 0.25 0.83 0 290 - 0.8 62 224 48.6 11.3 47 0.20 1.00 1.18 0 310 240 1.3 60 132 40.3 12.6 27 0.05 0.00 0.90 4 310 210 1.3 63 147 14.8 4.26 28 0.05 1.00 0.91 0.5 290 200 0.6 63 159 32.6 9.18 44 0.05 4.00 1.36 0 310 250 1.3 61 136 32 7.89
7.9 Slag and Super Sulphate Cement systems (SSC): Activation of slag
7.9.1 Experiments
Once the requirement for the compressive strength was set (Step 10 in Chapter 4) the work was focused on the activation of slag, because the strength gain and the low pH of the end product are conflicting requirements. The former experiments on slag showed that besides for compressive strength the mixes needed to be improved also for penetration-ability, setting and pH. These needs are somewhat conflicting: Lowering pH called for more silica, which in turn was to inactivate slag even more. SF would also increase water demand and thus retard setting. In the first experiments slag was activated with OPC (Chapter 7.8). In the up-coming experiments also super sulphate cement system (SSC) was used. SSC denotes a binder system which is based on slag and activated with gypsum (G) and OPC. The aim of the slag experiments was to find answers to the following questions:
• What would be the safe SF dosage from the pH point of view? • Can slag be activated with OPC only while using dosages that would produce
the low pH required? • How can ETTA be applied to the slag system in order to accelerate setting? • Is the SSC needed to increase the strength development? • What is the gypsum content needed in the super sulphate system? • Is NaOH activation needed to start the reactions? • What is the effect of W/DM on the properties?
The SF content was increased to the SF/SL ratio of 0.5 to ensure the total SiO2 content of 50.5 – 54.5 w % throughout the series (Figure 1). Given as SF/DM ratio, the value was about 0.3 throughout the series. The ratios were the lowest when gypsum was used in the super sulphate system. OPC/SL ratios used were 0.05 and 0.1.
Two slag batches were used namely SL15, which was coarser, in the mixes S0 – S15 and SL10/3 in the mixes S16 – S47 (Chapter 5). Both were ground by CT-Group in a full scale jet mill. The OPC used with SL15 was RC10/1 as previously, but with SL/3 it was RC10/2 , which was same material but a batch ground later. SF was used in the form of GroutAid. The compositions of the mixes S16 – S47 are listed in Table 20. The mixing was performed according to the mixing order 21 in Table 21.
50

The results are discussed in the up-coming figures below. The mix compositions and test results are given in detail in Appendix 5 in Tables 1, 2 and 3 as follows:
Experiments with slag SL15
• Effect of ETTA (HAC/G = 3), OPC/SL = 0.05, SF/DM = 0.3, W/DM = 1.6. Mixes S2, S3, S4. In the rows 1431-1433.
• Effect of HAC vs. OPC, SF/DM = 0.3, W/DM = 1.6. Mixes S4, S4, S6. In the rows 1435 – 1437.
• Effect of G/DM, OPC/SL = 0.05, SF/DM = 0.3, HAC/DM = 0.035. W/DM = 1.6. Mixes S3, S7, S8. . In the rows 1439-1441.
• Effect of G/DM, OPC/SL = 0.05, SF/DM = 0.3, HAC/DM = 0.00, W/DM = 1.6. Mixes S0, S1, S5, S9, S14. In the rows 1443 – 1447.
• Effect of G/DM and NaOH, OPC/SL = 0, SF/DM = 0.3, HAC/DM = 0.00, W/DM = 1.6. Mix S12 In the row 1449.
• Effect of G/DM and NaOH, OPC/SL = 0, SF/DM = 0.3, HAC/DM = 0.00, W/DM = 1.6. Mixes S10, S13 . In the rows 1451 – 1452.
• Effect of G/DM and NaOH, OPC/SL = 0.05, SF/DM = 0.3, HAC/DM = 0.00, W/DM = 1.6. Mixes S11, S15. In the rows 1454 – 1455.
Experiments with slag SL10/3
• Effect of OPC/SL, G/SL=0, W/DM=1.6. Mixes S17, S20c. In the rows 1458 - 1459.
• Effect of OPC/SL, G/SL=0.16, W/DM=1.6. Mixes S26, S29. S26, S29. In the rows 1461 - 1462.
• Effect of OPC/SL, G/SL=0.23, W/DM=1.6. Mixes S32, S33. In the rows 1464 – 1465.
• Effect of G/SL, OPC/SL=0.05, W/DM=1.6. Mixes S17, S26, S32. In the rows 1467 – 1469.
• Effect of G/SL, OPC/SL=0.1, W/DM=1.6. Mixes S20c, S29, S35. In the rows 1471 – 1473.
• Effect of W/DM, OPC/SL = 0.05, G/SL=0. Mixes S16, S17, S18. In the rows 1475 – 1477.
• Effect of W/DM, OPC/SL = 0.05, G/SL=0.16. Mixes S44, S45, S25, S26, S27. In the rows 1479 – 1483.
• Effect of W/DM, OPC/SL = 0.1, G/SL=0. Mixes S43, S19, S20c, S21. In the rows 1485 – 1488.
• Effect of W/DM, OPC/SL = 0.1, G/SL=0.16. Mixes S46, S47, S29. In the rows 1490 – 1492.
• Effect of W/DM, OPC/SL= 0.05, G/DM = 0.1. Mixes S41, S42, S43. In the rows 1501 – 1503.
51

Table 20. Experiments with slag SL10/3. Compositions of mixes S16 – S47. The mixing order was no 21 (Table 21). No SP was used.
Mix OPC type
SF type
OPC /DM
SF /DM
SL /DM
Gypsum/DM
SF /SL
OPC/SL
Gypsum /SL
Superpl. /DM
Water/DM
S16 RC10 GroutAid 0.032 0.32 0.65 0.000 0.50 0.050 0.00 0.00 1.41 S17 RC10 GroutAid 0.032 0.32 0.65 0.000 0.50 0.050 0.00 0.00 1.57 S18 RC10 GroutAid 0.032 0.32 0.65 0.000 0.50 0.050 0.00 0.00 2.01 S19 RC10 GroutAid 0.063 0.31 0.63 0.000 0.50 0.100 0.00 0.00 1.40 S20c RC10 GroutAid 0.063 0.31 0.63 0.000 0.50 0.100 0.00 0.00 1.58 S21 RC10 GroutAid 0.063 0.31 0.63 0.000 0.50 0.100 0.00 0.00 2.00 S22 RC10 GroutAid 0.120 0.29 0.59 0.000 0.50 0.204 0.00 0.00 1.40 S23 RC10 GroutAid 0.120 0.29 0.59 0.000 0.50 0.204 0.00 0.00 1.57 S24 RC10 GroutAid 0.120 0.29 0.59 0.000 0.50 0.204 0.00 0.00 2.01 S25 RC10 GroutAid 0.029 0.29 0.59 0.093 0.50 0.050 0.16 0.00 1.39 S26 RC10 GroutAid 0.029 0.29 0.59 0.093 0.50 0.050 0.16 0.00 1.57 S27 RC10 GroutAid 0.029 0.29 0.59 0.093 0.50 0.050 0.16 0.00 2.00 S28 RC10 GroutAid 0.057 0.28 0.57 0.091 0.50 0.100 0.16 0.00 1.40 S29 RC10 GroutAid 0.057 0.28 0.57 0.091 0.50 0.100 0.16 0.00 1.57 S30 RC10 GroutAid 0.057 0.28 0.57 0.091 0.50 0.100 0.16 0.00 2.00 S31 RC10 GroutAid 0.028 0.28 0.56 0.130 0.50 0.050 0.23 0.00 1.40 S32 RC10 GroutAid 0.028 0.28 0.56 0.130 0.50 0.050 0.23 0.00 1.57 S33 RC10 GroutAid 0.028 0.28 0.56 0.130 0.50 0.050 0.23 0.00 2.00 S34 RC10 GroutAid 0.055 0.27 0.55 0.126 0.50 0.100 0.23 0.00 1.40 S35 RC10 GroutAid 0.055 0.27 0.55 0.126 0.50 0.100 0.23 0.00 1.57 S36 RC10 GroutAid 0.055 0.27 0.55 0.126 0.50 0.100 0.23 0.00 2.00 S37 RC10 GroutAid 0.027 0.27 0.54 0.166 0.50 0.050 0.31 0.00 1.40 S38 RC10 GroutAid 0.027 0.27 0.54 0.166 0.50 0.050 0.31 0.00 1.57 S39 RC10 GroutAid 0.027 0.27 0.54 0.166 0.50 0.050 0.31 0.00 2.00 S40 RC10 GroutAid 0.052 0.26 0.52 0.161 0.50 0.100 0.31 0.00 1.40 S41 RC10 GroutAid 0.052 0.26 0.52 0.161 0.50 0.100 0.31 0.00 1.57 S42 RC10 GroutAid 0.052 0.26 0.52 0.161 0.50 0.100 0.31 0.00 2.01 S43 RC10 GroutAid 0.063 0.31 0.63 0.000 0.50 0.100 0.00 0.00 1.15 S44 RC10 GroutAid 0.029 0.29 0.59 0.093 0.50 0.050 0.16 0.00 1.15 S45 RC10 GroutAid 0.029 0.29 0.59 0.093 0.50 0.050 0.16 0.00 1.39 S46 RC10 GroutAid 0.057 0.28 0.57 0.091 0.50 0.100 0.16 0.00 1.15 S47 RC10 GroutAid 0.057 0.28 0.57 0.091 0.50 0.100 0.16 0.00 1.40
52

Table 21. Mixing order and testing procedure 21 for slag mixes. Mixing order and testing procedure 21
with slag system 1 Water + slag + OPC+ Gypsum slurry (if
any) 2 Start timing for all tests 3 Mix 2 min 12 000 rpm 1) 4 Superpl. if any 5 GroutAid 6 Mix 3 min 12 000 rpm 1) 7 Start bleeding and
shear strength tests 8 Move the mix to agitator 9 Slow agitation for 1h 10 Test rheology and penetration-ability at
1h 11 Cast for pH and comp. str. 12 Test bleeding at 2 h and shear strength at
6 h 13 Test compressive strength at 28/91 d 14 Selected specimen sent to pH test to be
tested at 2 months 1) Dispersing equipment. Diameter of the rotator-stabilator aggregate 30 mm. Batch volume 3 litre.
7.9.2 Results and conclusions on Slag system and ETTA - slag batch SL15
The results of the ETTA experiments with the slag batch SL15 are shown in Figures 18a, 18b and 18c.
• Increasing the content of ETTA components while keeping their ratio constant (HAC/G = 3) accelerates setting (shear strength at 6 h) quite clearly. Unfortunately there is no strength development what so ever by the age of 28 d. The mixes were still too soft for even to open the moulds at the age of 28 d (Figure 18a).
• Testing the effect of excluding OPC in the presence of HAC proved that OPC is needed for the setting. Again no compressive strength gain was observed at the age of 28 d (Figure 18b).
• Experiments on increasing gypsum content, led again to similar result: No compressive strength (Figure 18c).
• The overall conclusion was that any presence of HAC depresses slag strength development.
53

Effect of ETTA (HAC/G = 3), OPC/SL = 0.05, SF/DM = 0.3, W/DM = 1.6
Mix: S2, S3, S4
0
2
4
6
8
10
12
0 0.02 0.04 0.06 0.08
HAC/DM
Shea
r.st
r. a
nd c
ompr
.str
.Shear str. 6 h,kPaCompr.str. 28 d,MPa
Figure 18a. Effect of ETTA components (HAC and gypsum) on setting and compressive strength of the Slag system. Slag batch was SL15.
Effect of HAC vs. OPC, SF/DM = 0.3, W/DM = 1.6
Mix: S4, S5, S6
0
2
4
6
8
10
12
0 0.02 0.04 0.06 0.08HAC/DM
Shea
r st
r. a
nd c
ompr
.str
.
Shear str. 6 h,kPaCompr.str. 28 d,MPa
OPC
No OPC
Figure 18b. Effect of OPC compared to no OPC on setting and compressive strength of Slag system. Slag batch was SL15.
54

Effect of G/DM, OPC/SL = 0.05, SF/DM = 0.3, HAC/DM = 0.035. W/DM = 1.6
Mix: S3, S7, S8
0
2
4
6
8
10
12
0 0.02 0.04 0.06 0.08
Gypsum/slag
Shea
r st
r. a
nd c
ompr
.str
. Shear str. 6 h,kPaCompr.str. 28 d,MPa
Figure 18c. Effect of increasing gypsum content in ETTA system on setting and compressive strength of Slag system. Slag batch was SL15.
7.9.3 Results and conclusions on activation without ETTA - slag batch SL15
The mixes without ETTA (e.g. without the presence of HAC) all showed strength development. The tests were made with the same slag batch SL15 as the previous tests in Figures 18a – 18b. The results in Figures 19a – 19d are as follows:
• The effect of gypsum to strength development was positive. Yet, there was an unexplained minimum at the 3 % gypsum dosage. (Figure 19a).
• The same results of Figure 19a are reproduced in Figure 19b along with results on accelerating slag activation with NaOH. The dosages used showed no acceleration, which ended the interest to the originally questionable alkali activation from the desired low-pH point of view.
• The setting of all mixes was relatively slow. Gypsum seemed to depress it even more.
The Bcrit values were generally slightly over the requirement (too high) while the Bmin values were within the requirements. Mix S14 was selected to closer examination (circled in Figures 19a – 19d) as the new finer slag batch SL10/3 arrived. The identical mix with the finer slag batch SL10/3 was named S26 and is also circled in the upcoming figures in Chapter 7.9.4. Mix S14 was sent to pH tests, which yielded low enough values e.g. it passed the pH test.
55

Effect of G/DM, OPC/SL = 0.05, SF/DM = 0.3, HAC/DM = 0, W/DM = 1.6
Mix: S0, S1, S5, S9, S14
0
2
4
6
8
10
12
0 0.05 0.1 0.15 0.2Gypsum/slag
Com
pr.s
tr.,
MPa
Mix 12 without OPC
Figure 19a. Effect of gypsum activation on compressive strength determined at the age of 28 d. Slag batch was SL15. The circled mix S14 was re-examined (Chapter 7.9.4).
Effect of G/DM and NaOH, OPC/SL = 0.05, SF/DM = 0.3, HAC/DM = 0, W/DM = 1.6
Mix: S0, S1, S5, S9, S11 , S12, S14, S15,
0
2
4
6
8
10
12
0 0.05 0.1 0.15 0.2
Gypsum/slag
Com
pr.s
tr.,
MPa
OPC/SL = 0, NaOH/SL = 0OPC/SL = 0.05, NaOH/SL = 0OPC/SL = 0.05, NaOH/SL = 0.01 - 0.02
Figure 19b. Effect of gypsum and alkali activation on compressive strength determined at the age of 28 d. Slag batch was SL15. Gypsum activation results are the same as in Figure 19a. Notation as in Figure 19a.
56

Effect of G/DM and NaOH, OPC/SL = 0.05, SF/DM = 0.3, HAC/DM = 0, W/DM = 1.6
Mix: S0, S1, S5, S9, S11 , S12, S14, S15,
0
2
4
6
8
10
12
0 0.05 0.1 0.15 0.2
Gypsum/slag
Shea
r.st
r. 6
h, k
Pa
OPC/SL = 0, NaOH/SL = 0OPC/SL = 0.05, NaOH/SL = 0OPC/SL = 0.05, NaOH/SL = 0.01 - 0.02
Figure 19c. Effect of gypsum and alkali activation on shear strength determined at the age of 6 h. Slag batch was SL1. Notation as in Figure 19a.
Effect of G/DM and NaOH, OPC/SL = 0.05, SF/DM = 0.3, HAC/DM = 0, W/DM = 1.6
Mix: S0, S1, S5, S9, S11 , S12, S14, S15,
0
50
100
150
200
250
0 0.05 0.1 0.15 0.2
Gypsum/slag
B c
rit,
um
OPC/SL = 0, NaOH/SL = 0OPC/SL = 0.05, NaOH/SL = 0OPC/SL = 0.05, NaOH/SL = 0.01 - 0.02
Figure 19d. Effect of gypsum and alkali activation on penetration-ability (Bcrit values determined at the age of 1 h by the penetrabilitymeter). Slag batch was SL15. Notation as in Figure 19a.
7.9.4 Results and conclusions on W/DM effect on slag and super sulphate cement systems - slag batch SL10/3
The super sulphate system (SSC) was found to be an effective way of activating slag with the relatively low OPC/SL ratio of 0.05 (Figures 20a – 20d). Mix S26 (circled in Figures 20a – 20b) is identical to S14 (circled in Figures 19a, 19b, 19c and 19d), the only difference being the slag batch, which was finer for S26.
57

• The compressive strength was doubled compared to the mixes without gypsum (Figure 20a).
• On the contrary, setting was delayed by gypsum (Figure 20b). This was observed also in the previous results with the coarser slag batch SL15 (Figure 19c).
• Increasing the gypsum content over the G/SL ratio of 0.16 did not produce any benefits (Figures 20a – 20d).
Effect of W/DM and G/SL, OPC/SL=0.05Mix: S16, S17, S18, S44, S45, S25 S26, S27,
S32
02468
101214161820
1.1 1.3 1.5 1.7 1.9 2.1Water/dry materials
Com
pres
sive
str
. 28d
and
91
d, M
Pa
G/SL=0
G/SL=0.16
G/SL=0.23
91 d
28 d
Effect of W/DM and G/SL, OPC/SL=0.05Mix: S16, S17, S18, S44, S45, S25, S26, S27, S32
0
1
2
3
4
5
6
1.1 1.3 1.5 1.7 1.9 2.1Water/dry materials
Shea
r.str
. 6h,
kPa
G/SL=0
G/SL=0.16
G/SL=0.23
(a) (b)
Effect of W/DM and G/SL, OPC/SL=0.05Mix: S16, S17, S18, S44, S45, S25, S26, S27,
S32
0
20
40
60
80
100
120
140
160
1.1 1.3 1.5 1.7 1.9 2.1Water/dry materials
B c
rit a
nd B
min
, µm
G/SL=0G/SL=0.16G/SL=0.23
B min
B crit
Effect of W/DM and G/SL, OPC/SL=0.05Mix: S16, S17, S18, S44, S45, S25, S26, S27,
S32
0
20
40
60
80
100
120
140
1.1 1.3 1.5 1.7 1.9 2.1Water/dry materials
Visc
. (m
Pas)
and
Yie
ld
(Pa)
, Bin
gham
G/SL=0G/SL=0.16G/SL=0.23
Visc.
Yield
(c) (d)
Figure 20a, 20b, 20c and 20d. Effect W/DM on the compressive strength and injection properties of OPC activated slag and OPC-gypsum activated slag (super sulphate cement), when the OPC/SL ratio was 0.05. Slag batch was SL10/3. Mix S26 (circled) was nearly identical to the mix S14, the only difference being the ground slag batch fineness, which was finer for S26.
When using the higher OPC/SL ratio of 0.1 (Figures 21a – 21d), the behaviour of the mixes did not differ significantly from that of the mixes with the lower OPC/SL ratio of 0.05 (Figures 20a – 20d). Actually higher OPC-content did not provide any benefits to the mix properties. This was somewhat unexpected from the strength development point
58

of view, for the strength was expected to increase. Only a slight acceleration of setting (shear strength) was observed, but it was not significant. Yet, even the slight acceleration may turn out to be significant if the mix was to be used in a lower temperature.
Effect of W/DM and G/SL, OPC/SL=0.1Mix: S43, S19, S20c, S21, S46, S47, S29, S35,
02468
101214161820
1.1 1.3 1.5 1.7 1.9 2.1
Water/dry materials
Com
pres
sive
str
. 28
d an
d 91
d,
MPa
G/SL=0
G/SL=0.16
G/SL=0.23
91 d
28 d
Effect of W/DM and G/SL, OPC/SL=0.1Mix: S43, S19, S20, S21, S46, S47, S29, S35,
0
1
2
3
4
5
6
1.1 1.3 1.5 1.7 1.9 2.1
Water/dry materials
Shea
r.str
. 6h,
kPa
G/SL=0
G/SL=0.16
G/SL=0.23
(a) (b)
Effect of W/DM and G/SL, OPC/SL=0.1Mix: S43, S19, S20c, S21, S46, S47, S29, S35,
0
20
40
60
80
100
120
140
160
1.1 1.3 1.5 1.7 1.9 2.1Water/dry materials
B c
rit a
nd B
min
, µm
G/SL=0G/SL=0.16G/SL=0.23
B min
B crit
Effect of W/DM and G/SL, OPC/SL=0.1Mix: S43, S19, S20c, S21, S46, S47, S29, S35,
0
20
40
60
80
100
120
140
1.1 1.3 1.5 1.7 1.9 2.1Water/dry materials
Visc
. (m
Pas)
and
Yie
ld (P
a),
Bin
gham
G/SL=0G/SL=0.16
G/SL=0.23
Yield
Visc.
(c) (d)
Figure 21a, 21b, 21 and, 21d. Effect W/DM on the compressive strength and injection properties of OPC activated slag and OPC-gypsum activated slag (super sulphate cement), when the OPC/SL ratio was 0.1. Slag batch was SL10/3.
Note: The penetration-ability of the mix S20 was very poor when measured for the first time (Bcrit = 278 µm, Bmin = 37 µm) probably due to an occasional material failure or an experimental error. The mix was remixed and renamed as S20u. Only penetration-ability was measured for the second time. The second measurement yielded the penetration-ability reported here (Bcrit = 99 µm, Bmin = 40 µm in Figure 21c). The mix symbol S20c denotes the combined results of the first (S20) and second (S20u) mixing.
A fluidity measurement with the Marsh cone (Figure 4) was introduced to the slag experiment S15 – S27. In most cases the grout did not pass through the cone but got stuck before one litre had run through. This is likely to be due to the high yield values of
59

all mixes in this work. In those cases the readings were not recorded. Only four readings were received and they are listed in Table 22. Three had the highest W/DM value of 2; only mix S47 had a lover value of 1.4. The Marsh cone values were not further examined.
Table 22. Properties of the mixes that passed the Marsh cone test.
Mix W/DM OPC/SL G/SL Mash cone time, s S21 2.0 0.1 0 100 S27 2.0 0.05 0.16 71 S35 2.0 0.05 0.31 205 S47 1.4 0.1 0.16 172
7.9.5 Oversized particles
The slag batch SL10/2 was also tested, but the penetration-ability results were fluctuating in a random manner due to a material failure: There were oversized particles, which were able to block the sieves of the penetrabilitymeter very efficiently. The fraction of large particles (> 63 µm) was 0.3%. The weight of ground slag per 1000 ml (the volume that passes the sieves in the penetrabilitymeter) is approximately 330 g. Therefore the weight of over sized particles per 1000 ml would be 0.1 g. Since the sieve diameter is only 30 mm, 0,1 g is far enough to block the sieve. Problems would probably occur in field conditions as well.
The observation above is significant, while planning the quality control of ground grouting products: The content of oversized particle should be kept at a low level by setting a requirement and verifying it regularly.
7.10 LAC system: Low Alkali Cement
7.10.1 Experiments
The Nuclear Waste Management Organisation of Japan (NUMO) delivered two specimens of low alkali cement (LAC) to test the possibility of applying the products for grouting purposes. The specimens were named “LAC coarse” and “LAC fine”. LAC fine was far finer than the other cements and slag used in the work. The fineness along with other material information is given Chapter 5. Use of citric acid was recommended by the deliverer in order to retard hydration if needed.
The results are discussed in the up-coming figures below. The mix compositions and test results are given in detail in Appendix 5 in Tables 1, 2 and 3 as follows:
• The effect of W/DM and citric acid content in the rows 1506 – 1513. • The effect of substituting LAC fine with LAC coarse (W/DM = 2) in the rows
1515 – 1517. • A mix with LAC coarse only (W/DM = 1) in the row 1519
60

7.10.2 Results and conclusions
The penetration-ability of LAC fine mixes was poor even when the W/DM was increased up to 2.5 and the citric acid content up to 1.8%. Since the LAC fine particles were very small, the reason must be a very strong gel blocking due to the material reactivity or flocculation. In this work the penetration-ability testing age has been 60 min throughout the experiments, but an exception was made here: Mix L5 (in the square in Figure 22) was tested also at about 5 min immediately after mixing. No better penetration-ability was observed when tested at an earlier age as compared to the later age. In fact the result was exactly the same as at the age of 60 min (Figure 23).
LAC fine mixes: L1, L2, L3, L4, L5
0
0.005
0.01
0.015
0.02
1 1.5 2 2.5 3W / LAC
Citr
ic a
cid
/ LA
C
LAC fine mixes: L1, L2, L3, L4, L5 Citric acid dosage 0.6 - 1.8%
0
50
100
150
200
250
300
1 1.5 2 2.5W / LAC
Filte
r pum
p, 1
00 µ
m, m
l
3
(a) (b)
0
1
2
3
4
5
6
1 1.5 2 2.5 3W / LAC
Shea
r str
, 6h,
kPa
LAC fine mixes: L1, L2, L3, L4, L5 Citric acid dosage 0.6 - 1.8%
(c)
Figure 22a, 22b and 22c. Effect W/DM and citric acid content on penetration-ability determined by filter pump.
61

W /LAC fine = 2.5, Citric acid 1.8%Mix: L5
0
200
400
600
800
1000
50 100 150 200 250 300 350 400Sieve, µm
Pass
ed, m
l
5 min, B min=103, B crit=274 µm
I hour, B min=103, B crit=275 µm
Figure 23. Penetration-ability of L5 (in square in Figure 22) when determined both immediately and 1 hour after mixing.
Modifying L3 (circled in Figure 22) by substituting LAC fine with LAC coarse did not yield improved behaviour (Figure 24). The setting (shear strength) was decreased to zero and the penetration-ability became poorer than that of L5 in Figure 23.
W/DM = 2, Citric acid dosage 1.8%Mixes: L3, L6, L7
0
1
2
3
4
5
6
0 10 20 30 40 50 60 70 80
LAC coarse /(LAC fine+LAC coarse)
Shea
r str
. 6h,
kPa
W/DM = 2, Citric acid dosage 1.8% Mixes: L6, L7
0
100
200
300
400
0 10 20 30 40 50 60 70 80
LAC coarse /(LAC fine+LAC coarse)
B m
in a
nd B
crit
, µm
B critB min
(a) (b)
Figure 24a and 24b. Effect of mixing LAC coarse with LAC on setting and penetration-ability.
The mix L8 was made of LAC coarse only without citric acid. It was selected to the pH tests as it was the only “pure” LAC mix. The penetration-ability was very poor which was expected due to the results shown in Figure 24a. The aim of the pH tests was to get information of the pH behaviour of LAC, as its chemical composition differed significantly from the other systems of this work i.e. the sulphate content was much higher and silica content lower (Chapter 5). The properties of L8 are listed in Table 23. The pH was lower than the requirement of 11, e.g. it passed the pH test (Chapter 9.1).
62

Table 23. Properties of mix L8. No SP was used.
Mix LAC type
Citric acid,
%
W/ DM
Bleed-ing,
%
Shear str, 6h,
kPa
Bminµm
Bcrit µm
Viscosity Bingham,
mPas
Yield value
Bingha Pa
Compr str
28 d MPa
L8 LAC coarse 0 1.0 0 1.6 245 361 6.8 27 16.5
7.11 Reference grout
A superplasticized reference mix (composed of UF16 and SF) of known good performance in practical field conditions was examined in order to find a comparison between the pH and the leachate chemical composition of mixes developed in this work and the reference mix (Vuorinen et al. 2004) as well as a comparison between injection properties determined in the laboratory conditions and the behaviour in field conditions. The injection properties of reference mix 52 are listed in Table 24.
The injection properties were tested at the age of 1 hour as all mixes in this work. By that time the grout had probably already lost some of its fluidity and penetration-ability. The Marsh values on site have been measured from 0 up to 30 min after mixing and the values are generally lower than values of the present reference mix. However, all results indicated that the present reference mix was clearly more fluid that the low-pH mixes made in this work. The reasons are obvious: A lot of SF and no superplasticizer were used in the low-pH mixes. The interesting result is that even though the reference mix is still 1 hour after mixing more fluid, it has a lower penetration-ability than the low-pH mixes made in this work. Table 24. Composition and properties of reference mix 52.
Ref. mix
SF/ OPC (UF16)
W/ OPC (UF16)
W/DM
SPL, %
(DM)
Bleed-ing,
%
Shearstr, 6h,
kPa
Bminµm
Bcrit,µm
Visc. Bing. mPas
Filterpump
ml
Yield value
Bing. Pa
Marsh cone,
s
Compr str
28 d 91 d MPa
52 0.075 1.30 1.21 1 0 2.6 63 201 22.9 140 5.0 53 9.3 11.1
63

64

8 MIXES FOR PILOT TESTS
One Slag and one OPC-SF mix were selected to the pilot tests. The OPC-SF mix was the mix type f63, which was an ETTA mix. It was selected due its better technical performance compared to other SF-OPC mixes. The pH was also known to be sufficiently low to pass the requirement of pH 11. Comprehensive test results of its injection properties in the laboratory measurements are given in Figure 13 where they are plotted against W/DM. The OPC-SF mixes made with white cement (WCE) were another possibility, but the use of WCE did not produce improved properties. By the time of the decision the leaching behaviour had not been tested yet.
The Slag mix first selected to the first pilot tests was mix type S20c (circled in Figures 25a – 25d), which was activated with OPC only. It was selected due to its low pH while the strength development was 50% lower than that of a similar mix S29 activated with both gypsum and OPC. However the activation with gypsum was excluded due to possible detrimental long-term safety effects caused by sulphate reducing bacteria in the deep repository (Vuorinen et al. 2004).
Because S20c (W/DM = 1.6) turned out to be too viscous in the field conditions, a leaner mix with a higher W/DM mix was also tested. That was S21 (squared in Figures 25a – 25d). The effect of W/DM on compressive strength and all injection properties tested is presented in Figures 25a – 25d (extracted from Figures 21a, 21b, 21c, 21d). While examining the pilot test results Sievänen and Kronlöf found that the W/DM ratios used on site were actually higher than the intended values of 1.6 and 2.0 and properties naturally different as well (Sievänen et al 2004).
65

66
Effect of W/DM. OPC/SL=0.1Mix: S43, S19, S20c, S21
0
2
4
6
8
10
1 1.5 2 2.5
Water/dry materials
Com
pres
sive
str
. MPa
G/SL=0, 28 d
G/SL=0, 91 d
Effect of W/DM. OPC/SL=0.1Mix: S43, S19, S20, S21
0
1
2
3
4
5
6
1 1.5 2Water/dry materials
Shea
r.str
. 6h,
kPa
2.5
G/SL=0
(a) (b)
Effect of W/DM. OPC/SL=0.1Mix: S43, S19, S20c, S21
0
20
40
60
80
100
120
140
160
1 1.5 2 2.5Water/dry materials
B c
rit a
nd B
min
, µm
G/SL=0
Effect of W/DM. OPC/SL=0.1Mix: S43, S19, S20c, S21
0
20
40
60
80
100
120
140
1 1.5 2
Water/dry materials
Visc
. (m
Pas)
and
Yie
ld
(Pa)
, Bin
gham
2.5
G/SL=0
Yield
Visc.
(c) (d)
B crit
B min
Figure 25a, 25b, 25c and 25d. Effect of W/DM on the compressive strength and injection properties of OPC activated slag when the OPC/SL ratio was 0.1.

9 EXAMINATION OF RESULTS
9.1 pH
9.1.1 Compositions of mixes tested for pH
The pH values determined by Vuorinen (Vuorinen et al. 2004) were examined by searching correlation between some features of the chemical composition of the mixes and the results of the pH tests. The pH specimens were cast into plastic tubes and sealed to avoid CO2 contamination. They were cured in different temperatures either
• in 20 ºC for two months or • two weeks in 20 ºC followed by curing in 50 ºC up to the age of two months.
Tables 25a, 25b, 26a and 26b summarize the mix compositions as well as the pH results and Tables 27 and 28 the chemical compositions of the all mixes tested for pH. The pH values are the ones measured until the date 31.08.2004 in the equilibrium test in either fresh or saline leachates (Vuorinen et al. 2004). The testing period is not the same for each test, since they were started at different dates, but generally the declining pH development had levelled relatively well by the date for almost all of the mixes presented in Tables 25a and 26a. The pH values along with the injection properties are given in the up-coming Tables 29a and 29b in the Summary (Chapter 11).
Table 25a . The mix composition of the OPC-SF mixes tested for pH along with the reference mix 52.
Mix Binder combination
OPC -type
SF type
OPC/DM
SF /DM
Gypsum/OPC
HAC /OPC
SF /OPC
Superpl. /DM
Water/DM
12 UF16-SF UF16 Grout Aid' 0.77 0.23 0.000 0.000 0.30 0.00 1.26
f63 UF16-SF with ETTA UF16 Grout
Aid' 0.56 0.38 0.027 0.075 0.69 0.00 2.48
f64 UF16-SF with ETTA UF16 Grout
Aid' 0.49 0.46 0.027 0.075 0.94 0.00 2.91
w1 WCE-SF with ETTA WCE Grout
Aid' 0.56 0.38 0.027 0.075 0.69 0.00 2.48
w2 WCE-SF with ETTA WCE Grout
Aid' 0.49 0.46 0.027 0.075 0.94 0.00 2.91
Ref 52 UF16-SF with SP UF16 Grout
Aid 0.925 0.070 0 0 0.075 0.01 1.21
67

Table 25b . pH values in leachates of the OPC-SF mixes tested for pH along with the reference mix 52.
Mix Binder combination pH 1)
In fresh leachate 20 / 50 2)
In saline leachate 20 / 50 2)
12 UF16-SF 12.3 / 12.3 12.0 / 12.0 f63 UF16-SF with ETTA 11.1 / 10.7 10.0 / 10.1 f64 UF16-SFwith ETTA 10.5 / 10.0 9.7 /9.4 w1 WCE-SFwith ETTA 11.2 / 11.3 10.1 / 10.5 w2 WCE-SFwith ETTA 10.7 / 10.7 9.8 / 9.7
Ref 52 UF16-SF with SP 12.5 / - 12.2 / - 1) pH research (Vuorinen et al. 2004) 2) 20: samples cured in plastic pipes at the temperature of 20 o C for two months prior to pH testing; 50: samples cured in plastic pipes at the temperature of 20 o C for two weeks continuing at 50 o C till the age of two months prior to pH testing Table 26a. The mix composition of the Slag and LAC mixes tested for pH along with the reference mix 52.
Mix Binder
OPC type
SF type
OPC /DM
SF /DM
SL /DM
G /DM
SF /SL
OPC/SL
Gypsum /SL
Superpl/DM
Water/DM
44 Slag-RC10-SF UF16 Grout
Aid' 0.04 0.16 0.80 0.00 0.20 0.05 0 0.00 1.36
S14 Slag-RC10-Gypsum-SF RC10 Grout
Aid 0.029 0.29 0.59 0.093 0.50 0.05 0.16 0 1.6
S20c Slag-RC10-SF RC10 Grout
Aid 0.031 0.31 0.63 0.000 0.50 0.1 0 0 1.6
L8 LAC coarse 0.000 0 1.0
Ref 52 UF16-SF-SPL UF16 Grout
Aid 0.925 0.070 0 0.000 0.01 1.21
Table 26b . pH values in leachates of the OPC-SF mixes tested for pH along with the reference mix 52.
Mix Binder combination pH 1
In fresh leachate 20 / 50 2)
In saline leachate 20 / 50 2)
44 Slag-RC10-SF 11.4 / 11.3 10.6 / 10.6 S14 Slag-RC10-Gypsum-SF 10.5 / - 9.9 / - S20c Slag-RC10-SF 11.1 / - 10.2 / - L8 LAC 11.0 / - 10.5 / -
Ref 52 UF16-SF-SPL 12.5 / - 12.2 / - 1) pH research (Vuorinen et al. 2004). 2) 2: samples cured in plastic pipes at the temperature of 20 o C for two months prior to pH testing; 50: samples cured in plastic pipes at the temperature of 20 o C for two weeks continuing at 50 o C till the age of two months prior to pH testing.
68

Table 27. The chemical composition of the mixes in Tables 23 and 24 given as weight units per weight of the dry materials, added water excluded from the calculations.
Mix CaO SiO2 Na2O eq. OPC+ SL + SF 3)
Na2O eq. OPC+SL
Na2O eq. OPC
Al2O3 Mg0 Fe2O3 SO3 S sulphides
Other Tot
w% 1) w% w% w% w% w% w% w% w% w% w% w% 12 49.7 39.5 0.84 0.38 0.38 2.69 0.69 3.23 1.85 0.00 1.55 100 f63 37.8 49.3 1.06 0.30 0.30 4.87 0.50 2.36 2.03 0.00 2.08 100 f64 33.2 54.9 1.18 0.26 0.26 4.28 0.44 2.07 1.78 0.00 2.19 100 w1 39.6 50.0 0.83 0.06 0.06 4.43 0.15 0.12 2.12 0.00 2.75 100 w2 34.8 55.5 0.97 0.05 0.05 3.88 0.13 0.11 1.86 0.00 2.78 100
w1 1) 39.6 51.3 0.15 0.06 0.06 4.54 0.18 0.14 2.20 0.00 1.87 100 w2 1) 34.8 57.1 0.16 0.05 0.05 4.02 0.17 0.13 1.95 0.00 1.73 100
44 33.8 44.8 1.57 1.25 0.06 7.80 7.74 1.08 0.12 1.04 2.04 100 S14 2) 27.7 49.5 1.50 0.91 0.04 5.71 5.66 0.79 4.41 0.76 3.99 100 S26 2) 27.7 49.5 1.50 0.91 0.04 5.71 5.66 0.79 4.41 0.76 3.99 100
S20 28.4 53.5 1.64 1.02 0.09 6.26 6.16 0.93 0.19 0.81 2.13 100 L8 38.1 18.2 0.22 0.22 0.00 16.92 2.25 0.82 22.63 0.00 3) 0.91 100 Ref 52. 63.1 29.0 0.20 0.07 0.07 2.51 0.24 0.19 2.38 0.00 2.36 100
1) Values for mixes w1 and w2 if silica type 983 was used instead of GroutAid. The experiments have not been made. 2) Mix S26 was nearly identical to the mix S14, the only difference being the ground slag batch fineness, which was finer for S26. 3) Mix L8, made of LAC, may contain minor traces of sulphides (Vuorinen et al. 2004).
69

Table 28. The chemical composition of the mixes as weight units per volume unit of grout.
Mix Binder CaO SiO2 Na2O eq. OPC+SL + SF 3)
Na2O eq. OPC+SL
Na2O eq.
OPC
Al2O3 Mg0 Fe2O3 SO3 S Other Tot
g/litre g/litre g/litre g/litre g/litre g/litre g/litre g/litre g/litre g/litre g/litre g/litre12 UF16-SF 310 246 5.23 2.35 2.35 16.8 4.3 20.1 11.5 0 10 623
f63 UF16-SF with ETTA 133 173 3.73 1.04 1.04 17.1 1.8 8.3 7.1 0 7 350
f64 1) UF16-SF with ETTA 101 167 3.58 0.79 0.79 13.0 1.3 6.3 5.4 0 7 303
w1 WCE-SF with ETTA 139 175 2.90 0.21 0.21 15.5 0.5 0.4 7.4 0 10 350
w2 WCE-SF with ETTA 105 168 2.95 0.16 0.16 11.8 0.4 0.3 5.6 0 8 303
w1 1) WCE-SF with ETTA 139 179 0.35 0.21 0.21 15.78 0.51 0.42 7.43 0 7 350
w2 1) WCE-SF with ETTA 105 173 0.30 0.16 0.16 12.07 0.39 0.32 5.65 0 303
44 Slag-RC10-SF 197 262 9.16 7.29 0.32 45.6 45.2 0.7 0.7 6.1 12 584
S14 Slag-RC10-Gypsum-SF 145 259 7.85 4.79 0.21 29.9 29.7 4.16 23.1 4.0 21 524
S26 2) Slag-RC10-Gypsum-SF 145 259 7.85 4.79 0.21 29.9 29.7 4.16 23.1 4.0 21 524
S20c Slag-RC10-SF 146 275 8.45 5.24 0.44 32.2 31.6 4.80 0.96 4.2 11 514 L8 LAC 286 136.2 1.61 1.61 0 126.9 16.9 6.15 169.7 0 3) 7 750
Ref 52. UF16-SF-SPL 412 190 1.34 0.42 0.42 16.4 1.4 1.22 15.5 0 15.4 652 1) Values for mixes w1 and w2 if silica type 983 was used instead of GroutAid. The experiments have not been made. 2) Mix S26 was nearly identical to the mix S14, the only difference being the ground slag batch fineness, which was finer for S26. 3) Mix L8, made of LAC, may contain minor traces of sulphides (Vuorinen et al. 2004).
9.1.2 Effect of alkalis on pH
The alkali content of the raw materials versus pH in the leaching solution is shown in Figure 26. The alkali content is given as weight % of the Na2O equivalent (which is composed of Na2O and K2O) per dry materials of the mix. The chemical composition of the raw materials is based on the material information given by the producers in Chapter 5. The Na2O equivalent was calculated from the Na2O and K2O in three different ways:
• Alkalis originating from OPC only • Alkalis originating from OPC and slag only • Alkalis originating from OPC, slag and SF (or LAC in the LAC mixes).
In the Figures 26a, 26b and 26c it can be observed that the alkali equivalent content of the raw materials could not directly be correlated to the measured the pH of the leaching solutions.
The most striking evidence was provided by the comparison of mixes f63 and f64 to w1 and w2. The later (w1 and w2) were made of low alkali OPC instead the higher alkali OPC, UF16, used in f63 and f64. However the pH of w1 and w2 in the leaching solutions was higher than that of f63 and f64. Another interesting feature was the
70

relatively low pH of all slag based mixes (S14, S29 and 44) with irrespective of their high alkali content Figures (26b and 26c).
Figures 27a, 27b and 27c give the alkali equivalent contents as weight units per volume of grout. Again, as in the previous figures, alkali content of the raw materials could not solely explain the pH.
The results of the present work (Figures 26c and 27c) indicated that alkali equivalent content from raw materials (OPC, SL and SF) was not a decisive factor controlling the pH in the relatively Si-rich mixes tested in this work. This behaviour was probably typical only to Si-rich binder systems were the alkalis originate largely from SL and SF, and are bound to silicates. The behaviour cannot be treated as general rule but rather as an observation.
Based on the above observations it can be concluded that within the mix composition limits of this work alkali equivalent content was not a decisive factor controlling the pH in the relatively Si-rich (OPC-SF and slag-based) mixes.
The significance of the alkali origin remained unexamined in this work, but it is one of the questions that should be looked onto in the future. Some attempts to explain the main components affecting pH and alkalinity will be done by Vuorinen (Vuorinen et al. 2004), on the basis of the leaching tests.
71

20 oC
9.0
9.5
10.0
10.5
11.0
11.5
12.0
12.5
13.0
0.0 0.1 0.2 0.3 0.4 0.5Na2O eq. (OPC), w%
pHUF16+SF (12)ETTA, UF16+SF (f63, f64)ETTA, WCE+SF (w1, w2)Slag and SSC (S14, S20, 44)Ref. 52
20 oC
9.0
9.5
10.0
10.5
11.0
11.5
12.0
12.5
13.0
0.0 0.5 1.0 1.5 2.0Na2O eq. (OPC+SL), w%
pH
UF16+SF (12)ETTA, UF16+SF (f63, f64)ETTA, WCE+SF (w1, w2)Slag and SSC (S14, S20, 44)Ref. 52
(a) (b)
20 oC
9.0
9.5
10.0
10.5
11.0
11.5
12.0
12.5
13.0
0.0 0.5 1.0 1.5 2.0Na2O eq. (OPC+SL+SF or LAC), w%
pH
UF16+SF (12)ETTA, UF16+SF (f63, f64)ETTA, WCE+SF (w1, w2)Slag and SSC (S14, S20, 44)LAC (L8)Ref. 52
(c)
Figure 26a, 26b and 26c. Alkalis of raw materials as weight % of Na2O equivalent vs. pH. Mix symbols are given in parenthesis. pH values were measured in the solutions until 31.08.2004 in the equilibrium test (Vuorinen et al. 2004). Specimens were cured at temperature of 20 ºC for two months. The composition is given as w% calculated from the dry materials only (excluding water). Notation: Solid labels indicate pH in fresh leach solution (ALL-MR) and empty ones in saline leach solution (OL-SR).
72

20 oC
9.0
9.5
10.0
10.5
11.0
11.5
12.0
12.5
13.0
0.0 1.0 2.0 3.0 4.0
Na2O eq. (OPC), g / litre
pHUF16+SF (12)ETTA, UF16+SF (f63, f64)ETTA, WCE+SF (w1, w2)Slag and SSC (S14, S20, 44)Ref. 52
20 oC
9.0
9.5
10.0
10.5
11.0
11.5
12.0
12.5
13.0
0.0 2.0 4.0 6.0 8.0 10.0
Na2O eq. (OPC + SL), g / litre
pH
UF16+SF (12)ETTA, UF16+SF (f63, f64)ETTA, WCE+SF (w1, w2)Slag and SSC (S14, S20, 44)Ref. 52
(a) (b)
20 oC
9.0
9.5
10.0
10.5
11.0
11.5
12.0
12.5
13.0
0.0 2.0 4.0 6.0 8.0 10.0
Na2O eq. (OPC+SL+SF or LAC), g / litre
pH
UF16+SF (12)ETTA, UF16+SF (f63, f64)ETTA, WCE+SF (w1, w2)Slag and SSC (S14, S20, 44)LAC (L8)Ref. 52
(c)
Figure 27a, 27b and 27c. Alkalis of raw materials as g/litre of Na2O equivalent vs. pH of leaching solutions. pH values were measured in the solutions until 31.08.2004 in the equilibrium test. (Specimens cured at temperature of 20 ºC for two months. Notation as in Figure 26.
9.1.3 Effect of Ca, Mg, Si, Fe, Al and SO3 on pH
Figures 28a – 28e show a few correlations between the chemical composition of the raw materials of the mixes (Ca, Mg, Si, Fe, Al, SO3) and pH of specimens cured at temperature of 20 ºC. The composition was given as weight % of per dry materials of the mix. The chemical composition of the raw materials is based on the material information given by the producers in Chapter 5.
The LAC mix L8 did not fit the correlation between SiO2 content and the pH of relatively Si-rich mixes (OPC-SF and slag-based) shown earlier (Figure 1, Cau Dit
73

Coumes at al 2004) (Figure 28a). This is because LAC was based because calcium aluminates and sulphates in larger extent than the other systems. The behaviour of the Si-rich mixes did fit the results of Cau Dit Coumes et al very well, indicating that the minimum value for SiO2 content should be 55w% in order to yield pH 11 or lower. The correlation with the molar ratio (Figure 28d) indicated that CaO + MgO content was an important pH factor. The sum of CaO + MgO as weight % should not exceed 37% in order to obtain pH value 11 or smaller. CaO content alone could not explain the pH of the relatively Mg-rich Slag mixes, for their pH was higher than what would be estimated based on their CaO content only (Figure 28b). When comparing the OPC-SF systems only against CaO/SiO2 molar ratio (Figure 28c), it can be concluded that the ratio should be 0.8 or smaller. The molar ratio of 1 indicated in Chapter 3.1 is too high. It would yield the pH value of about 11.7.
Neither did the present examination based on chemical composition produce modelling nor validation of any existing pH models. Modelling was out side the scope of this work. Yet, the observations made offered valuable guide lines for mix modification and those were used towards the end of this work.
74

20 oC
9.0
9.5
10.0
10.5
11.0
11.5
12.0
12.5
13.0
10 20 30 40 50 60
SiO2, tot, w%
pHUF16+SF (12)ETTA, UF16+SF (f63, f64)ETTA, WCE+SF (w1, w2)Slag and SSC (S14, S20, 44)LAC (L8)Ref. 52
20 oC
9.0
9.5
10.0
10.5
11.0
11.5
12.0
12.5
13.0
20 30 40 50 60 70
(CaO), w%
pH
UF16+SF (12)ETTA, UF16+SF (f63, f64)ETTA, WCE+SF (w1, w2)Slag and SSC (S14, S20, 44)LAC (L8)Ref. 52
(a) (b)
20 oC
9.0
9.5
10.0
10.5
11.0
11.5
12.0
12.5
13.0
0.0 0.5 1.0 1.5 2.0 2.5
UF16+SF (12)
CaO/SiO2, tot, mol/mol
pH
ETTA, UF16+SF (f63, f64)ETTA, WCE+SF (w1, w2)Slag and SSC (S14, S20, 44)LAC (L8)Ref. 52
20 oC
9.0
9.5
10.0
10.5
11.0
11.5
12.0
12.5
13.0
0.5 1.0 1.5 2.0 2(Ca + Mg) / (Si + 1/3Al + 1/3Fe + SO3), mol/mol
pH
.5
UF16+SF (12)ETTA, UF16+SF (f63, f64)ETTA, WCE+SF (w1, w2)Slag and SSC (S14, S20, 44)LAC (L8)Ref. 52
(c) (d)
20 oC
9.0
9.5
10.0
10.5
11.0
11.5
12.0
12.5
13.0
20 30 40 50 60 70
(CaO + MgO), w%
pH
UF16+SF (12)ETTA, UF16+SF (f63, f64)ETTA, WCE+SF (w1, w2)Slag and SSC (S14, S20, 44)LAC (L8)Ref. 52
(e)
Figure 28a, 28b, 28c, 28d and 28e. Chemical composition vs. pH of leaching solutions of specimens cured at temperature of 20 ºC for two months. pH solutions were measured in the solutions until 31.08.2004 in the equilibrium test The composition is given as w% calculated from the dry materials only, (excluding water). Notation as in Figure 26.
75

9.1.4 Effect of curing temperature on pH
The specimens were cored at two temperatures namely 20 ºC and 50 ºC. The higher temperature was taken into the program in order to accelerate the hydration reactions. The project schedule was very tight and the pH tests long lasting. The accelerated 50 ºC specimen offered some approximation on how the 20 ºC specimen were expected to develop, which offered guide lines to the mix modification. Specimens cured at the higher temperature of 50 ºC instead of 20 ºC yielded slightly lower pH values throughout the series at the start of the leaching experiments but with time the pH for higher temperature samples yielded the same pH values as for the lower temperature samples. For some samples even slightly higher pH values could be obtained with time in the leaching tests with samples cured at 50 ºC as compared to the leaching tests with samples cured at 20 ºC. Towards the end of the work it was decided to continue pH and leaching tests only with the specimens cured at 20 ºC. Therefore the results at 50 ºC are not further examined here. Closer examination is given elsewhere (Vuorinen et al. 2004).
9.2 Penetration-ability
9.2.1 Comparison of filter pump and penetration-ability (Bmin and Bcrit) methods
The two penetration-ability methods, namely “filter pump test” developed for field conditions and the more laborious “penetrabilitymeter test” both are based on forcing the grout through sieves of 30 mm diameter under the pressure difference of 1 bar. The interpretation of the results may be somewhat confusing: The maximum volume that can pass trough the sieve in the filter pump is only 300 ml, while in the penetrabilitymeter test the volume of 1000 ml is required to pass any sieve in order to regard the mix as passed through that particular sieve. The Figure 29 gives the correlation between the test results of the two methods: A filter pump test result of 300 ml (the maximum value) through a 100 µm sieve does not indicate that the Bcrit value of the mix would be anywhere near 100 µm. It might be much larger or actually even smaller.
76

0
200
400
600
800
1000
0 50 100 150 200 250 300 350 400
B crit, um
Pass
in fi
lter
pum
p, 1
00 u
m, m
l
Figure 29. Correlation between the test results of the two methods.
How are two methods interrelated and could the filter pump be used to give any idea of the Bcrit value? It can be used give preliminary information of relative penetrability. To accomplish this, the aperture size of the sieve used in the filter pump should be about 50% of the Bcrit range of interest. This is demonstrated in Figure 30 where penetrabilitymeter readings through 45, 63, 75 and 100 µm have been plotted against the Bcrit values. The 63 µm trend line, “Log. (63 µm)”, shows that to yield the Bcrit value of 120 µm, 300 ml of grout must pass through the 63 µm sieve. For example, if only 150 ml passes, the rough estimate of Bcrit value would be approximately 150 µm. The aperture size of 75 µm is slightly too wide to give information about Bcrit values of smaller than 150 µm. In the preliminary tests on the Slag mixes, with W/DM around 1, both the aperture size of 80 and 100 µm were used in the filter pump test (Figure 16). The results were around 150 - 200 and 300 ml. The analysis above indicate that the Bcrit value of those mixes would be about 150 – 200 µm, which is too high to meet the requirement of 120 µm. A few selected Slag specimens were tested for both Bcrit and filter pump values through 80 µm sieve (Table 18). Those results are shown in Figure 31 along with the 75 µm plot (the closest value to 80 µm) from Figure 30. The correlation is reasonably good. The filter pump value of 200 ml through an 80 µm sieve indicates a Bcrit value is too high to meet the requirement.
77

0
200
400
600
800
1000
0 50 100 150 200 250 300 350 400
B crit, um
Pass
in p
enet
rabi
litym
eter
, ml
45 um75 um63 um100 umPass 300 mlLog. (63 um)
Figure 30. Correlation between penetrabilitymeter readings through 45, 63, 75 and 100 µm sieves and Bcrit values.
0
200
400
600
800
1000
0 50 100 150 200 250 300 350 400
B crit, um
Pass
in p
enet
rabi
litym
eter
, ml
75 µm
B crit and filter pump (80 µm) data points
Figure 31. Mixes tested for Bcrit values and filter pump values through an 80 µm sieve along with 75 µm plot (the closest value to 80 µm) from Figure 30.
78

9.2.2 Effect of water / dry materials ratio on penetration-ability (Bmin and Bcrit)
Water is added to grouts in order to decrease viscosity and improve penetration-ability. The results show that this effect does exist but it is not altogether easy to describe (Figure 32): Increasing W/DM improves penetration-ability, but only up to the W/DM ratio of about 2. Larger values still decrease (improve) viscosity.
The penetration-ability of the OPC – SF mixes became worse sharply (Bcrit increased) with W/DM below 2, but the penetration-ability of some slag mixes was relatively good down to the value of 1.6. The reasons for the difference may be:
1. The smaller SF content of the slag mixes per fixed W/DM and consequently less gel formation.
2. Slower reaction rate of slag and consequently less gel formation 3. Smaller maximum particle size, d98% value on slag and consequently less particle
blocking.
The observation based on the data in Figure 32 is in line with the more detailed results on the systems treated separately and shown earlier in Figures 13, 14, 20 and 21.
79

0
50
100
150
200
250
300
350
400
1.0 2.0 3.0 4.0Water / dry materials
B c
rit, µ
mOPC - SF Slag
0
20
40
60
80
100
120
140
160
1.0 2.0 3.0 4.0Water / dry materials
B m
in, µ
m
(a) (b)
0
20
40
60
80
100
120
140
160
1.0 2.0 3.0 4.0Water / dry materials
Visc
osity
, Bin
gham
, mPa
s
0
20
40
60
80
100
120
140
160
1.0 2.0 3.0 4.0Water / dry materials
Yiel
d va
lue,
Bin
gman
, Pa
(c) (d)
Figure 32. Effect of W/DM on penetration-ability and rheology. Summarized results. Legend as in Figure 32a.
9.2.3 Effect of rheology on penetration-ability (Bmin and Bcrit)
Generally, rheology (viscosity and yield value) was unable to explain penetration-ability (Figure 33). Correlations (R2) were less than 0.3 and the trend lines were negative as well as positive. Some vague correlation could be found in Figure 33d: Bmin increased as the yield value increased. E.g. high yield value limits even minor access to apertures in the range of 30 - 70 µm.
80

0
50
100
150
200
250
300
350
400
0 50 100 150
OPC - SF
Slag
Viscosity, Bingham, mPas
B c
rit, µ
m
0
20
40
60
80
100
120
140
160
0 50 100 150Viscosity, Bingham, mPas
B m
in, µ
m
(a) (b)
0
50
100
150
200
250
300
350
400
0 20 40 60Yield value, Bingham, Pa
B c
rit, µ
m
0
20
40
60
80
100
120
140
160
0 20 40 60Yield value, Bingham, Pa
B m
in, µ
m
(c) (d) Figure 33a, 33b, 33c and 33d. .Effect of rheology on penetration-ability. Summarised results. Legend as in Figure 33a.
9.2.4 Observations on “cake build-up” phenomena in penetration-ability test (Bmin and Bcrit)
When the penetration-ability measurement is performed through any sieve of an aperture size between the Bmin and the Bcrit values, the flow passes through three steps.
• The flow starts initially. • The flow slows down due to blocking of the sieve. In the case of particle
blocking the flow rate slows down gradually. In case of gel blocking the flow rate slows rapidly and cake formed has gel like appearance.
• The flow stops when cake blocks the sieve completely. The amount of grout that passed through the sieve gives the reading of that particular sieve. The smaller is the sieve aperture, the smaller is volume of grout needed to form the cake and
81

stop the flow. Typical readings are shown in Figure 34. Detailed description of the method is in Appendix 3 and 4.
When W/DM is increased the volume of grout that passes through a certain sieve increases (Figure 35a). Because the amount of particles per unit volume decreases, the amount of particles that passes the sieve does not increase equally much (Figure 35b). It appears, that after a threshold value, the amount of particles needed to form the blocking cake, does not depend on their concentration in the grout. In more common words: “The same particles block the sieve no matter how lean the mix is. This applies once the mix is not too thick. If the mix is too thick, it blocks the sieve soon anyway”. (See also up coming Figure 41.) The calculations in Figure 35 were made for OPC – SF mixes. Similar calculations for Slag mixes are given in Figure 36.
The consequence of the above reasoning is that the penetration-ability of mixes dominated by particle blocking could be improved by focusing the development work on the particle fractions that block the sieve by identifying them and removing them.
There are two major lines that can be followed. • One line is limiting the content of over sized particles by quality control. That is,
the large particles that should not exist in the ground product. • The other line is the reduction of the d 98% value preferably without increasing
the specific surface area. This can be obtained the jet mill that could be used for grinding OPC as well as slag. The effect of grinding technology on the particle size distribution can be seen by comparing the values of specimen UF16, SL10/3 and WCE-CT in Table 5.
OPC - SF system , type f64
0
200
400
600
800
1000
25 50 75 100 125 150 175 200
Sieve, um
Pass
ed, m
l
W/DM =2.0
W/DM=2.5
W/DM =4.0
Figure 34. Penetration-ability measurement.
82

0
200
400
600
800
1000
1.0 2.0 3.0 4.0
Water / dry materials
Gro
ut v
olum
e pa
ssed
trou
gh75
µm
, ml
f64 typef63 typef63 type, without ETTARef. 52
Mix: u1 - u3, u4 - u5, u8 - u10, u11 - u13
0
100
200
300
400
1.0 2.0 3.0 4.0Water / dry materials
Part
icle
s pa
ssed
tr
ough
75
µm, g
(a) (b)
Figure 35a and 35b. Volume of grout and amount of OPC particles passing through 75 µm sieve (diameter 30 mm) in penetration-ability measurement.
0
200
400
600
800
1000
1.0 1.5 2.0Water / dry materials
Gro
ut v
olum
e pa
ssed
tr
ough
75
µm, m
l
Slag and SSCsystems
Mix: S16 - S18S44 - S45, S25 - S27S43, S19 - S21S46 - S47, S29
0
100
200
300
400
1.0 1.5 2.0Water / dry materials
Part
icle
s pa
ssed
tr
ough
75
µm, g
(a) (b)
Figure 36a and 36b. Volume of grout and amount of SL particles passing through 75 µm sieve in penetration-ability measurement.
9.3 Compressive strength
In the previous work it was found that the well-known dependency between compressive strength and water to cement ratio hold true also with four different types of OPC micro cements (Figure 37, Kronlöf 2003). In the present work the scatter of binders is far wider including several SF/OPC ratios as well as blast furnace slag activated in several ways. The results were as follows (Figures 38a, 38b and 38c):
• The strength of the slag system mixes (activated with OPC only) was 50% lower than the strength of other systems, namely OPC – SF system and the super sulphate cement system (SSC, slag activated with gypsum and OPC).
83

• The strength development of all systems was completed at the age of 28 d. The strengths did not increase from 28 d to 91 d.
• The strength of the OPC – SF system mixes was higher than the strength of plain OPC mixes in Figure 37.
The observations above indicate that • SF used in the relatively large SF/OPC ratios of 0.69 and 0.94 was activated
well, • blast furnace slag was not activated with OPC only in low-pH conditions.
Gypsum was needed to provide the necessary sulphate for further activation.
y = 13.021x-1.78
R2 = 0.8782
0
10
20
30
40
0.0 0.5 1.0 1.5 2.0 2.5 3.0
Water powder ratio
Com
pres
sive
str
engt
h, M
Pa
1 d28 dPower (28 d)
Figure 37. Compressive strength vs. water to cement ratio with four different types of OPC micro cements. The trend is line fitted only to mixes without SF, which was used in the form of GroutAid (Kronlöf 2003).
84

OPC - SF system
0
2
4
6
8
10
12
14
16
18
20
1 1.2 1.4 1.6 1.8 2 2.2 2.4 2.6 2.8 3 3.2 3.4 3.6 3.8 4 4.2Water / dry materials
Com
pres
sive
str
. MPa
Est, prev project. Experim. without SF, 1)UF16+SF no ETTA, 3 months, 2)OPC-SF, 28 dOPC-SF, 91 d
Mix:u1 - u3u4 - u6u8 - u10u11 - u13
Ref. 52; 28 d and 91 d
(a)
Slag system (activated with OPC)
0
2
4
6
8
10
12
14
16
18
20
1 1.2 1.4 1.6 1.8 2 2.2 2.4
Water / dry materials
Com
pres
sive
str
. MPa
Slag SL15, 91 dSlag SL10/3, 28 dSlag SL15, 91 dSlag SL10/3, 91 d
Mix:S0 - S1S43, S19 - S21S16 - S18
Super sulfate cement system(activated with gypsum and OPC)
0
2
4
6
8
10
12
14
16
18
20
1 1.2 1.4 1.6 1.8 2 2.2 2.4Water / dry materials
Com
pres
sive
str
. MPa
Slag SL15, G/SL=0.8-0.16, 28 dSlag SL10/3, G/SL=0.16, 28 dSlag SL15, G/SL=0.8-0.16, 91 dSlag SL10/3, G/SL=0.16, 91 d
Mix: S9 - S15S25 - S27, S44 - S45S46 - S47, S29
(b) (c)
Figure 38. Compressive strength of specimens cured at 20 ºC for 28 and 91 days vs. water / dry materials ratio. 1) Curve fitted to results without SF (Figure 37, Kronlöf 2003). 2) Tested with pH cylinders at the age of about 3 months. Experiments 1, 2, 3 and 4. SF/OPC =0.3, which is smaller that in the mixes f63 and f64
9.4 Setting (shear strength at 6 h)
The setting behaviour of different systems is given in Figure 39. W/DM ratio controls the setting of all binder systems. When comparing different systems to the OPC – SF plot without ETTA the following observations can be made:
• ETTA accelerated the OPC-SF system clearly (Figure 39a). • The reference mix set relatively slowly. This was probably due to the retarding
effect of superplasticizer at the ambient low temperature of 12 ºC (Figure 39a).
85

86
• Slag system set almost as fast as the OPC SF system without ETTA (Figure 39b).
• Super sulphate system was slower than the slag system (Figure 39c). The order was reverse while examining the compressive strength results at the age of 28 days (Figures 38b and 38c).
OPC - SF system
0
2
4
6
8
10
1 1.2 1.4 1.6 1.8 2 2.2 2.4 2.6 2.8 3 3.2 3.4 3.6 3.8 4 4.2Water / dry materials
Shea
r str
. 6 h
, kPa
OPC-SF, with ETTA
OPC-SF, no ETTA
Mix:u1 - u3u4 - u6u8 - u10u11 - u1352
Ref. 52
(a)
Slag system (activated with OPC)
0
2
4
6
8
10
1.0 1.2 1.4 1.6 1.8 2.0 2.2 2.4
Water / dry materials
Shea
r str
. 6 h
, kPa
OPC-SF, no ETTASlag SL15Slag SL10/3
Mix:S0 - S1S43, S19 - S21S16 - S18
Super sulfate cement system(activated with gypsum and OPC)
0
2
4
6
8
10
1.0 1.2 1.4 1.6 1.8 2.0 2.2 2.4Water / dry materials
Shea
r str
. 6 h
, kPa
OPC-SF, no ETTASlag SL15, G/SL=0.8-0.16
Slag SL10/3, G/SL=0.16
Mix: S9 - S15S25 - S27, S44 - S45S46 - S47, S29
(b) (c)
Figure 39. Shear strength of specimens cured at 12 Cº for 6 hours vs. water / dry materials ratio.

10 CONCLUSIONS
10.1 Portland cement – silica fume system (OPC – SF)
The water/dry materials ratio of the OPC - SF mixes needed to obtain good penetration-ability was too high to yield the compressive strength requirement. So, the strength was slightly below the requirement. This is partly because the strength requirement was set too late by the project management board end therefore it was not was not to optimise the mixes for higher strength and several options for reducing the water content were overlooked while developing the mixes.
The options for reducing the water content are discussed in detail in the up-coming Chapter 12. Other requirements were met except that of the yield value, which none of tested the systems met.
The most important advantage of the OPC-SF system compared to the others were theabsence of sulphides and the possibility ntrol setting with ettringite acceleration (ETTA). Reduction of W/DM and ETTA would lead to better strength probably without jeopardising other properties (Chapter 12).
10.2 Super sulphate cement system (SSC)
SSC mixes (slag activated with gypsum and OPC) met all the given requirements except that of the yield value. The penetration-ability was relatively good with water / dry materials ratios down to 1.6. This made it possible to yield high compressive strength. The compressive strength at the age of 28 d was 10 MPa, which is higher than that of the reference mix.
The drawbacks were the slow setting and sulphides originating from slag (Vuorinen et al. 2004). The shear strength of the mixes within the suitable water / dry materials ratio was 0.3 - 1.5 kPa which generally exceeded the requirement (0.5 kPa), but was still too slow for practical grouting (see Chapter 4, Step 2). Sulphides are problematic, because they cause a possible long-term safety risk in the repository (Vuorinen et al. 2004).
10.3 Slag system activated with OPC (Slag)
Slag mixes met also all the given requirements except that of the yield value. The penetration-ability was slightly better that that of the SSC mixes. Setting was faster than that of SSC. The shear strength of the mixes within the suitable water to dry materials ratio (W/DM) measured in the laboratory conditions was 1 - 3 kPa. The lowest values are still too low for practical grouting.
Compressive strength was smaller that with the SSC mixes. The strength at the age of 28 d was generally 50% lower and remained at that level until the age of 91 d. The sulphides of the Slag system naturally represent the same risk as those of SSC.
to co
87

10.4 Low Alkali Cement system (LAC)
LAC was a product developed in Japan for construction purposes and was tested here r injection properties without making modifications to the mineral composition hapter 5). It was not found suitable for grouting for the penetration was poor. This
was found with the extremely fine “LAC fine” product, which was retarded with citric acid as well as with mixtures with LAC coarse. Substituting LAC fine with LAC coarse deteriorated setting completely (shear strength at 6h), but did not improve penetration-ability. The pH of LAC was below 11 as required.
10.5 Effect of alkalis (Na2O and K2O) on pH
The alkali content of raw materials did not seem to explain the pH of the leachate solutions. This behaviour is probably typical only to Si-rich binder systems were the alkalis are bound to silicates and cannot be treated as a general rule. The significance of the alkali origin remained unexamined in this work, but it is one of the questions that should be looked onto in the future.
10.6 Effect of Ca, Si, Fe, Al, SO3 on pH
The parameter that was found to explain the pH behaviour of all systems including slag based systems and LAC was the sum of CaO + MgO as weight %. This is merely an observation and cannot be treated as a general rule. The sum of CaO + MgO as weight % should not exceed 37% in order to obtain pH value 11 or lower. When comparing the OPC-SF mixes only the Ca/SiO2 molar ratio should be 0.8 or lower to obtain pH value 11 or lower. The ratio 1 suggested in Table 3 would yield pH 11.7 approximately.
10.7 Penetration-ability
A filter pump test result of 300 ml through a 100 µm sieve does not prove that the Bcrit value of the mix would be equal or even close to 100 µm. It might be larger or actually smaller. The filter pump can be used to give preliminary information of relative penetrability, if the aperture size of the sieve used in the filter pump is about 50% of the Bcrit range of interest. The penetrabilitymeter cannot be substituted by filter pump.
The penetration-ability of the OPC – SF mixes became worse sharply (Bcrit increased) with water / dry materials ratios below 2, but penetration-ability of several Slag mixes was relatively good down to the value of 1.6. The reasons for the difference may be:
• The smaller SF content of the slag mixes and consequently less gel formation. • Slower reaction rate of slag and consequently less gel formation • Smaller maximum particle size, d98% value of slag and consequently less particle
blocking.
Increasing water / dry materials ratio generally increases fluidity and penetration-ability up to a threshold value. If the ratio was increased over the threshold value penetration-ability did not improve but fluidity did.
fo(C
88

After the threshold value, the amount of particles needed to form the blocking cake, did not depend on their concentration in the grout. In more common words: “The same
s once the mix is not
s, namely OPC – SF system and SSC system
strength at 6 h)
particles block the sieve no matter how lean the mix is. This applietoo thick. If the mix is too thick, it blocks the sieve soon anyway”. (See also up coming Figure 41.)
10.8 Compressive strength
The compressive strength of Slag system (activated with OPC only) was about 50% of that of the other systems the other system(slag activated with gypsum and OPC).
10.9 Setting (shear
ETTA accelerated the OPC-SF system clearly. The reference mix set relatively slowly. Slag system set almost as fast as the OPC-SF system without ETTA. Super sulphate system set slower than the slag system.
89

90

11 SUMMARY
Posiva and SKB are planning to deposit spent nuclear fuel in deep repositories. Use of common construction materials, as steel and concrete, are foreseen. With respect to the long-term safety a suitable chemical environment is vital. The use of low-pH products is necessary in order to get leachates with sufficiently low pH (< 11).
sk 4 (Testing the technical performance of the
The object of the work was to design at least one grout that would meet given 1 and 2 above)
m 3. Penetration-ability bcrit ≤ 120 μm
Desired properties: 4. Viscosity ≤ 50 mPas 5. Bleeding ≤ 10% 6. Workability time ≥ 60 min 7. Shear strength at 6 hours ≥ 500 Pa 8. Yield value at 6 hours ≤ 5 Pa 9. Compressive strength at 28 d ≥ 4 MPa
The four candidate grouting systems, material combinations, studied in this work were as follows:
1. Ordinary Portland Cement + Silica Fume (OPC+SF) 2. Blast furnace slag (Slag) 3. Super sulphate cement (SSC) 4. Low Alkali Cement (LAC)
LAC was a cement product developed elsewhere for low-pH concrete. Its suitability for grouting was tested without varying the product mineral composition. Mix modifications concerning only water to dry materials ratio as well as retarder dosage were made. Within those limits the product was not found suitable for grouting.
Originally, according to the project plan, also fly ash was to be studied. However fly ash was ruled out at an early stage of the work for there were problems foreseen in the delivery and quality stability of the material.
Tested materials were commercially available. Only the fineness of the materials was modified by grinding when needed. The scientific modelling of the mechanisms of grout behaviour (setting, rheology, penetration-ability, compressive strength, pH) was not included in the objectives of this work (Task 4).
The work reported here is the Tamaterials) of the seven tasks in the subproject 1 (Low-pH cementitious injection grout for larger fractures), which is a part of the larger SKB-NUMO-POSIVA research project (Injection Grout for deep repositories).
requirements listed below (in detail in Tables
Required properties: 1. pH ≤ 11 2. Penetration-ability bmin ≤ 80 μ
91

The most promising mixes were selected to the pH test. Their properties are listed in Tables 29a and 29b along with properties of the reference mix 52. Summarised mix and chemical compositions of the same mixes are listed in Chapter 9.1. The pH values are the ones measured until the date 31.08.2004 in the equilibrium test The testing period is not the same for each test, since they were started at different dates, but generally the declining pH development had levelled relatively well by the date for most samples (Vuorinen et al. 2004).
Table 29a. Properties of mixes tested for pH. Mix Binder
Bleeding
2 h Shear
str. 6 h
Bcrit Bmin Visco- sity
Bingham
Yield value
Bingham
Visco- sity
Casson
Yield value
Casson % kPa µm µm mPas Pa mPas Pa
Requir. < 10 > 0.5 < 120 < 80 < 50 < 5 < 50 < 5 12 UF16-SF 0 0.2 108 63 55 22 18 15 f63 UF16-SF with ETTA 0 3.7 65 2) 44 2) 50 21 16 15 f64 UF16-SF with ETTA 0 3.4 63 3) 44 3) 40 16 12 12 w1 WCE-SFwith ETTA 0 1.3 103 49 35 8 13 5 w2 WCE-SF with ETTA 0 1.0 102 47 28 7 9 5 44 Slag-RC10-SF 0 1.3 136 61 32 8 11 5
S14 1) Slag-RC10-Gypsum-SF 0 1 139 40 50 18 14 13 S26 1) Slag-RC10-Gypsum-SF 0 1 135 47 52 22 15 16 S20c Slag-RC10-SF 0 2.8 99 40 63 24 20 17 L8 LAC 0 1.6 - - 27 7 9 5
Ref 52. UF16-SF-SPL 0 2.6 63 201 23 5 8 3 1) Mix S26 was nearly identical to the mix S14, the only difference being the ground slag batch fineness, which was finer for S26. S26 has not been tested for pH 2) Note: The penetration-ability results could not be repeated in later examinations. The repeated Bcrit values were around 120 - 140 and Bmin 40 - 60 µm. (Figure 13) 3) Note: The penetration-ability results could not be repeated in later examinations Note: The penetration-ability results could not be repeated in later examinations. The repeated Bcrit values around were 100 and Bmin 50 - 60 µm (Figure 14)
Table 29b. Properties of mixes tested for pH . Mix Binder
W/DM Compr. str. Compr. str. pH 1)
28 d MPa
91 d MPa
In fresh leachate
20 / 50 2)
In saline leachate
20 / 50 2) Requirement ≥ 4 ≥ 4 < 11 < 11
12 UF16-SF 1.26 -- - 12.3 / 12.3 12.0 / 12.0 f63 UF16-SFwith ETTA 2.48 3.3 3) 3.7 3) 11.1 / 10.7 10.0 / 10.1 f64 UF16-SFwith ETTA 2.91 2 3) 2 3) 10.5 / 10.0 9.7 /9.4 w1 WCE-SFwith ETTA 2.48 - - 11.2 / 11.3 10.1 / 10.5 w2 WCE-SFwith ETTA 2.91 - - 10.7 / 10.7 9.8 / 9.7 44 Slag-RC10-SF 1.36 - - 11.4 / 11.3 10.6 / 10.6
S14 4) Slag-RC10-Gypsum-SF 1.6 7.1 5.9 10.5 / - 9.9 / - S26 4) Slag-RC10-Gypsum-SF 1.6 9.0 9.9 - -
S20 Slag-RC10-SF 1.6 4.4 3.8 11.1 / - 10.2 / - L8 LAC 1.0 16.5 - 11.0 / - 10.5 / -
Ref 52. UF16-SF-SPL 1.21 9.3 11.1 12.5 / - 12.2 / - 1) pH research (Vuorinen et al. 2004)
92

2) 20; samples cured in plastsamples cured in plastic pipes
ic pipes at the temperature of 20 o C for two months prior to pH testing 50; at the temperature of 20 o C for two weeks continuing at 50 o C till the age
For other systems except LAC the requirements were generally met except for the yield
e the relatively low water demand for penetration-ability. This made the compressive strength requirement easy to meet in the
lag-based mixes were the setting (shear strength at 6 hours) and the
fety problems caused by slag sulphides. The strength of the OPC – ingite acceleration (ETTA), which can be he weakness was the high water demand ere are several possibilities to reduce as
ased mix were selected to the first pilot tests. They were the as an ETTA mix and the slag mix of the type
he f63 type of mix was selected due its ed to other SF-OPC mixes. S20c was selected
as 50% lower than that of a similar mix S29 activated with both gypsum and OPC. However the activation with gypsum
ucing bacteria in the deep repositories (Vuorinen et al. 2004).
of two months prior to pH testing 3) Not tested. Estimated (linear interpolation) from the data shown in Figures 13 and 14. 4) Mix S26 was nearly identical to the mix S14, the only difference being the ground slag batch fineness, which was finer for S26. S26 has not been tested for pH.
value (rheology) and the compressive strength of those OPC – SF mixes that were selected to the pH tests before the strength requirement was set.
The advantages of the slag-based systems wer
case of the slag based super sulphate cement (SSC) while the OPC activated slag mixes remained about 50% weaker. The severe weaknesses of all sslow reaction rate, which was seen as slow potential long-term saSF system was the fast setting due to ettrdeveloped into a setting control system. Tneededlisted in Chapter 12.
for penetration-ability. However, th
One OPC-SF and one slag bOPC-SF mix of the type f63, which wS20c, which was activated with OPC only. Tbetter the technical performance compardue to its low pH while the strength development w
was excluded due to the possible detrimental long-term safety effects caused by sulphate red
93

94

12 FUTURE NEEDS
Discussions about the need of grout compressive strength were in progress through the project starting from “no requirements” towards the requirement of 4 MPa ending up to strengths clearly higher. The need does not stem from structural reasons but from the need of long term (100 years) performance. The connection between durability and
be considered as listed below. If the compressive strength requirement will be lower than the present 4 MPa,
crease the compressive strength.
ld conditions. A more favourable mixing order might be achieved with some type of special grouting equipment that allows the addition of GroutAid at the nozzle (Figure 40).
strength is not defined and discussions are likely to continue for some time in the future. If conclusions will be drawn and a higher compressive strength requirement set, the mix development will be more demanding and new options should
the options below need not be considered.
12.1 Requirements (open time)
In this work the open time requirement was 1 hour. The possibility of shortening the open time requirement into 30 min should be considered.
• The benefits would be lower viscosity and possibly better penetration-ability.
• The benefits could be utilised as such or as lower water / dry materials ratio (W/DM), which (the later) would in
12.2 Mixing order
The delayed GroutAid addition (mixing order 2) instead of mixing “everything together” (mixing order 1), gave lower viscosity. This was most pronounced in the more Si-rich mixes. In both OPC – SF and Slag systems the effect of mixing order was at least as great as that of 1% superplasticizer dosage. However, mixing order was excluded from the experiments for it was considered to be laborious in fie
GroutAid
Good penetration “Gelling”
Open time 0.5 - 1 h
Figure 40. Addition of GroutAid at the nozzle. Mixing order 2.
95

The possibility of applying such a mixing technology should be reconsidered and included in future tests. The precondition of such a decision is the estimation of the costs effects of the new technology on the overall grouting procedure.
The benefits to mix development would be same and could be utilised as those of shorter open time listed above (Chapter 12.1).
The effect of mixing order is demonstrated as follows: • OPC-SF system: The parallel mixes 2 and 12 vs. the parallel mixes 9 and 13 in
Figure 6a. • Slag system: The mix 46 vs. the mix 34 in Figure 16a and the mix 44 vs. the mix
36 in Figure 17a.
12.3 Superplasticizer
In the current tests superplasticizers were ruled out as their use would require an analysis of any undesired effects on the long-term safety. Yet, it is possible that after testing they can be approved.
The benefits would be the same as those of shorter open time listed above (Chapter 12.1).
12.4 Glass and alkalis
The most important Si source of the present work has been silica fume (SF) in the form of GroutAid. Its drawback is the gel like nature when used in large quantities. It would be possible to substitute it partly with ground glass. The problems to be solved are its unknown reaction rate, the possible effect of alkalis on pH, question concerning quality and availability. Grinding to favourable fineness is one possibility to regulate reactivity, but most likely also other means are needed in order to modify reactions at early age.
The benefits would be the same as those of shorter open time listed above (Chapter 12.1).
12.5 Binder development
A well penetrating mix is one that does not tend to form a blocking “cake” in front of the sieve. To avoid that, the blocking features of grout should be minimised. “Gel” blocking is likely to take place with fast reacting cements and silica fume (Figure 41a).
If that is avoided the next step is to avoid particle blocking caused by oversized particles observed with blast furnace slag batch SL10/2 (Chapter 7.9.5) (Figure 41b). Even though the fraction of particles larger than 63 µm was only 0.3% (a fraction far too small to show in the particle size analysis), yet that was large enough to totally poison the slag batch SL10/2. In the case of slag batches with better penetration-ability the fraction of particles larger than 63 µm was not known. Neither is it known how would the particles in the 20 -63 range µm effect on the penetration-ability.
96

In this work the jet grinding technology has produced relatively narrow particle size distributions for slag (Figure 2a, Table 5), which is advantageous for penetration. Yet,
en UF16, SL10/3 and WCE-CT in Table 5.
-ability is given in Chapter 9.2.4.
more effort is needed for the separation of the very small fractions of over sized particles. If the over sized particles were identified and removed, the penetration-ability would possible be improved significantly (Figure 41b and Figure 41bc).
The other line is the reduction of the d98% value preferably without increasing reactivity e.g. without increasing the specific surface area. This necessitates narrow particle size distribution, which has been obtained by jet mill for slag. The technology could also be used for grinding OPC. The effect of grinding technology on the particle size distribution can be seen by comparing the values of specim
More detailed discussion on penetration
SF-particle
OPC-particle
(a) (b) (c)
d shown and lower water to dry materials ratio (W/DM) established, the dosage of ETTA components should be examined. If the W/DM was low enough, it would be possible that acceleration would be needed only in exceptional conditions for controlled rapid setting.
The significance of ETTA dosage on leachate pH as well as other leaching behaviour need to be tested with a specimen without ETTA. The results would provide information for dosages from 0% up to the values tested earlier with specimen f64 and f64.
12.7 Sulphides and sulphates
The performance of super sulphate cement system mixes (based on blast furnace slag activated with gypsum and OPC) was very promising: The water need was smaller than that of the OPC-SF system and the strength development faster than that of the OPC
slag’s ulphide content fety risks: Sulphide is
Figure 41a, 41b and 41c. Gel blocking, all particles covered by gel (a), particle blocking caused by oversized particles (b) and penetration-ability improved by removing the oversized particles (c).
12.6 Ettringite acceleration (ETTA) control
Once the questions above have been solved, their effects on water deman
activated Slag system. Yet, the drawbacks of the SSC system areand gypsum’s sulphate contents. Both are possible long-term sa
s
97

98
e developing the ETTA system this can be done by testing the option of reducing or excluding the
considered as such a risk and the Sulphate Reducing Bacteria (SRB) brings about the risk of sulphate (SO4) reduction to sulphide (Vuorinen et al. 2004). This is a factor, which must be taken into account at the bedrock conditions. Whil
sulphate (gypsum) component from ETTA.

REFERENCES
BY 1, Technical code 1972. The Concrete Association of Finland.
Cau Dit Coumes, C.; Courtois, Simone; L., Stephanie ; Bourbon X. 2004. Formulating a low-alkalinity cement for radioactive waste repositories. Atlante, June 21 – 25, 2004.
ent Based Injection Grouts - Setting and Cement Proceedings.
Hjertström, S. 2001. Microcement – Penetration Versus Particle Size and Time Control. 4th Nordic Rock Grouting Symposium. Stockholm 2001. Proceedings. Pp. 61 – 71.
Kronlöf, A. 2003. Development of cement based materials for grouting rock at Olkiluoto rock. Posiva Oy, Olkiluoto, Finland. Working report 2003-29.
Lagerblad, B. 2001. Leaching performance of concrete based studies of samples from old concrete
karakterisering av material. Teknisk Dokument TD-01-50. Cement och Betong Institutet. (In Swedish).
Lojander, M. 1985. GLO-85. Geotechnical laboratory instructions. Grading experiments
VBM 3078, 1997.
SFS-EN196-1. 1995. Methods of testing cement - Part 1: Determination of strength.
Pp. 1 - 4
Eriksson, M.; Brantberger, M.; Dalmalm, T.; Stille, H., 2000. Separations och filteringstabilitet hos cementbaserade injekteringsmedel – En litteratur- och laboratoriestudie. Bergmekanikdag 2000, Stockholm. Pp. 203 – 225 (In Swedish).
Fjellberg, L.; Lagerblad, B. 2001. CemReactions. 4th Nordic Rock Grouting Symposium. Stockholm 2001.Pp. 51 - 60.
constructions. Technical Report TR-01-27. Svensk Kärnbränslehantering AB (Swedish Nuclear Fuel and Waste Management Co.
Lagerblad, B.; Fjellberg, L. 2001. Djupförvarsteknik - Cement baserade injekteringsmedel – Inventering och
SGY. Rakentajain kustannus Oy, Helsinki 1985. (in Finnish).
Sandberg, P. 1997. Penetrability of cement based grouts. Selected Research Studies from Scandinavia. Editor K. Tuutti. Lunds Tekniska Högskola, Byggnadsmaterial, rapport T
Sievänen, U., Syrjänen, P, Ranta-aho, S. 2004. Injection Grout for Deep Repositories, Low-pH Cementitious Grout for Larger Fractures, Field testing in Finland, Pilot test. JP-Suoraplan, Gridpoint. Posiva working report 2004-47
Suomen standardisoimislittio SFS
Stronach, S. A. and Glasser, F.P. 1997. “Modelling the Impact of Abundant Geochemical Components on the phase Stability and Solubility of the CaO-SiO2-H2O System at 25°C: Na+, K+, SO4
2-, Cl-, and CO32-“, Adv. Cem. Res. 9-36 (1997) 167-181
Vattenfall Utveckling AB 1996. Instructions: Bestämning av filterstabilitet / Determination of the filtration stability 1996-01-15. VU-SC: 27.
99

100
Vuorinen, U. et al. 2004. Injection Grout for Deep Repositories, Low-pH Cementitious Grout for Larger Fractures, Leach testing of Grout Mixes. VTT Processes. Posiva working report 2004-46.

APPENDIX 1
REQUIREMENTS FOR THE LOW pH CEMENTITIOUS GROUT
Reijo Riekkola
101

102

103

Seawaterintrusion
Upconing of deep saline
water
pH-plume
Drawdown ofgroundwater level
Drifting of organicand oxidizing
material
Migration ofsuperficial waters into
disposal level
Disturbances forconstruction and operation
Consumption of buffering capacity of
fracture infillings
Figure 1. The site-scale problems envisaged due to groundwater inflow into underground facilities (Riekkola et al. 2003).
In this memorandum the required and desired properties of the low pH grout are described. The impacts of the grout properties are considered from long term safety, environmental acceptance, achieved sealing result and from practicability point of view.
The individual properties are discussed in the following chapters and summarized in Table-1.
2 PROPERTIES TO ASSURE THE LONG TERM SAFETY
Development of low pH cement for sealing of the repository has been initiated because the harmful effect of OPC on engineering barriers has been recognized. Present understanding is that pH of the grout should be lower than 11. This is the basic requirement for the developed grouts. In addition, the amount of organic materials must be minimized and the composition of the grout mixture and its components must be known to enable the analysis of their impact on the long term safety. For instance, cements and additives may contain organic dispersing agents that are not generally pointed out in the safety data sheet.
3 PROPERTIES TO ASSURE THE ENVIRONMENTAL ACCEPTANCE AND OCCUPATIONAL SAFETY
The composition of the grout mixture and its components must be known to enable the evaluation of their impact on the environment and occupational safety.
104

Grouting materials may also cause harmful effects on the environment (or man-maid structures) if its penetration path cannot be controlled or if the setting process does not take place properly. Maximum penetration length during grouting can, in principle, be adjusted by selecting the values for the shear strength of the grout and grouting pressure, by controlling the time used for pumping or by controlling the volume of the grouted material assuming that the properties of the rock fractures are known. In this context maximum penetration length is not considered to have major impact on the selection of the shear strength or other material properties of the grout.
4 TECHNICAL PROPERTIES TO ENABLE REASONABLE EXCAVATION WORK
Precondition for reasonable excavation work is that the grout must be practical to use, which will mainly be ensured in the field tests. For practical implementation of grouting and excavation works it is important that fresh grouting material does not flow out from the fracture because of boring of new boreholes or blasting of the rock. Equally important is that excavation can be continued within reasonable time frames after pregrouting is completed. These goals can be achieved by designing the working procedures and by controlling the development of the shear stress of the grout.
Grouting material needs to have sufficient strength to withstand the outwards water pressure when construction activities are continued either by boring new grouting or blasting holes or by blasting the tunnel in the pregrouted zone. In these cases the water pressure in a fracture tries to push the grout into the new borehole or into the blasted open tunnel. The property of the grout that resists the water pressure is the shear strength affecting at both surfaces in a fracture.
The case chosen for dimensioning the requirement for the shear strength at ≤ 6 hours age is based on the following suppositions:
• A new hole is bored in the pregrouted zone or the tunnel is blasted in the pregrouted area
• The length of the flow path of the previously grouted material to the new hole or the open tunnel is assumed to be ≥ 1 m
• Groundwater pressure is supposed to be reduced to ≤ 1 MPa • Fracture aperture ≤ 1 mm
Calculation principle is that groundwater overpressure (p) affects to the outer surface of the grout along the unit width. The grout is pushed by the force p a, where a = fracture aperture. Penetration is prevented by the shear stress (τ), which affects on the both fracture surfaces along the whole fracture length (L).
p a = 2 τ L
105

The required shear strength value (without any safety factor) can then be calculated:
τ·= p a / (2 L) = 1 MPa × 1 mm / (2 × 1m) = 500 Pa
During grouting the viscosity of the grout has great impact on the time needed to fill the fractures and the yield value has influence on the grouting pressure. The required values for the viscosity and the yield value of the grout should be as low as possible during the 60 minutes workability time to enable fast penetration and low grouting pressure and are set for ≤ 50 mPas and ≤ 5 Pa, respectively.
Blasting of the tunnel in or near the pregrouted zone produces vibrations to the rock and also to the grout in the fractures. State of the strength development at the time of blasting is important in order to enable continuation of the hardening process of the grout. The grout should have plastic properties during the most critical blasting rounds within the first few days after grouting. When the hardening process continues after blasting, the grout is foreseen to possess some self healing capability for obtaining intact structure and sufficient strength.
for penetrating the fractures is measured by the it is set for ≤
min pact on the
bleed smaller than 5% are favoured.
nt.
ensured by setting requirements for the uniaxial compressive
5 TECHNICAL PROPERTIES TO ENABLE GOOD SEALING RESULT
The target for obtaining good sealing result requires that the grout can penetrate and fill the small aperture fractures and that the hardened grout has low water conductivity.
Present understanding is that the lower limit of the apertures where cementitious grouts must penetrate are in the scale of one tenth of millimeter. The ability penetrability meter. The requirement for the critical aperture bcr120 μm. The requirement for b does not have that much imtotal tightness of the grouted zone but has an important role in sealing the very small fractures that the grouting holes penetrate. The requirement for bmin is set for ≤ 80 μm.
When the grout has been pumped into a fracture it should fill the fracture as completely as possible for achieving a tight grouted zone. If the cementitious particles of the suspension have possibility to settle under the gravity, a passage may be formed in planar, horizontal fractures into the upper part of the fracture, leakages may take place and erode the surface of the grout. Generally, grouts with the However, in small fractures the bleed is not considered to be that critical factor and the value of 10% is set as the bleed requireme
Because the grout needs to prevent leakages also through the grout matrix, the grout needs to be intact and have low water conductivity. This can be roughly
106

strength (UCS) of the hardened grout. However, it is not clearly understood which value should be selected as UCS-requirement. Kronlöf (2003) has earlier measured UCS of cement based grouts reporting values from 0,6 MPa to 15 MPa at the age of 24 hours and 7-36 MPa at the age of 28 days. For example one Ultrafin12-silica recipe tested by Kronlöf (2003) resembling Ultrafin12-silica grout used successfully in Salmisaari Coal Storage in Helsinki, showed UCS values of 2 and10 MPa at 24 hours and 28 days respectively. By selecting 4 MPa for UCS-requirement at 28 days age we are at the lower range of strength properties as believed to be met in practical cases but at the same time ensure that better penetration can be
Grouted zone in the rock should maintain its properties during about
6
tion costs. Generally speaking, the faster the excavation can proceed after the pregrouting, the cheaper the construction costs are,
and machinery may be
orkability.
7 S
• Material (or at least its components) must have a history of use in cement y (or practical engineering)
obtained.
hundred years under the expected site conditions or it should be possible to re-establish the properties by re-grouting. In addition, the grout (or at least its components) must have a history of use in cement technology (or practical engineering).
COSTS
In addition to sealing result, the grout properties have great influence on the construc
presuming that the sealing result is acceptable. As discussed in earlier chapters, the development of the shear strength of the grout has major impact when the excavation can be continued. In addition, the viscosity of the grout has influence on the time needed for filling the fractures and the better the penetrability of the grout is, the smaller amount of grouting holes is needed. Furthermore, sufficient workability time allows efficient use of the mixed grout.
Material costs form only a part of the costs for grouting. Especially in site conditions, where fracture apertures are generally small resulting in modest grout consumption, the costs of boring, manpowersignificant compared to material costs. However, it is practical from grouting costs point of view to set a target that material costs of the developed grouts should be reasonable, preferably in the scale of OPC grouts and that the properties of the grout can be adjusted to meet the requirements of the shear strength, viscosity, penetrability and w
OTHER REQUIREMENT
The grout should fulfil other, more general requirements that cannot so far be expressed by numbers:
• Material must be available in practice during the construction and operation of the repository
technolog
107

• Durability (chemical and physical) properties of the material needs to be sufficient that the grouted zone maintains its required properties during the expected lifetime
Table 1. Required and desired properties of low pH cement based grouts
Property
Requirement
Measuring
method Order of
importance
Required propertie
≤ 11 Leaching tests s
pH
Penetrability bmin Penetrability bcrit
≤ 80 μm ≤ 120 μm
Penetrability meter at 60 min
Desired
propertie
s
Viscosity
≤ 50 mPas
Rheometry at 60 min
Bleed
≤ 10% Measuring glass at 2 hours
500 Pa
Fall cone at 6 h
Workability time Shear strength
≥ 60 min
Determined by penetrability and viscosity
Yield value
≤ 5 Pa Rheometry at 60 min
Compressive strength
≥ 4 MPa
Uniaxial compressive strength at 28 days
REFEREN
project 1: Low pH cementitious injection grout for larger fractures. Project plan. Posiva Oy
CES
Kronlöf, A. 2003. Development of Cement Based Materials for Grouting of Rock at Olkiluoto. Posiva Oy, Olkiluoto, Finland. Working Report 2003-29.
Riekkola, R., Sievänen, U. & Vieno, T. 2003. Controlling of disturbances due to groundwater inflow into ONKALO and the deep repository. Posiva Oy, Olkiluoto, Finland. Working Report 2003-46.
Sievänen, U. 2003. Injection grout for deep repositories, Sub
Memorandum RA-M-06/03.
108

Snellman, M., Riekkola, R., Pettersson, S. & Bodén, A. 2003. Injection grout for deep repositories. SKB Project Plan SU324, 17.10.2003.
Vieno, T., Lehikoinen, J., Löfman, J., Nordman, H. & Mészáros, F. 2003. Assessment of disturbances caused by construction and operation of ONKALO. POSIVA 2003-06.
109

110

APPENDIX
D
Vattenfall Utveckling AB 1996-01-15 VU-SC:27
Bestämning av filterstabilitet/Determination of the filtration stability.
2
ETERMINATION OF THE FILTRATION STABILITY
111

112

DETERMINATION OF FILTRATION STABILITY
trances of cracks and at changes of crack widths arches and agglomerof the grout. This standard desc
1 SCOPE AND APPLICATIONS
At the en ates are formed which obstruct further penetration ribes a procedure to measure the abili ese formations.
This method can be used both in the d on site and it can be used to check the efficiency of the m ents.
he method can also be used to determine the pot life of the grout.
2 REFERENCES
3 EQUIPMENT
Suction device according to figure 1. Woven metal wire cloths with mesh apertures of 125, 100, 75 and 45 μm. Graduated beaker with an internal diameter of 105 ± 5 mm and a height of at least 140 mm. Thermometer with the accuracy of ± 0.1°C. Stop-watch with the accuracy of ± 1 s. Mixing equipment. Measuring cylinder, 500 ml.
ty of the grout to withstand th
laboratory anpare the abiixing and to com lity of different mixing equipm
T
Figure 1. Suction device for evaluation of filtration stability.
4 PROCEDURE
The environmental temperature and the temperature of the grout should be 20 ± 2°C, unless otherwise stated. The temperatures are measured.
113

114
he woven metal wire cloth in question (125, 100, 75 or 45 μlm) is fixed to the suction device.
The grout is poured into the vessel to the 1.0 l graduation 5 ± 1 minute after finishing of the mixing unless otherwise stated. The suction device is immersed into the grout in such a way that the bottom of the suction device is situated on the half height of the grout column. The handle of the suction device is immediately drawn up. This shall be done with a constant speed and. the whole procedure shall take 5 ± 1 second. The suction device is kept immersed in the same position for 10 ± 1 second further. Then the suction device is taken up from the vessel and the content in the suction device is pumped into the measuring vessel.
The procedure starts with the 125 μlm metal wire cloth and if the suction device is totally filled (300 ml) the procedure is repeated for the other two wire clothes otherwise it is only repeated for the next smaller wire cloth. The repetition shall be made within 3 minutes.
5 RESULTS
The volumes sucked into the device are measured in ml with the accuracy of ± 5 ml.
6 REPORT
The report must at least contain the following information. The name and composition of the grout. The date of the test. A description of the mixing equipment. The age of the grout after mixing, minutes rounded to nearest integer. The environmental temperature and the temperature of the grout, °C rounded to the nearest 0.1°C.
The mesh size and the sucked up grout, ml rounded to the nearest 5 ml.
T

APPENDIX 3
SHORT MANUAL FOR THE PENETRABILITY METER
Prepared at the division of Soil and Rock Mechanics at the Royal Institute of Technology
Per Delin
Magnus Eriksson
115

116

Short manual for the Penetrability meter
in
Prepared at the division of Soil and Rock Mechanics at the Royal Institute of Technology
Per Del
Magnus Eriksso
Description
The equipment has been develope f Soil- and Rock Mechanics with e of facilitating investigations of the penetration-ability of cement based
routs. The main principle is to press grout through filters of defined widths and measure the volume.
A pressure vessel (24 l) is filled with grout that is pressed through the filter until stop, or until a certain volume has passed (called nominal volume). The filters are mounted into cassettes which easy can be shifted so that a large number can be prepared in advance. It is also easy to take care of the so-called filter cake that remains in the cassette after the testing. The pressure vessel is equipped with a cap including a manometer, a pressure regulator, a connection for compressed air and a security valve (2 bar). It is possible to shift the cap to another one, with a stirring device that makes it possible to keep the grout in the vessel a longer time for testing the grout at different times after mixing. An outlet with a pipe sticking up inside is placed in the bottom of the vessel. A tap on the outlet has a connection to a 90o plastic pipe with rubber tightening in both ends. It is locked with a crossbar, while it might be pressed out. The cassettes, that are pushed into the other side of this holder, is sluggish enough to stand the pressure (1 bar).
Procedure
Put the equipment in a place where some grout can be spilled out. Under the outlet a wide and low bucket might be placed. The testing shall follow the steps below:
• Prepare the filter cassettes with required filter sizes for example 1, 2, 3, 4, 5 and 6 times d95 for the cement. Place first the rubber washer inside the brass nut and then the filter. Screw it up tight to the white plastic pipe connection. For a quick measuring, have a graded cylinder for each cassette.
• Remove the cap from pressure vessel and open the tap valve..
• Connect the cap to the compressed air and turn the regulator counter clockwise to unpressurized position.
• Mix the grout.
• Pour the grout into the vessel (ca 5-20 l).
• Assemble the cap.
• Turn the regulator clockwise to increase the pressure and set at 1 bar.
n
d at the division othe purposg
117

• Put the first cassette in the pipe connection. It might be convenient to turn it horizontally. Check that the crossbar is in position. Start with the finest filter and end when the nominal volume passes.
• Turn the cassette holder downwards and place a graded cylinder (0.5 or 1 l) under.
• Open the tap carefully and let the grout flow down into the graduated cylinder.
• Close the tap after 10 seconds or when the cylinder is full.
• Change cassette.
The cylinders can be read and weighed for determining density. When the cassette is dismounted the filter cake can be taken care of for determining thickness and density.
If keeping the grout in the vessel put the cap with the stirring device on. Run it on lowest or second lowest speed.
Evaluation
There are different ways to use the equipment and to evaluate the result. One way is to examine the volume that passes a certain filter for different grouts. This gives a relative comparison of the grouts ability to penetrate. Another way is to examine a specified grouts penetration-ability at different filter widths. This is how the evaluation is performed at the division of Soil and Rock Mechanics at the Royal Institute (KTH). There are advantages and disadvantages with both methods. The first method is quick and easy to perform but does not give the full behaviour of the grout. The second method is more work intensive but gives a more complete picture of the grouts behaviour.
The second method is in principle to investigate the volume that passes filters of different widths. By plotting these in a diagram with the widths on the x-axis and the volume of the y-axis the ideal curve will be as in the figure below.
V [l]
b [μm]
V 1
V2
b1 b2
V1 refers to the nominal volume that is the maximum volume in the test. This volume is decided in advance and should be large enough for examination of that particular grout. A commonly used volume at KTH is 1 litre. V2 is the smallest volume that passes any filter. This volume will more or less always pass the filter before the filter cake is dense enough to stop the flow and is often in the range of 10 - 30 ml. b1 refers to an aperture called the minimum aperture. This aperture resembles the aperture limit under which no
118

grout can pass. b2 refers to an aperture called critical aperture. This aperture resembles the aperture limit over which grout can pass without being affected by filtration. In
In the b1 and b2 a limited amount of grout will pass and a filter cake will form.
ing the grout penetration-ability in the way described above two parameters inimum and critical aperture. These parameters, and measurements
on the density of the filter cake and the filtrate can be used for comparing different
ediction of on and Varying Aperture, Tunnelling and
ound Space Technology, Vol. 15, No. 4, pp. 353-364.
nics – a
principle an infinite volume can pass this aperture (if the time aspect is ignored). range between
By evaluatare obtained, the m
grouts.
The equipment is developed with the purpose of facilitating also evaluation of the time dependent penetration-ability. This is performed by doing several series of measurements according to above on the same grout. Between the measurements (time interval around 10 – 30 minutes is recommended) the stirring device is used.
Maintenance
It is very important to clean the equipment after using. The vessel and all parts that have been in contact with grout must be taken into pieces and thoroughly washed.
Details are easy to replace while standard components mostly are used.
The filters can be cleaned and reused, but throw them away after one days use. New filters can be ordered from Silkduksfabriken in Jönköping, Sweden.
Further reading
Eriksson, M., Stille, H., Andersson, J. (2000). Numerical Calculations for PrGrout Spread with Account for FiltratiUndergr
Eriksson, M., (2001). Numerical Calculations of Grout Propagation Subjected to Filtration – Comparison to Laboratory Experiments, Proc. Rock MechaChallenge for Society, (Särkkä & Eloranta, eds.), 2001 Swets & Zeitlinger Lisse, ISBN 90 2651 821 8, pp. 567-572.
119

120

APPENDIX 4
DETAILS OF PROCEDURES FOLLOWED WHEN DETERMINING
INJECTION PROPERTIES
Anna Kronlöf
121

122

DETAILS OF PROCEDURES FO ING IN
LLOWED WHEN DETERMINJECTION PROPERTIES
1 Facility
c a b
d e Figure 1a. Tempered room. Figure 1b. Dispersing equipment. Diameter of the rotator-stabilator aggregate 30 mm. Batch volume 3 litre. Figure 1c. Marsh cone. Figure 1d. Hobart mixers for agitation. Figure 1e. Brookfield DV-III+ Rheometer. 2 Determination of filtration stability
The procedure given on Appendix 2 for determining filtration stability values was followed. Some comments to the procedure are listed below.
123

- Maintenance of the device was found crucial: The device need to be cleaned well and the rubber head of the piston greased with white Vaseline. Otherwise the results are not acceptable.
- In order to ensure a constant speed of the in-flow, a stand (Figure 2) was used to allow the use of legs in stead of arms during pulling the piston. The stand was also used while emptying the cylinder.
Figure 2. Suction device for evaluation of filtration stability (Filter pump) and a stand used to ensure constant flow rate during measurement.
3 Determination of penetration-ability by penetrability meter
The procedure given on Appendix 3 for determining Bcrit and Bmin values was followed. Some comments to the procedure are listed below. The ability of the pressure chamber to hold pressure was checked each day before starting measurements. This was done with air. When leaking was observed it was located with water and the device fixed. This gradually led to changing all original parts below the pressure chamber. Plastic parts were changed into metallic ones and new seal made. Good maintenance and constant checking is important. Otherwise the grout may flow past the sieve. The results would be very “good” (low bcrit -values), but naturally false. The sieves used were 35, 45, 63, 75, 100, 125, 144, 200, 270, 300, 360 and 400 µm. While measuring “good quality” grouts the four largest sieves (270 – 400 µm) did not need to be used because the grout run freely through them. Each sieve was washed immediately after having been removed from the device. If any precipitations was found the sieve was disqualified. The pressure chamber was washed and cooled between grouts.
124

Figure 3. Penetrability meter
Evaluation Evaluating the grout penetration-ability was done by linear fitting of the data points that lie in the ascending linear part of the diagram (Appendix 3). The maximum volume of grout run trough the largest sieve was 1000 ml. Whether that point lies in linear part or not (whether it was included or excluded from the evaluation) was checked as show in Figures 4a, 4b 5a and 5b. In each case the 1000 ml data point was excluded, if it increased the Bcrit value and included, if it decreased the value.
125

Method used
0
1200
0
200
400
0 50 100 150 200 250
Sieve, µm
600
800
100
lune
, ml
Vo
Data points used inevaluation
Data pointexcluded from eval.
Linear (Data pointsused in evaluation)
Method not used1200
0
200
400
600
0 50 100 150 200 250
Sieve, µm
Vo
800
1000
lune
, ml
Data points
Linear (Datapoints)
Figure 4a. Evaluation method used when the 1000 ml point lies outside the linear part of the plot and is excluded from the evaluation Bmin 36 µm Bcrit 147 µm
Figure 4b. Evaluation method not used when the 1000 ml point lies outside the linear part of the plot. Here the point is included in the evaluation Bmin 26 µm Bcrit 173 µm Bcrit value is larger that in Fig. 4a
Method not usedMethod used
0
200
800
1000
1200
0 50 100 150 200 250
e, m
l
400
600
Volu
n
Sieve, µm
Data points used inevaluation
Linear (Data pointsused in evaluation)
0
200
800
1000
1200
0 50 100 150 200 250
, ml
Data points
400
600
Volu
ne
Data pointexcluded from eval.Linear (Data
ints)po
Sieve, µm Figure 5a. Evaluation method used when Figure 5b. Evaluation method not used the 1000 ml point lies inside the linear part of the plot and is included in the evaluationBmin 39 µm Bcrit 154 µm
when the 1000 ml point lies inside the linear part of the plot. Here the point is excluded from the evaluation Bmin 34 µm Bcrit 168 µm The Bcrit value is larger that in Fig. 5a
Limitations with stiff grouts The amount of grout used was 5 – 6 litre. This was limited by the mixing capacity of the dispersing equipment. The batch volume was 3 litre and two batches were used for each measurement. This volume was large enough for most mixes, but in case of stiff mixes a
ecial problem occurred: sp While measuring the stiff grouts the grout did not flow down towards the outlet in the pressure chamber but remained stuck on the walls. Therefore air penetrated through the
ix to the sieve. Air pulse immmand the m
ediately cleaned any cake already formed to the sieve easurement was naturally spoiled. To avoid this in the case of stiff grouts the
126

measurement was started from sieves with the large aperture which the grout passed freely up to the maximum value of 1 litre (See Appendix 3). The pressure chamber was opened, the surface of the grout levelled down and the grout applied to the top. Also use of firm plastic sheet on the top of the grout to keep the air from penetrating to the grout was tested, but it was found unsuitable. The problem above occurred with stiff mixes, ones that needed to be rather shovelled than poured the device. Based to the experience gathered up during the experiments it can be concluded that the method is not suitable for stiff mixes. In those cases the bcrit values were approx 250 µm or more and the results should not be considered accurate. The problem above is probably particularly typical of low-pH grouts that contain large amounts of silica fume. Silica fume makes the grouts sticky which can see as high yield values (rheology).
127

128

APPENDIX 5
d pH (measured, Vuorinen
EXPERIMENTS AND RESULTS
Table 1. Mix compositions (raw materials and their proportions) and mixing order.
Table 2. Chemical compositions (calculated from raw material information as given by suppliers) anet al. 2004).
Table 3. Properties (measured).
129

130

Table 1. Mix compositions (raw materials and their proportions) and mixing order.
1095
1096
A B C D E F G H I J K L M N O P Q R S T U
a1Mix Binder
systemOPC type Slag type SF type OPC/DM SF/DM Slag /DM SF/OPC G/ OPC HAC/ OPC G/ DM SF/ DM OPC/ SL G/ SL SPL/ DM
w%Other admix. type
Other admix. /DM
Mix order
W /DM
131
1098109911001101110211031104110511061107110811091110111111121113111411151116111711181119
1120
1121112211231124
1125
1126
1127
1128
1129
1130
A B C D E F G H I J K L M N O P Q R S T UUltra fi
ct of W/DMUF16 0 GroutAid 0.77UF16 0 GroutAid 0.77
n 16 (UF16)
Effe1 0.23 0.00 0.30 0.000 0.000 0.000 0.23 - 0.00 0.00 0.00 0.00 1 1.002 0.23 0.00 0.30 0.000 0.000 0.000 0.23 - 0.00 0.00 0.00 0.00 1 1.263 UF16 0 GroutAid 0.77 0.23 0.00 0.30 0.000 0.000 0.000 0.23 - 0.00 0.00 0.00 0.00 1 1.624 - 0.00 0.00 0.00 0.00 1 2.19
Effect of mixig order and superplasticizer10 1.26
11 0 GroutAid 0.77 0.23 0.00 0.30 0.000 0.000 0.000 0.23 - 0.00 1.03 0.00 0.00 2 1.26
2 .77 0.23 0.00 0.30 0.000 0.000 0.000 0.23 - 0.00 0.00 0.00 0.00 1 1.2612 .77 0.23 0.00 0.30 0.000 0.000 0.000 0.23 - 0.00 0.00 0.00 0.00 1 1.26
9 UF16 0 GroutAid 0.77 0.23 0.00 0.30 0.000 0.000 0.000 0.23 - 0.00 0.00 0.00 0.00 2 1.2613 UF16 0 GroutAid 0.77 0.23 0.00 0.30 0.000 0.000 0.000 0.23 - 0.00 0.00 0.00 0.00 2 1.26
Effect of shotcrete accelator9 UF16 0 GroutAid 0.77 0.23 0.00 0.30 0.000 0.000 0.000 0.23 - 0.00 0.00 0.00 0.00 2 1.2613 UF16 0 GroutAid 0.77 0.23 0.00 0.30 0.000 0.000 0.000 0.23 - 0.00 0.00 0.00 0.00 2 1.26
37 UF16 0 GroutAid 0.77 0.23 0.00 0.30 0.000 0.000 0.000 0.23 - 0.00 0.00Meyco SA 161 0.50 4 1.26
38 UF16 0 GroutAid 0.77 0.23 0.00 0.30 0.000 0.000 0.000 0.23 - 0.00 0.00Meyco SA 161 1.00 4 1.27
RheoCem 900, effect of W/DM
17RheoCem900 0 GroutAid 0.77 0.23 0.00 0.30 0.000 0.000 0.000 0.23 - 0.00 0.00 0.00 0.00 1 1.26
18RheoCem900 0 GroutAid 0.77 0.23 0.00 0.30 0.000 0.000 0.000 0.23 - 0.00 0.00 0.00 0.00 1 1.54
19RheoCem900 0 GroutAid 0.77 0.23 0.00 0.30 0.000 0.000 0.000 0.23 - 0.00 0.00 0.00 0.00 1 1.96
20RheoCem900 0 GroutAid 0.77 0.23 0.00 0.30 0.000 0.000 0.000 0.23 - 0.00 0.00 0.00 0.00 2 1.26
21RheoCem900 0 GroutAid 0.77 0.23 0.00 0.30 0.000 0.000 0.000 0.23 - 0.00 0.00 0.00 0.00 2 1.54
22RheoCem900 0 GroutAid 0.77 0.23 0.00 0.30 0.000 0.000 0.000 0.23 - 0.00 0.00 0.00 0.00 2 1.96
UF16 0 GroutAid 0.79 0.21 0.00 0.26 0.000 0.000 0.000 0.21
UF16 0 GroutAid 0.77 0.23 0.00 0.30 0.000 0.000 0.000 0.23 - 0.00 1.03 0.00 0.00 1
UF16
UF16 0 GroutAid 0UF16 0 GroutAid 0

Table 1. Mix compositions (raw materials and their proportions) and mixing order.
1095
1096
A B C D E F G H I J K L M N O P Q R S T U
a1Mix Binder
systemOPC type Slag type SF type OPC/DM SF/DM Slag /DM SF/OPC G/ OPC HAC/ OPC G/ DM SF/ DM OPC/ SL G/ SL SPL/ DM
w%Other admix. type
Other admix. /DM
Mix order
W /DM
132
1133113411351136113711381139114011411142114311441145114611471148114911501151115211531154115511561157115811591160116111621163116411651166116711681169117011711172
A B C D E F G H I J K L M N O P Q R S T UPenetrability of selected previous mixes. Re-mixed for pentrability only. 10 UF16 0 GroutAid 0.77 0.23 0.00 0.30 0.000 0.000 0.000 0.23 - 0.00 1.03 0.00 1.03 1 1.2611 UF16 0 GroutAid 0.77 0.23 0.00 0.30 0.000 0.000 0.000 0.23 - 0.00 1.03 0.00 1.03 2 1.2612 UF16 0 GroutAid 0.77 0.23 0.00 0.30 0.000 0.000 0.000 0.23 - 0.00 0.00 0.00 0.00 1 1.2613 UF16 0 GroutAid 0.77 0.23 0.00 0.30 0.000 0.000 0.000 0.23 - 0.00 0.00 0.00 0.00 2 1.26
Ettringite accelerationEffect of HAC, W/DM = 1.62, SF/UF16 = 0.26, no gypsum, mixing order 113 UF16 0 0 0.77 0.23 0.00 0.30 0.000 0.000 0.000 0.23 - 0.00 0.00 0.00 0.00 1 1.62e9 UF16 0 0 0.78 0.21 0.00 0.26 0.000 0.013 0.000 0.21 - 0.00 0.00 0.00 0.98 11 1.67e1 UF16 0 0 0.78 0.20 0.00 0.26 0.000 0.025 0.000 0.20 - 0.00 0.00 0.00 1.94 11 1.65e11 UF16 0 0 0.77 0.20 0.00 0.26 0.000 0.038 0.000 0.20 - 0.00 0.00 0.00 2.88 11 1.63e3 UF16 0 0 0.76 0.20 0.00 0.26 0.000 0.050 0.000 0.20 - 0.00 0.00 0.00 3.81 11 1.62e37 UF16 0 0 0.75 0.20 0.00 0.26 0.000 0.075 0.000 0.20 - 0.00 0.00 0.00 5.61 11 1.62e5 UF16 0 0 0.73 0.19 0.00 0.26 0.000 0.100 0.000 0.19 - 0.00 0.00 0.00 7.34 11 1.56e7 UF16 0 0 0.71 0.19 0.00 0.26 0.000 0.150 0.000 0.19 - 0.00 0.00 0.00 10.62 11 1.50Effect of HAC, W/DM = 1.62, SF/UF16 = 0.26, no gypsum, mixing order 103 UF16 0 0 0.77 0.23 0.00 0.30 0.000 0.000 0.000 0.23 - 0.00 0.00 0.00 0.00 1 1.62e13 UF16 0 0 0.78 0.21 0.00 0.26 0.000 0.013 0.000 0.21 - 0.00 0.00 0.00 0.98 10 1.67e15 UF16 0 0 0.77 0.20 0.00 0.26 0.000 0.038 0.000 0.20 - 0.00 0.00 0.00 2.88 10 1.63e38 UF16 0 0 0.75 0.20 0.00 0.26 0.000 0.075 0.000 0.20 - 0.00 0.00 0.00 5.61 10 1.62Effect of HAC, W/DM = 1.62, SF/UF16 = 0.26, no gypsum, mixing order 123 UF16 0 0 0.77 0.23 0.00 0.30 0.000 0.000 0.000 0.23 - 0.00 0.00 0.00 0.00 1 1.62e14 UF16 0 0 0.78 0.21 0.00 0.26 0.000 0.013 0.000 0.21 - 0.00 0.00 0.00 0.98 12 1.67e16 UF16 0 0 0.77 0.20 0.00 0.26 0.000 0.038 0.000 0.20 - 0.00 0.00 0.00 2.88 12 1.63e39 UF16 0 0 0.75 0.20 0.00 0.26 0.000 0.075 0.000 0.20 - 0.00 0.00 0.00 5.61 12 1.62Effect of HAC, W/DM = 1.62, SF/UF16 = 0.26, no gypsum, mixing order 143 UF16 0 0 0.77 0.23 0.00 0.30 0.000 0.000 0.000 0.23 - 0.00 0.00 0.00 0.00 1 1.62e10 UF16 0 0 0.78 0.21 0.00 0.26 0.000 0.013 0.000 0.21 - 0.00 0.00 0.00 0.98 14 1.67e2 UF16 0 0 0.78 0.20 0.00 0.26 0.000 0.025 0.000 0.20 - 0.00 0.00 0.00 1.94 14 1.65e12 UF16 0 0 0.77 0.20 0.00 0.26 0.000 0.038 0.000 0.20 - 0.00 0.00 0.00 2.88 14 1.63e4 UF16 0 0 0.76 0.20 0.00 0.26 0.000 0.050 0.000 0.20 - 0.00 0.00 0.00 3.81 14 1.62e40 UF16 0 0 0.75 0.20 0.00 0.26 0.000 0.075 0.000 0.20 - 0.00 0.00 0.00 5.61 14 1.62e6 UF16 0 0 0.73 0.19 0.00 0.26 0.000 0.100 0.000 0.19 - 0.00 0.00 0.00 7.34 14 1.56e8 UF16 0 0 0.71 0.19 0.00 0.26 0.000 0.150 0.000 0.19 - 0.00 0.00 0.00 10.62 14 1.50Effect of mixing order, W/DM = 1.62, SF/UF16 = 0.26, HAC/DM = 0.01, HAC/UF16 = 0.0125, no gypsume9 UF16 0 0 0.78 0.21 0.00 0.26 0.000 0.013 0.000 0.21 - 0.00 0.00 0.00 0.98 11 1.67e13 UF16 0 0 0.78 0.21 0.00 0.26 0.000 0.013 0.000 0.21 - 0.00 0.00 0.00 0.98 10 1.67e14 UF16 0 0 0.78 0.21 0.00 0.26 0.000 0.013 0.000 0.21 - 0.00 0.00 0.00 0.98 12 1.67e10 UF16 0 0 0.78 0.21 0.00 0.26 0.000 0.013 0.000 0.21 - 0.00 0.00 0.00 0.98 14 1.67

Table 1. Mix compositions (raw materials and their proportions) and mixing order.
1095
1096
A B C D E F G H I J K L M N O P Q R S T U
a1Mix Binder
systemOPC type Slag type SF type OPC/DM SF/DM Slag /DM SF/OPC G/ OPC HAC/ OPC G/ DM SF/ DM OPC/ SL G/ SL SPL/ DM
w%Other admix. type
Other admix. /DM
Mix order
W /DM
133
1173117411751176117711781179118011811182118311841185118611871188118911901191119211931194119511961197119811991200120112021203120412051206120712081209121012111212
A B C D E F G H I J K L M N O P Q R S T UEffect of mixing order, W/DM = 1.62, SF/UF16 = 0.26, HAC/DM = 0.03, HAC/UF16 = 0.0375, no gypsume11 UF16 0 0 0.77 0.20 0.00 0.26 0.000 0.038 0.000 0.20 - 0.00 0.00 0.00 2.88 11 1.63e15 UF16 0 0 0.77 0.20 0.00 0.26 0.000 0.038 0.000 0.20 - 0.00 0.00 0.00 2.88 10 1.63e16 UF16 0 0 0.77 0.20 0.00 0.26 0.000 0.038 0.000 0.20 - 0.00 0.00 0.00 2.88 12 1.63e12 UF16 0 0 0.77 0.20 0.00 0.26 0.000 0.038 0.000 0.20 - 0.00 0.00 0.00 2.88 14 1.63Effect of mixing order, W/DM = 1.62, SF/UF16 = 0.26, HAC/DM = 0.056, HAC/UF16 = 0.075, no gypsume37 UF16 0 0 0.75 0.20 0.00 0.26 0.000 0.075 0.000 0.20 - 0.00 0.00 0.00 5.61 11 1.62e38 UF16 0 0 0.75 0.20 0.00 0.26 0.000 0.075 0.000 0.20 - 0.00 0.00 0.00 5.61 10 1.62e39 UF16 0 0 0.75 0.20 0.00 0.26 0.000 0.075 0.000 0.20 - 0.00 0.00 0.00 5.61 12 1.62e40 UF16 0 0 0.75 0.20 0.00 0.26 0.000 0.075 0.000 0.20 - 0.00 0.00 0.00 5.61 14 1.62Effect of HAC, W/DM = 1.62, SF/UF16 = 0.26, G/DM = 0.02. G/UF16 = 0.027, mixing order 213 UF16 0 0 0.77 0.23 0.00 0.30 0.000 0.000 0.000 0.23 - 0.00 0.00 0.00 0.00 1 1.62e27 UF16 0 0 0.77 0.20 0.00 0.26 0.027 0.013 0.020 0.20 - 0.00 0.00 0.00 0.96 21 1.67e17 UF16 0 0 0.75 0.20 0.00 0.26 0.027 0.050 0.020 0.20 - 0.00 0.00 0.00 3.73 21 1.62e32 UF16 0 0 0.73 0.19 0.00 0.26 0.027 0.075 0.020 0.19 - 0.00 0.00 0.00 5.50 21 1.60e22 UF16 0 0 0.72 0.19 0.00 0.26 0.027 0.100 0.019 0.19 - 0.00 0.00 0.00 7.20 21 1.57Effect of HAC, W/DM = 1.62, SF/UF16 = 0.26, G/DM = 0.02. G/UF16 = 0.027, mixing order 203 UF16 0 0 0.77 0.23 0.00 0.30 0.000 0.000 0.000 0.23 - 0.00 0.00 0.00 0.00 1 1.62e28 UF16 0 0 0.77 0.20 0.00 0.26 0.027 0.013 0.020 0.20 - 0.00 0.00 0.00 0.96 20 1.67e18 UF16 0 0 0.75 0.20 0.00 0.26 0.027 0.050 0.020 0.20 - 0.00 0.00 0.00 3.73 20 1.62e33 UF16 0 0 0.73 0.19 0.00 0.26 0.027 0.075 0.020 0.19 - 0.00 0.00 0.00 5.50 20 1.60e23 UF16 0 0 0.72 0.19 0.00 0.26 0.027 0.100 0.019 0.19 - 0.00 0.00 0.00 7.20 20 1.57Effect of HAC, W/DM = 1.62, SF/UF16 = 0.26, G/DM = 0.02. G/UF16 = 0.027, mixing order 223 UF16 0 0 0.77 0.23 0.00 0.30 0.000 0.000 0.000 0.23 - 0.00 0.00 0.00 0.00 1 1.62e29 UF16 0 0 0.77 0.20 0.00 0.26 0.027 0.013 0.020 0.20 - 0.00 0.00 0.00 0.96 22 1.67e19 UF16 0 0 0.75 0.20 0.00 0.26 0.027 0.050 0.020 0.20 - 0.00 0.00 0.00 3.73 22 1.62e34 UF16 0 0 0.73 0.19 0.00 0.26 0.027 0.075 0.020 0.19 - 0.00 0.00 0.00 5.50 22 1.60e24 UF16 0 0 0.72 0.19 0.00 0.26 0.027 0.100 0.019 0.19 - 0.00 0.00 0.00 7.20 22 1.57Effect of HAC, W/DM = 1.62, SF/UF16 = 0.26, G/DM = 0.02. G/UF16 = 0.027, mixing order 243 UF16 0 0 0.77 0.23 0.00 0.30 0.000 0.000 0.000 0.23 - 0.00 0.00 0.00 0.00 1 1.62e30 UF16 0 0 0.77 0.20 0.00 0.26 0.027 0.013 0.020 0.20 - 0.00 0.00 0.00 0.96 24 1.67e20 UF16 0 0 0.75 0.20 0.00 0.26 0.027 0.050 0.020 0.20 - 0.00 0.00 0.00 3.73 24 1.62e35 UF16 0 0 0.73 0.19 0.00 0.26 0.027 0.075 0.020 0.19 - 0.00 0.00 0.00 5.50 24 1.60e25 UF16 0 0 0.72 0.19 0.00 0.26 0.027 0.100 0.019 0.19 - 0.00 0.00 0.00 7.20 24 1.57Effect of HAC, W/DM = 1.62, SF/UF16 = 0.26, G/DM = 0.02. G/UF16 = 0.027, mixing order 263 UF16 0 0 0.77 0.23 0.00 0.30 0.000 0.000 0.000 0.23 - 0.00 0.00 0.00 0.00 1 1.62e31 UF16 0 0 0.77 0.20 0.00 0.26 0.027 0.013 0.020 0.20 - 0.00 0.00 0.00 0.96 26 1.67e21 UF16 0 0 0.75 0.20 0.00 0.26 0.027 0.050 0.020 0.20 - 0.00 0.00 0.00 3.73 26 1.62e36 UF16 0 0 0.73 0.19 0.00 0.26 0.027 0.075 0.020 0.19 - 0.00 0.00 0.00 5.50 26 1.60e26 UF16 0 0 0.72 0.19 0.00 0.26 0.027 0.100 0.019 0.19 - 0.00 0.00 0.00 7.20 26 1.57

Table 1. Mix compositions (raw materials and their proportions) and mixing order.
1095
1096
A B C D E F G H I J K L M N O P Q R S T U
a1Mix Binder
systemOPC type Slag type SF type OPC/DM SF/DM Slag /DM SF/OPC G/ OPC HAC/ OPC G/ DM SF/ DM OPC/ SL G/ SL SPL/ DM
w%Other admix. type
Other admix. /DM
Mix order
W /DM
134
1213121412151216121712181219122012211222122312241225122612271228122912301231123212331234123512361237123812391240124112421243124412451246124712481249125012511252
A B C D E F G H I J K L M N O P Q R S T UEffect of mixing order, HAC/DM = 0.01, HAC/UF16 = 0.0125, W/DM = 1.62, SF/UF16 = 0.26, G/DM = 0.02, G/UF16 = 0.0273 UF16 0 0 0.77 0.23 0.00 0.30 0.000 0.000 0.000 0.23 - 0.00 0.00 0.00 0.00 1 1.62e27 UF16 0 0 0.77 0.20 0.00 0.26 0.027 0.013 0.020 0.20 - 0.00 0.00 0.00 0.96 21 1.67e28 UF16 0 0 0.77 0.20 0.00 0.26 0.027 0.013 0.020 0.20 - 0.00 0.00 0.00 0.96 20 1.67e29 UF16 0 0 0.77 0.20 0.00 0.26 0.027 0.013 0.020 0.20 - 0.00 0.00 0.00 0.96 22 1.67e30 UF16 0 0 0.77 0.20 0.00 0.26 0.027 0.013 0.020 0.20 - 0.00 0.00 0.00 0.96 24 1.67e31 UF16 0 0 0.77 0.20 0.00 0.26 0.027 0.013 0.020 0.20 - 0.00 0.00 0.00 0.96 26 1.67Effect of mixing order, HAC/DM = 0.037, HAC/UF16 = 0.05, W/DM = 1.62, SF/UF16 = 0.26, G/DM = 0.02, G/UF16 = 0.0273 UF16 0 0 0.77 0.23 0.00 0.30 0.000 0.000 0.000 0.23 - 0.00 0.00 0.00 0.00 1 1.62e17 UF16 0 0 0.75 0.20 0.00 0.26 0.027 0.050 0.020 0.20 - 0.00 0.00 0.00 3.73 21 1.62e18 UF16 0 0 0.75 0.20 0.00 0.26 0.027 0.050 0.020 0.20 - 0.00 0.00 0.00 3.73 20 1.62e19 UF16 0 0 0.75 0.20 0.00 0.26 0.027 0.050 0.020 0.20 - 0.00 0.00 0.00 3.73 22 1.62e20 UF16 0 0 0.75 0.20 0.00 0.26 0.027 0.050 0.020 0.20 - 0.00 0.00 0.00 3.73 24 1.62e21 UF16 0 0 0.75 0.20 0.00 0.26 0.027 0.050 0.020 0.20 - 0.00 0.00 0.00 3.73 26 1.62Effect of mixing order, HAC/DM = 0.055, HAC/UF16 = 0.075, W/DM = 1.62, SF/UF16 = 0.26, G/DM = 0.02, G/UF16 = 0.0273 UF16 0 0 0.77 0.23 0.00 0.30 0.000 0.000 0.000 0.23 - 0.00 0.00 0.00 0.00 1 1.62e32 UF16 0 0 0.73 0.19 0.00 0.26 0.027 0.075 0.020 0.19 - 0.00 0.00 0.00 5.50 21 1.60e33 UF16 0 0 0.73 0.19 0.00 0.26 0.027 0.075 0.020 0.19 - 0.00 0.00 0.00 5.50 20 1.60e34 UF16 0 0 0.73 0.19 0.00 0.26 0.027 0.075 0.020 0.19 - 0.00 0.00 0.00 5.50 22 1.60e35 UF16 0 0 0.73 0.19 0.00 0.26 0.027 0.075 0.020 0.19 - 0.00 0.00 0.00 5.50 24 1.60e36 UF16 0 0 0.73 0.19 0.00 0.26 0.027 0.075 0.020 0.19 - 0.00 0.00 0.00 5.50 26 1.60Effect of mixing order, HAC/DM = 0.072, HAC/UF16 = 0.1, W/DM = 1.62, SF/UF16 = 0.26, G/DM = 0.02, G/UF16 = 0.0273 UF16 0 0 0.77 0.23 0.00 0.30 0.000 0.000 0.000 0.23 - 0.00 0.00 0.00 0.00 1 1.62e22 UF16 0 0 0.72 0.19 0.00 0.26 0.027 0.100 0.019 0.19 - 0.00 0.00 0.00 7.20 21 1.57e23 UF16 0 0 0.72 0.19 0.00 0.26 0.027 0.100 0.019 0.19 - 0.00 0.00 0.00 7.20 20 1.57e24 UF16 0 0 0.72 0.19 0.00 0.26 0.027 0.100 0.019 0.19 - 0.00 0.00 0.00 7.20 22 1.57e25 UF16 0 0 0.72 0.19 0.00 0.26 0.027 0.100 0.019 0.19 - 0.00 0.00 0.00 7.20 24 1.57e26 UF16 0 0 0.72 0.19 0.00 0.26 0.027 0.100 0.019 0.19 - 0.00 0.00 0.00 7.20 26 1.57Effect of W/DM, SF/UF16 = 0.3 - 1.25, HAC/DM = 0.03 - 0.05, HAC/UF16 = 0.075, G/DM = 0.01 - 0.02 , G/UF16 = 0.027e41 UF16 0 GroutAid 0.71 0.21 0.00 0.30 0.027 0.075 0.019 0.21 - 0.00 0.00 0.00 5.35 21 1.58e42 UF16 0 GroutAid 0.71 0.21 0.00 0.30 0.027 0.075 0.019 0.21 - 0.00 0.00 0.00 5.35 21 2.45e43 UF16 0 GroutAid 0.71 0.21 0.00 0.30 0.027 0.075 0.019 0.21 - 0.00 0.00 0.00 5.35 21 2.67e44 UF16 0 GroutAid 0.71 0.21 0.00 0.30 0.027 0.075 0.019 0.21 - 0.00 0.00 0.00 5.35 21 3.08e54 UF16 0 GroutAid 0.62 0.31 0.00 0.50 0.027 0.075 0.017 0.31 - 0.00 0.00 0.00 4.68 21 2.66e55 UF16 0 GroutAid 0.56 0.38 0.00 0.69 0.027 0.075 0.015 0.38 - 0.00 0.00 0.00 4.19 21 2.49e45 UF16 0 GroutAid 0.49 0.46 0.00 0.94 0.027 0.075 0.013 0.46 - 0.00 0.00 0.00 3.68 21 2.15e56 UF16 0 GroutAid 0.49 0.46 0.00 0.94 0.027 0.075 0.013 0.46 - 0.00 0.00 0.00 3.68 21 2.31e57 UF16 0 GroutAid 0.49 0.46 0.00 0.94 0.027 0.075 0.013 0.46 - 0.00 0.00 0.00 3.68 21 2.67e58 UF16 0 GroutAid 0.49 0.46 0.00 0.94 0.027 0.075 0.013 0.46 - 0.00 0.00 0.00 3.68 21 2.92e46 UF16 0 GroutAid 0.43 0.53 0.00 1.25 0.027 0.075 0.011 0.53 - 0.00 0.00 0.00 3.19 21 1.99

Table 1. Mix compositions (raw materials and their proportions) and mixing order.
1095
1096
A B C D E F G H I J K L M N O P Q R S T U
a1Mix Binder
systemOPC type Slag type SF type OPC/DM SF/DM Slag /DM SF/OPC G/ OPC HAC/ OPC G/ DM SF/ DM OPC/ SL G/ SL SPL/ DM
w%Other admix. type
Other admix. /DM
Mix order
W /DM
135
1253125412551256125712581259126012611262126312641265126612671268126912701271127212731274127512761277127812791280128112821283128412851286128712881289129012911292129312941295
B C D E F G H I J K L M N O P Q R S T UEffect of W/DM, SF/UF16 = 0.3 - 1.25, HAC/DM = 0.04 - 0.07, HAC/UF16 = 0.1, G/DM = 0.01 - 0.02, G/UF16 = 0.027e47 UF16 0 GroutAid 0.70 0.21 0.00 0.30 0.027 0.000 0.019 0.21 - 0.00 0.00 0.00 7.01 21 1.55e48 UF16 0 GroutAid 0.70 0.21 0.00 0.30 0.027 0.100 0.019 0.21 - 0.00 0.00 0.00 7.01 21 2.85e49 UF16 0 GroutAid 0.70 0.21 0.00 0.30 0.027 0.100 0.019 0.21 - 0.00 0.00 0.00 7.01 21 3.37e50 UF16 0 GroutAid 0.70 0.21 0.00 0.30 0.027 0.100 0.019 0.21 - 0.00 0.00 0.00 7.01 21 4.08e59 UF16 0 GroutAid 0.61 0.31 0.00 0.50 0.027 0.100 0.016 0.31 - 0.00 0.00 0.00 6.15 21 3.39e60 UF16 0 GroutAid 0.55 0.38 0.00 0.69 0.027 0.100 0.015 0.38 - 0.00 0.00 0.00 5.51 21 3.14e51 UF16 0 GroutAid 0.48 0.45 0.00 0.94 0.027 0.100 0.013 0.45 - 0.00 0.00 0.00 4.84 21 2.64e61 UF16 0 GroutAid 0.48 0.45 0.00 0.94 0.027 0.100 0.013 0.45 - 0.00 0.00 0.00 4.84 21 2.88e62 UF16 0 GroutAid 0.48 0.45 0.00 0.94 0.027 0.100 0.013 0.45 - 0.00 0.00 0.00 4.84 21 3.49e52 UF16 0 GroutAid 0.42 0.53 0.00 1.25 0.027 0.100 0.011 0.53 - 0.00 0.00 0.00 4.21 21 2.43e53 UF16 0 GroutAid 0.42 0.53 0.00 1.25 0.027 0.100 0.011 0.53 - 0.00 0.00 0.00 4.21 21 2.85Penetrability of selected mixese72 UF16 0 0 0.56 0.38 0.00 0.69 0.027 0.075 0.015 0.38 - 0.00 0.00 0.00 4.19 21 2.02f63 UF16 0 0 0.56 0.38 0.00 0.69 0.027 0.075 0.015 0.38 - 0.00 0.00 0.00 4.19 21 2.49f64 UF16 0 0 0.49 0.46 0.00 0.94 0.027 0.075 0.013 0.46 - 0.00 0.00 0.00 3.68 21 2.92f65 UF16 0 0 0.55 0.38 0.00 0.69 0.027 0.100 0.015 0.38 - 0.00 0.00 0.00 5.51 21 3.14f66 UF16 0 0 0.48 0.45 0.00 0.94 0.027 0.100 0.013 0.45 - 0.00 0.00 0.00 4.84 21 2.88Penetrability of selected mixesf67 UF16 0 0 0.57 0.39 0.00 0.69 0.000 0.075 0.000 0.39 - 0.00 0.00 0.00 4.26 21 2.52f68 UF16 0 0 0.50 0.47 0.00 0.94 0.000 0.075 0.000 0.47 - 0.00 0.00 0.00 3.73 21 2.95f69 UF16 0 0 0.56 0.38 0.00 0.69 0.000 0.100 0.000 0.38 - 0.00 0.00 0.00 5.59 21 3.18f70 UF16 0 0 0.49 0.46 0.00 0.94 0.000 0.100 0.000 0.46 - 0.00 0.00 0.00 4.91 21 2.91
Compresive strengthEffect of W/DM on compressive str., SF/UF16 = 0.3. Testing of 30 mm cylinders cast for pH-testing1 UF16 0 0 0.77 0.23 0.00 0.30 0.000 0.000 0.000 0.23 - 0.00 0.00 0.00 0.00 1 1.002 UF16 0 0 0.77 0.23 0.00 0.30 0.000 0.000 0.000 0.23 - 0.00 0.00 0.00 0.00 1 1.263 UF16 0 0 0.77 0.23 0.00 0.30 0.000 0.000 0.000 0.23 - 0.00 0.00 0.00 0.00 1 1.624 UF16 0 0 0.79 0.21 0.00 0.26 0.000 0.000 0.000 0.21 - 0.00 0.00 0.00 0.00 1 2.19Effect of W/DM on compressive str., SF/UF16 = 0.69. 40*40*160 mm specimenf63 UF16 0 0 0.56 0.38 0.00 0.69 0.027 0.075 0.015 0.38 - 0.00 0.00 0.00 4.19 21 2.49e71 UF16 0 0 0.56 0.38 0.00 0.69 0.027 0.075 0.015 0.38 - 0.00 0.00 0.00 4.19 21 2.49e72 UF16 0 0 0.56 0.38 0.00 0.69 0.027 0.075 0.015 0.38 - 0.00 0.00 0.00 4.19 21 2.02Effect of W/DM on compressive str., SF/UF16 = 0. Reference. Testing of 40*40*160 mm specimen50 UF16 0 0 1.00 0.00 0.00 0.00 0.000 0.000 0.000 0.00 - 0.00 2.00 0.00 2.00 1 2.5151 UF16 0 0 1.00 0.00 0.00 0.00 0.000 0.000 0.000 0.00 - 0.00 2.00 0.00 2.00 1 2.0152 UF16 0 GroutAid 0.93 0.07 0.00 0.08 0.000 0.000 0.000 0.07 - 0.00 0.93 0.00 0.93 1 1.21Effect of W/DM, SF/UF16 = 0,94, W/DM = 2 - 2,5 - 4. Testing of 40*40*160 mm specimenu1 UF16 0 GroutAid 0.49 0.46 0.00 0.94 0.027 0.075 0.013 0.46 - 0.00 0.00 0.00 3.68 21 2.01u2 UF16 0 GroutAid 0.49 0.46 0.00 0.94 0.027 0.075 0.013 0.46 - 0.00 0.00 0.00 3.68 21 2.51u3 UF16 0 GroutAid 0.49 0.46 0.00 0.94 0.027 0.075 0.013 0.46 - 0.00 0.00 0.00 3.68 21 4.01

Table 1. Mix compositions (raw materials and their proportions) and mixing order.
1095
1096
A B C D E F G H I J K L M N O P Q R S T U
a1Mix Binder
systemOPC type Slag type SF type OPC/DM SF/DM Slag /DM SF/OPC G/ OPC HAC/ OPC G/ DM SF/ DM OPC/ SL G/ SL SPL/ DM
w%Other admix. type
Other admix. /DM
Mix order
W /DM
136
1296129712981299130013011302130313041305130613071308130913101311131213131314
1315
13161317
1318
131913201321132213231324132513261327132813291330133113321333
B C D E F G H I J K L M N O P Q R S T UEffect of W/DM, SF/UF16 = 0,69, W/DM = 2 - 2,5 - 4. Testing of 40*40*160 mm specimenu4 UF16 0 GroutAid 0.56 0.38 0.00 0.69 0.027 0.075 0.015 0.38 - 0.00 0.00 0.00 4.19 21 2.00u5 UF16 0 GroutAid 0.56 0.38 0.00 0.69 0.027 0.075 0.015 0.38 - 0.00 0.00 0.00 4.20 21 2.51u6 UF16 0 GroutAid 0.56 0.38 0.00 0.69 0.027 0.075 0.015 0.38 - 0.00 0.00 0.00 4.19 21 4.01New UF16 batchEffect of W/DM, SF/UF16 = 0,69, W/DM = 2 - 2,5 - 4. Testing of 40*40*160 mm specimenu8 UF16 0 GroutAid 0.56 0.38 0.00 0.69 0.027 0.075 0.015 0.38 - 0.00 0.00 0.00 4.19 21 2.00u9 UF16 0 GroutAid 0.56 0.38 0.00 0.69 0.027 0.075 0.015 0.38 - 0.00 0.00 0.00 4.20 21 2.51u10 UF16 0 GroutAid 0.56 0.38 0.00 0.69 0.027 0.075 0.015 0.38 - 0.00 0.00 0.00 4.19 21 4.01
u11 UF16 0 GroutAid 0.59 0.41 0.00 0.69 0.000 0.000 0.000 0.41 - 0.00 0.00 0.00 0.00 21 2.00u12 UF16 0 GroutAid 0.59 0.41 0.00 0.69 0.000 0.000 0.000 0.41 - 0.00 0.00 0.00 0.00 21 1.60u13 UF16 0 GroutAid 0.59 0.41 0.00 0.69 0.000 0.000 0.000 0.41 - 0.00 0.00 0.00 0.00 21 1.20
White OPC from Egypt (WCE)
Effect of W/DM and SF/WCE , HAC/DM = 0.037 - 0.42, HAC/WCE = 0.075, G/DM = 0.013 - 0.015, G/WCE = 0.027
w1 WCE15 (1) 0 GroutAid 0.56 0.38 0.00 0.69 0.027 0.075 0.015 0.38 - 0.00 0.00 0.00 4.19 21 2.49
w2 WCE15 (1) 0 GroutAid 0.49 0.46 0.00 0.94 0.027 0.075 0.013 0.46 - 0.00 0.00 0.00 3.68 21 2.92Effect of W/DM and SF/WCE , HAC/DM = 0.037 - 0.42, HAC/WCE = 0.075, no gypsum
w3 WCE15 (1) 0 GroutAid 0.57 0.39 0.00 0.69 0.000 0.075 0.000 0.39 - 0.00 0.00 0.00 4.26 21 2.52
w4 WCE15 (1) 0 GroutAid 0.50 0.47 0.00 0.94 0.000 0.075 0.000 0.47 - 0.00 0.00 0.00 3.73 21 2.95
Mixing of dry SF as GroutAid with UF16. Reference, W/DM = 2.5, SF/UF16 = 0.94. G4 includes WCE, HAC and Gw5 WCE15 0 GroutAid 0.49 0.46 0.00 0.94 0.027 0.075 0.013 0.46 - 0.00 0.00 0.00 3.68 211 2.51Mixing of dry SF as dry undesified 983 with UF16, W/DM = 2.5, SF/UF16 = 0.94. G4 includes WCE, HAC and Gw6 WCE15 0 983 0.49 0.46 0.00 0.94 0.027 0.075 0.013 0.46 - 0.00 0.00 0.00 3.68 211 2.51Pre-mixing of dry SF as dry undesified 983 with UF16, W/DM = 2.5, SF/UF16 = 0.94. G3 includes WCE, HAC, G and SF (type undensified 983)w8 WCE15 0 983 0.49 0.46 0.00 0.94 0.027 0.075 0.013 0.46 - 0.00 0.00 0.00 3.68 211 2.51
Pre mixing of UF16 mixMixing of dry SF with UF16, W/DM = 2.5, SF/UF16 = 0.94Referenceu2 UF16 0 GroutAid 0.49 0.46 0.00 0.94 0.027 0.075 0.013 0.46 - 0.00 0.00 0.00 3.68 21 2.51Mixing of dry SF as un-desified 920 in the mixeru7 UF16 0 920 0.49 0.46 0.00 0.94 0.027 0.075 0.013 0.46 - 0.00 0.00 0.00 3.68 211 2.50

Table 1. Mix compositions (raw materials and their proportions) and mixing order.
1095
1096
A B C D E F G H I J K L M N O P Q R S T U
a1Mix Binder
systemOPC type Slag type SF type OPC/DM SF/DM Slag /DM SF/OPC G/ OPC HAC/ OPC G/ DM SF/ DM OPC/ SL G/ SL SPL/ DM
w%Other admix. type
Other admix. /DM
Mix order
W /DM
137
13391340134113421343134413451346134713481349135013511352135313541355135613571358135913601361136213631364136513661367136813691370137113721373137413751376137713781379
B C D E F G H I J K L M N O P Q R S T UBlast furnace slag
Effect of OPC/SL; 0.05 - 0.075 - 0.1 - 0.2, no SF, W/DM = 0.82 - 0.9227 RC10 (RapidSL10/1 0 0.05 0.00 0.95 0.00 0.000 0.000 0.000 0.00 0.05 0.00 0.00 0.00 0.00 1 0.9026 RC10 (RapidSL10/1 0 0.07 0.00 0.93 0.00 0.000 0.000 0.000 0.00 0.08 0.00 0.00 0.00 0.00 1 0.925 RC10(Rapid SL10/1 0 0.09 0.00 0.91 0.00 0.000 0.000 0.000 0.00 0.10 0.00 0.00 0.00 0.00 1 0.827 RC10(Rapid SL10/1 0 0.17 0.00 0.83 0.00 0.000 0.000 0.000 0.00 0.20 0.00 0.00 0.00 0.00 1 0.82
Effect of SPL, OPC/SL; 0.1, no SF, W/DM = 0.825 RC10(Rapid SL10/1 0 0.09 0.00 0.91 0.00 0.000 0.000 0.000 0.00 0.10 0.00 0.00 0.00 0.00 1 0.8223 RC10 (RapidSL10/1 0 0.09 0.00 0.91 0.00 0.000 0.000 0.000 0.00 0.10 0.00 0.73 0.00 0.00 1 0.82
Effect of OPC type. OPC/SL = 0.15. no SF, W/DM = 0.8215 UF16 SL10/1 0 0.13 0.00 0.87 0.00 0.000 0.000 0.000 0.00 0.15 0.00 0.00 0.00 0.00 1 0.8216 RheoCem90SL10/1 0 0.13 0.00 0.87 0.00 0.000 0.000 0.000 0.00 0.15 0.00 0.00 0.00 0.00 1 0.82
Effect of SPL, OPC/SL = 0.2. no SF, W/DM = 0.8249 RC10(Rapid SL10/1 0 0.17 0.00 0.83 0.00 0.000 0.000 0.000 0.00 0.20 0.00 0.67 0.00 0.67 1 0.827 RC10(Rapid SL10/1 0 0.17 0.00 0.83 0.00 0.000 0.000 0.000 0.00 0.20 0.00 0.00 0.00 0.00 1 0.82
Effect of mixing order with SPL, OPC/SL = 0.2. SF/DM = 0.04, W/DM = 0.8224 RC10 (RapidSL10/1 GroutAid 0.16 0.04 0.80 0.25 0.000 0.000 0.000 0.04 0.20 0.00 0.64 0.00 0.00 1 0.8325 RC10 (RapidSL10/1 GroutAid 0.16 0.04 0.80 0.25 0.000 0.000 0.000 0.04 0.20 0.00 0.64 0.00 0.00 2 0.83
Effect of mixing order without SPL, OPC/SL = 0.2. SF/DM = 0.04, W/DM = 0.828 RC10(Rapid SL10/1 GroutAid 0.16 0.04 0.80 0.25 0.000 0.000 0.000 0.04 0.20 0.00 0.00 0.00 0.00 1 0.8340 RC10(Rapid SL10/1 GroutAid 0.16 0.04 0.80 0.25 0.000 0.000 0.000 0.04 0.20 0.00 0.00 0.00 0.00 2 0.83
Effect of mixing order without SPL, OPC/SL = 0.2. SF/DM = 0.14, W/DM = 1.2546 RC10(Rapid SL10/1 GroutAid 0.14 0.14 0.71 1.00 0.000 0.000 0.000 0.14 0.20 0.00 0.00 0.00 0.00 1 1.2534 RC10(Rapid SL10/1 GroutAid 0.14 0.14 0.71 1.00 0.000 0.000 0.000 0.14 0.20 0.00 0.00 0.00 0.00 2 1.25
Effect of W/DM, no SPL, OPC/SL = 0.2. SF/DM = 0.1446 RC10(Rapid SL10/1 GroutAid 0.14 0.14 0.71 1.00 0.000 0.000 0.000 0.14 0.20 0.00 0.00 0.00 0.00 1 1.2547 RC10(Rapid SL10/1 GroutAid 0.14 0.14 0.71 1.00 0.000 0.000 0.000 0.14 0.20 0.00 0.00 0.00 0.00 1 1.18
Effect of OPC type. no SPL, OPC/SL = 0.2. SF/DM = 0.04, W/DM = 0.8332 WC10(ValkoSL10/1 GroutAid 0.16 0.04 0.80 0.25 0.000 0.000 0.000 0.04 0.20 0.00 0.00 0.00 0.00 2 0.8333 UF16 SL10/1 GroutAid 0.16 0.04 0.80 0.25 0.000 0.000 0.000 0.04 0.20 0.00 0.00 0.00 0.00 2 0.8340 RC10(Rapid SL10/1 GroutAid 0.16 0.04 0.80 0.25 0.000 0.000 0.000 0.04 0.20 0.00 0.00 0.00 0.00 2 0.83

Table 1. Mix compositions (raw materials and their proportions) and mixing order.
1095
1096
A B C D E F G H I J K L M N O P Q R S T U
a1Mix Binder
systemOPC type Slag type SF type OPC/DM SF/DM Slag /DM SF/OPC G/ OPC HAC/ OPC G/ DM SF/ DM OPC/ SL G/ SL SPL/ DM
w%Other admix. type
Other admix. /DM
Mix order
W /DM
138
13811382138313841385138613871388138913901391139213931394139513961397139813991400140114021403140414051406140714081409141014111412141314141415141614171418
A B C D E F G H I J K L M N O P Q R S T UPenetrability of selected mixes with OPC/SL = 0.28 RC10(Rapid SL10/1 GroutAid 0.16 0.04 0.80 0.25 0.000 0.000 0.000 0.04 0.20 0.00 0.00 0.00 0.00 1 0.8347 RC10(Rapid SL10/1 GroutAid 0.14 0.14 0.71 1.00 0.000 0.000 0.000 0.14 0.20 0.00 0.00 0.00 0.00 1 1.18
Effect of SPL, OPC/SL = 0.05. no SF, W/DM = 0.9148 RC10(Rapid SL10/1 0 0.05 0.00 0.95 0.00 0.000 0.000 0.000 0.00 0.05 0.00 0.76 0.00 0.76 1 0.9127 RC10 (RapidSL10/1 0 0.05 0.00 0.95 0.00 0.000 0.000 0.000 0.00 0.05 0.00 0.00 0.00 0.00 1 0.90
Effect of mixing order with SPL, OPC/SL = 0.05. SF/DM = 0.04, W/DM = 0.9129 RC10 (RapidSL10/1 GroutAid 0.05 0.05 0.91 1.00 0.000 0.000 0.000 0.05 0.05 0.00 0.73 0.00 0.00 1 0.9131 RC10 (RapidSL10/1 GroutAid 0.05 0.05 0.91 1.00 0.000 0.000 0.000 0.05 0.05 0.00 0.73 0.00 0.00 2 0.91
Effect of mixing order without SPL, OPC/SL = 0.05. SF/DM = 0.04, W/DM = 0.9128 RC10 (RapidSL10/1 GroutAid 0.05 0.05 0.91 1.00 0.000 0.000 0.000 0.05 0.05 0.00 0.00 0.00 0.00 1 0.9130 RC10 (RapidSL10/1 GroutAid 0.05 0.05 0.91 1.00 0.000 0.000 0.000 0.05 0.05 0.00 0.00 0.00 0.00 2 0.91
Effect of mixing order without SPL, OPC/SL = 0.04. SF/DM = 0.16, W/DM = 1.3644 RC10(Rapid SL10/1 GroutAid 0.04 0.16 0.80 4.00 0.000 0.000 0.000 0.16 0.05 0.00 0.00 0.00 0.00 1 1.3636 RC10(Rapid SL10/1 GroutAid 0.04 0.16 0.80 4.00 0.000 0.000 0.000 0.16 0.05 0.00 0.00 0.00 0.00 2 1.36
Effect of W/DM, no SPL, OPC/SL = 0.04. SF/DM = 0.1644 RC10(Rapid SL10/1 GroutAid 0.04 0.16 0.80 4.00 0.000 0.000 0.000 0.16 0.05 0.00 0.00 0.00 0.00 1 1.3645 RC10(Rapid SL10/1 GroutAid 0.04 0.16 0.80 4.00 0.000 0.000 0.000 0.16 0.05 0.00 0.00 0.00 0.00 1 1.28
Effect of OPC type. no SPL, OPC/SL = 0.05. SF/DM = 0.05, W/DM = 0.9135 UF16 SL10/1 GroutAid 0.05 0.05 0.91 1.00 0.000 0.000 0.000 0.05 0.05 0.00 0.00 0.00 0.00 2 0.9130 RC10 (RapidSL10/1 GroutAid 0.05 0.05 0.91 1.00 0.000 0.000 0.000 0.05 0.05 0.00 0.00 0.00 0.00 2 0.91
Penetrability of selected mixes with OPC/SL = 0.0527 RC10 (RapidSL10/1 GroutAid 0.05 0.00 0.95 0.00 0.000 0.000 0.000 0.00 0.05 0.00 0.00 0.00 0.00 1 0.9028 RC10 (RapidSL10/1 GroutAid 0.05 0.05 0.91 1.00 0.000 0.000 0.000 0.05 0.05 0.00 0.00 0.00 0.00 1 0.9144 RC10(Rapid SL10/1 GroutAid 0.04 0.16 0.80 4.00 0.000 0.000 0.000 0.16 0.05 0.00 0.00 0.00 0.00 1 1.36
Compresive strengthEffect of W/DM on compressive str., OPC/SL = 0.2. SF/DM =0 - 0.04 - 0.14 Testing of 30 mm cylinders cast for pH-testing7 RC10(Rapid SL10/1 0 0.17 0.00 0.83 0.00 0.000 0.000 0.000 0.00 0.20 0.00 0.00 0.00 0.00 1 0.828 RC10(Rapid SL10/1 GroutAid 0.16 0.04 0.80 0.25 0.000 0.000 0.000 0.04 0.20 0.00 0.00 0.00 0.00 1 0.8346 RC10(Rapid SL10/1 GroutAid 0.14 0.14 0.71 1.00 0.000 0.000 0.000 0.14 0.20 0.00 0.00 0.00 0.00 1 1.25

Table 1. Mix compositions (raw materials and their proportions) and mixing order.
1095
1096
A B C D E F G H I J K L M N O P Q R S T U
a1Mix Binder
systemOPC type Slag type SF type OPC/DM SF/DM Slag /DM SF/OPC G/ OPC HAC/ OPC G/ DM SF/ DM OPC/ SL G/ SL SPL/ DM
w%Other admix. type
Other admix. /DM
Mix order
W /DM
139
1419142014211422142314241425142614271428142914301431143214331434143514361437143814391440144114421443144414451446144714481449145014511452145314541455
A B C D E F G H I J K L M N O P Q R S T UEffect of W/DM on compressive str., OPC/SL = 0.05. SF/DM =0 - 0.05 - 0.16 Testing of 30 mm cylinders cast for pH-testing27 RC10 (RapidSL10/1 0 0.05 0.00 0.95 0.00 0.000 0.000 0.000 0.00 0.05 0.00 0.00 0.00 0.00 1 0.9028 RC10 (RapidSL10/1 GroutAid 0.05 0.05 0.91 1.00 0.000 0.000 0.000 0.05 0.05 0.00 0.00 0.00 0.00 1 0.9136 RC10(Rapid SL10/1 GroutAid 0.04 0.16 0.80 4.00 0.000 0.000 0.000 0.16 0.05 0.00 0.00 0.00 0.00 2 1.36
Blast furnace slag activationReference. OPC/SL = 0.05, SF/DM = 0,16, W/DM = 1.3644 RC10(Rapid SL10/1 GroutAid 0.04 0.16 0.80 4.00 0.000 0.000 0.000 0.16 0.05 0.00 0.00 0.00 0.00 1 1.36Reference. OPC/SL = 0.05, SF/DM = 0.3, W/DM = 1.6S0 RC10(Rapid SL15 GroutAid 0.03 0.32 0.65 10.00 0.000 0.000 0.000 0.32 0.05 0.00 0.00 0.00 0.00 21 1.60S1 RC10(Rapid SL15 GroutAid 0.03 0.32 0.65 10.00 0.000 0.000 0.000 0.32 0.05 0.00 0.00 0.00 0.00 21 1.60Effect of ETTA (HAC/G = 3), OPC/SL = 0.05, SF/DM = 0.3, W/DM = 1.6S2 RC10(Rapid SL15 GroutAid 0.03 0.31 0.63 10.00 0.200 0.583 0.006 0.31 0.05 0.01 0.00 0.00 1.84 21 1.60S3 RC10(Rapid SL15 GroutAid 0.03 0.31 0.61 10.00 0.399 1.150 0.012 0.31 0.05 0.02 0.00 0.00 3.53 21 1.60S4 RC10(Rapid SL15 GroutAid 0.03 0.30 0.60 10.00 0.599 1.750 0.018 0.30 0.05 0.03 0.00 0.00 5.25 21 1.61Effect of HAC vs. OPC, SF/DM = 0.3, W/DM = 1.6S4 RC10(Rapid SL15 GroutAid 0.03 0.30 0.60 10.00 0.599 1.750 0.018 0.30 0.05 0.03 0.00 0.00 5.25 21 1.61S5 RC10(Rapid SL15 GroutAid 0.03 0.32 0.63 10.00 0.599 0.000 0.019 0.32 0.05 0.03 0.00 0.00 0.00 21 1.70S6 RC10(Rapid SL15 GroutAid 0.00 0.31 0.62 - - - 0.019 0.31 0.00 0.03 0.00 0.00 5.41 21 1.66Effect of G/DM, OPC/SL = 0.05, SF/DM = 0.3, HAC/DM = 0.035. W/DM = 1.6S3 RC10(Rapid SL15 GroutAid 0.03 0.31 0.61 10.00 0.399 1.150 0.012 0.31 0.05 0.02 0.00 0.00 3.53 21 1.60S7 RC10(Rapid SL15 GroutAid 0.03 0.30 0.61 10.00 0.798 1.150 0.024 0.30 0.05 0.04 0.00 0.00 3.49 21 1.61S8 RC10(Rapid SL15 GroutAid 0.03 0.30 0.59 10.00 1.599 1.150 0.047 0.30 0.05 0.08 0.00 0.00 3.41 21 1.62Effect of G/DM, OPC/SL = 0.05, SF/DM = 0.3, HAC/DM = 0, W/DM = 1.6S0 RC10(Rapid SL15 GroutAid 0.03 0.32 0.65 10.00 0.000 0.000 0.000 0.32 0.05 0.00 0.00 0.00 0.00 21 1.60S1 RC10(Rapid SL15 GroutAid 0.03 0.32 0.65 10.00 0.000 0.000 0.000 0.32 0.05 0.00 0.00 0.00 0.00 21 1.60S5 RC10(Rapid SL15 GroutAid 0.03 0.32 0.63 10.00 0.599 0.000 0.019 0.32 0.05 0.03 0.00 0.00 0.00 21 1.70S9 RC10(Rapid SL15 GroutAid 0.03 0.31 0.61 10.00 1.593 0.000 0.049 0.31 0.05 0.08 0.00 0.00 0.00 21 1.62S14 RC10(Rapid SL15 GroutAid 0.03 0.29 0.59 10.00 3.186 0.000 0.093 0.29 0.05 0.16 0.00 0.00 0.00 21 1.57Effect of G/DM and NaOH, OPC/SL = 0, SF/DM = 0.3, HAC/DM = 0, W/DM = 1.6S12 RC10(Rapid SL15 GroutAid 0.00 0.30 0.60 no OPC - - 0.096 0.30 0.00 0.16 0.00 0.00 0.00 21 1.61Effect of G/DM and NaOH, OPC/SL = 0, SF/DM = 0.3, HAC/DM = 0, W/DM = 1.6S10 RC10(Rapid SL15 GroutAid 0.00 0.31 0.63 no OPC - - 0.050 0.31 0.00 0.08 1.25 NAOH 1.25 21 1.61S13 RC10(Rapid SL15 GroutAid 0.00 0.30 0.60 no OPC - - 0.095 0.30 0.00 0.16 0.60 NAOH 0.60 21 1.60Effect of G/DM and NaOH, OPC/SL = 0.05, SF/DM = 0.3, HAC/DM = 0, W/DM = 1.6S11 RC10(Rapid SL15 GroutAid 0.03 0.30 0.61 10.00 1.599 0.000 0.048 0.30 0.05 0.08 1.21 NAOH 1.21 21 1.56S15 RC10(Rapid SL15 GroutAid 0.03 0.29 0.58 10.00 3.186 0.000 0.093 0.29 0.05 0.16 0.58 NAOH 0.58 21 1.56

Table 1. Mix compositions (raw materials and their proportions) and mixing order.
1095
1096
A B C D E F G H I J K L M N O P Q R S T U
a1Mix Binder
systemOPC type Slag type SF type OPC/DM SF/DM Slag /DM SF/OPC G/ OPC HAC/ OPC G/ DM SF/ DM OPC/ SL G/ SL SPL/ DM
w%Other admix. type
Other admix. /DM
Mix order
W /DM
140
145714581459146014611462146314641465146614671468146914701471147214731474147514761477147814791480148114821483148414851486148714881489149014911492
A B C D E F G H I J K L M N O P Q R S T UEffect of OPC/SL, G/SL=0, W/DM = 1.6S17 RC10(Rapid SL10/3 GroutAid 0.03 0.32 0.65 10.00 0.000 0.000 0.000 0.32 0.05 0.00 0.00 0.00 0.00 21 1.57S20c RC10(Rapid SL10/3 GroutAid 0.06 0.31 0.63 5.00 0.000 0.000 0.000 0.31 0.10 0.00 0.00 0.00 0.00 21 1.58Effect of OPC/SL, G/SL=0.16, W/DM = 1.6S26 RC10(Rapid SL10/3 GroutAid 0.03 0.29 0.59 10.00 3.186 0.000 0.093 0.29 0.05 0.16 0.00 0.00 0.00 21 1.57S29 RC10(Rapid SL10/3 GroutAid 0.06 0.28 0.57 5.00 1.593 0.000 0.091 0.28 0.10 0.16 0.00 0.00 0.00 21 1.57Effect of OPC/SL, G/SL=0.23, W/DM = 1.6S32 RC10(Rapid SL10/3 GroutAid 0.03 0.28 0.56 10.00 4.618 0.000 0.130 0.28 0.05 0.23 0.00 0.00 0.00 21 1.57S35 RC10(Rapid SL10/3 GroutAid 0.05 0.27 0.55 5.00 2.309 0.000 0.126 0.27 0.10 0.23 0.00 0.00 0.00 21 1.57Effect of G/SL, OPC/SL=0.05,W/DM = 1.6S17 RC10(Rapid SL10/3 GroutAid 0.03 0.32 0.65 10.00 0.000 0.000 0.000 0.32 0.05 0.00 0.00 0.00 0.00 21 1.57S26 RC10(Rapid SL10/3 GroutAid 0.03 0.29 0.59 10.00 3.186 0.000 0.093 0.29 0.05 0.16 0.00 0.00 0.00 21 1.57S32 RC10(Rapid SL10/3 GroutAid 0.03 0.28 0.56 10.00 4.618 0.000 0.130 0.28 0.05 0.23 0.00 0.00 0.00 21 1.57Effect of G/SL, OPC/SL=0.1,W/DM = 1.6S20c RC10(Rapid SL10/3 GroutAid 0.06 0.31 0.63 5.00 0.000 0.000 0.000 0.31 0.10 0.00 0.00 0.00 0.00 21 1.58S29 RC10(Rapid SL10/3 GroutAid 0.06 0.28 0.57 5.00 1.593 0.000 0.091 0.28 0.10 0.16 0.00 0.00 0.00 21 1.57S35 RC10(Rapid SL10/3 GroutAid 0.05 0.27 0.55 5.00 2.309 0.000 0.126 0.27 0.10 0.23 0.00 0.00 0.00 21 1.57Effect of W/DM, OPC/SL = 0.05, G/SL=0S16 RC10(Rapid SL10/3 GroutAid 0.03 0.32 0.65 10.00 0.000 0.000 0.000 0.32 0.05 0.00 0.00 0.00 0.00 21 1.41S17 RC10(Rapid SL10/3 GroutAid 0.03 0.32 0.65 10.00 0.000 0.000 0.000 0.32 0.05 0.00 0.00 0.00 0.00 21 1.57S18 RC10(Rapid SL10/3 GroutAid 0.03 0.32 0.65 10.00 0.000 0.000 0.000 0.32 0.05 0.00 0.00 0.00 0.00 21 2.01Effect of W/DM, OPC/SL = 0.05, G/SL=0.16S44 RC10(Rapid SL10/3 GroutAid 0.03 0.29 0.59 10.00 3.185 0.000 0.093 0.29 0.05 0.16 0.00 0.00 0.00 21 1.15S45 RC10(Rapid SL10/3 GroutAid 0.03 0.29 0.59 10.00 3.186 0.000 0.093 0.29 0.05 0.16 0.00 0.00 0.00 21 1.39S25 RC10(Rapid SL10/3 GroutAid 0.03 0.29 0.59 10.00 3.186 0.000 0.093 0.29 0.05 0.16 0.00 0.00 0.00 21 1.39S26 RC10(Rapid SL10/3 GroutAid 0.03 0.29 0.59 10.00 3.186 0.000 0.093 0.29 0.05 0.16 0.00 0.00 0.00 21 1.57S27 RC10(Rapid SL10/3 GroutAid 0.03 0.29 0.59 10.01 3.189 0.000 0.093 0.29 0.05 0.16 0.00 0.00 0.00 21 2.00Effect of W/DM, OPC/SL = 0.1, G/SL=0S43 RC10(Rapid SL10/3 GroutAid 0.06 0.31 0.63 5.00 0.000 0.000 0.000 0.31 0.10 0.00 0.00 0.00 0.00 21 1.15S19 RC10(Rapid SL10/3 GroutAid 0.06 0.31 0.63 5.00 0.000 0.000 0.000 0.31 0.10 0.00 0.00 0.00 0.00 21 1.40S20c RC10(Rapid SL10/3 GroutAid 0.06 0.31 0.63 5.00 0.000 0.000 0.000 0.31 0.10 0.00 0.00 0.00 0.00 21 1.58S21 RC10(Rapid SL10/3 GroutAid 0.06 0.31 0.63 5.00 0.000 0.000 0.000 0.31 0.10 0.00 0.00 0.00 0.00 21 2.00Effect of W/DM, OPC/SL = 0.1, G/SL=0.16S46 RC10(Rapid SL10/3 GroutAid 0.06 0.28 0.57 5.00 1.593 0.000 0.091 0.28 0.10 0.16 0.00 0.00 0.00 21 1.15S47 RC10(Rapid SL10/3 GroutAid 0.06 0.28 0.57 5.00 1.593 0.000 0.091 0.28 0.10 0.16 0.00 0.00 0.00 21 1.40S29 RC10(Rapid SL10/3 GroutAid 0.06 0.28 0.57 5.00 1.593 0.000 0.091 0.28 0.10 0.16 0.00 0.00 0.00 21 1.57

Table 1. Mix compositions (raw materials and their proportions) and mixing order.
1095
1096
A B C D E F G H I J K L M N O P Q R S T U
a1Mix Binder
systemOPC type Slag type SF type OPC/DM SF/DM Slag /DM SF/OPC G/ OPC HAC/ OPC G/ DM SF/ DM OPC/ SL G/ SL SPL/ DM
w%Other admix. type
Other admix. /DM
Mix order
W /DM
141
149714981499150015011502150315041505
1506
15071508
1509
15101511
1512
15131514
1515
1516
15171518
151915201521
B C D E F G H I J K L M N O P Q R S T USuper sulf.Reference. W/DM = 0.9, OPC/SL= 0.05, G/DM = 027 RC10 (RapidSL10/1 0 0.05 0.00 0.95 0.00 0.000 0.000 0.000 0.00 0.05 0.00 0.00 0.00 0.00 1 0.90Effect of W/DM, OPC/SL= 0.05, G/DM = 0.141 RC10(Rapid SL10/1 0 0.04 0.00 0.86 0.00 2.328 0.000 0.100 0.00 0.05 0.00 0.00 0.00 0.00 5 0.7442 RC10(Rapid SL10/1 0 0.04 0.00 0.86 0.00 2.328 0.000 0.100 0.00 0.05 0.00 0.00 0.00 0.00 5 0.7843 RC10(Rapid SL10/1 0 0.04 0.00 0.86 0.00 2.328 0.000 0.100 0.00 0.05 0.00 0.00 0.00 0.00 5 0.82
Effect of W/DM and citric acid content on LAC fine mixes
L1 0 LAC fine 0 0.00 0.00 0.99 - - - - - - - - Citr. acid 0.60 211 1.49
L2 0 LAC fine 0 0.00 0.00 0.99 - - - - - - - - Citr. acid 0.89 211 1.49
L3 0 LAC fine 0 0.00 0.00 0.98 - - - - - - - - Citr. acid 1.77 211 1.96
L4 0 LAC fine 0 0.00 0.00 0.99 - - - - - - - - Citr. acid 0.89 211 1.98
L5 5min 0 LAC fine 0 0.00 0.00 0.98 - - - - - - - - Citr. acid 1.77 211 2.49
L5 0 LAC fine 0 0.00 0.00 0.98 - - - - - - - - Citr. acid 1.77 211 2.49Effect of LAC coarse content
L3 0 LAC fine 0 0.00 0.00 0.98 - - - - - - - - Citr. acid 1.77 211 1.96
L7 0
LAC fine+coarse 0 0.00 0.00 0.98 - - - - - - - - Citr. acid 1.77 211 1.96
L6 0
LAC fine+coarse 0 0.00 0.00 0.98 - - - - - - - - Citr. acid 1.77 211 1.96
LAC coarse without citric asid
L8 0LACcoarse 0 0.00 0.00 1.00 - - - - - - - - Citr. acid 0.00 211 1.00
THE END

Table 2. Chemical compositions (calculated from raw material information as given by supplier) and pH (measured, Vuorinen et al. 2004).
1095
1096
V W X Y Z AA AB AC AD AE AF AG AH AI AJ AK AL AM AN AO
Chemical compositionMix CaO
g/litre
SiO2
g/litre
Na2O eq. OPC+ NaOH+ SL+SF
g/litre
Na2O eq. OPC+NaOH+SL
g/litre
Na2O eq. OPC+NaOH
g/litre
Al2O3
g/litre
MgO
g/litre
Fe2O3
g/litre
S sulphide
g/litre
SO3
g/litre
Other
g/litre
DM tot
g/litre
CaO/ SiO2
mol/mol
SiO2
wt%
CaO +MgO
wt%
pH fresh
ALL-MR 20 oC
pH fresh ALL-MR 50 oC
pH saline OL-SR 20oC
pH saline OL-
SR 50oC
142
1098109911001101110211031104110511061107110811091110111111121113111411151116111711181119
1120
1121112211231124
1125
1126
1127
1128
1129
1130
V W X Y Z AA AB AC AD AE AF AG AH AI AJ AK AL AM AN AO
1 368 293 6.22 2.80 2.80 19.96 5.13 23.95 0.00 13.68 11.45 741.2 1.35 39.5 50.42 310 246 5.23 2.35 2.35 16.77 4.31 20.12 0.00 11.50 9.62 622.9 1.35 39.5 50.43 253 201 4.27 1.92 1.92 13.70 3.52 16.45 0.00 9.40 7.87 509.0 1.35 39.5 50.44 202 149 3.18 1.54 1.54 10.94 2.81 13.13 0.00 7.50 5.93 394.6 1.45 37.8 51.9
10 310 246 5.23 2.35 2.35 16.77 4.31 20.12 0.00 11.50 9.62 622.9 1.35 39.5 50.4
11 310 246 5.23 2.35 2.35 16.77 4.31 20.12 0.00 11.50 9.62 622.9 1.35 39.5 50.4
2 310 246 5.23 2.35 2.35 16.77 4.31 20.12 0.00 11.50 9.62 622.9 1.35 39.5 50.412 310 246 5.23 2.35 2.35 16.77 4.31 20.12 0.00 11.50 9.62 622.9 1.35 39.5 50.4 12.3 12.3 12 12
9 310 246 5.23 2.35 2.35 16.77 4.31 20.12 0.00 11.50 9.62 622.9 1.35 39.5 50.413 310 246 5.23 2.35 2.35 16.77 4.31 20.12 0.00 11.50 9.62 622.9 1.35 39.5 50.4
9 310 246 5.23 2.35 2.35 16.77 4.31 20.12 0.00 11.50 9.62 622.9 1.35 39.5 50.413 310 246 5.23 2.35 2.35 16.77 4.31 20.12 0.00 11.50 9.62 622.9 1.35 39.5 50.4
37 310 246 5.23 2.35 2.35 0.00 0.00 0.00 0.00 0.00 62.33 622.9 1.35 39.5 49.7
38 310 246 5.23 2.35 2.35 0.00 0.00 0.00 0.00 0.00 62.33 622.9 1.35 39.5 49.7
17 325 238 5.56 2.69 2.69 25.87 7.19 16.29 0.00 18.21 -13.23 622.9 1.46 38.2 53.3
18 276 203 4.73 2.28 2.28 22.01 6.11 13.86 0.00 15.49 -11.25 529.8 1.46 38.2 53.3
19 226 165 3.86 1.87 1.87 17.98 4.99 11.32 0.00 12.65 -9.19 432.8 1.46 38.2 53.3
20 325 238 5.56 2.69 2.69 25.87 7.19 16.29 0.00 18.21 -13.23 622.9 1.46 38.2 53.3
21 276 203 4.73 2.28 2.28 22.01 6.11 13.86 0.00 15.49 -11.25 529.8 1.46 38.2 53.3
22 226 165 3.86 1.87 1.87 17.98 4.99 11.32 0.00 12.65 -9.19 432.8 1.46 38.2 53.3

Table 2. Chemical compositions (calculated from raw material information as given by supplier) and pH (measured, Vuorinen et al. 2004).
1095
1096
V W X Y Z AA AB AC AD AE AF AG AH AI AJ AK AL AM AN AO
Chemical compositionMix CaO
g/litre
SiO2
g/litre
Na2O eq. OPC+ NaOH+ SL+SF
g/litre
Na2O eq. OPC+NaOH+SL
g/litre
Na2O eq. OPC+NaOH
g/litre
Al2O3
g/litre
MgO
g/litre
Fe2O3
g/litre
S sulphide
g/litre
SO3
g/litre
Other
g/litre
DM tot
g/litre
CaO/ SiO2
mol/mol
SiO2
wt%
CaO +MgO
wt%
pH fresh
ALL-MR 20 oC
pH fresh ALL-MR 50 oC
pH saline OL-SR 20oC
pH saline OL-
SR 50oC
143
1133113411351136113711381139114011411142114311441145114611471148114911501151115211531154115511561157115811591160116111621163116411651166116711681169117011711172
V W X Y Z AA AB AC AD AE AF AG AH AI AJ AK AL AM AN AO
10 310 246 5.23 2.35 2.35 16.77 4.31 20.12 0.00 11.50 9.62 622.9 1.35 39.5 50.411 310 246 5.23 2.35 2.35 16.77 4.31 20.12 0.00 11.50 9.62 622.9 1.35 39.5 50.412 310 246 5.23 2.35 2.35 16.77 4.31 20.12 0.00 11.50 9.62 622.9 1.35 39.5 50.413 310 246 5.23 2.35 2.35 16.77 4.31 20.12 0.00 11.50 9.62 622.9 1.35 39.5 50.4
3 253 201 4.27 1.92 1.92 13.70 3.52 16.45 0.00 9.40 7.87 509.0 1.35 39.5 50.4e9 253 186 3.99 1.94 1.94 17.03 3.51 16.38 0.00 9.35 7.38 496.9 1.46 37.4 51.7e1 254 186 4.00 1.96 1.96 20.39 3.50 16.36 0.00 9.34 7.36 501.0 1.47 37.1 51.4e11 255 185 4.02 1.98 1.98 23.73 3.50 16.34 0.00 9.32 7.34 505.0 1.47 36.7 51.2e3 256 185 4.04 2.00 2.00 27.07 3.49 16.33 0.00 9.31 7.32 509.0 1.48 36.4 51.0e37 255 182 4.02 2.02 2.02 33.23 3.43 16.06 0.00 9.15 7.18 509.7 1.50 35.7 50.6e5 260 184 4.11 2.09 2.09 40.31 3.47 16.26 0.00 9.25 7.25 525.0 1.52 35.1 50.2e7 264 183 4.18 2.17 2.17 53.37 3.45 16.20 0.00 9.19 7.17 540.8 1.55 33.8 49.5
3 253 201 4.27 1.92 1.92 13.70 3.52 16.45 0.00 9.40 7.87 509.0 1.35 39.5 50.4e13 253 186 3.99 1.94 1.94 17.03 3.51 16.38 0.00 9.35 7.38 496.9 1.46 37.4 51.7e15 255 185 4.02 1.98 1.98 23.73 3.50 16.34 0.00 9.32 7.34 505.0 1.47 36.7 51.2e38 255 182 4.02 2.02 2.02 33.23 3.43 16.06 0.00 9.15 7.18 509.7 1.50 35.7 50.6
3 253 201 4.27 1.92 1.92 13.70 3.52 16.45 0.00 9.40 7.87 509.0 1.35 39.5 50.4e14 253 186 3.99 1.94 1.94 17.03 3.51 16.38 0.00 9.35 7.38 496.9 1.46 37.4 51.7e16 255 185 4.02 1.98 1.98 23.73 3.50 16.34 0.00 9.32 7.34 505.0 1.47 36.7 51.2e39 255 182 4.02 2.02 2.02 33.23 3.43 16.06 0.00 9.15 7.18 509.7 1.50 35.7 50.6
3 253 201 4.27 1.92 1.92 13.70 3.52 16.45 0.00 9.40 7.87 509.0 1.35 39.5 50.4e10 253 186 3.99 1.94 1.94 17.03 3.51 16.38 0.00 9.35 7.38 496.9 1.46 37.4 51.7e2 254 186 4.00 1.96 1.96 20.39 3.50 16.36 0.00 9.34 7.36 501.0 1.47 37.1 51.4e12 255 185 4.02 1.98 1.98 23.73 3.50 16.34 0.00 9.32 7.34 505.0 1.47 36.7 51.2e4 256 185 4.04 2.00 2.00 27.07 3.49 16.33 0.00 9.31 7.32 509.0 1.48 36.4 51.0e40 255 182 4.02 2.02 2.02 33.23 3.43 16.06 0.00 9.15 7.18 509.7 1.50 35.7 50.6e6 260 184 4.11 2.09 2.09 40.31 3.47 16.26 0.00 9.25 7.25 525.0 1.52 35.1 50.2e8 264 183 4.18 2.17 2.17 53.37 3.45 16.20 0.00 9.19 7.17 540.8 1.55 33.8 49.5
e9 253 186 3.99 1.94 1.94 17.03 3.51 16.38 0.00 9.35 7.38 496.9 1.46 37.4 51.7e13 253 186 3.99 1.94 1.94 17.03 3.51 16.38 0.00 9.35 7.38 496.9 1.46 37.4 51.7e14 253 186 3.99 1.94 1.94 17.03 3.51 16.38 0.00 9.35 7.38 496.9 1.46 37.4 51.7e10 253 186 3.99 1.94 1.94 17.03 3.51 16.38 0.00 9.35 7.38 496.9 1.46 37.4 51.7

Table 2. Chemical compositions (calculated from raw material information as given by supplier) and pH (measured, Vuorinen et al. 2004).
1095
1096
V W X Y Z AA AB AC AD AE AF AG AH AI AJ AK AL AM AN AO
Chemical compositionMix CaO
g/litre
SiO2
g/litre
Na2O eq. OPC+ NaOH+ SL+SF
g/litre
Na2O eq. OPC+NaOH+SL
g/litre
Na2O eq. OPC+NaOH
g/litre
Al2O3
g/litre
MgO
g/litre
Fe2O3
g/litre
S sulphide
g/litre
SO3
g/litre
Other
g/litre
DM tot
g/litre
CaO/ SiO2
mol/mol
SiO2
wt%
CaO +MgO
wt%
pH fresh
ALL-MR 20 oC
pH fresh ALL-MR 50 oC
pH saline OL-SR 20oC
pH saline OL-
SR 50oC
144
1173117411751176117711781179118011811182118311841185118611871188118911901191119211931194119511961197119811991200120112021203120412051206120712081209121012111212
V W X Y Z AA AB AC AD AE AF AG AH AI AJ AK AL AM AN AO
e11 255 185 4.02 1.98 1.98 23.73 3.50 16.34 0.00 9.32 7.34 505.0 1.47 36.7 51.2e15 255 185 4.02 1.98 1.98 23.73 3.50 16.34 0.00 9.32 7.34 505.0 1.47 36.7 51.2e16 255 185 4.02 1.98 1.98 23.73 3.50 16.34 0.00 9.32 7.34 505.0 1.47 36.7 51.2e12 255 185 4.02 1.98 1.98 23.73 3.50 16.34 0.00 9.32 7.34 505.0 1.47 36.7 51.2
e37 255 182 4.02 2.02 2.02 33.23 3.43 16.06 0.00 9.15 7.18 509.7 1.50 35.7 50.6e38 255 182 4.02 2.02 2.02 33.23 3.43 16.06 0.00 9.15 7.18 509.7 1.50 35.7 50.6e39 255 182 4.02 2.02 2.02 33.23 3.43 16.06 0.00 9.15 7.18 509.7 1.50 35.7 50.6e40 255 182 4.02 2.02 2.02 33.23 3.43 16.06 0.00 9.15 7.18 509.7 1.50 35.7 50.6
3 253 201 4.27 1.92 1.92 13.70 3.52 16.45 0.00 9.40 7.87 509.0 1.35 39.5 50.4e27 250 182 3.89 1.89 1.89 16.63 3.42 15.99 0.00 13.83 9.34 495.2 1.48 36.7 51.3e17 253 181 3.94 1.96 1.96 26.43 3.41 15.94 0.00 13.76 9.28 507.1 1.50 35.7 50.7e32 255 180 3.98 2.00 2.00 32.92 3.40 15.91 0.00 13.72 9.23 514.9 1.52 35.0 50.3e22 257 180 4.01 2.04 2.04 39.36 3.39 15.88 0.00 13.68 9.19 522.7 1.53 34.4 49.9
3 253 201 4.27 1.92 1.92 13.70 3.52 16.45 0.00 9.40 7.87 509.0 1.35 39.5 50.4e28 250 182 3.89 1.89 1.89 16.63 3.42 15.99 0.00 13.83 9.34 495.2 1.48 36.7 51.3e18 253 181 3.94 1.96 1.96 26.43 3.41 15.94 0.00 13.76 9.28 507.1 1.50 35.7 50.7e33 255 180 3.98 2.00 2.00 32.92 3.40 15.91 0.00 13.72 9.23 514.9 1.52 35.0 50.3e23 257 180 4.01 2.04 2.04 39.36 3.39 15.88 0.00 13.68 9.19 522.7 1.53 34.4 49.9
3 253 201 4.27 1.92 1.92 13.70 3.52 16.45 0.00 9.40 7.87 509.0 1.35 39.5 50.4e29 250 182 3.89 1.89 1.89 16.63 3.42 15.99 0.00 13.83 9.34 495.2 1.48 36.7 51.3e19 253 181 3.94 1.96 1.96 26.43 3.41 15.94 0.00 13.76 9.28 507.1 1.50 35.7 50.7e34 255 180 3.98 2.00 2.00 32.92 3.40 15.91 0.00 13.72 9.23 514.9 1.52 35.0 50.3e24 257 180 4.01 2.04 2.04 39.36 3.39 15.88 0.00 13.68 9.19 522.7 1.53 34.4 49.9
3 253 201 4.27 1.92 1.92 13.70 3.52 16.45 0.00 9.40 7.87 509.0 1.35 39.5 50.4e30 250 182 3.89 1.89 1.89 16.63 3.42 15.99 0.00 13.83 9.34 495.2 1.48 36.7 51.3e20 253 181 3.94 1.96 1.96 26.43 3.41 15.94 0.00 13.76 9.28 507.1 1.50 35.7 50.7e35 255 180 3.98 2.00 2.00 32.92 3.40 15.91 0.00 13.72 9.23 514.9 1.52 35.0 50.3e25 257 180 4.01 2.04 2.04 39.36 3.39 15.88 0.00 13.68 9.19 522.7 1.53 34.4 49.9
3 253 201 4.27 1.92 1.92 13.70 3.52 16.45 0.00 9.40 7.87 509.0 1.35 39.5 50.4e31 250 182 3.89 1.89 1.89 16.63 3.42 15.99 0.00 13.83 9.34 495.2 1.48 36.7 51.3e21 253 181 3.94 1.96 1.96 26.43 3.41 15.94 0.00 13.76 9.28 507.1 1.50 35.7 50.7e36 255 180 3.98 2.00 2.00 32.92 3.40 15.91 0.00 13.72 9.23 514.9 1.52 35.0 50.3e26 257 180 4.01 2.04 2.04 39.36 3.39 15.88 0.00 13.68 9.19 522.7 1.53 34.4 49.9

Table 2. Chemical compositions (calculated from raw material information as given by supplier) and pH (measured, Vuorinen et al. 2004).
1095
1096
V W X Y Z AA AB AC AD AE AF AG AH AI AJ AK AL AM AN AO
Chemical compositionMix CaO
g/litre
SiO2
g/litre
Na2O eq. OPC+ NaOH+ SL+SF
g/litre
Na2O eq. OPC+NaOH+SL
g/litre
Na2O eq. OPC+NaOH
g/litre
Al2O3
g/litre
MgO
g/litre
Fe2O3
g/litre
S sulphide
g/litre
SO3
g/litre
Other
g/litre
DM tot
g/litre
CaO/ SiO2
mol/mol
SiO2
wt%
CaO +MgO
wt%
pH fresh
ALL-MR 20 oC
pH fresh ALL-MR 50 oC
pH saline OL-SR 20oC
pH saline OL-
SR 50oC
145
1213121412151216121712181219122012211222122312241225122612271228122912301231123212331234123512361237123812391240124112421243124412451246124712481249125012511252
V W X Y Z AA AB AC AD AE AF AG AH AI AJ AK AL AM AN AO
3 253 201 4.27 1.92 1.92 13.70 3.52 16.45 0.00 9.40 7.87 509.0 1.35 39.5 50.4e27 250 182 3.89 1.89 1.89 16.63 3.42 15.99 0.00 13.83 9.34 495.2 1.48 36.7 51.3e28 250 182 3.89 1.89 1.89 16.63 3.42 15.99 0.00 13.83 9.34 495.2 1.48 36.7 51.3e29 250 182 3.89 1.89 1.89 16.63 3.42 15.99 0.00 13.83 9.34 495.2 1.48 36.7 51.3e30 250 182 3.89 1.89 1.89 16.63 3.42 15.99 0.00 13.83 9.34 495.2 1.48 36.7 51.3e31 250 182 3.89 1.89 1.89 16.63 3.42 15.99 0.00 13.83 9.34 495.2 1.48 36.7 51.3
3 253 201 4.27 1.92 1.92 13.70 3.52 16.45 0.00 9.40 7.87 509.0 1.35 39.5 50.4e17 253 181 3.94 1.96 1.96 26.43 3.41 15.94 0.00 13.76 9.28 507.1 1.50 35.7 50.7e18 253 181 3.94 1.96 1.96 26.43 3.41 15.94 0.00 13.76 9.28 507.1 1.50 35.7 50.7e19 253 181 3.94 1.96 1.96 26.43 3.41 15.94 0.00 13.76 9.28 507.1 1.50 35.7 50.7e20 253 181 3.94 1.96 1.96 26.43 3.41 15.94 0.00 13.76 9.28 507.1 1.50 35.7 50.7e21 253 181 3.94 1.96 1.96 26.43 3.41 15.94 0.00 13.76 9.28 507.1 1.50 35.7 50.7
3 253 201 4.27 1.92 1.92 13.70 3.52 16.45 0.00 9.40 7.87 509.0 1.35 39.5 50.4e32 255 180 3.98 2.00 2.00 32.92 3.40 15.91 0.00 13.72 9.23 514.9 1.52 35.0 50.3e33 255 180 3.98 2.00 2.00 32.92 3.40 15.91 0.00 13.72 9.23 514.9 1.52 35.0 50.3e34 255 180 3.98 2.00 2.00 32.92 3.40 15.91 0.00 13.72 9.23 514.9 1.52 35.0 50.3e35 255 180 3.98 2.00 2.00 32.92 3.40 15.91 0.00 13.72 9.23 514.9 1.52 35.0 50.3e36 255 180 3.98 2.00 2.00 32.92 3.40 15.91 0.00 13.72 9.23 514.9 1.52 35.0 50.3
3 253 201 4.27 1.92 1.92 13.70 3.52 16.45 0.00 9.40 7.87 509.0 1.35 39.5 50.4e22 257 180 4.01 2.04 2.04 39.36 3.39 15.88 0.00 13.68 9.19 522.7 1.53 34.4 49.9e23 257 180 4.01 2.04 2.04 39.36 3.39 15.88 0.00 13.68 9.19 522.7 1.53 34.4 49.9e24 257 180 4.01 2.04 2.04 39.36 3.39 15.88 0.00 13.68 9.19 522.7 1.53 34.4 49.9e25 257 180 4.01 2.04 2.04 39.36 3.39 15.88 0.00 13.68 9.19 522.7 1.53 34.4 49.9e26 257 180 4.01 2.04 2.04 39.36 3.39 15.88 0.00 13.68 9.19 522.7 1.53 34.4 49.9
e41 250 190 4.18 1.96 1.96 32.25 3.33 15.59 0.00 13.44 9.46 518.4 1.41 36.6 48.9e42 172 131 2.87 1.35 1.35 22.20 2.29 10.73 0.00 9.25 6.51 356.8 1.41 36.6 48.9e43 160 121 2.67 1.25 1.25 20.62 2.13 9.97 0.00 8.59 6.05 331.5 1.41 36.6 48.9e44 141 107 2.35 1.10 1.10 18.15 1.87 8.77 0.00 7.57 5.33 291.8 1.41 36.6 48.9e54 140 145 3.16 1.09 1.09 18.00 1.86 8.70 0.00 7.50 6.52 330.6 1.03 43.9 42.8e55 132 172 3.72 1.03 1.03 17.04 1.76 8.24 0.00 7.10 7.27 349.6 0.82 49.3 38.3e45 131 217 4.66 1.03 1.03 16.91 1.75 8.18 0.00 7.05 8.67 395.5 0.65 54.9 33.6e56 123 204 4.39 0.96 0.96 15.91 1.64 7.69 0.00 6.63 8.16 372.0 0.65 54.9 33.6e57 109 180 3.86 0.85 0.85 13.99 1.44 6.76 0.00 5.83 7.17 327.3 0.65 54.9 33.6e58 101 166 3.57 0.79 0.79 12.96 1.34 6.26 0.00 5.40 6.64 302.9 0.65 54.9 33.6e46 121 252 5.40 0.94 0.94 15.54 1.60 7.51 0.00 6.48 9.64 419.1 0.51 60.2 29.2

Table 2. Chemical compositions (calculated from raw material information as given by supplier) and pH (measured, Vuorinen et al. 2004).
1095
1096
V W X Y Z AA AB AC AD AE AF AG AH AI AJ AK AL AM AN AO
Chemical compositionMix CaO
g/litre
SiO2
g/litre
Na2O eq. OPC+ NaOH+ SL+SF
g/litre
Na2O eq. OPC+NaOH+SL
g/litre
Na2O eq. OPC+NaOH
g/litre
Al2O3
g/litre
MgO
g/litre
Fe2O3
g/litre
S sulphide
g/litre
SO3
g/litre
Other
g/litre
DM tot
g/litre
CaO/ SiO2
mol/mol
SiO2
wt%
CaO +MgO
wt%
pH fresh
ALL-MR 20 oC
pH fresh ALL-MR 50 oC
pH saline OL-SR 20oC
pH saline OL-
SR 50oC
146
1253125412551256125712581259126012611262126312641265126612671268126912701271127212731274127512761277127812791280128112821283128412851286128712881289129012911292129312941295
V W X Y Z AA AB AC AD AE AF AG AH AI AJ AK AL AM AN AO
e47 252 189 4.21 2.00 2.00 38.57 3.32 15.56 0.00 13.40 9.42 526.0 1.43 36.0 48.6e48 150 113 2.50 1.19 1.19 22.93 1.97 9.25 0.00 7.97 5.60 312.7 1.43 36.0 48.6e49 129 97 2.15 1.02 1.02 19.69 1.69 7.94 0.00 6.84 4.81 268.6 1.43 36.0 48.6e50 108 81 1.81 0.86 0.86 16.57 1.43 6.69 0.00 5.76 4.05 226.0 1.43 36.0 48.6e59 112 115 2.53 0.89 0.89 17.14 1.47 6.91 0.00 5.95 5.17 266.5 1.04 43.2 42.6e60 107 138 3.01 0.85 0.85 16.41 1.41 6.62 0.00 5.70 5.83 284.5 0.83 48.6 38.2e51 110 179 3.87 0.87 0.87 16.76 1.44 6.76 0.00 5.82 7.16 330.8 0.66 54.2 33.6e61 102 166 3.59 0.80 0.80 15.52 1.34 6.26 0.00 5.39 6.63 306.3 0.66 54.2 33.6e62 86 140 3.02 0.68 0.68 13.09 1.13 5.28 0.00 4.55 5.59 258.4 0.66 54.2 33.6e52 102 212 4.54 0.81 0.81 15.63 1.34 6.30 0.00 5.43 8.07 355.0 0.52 59.6 29.2e53 89 184 3.95 0.70 0.70 13.60 1.17 5.48 0.00 4.72 7.02 308.9 0.52 59.6 29.2
e72 158 206 4.44 1.23 1.23 20.35 2.10 9.84 0.00 8.48 8.68 417.6 0.82 49.3 38.3 0 0 0 0f63 132 172 3.72 1.03 1.03 17.04 1.76 8.24 0.00 7.10 7.27 349.6 0.82 49.3 38.3 11.1 10.7 10 10.1f64 101 166 3.57 0.79 0.79 12.96 1.34 6.26 0.00 5.40 6.64 302.9 0.65 54.9 33.6 10.5 10 9.7 9.4f65 107 138 3.01 0.85 0.85 16.41 1.41 6.62 0.00 5.70 5.83 284.5 0.83 48.6 38.2f66 102 166 3.59 0.80 0.80 15.52 1.34 6.26 0.00 5.39 6.63 306.3 0.66 54.2 33.6
f67 131 173 3.74 1.04 1.04 17.12 1.77 8.28 0.00 4.71 6.21 346.1 0.81 50.0 38.4f68 100 167 3.58 0.79 0.79 13.00 1.34 6.29 0.00 3.58 5.83 300.1 0.64 55.6 33.6f69 106 139 3.02 0.85 0.85 16.47 1.42 6.64 0.00 3.78 4.97 281.5 0.82 49.3 38.3f70 101 167 3.60 0.81 0.81 15.58 1.34 6.28 0.00 3.57 5.82 303.5 0.65 54.9 33.6
0.00.0
1 368 293 6.22 2.80 2.80 19.96 5.13 23.95 0.00 13.68 11.45 741.2 1.35 39.5 50.42 310 246 5.23 2.35 2.35 16.77 4.31 20.12 0.00 11.50 9.62 622.9 1.35 39.5 50.43 253 201 4.27 1.92 1.92 13.70 3.52 16.45 0.00 9.40 7.87 509.0 1.35 39.5 50.44 202 149 3.18 1.54 1.54 10.94 2.81 13.13 0.00 7.50 5.93 394.6 1.45 37.8 51.9
f63 132 172 3.72 1.03 1.03 17.04 1.76 8.24 0.00 7.10 7.27 349.6 0.82 49.3 38.3 11.1 10.7 10 10.1e71 132 172 3.72 1.03 1.03 17.04 1.76 8.24 0.00 7.10 7.27 349.6 0.82 49.3 38.3e72 158 206 4.44 1.23 1.23 20.35 2.10 9.84 0.00 8.48 8.68 417.6 0.82 49.3 38.3
50 229 81 1.74 1.74 1.74 12.42 3.19 14.91 0.00 8.52 3.93 354.9 3.04 22.8 65.551 279 98 2.12 2.12 2.12 15.10 3.88 18.12 0.00 10.36 4.78 431.5 3.04 22.8 65.552 392 182 3.89 2.98 2.98 21.24 5.46 25.49 0.00 14.57 8.09 652.5 2.31 27.8 60.9
u1 139 229 4.93 1.08 1.08 17.87 1.84 8.64 0.00 7.45 9.16 417.9 0.65 54.9 33.6u2 115 190 4.08 0.90 0.90 14.79 1.53 7.15 0.00 6.16 7.58 345.7 0.65 54.9 33.6u3 76 125 2.69 0.59 0.59 9.75 1.01 4.71 0.00 4.07 5.00 227.9 0.65 54.9 33.6

Table 2. Chemical compositions (calculated from raw material information as given by supplier) and pH (measured, Vuorinen et al. 2004).
1095
1096
V W X Y Z AA AB AC AD AE AF AG AH AI AJ AK AL AM AN AO
Chemical compositionMix CaO
g/litre
SiO2
g/litre
Na2O eq. OPC+ NaOH+ SL+SF
g/litre
Na2O eq. OPC+NaOH+SL
g/litre
Na2O eq. OPC+NaOH
g/litre
Al2O3
g/litre
MgO
g/litre
Fe2O3
g/litre
S sulphide
g/litre
SO3
g/litre
Other
g/litre
DM tot
g/litre
CaO/ SiO2
mol/mol
SiO2
wt%
CaO +MgO
wt%
pH fresh
ALL-MR 20 oC
pH fresh ALL-MR 50 oC
pH saline OL-SR 20oC
pH saline OL-
SR 50oC
147
1296129712981299130013011302130313041305130613071308130913101311131213131314
1315
13161317
1318
131913201321132213231324132513261327132813291330133113321333
V W X Y Z AA AB AC AD AE AF AG AH AI AJ AK AL AM AN AO
u4 159 207 4.48 1.24 1.24 20.49 2.11 9.90 0.00 8.54 8.76 420.8 0.82 49.3 38.3u5 131 171 3.69 1.03 1.03 16.93 1.75 8.19 0.00 7.06 7.22 347.1 0.82 49.2 38.4u6 86 112 2.43 0.67 0.67 11.13 1.15 5.38 0.00 4.65 4.75 228.3 0.82 49.2 38.3
u8 0 0 0.00 0.00 0.00 0.00 0.00 0.00 0.00 0.00 0.00 0.0 0.00 0.0 38.3u9 0 0 0.00 0.00 0.00 0.00 0.00 0.00 0.00 0.00 0.00 0.0 0.00 0.0 38.4u10 0 0 0.00 0.00 0.00 0.00 0.00 0.00 0.00 0.00 0.00 0.0 0.00 0.0 38.3
u11 0 0 0.00 0.00 0.00 0.00 0.00 0.00 0.00 0.00 0.00 0.0 0.00 0.0 38.9u12 0 0 0.00 0.00 0.00 0.00 0.00 0.00 0.00 0.00 0.00 0.0 0.00 0.0 38.9u13 0 0 0.00 0.00 0.00 0.00 0.00 0.00 0.00 0.00 0.00 0.0 0.00 0.0 38.9
w1 139 175 2.90 0.21 0.21 15.48 0.51 0.42 0.00 7.41 9.62 349.6 0.85 50.0 39.8 11.2 11.3 10.1 10.5
w2 105 168 2.95 0.16 0.16 11.77 0.39 0.32 0.00 5.64 8.43 302.9 0.67 55.5 34.9 10.7 10.7 9.8 9.7
w3 137 176 2.91 0.21 0.21 15.55 0.51 0.42 0.00 5.03 8.56 346.1 0.84 50.7 39.9
w4 104 169 2.96 0.16 0.16 11.81 0.39 0.32 0.00 3.82 7.62 300.1 0.66 56.2 34.9
w5 120 192 3.36 0.18 0.18 13.43 0.44 0.36 0.00 6.43 9.62 345.7 0.67 55.5 34.9
w6 120 197 0.55 0.18 0.18 13.91 0.60 0.44 0.00 6.75 5.99 345.7 0.65 57.1 34.9
w8 120 197 0.55 0.18 0.18 13.91 0.60 0.44 0.00 6.75 5.99 345.7 0.65 57.1 34.9
u2 115 190 4.08 0.90 0.90 14.79 1.53 7.15 0.00 6.16 7.58 345.7 0.65 54.9 33.6
u7 115 193 1.81 0.90 0.90 14.81 1.53 7.16 0.00 6.17 7.16 346.4 0.64 55.7 33.6

Table 2. Chemical compositions (calculated from raw material information as given by supplier) and pH (measured, Vuorinen et al. 2004).
1095
1096
V W X Y Z AA AB AC AD AE AF AG AH AI AJ AK AL AM AN AO
Chemical compositionMix CaO
g/litre
SiO2
g/litre
Na2O eq. OPC+ NaOH+ SL+SF
g/litre
Na2O eq. OPC+NaOH+SL
g/litre
Na2O eq. OPC+NaOH
g/litre
Al2O3
g/litre
MgO
g/litre
Fe2O3
g/litre
S sulphide
g/litre
SO3
g/litre
Other
g/litre
DM tot
g/litre
CaO/ SiO2
mol/mol
SiO2
wt%
CaO +MgO
wt%
pH fresh
ALL-MR 20 oC
pH fresh ALL-MR 50 oC
pH saline OL-SR 20oC
pH saline OL-
SR 50oC
148
13391340134113421343134413451346134713481349135013511352135313541355135613571358135913601361136213631364136513661367136813691370137113721373137413751376137713781379
V W X Y Z AA AB AC AD AE AF AG AH AI AJ AK AL AM AN AO
27 325 285 12.02 12.02 0.53 75.08 74.47 10.43 10.01 1.15 15.04 808.2 1.22 35.3 49.426 326 280 11.89 11.89 0.77 73.63 72.74 10.62 9.69 1.68 14.41 801.0 1.25 35.0 49.85 359 301 12.88 12.88 1.09 79.13 77.86 11.82 10.28 2.37 15.14 869.5 1.28 34.6 50.27 375 291 12.79 12.79 1.99 76.13 73.82 12.85 9.41 4.34 13.29 868.4 1.38 33.5 51.7
5 359 301 12.88 12.88 1.09 79.13 77.86 11.82 10.28 2.37 15.14 869.5 1.28 34.6 50.223 359 301 12.88 12.88 1.09 79.13 77.86 11.82 10.28 2.37 15.14 869.5 1.28 34.6 50.2
15 369 298 11.85 11.85 0.56 75.89 72.94 13.97 9.84 2.73 16.34 870.6 1.32 34.3 50.716 372 297 11.93 11.93 0.64 78.05 73.62 13.06 9.84 4.32 10.93 870.6 1.34 34.1 51.2
49 375 291 12.79 12.79 1.99 76.13 73.82 12.85 9.41 4.34 13.29 868.4 1.38 33.5 51.77 375 291 12.79 12.79 1.99 76.13 73.82 12.85 9.41 4.34 13.29 868.4 1.38 33.5 51.7
24 356 309 12.84 12.15 1.89 72.32 70.12 12.20 8.94 4.12 13.66 859.4 1.23 36.0 49.625 356 309 12.84 12.15 1.89 72.32 70.12 12.20 8.94 4.12 13.66 859.4 1.23 36.0 49.6
8 356 309 12.84 12.15 1.89 72.32 70.12 12.20 8.94 4.12 13.66 859.4 1.23 36.0 49.640 356 309 12.84 12.15 1.89 72.32 70.12 12.20 8.94 4.12 13.66 859.4 1.23 36.0 49.6
46 231 265 9.69 7.90 1.23 47.01 45.58 7.93 5.81 2.68 10.89 625.6 0.94 42.3 44.334 231 265 9.69 7.90 1.23 47.01 45.58 7.93 5.81 2.68 10.89 625.6 0.94 42.3 44.3
46 231 265 9.69 7.90 1.23 47.01 45.58 7.93 5.81 2.68 10.89 625.6 0.94 42.3 44.347 242 277 10.14 8.27 1.29 49.21 47.71 8.30 6.08 2.81 11.40 654.9 0.94 42.3 44.3
32 363 315 11.27 10.59 0.33 67.92 66.10 8.79 8.94 2.89 15.93 859.4 1.24 36.6 49.933 357 312 11.62 10.93 0.68 70.12 66.55 14.13 8.94 3.30 16.25 859.4 1.23 36.2 49.340 356 309 12.84 12.15 1.89 72.32 70.12 12.20 8.94 4.12 13.66 859.4 1.23 36.0 49.6

Table 2. Chemical compositions (calculated from raw material information as given by supplier) and pH (measured, Vuorinen et al. 2004).
1095
1096
V W X Y Z AA AB AC AD AE AF AG AH AI AJ AK AL AM AN AO
Chemical compositionMix CaO
g/litre
SiO2
g/litre
Na2O eq. OPC+ NaOH+ SL+SF
g/litre
Na2O eq. OPC+NaOH+SL
g/litre
Na2O eq. OPC+NaOH
g/litre
Al2O3
g/litre
MgO
g/litre
Fe2O3
g/litre
S sulphide
g/litre
SO3
g/litre
Other
g/litre
DM tot
g/litre
CaO/ SiO2
mol/mol
SiO2
wt%
CaO +MgO
wt%
pH fresh
ALL-MR 20 oC
pH fresh ALL-MR 50 oC
pH saline OL-SR 20oC
pH saline OL-
SR 50oC
149
13811382138313841385138613871388138913901391139213931394139513961397139813991400140114021403140414051406140714081409141014111412141314141415141614171418
V W X Y Z AA AB AC AD AE AF AG AH AI AJ AK AL AM AN AO
8 356 309 12.84 12.15 1.89 72.32 70.12 12.20 8.94 4.12 13.66 859.4 1.23 36.0 49.647 242 277 10.14 8.27 1.29 49.21 47.71 8.30 6.08 2.81 11.40 654.9 0.94 42.3 44.3
48 325 285 12.02 12.02 0.53 75.08 74.47 10.43 10.01 1.15 15.04 808.2 1.22 35.3 49.427 325 285 12.02 12.02 0.53 75.08 74.47 10.43 10.01 1.15 15.04 808.2 1.22 35.3 49.4
29 308 305 12.11 11.38 0.50 71.10 70.52 9.88 9.48 1.09 15.33 801.8 1.08 38.0 47.231 308 305 12.11 11.38 0.50 71.10 70.52 9.88 9.48 1.09 15.33 801.8 1.08 38.0 47.2
28 308 305 12.11 11.38 0.50 71.10 70.52 9.88 9.48 1.09 15.33 801.8 1.08 38.0 47.230 308 305 12.11 11.38 0.50 71.10 70.52 9.88 9.48 1.09 15.33 801.8 1.08 38.0 47.2
44 197 262 9.16 7.29 0.32 45.58 45.21 6.33 6.07 0.70 11.93 584.1 0.81 44.8 41.5 11.4 11.3 10.6 10.636 197 262 9.16 7.29 0.32 45.58 45.21 6.33 6.07 0.70 11.93 584.1 0.81 44.8 41.5
44 197 262 9.16 7.29 0.32 45.58 45.21 6.33 6.07 0.70 11.93 584.1 0.81 44.8 41.5 11.4 11.3 10.6 10.645 207 275 9.61 7.65 0.34 47.82 47.42 6.64 6.37 0.74 12.52 612.7 0.81 44.8 41.5
35 308 305 11.78 11.06 0.18 70.52 69.57 10.39 9.48 0.87 16.02 801.8 1.08 38.1 47.130 308 305 12.11 11.38 0.50 71.10 70.52 9.88 9.48 1.09 15.33 801.8 1.08 38.0 47.2
27 325 285 12.02 12.02 0.53 75.08 74.47 10.43 10.01 1.15 15.04 808.2 1.22 35.3 49.428 308 305 12.11 11.38 0.50 71.10 70.52 9.88 9.48 1.09 15.33 801.8 1.08 38.0 47.244 197 262 9.16 7.29 0.32 45.58 45.21 6.33 6.07 0.70 11.93 584.1 0.81 44.8 41.5
7 375 291 12.79 12.79 1.99 76.13 73.82 12.85 9.41 4.34 13.29 868.4 1.38 33.5 51.78 356 309 12.84 12.15 1.89 72.32 70.12 12.20 8.94 4.12 13.66 859.4 1.23 36.0 49.646 231 265 9.69 7.90 1.23 47.01 45.58 7.93 5.81 2.68 10.89 625.6 0.94 42.3 44.3

Table 2. Chemical compositions (calculated from raw material information as given by supplier) and pH (measured, Vuorinen et al. 2004).
1095
1096
V W X Y Z AA AB AC AD AE AF AG AH AI AJ AK AL AM AN AO
Chemical compositionMix CaO
g/litre
SiO2
g/litre
Na2O eq. OPC+ NaOH+ SL+SF
g/litre
Na2O eq. OPC+NaOH+SL
g/litre
Na2O eq. OPC+NaOH
g/litre
Al2O3
g/litre
MgO
g/litre
Fe2O3
g/litre
S sulphide
g/litre
SO3
g/litre
Other
g/litre
DM tot
g/litre
CaO/ SiO2
mol/mol
SiO2
wt%
CaO +MgO
wt%
pH fresh
ALL-MR 20 oC
pH fresh ALL-MR 50 oC
pH saline OL-SR 20oC
pH saline OL-
SR 50oC
150
1419142014211422142314241425142614271428142914301431143214331434143514361437143814391440144114421443144414451446144714481449145014511452145314541455
V W X Y Z AA AB AC AD AE AF AG AH AI AJ AK AL AM AN AO
27 325 285 12.02 12.02 0.53 75.08 74.47 10.43 10.01 1.15 15.04 808.2 1.22 35.3 49.428 308 305 12.11 11.38 0.50 71.10 70.52 9.88 9.48 1.09 15.33 801.8 1.08 38.0 47.236 197 262 9.16 7.29 0.32 45.58 45.21 6.33 6.07 0.70 11.93 584.1 0.81 44.8 41.5
44 197 262 9.16 7.29 0.32 45.58 45.21 6.33 6.07 0.70 11.93 584.1 0.81 44.8 41.5
S0 138 277 8.38 5.11 0.23 31.92 31.66 4.44 4.25 0.49 11.30 507.3 0.53 54.5 33.5S1 138 277 8.39 5.12 0.23 31.97 31.71 4.44 4.26 0.49 11.32 508.0 0.53 54.5 33.5
S2 138 270 8.21 5.02 0.27 37.57 30.84 4.34 4.14 1.95 11.67 506.5 0.55 53.2 33.4S3 139 263 8.06 4.95 0.30 42.80 30.10 4.25 4.04 3.35 12.03 506.3 0.56 52.0 33.3S4 139 256 7.89 4.86 0.34 48.01 29.32 4.16 3.94 4.66 12.34 505.2 0.58 50.7 33.2
S4 139 256 7.89 4.86 0.34 48.01 29.32 4.16 3.94 4.66 12.34 505.2 0.58 50.7 33.2S5 132 258 7.83 4.77 0.21 29.82 29.58 4.14 3.97 4.70 12.49 483.0 0.55 53.5 33.4S6 130 254 7.72 4.68 0.13 47.47 28.92 3.75 3.96 4.23 12.51 492.5 0.55 51.6 32.2
S3 139 263 8.06 4.95 0.30 42.80 30.10 4.25 4.04 3.35 12.03 506.3 0.56 52.0 33.3S7 138 259 7.92 4.86 0.30 42.09 29.60 4.18 3.98 6.12 13.11 504.0 0.57 51.3 33.3S8 138 252 7.71 4.73 0.29 40.97 28.81 4.07 3.87 11.49 15.28 502.5 0.59 50.1 33.3
S0 138 277 8.38 5.11 0.23 31.92 31.66 4.44 4.25 0.49 11.30 507.3 0.53 54.5 33.5S1 138 277 8.39 5.12 0.23 31.97 31.71 4.44 4.26 0.49 11.32 508.0 0.53 54.5 33.5S5 132 258 7.83 4.77 0.21 29.82 29.58 4.14 3.97 4.70 12.49 483.0 0.55 53.5 33.4S9 138 260 7.87 4.80 0.21 29.97 29.72 4.16 3.99 11.82 15.77 500.6 0.57 51.9 33.4S14 142 254 7.69 4.69 0.21 29.30 29.06 4.07 3.90 22.65 20.46 513.4 0.60 49.5 33.4
S12 134 254 7.57 4.53 0.00 28.85 28.85 3.69 3.95 22.45 20.81 503.9 0.57 50.3 32.4
S10 132 265 12.81 9.64 4.91 30.10 30.10 3.85 4.12 11.75 17.83 506.9 0.53 52.2 31.9S13 134 254 9.92 6.88 2.35 28.85 28.85 3.69 3.95 22.45 21.49 507.0 0.57 50.0 32.2
S11 141 267 12.96 9.81 5.10 30.75 30.50 4.27 4.10 12.17 17.62 520.2 0.57 51.2 33.0S15 142 254 10.02 7.02 2.53 29.30 29.06 4.07 3.90 22.65 21.14 516.4 0.60 49.2 33.2

Table 2. Chemical compositions (calculated from raw material information as given by supplier) and pH (measured, Vuorinen et al. 2004).
1095
1096
V W X Y Z AA AB AC AD AE AF AG AH AI AJ AK AL AM AN AO
Chemical compositionMix CaO
g/litre
SiO2
g/litre
Na2O eq. OPC+ NaOH+ SL+SF
g/litre
Na2O eq. OPC+NaOH+SL
g/litre
Na2O eq. OPC+NaOH
g/litre
Al2O3
g/litre
MgO
g/litre
Fe2O3
g/litre
S sulphide
g/litre
SO3
g/litre
Other
g/litre
DM tot
g/litre
CaO/ SiO2
mol/mol
SiO2
wt%
CaO +MgO
wt%
pH fresh
ALL-MR 20 oC
pH fresh ALL-MR 50 oC
pH saline OL-SR 20oC
pH saline OL-
SR 50oC
151
145714581459146014611462146314641465146614671468146914701471147214731474147514761477147814791480148114821483148414851486148714881489149014911492
V W X Y Z AA AB AC AD AE AF AG AH AI AJ AK AL AM AN AO
S17 140 281 8.50 5.18 0.23 32.37 32.10 4.50 4.31 0.50 11.46 514.3 0.53 54.5 33.5S20c 146 275 8.45 5.24 0.44 32.15 31.64 4.80 4.18 0.96 10.97 513.9 0.57 53.5 34.5
S26 142 254 7.69 4.69 0.21 29.30 29.06 4.07 3.90 22.65 20.46 513.4 0.60 49.5 33.4S29 148 250 7.67 4.75 0.40 29.19 28.73 4.36 3.79 22.44 19.75 513.1 0.63 48.7 34.3
S32 143 243 7.36 4.49 0.20 28.03 27.80 3.89 3.74 31.22 23.91 511.8 0.63 47.5 33.3S35 148 240 7.36 4.56 0.39 28.03 27.58 4.19 3.64 30.84 23.19 512.7 0.66 46.8 34.3
S17 140 281 8.50 5.18 0.23 32.37 32.10 4.50 4.31 0.50 11.46 514.3 0.53 54.5 33.5S26 142 254 7.69 4.69 0.21 29.30 29.06 4.07 3.90 22.65 20.46 513.4 0.60 49.5 33.4S32 143 243 7.36 4.49 0.20 28.03 27.80 3.89 3.74 31.22 23.91 511.8 0.63 47.5 33.3
S20c 146 275 8.45 5.24 0.44 32.15 31.64 4.80 4.18 0.96 10.97 513.9 0.57 53.5 34.5S29 148 250 7.67 4.75 0.40 29.19 28.73 4.36 3.79 22.44 19.75 513.1 0.63 48.7 34.3S35 148 240 7.36 4.56 0.39 28.03 27.58 4.19 3.64 30.84 23.19 512.7 0.66 46.8 34.3
S16 153 306 9.28 5.66 0.25 35.35 35.06 4.91 4.71 0.54 12.52 561.8 0.53 54.5 33.5S17 140 281 8.50 5.18 0.23 32.37 32.10 4.50 4.31 0.50 11.46 514.3 0.53 54.5 33.5S18 114 229 6.95 4.23 0.19 26.46 26.24 3.68 3.53 0.41 9.37 420.4 0.53 54.5 33.5
S44 181 323 9.78 5.96 0.26 37.27 36.96 5.18 4.97 28.81 26.02 653.0 0.60 49.5 33.4S45 157 280 8.47 5.16 0.23 32.25 31.99 4.48 4.30 24.94 22.52 565.1 0.60 49.5 33.4S25 157 280 8.47 5.16 0.23 32.25 31.99 4.48 4.30 24.94 22.52 565.1 0.60 49.5 33.4S26 142 254 7.69 4.69 0.21 29.30 29.06 4.07 3.90 22.65 20.46 513.4 0.60 49.5 33.4S27 116 208 6.29 3.84 0.17 23.98 23.78 3.33 3.20 18.54 16.75 420.1 0.60 49.5 33.4
S43 186 352 10.80 6.69 0.57 41.10 40.45 6.14 5.34 1.23 14.02 657.0 0.57 53.5 34.5S19 160 302 9.27 5.74 0.49 35.28 34.72 5.27 4.58 1.06 12.04 563.9 0.57 53.5 34.5S20c 146 275 8.45 5.24 0.44 32.15 31.64 4.80 4.18 0.96 10.97 513.9 0.57 53.5 34.5S21 120 225 6.92 4.29 0.36 26.35 25.93 3.94 3.42 0.79 8.99 421.3 0.57 53.5 34.5
S46 188 319 9.80 6.07 0.51 37.28 36.69 5.57 4.84 28.65 25.23 655.3 0.63 48.7 34.3S47 162 275 8.44 5.23 0.44 32.12 31.61 4.80 4.17 24.69 21.74 564.6 0.63 48.7 34.3S29 148 250 7.67 4.75 0.40 29.19 28.73 4.36 3.79 22.44 19.75 513.1 0.63 48.7 34.3

Table 2. Chemical compositions (calculated from raw material information as given by supplier) and pH (measured, Vuorinen et al. 2004).
1095
1096
V W X Y Z AA AB AC AD AE AF AG AH AI AJ AK AL AM AN AO
Chemical compositionMix CaO
g/litre
SiO2
g/litre
Na2O eq. OPC+ NaOH+ SL+SF
g/litre
Na2O eq. OPC+NaOH+SL
g/litre
Na2O eq. OPC+NaOH
g/litre
Al2O3
g/litre
MgO
g/litre
Fe2O3
g/litre
S sulphide
g/litre
SO3
g/litre
Other
g/litre
DM tot
g/litre
CaO/ SiO2
mol/mol
SiO2
wt%
CaO +MgO
wt%
pH fresh
ALL-MR 20 oC
pH fresh ALL-MR 50 oC
pH saline OL-SR 20oC
pH saline OL-
SR 50oC
152
149714981499150015011502150315041505
1506
15071508
1509
15101511
1512
15131514
1515
1516
15171518
151915201521
V W X Y Z AA AB AC AD AE AF AG AH AI AJ AK AL AM AN AO
27 325 285 12.02 - - 75.08 74.47 10.43 10.01 1.15 15.04 808.2 1.22 35.3 49.4
41 366 295 12.41 - - 77.54 76.91 10.77 10.33 44.12 35.03 927.2 1.33 31.8 47.742 352 283 11.93 - - 74.58 73.97 10.36 9.94 42.43 33.69 891.7 1.33 31.8 47.743 339 273 11.50 - - 71.83 71.24 9.98 9.57 40.87 32.45 858.9 1.33 31.8 47.7
L1 207 99 1.17 - - 92.05 12.24 4.46 123.11 8.24 547.3 2.25 18.1 40.1
L2 207 99 1.17 - - 92.00 12.23 4.46 123.04 9.87 548.6 2.25 18.0 40.0
L3 163 78 0.92 - - 72.33 9.62 3.51 96.74 11.60 435.2 2.25 17.8 39.6
L4 163 78 0.92 - - 72.60 9.65 3.52 97.10 7.79 432.9 2.25 18.0 40.0
L5 5min 132 63 0.75 - - 58.80 7.82 2.85 78.64 9.43 353.7 2.25 17.8 39.6
L5 132 63 0.75 - - 58.80 7.82 2.85 78.64 9.43 353.7 2.25 17.8 39.6
L3 163 78 0.92 - - 72.33 9.62 3.51 96.74 11.60 435.2 2.25 17.8 39.6
L7 163 78 0.92 - - 72.33 9.62 3.51 96.74 11.60 435.2 2.25 17.8 39.6
L6 163 78 0.92 - - 72.33 9.62 3.51 96.74 11.60 435.2 2.25 17.8 39.6
L8 286 136 1.62 - - 126.90 16.88 6.15 169.73 6.86 750.0 2.25 18.2 40.3 11 10.5
THE END

Table 3. Properties (measured).
1095
1096
AP AQ AR AS AT AU AV AW AX AY AZ BA BB BC BD BE
Bleeding Setting Compressive str Filter pump Penetrability RheologyMix 2h, % Shear str,
6h, kPa Shear str, 24h, kPa
28 d, MPa 91 d, MPa About 3 month *)
100 um 80 um B min B crit Yield, Bing. 1h Pa
Yield Cass. 1h, Pa
Visc Bing. 1h, mPas
Visk Cass. 1h, mPas
Marsh, s
153
1098109911001101110211031104110511061107110811091110111111121113111411151116111711181119
1120
1121112211231124
1125
1126
1127
1128
1129
1130
AP AQ AR AS AT AU AV AW AX AY AZ BA BB BC BD BE*) Tested with specimen cast for pH test.
1 0 2.8 245 17.7 290 48.9 43.0 130.8 42.82 0 1.0 245 15.6 300 22.3 16.1 51.0 15.33 0 0.6 38 7.9 310 10.0 7.2 32.5 10.14 1 0.0 245 3.9 310 3.2 2.3 12.7 4.1
10 0.5 1.3 245 300 22.9 17.7 42.4 10.4
11 5 0.0 114 300 7.0 4.9 26.1 8.6
2 0 1.0 245 15.6 300 22.3 16.1 51.0 15.312 0 0.2 245 300 21.6 14.9 54.6 18.2
9 0 0.0 245 200 7.7 5.5 23.7 7.413 4 0.0 157 10.6 310 7.3 5.3 23.4 7.0
9 0 0.0 245 200 7.7 5.5 23.7 7.413 4 0.0 157 10.6 310 7.3 5.3 23.4 7.0
37 2 0.0 196 20 12.1 8.3 39.8 13.3
38 1 0.0 245 10 14.7 9.8 45.9 15.9
17 0 6.2 40 x x x x
18 0 7.5 50 x x x x
19 0.5 0.6 60 x x x x
20 0 6.2 80 70 x x x x
21 0.5 1.6 40 2.1 1.4 11.7 4.6
22 5 0.2 40 40 1.0 0.6 6.8 3.1

Table 3. Properties (measured).
1095
1096
AP AQ AR AS AT AU AV AW AX AY AZ BA BB BC BD BE
Bleeding Setting Compressive str Filter pump Penetrability RheologyMix 2h, % Shear str,
6h, kPa Shear str, 24h, kPa
28 d, MPa 91 d, MPa About 3 month *)
100 um 80 um B min B crit Yield, Bing. 1h Pa
Yield Cass. 1h, Pa
Visc Bing. 1h, mPas
Visk Cass. 1h, mPas
Marsh, s
154
1133113411351136113711381139114011411142114311441145114611471148114911501151115211531154115511561157115811591160116111621163116411651166116711681169117011711172
AP AQ AR AS AT AU AV AW AX AY AZ BA BB BC BD BE
10 38 9111 48 11812 63 10813 41 97
3 0 0.6 38 7.9 310 10.0 7.2 32.5 10.1e9 0 10.7 310e1 0 4.1 190e11 0 6.5 310e3 0 7.7 300e37 0 37.7 10e5 0 42.4 90e7 0 66.7 0
3 0 0.6 38 7.9 310 10.0 7.2 32.5 10.1e13 0 0.2 260e15 0 0.8 90e38 0 6.5 60
3 0 0.6 38 7.9 310 10.0 7.2 32.5 10.1e14 0 0.0 300e16 0 2.8 310e39 0 4.4 10
3 0 0.6 38 7.9 310 10.0 7.2 32.5 10.1e10 0 0.0 150e2 0 1.5 80e12 0 1.8 90e4 0 4.4 40e40 0 14.3 60e6 0 37.7 20e8 0 34.8 0
e9 0 10.7 310e13 0 0.2 260e14 0 0.0 300e10 0 0.0 150

Table 3. Properties (measured).
1095
1096
AP AQ AR AS AT AU AV AW AX AY AZ BA BB BC BD BE
Bleeding Setting Compressive str Filter pump Penetrability RheologyMix 2h, % Shear str,
6h, kPa Shear str, 24h, kPa
28 d, MPa 91 d, MPa About 3 month *)
100 um 80 um B min B crit Yield, Bing. 1h Pa
Yield Cass. 1h, Pa
Visc Bing. 1h, mPas
Visk Cass. 1h, mPas
Marsh, s
155
1173117411751176117711781179118011811182118311841185118611871188118911901191119211931194119511961197119811991200120112021203120412051206120712081209121012111212
AP AQ AR AS AT AU AV AW AX AY AZ BA BB BC BD BE
e11 0 6.5 310e15 0 0.8 90e16 0 2.8 310e12 0 1.8 90
e37 0 37.7 10e38 0 6.5 60e39 0 4.4 10e40 0 14.3 60
3 0 0.6 38 7.9 310 10.0 7.2 32.5 10.1e27 0 0.8 310e17 0 5.8 310e32 0 11.4 290e22 0 47.0 210
3 0 0.6 38 7.9 310 10.0 7.2 32.5 10.1e28 0 0.0 310e18 0 0.0 310e33 0 8.2 210e23 0 21.5 20
3 0 0.6 38 7.9 310 10.0 7.2 32.5 10.1e29 0 0.0 90e19 0 1.3 20e34 0 7.5 30e24 0 15.6 10
3 0 0.6 38 7.9 310 10.0 7.2 32.5 10.1e30 0 0.0 40e20 0 2.4 30e35 0 8.2 20e25 0 21.5 20
3 0 0.6 38 7.9 310 10.0 7.2 32.5 10.1e31 0 0.0 310e21 0 0.7 230e36 0 11.4 10e26 0 38.2 0

Table 3. Properties (measured).
1095
1096
AP AQ AR AS AT AU AV AW AX AY AZ BA BB BC BD BE
Bleeding Setting Compressive str Filter pump Penetrability RheologyMix 2h, % Shear str,
6h, kPa Shear str, 24h, kPa
28 d, MPa 91 d, MPa About 3 month *)
100 um 80 um B min B crit Yield, Bing. 1h Pa
Yield Cass. 1h, Pa
Visc Bing. 1h, mPas
Visk Cass. 1h, mPas
Marsh, s
156
1213121412151216121712181219122012211222122312241225122612271228122912301231123212331234123512361237123812391240124112421243124412451246124712481249125012511252
AP AQ AR AS AT AU AV AW AX AY AZ BA BB BC BD BE
3 0 0.6 38 7.9 310 10.0 7.2 32.5 10.1e27 0 0.8 310e28 0 0.0 310e29 0 0.0 90e30 0 0.0 40e31 0 0.0 310
3 0 0.6 38 7.9 310 10.0 7.2 32.5 10.1e17 0 5.8 310e18 0 0.0 310e19 0 1.3 20e20 0 2.4 30e21 0 0.7 230
3 0 0.6 38 7.9 310 10.0 7.2 32.5 10.1e32 0 11.4 290e33 0 8.2 210e34 0 7.5 30e35 0 8.2 20e36 0 11.4 10
3 0 0.6 38 7.9 310 10.0 7.2 32.5 10.1e22 0 47.0 210e23 0 21.5 20e24 0 15.6 10e25 0 21.5 20e26 0 38.2 0
e41 0 15.6 290e42 0 1.2 310e43 0 1.0 310e44 0 0.4 80e54 0 1.2 300e55 0 1.7 310e45 0 6.5 300e56 0 5.3 300e57 0 1.9 310e58 0 1.5 310e46 0 8.2 300

Table 3. Properties (measured).
1095
1096
AP AQ AR AS AT AU AV AW AX AY AZ BA BB BC BD BE
Bleeding Setting Compressive str Filter pump Penetrability RheologyMix 2h, % Shear str,
6h, kPa Shear str, 24h, kPa
28 d, MPa 91 d, MPa About 3 month *)
100 um 80 um B min B crit Yield, Bing. 1h Pa
Yield Cass. 1h, Pa
Visc Bing. 1h, mPas
Visk Cass. 1h, mPas
Marsh, s
157
1253125412551256125712581259126012611262126312641265126612671268126912701271127212731274127512761277127812791280128112821283128412851286128712881289129012911292129312941295
AP AQ AR AS AT AU AV AW AX AY AZ BA BB BC BD BE
e47 0 34.8 120e48 0 0.1 320e49 0 1.3 310e50 0 0.4 310e59 0 0.9 310e60 0 1.0 310e51 0 1.7 310e61 0 1.8 310e62 0 0.7 310e52 0 4.4 290e53 0 2.8 300
e72 0 6.5 11 6.9 300 53 152f63 0 3.7 14 44 65 20.7 14.6 49.6 15.7f64 0 3.4 8 44 63 16.4 12.0 40.4 11.7f65 0 1.3 3 43 70 12.1 8.8 30.7 8.9f66 0 2.8 7 44 68 22.6 17.1 41.3 10.6
f67 0 4.8 9 44 71 13.0 9.0 43.8 14.3f68 0 3.7 8 43 71 11.6 7.9 40.4 13.6f69 0 2.2 4 44 83 6.5 4.5 26.3 8.8f70 0 4.1 9 41 85 12.5 9.1 36.2 10.6
1 0 2.8 245 17.7 290 48.9 43.0 130.8 42.82 0 1.0 245 15.6 300 22.3 16.1 51.0 15.33 0 0.6 38 7.9 310 10.0 7.2 32.5 10.14 1 0.0 245 3.9 310 3.2 2.3 12.7 4.1
f63 0 3.7 14 0 44 65 20.7 14.6 49.6 15.7e71 0 2.6 9 3.6 300 0 0 0.0 0.0 0.0 0.0e72 0 6.5 11 6.9 300 53 152 0.0 0.0 0.0 0.0
50 42 0.0 0 0.3 310 32 85 0.0 0.0 0.0 0.051 14 0.0 0 1.8 310 33 64 0.0 0.0 0.0 0.052 0 2.6 9.3 140 63 201 5.0 3.4 22.9 8.1 53
u1 0 8.7 25 5.8 5.6 300 50 187 43.4 27.9 134.5 51.0u2 0 5.8 32 2.8 2.7 300 46 101 25.2 15.9 75.8 30.0u3 0 1.6 4 0.8 0.8 310 38 97 6.5 4.4 23.8 8.2

Table 3. Properties (measured).
1095
1096
AP AQ AR AS AT AU AV AW AX AY AZ BA BB BC BD BE
Bleeding Setting Compressive str Filter pump Penetrability RheologyMix 2h, % Shear str,
6h, kPa Shear str, 24h, kPa
28 d, MPa 91 d, MPa About 3 month *)
100 um 80 um B min B crit Yield, Bing. 1h Pa
Yield Cass. 1h, Pa
Visc Bing. 1h, mPas
Visk Cass. 1h, mPas
Marsh, s
158
1296129712981299130013011302130313041305130613071308130913101311131213131314
1315
13161317
1318
131913201321132213231324132513261327132813291330133113321333
AP AQ AR AS AT AU AV AW AX AY AZ BA BB BC BD BE
u4 0 8.7 26 4.5 4.7 300 51 101 33.6 21.5 110.0 42.0u5 0 3.7 6 3.3 3.7 300 1 137 18.3 11.7 57.4 21.8u6 0 0.9 2 1.0 1.1 310 42 99 5.7 3.9 21.0 6.7
u8 0 4.8 17 4.4 300 59 120 34.2 0.0 102.1 0.0 Nou9 0 4.4 9 3.1 300 44 119 20.5 0.0 55.9 0.0 Nou10 0 0.9 1 0.9 310 41 97 4.6 0.0 17.9 0.0 60
u11 0 1.0 94 4.8 310 35 121 21.6 0.0 45.5 0.0 Nou12 0 2.4 245 8.6 290 108 372 47.7 0.0 106.5 0.0 Nou13 0 8.7 245 13.5 10 140 276 105.0 0.0 145.7 0.0 No
w1 0 1.3 38 5.6Meas. in coffee cup 310 49 103 8.0 5.3 35.3 13.0
w2 0 1.1 11 3.7Meas. in coffee cup 310 47 102 7.4 5.1 28.4 9.4
w3 0 1.2 18 5.5Meas. in coffee cup 310 49 104 7.6 4.4 48.5 21.7
w4 0 1.0 5 3.9Meas. in coffee cup 310 46 102 6.2 4.1 33.7 13.4
w5 0 5.3 245 3.7 2.7 40 89 269 17.0 12.3 48.6 14.3
w6 0 3,37 31 3.0 2.8 0 145 297 4.8 3.3 21.0 7.3
w8 0 0,9 47 2.9 3.3 0 165 410 3.6 2.4 16.9 6.2
u2 0 5.8 32 2.8 2.7 300 46 101 25.2 15.9 75.8 30.0
u7 0 6.5 13 3.2 3.4 10 163 324 21.9 15.7 49.4 15.0

Table 3. Properties (measured).
1095
1096
AP AQ AR AS AT AU AV AW AX AY AZ BA BB BC BD BE
Bleeding Setting Compressive str Filter pump Penetrability RheologyMix 2h, % Shear str,
6h, kPa Shear str, 24h, kPa
28 d, MPa 91 d, MPa About 3 month *)
100 um 80 um B min B crit Yield, Bing. 1h Pa
Yield Cass. 1h, Pa
Visc Bing. 1h, mPas
Visk Cass. 1h, mPas
Marsh, s
159
13391340134113421343134413451346134713481349135013511352135313541355135613571358135913601361136213631364136513661367136813691370137113721373137413751376137713781379
AP AQ AR AS AT AU AV AW AX AY AZ BA BB BC BD BE
27 4 1.3 24 16.1 310 210 4.3 3.1 14.8 4.626 3 1.6 32 220 5.3 3.8 19.8 6.35 1 1.6 33 100 9.4 6.6 31.6 10.37 0.5 0.8 130 17.3 300 8.9 6.1 31.3 10.7
5 1 1.6 33 100 9.4 6.6 31.6 10.323 4 1.6 14 160 130 5.7 4.4 15.3 3.9
15 0.5 0.4 61 300 7.5 5.3 26.8 8.616 0 0.2 3 150 8.7 6.0 33.4 11.4
49 2 0.2 114 70 30 5.0 3.6 18.9 6.07 0.5 0.8 130 17.3 300 8.9 6.1 31.3 10.7
24 1 0.2 57 310 190 11.2 8.6 30.4 8.025 0.5 0.7 61 310 150 7.7 5.6 26.2 8.0
8 0 1.0 130 32.8 290 11.3 6.1 48.6 20.540 0 1.1 196 240 10.7 7.4 39.7 13.2
46 0 1.6 29 13.6 310 210 10.3 7.2 35.9 11.734 0.5 0.4 38 310 140 4.4 3.1 17.5 5.7
46 0 1.6 29 13.6 310 210 10.3 7.2 35.9 11.747 0 1.3 33 310 240 12.6 9.0 40.3 12.5
32 0 0.9 245 150 9.6 6.6 37.6 12.733 0 1.0 240 170 9.0 6.3 31.8 10.340 0 1.1 196 240 10.7 7.4 39.7 13.2

Table 3. Properties (measured).
1095
1096
AP AQ AR AS AT AU AV AW AX AY AZ BA BB BC BD BE
Bleeding Setting Compressive str Filter pump Penetrability RheologyMix 2h, % Shear str,
6h, kPa Shear str, 24h, kPa
28 d, MPa 91 d, MPa About 3 month *)
100 um 80 um B min B crit Yield, Bing. 1h Pa
Yield Cass. 1h, Pa
Visc Bing. 1h, mPas
Visk Cass. 1h, mPas
Marsh, s
160
13811382138313841385138613871388138913901391139213931394139513961397139813991400140114021403140414051406140714081409141014111412141314141415141614171418
AP AQ AR AS AT AU AV AW AX AY AZ BA BB BC BD BE
8 0 1.0 130 290 62 224 11.3 6.1 48.6 20.547 0 1.3 33 310 240 60 132 12.6 9.0 40.3 12.5
48 4 0.2 77 310 140 2.5 1.8 9.8 3.127 4 1.3 24 16.1 310 210 4.3 3.1 14.8 4.6
29 1 1.3 12 310 210 6.8 5.3 19.0 4.931 1 0.5 7 310 200 6.4 5.2 14.3 3.1
28 0.5 0.6 9 17.3 290 200 9.2 6.5 32.6 10.330 0 1.1 32 310 180 7.7 5.7 22.9 6.5
44 0 1.3 47 310 250 7.9 5.4 32.0 11.036 2 0.2 35 2.7 300 220 3.0 2.1 11.9 3.9
44 0 1.3 47 310 250 7.9 5.4 32.0 11.045 0 1.3 32 310 250 9.0 6.2 34.2 11.5
35 0.5 1.1 29 310 160 6.1 4.4 20.3 6.130 0 1.1 32 310 180 7.7 5.7 22.9 6.5
27 4 1.3 24 310 210 63 147 4.3 3.1 14.8 4.628 0.5 0.6 9 290 200 63 159 9.2 6.5 32.6 10.344 0 1.3 47 310 250 61 136 7.9 5.4 32.0 11.0
7 0.5 0.8 130 17.3 300 8.9 6.1 31.3 10.78 0 1.0 130 32.8 290 11.3 6.1 48.6 20.546 0 1.6 29 13.6 310 210 10.3 7.2 35.9 11.7

Table 3. Properties (measured).
1095
1096
AP AQ AR AS AT AU AV AW AX AY AZ BA BB BC BD BE
Bleeding Setting Compressive str Filter pump Penetrability RheologyMix 2h, % Shear str,
6h, kPa Shear str, 24h, kPa
28 d, MPa 91 d, MPa About 3 month *)
100 um 80 um B min B crit Yield, Bing. 1h Pa
Yield Cass. 1h, Pa
Visc Bing. 1h, mPas
Visk Cass. 1h, mPas
Marsh, s
161
1419142014211422142314241425142614271428142914301431143214331434143514361437143814391440144114421443144414451446144714481449145014511452145314541455
AP AQ AR AS AT AU AV AW AX AY AZ BA BB BC BD BE
27 4 1.3 24 16.1 310 210 4.3 3.1 14.8 4.628 0.5 0.6 9 17.3 290 200 9.2 6.5 32.6 10.336 2 0.2 35 2.7 300 220 3.0 2.1 11.9 3.9
44 0 1.3 47 310 250 61 136 7.9 5.4 32.0 11.0
S0 0 1.6 34,8 4.5 9.0 290 43 128 19.1 13.0 66.8 22.7S1 0 1.9 27 4.7 8.9 300 50 99 18.8 13.1 57.1 18.4
S2 0 1.9 2 0.0 2.6 300 49 122 28.0 18.7 74.4 26.5S3 0 3.4 4 0.0 0.0 300 53 99 29.6 18.9 83.5 32.3S4 0 7.5 8 0.0 0.0 290 61 130 36.1 20.3 141.7 65.8
S4 0 7.5 8 0.0 0.0 290 61 130 36.1 20.3 141.7 65.8S5 0 1.6 27 1.0 6.2 300 46 144 11.3 8.1 38.8 12.1S6 0 3.1 6 0.0 0.0 300 51 134 16.7 10.5 73.3 29.0
S3 0 3.4 4 0.0 0.0 300 53 99 29.6 18.9 83.5 32.3S7 0 5.3 6 0.0 0.0 300 54 122 30.0 18.8 91.4 37.4S8 0 1.8 11 0.0 0.0 300 57 147 24.1 16.1 68.5 24.3
S0 0 1.6 34,8 4.5 9.0 290 43 128 19.1 13.0 66.8 22.7S1 0 1.9 27 4.7 8.9 300 50 99 18.8 13.1 57.1 18.4S5 0 1.6 27 1.0 6.2 300 46 144 11.3 8.1 38.8 12.1S9 0 0,98 14 4.2 5.9 310 51 119 14.0 9.8 49.7 16.2S14 0 1.0 35 7.1 5.9 300 40 139 17.7 13.2 50.3 13.8
S12 0 0.0 0 0.0 6.6 310 50 122 10.6 7.8 33.5 9.7
S10 0 0,20 6 4.8 6.1 150 73 320 13.2 9.7 37.5 10.9S13 0 0.2 2 5.0 6.7 300 50 124 14.6 10.9 31.4 11.6
S11 0 0,68 6 4.7 4.9 310 63 208 14.8 11.1 39.2 10.6S15 0 0.7 17 7.0 6.7 300 53 143 14.9 10.9 43.2 12.6

Table 3. Properties (measured).
1095
1096
AP AQ AR AS AT AU AV AW AX AY AZ BA BB BC BD BE
Bleeding Setting Compressive str Filter pump Penetrability RheologyMix 2h, % Shear str,
6h, kPa Shear str, 24h, kPa
28 d, MPa 91 d, MPa About 3 month *)
100 um 80 um B min B crit Yield, Bing. 1h Pa
Yield Cass. 1h, Pa
Visc Bing. 1h, mPas
Visk Cass. 1h, mPas
Marsh, s
162
145714581459146014611462146314641465146614671468146914701471147214731474147514761477147814791480148114821483148414851486148714881489149014911492
AP AQ AR AS AT AU AV AW AX AY AZ BA BB BC BD BE
S17 0 2.4 0 4.7 5.1 300 50 118 15.8 19.4 55.9 10.7 NoS20c 0 2.8 0 4.4 3.8 290 40 99 24.2 17.1 62.6 19.8 No
S26 0 1.0 32 9.0 9.9 300 47 135 21.7 15.9 52.3 15.0 NoS29 0 1.6 0 10.5 10.5 300 48 126 22.3 15.8 54.8 17.1 No
S32 0 1.0 0 8.2 11.0 300 30 152 24.0 18.5 47.6 11.8 NoS35 0 1.0 6 8.2 10.7 300 49 144 15.7 15.1 49.5 11.3 205
S17 0 2.4 0 4.7 5.1 300 50 118 15.8 19.4 55.9 10.7 NoS26 0 1.0 32 9.0 9.9 300 47 135 21.7 15.9 52.3 15.0 NoS32 0 1.0 0 8.2 11.0 300 30 152 24.0 18.5 47.6 11.8 No
S20c 0 2.8 0 4.4 3.8 290 40 99 24.2 17.1 62.6 19.8 NoS29 0 1.6 0 10.5 10.5 300 48 126 22.3 15.8 54.8 17.1 NoS35 0 1.0 6 8.2 10.7 300 49 144 15.7 15.1 49.5 11.3 205
S16 0 3.4 0 5.5 5.5 290 67 152 40.4 29.3 92.6 28.5 NoS17 0 2.4 0 4.7 5.1 300 50 118 15.8 19.4 55.9 10.7 NoS18 0 1.0 0 2.5 2.9 310 41 123 7.9 10.5 31.0 5.4 98
S44 0 4.1 38 16.1 17.3 200 67 137 46.1 30.3 133.7 48.9 NoS45 0 1.2 27 13.3 14.0 300 47 120 25.0 18.1 58.4 17.3 NoS25 0 1.6 29 11.9 12.9 300 54 124 27.8 18.6 80.4 28.4 NoS26 0 1.0 32 9.0 9.9 300 47 135 21.7 15.9 52.3 15.0 NoS27 0 0.3 10 4.0 4.9 300 38 119 7.5 5.3 28.3 9.3 71
S43 0 5.8 38 8.5 8.7 80 71 153 41.7 29.4 99.1 31.2 NoS19 0 4.1 0 5.3 5.1 300 54 99 32.3 0.0 79.2 22.8 NoS20c 0 2.8 0 4.4 3.8 290 40 99 24.2 17.1 62.6 19.8 NoS21 0 1.5 0 2.8 2.1 310 37 99 8.5 5.7 36.2 13.1 100
S46 0 2.4 0 15.0 15.2 220 68 157 34.4 23.8 85.8 28.5 NoS47 0 1.6 0 10.7 11.1 310 48 109 20.0 15.1 48.3 12.7 172S29 0 1.6 0 10.5 10.5 300 48 126 22.3 15.8 54.8 17.1 No

Table 3. Properties (measured).
1095
1096
AP AQ AR AS AT AU AV AW AX AY AZ BA BB BC BD BE
Bleeding Setting Compressive str Filter pump Penetrability RheologyMix 2h, % Shear str,
6h, kPa Shear str, 24h, kPa
28 d, MPa 91 d, MPa About 3 month *)
100 um 80 um B min B crit Yield, Bing. 1h Pa
Yield Cass. 1h, Pa
Visc Bing. 1h, mPas
Visk Cass. 1h, mPas
Marsh, s
163
149714981499150015011502150315041505
1506
15071508
1509
15101511
1512
15131514
1515
1516
15171518
151915201521
AP AQ AR AS AT AU AV AW AX AY AZ BA BB BC BD BE
27 4 1.3 24 16.1 310 210 4.3 3.1 14.8 4.6
41 1 0.5 13 260 12.6 8.8 43.3 14.142 1 1.0 7 290 10.1 7.3 33.4 10.343 1 0.2 5 310 110 7.8 5.7 25.2 7.5
L1 0 6.5 43 0.6 10
L2 0 13.4 38 0.8 20
L3 0 4.8 9 0.3 20
L4 0 5.8 18 0.4 20
L5 5min 0 0.0 0 0.0 103 274 0.9 0.5 7.8 3.9
L5 0 1.0 6 0.2 103 275
L3 0 4.8 9 0.3 20
L7 6 0.0 2 0.4 245 361 0.5 0.2 6.4 3.8
L6 18 0.0 0 0.4 214 370 0.3 0.1 4.6 3.0
L8 0 1.6 42 16.5 6.8 4.7 27.0 9.4
THE END