Embed Size (px)
Citation preview

Lincoln Laboratory MASSACHUSETTS INSTITUTE OF TECHNOLOGY
LEXINGTON, MASSACHUSETTS
Project Report ATC-414
Initial Assessment of Wind Forecasts for Airport Acceptance Rate (AAR) and
Ground Delay Program (GDP) Planning
R.A. DeLaura
R.F. Ferris
F.M. Robasky S.W. Troxel
N.K. Underhill
29 January 2014
Prepared for the Federal Aviation Administration, Washington, D.C. 20591
This document is available to the public through the National Technical Information Service,
Springfield, Virginia 22161

This document is disseminated under the sponsorship of the Department of Transportation, Federal Aviation Administration, in the interest of information exchange. The United States Government assumes no liability for its contents or use thereof.

17. Key Words 18. Distribution Statement
19. Security Classif. (of this report) 20. Security Classif. (of this page) 21. No. of Pages 22. Price
TECHNICAL REPORT STANDARD TITLE PAGE
1. Report No. 2. Government Accession No. 3. Recipient's Catalog No.
4. Title and Subtitle 5. Report Date
6. Performing Organization Code
7. Author(s) 8. Performing Organization Report No.
9. Performing Organization Name and Address 10. Work Unit No. (TRAIS)
11. Contract or Grant No.
12. Sponsoring Agency Name and Address 13. Type of Report and Period Covered
14. Sponsoring Agency Code
15. Supplementary Notes
16. Abstract
Unclassified Unclassified 64
FORM DOT F 1700.7 (8-72) Reproduction of completed page authorized
Richard A. DeLaura, Richard F. Ferris, Frank M. Robasky, Seth W. Troxel, and Ngaire K. Underhill
MIT Lincoln Laboratory 244 Wood Street Lexington, MA 02420-9108
This report is based on studies performed at Lincoln Laboratory, a federally funded research and development center operated by Massachusetts Institute of Technology, under Air Force Contract FA8721-05-C-0002.
This document is available to the public through the National Technical Information Service, Springfield, VA 22161.
ATC-414
Initial Assessment of Wind Forecasts for Airport Acceptance Rate (AAR) and Ground Delay Program (GDP) Planning
Department of Transportation Federal Aviation Administration 800 Independence Ave., S.W. Washington, DC 20591
Project Report
ATC-414
29 January 2014
The planning and execution of the Airport Acceptance Rate (AAR) for major metroplex airports is a complex and critical function of traffic managers in the National Airspace System (NAS). Despite the importance of AAR planning, traffic managers currently have no widely available decision support to provide guidance for runway selection and the determination of a sustainable AAR. The AAR Decision Support Capability (AARDSC), currently under development as part of the Collaborative Air Traffic Management Technology Work Package 4 (CATMT WP4), will provide such guidance.
This report provides an initial analysis of the impacts of surface winds and winds aloft on the key factors associated with the AAR (the selection of runway configuration and aircraft ground speed and spacing on final approach) and the capabilities of currently available weather forecasts to accurately predict those impacts. The report was limited in scope by the schedule and available resources, and is intended as a foundation for a comprehensive forecast assessment in follow-on work.
Surface wind forecasts from the Terminal Aerodrome Forecast (TAF) and numerical prediction models (the High Resolution Rapid Refresh [HRRR], Rapid Refresh [RAP] and Rapid Update Cycle [RUC], collectively described as “MODEL”) were compared to observed winds gathered from METAR reports at Newark International Airport (EWR). TAF and METAR were compared for 639 days of operations from 2011–2013. MODEL forecasts and METAR were compared for 21 days of operation, 16 of which had Traffic Management Initiatives (TMI) in place to mitigate adverse weather impacts. Winds aloft were translated into several wind impact metrics. The impacts of winds aloft forecast errors were evaluated by comparing impact metrics calculated from MODEL forecasts with those calculated from analysis fields for the 21 case days. Forecasts were evaluated at horizons of 2, 4, 6, and 8 hours.
FA8721-05-C-0002

This page intentionally left blank.

iii
EXECUTIVE SUMMARY
The planning and execution of the Airport Acceptance Rate (AAR) for major metroplex airports is
a complex and critical function of traffic managers in the National Airspace System (NAS). Despite the
importance of AAR planning, traffic managers currently have no widely available decision support to
provide guidance for runway selection and the determination of a sustainable AAR. The AAR Decision
Support Capability (AARDSC), currently under development as part of the Collaborative Air Traffic
Management Technology Work Package 4 (CATMT WP4), will provide such guidance.
Critical factors that impact the AAR are the selection of the arrival runway(s) and the aircraft
ground speed and spacing on final approach. These factors are affected by several characteristics of the
weather and operations, including surface winds and winds aloft. This report provides an initial analysis
of the impacts of surface winds and winds aloft on the key factors associated with the AAR (the selection
of runway configuration and aircraft ground speed and spacing on final approach) and the capabilities of
currently available weather forecasts to accurately predict those impacts. The report was limited in scope
by the schedule and available resources, and is intended as a foundation for a comprehensive forecast
assessment in follow-on work.
Surface wind forecasts from the Terminal Aerodrome Forecast (TAF) and numerical prediction
models (the High Resolution Rapid Refresh [HRRR], Rapid Refresh [RAP] and Rapid Update Cycle
[RUC], collectively described as “MODEL”) were compared to observed winds gathered from METAR
reports at Newark International Airport (EWR). TAF and METAR were compared for 639 days of
operations from 2011–2013. MODEL forecasts and METAR were compared for 21 days of operation, 16
of which had Traffic Management Initiatives (TMI) in place to mitigate adverse weather impacts. Winds
aloft were translated into several wind impact metrics. The impacts of winds aloft forecast errors were
evaluated by comparing impact metrics calculated from MODEL forecasts with those calculated from
analysis fields for the 21 case days. Forecasts were evaluated at horizons of 2, 4, 6, and 8 hours.
Key findings of the baseline evaluations were:
1. Statistical differences between TAF and MODEL surface forecasts were small.
2. Statistical differences between different wind forecast horizons (ranging from 2 to 8 hours), for
both surface and aloft winds, were small.
3. Several wind impact metrics, derived from winds aloft, show skill as predictors of significant
operational impacts.
4. The apparent lack of improvement in forecast accuracy at shorter forecast horizons, and the
lack of accurate short horizon forecasts (less than two hours) to support the execution of arrival
management plans were identified as significant shortfalls.

iv
To determine the impact of surface headwind forecast errors on runway selection, two probabilities
were defined and calculated from TAF and MODEL forecasts: the probability of infeasible runway
selection and the probability of optimal runway selection. The probability of infeasible selection was
surprisingly low (<<1%) for both TAF and MODEL forecast, considering the frequency of operational
difficulties attributed to surface wind conditions. The probability of optimal runway selection was
between 0.55 and 0.60 for all forecast horizons from the TAF and MODEL forecasts.
Three statistical measures were defined to estimate of the effect of winds-aloft impact forecast
errors on aircraft ground speed and spacing on final approach: probability of prediction of operational
impact (PoPOI), probability of false operational impact (PoFOI), and probability of true operational
impact (PoTOI). The measures were calculated for MODEL forecasts from the 21 case days. PoPOI
generally ranged between 0.85 and 0.95 for all forecast horizons of all wind impact metrics. PoFOI
ranged generally between 0.1 and 0.3, with higher value often associated with longer forecast horizons.
PoTOI ranged from approximately 0.09 to 0.25, which suggests that wind impact conditions were
commonly observed on high impact days, and seems reasonable considering that compression was
explicitly noted in operational logs on 10 of the 21 case study days. These statistical measures may be
applied to future analyses of potential benefits.
The forecast evaluation methodology did not capture the ability of forecasts to predict specific
events, such as frontal passages with associated strong wind shifts or the onset of a sea breeze, that have
potentially widespread or long-lived operational impacts. The accuracy and timing of forecasts of such
significant events are critical aspects of forecasts that planners must assess, as they have a direct bearing
on the type, scope, and timing of TMI to mitigate weather impacts.
Several follow-on research efforts have been identified:
1. Refinement of the results of this evaluation. The findings of this analysis were based on a
limited data set from a single location (EWR). The scope of the analysis should be expanded to
include several additional sites and case days.
2. Event-based forecast evaluation. The ability to forecast the onset and clearing of weather events
that have significant impact on operations (e.g., frontal passages) should be evaluated.
3. Definition of forecast requirements and shortfalls. These follow from a potential benefits
analysis that accounts for the impacts of forecast errors on translation and event forecasts.
4. Identification of forecast requirements and opportunities for improvement at shorter planning
and execution horizons. The finding that there is little statistical difference between 2 and 8
hour forecast accuracy suggests a need to explore requirements and opportunities to improve
short horizon wind forecasts for progressive planning and tactical execution.
5. Development of forecast uncertainty models that can be translated into confidence metrics for
specific operational decisions. Models for the uncertainty of weather impact forecast metrics
must be developed and translated into confidence metrics that apply to the specific impact
mitigation decisions that planners must evaluate.

v
TABLE OF CONTENTS
Page
Executive Summary iii List of Illustrations vii List of Tables ix
1. INTRODUCTION 1
2. METHODOLOGY 7
3. WIND IMPACT METRICS 13
3.1 Selection of Runway Configuration 13 3.2 Determination of Sustainable AAR 15
4. RESULTS 23
4.1 Baseline Surface Forecast Evaluation 23 4.2 Baseline Evaluation of Winds-Aloft Forecast 26 4.3 Evaluation of Forecast Impacts on Decision Making 29
5. SUMMARY AND RECOMMENDATIONS 35
5.1 Summary 35 5.2 Recommendations for Future Work 38
APPENDIX A. WIND IMPACT METRICS 39
APPENDIX B. SEARCHING FOR SIGNS OF OPERATIONAL STRESS 47
Glossary 49
References 51

This page intentionally left blank.

vii
LIST OF ILLUSTRATIONS
Figure Page
No.
1 Illustration of adverse wind impacts at Newark International Airport (EWR). 2
2 Forecast evaluation methodology. 8
3 GDP and stated reasons (left) [4] and percentage GDP with GS (right) [5]. 9
4 Illustration of the forecast evaluation methodology. Green text describes the evaluation
of the runway selection decision evaluation. 11
5 EWR runway layout. 13
6 Nominal EWR arrival trajectories and wind impact capture boxes for arrivals
on Runway 4. 17
7 Compression segment wind impact metric. 18
8 Distributions of TAF surface wind error vector magnitudes. 23
9 Distributions of MODEL surface wind error vector magnitudes. 24
10 Comparison of TAF and MODEL surface wind error vector magnitudes. 24
11 Runway 4 TAF surface headwind forecast errors. 25
12 Runway 4 MODEL surface headwind forecast errors. 26
13 Runway 4 MODEL DCB headwind forecast errors. 27
14 Runway 4 MODEL merge point headwind forecast errors. 27
15 MODEL forecast errors for the difference between merge point and DCB headwinds
for Runway 4 approach. 28
16 MODEL forecast errors for the maximum difference in headwinds at the TRACON
entry capture boxes for the Runway 4 trajectory. 29
17 MODEL forecast errors for the compression segment for Runway 4 trajectory. 29

LIST OF ILLUSTRATIONS
(Continued)
Figure Page
No.
viii
18 Scatter plot of observed METAR vs. TAF surface headwinds for the Runway 4
approach, showing where runway selection outcomes are correct, within tolerance,
and infeasible. 31
19 Comparison of runway selection outcomes with stricter headwind selection criterion
(headwind >= 0.0 knots, at left) and relaxed headwind selection criterion
(headwind >= –6.0 knots, at right). Note the reduction in error tolerance as the selection
criterion approaches the infeasibility criterion. 32
20 Probability of correct forecast of operational impact (PoPOI) vs. probability of false
prediction of operational impact (PoFOI) as a result of MODEL wind impact metric
forecast errors. 33
A-1 Correlation between observed surface headwind and ground speed on final approach. 41
A-2 Correlation between observed DCB headwind and ground speed on final approach. 42
A-3 Correlation between observed difference between DCB and surface headwind and
aircraft spacing on final approach. 43
A-4 Correlation between observed maximum difference between compression segment
headwind gain and aircraft spacing on final approach. 44
A-5 Correlation between observed maximum difference between headwinds at TRACON
entry capture boxes and aircraft spacing on final approach. 45
A-6 Correlation between observed difference between headwinds at the merge point and
the DCB and aircraft spacing on final approach. 46

ix
LIST OF TABLES
Table Page
No.
1 Wind Forecasts Evaluated in This Study 5
2 Summary of Case Study Days from EWR 9
3 Runway Feasibility Thresholds for EWR 15
4 Wind Impact Metrics Assessed in Forecast Evaluation 19
5 Wind Impact Metric Decision Thresholds and Frequency That Thresholds
Were Exceeded 21
6 Probability of Incorrect Runway Selection as a Result of Forecast Error 30
A-1 Wind Impact Metrics 39

This page intentionally left blank.

1
1. INTRODUCTION
The Airport Acceptance Rate (AAR), which states the expected hourly landing capacity for an
airport, is a fundamental driver for National Airspace System (NAS) operations. The AAR at any
particular time depends on the runway configuration in effect at the airport, and may be further affected
by adverse weather, type of aircraft that make up the arrival and departure demand, equipment outages,
etc. Traffic planners and managers from the airport tower, the host Terminal Radar Approach Control
(TRACON) and Air Route Traffic Control Center (ARTCC), and the Air Traffic Control System
Command Center (ATCSCC) may confer several times per day to determine the preferred runway
configuration and sustainable AAR, given the operational circumstances as the day unfolds. When factors
such as adverse weather or equipment outages constrain airport capacity and arrival demand is expected
to exceed the AAR by a significant amount, Traffic Management Initiatives (TMI) may be planned and
implemented to restrict demand and restore the balance between demand and capacity at the airport. The
most commonly used TMI for airport demand management is the Ground Delay Program (GDP), in
which flights destined for the constrained airport are assigned pre-departure ground delays to reduce
demand during the hours of constrained operations.
Figure 1 illustrates both the challenges and opportunities to improve AAR and GDP planning
during adverse wind impact events. A stationary front settled in near EWR for much of the day on 27
October, 2011, with moderate northerly winds north of the airport, and weak-to-moderate southerly winds
south of the airport. A GDP was in place for low ceilings, and the arrival rate fell far short of the GDP
rate, resulting in a lengthy Ground Stop (GS) around 15Z, followed by a GDP revision to a lower arrival
rate. Go-arounds and compression were reported in 17-18Z period, and a second GS ensued, followed by
yet another downward revision of the GDP rate. In this instance, the front and winds were reasonably
well-forecast, but traffic managers had no ready access to tools that could have provided a detailed
display of winds and frontal boundaries similar to the one shown in Figure 1, nor did they have access to
wind translations that would forecast likely compression due to winds aloft. The AAR Decision Support
Capability (AARDSC) Preliminary Benefits Analysis estimated that similar operational challenges due to
adverse winds are present approximately 15 days per year in operations at Newark International (EWR)
and LaGuardia (LGA) Airports, with an annual potential benefits pool of approximately $5 million
associated with excessive airborne holding and diversions [1].

2
Figure 1. Illustration of adverse wind impacts at Newark International Airport (EWR).
Several factors impact the selection of runway configuration and the determination of AAR:
1. Surface winds. Headwinds and crosswinds at the surface determine the feasibility of use for a
given runway. Surface winds may determine the feasibility of particular operational procedures
such as Land and Hold Short Operations (LAHSO). Surface headwinds may also affect the
ground speed of aircraft on final approach, which is closely related to the achievable arrival
rate. Surface wind impacts may be exacerbated by adverse ceiling and visibility conditions.
2. Ceiling and visibility. Ceiling, visibility, and the ability to maintain visual separation affect the
feasibility of different operational procedures, such as simultaneous landings on parallel arrival
runways. The availability of such procedures may impact both the preferred runway
configuration and the AAR achievable on the selected runway configuration.
5. Winds aloft (up to approximately 12 kft). Excessive wind speeds and/or vertical wind shear
aloft are currently not considered in making the choice of runway configuration. (In fact,
planners have limited access to information about winds aloft.) However, adverse wind
conditions aloft can result in AAR reductions due to the increased complexity of merging
arrival traffic streams and maintaining acceptable ground speeds and spacing as aircraft
descend and change heading through strong or varying winds. In particular, winds aloft may
result in compression, in which the spacing between pairs of arriving aircraft decreases rapidly
as they descend to final approach. Compression arises when headwinds increase significantly
along the arrival trajectory, causing the lead aircraft ground speed to decrease more rapidly than
the ground speed of the following aircraft. The greater than anticipated difference in ground
speed between lead and following aircraft results in a reduction in aircraft spacing that can
make it difficult for controllers to maintain required aircraft separation. High winds aloft may
also result in abnormally high or low aircraft ground speeds, which may make it difficult to
speed up or slow down efficiently to the desired ground speed on final approach.
Actual arrival rates and delays on October 27, 2011
Time (Z) 15 16 17 18 19 20 21 22 23 0 1 2GDP rate 34 34 32 32 32 32 32 32 30 30 30
ASPM arrival rate 27 25 25 29 31 27 28 26 27 22 24 29AAR 34 34 34 34 34 34 34 34 34 34 34 34
average arrival delay 6 25 49 64 74 55 80 83 90 80 80 60
HRRR 3 hour forecast valid at 15Z
Ground Stops

3
6. Runway surface conditions. The conditions of the runway surface affect the braking ability of
arriving aircraft, and as a result may limit the feasibility of landing procedures such as LAHSO.
7. Arrival demand fleet mix. The weight class and type of aircraft that make up the arrival
demand will determine the likely average landing speed and final spacing, both of which are
key factors in the AAR estimation.
8. Schedule. Some airport schedules are characterized by alternating periods of high departure
and high arrival counts (“banks”). Schedule banks may dictate that the preferred runway
configuration favor departures or arrivals at different parts of the day, with the AAR changing
to reflect the preference.
9. Metroplex coordination. In crowded metroplex airspaces like New York, runway
configurations at metroplex airports may need to be coordinated to ensure that traffic patterns
for one airport do not conflict with those for another. On occasion, the needs of one metroplex
airport may dominate, and the selected runway configurations for all metroplex airports may be
driven by the needs of the dominant airport, rather than individual airport optimality.
10. Equipment outages. Runways configurations or procedures may be infeasible if airport
resources or equipment required to use the runway or implement the procedures are not in
service.
As part of the Collaborative Air Traffic Management Technology Work Package 4 (CATMT WP4)
implementation, scheduled for release into the NAS Traffic Flow Management System (TFMS) in the
2016-2020 timeframe, an Airport Acceptance Rate Decision Support Capability (AARDSC) is being
developed. The AARDSC is intended to address the current lack of an objective forecast for AAR in the
TFMS that takes into account the effects of predicted adverse weather (winds, ceiling, and visibility), fleet
mix, surface conditions, and equipment outages. The AARDSC is expected to reduce airborne holding,
diversions, and Ground Stops (GS) that result from poor AAR and GDP planning. Since adverse winds in
the terminal area are a significant cause of operational problems in the TRACON, a key element of the
AARDSC is improved capability to forecast wind impacts on AAR [2].
The AARDSC is based on the AAR Decision Support Tool spreadsheet (ADEST) developed by
traffic manager Greg Callahan at Newark International Airport (EWR) [3]. ADEST accounts for the
impacts of surface winds, ceiling, visibility, runway surface conditions, arrival demand fleet mix, and
equipment outages on the sustainable AAR. The user provides fleet mix information and an average
ground speed on final approach for each hour of operations. Weather forecast information for each hour
(surface winds, ceiling, visibility, and surface conditions) are taken from the Terminal Aerodrome
Forecast (TAF). ADEST uses a set of procedural and heuristic rules to determine the preferred runway
configuration and average arrival spacing. The “base” runway AAR is calculated by dividing the average
ground speed by the average spacing on final approach, and then adjusted further to account for the

4
number of runways in operation, arrival fleet mix, etc. ADEST does not currently account for the impacts
of winds aloft on AAR.
The AARDSC will provide the following enhancements to ADEST:
1. Incorporation of the impacts of adverse winds aloft on arrival operations (in particular,
increases in spacing due to difficulties in merging multiple arrival streams and compression),
2. Prediction of the average ground speed on final approach for the calculation of the base AAR,
taking into account the effects of surface and aloft winds, and
3. Refinements of the spacing algorithm to account for operational stresses that arise in the
TRACON due to the combined effects of surface winds, winds aloft, ceiling, and visibility
impacts.
This report presents the results of an initial assessment of wind forecasts for use in AARDSC to
support improved AAR and GDP planning through the proposed ADEST enhancements. The analysis
focuses on the ability of existing forecasts to support the first two enhancements (impacts of winds aloft
on spacing and prediction of ground speed on final approach). As part of the analysis for this report, an
initial exploration of operational stresses due to adverse weather was undertaken. However, a satisfactory
objective metric for operational stress has not yet been defined, so the impact of wind forecast accuracy
on the ability to predict and mitigate operational stresses (beyond limitations on ground speed and spacing
on final approach) could not be determined. It is intended to provide the foundation for a comprehensive
assessment of wind forecasts for AAR and GDP planning and arrival management which will guide the
definition of wind forecast requirements for AAR and GDP planning and identify forecast shortfalls that
should be addressed. Only wind forecasts that are expected to be operational in the WP4 time frame and
that provide forecast products that can be translated into arrival trajectory impacts were assessed. The
sources of wind forecast and “truth” data evaluated in this study are described in Table 1.

5
TABLE 1
Wind Forecasts Evaluated in This Study
Forecast Type Products Update Horizon Status Truth
Terminal
Aerodrome
Forecast (TAF)
Human,
point
forecast
Surface winds,
gusts, ceiling,
visibility, runway
conditions
3 hours,
special as
needed
24 hours Operational METAR
observation
Rapid Update
Cycle (RUC)
Automated,
gridded
forecast
Surface winds,
winds aloft
(isobar levels)
Hourly 15 hours Operational
(prior to 1
May 2012)
RUC
analysis,
METAR (for
surface
forecasts)
Rapid Refresh
(RAP)
Automated,
gridded
forecast
Surface winds,
winds aloft
(isobar levels)
Hourly 15 hours Operational
(starting 1
May 2012)
RAP
analysis,
METAR (for
surface
forecasts)
High
Resolution
Rapid Refresh
(HRRR)
Automated,
gridded
forecast
Surface winds,
winds aloft
(isobar levels)
15 minutes 15 hours Prototype
(operational
in 2015)
HRRR
analysis,
METAR (for
surface
forecasts)
Wherever available, the HRRR was evaluated for forecast of winds aloft.
This report is organized as follows. The methodology for forecast assessment is described in
Section 2. The set of wind impact metrics—wind field characteristics that can be calculated from forecast
and observed winds that are likely to have the greatest effect on the AAR—are described in Section 3.
The results of the surface and aloft wind forecast assessment are presented in Section 4. A summary of
the findings and recommendations for future work are presented in Section 5. An Appendix provides
details of the analysis used to determine the wind impact metrics, and a description of as yet unmet
challenges in defining an operational stress metric.

This page intentionally left blank.

7
2. METHODOLOGY
In order to assess the effectiveness of wind forecasts for AAR planning, it is necessary to
understand how winds affect arrival operations. The following methodology, illustrated in Figure 2, was
employed to determine the characteristics of winds fields that impact arrival operations and to guide the
evaluation of wind forecasts:
1. Identify the operational decisions most critical to the AAR planning process. Key decisions
were identified from discussions with subject matter experts: selection of the preferred runway
configuration, and determination of a sustainable AAR for the selected configuration that
accounts for adverse weather and other operational factors.
2. Identify the factors that drive each decision. The key weather impact factor driving the
runway selection decision is the feasibility of use for each runway. The key factors affecting the
sustainable AAR are the average ground speed and spacing of aircraft on final approach.
3. Identify signs of operational stress. Since stress is likely to arise when airborne arrival
inventory exceeds capacity for the current conditions, the observed AAR performance during
periods of stress can be assumed to be the “best possible” under the observed conditions.
Periods of operational stress also identify a portion of the potential benefits pool. This
evaluation does not include an in-depth analysis of operations during periods of operational
stress, as the definition of objective metrics for operational stress is still being developed.
4. Define and validate objective wind field characteristics (“wind impact metrics”) that may
be associated with decision-driving factors and operational stress. Runway feasibility is
determined in large part by the headwinds and crosswinds for the runway at the surface. Several
metrics based on surface and aloft winds that may impact ground speed and spacing on final
approach were considered. These are described in Section 3.
5. Define forecast evaluation metrics based on impact metrics and how they impact
decisions. Where possible, thresholds that relate wind impact metrics to specific decisions (e.g.,
the maximum tailwind for which a runway is feasible) are defined, and the forecast error is
assessed in terms of the accuracy of decisions based on the forecast of the exceedance of
operational thresholds.
6. Develop forecast requirements and identify shortfalls. The specification of forecast
requirements and shortfalls follows from the forecast evaluation through an assessment of the
impact of forecast capabilities on decision making, operational performance, and the benefit
associated with operational performance as a result of improved decision making. The
development of forecast requirements is beyond the scope of this report.

8
Figure 2. Forecast evaluation methodology.
The assessment data set consisted of winds and operational data from 21 days at EWR from 2011–
2013. EWR was selected as the initial test site because of the high number of GDP due to winds, the high
number of GS observed during GDP (evidence of a challenging, highly stressed operational environment)
(Figure 3), the complexity of EWR and New York TRACON operations, and the opportunity for
significant potential benefits from improved AAR and GDP planning at the site. The data set includes 6
days of “nominal” operations (no observed adverse weather or operational impacts), and 15 days where
adverse weather impacted operations (14 days with GDP, one day with a GS only). Additional
information about operational conditions was taken from the National Traffic Management Log (NTML)
for the day. Table 2 summarizes the operating conditions on the case days.
Identify
decision
Identify
factors
Identify
operational
stress
Define
weather
impact
metrics
Evaluate
forecast
accuracy
Develop
forecast
requirements
Identify decision
Identify operational stress
Define weather impact metrics
Evaluate forecast accuracy
Key:
Capability definition / ConOps
Benefits analysis
Weather translation / capability definition
Benefits, limitations, shortfalls
Runway configuration
Sustainable AAR
Spacing on final
Ground speed on final
Diversions
Excessive holding
Etc.
Surface headwinds
Surface crosswinds
Winds aloft metrics
Baseline errors
Probability of good,
poor decisions

9
Figure 3. GDP and stated reasons (left) [4] and percentage GDP with GS (right) [5].
TABLE 2
Summary of Case Study Days from EWR
Date GDP (wind)
GDP (C&V)
GS VMC IMC NTML
06 Sept. 2011 X X X X Compression
13 Oct. 2011 X X
(2)
X EWR, LGA GS (compression)
23 Jan. 2012 X X
(4)
X N90 compression on final approach
26 Feb. 2012 X X EWR gusts, compression on final
approach
26 Mar. 2012 X X X EWR compression, wind shear
27 Apr. 2012 X X EWR wind GDP
14 Oct. 2012 X X N90 compression (“strong winds”)
15 Oct. 2012 X X X JFK compression on final approach;
gusts

10
28 Oct. 2012 X X X Compression; day before hurricane
Sandy
12 Nov. 2012 X X X N90 go-rounds, compression on
final approach
13 Nov. 2012 X X X N90 compression
27 Nov. 2012 X X X
28 Nov. 2012 X X X
29 Nov. 2012 X X EWR wind GDP
21 Dec. 2012 X X X Strong low altitude winds (70 kts @
1 kft)
No impact days
01 Jan. 2012
13 Sept. 2012 GDP related to construction
20 Dec. 2012
04 Apr. 2013
27 Apr. 2013
02 May 2013
Summary 10 5 10 13 10
For the evaluation of surface wind forecasts, TAF and METAR data from 639 days of operations in
2011–2013 when both were available were also analyzed. HRRR was used for the winds aloft forecast 15
of the 21 case days where model data were available; RUC was used for 5 days and RAP for 1 day when
HRRR was not available. Forecasts were evaluated at horizons of 2, 4, 6, and 8 hours.
The forecast evaluation methodology is illustrated in Figure 4. For a particular decision or impact
factor (e.g., runway selection), the relevant wind impact metrics are identified (runway headwind). A
baseline forecast error is calculated by comparing forecast winds and wind impact metrics to true metric
values derived from forecast truth (histogram of runway headwind forecast error). Operational thresholds
are identified for each wind impact metric (maximum tailwind for which a runway is feasible), and
criteria for decision making or significant operational impact are defined (headwind conditions required
to select a particular runway). By applying the decision making criteria to the forecast and true winds, the

11
predicted decision and true outcome can be defined and compared (the runway selection based on forecast
headwinds was deemed correct or infeasible based on true headwinds).
Figure 4. Illustration of the forecast evaluation methodology. Green text describes the evaluation of the runway selection decision evaluation.
The following probabilities are associated with the decision forecasts and outcomes, based on the
forecast and observed exceedance of operational thresholds for runway selection:
1. Probability of infeasible runway selection. This was defined as the percentage of forecasts of
runway headwinds >= 0.0 knots (the runway selection criterion) for which observed runway
headwinds were < –8.0 knots (the runway infeasibility criterion).
2. Probability of “better” runway selection. This was defined as the percentage of forecasts of
runway headwinds >= 0.0 knots (the runway selection criterion) that were correct.
For the impacts of winds aloft on ground speed and spacing on final approach, the following
probabilities are associated with decisions:
Probability of predicted operational impact (PoPOI). PoPOI is defined as the ratio
(correct predictions that threshold will be exceeded) /
(observations where threshold was actually exceeded)
Probability of false operational impact (PoFOI). PoFOI is defined as the ratio
(erroneous predictions threshold will be exceeded) / (total predictions that threshold will be exceeded)
Identify decision /
impact factor
Calculate relevant wind
impact metric
Calculate baseline
forecast error
Identify operational
impact threshold
Define criteria for
decision making; true vs. forecast outcomes
Calculate
probability of good, poor outcomes
based on forecast
Runway selection
Runway headwinds, crosswinds
Headwind < -8.0 knotsSelection headwind >= 0.0 knots
Infeasibility: headwind < -8.0 knots
‘good’ outcome: forecast, true headwind >= 0.0 knots
‘poor’ outcome: forecast >= 0.0, true < -8.0 knots (infeasible runway selected)

12
Probability of true operational impact (PoTOI). PoTOI is defined as the ratio
(observations where threshold was exceeded) / (total observations)
The consequence of a low PoPOI is that significant operational impacts will not be predicted,
resulting in over-delivery of arrivals, excessive airborne holding in or near the TRACON, high numbers
of diversions, and disruptive Ground Stops. The consequence of a high PoFOI is that arrival rates will be
overly constrained, resulting in lower efficiency. The PoTOI gives a sense of how often operations might
be affected by adverse conditions associated with the specific wind impact metric. The PoTOI provides an
impact baseline that is applicable to the requirements and benefits analysis. Wherever possible,
predictions are tuned to achieve an optimal balance between PoPOI and PoFOI, where “optimal” is
determined by weighing the costs of over-delivery versus lost efficiency.
A shortcoming of this methodology is that it does not explicitly assess the ability of forecasts to
predict significant changes in conditions that may require proactive planning to mitigate the adverse
impacts or take advantage of improving weather. The accuracy of each forecast is evaluated
independently of all other forecasts, and simply aggregated into the probabilities. For example, a forecast
may predict a frontal passage at 15Z that will result in a wind shift of 60 degrees and 8 knots that remains
in place for the remainder of the day. Assume that the forecast of wind shift is correct, but that the
passage occurs at 13Z instead of 15Z. The statistics will show that 2 forecasts out of 24 for the day were
incorrect, suggesting very good performance for the forecast. However, the frontal passage is an event
that results in a significant operational impact, and the consequences of poor timing may be an extended
period of inefficient operation as traffic management first reacts to the changed circumstances and then
recovers from the disruption due to the reaction. Viewing the forecast this way suggests that the forecast
for the day was only fair, as the operational impacts of poor timing may have been felt for several hours
after the frontal passage. A comprehensive evaluation must include event-based probabilities in the
assessment of the decision-making impacts of forecast error.

13
3. WIND IMPACT METRICS
The two key decisions associated with AAR planning are the selection of the runway configuration
and the determination of the sustainable AAR, given the selected runway configuration, weather
conditions, demand, etc. The critical factors in the determination of the AAR that are impacted by winds
are the aircraft ground speed and spacing on final approach. The relationship between winds and each of
these decisions and factors is described in Sections 3.1 and 3.2.
3.1 SELECTION OF RUNWAY CONFIGURATION
The EWR runway layout is shown in Figure 5. There is a single pair of parallel runways
(4R/22L and 4L/22R) and in typical operations, departures use one runway (4L/22R) and arrivals use the
other (4R/22L). When ceilings are extremely low, operations may be restricted to the use of a single
runway for both departures and arrivals. There is also single crossing runway (11/29) that may be used to
increase arrival or departure capacity (“overflow”). The configuration decision is a three-step process:
select the primary arrival flow direction (4 or 22 are preferred; 11/29 is used only when both 4 and 22 are
infeasible), determine if 11/29 may be used for arrival overflow, and determine if LAHSO is feasible
(Runway 4 only).
Figure 5. EWR runway layout.
Availability of 11 or 29 for
overflows significantly
improves AAR
Rwy 22
(preferred)
Rwy 4
Rwy 11
Rwy 29
14
The selection of the flow direction is limited by which runways are feasible. The surface headwind
(wind component along the direction of approach to the arrival runway) is the fundamental determinant of
runway feasibility. Excess tailwinds result in arrival ground speeds that may be too high for the runway—
landing aircraft may not be able to come to a stop before the end of the runway. High surface crosswinds
(perpendicular to the direction of the arrival runway) may limit the use of LAHSO, an overflow runway,
or, in extreme conditions, a primary arrival flow. Headwind and crosswind feasibility thresholds are
related to runway length and the type of aircraft that typically use the runway, and are fairly well-
established (ADEST encodes specific thresholds for runway and procedure feasibility). If wind gusts are
strong, gust speeds rather than sustained winds may determine feasibility. This assessment focused only
on sustained headwinds at the surface, as instances of high gusts and crosswinds in excess of operational
thresholds were rare or difficult to identify in the dataset.
In this assessment, surface winds from the regular and amended (“AMD”) TAF reports were
compared to observed surface winds recorded in the regular and special (“SPECI”) METAR reports. In
total, the TAF assessment data set included over 19,000 TAF (each with several forecast horizons) from
639 days when both TAF and METAR were available in 2011–2013. In addition, surface wind forecasts
from the HRRR/RUC RAP models (model sources for the forecasts were not differentiated and forecasts
from HRRR/RUC/RAP will be designated as “MODEL”) were compared to observed METAR surface
winds from the 21 EWR case days described above (approximately 450 forecasts per forecast horizon).
The following baseline and decision impact forecast evaluation metrics were calculated:
1. Surface wind vector errors (baseline). The distribution of error vector magnitudes as a
function of forecast horizon is reported to provide an overview of surface forecast accuracy and
behavior.
2. Surface headwind errors (baseline). The error in headwind forecast was calculated for all
EWR runway directions. Since headwind errors are the projection of the error vector along the
runway direction, they will always be less than or equal to the error vector magnitude.
3. Runway selection and prediction of runway feasibility (decision impact). ADEST runway
feasibility rules specify headwind thresholds for the use of the primary landing directions
(Runway 4 and 22) and the overflow runways (11 and 29). (See Table 3: note that a headwind
<0 is a tailwind.) In this analysis, only the prediction of feasibility for the primary landing
directions is evaluated. The runway selection criterion used in this assessment was “select the
direction with headwind >= 0 (assumed to be the ‘better’ runway)” (since the 4 and 22 arrival
directions are 180 degrees opposite, one runway always has a headwind and the other a
tailwind, unless the wind is exactly 0). A poor runway selection forecast was defined as
follows:
Forecast headwind >= 0.0 knots AND true headwind < –8.0 knots (i.e., runway is infeasible), and
the observed probability of a poor selection was calculated for both TAF and MODEL forecasts.

15
TABLE 3
Runway Feasibility Thresholds for EWR
Runway Minimum Feasible Headwind (knots)
Maximum Feasible Crosswind (knots)
4 –8 32
22 –8 35
11 –17 25
29 –10 25
3.2 DETERMINATION OF SUSTAINABLE AAR
ADEST estimates the sustainable AAR by calculating a “base” AAR as a function of runway
configuration and weather impacts, and adjusting it for additional constraints that arise as a result of the
expected arrival demand fleet mix. The base AAR, which is defined by the ratio
(average aircraft ground speed on final approach) /
(average weather-adjusted aircraft spacing on final approach),
is fundamental to the estimation of the sustainable AAR. Adverse winds aloft and at the surface
may be translated into operational impacts through modeling of their effects on average ground speed and
spacing on final approach. However, there are no established wind metrics or operational thresholds for
the estimation of ground speed or spacing on final approach as there are for runway feasibility. Therefore,
it was necessary to define wind impact metrics and impact translation models in order to evaluate wind
forecast performance.
Candidate wind impact metrics were defined with the help of New York TRACON and EWR
operational subject matter experts. A key concept stressed by the subject matter experts is recovery.
TRACON air traffic controllers are often able to maintain high AAR in the presence of adverse winds
through the use of trajectory management techniques that enable them to absorb the impacts of adverse
winds over the course of the arrival trajectory in the TRACON. It is easier to recover from impacts at
higher altitudes than from those at lower altitudes. Furthermore, operational sensitivity to a particular
wind characteristic—for example, vertical wind shear along an arrival trajectory—is likely to be different
at low and high altitudes. The set of wind impact metrics is intended to capture not only the nature of the
winds that affect operations—headwinds that impact ground speed, compression and headwind
differences between merging streams that impact spacing—but also the different stages of the arrival
trajectory where the operational sensitivity to these phenomena may be different.

16
The wind impacts metrics are associated with 20 20 nautical mile “capture boxes” that capture
characteristics of the winds at critical locations along the nominal arrival trajectories. These
characteristics are a set of headwinds and headwind differences along one or more trajectories that are
related to ground speed differences among merging aircraft, compression, and difficulties in maintaining
optimal spacing. Headwinds associated with each capture box are defined as the average value of all
forecast or analysis grid points within the capture box. Wind impact metric forecasts were calculated from
MODEL forecasts, and impact metric truth was calculated from MODEL analysis fields. The wind impact
metrics, illustrated in Figures 6 and 7, are defined as follows:
1. Surface headwinds. Surface headwinds that fall within the feasibility threshold may also
impact ground speed on final approach; higher headwinds in the feasibility range can result in
lower ground speeds. Surface headwinds were calculated and evaluated for both TAF and
MODEL forecasts against METAR truth.
2. Headwinds at the “downstream capture box” (DCB). The DCB identifies the segment of the
arrival trajectory where the merged arrival streams are set up for final approach. There is a
different DCB for each arrival runway approach. DCB altitudes for different approaches range
between approximately 1.5 and 2.0 kft.
3. Difference between headwinds at DCB and surface (DCB-to-surface headwind
difference). The DCB-to-surface headwind difference relates to the likelihood of compression
between the surface and 2.0 kft.
4. Difference between headwinds at merge and DCB (merge-to-DCB headwind difference).
The merge points are where arrivals from different directions (north, west, south) merge into a
single stream for preparation for final approach, and are associated with merge point capture
boxes. Each arrival runway approach has a different merge point. The merge altitude ranges
between approximately 2.5 and 3.0 kft, so the merge-to-DCB headwind difference relates to the
likelihood of compression roughly between 2 and 3 kft.
5. Headwind at TRACON entry capture box. The aircraft ground speed at TRACON entry,
dependent in part on headwind, represents the initial condition for TRACON flow management.
High tailwinds at TRACON entry, and the resulting high ground speeds, may present
significant challenges to TRACON controllers as they try to reduce aircraft ground speeds on
final approach to acceptable levels. There is a TRACON entry capture box for each
STAR/arrival runway combination. Standard Terminal Automation Replacement (STAR) entry
capture boxes encompass altitudes ranging approximately between 5.0 and 7.0 kft.
6. Maximum difference between headwinds at TRACON entry capture boxes (maximum
merge headwind difference). Excessive differences in headwinds and the resulting differences
in ground speed increase the difficulty of merging traffic from different STARs onto final
approach.

17
7. Maximum difference between headwinds at TRACON entry capture boxes and DCB
(maximum STAR-to-DCB difference). This metric is a rough measure of the possibility of
compression in the approximate altitude range between 7.0 and 2.0 kft.
8. Maximum compression segment headwind gain (maximum segment gain). Compression
segments are defined as segments of the arrival trajectory along which the headwind increases
monotonically. Compression segment headwind gain is the total increase in headwind from the
beginning to the end of the segment. Compression segments may be defined for each
STAR/arrival runway combination. This metric provides a rough measure of the possibility and
severity of compression anywhere along the arrival trajectory.
9. Maximum difference in compression segment headwind gain. This difference is analogous
to the maximum merge headwind difference, and gives a sense of the potential difficulty of
maintaining acceptable spacing while merging arrival streams.
Figure 6. Nominal EWR arrival trajectories and wind impact capture boxes for arrivals on Runway 4.
TRACON entry capture boxes
Downstream capture box
Merge point
Note: capture boxes are not to scale
Key:

18
Figure 7. Compression segment wind impact metric.
Table 4 summarizes the wind impact metrics evaluated, impacted operational factors
(runway configuration, ground speed and/or spacing on final approach), and the sources of forecast and
truth. Table 5 presents the decision thresholds used in the evaluation and the percentage of true data
samples that exceeded the decision threshold. The frequency at which the operational thresholds are
actually exceeded gives a sense of how often significant operational impacts may occur as a result of
conditions measured by each wind impact metric. The frequency of occurrence provides a baseline for the
analysis of potential benefits from the use and improvement of forecasts. Note that for winds-aloft
metrics, which were assessed from the case day dataset, this percentage represents the percentage of
potential impacts from the 21 case days where MODEL data were available.
A larger data set will be needed to develop a quantitative multivariate translation model that maps
these metrics to impacts on ground speed and spacing on final approach. However, an analysis of the
available data identified several metrics and corresponding “operational impact thresholds” that appear
related to significant observed changes in ground speed and spacing on final approach, and these were
used in the decision impact forecast evaluations. The decision-related forecast probabilities reported here
may be adjusted as the models for use of these metrics are refined.
800 mb
900 mb
10 meter
1. Compression segment identifies segments of trajectory from TRACON
entry to runway with monotonically increasing headwinds2. Each compression segment is characterized by a total headwind gain3. The compression segment with the maximum headwind gain is
assigned to the trajectory as the ‘compression segment headwind gain’

19
A detailed analysis of the weather impact metrics and heuristic operational thresholds is presented
in the Appendix.
TABLE 4
Wind Impact Metrics Assessed in Forecast Evaluation
Metric Decision/Impact
Forecast/Truth Wind Impact Metric Evaluated
Approximate # of True Data Samples
Surface winds1,2
Runway
configuration
TAF/METAR
HRRR (RAP)
/METAR
Runway headwind
Runway crosswind
38963
Ground speed2
Runway headwind 10384
DCB winds3
Ground speed HRRR (RAP)
forecast/HRRR
(RAP) analysis
Trajectory headwind 896
DCB-to-surface3
Spacing Difference in trajectory
headwind (DCB-surface)
896
Merge-to-DCB4 Spacing
(observed
correlation very
weak)
HRRR (RAP)
forecast/HRRR
(RAP) analysis
Difference in trajectory
headwind (merge-DCB)
1792

20
TRACON entry4
Spacing HRRR (RAP)
forecast/HRRR
(RAP) analysis
Maximum difference
between capture boxes
1792
Compression
segment5
Spacing HRRR (RAP)
forecast/HRRR
(RAP) analysis
Compression segment
headwind gain
6848
Table 4 notes:
1. METAR were available from 1270 days in 2010–2013, for several hours per day.
2. Forecasts were evaluated for Runways 4 and 22 for all days in 2011–2013 for which both TAF
and METAR were available. Approximately 6000 TAF were issued during the analysis period;
one TAF may have been compared to multiple METAR observations, resulting in a number of
comparisons higher than the number of TAF.
3. Forecasts were evaluated for Runways 4 and 22 for all 18 EWR case study days (total = 448
forecast hours 2 runways).
4. Forecasts were evaluated for Runways 4, 22, 11, and 29 for all 18 EWR case study days (total =
448 forecast hours 4 runways).
5. Forecasts were evaluated for all 18 EWR case study days (total = 448 forecast hours 4
runways 4 STARs).

21
TABLE 5
Wind Impact Metric Decision Thresholds and Frequency that Thresholds Were Exceeded
Metric Decision/Impact Threshold % of Truth Exceeding Threshold
Surface winds
Headwind < –8.0
11.2%
(4367 out of 38963)
Headwind >10.0 3.6% (403 out of 10364)
(Runways 4 and 22)
DCB winds
Headwind >20.0
9.2%
(82 out of 896)
DCB-to-surface
Difference >10.0
17.2%
(154 out of 896)
Merge-to-DCB
Difference >20.0 12.4%
(222 out of 1792)

22
TRACON entry
Difference >50.0 25.0%
(448 out of 1792)
Compression
segment
Gain >40.0
Note: Heuristic relationship
strongest for maximum
difference in gain >40.0
15.0%
(1026 out of 6848)

23
4. RESULTS
All errors are defined as
forecast value – observed value
4.1 BASELINE SURFACE FORECAST EVALUATION
The magnitude of surface wind forecast error vectors was calculated for the TAF (approximately
6000 TAF issued at each forecast horizon from 2011–2013) and MODEL surface forecasts
(approximately 450 forecasts at each forecast horizon from the 21 EWR case study days). Figures 8
(TAF) and 9 (MODEL) present the probability distribution and cumulative probability distributions of the
errors; Figure 10 compares the 10th, 25th, 50th, 75th, and 90th percentile of forecast errors for TAF and
MODEL.
Figure 8. Distributions of TAF surface wind error vector magnitudes.
0
0.05
0.1
0.15
0.2
0 2 4 6 8 10 12 14 16 18 20
0
0.1
0.2
0.3
0.4
0.5
0.6
0.7
0.8
0.9
1
0 2 4 6 8 10 12 14 16 18 20
2 hour
4 hour
6 hour
8 hour
Error vector magnitude probability Error vector cumulative probability

24
Figure 9. Distributions of MODEL surface wind error vector magnitudes.
Figure 10. Comparison of TAF and MODEL surface wind error vector magnitudes.
Error vector magnitude probability Error vector cumulative probability
0
0.05
0.1
0.15
0.2
0 2 4 6 8 10 12 14 16 18 200
0.1
0.2
0.3
0.4
0.5
0.6
0.7
0.8
0.9
1
0 2 4 6 8 10 12 14 16 18 20
2 hour
4 hour
6 hour
8 hour
0
2
4
6
8
10
12
14
TAF 2 hour
HRRR 2 hour
0
2
4
6
8
10
12
14
TAF 4 hour
HRRR 4 hour
0
2
4
6
8
10
12
14
TAF 6 hour
HRRR 6 hour
0
2
4
6
8
10
12
14
TAF 8 hour
HRRR 8 hour

25
Three forecast characteristics are evident:
1. TAF and MODEL forecast errors are similar. This is not particularly surprising, since models
are likely to be considered by the forecaster who is responsible for the TAF. TAF and MODEL
forecasts may diverge in circumstances where surface winds may be driven by local weather
processes that are not captured by the MODEL.
2. Forecast errors are similar over all forecast horizons for TAF and MODEL. Modeled winds
change slowly from one time frame to the next within a given forecast, which may explain why
errors are so consistent across all forecast horizons on average.
3. Roughly 80% of forecast errors for the TAF and MODEL fall between 2.0 and 14.0 knots.
Finer details of the forecast error characteristics, such as the conditions that differentiate days with
high forecast errors from low ones, analysis of the specific differences between TAF and MODEL, and
the apparent constancy of forecast errors over all forecast horizons, were not analyzed due to schedule
constraints and may be addressed as future work.
Forecast errors for runway headwinds for all runway approaches were also calculated for TAF and
MODEL forecasts. Figures 11 and 12 present the results for Runway 4. Approximately 80% of errors fell
between –8.0 and 6.0 knots. Errors for other runways were similar.
Figure 11. Runway 4 TAF surface headwind forecast errors.
Headwind error probability
0
0.05
0.1
0.15
0.2
-50 -12 -8 -4 0 4 8 12 >15
Error vector cumulative probability
0
0.1
0.2
0.3
0.4
0.5
0.6
0.7
0.8
0.9
1
-50 -12 -8 -4 0 4 8 12 >15
2 hour
4 hour
6 hour
8 hour

26
Figure 12. Runway 4 MODEL surface headwind forecast errors.
4.2 BASELINE EVALUATION OF WINDS-ALOFT FORECAST
The errors in MODEL forecasts of average headwinds at the DCB and merge point were calculated
on all four runway approaches for the 21 EWR case study days. Forecast errors were defined relative to
the MODEL analysis field, which was assumed as truth. Since the DCB and merge point altitudes range
from roughly 1.5 to 3.0 kft, these errors are indicative of the magnitude of forecast errors at low altitudes,
where the controller’s ability to recover from wind impacts may be limited.
Errors were similar for all four runway approaches, with minor differences attributable to the
differences in altitude of the DCB and merge points for different runway approaches. Since headwind
errors are a projection of the wind vector error onto the trajectory heading, the wind vector error
magnitude is the upper bound of headwind error, so headwind forecasts will be more forgiving than wind
vector forecasts. Forecast errors increase slightly as a function of forecast horizon and altitude (merge
altitudes are higher than DCB altitudes), possibly due to the higher forecast errors associated with
stronger winds that are more often present at higher altitudes [6]. Figures 13 and 14 illustrate the error
probability distribution for the Runway 4 approach for the DCB (Figure 13) and the merge point
(Figure 14). The forecast errors in the headwind difference between the merge point and DCB for
Runway 4 is illustrated in Figure 15; note that the difference operation removes the slight forecast bias
evident in Figures 13 and 14. Forecasts of the difference in headwinds may be more robust than forecasts
of the headwinds themselves, since differencing will remove biases that may be present in forecasts.
Headwind error cumulative probability
0
0.1
0.2
0.3
0.4
0.5
0.6
0.7
0.8
0.9
1
-50 -12 -8 -4 0 4 8 12 >15
2 hour
4 hour
6 hour
8 hour
Headwind error probability
0
0.05
0.1
0.15
0.2
-50 -12 -8 -4 0 4 8 12 >15

27
Figure 13. Runway 4 MODEL DCB headwind forecast errors.
Figure 14. Runway 4 MODEL merge point headwind forecast errors.
Headwind error probability Headwind error cumulative probability
0
0.1
0.2
0.3
0.4
0.5
0.6
0.7
0.8
0.9
1
-30 -25 -20 -15 -10 -5 0 5 10 15 20 25 300
0.1
0.2
0.3
0.4
0.5
0.6
0.7
0.8
0.9
1
-30 -25 -20 -15 -10 -5 0 5 10 15 20 25 30
2 hour
4 hour
6 hour
8 hour
Headwind error probability Headwind error cumulative probability
0
0.1
0.2
0.3
0.4
0.5
0.6
0.7
-30 -25 -20 -15 -10 -5 0 5 10 15 20 25 30
0
0.1
0.2
0.3
0.4
0.5
0.6
0.7
0.8
0.9
1
-30 -25 -20 -15 -10 -5 0 5 10 15 20 25 30
2 hour
4 hour
6 hour
8 hour

28
Figure 15. MODEL forecast errors for the difference between merge point and DCB headwinds for Runway 4 approach.
The maximum difference between ground speed at the different TRACON entry capture boxes
provides a measure of the potential difficulty in merging different arrival streams due to winds in the
altitude range of 5.0 to 7.0 kft. Errors in forecasting the ground speed differences also provide insight into
the accuracy of the horizontal spatial distribution of winds in the altitude range. Forecast errors were
similar for TRACON entry capture box differences from all four runway approaches. Forecast errors
increased with the forecast time horizon, possibly as a result of the typically stronger winds
(and correspondingly higher forecast error) at higher altitudes. Figure 16 illustrates the error probability
distribution for the Runway 4 approach.
Figure 16. MODEL forecast errors for the maximum difference in headwinds at the TRACON entry capture boxes for the Runway 4 trajectory.
Headwind difference error probability Headwind error cumulative probability
0
0.1
0.2
0.3
0.4
0.5
0.6
0.7
0.8
0.9
-30 -25 -20 -15 -10 -5 0 5 10 15 20 25 300
0.1
0.2
0.3
0.4
0.5
0.6
0.7
0.8
0.9
1
-30 -25 -20 -15 -10 -5 0 5 10 15 20 25 30
2 hour
4 hour
6 hour
8 hour
Headwind difference error probability Headwind error cumulative probability
0
0.1
0.2
0.3
0.4
0.5
-30 -20 -10 0 10 20 30
0
0.1
0.2
0.3
0.4
0.5
0.6
0.7
0.8
0.9
1
-30 -20 -10 0 10 20 30
2 hour
4 hour
6 hour
8 hour

29
Finally, the forecast error for compression segment headwind gain from all four runway approaches
was calculated. Since compression segments are calculated over the full length of the arrival trajectory,
the compression segment headwind gain provides an operationally relevant measure of the horizontal and
vertical spatial characteristics of the wind field encompassing the whole arrival airspace. Again, error
increases with forecast horizon, although not as rapidly as in the TRACON entry capture box differences.
Figure 17 illustrates the error probability distribution for the Runway 4 arrival trajectory.
Figure 17. MODEL forecast errors for the compression segment for Runway 4 trajectory.
4.3 EVALUATION OF FORECAST IMPACTS ON DECISION MAKING
The performance of several wind impact metric forecasts was evaluated in the context of decision
making, as described in Section 2. Methodology. Forecast error impacts were analyzed for three critical
decisions and AAR impact factors: runway selection, average aircraft spacing on final approach, and
average aircraft ground speed on final approach.
Runway selection. The probability of selecting an infeasible runway as a result of surface wind
forecast error was estimated to be very low for both the TAF and MODEL forecasts (<1.0%). The
probability of correctly selecting the better arrival runway (i.e., the direction with headwind >= 0) was
roughly 0.6 for all forecast horizons. In these cases, the forecast error would result in the selection of the
arrival direction with a tailwind that fell short of the threshold for infeasibility. The results are presented
in Table 6.
Compression segment error probability
Compression segment error cumulative
probability
0
0.1
0.2
0.3
0.4
0.5
0.6
-40 -30 -20 -10 0 10 20 30 400
0.1
0.2
0.3
0.4
0.5
0.6
0.7
0.8
0.9
1
-40 -30 -20 -10 0 10 20 30 40
2 hour
4 hour
6 hour
8 hour

30
TABLE 6
Probability of Incorrect Runway Selection as a Result of Forecast Error
Forecast Horizon
TAF MODEL
P(infeasible) P(better) # forecasts P(infeasible) P(better) # forecasts
2 hour <0.01 0.57 5877 <0.01 0.56 446
4 hour <0.01 0.57 5920 <0.01 0.56 444
6 hour <0.01 0.56 5956 <0.01 0.56 445
8 hour <0.01 0.56 5976 <0.01 0.56 440
Two factors may be responsible for the very low estimate of decision impact. The threshold for a
poor decision is very high; headwind forecast errors must be in excess of true headwinds by at least 8.0
knots, and must be significantly higher if higher headwinds are forecast (for example, if the forecast calls
for a headwind of 4.0 knots, forecast error must be in excess of 12.0 knots). Headwind errors are always
less than (or in rare occasions, when winds line up exactly with the runway, equal to) the forecast error
vector magnitude, since they are the projection of the forecast error onto the runway direction.
Nonetheless, considering the high number of GDP and GS associated with wind impacts in EWR
operations, this estimate seems very low. Possible explanations are that surface wind gusts or impacts of
winds aloft may be responsible for difficulties in optimal runway selection, or that traffic management
may choose to run with a tailwind under many circumstances, lowering the real operational margin for
error. Further research is needed to assess the frequency and severity of operational difficulties due to
suboptimal runway selection and to identify specific factors that relate surface wind forecast errors to
poor runway selections.
Figure 18 presents a scatter plot of observed vs. forecast headwinds with regions of correct
forecasts, P(better), suboptimal but feasible forecasts, and runway selection forecasts that selected
infeasible runways, P(infeasible), highlighted. From the scatter plot, it is evident that surface wind
forecasts tend to be high. The tendency appears at all forecast horizons; the figure illustrates observed vs.
forecast for the 2 and 8 hour forecasts. Figure 19 illustrates the effect on the margin for error and
likelihood of selecting an infeasible runway when the arrival runway selection criterion accepts a tailwind
of 6.0 knots or less.

31
Figure 18. Scatter plot of observed METAR vs. TAF surface headwinds for the Runway 4 approach, showing where runway selection outcomes are correct, within tolerance, and infeasible.
-40
-30
-20
-10
0
10
20
30
40
-40 -30 -20 -10 0 10 20 30 40
2 hour
Forecast headwind (knots)
Ob
se
rve
d h
ea
dw
ind
(k
no
ts)
Key:Forecast selection correct
Forecast selection within tolerance
Forecast selection infeasible
Perfect
forecast-40
-30
-20
-10
0
10
20
30
40
-40 -30 -20 -10 0 10 20 30 40
8 hour
Perfect
forecast

32
Figure 19. Comparison of runway selection outcomes with stricter headwind selection criterion (headwind >= 0.0 knots, at left) and relaxed headwind selection criterion (headwind >= –6.0 knots, at right). Note the reduction in error tolerance as the selection criterion approaches the infeasibility criterion.
Spacing and ground speed. Figure 20 presents a scatter plot of PoPOI vs. PoFOI that result from
MODEL forecast errors at all forecast horizons for wind impact factors based on winds aloft. Data points
for progressively longer forecast horizons are displayed by symbols with progressively less-saturated
colors.
Forecast TAF headwind (knots)
Key:Forecast selection correct
Forecast within selection tolerance
Forecast selection infeasible
-40
-30
-20
-10
0
10
20
30
40
-40 -30 -20 -10 0 10 20 30 40
2 hourSelection criterion: headwind>=0
Ob
se
rve
d h
ea
dw
ind
(k
no
ts)
-40
-30
-20
-10
0
10
20
30
40
-40 -30 -20 -10 0 10 20 30 40
2 hourSelection criterion: headwind >=-6
Perfect
forecast

33
Figure 20. Probability of correct forecast of operational impact (PoPOI) vs. probability of false prediction of operational impact (PoFOI) as a result of MODEL wind impact metric forecast errors.
Forecast performance is fairly good, with PoPOI clustered in the range of 0.85 to 0.95. PoFOI
clusters in the range of 0.1 to 0.3. Few strong trends are evident, most likely a result of the small data set.
For most metrics, the PoFOI increases with forecast horizon, suggesting that longer horizon forecasts tend
to over-forecast the severity of impacts. However, since both wind measurement and wind difference
metrics exhibit the same behavior, the observed over-forecast is not simply due to a bias in longer range
forecast toward higher winds.
In any event, it is inadvisable to draw strong conclusions from decision outcome probabilities based
on a rudimentary translation model derived from limited data. A more comprehensive and reliable
evaluation requires further work:
1. Expansion of the analysis data set to include more days at EWR and additional sites,
2. Refinement of the translation model to identify more precise operational thresholds and to
assign relative importance to different metrics in decision making, and
3. Cost/benefit analysis to inform the optimal tradeoff between PoPOI and PoFOI.
0.700
0.750
0.800
0.850
0.900
0.950
1.000
0.000 0.050 0.100 0.150 0.200 0.250 0.300 0.350
Po
PO
I
PoFOI
DCB HW > 20
DCB-surface HW >1 0Merge-DCB HW > 20
Merge HW difference > 50
Compression segment > 40

This page intentionally left blank.

35
5. SUMMARY AND RECOMMENDATIONS
5.1 SUMMARY
The planning and execution of the AAR for major metroplex airports is a complex and critical
function of traffic managers in the NAS. The key decisions that impact the AAR are the selection of the
arrival runway(s) and specification of an AAR that that can be sustained in the runway configuration.
Two primary factors that determine the sustainable AAR are the aircraft ground speed and achievable
spacing on final approach. Despite the importance of AAR planning, traffic managers currently have no
widely available decision support to provide guidance for runway selection or the determination of a
sustainable AAR, nor do they have tools that provide predictions of ground speed or achievable spacing
on final approach. The AARDSC, currently under development as part of the CATMT WP4, will provide
such guidance.
Several factors must be taken into account in identifying the most advantageous runway
configuration and determining a sustainable AAR: surface winds and winds aloft, ceiling, visibility,
runway surface conditions, mix of aircraft types in the arrival demand, balance between arrival and
departure demand, coordination of arrival and departure traffic flows in the TRACON among metroplex
airports, and the availability of airport resources such as Instrument Landing Systems (ILS), runways and
taxiways, etc. This report provides an initial analysis of the impacts of surface winds and winds aloft on
the selection of runway configuration and the achievable aircraft ground speed and spacing on final
approach, and the capabilities of currently available weather forecasts to accurately predict those impacts.
The report was limited in scope by the schedule and available resources, and its findings should not be
viewed as complete or comprehensive. The methodology and initial findings provide a foundation for a
comprehensive forecast assessment in follow-on work.
Surface wind forecasts from the TAF and numerical prediction models (HRRR, RAP, and RUC,
collectively described as “MODEL”) were compared to observed winds gathered from METAR reports at
EWR. TAF and METAR were compared for 639 days of operations from 2011–2013. MODEL forecasts
and METAR were compared for 21 days of operation, 16 of which had TMI in place to mitigate adverse
weather impacts. MODEL forecasts of winds aloft were compared to MODEL analysis winds for the
same 21 days of operations. Forecasts were evaluated at horizons of 2, 4, 6, and 8 hours.
For both surface and aloft winds, the forecast assessment included a baseline evaluation of forecast
accuracy and an estimation of the impact of forecast errors on the prediction of key AAR factors. For
surface forecasts, the baseline evaluation included the magnitude of forecast error vectors and runway
headwind forecast errors. For forecasts of winds aloft, the baseline evaluation consisted of forecast errors
for several wind impact metrics that were defined to translate winds into operational impacts. In addition
to the baseline forecast evaluation, an assessment of the impacts of forecast error on the likely quality of
decisions based on forecasts of wind impacts.

36
Key findings of the baseline evaluations were:
1. Statistical differences between TAF and MODEL surface forecasts were small. Since TAF
forecasters consult forecast models, the TAF will in most cases resemble MODEL forecasts. It
is conceivable that the TAF could identify conditions not resolvable by forecast models that
could impact surface winds (e.g., sea breezes), adding value to the MODEL forecasts by
correcting for such “invisible” impacts. An analysis of the differences between the two
forecasts was beyond the scope of this report, but should be considered as follow-on work.
2. Statistical differences between different wind forecast horizons (ranging from 2 to 8
hours) were small. Models winds change slowly, as small perturbations are smoothed out to
maintain mass continuity and thermal balance. Findings were similar for surface and aloft wind
forecasts, although at higher altitudes, some improvement in forecast accuracy at shorter
forecast horizons was evident. As planning horizons shorten over the course of the day and
operations transition from large scale planning to small scale planning to execution, it would be
advantageous to have forecasts with accuracy and resolution that improve to meet operational
needs.
3. Several wind impact metrics, derived from winds aloft, showed promise as predictors of
significant operational impacts. Important points in nominal arrival trajectories—TRACON
entry (between 5.0 and 7.0 kft altitude), arrival stream merge points (~3.0 kft), and the head of
final approach (between 1.5 and 2.0 kft)—were identified from discussions with subject matter
experts, and 20 20 km. wind forecast capture boxes were defined for each point. Wind impact
metrics included capture box average headwinds and headwind differences between capture
boxes. Operationally significant thresholds—metric values that appeared to be associated with
decreases in ground speed on final approach >10 knots, or increase in spacing on final approach
to 4 or more nautical miles—were identified for several impact metrics. Four metrics were of
particular interest: headwinds at the surface and at the head of final approach, the difference in
headwinds between the head of final approach and the surface, and the difference in headwind
gain (a likely cause of compression) along arrival trajectories from different TRACON entry
points to the surface. However, further work is needed to validate and refine the definition of
the impact metrics and their translation into operational impacts.
To determine the impact of surface headwind forecast errors on runway selection, two probabilities
were defined and calculated from TAF and MODEL forecasts:
1. Probability of infeasible runway selection. This was defined as the percentage of forecasts of
runway headwinds >= 0.0 knots (the runway selection criterion) for which observed runway
headwinds were < –8.0 knots (the runway infeasibility criterion).
2. Probability of “better” runway selection. This was defined as the percentage of forecasts of
runway headwinds >= 0.0 knots (the runway selection criterion) that were correct.
37
The probability of infeasible selection was very low (<<1%) for both TAF and MODEL forecast. This result was surprising, even accounting for the relatively generous forecast accuracy criterion, considering the frequency of operational difficulties attributed to surface wind conditions. However, as the runway selection criterion is relaxed to allow the selection of a runway with a tailwind, the margin for error between selection and infeasibility is reduced, and the probability of an infeasible selection increases accordingly.
Three statistical measures were defined to estimate of the effect of winds-aloft impact forecast errors on aircraft ground speed and spacing on final approach:
1. Probability of Prediction of Operational Impact (PoPOI). PoPOI was defined as the ratio
(correct predictions that threshold will be exceeded) / (observations where threshold was actually exceeded)
2. Probability of False Operational Impact (PoFOI). PoFOI was defined as the ratio
(erroneous predictions threshold will be exceeded) / (total predictions threshold will be exceeded)
3. Probability of true operational impact (PoTOI). PoTOI was defined as the ratio
(observations where threshold was exceeded) / (total observations)
The measures were calculated for MODEL forecasts from the 21 case days. PoPOI generally ranged between 0.85 and 0.95 for all forecast horizons of all wind impact metrics. PoFOI ranged generally between 0.1 and 0.3, with higher value often associated with longer forecast horizons. PoTOI ranged from approximately 0.09 to 0.25, which seems reasonable considering that TMI were implemented on 16 of the 21 case days, and compression was explicitly noted in operational logs on 10 of the 21 case days. Follow-on research is needed to refine the operational impact thresholds and to determine the impact and tradeoff between PoPOI and PoFOI in potential benefits.
The analysis of runway selection highlights an important shortcoming of the analysis. Forecast errors for each location, forecast horizon, and issuance time were treated as independent measurements and aggregated into the various decision-related forecast accuracy probabilities. This method does not capture the ability of forecasts to predict specific events, such as frontal passages with associated strong wind shifts or the onset of a sea breeze or low level jet that results in compression, that have significant and potentially widespread or long-lived operational impacts. The accuracy and timing of forecasts of such significant events are critical aspects of forecasts that planners must assess, as they have a direct bearing on the type, scope, and timing of TMI to mitigate weather impacts.

38
5.2 RECOMMENDATIONS FOR FUTURE WORK
As a result of this evaluation, several follow-on research efforts have been identified:
1. Refinement of the results of this evaluation. The definition of weather impact metrics and
assessment of the impact of forecast error on weather translation and decision making were
based on the analysis of a limited data set from a single location (EWR). The scope of the
analysis should be expanded to include several additional sites and case days to refine
translation models and ensure that results apply to a wide range of geography and operations,
and should include a more detailed comparison of TAF and MODEL surface wind forecast
accuracy.
2. Event-based forecast evaluation. The ability to forecast the onset and clearing of weather
events that have significant impact on operations (e.g., frontal passages) should be evaluated,
since such events drive decision making and planning of TMI for mitigation of weather
impacts. This will require defining objective metrics for the onset and clearing of such events
and the collection of data from several case days where such events occurred.
3. Analysis of implications of forecast performance on potential benefits. The probabilities of
different decision outcomes that have been defined in this report should be mapped into impacts
of forecast error on potential benefits by associating costs/benefits with different decision
outcomes.
4. Identification of forecast requirements and opportunities for improvement at shorter
planning and execution horizons. The finding that there is little statistical difference between
2 and 8 hour forecast accuracy suggests a need to explore requirements and opportunities to
improve short horizon wind forecasts.
5. Development of forecast uncertainty models that can be translated into confidence metrics
for specific operational decisions. Models for the uncertainty of weather impact forecast
metrics must be developed and translated into confidence metrics that apply to the specific
impact mitigation decisions that planners must make. This may be viewed as a longer-range
effort.

39
APPENDIX A
WIND IMPACT METRICS
The operational threshold for a given wind impact metric was determined by examination of the
distributions of ground speed and aircraft spacing on final approach as a function of the wind impact
metric value. Wind impact metrics were calculated from the analyzed (i.e., observed/interpolated) wind
field for wind-aloft metrics or from METAR for surface wind metrics for the 21 EWR case study days.
Figures A-1–A-4 present heat maps that illustrate distributions for the wind impact metrics that showed
the strongest correlation with either ground speed or spacing on final approach. Figures A-5 and A-6
present distributions for wind impact metrics with weaker correlations. Table A-1 summarizes the wind
impact metrics.
TABLE A-1
Wind Impact Metrics
Metric Decision/Impact
Wind Impact Metric Evaluated
Operational Impact Threshold
Surface headwinds
Ground speed on final
approach
Runway headwind
Headwind >10.0 knots
(ground speed reduction
= ~10 knots)
DCB headwinds
Ground speed on final
approach
Trajectory headwind at DCB
Headwind >20.0 knots
(ground speed reduction
= ~10 knots)
DCB-to-surface
Spacing on final
approach
Difference between DCB and
surface trajectory headwinds
(DCB – surface)
Difference >10.0 knots
(spacing increase = ~1.0
nautical mile)

40
Compression segment
Spacing on final
approach
Maximum difference between
compression segment
headwind gain from STARs
Difference >40.0 knots
(spacing increase = ~1.0
nautical miles)
TRACON entry
Spacing on final
approach (observed
correlation weak)
Maximum difference between
TRACON entry capture box
headwinds
Difference >50.0 knots
(spacing increase =
~0.5 – 1.0 nautical miles)
Merge-to-DCB
No correlation observed Difference between merge
and DCB trajectory headwind
(Merge – DCB)
Each column of a heat map represents a range of wind impact metric values. Each row represents a
range of observed output values (ground speed or spacing on final approach). Data were sampled from
each individual flight (ground speed) or flight pair (spacing) from the 21 case days. Warm colors
represent higher concentrations of data samples; cool colors are lower concentrations. Data sample
concentrations are normalized by the number of data samples in the bin with the maximum number of
samples in the column; the darkest red bin in each column has the maximum number of samples
(normalized to 1.0), the yellow bins (normalized to 0.6) contain roughly 60% of the number of samples in
the darkest red bin, etc. The bar charts below each heat map give the sample count for each heat map
column.
Looking at the heat maps, it is apparent that the selected operational thresholds are somewhat
impressionistic, although in Figures A-1 through A-4, trends appear to be fairly strong. It is expected that
the analysis of a larger data set and more sophisticated multivariate modeling will result in sharper
statistical distributions, possibly a reduced set of weather impact metrics (as correlations between impact
metrics are accounted for), and more refined operational thresholds for forecast evaluation and sensitivity
analysis.

41
Figure A-1. Correlation between observed surface headwind and ground speed on final approach.
Ground speed on final vs. surface headwindG
rou
nd
sp
ee
d (
kn
ots
)
Surface headwind (knots)
10000
20000
# flig
hts
Operational impact threshold (=10 knots)

42
Figure A-2. Correlation between observed DCB headwind and ground speed on final approach.
From Figures A-1 and A-2, the correlation between surface or DCB headwinds and the ground
speed on final approach is evident. The correlations are not surprising, since stronger headwinds translate
directly to slower ground speeds, and the impacts at the DCB and surface impact the trajectory near or on
the final approach. Headwinds at the DCB and surface are also likely to be highly correlated, so these
wind impact metrics are probably redundant as predictors of ground speed on final approach.
Ground speed on final vs. DCB headwindG
rou
nd
sp
ee
d (
kn
ots
)
DCB headwind (knots)
1000
2000
# flig
hts
Operational impact threshold (=20 knots)
3000

43
Figure A-3. Correlation between observed difference between DCB and surface headwind and aircraft spacing on final approach.
Spacing on final vs. headwind difference (DCB - surface)
Sp
ac
ing
(n
au
tic
al
mile
s)
Headwind gain (knots)
1000
2000
# flig
ht
pa
irs
Operational impact threshold (=10 knots)

44
Figure A-4. Correlation between observed maximum difference between compression segment headwind gain and aircraft spacing on final approach.
Figures A-3 and A-4 illustrate the relationship between two compression-related wind impact
metrics (headwind difference between the DCB capture box and surface, maximum difference between
compression segment headwind gain from all STAR trajectories) and spacing on final approach. The
compression segment difference metric is more complex, multifactor translation, as it provides a
information about both compression and merging difficulty. Again, the possibility that compression-
related wind impact metrics are related to observed spacing on final approach is reasonable; the two
metrics presented in Figures A-3 and A-4 capture different aspects of compression in the TRACON, and
may provide complementary information about wind impacts.
Spacing on final vs. maximum difference in compression segments S
pa
cin
g o
n f
ina
l (n
au
tic
al
mile
s)
1000
2000
# flig
ht
pa
irs
Operational impact threshold (=40 knots)
Headwind gain difference (knots)
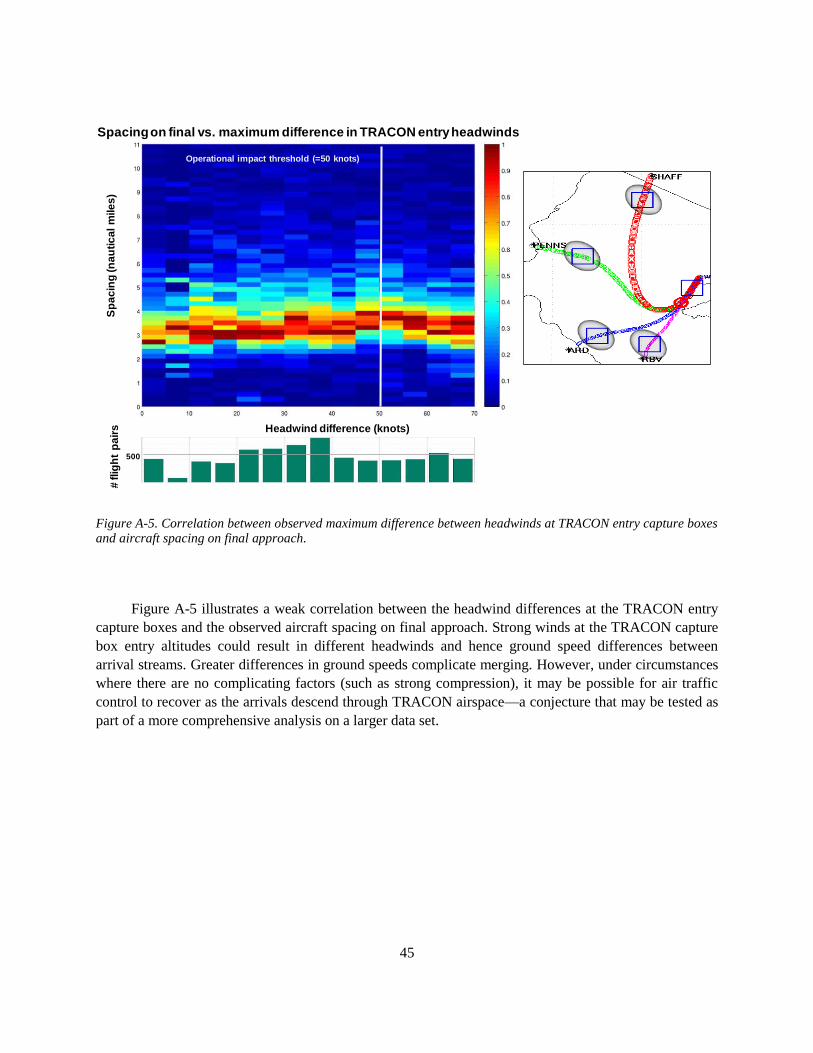
45
Figure A-5. Correlation between observed maximum difference between headwinds at TRACON entry capture boxes and aircraft spacing on final approach.
Figure A-5 illustrates a weak correlation between the headwind differences at the TRACON entry
capture boxes and the observed aircraft spacing on final approach. Strong winds at the TRACON capture
box entry altitudes could result in different headwinds and hence ground speed differences between
arrival streams. Greater differences in ground speeds complicate merging. However, under circumstances
where there are no complicating factors (such as strong compression), it may be possible for air traffic
control to recover as the arrivals descend through TRACON airspace—a conjecture that may be tested as
part of a more comprehensive analysis on a larger data set.
Spacing on final vs. maximum difference in TRACON entry headwinds
Sp
ac
ing
(n
au
tic
al
mile
s)
Headwind difference (knots)
500
# flig
ht
pa
irs
Operational impact threshold (=50 knots)

46
Figure A-6. Correlation between observed difference between headwinds at the merge point and the DCB and aircraft spacing on final approach.
Figure A-6 illustrates a wind impact metric—difference between headwinds at the merge point and
the DCB—that appears uncorrelated to key operational factors (spacing on final approach is shown). The
lack of correlation may be due to the concentration of the data sample in a single sample bin (difference
between 0.0 and 5.0 knots), or it may reflect operational reality; this metric characterizes impacts over a
very limited range of the arrival trajectory.
Spacing on final vs. maximum headwind difference
between all merge point altitudes and the downstream capture box
Sp
ac
ing
on
fin
al
(na
uti
ca
l m
ile
s)
1000
2000
# flig
ht
pa
irs
Headwind difference (knots)
3000
4000

47
APPENDIX B
SEARCHING FOR SIGNS OF OPERATIONAL STRESS
Periods of operational stress are expected to be the precursors of the most costly and disruptive
results of poor planning for arrival management: no-notice Ground Stops, diversions, and surface gridlock
at the arrival airport (due to the need to use departure resources to accommodate excessive airborne
arrival demand). Several trajectory and operational metrics were examined in an effort to find a
measurement or combination of measurements that could identify periods of operational stress:
1. Abnormally low arrival rates.
2. Abnormally low departure rates.
3. Arrival rates falling significantly short of GDP rates.
4. High number of holding aircraft in or just outside TRACON airspace.
5. Abnormally large spacing between arrivals on final approach.
6. High variation in spacing between arrivals on final approach.
7. Unusually high time of TRACON occupancy for arriving flights.
8. Unusually long downwind leg(s) for arriving traffic.
9. IMC, ceiling, and/or visibility constraints.
We examined several of the 15 high-impact case study days from EWR to see if we could identify
extended periods of operations where one or several stress signs were observed, followed by Ground
Stops, diversions or reports of gridlock. Unfortunately, the data set was too small to provide many
situations with severely adverse outcomes, and the circumstances leading up to the adverse outcomes that
were observed were too varied and diverse to support an objective definition of “operational stress.” A
larger data set and a better understanding of the conditions that result in adverse outcomes should inform
the “search for operational stress” and result in the definition of an objective measure that applies to
potential benefits assessments.

This page intentionally left blank.

49
GLOSSARY
AAR Airport Acceptance Rate
AARDSC Airport Acceptance Rate Decision Support Capability
ADEST Airport Acceptance Rate Decision Support Tool
AMD amended
ARTCC Air Route Traffic Control Center
ATCSCC Air Traffic Control System Command Center
CATMT WP4 Collaborative Air Traffic Management Technology Work Package 4
DCB downstream capture box
EWR Newark International Airport
GDP Ground Delay Program
GS Ground Stop
HRRR High Resolution Rapid Refresh
ILS Instrument Landing Systems
kft kilofeet
LAHSO Land and Hold Short Operations
LGA LaGuardia Airport
METAR weather report observations
MODEL RUC, RAP, and HRRR model sources of analyzing and forecasting weather
NAS National Airspace System
NTML National Traffic Management Log
PoFOI Probability of false operational impact
PoPOI Probability of prediction of operational impact
PoTOI Probability of true operational impact
RAP Rapid Refresh
RUC Rapid Update Cycle
SPECI special
STAR Standard Terminal Automation Replacement
TAF Terminal Aerodrome Forecast
TFMS Traffic Flow Management System
TMI Traffic Management Initiatives
TRACON Terminal Radar Approach Control
Z Zulu time (GMT)

This page intentionally left blank.

51
REFERENCES
1. Evans, James, and Richard DeLaura. “Airport Acceptance Rate Decision Support Capability
(AARDSC) Initial Benefits Assessment.” MIT Lincoln Laboratory, submitted to the FAA
August 2012.
2. “Airport Acceptance Rate Decision Support Capability (AARDSC) Concept of Operations.”
MIT Lincoln Laboratory, submitted to the FAA June 2012, revised March 2013.
3. Callahan, Greg. “Core 30 Airport Arrival Rate Decision Support Tool (ADEST).” Presented to
the FAA March 2012.
4. Provan, Christopher A., Lara Cook, and Jon Cunningham. “A Probabilistic Airport Capacity
Model for Improved Ground Delay Planning.” 30th Digital Avionics and Systems Conference
(DASC), Seattle, WA, October 2011.
5. Aviation System Performance Metrics (ASPM).
6. Schwartz, Barry E., Stanley G. Benjamin, Steven M. Green, and Matthew R. Jardin. “Accuracy
of RUC-1 and RUC-2 Wind and Aircraft Trajectory Forecasts by Comparison with ACARS
Observations,” Weather and Forecasting, June 2000.

This page intentionally left blank.