Embed Size (px)
Citation preview

Ricondo & Associates, Inc. (R&A) prepared this document for the stated purposes as expressly set forth herein and for the sole use
of Broward County Aviation Department and its intended recipients. The techniques and methodologies used in preparing this
document are consistent with industry practices at the time of preparation.
Airport Master Plan Update
Aviation Activity Forecasts Baseline Scenarios
PREPARED FOR:
Broward County Aviation Department
PREPARED BY:
RICONDO & ASSOCIATES, INC.
June 2016FINAL

A
Airport Master P
3. Av
3
3
3
3
Appendix A
Plan Update
viation Activity
.1 Histori
3.1.1 3.1.2 3.1.3 3.1.4 3.1.5
.2 Factors
3.2.1 3.2.2 3.2.3 3.2.4 3.2.5 3.2.6 3.2.7
.3 Enplan
3.3.1 3.3.2
3.3.3 3.3.4 3.3.5 3.3.6 3.3.7 3.3.8 3.3.9 3.3.10
3.3.11
.4 Preferr
A Federal Avia
y Forecast ......
cal Aviation Ac
PASSENGER
AIR SERVICE .
AIR FREIGHT
AIRCRAFT OP
BASED AIRCR
s Affecting Avi
NATIONAL EC
STATE OF TH
AIRLINE MER
COST OF AVIA
THREAT OF T
OPERATIONA
COMPETING A
ned Passenger
ASSUMPTION
ENPLANED
METHODOLO
ALL-CARGO ...
OTHER AIRCR
BASED AIRCR
ANNUAL ACTI
ANNUAL ITIN
ALTERNATIVE
ASSUMPTION
ENPLANED
METHODOLO
PEAKING PRO
red Forecasts
ation Administ
......................
ctivity and Tre
ACTIVITY...........
..........................
AND MAIL ........
PERATIONS ........
RAFT ..................
ation Demand
CONOMY ............
E AIRLINE INDU
RGERS AND ACQ
ATION FUEL ......
ERRORISM AND
AL CAPACITY OF
AIRPORTS ........
r and Aircraft O
NS UNDERLYING
PASSENGER
OGY AND RESUL
..........................
RAFT OPERATIO
RAFT ..................
IVITY FORECAST
ERANT OPERAT
E FORECAST SC
NS UNDERLYING
PASSENGER
OGY AND RESUL
OFILE ................
......................
tration Reivew
i
......................
nds ................
..........................
..........................
..........................
..........................
..........................
d at the Airpor
..........................
USTRY ................
QUISITIONS .......
..........................
D GEOPOLITICAL
THE NATIONAL
..........................
Operations Fo
G THE FORECAS
AND PASSEN
LTS .....................
..........................
NS FORECASTS
..........................
T COMPARISON
TIONS BY FUTUR
ENARIO – ACCE
G THE ACCELER
AND PASSEN
LTS .....................
..........................
......................
w
......................
......................
..........................
..........................
..........................
..........................
..........................
rt ....................
..........................
..........................
..........................
..........................
L ISSUES ..........
AIRSPACE SYST
..........................
orecasts .........
STS ....................
NGER AIRCRA
..........................
..........................
S ........................
..........................
S .......................
RE CRITICAL DES
ELERATED BASE
RATED BASELINE
NGER AIRCRA
..........................
..........................
......................
T
......................
......................
..........................
..........................
..........................
..........................
..........................
......................
..........................
..........................
..........................
..........................
..........................
TEM ..................
..........................
......................
..........................
AFT OPERATIO
..........................
..........................
..........................
..........................
..........................
SIGN AIRCRAFT
ELINE FORECAS
E FORECASTS ...
AFT OPERATIO
..........................
..........................
......................
J
Aviation Activi
Table of Co
.......................
.......................
..........................
..........................
..........................
..........................
..........................
.......................
..........................
..........................
..........................
..........................
..........................
..........................
..........................
.......................
..........................
ONS FORECAS
..........................
..........................
..........................
..........................
..........................
T .........................
STS ....................
..........................
ONS FORECAS
..........................
..........................
.......................
Ap
JUNE 2016
FINAL
ity Forecast
ontents
........... 3-1
........... 3-3
.............. 3-3
.............. 3-7
........... 3-20
........... 3-20
........... 3-28
......... 3-28
........... 3-29
........... 3-29
........... 3-30
........... 3-30
........... 3-31
........... 3-31
........... 3-32
......... 3-37
........... 3-39 ST
........... 3-39
........... 3-51
........... 3-53
........... 3-53
........... 3-56
........... 3-59
........... 3-60
........... 3-60 ST
........... 3-61
........... 3-75
......... 3-75
ppendix

FORT LAUDERDALE-HOLLYWOOD INTERNATIONAL AIRPORT JUNE 2016
FINAL
Airport Master Plan Update [ii] Aviation Activity Forecast
List of Tables
Table 3.1-1: Historical Enplaned Passengers Summary .............................................................................................. 3-4 Table 3.1-2: Historical Domestic and International Enplaned Passengers Comparison............................................ 3-6 Table 3.1-3: Historical Airport and National Enplaned Passengers Comparison........................................................ 3-7 Table 3.1-4: Airlines Currently Serving FLL1/ ................................................................................................................. 3-8 Table 3.1-5: Historical and Current Scheduled Passenger Airline Base1/ ................................................................... 3-9 Table 3.1-6: Historical Total Enplaned Passengers by Airline (sorted by FY 2015 share) ....................................... 3-11 Table 3.1-7: Scheduled Nonstop Service in March 2016 .......................................................................................... 3-14 Table 3.1-8: Historical O&D and Connection Enplaned Passenger Traffic ............................................................... 3-18 Table 3.1-9: FY 2015 Top 20 FLL Domestic O&D Markets ........................................................................................ 3-19 Table 3.1-10: Historical Cargo Tons ............................................................................................................................ 3-21 Table 3.1-11: Historical Aircraft Operations ................................................................................................................ 3-22 Table 3.1-12: Historical Mainline and Regional Passenger Airline Operations ........................................................ 3-23 Table 3.1-13: Historical All-Cargo Aircraft Operations ................................................................................................ 3-24 Table 3.1-14: Historical Other Air Taxi Operations ..................................................................................................... 3-25 Table 3.1-15: Historical General Aviation Operations ................................................................................................ 3-26 Table 3.1-16: Historical Military Operations ............................................................................................................... 3-27 Table 3.1-17: Based Aircraft ........................................................................................................................................ 3-28 Table 3.2-1: Forecast Growth of U.S. and Regional Socioeconomic Activity Drivers ................................................. 3-29 Table 3.2-2: Service and Fare Comparison from South Florida’s Airports to Top 20 Domestic O&D Markets ....... 3-35 Table 3.2-3: FY 2015 Distribution of International Seats by Region (South Florida Airports) ................................. 3-37 Table 3.2-4: Recent Changes in International Nonstop Airline Service From South Florida Airports ...................... 3-38 Table 3.3-1: Summary of Regression Analysis Results ............................................................................................... 3-41 Table 3.3-2: Airport Shares of Regional O&D Passengers (Baseline) ........................................................................ 3-42 Table 3.3-3: FLL Passenger Aircraft Fleet Mix (Baseline) 1/ ....................................................................................... 3-44 Table 3.3-4: Historical and Forecast Domestic and International Enplaned Passengers (Baseline) ....................... 3-46 Table 3.3-5: Historical and Forecast O&D and Connecting Enplaned Passengers (Baseline) .................................. 3-47 Table 3.3-6: Historical and Forecast Mainline and Regional Enplaned Passengers (Baseline) ............................... 3-48 Table 3.3-7: Domestic Passenger Airline Operations (Baseline) ................................................................................ 3-49 Table 3.3-8: International Passenger Airline Operations (Baseline) ........................................................................... 3-50 Table 3.3-9: Total Passenger Airline Operations (Baseline) ........................................................................................ 3-51 Table 3.3-10: Air Freight and Mail Cargo Tons (Baseline) ........................................................................................... 3-52 Table 3.3-11: All-Cargo Aircraft Fleet Mix (Baseline) .................................................................................................. 3-53 Table 3.3-12: Non-Passenger Airline Operations (Baseline) ....................................................................................... 3-54 Table 3.3-13: Based Aircraft (Baseline) ....................................................................................................................... 3-55 Table 3.3-14: Enplaned Passengers Forecast Comparison—Baseline Forecasts versus TAF .................................. 3-57 Table 3.3-15: Operations Forecast Comparison—Baseline Forecasts versus TAF .................................................... 3-58 Table 3.3-16: Forecast Annual Itinerant Operations by Future Critical Design Aircraft ............................................ 3-59 Table 3.3-17: Airport Shares of Regional O&D Passengers (Accelerated Baseline) ................................................. 3-63 Table 3.3-18: FLL Passenger Aircraft Fleet Mix (Accelerated Baseline) 1/ ................................................................ 3-64 Table 3.3-19: Historical and Forecast Domestic and International Enplaned Passengers (Accelerated Baseline) 3-65 Table 3.3-20: Historical and Forecast O&D and Connecting Enplaned Passengers (Accelerated Baseline) ........... 3-66

FORT LAUDERDALE-HOLLYWOOD INTERNATIONAL AIRPORT JUNE 2016
FINAL
Airport Master Plan Update [iii] Aviation Activity Forecast
Table 3.3-21: Historical and Forecast Mainline and Regional Enplaned Passengers (Accelerated Baseline) ........ 3-67 Table 3.3-22: Domestic Passenger Airline Operations (Accelerated Baseline) ......................................................... 3-68 Table 3.3-23: International Passenger Airline Operations (Accelerated Baseline) .................................................... 3-69 Table 3.3-24: Total Passenger Airline Operations (Accelerated Baseline) ................................................................. 3-70 Table 3.3-25: Non-Passenger Airline Operations (Accelerated Baseline) .................................................................. 3-71 Table 3.3-26: Enplaned Passengers Forecast Comparison—Baseline versus Accelerated Baseline Forecasts ..... 3-72 Table 3.3-27: Operations Forecast Comparison— Baseline versus Accelerated Baseline Forecasts ...................... 3-73 Table 3.3-28: Peaking Profiles ...................................................................................................................................... 3-75
List of Exhibits
Exhibit 3.1-1: FLL Air Trade Area ................................................................................................................................... 3-2 Exhibit 3.1-2: Domestic Destinations Served From the Airport ................................................................................. 3-12 Exhibit 3.1-3: International Destinations Served From the Airport ............................................................................ 3-13 Exhibit 3.2-1: Historical Monthly Averages of Jet Fuel and Crude Oil Prices ............................................................. 3-31 Exhibit 3.2-2: Annual Share of South Florida’s Airports Total Departing Airline Seat Capacity ................................ 3-32 Exhibit 3.2-3: Annual Share of South Florida’s Airports Total Domestic Departing Airline Seat Capacity ............... 3-33 Exhibit 3.2-4: Airline Shares of Domestic Seat Capacity from South Florida Airports .............................................. 3-33 Exhibit 3.2-5: Annual Share of South Florida’s Airports Domestic O&D Passengers ............................................... 3-34 Exhibit 3.2-6: Annual Share of South Florida’s Airports International Departing Airline Seat Capacity ................... 3-36 Exhibit 3.2-7: Annual Share of South Florida’s Airports International O&D Passengers ........................................... 3-36 Exhibit 3.3-1: Enplaned Passengers Forecast Comparison—Baseline Forecasts versus TAF ................................... 3-56 Exhibit 3.3-2: Operations Forecast Comparison—Baseline Forecasts versus TAF ..................................................... 3-59 Exhibit 3.3-3: Enplaned Passengers Forecast Comparison— Baseline versus Accelerated Baseline Forecasts ..... 3-74 Exhibit 3.3-4: Operations Forecast Comparison— Baseline versus Accelerated Baseline Forecasts ....................... 3-74

A
Airport Master P
This sectioAirport) sinend of thewell as fordevelopeddetermininfinancial, a
The forecawhich comaccuratelyschedulescurrent de
The aviatiothe Airportpreferred is the 10-cthe MiamPalm Beacaffect futucompetitio
Plan Update
on presents thnce FY 2005, e planning perr commercial ad for the aircng facility requand other ana
asts were prepmplete passeny represent ths for March 20estinations and
on activity foret’s Air Trade Aairport. For thcounty Miami-i-Fort Lauderdch Metropolitaure aviation aon among airp
he aviation act and it also sriod for FLL’s airline, cargo, raft fleet mixuirements and
alyses necessa
pared using fisnger data werhe current sta016 serve as thd the average
ecasts presentrea. An Air Trae purposes ofFort Lauderdadale-Port St. Lan Statistical Aactivity at the ports in the Air
3.
tivity and trenummarizes foMaster Plan Ugeneral aviati
x serving the d defining futuary for preparin
scal year (FY) re available). ate of the Airphe basis for pr seat capacity
ted in this secade Area is thef the Master Pale-Miami BeaLucie CombinArea (MSA), w Airport inclu Trade Area.
[3-1]
Avia
ds at Fort Lauorecasts of aviUpdate. Forecon, air taxi, anAirport. The
ure Airport neng the Master
2015 (Octobe While FY 20port at the timresenting the at the Airport
ction are basede geographic a
Plan Study, thech Economic ed Statistical
were also examde socioecon
ation A
uderdale-Hollywiation activity casts were dend military ope
e forecasts aneeds, as well ar Plan Update.
er–September015 serves asme of this M airlines current.
d, in part, on aarea within whe Air Trade AreArea shown o Area (CSA) amined. Factoomic and dem
Activity
wood Internat for the Airporveloped for enerations. In adnd projectionsas for conduc
r) as the base s the forecastaster Plan Upntly serving th
assumptions ahich people chea for this Airp
on Exhibit 3.1-and the Miamrs within the Amographic tre
J
Aviation Activi
y Fore
tional Airport (rt through FY nplaned passeddition, projecs provide thecting the envir
year (the latet base year, ipdate, publishe Airport, alon
about aviationhoose an airpoport (FLL Air T1. Subsets of
mi-Fort LauderAir Trade Areaends, and the
JUNE 2016
FINAL
ity Forecast
ecast
(FLL or the 2035, the engers, as tions were basis for ronmental,
est year for n order to hed airline ng with the
n activity in ort as their rade Area) f this area, rdale-West a that may e effect of
FINAL
JUNE 2016
A irpor t Master P lan Update Av iat ion Ac t iv i t y Forecas t
FLL Air Trade Area
SOURCE: Woods & Poole Economics, Inc., March 2016; Map Resources, March 2016.PREPARED BY: Ricondo & Associates, Inc., March 2016.EXHIBIT 3.1-1

FORT LAUDERDALE-HOLLYWOOD INTERNATIONAL AIRPORT JUNE 2016
FINAL
Airport Master Plan Update [3-3] Aviation Activity Forecast
Airport activity is also affected by factors outside the limits of the Air Trade Area, such as:
Events related to the national/global economy
The evolving airline business model
Airline industry consolidation
Fuel-cost changes
The forecasts developed for this Master Plan Update represent a range of possible activity at FLL. Actual activity may vary from the forecasts due to unforeseen events or changes in airline service at the Airport or at competing airports.
The remainder of this section is organized as follows:
3.1 Historical Aviation Activity and Trends
3.2 Factors Affecting Aviation Demand
3.3 Forecast Methodology and Results
3.1 Historical Aviation Activity and Trends
3.1.1 PASSENGER ACTIVITY
The Airport is classified by the Federal Aviation Administration (FAA) as a large-hub airport, accounting for 1.0 percent or more of total nationwide enplaned passengers. As shown in Table 3.1-1, approximately 13.2 million passengers were enplaned at the Airport in FY 2015, which represents the highest level of enplaned passenger activity in the period shown. The share of mainline enplaned passengers has increased from 94 percent (FY 2005) to 98 percent (FY 2015) while the share of regional/commuter enplaned passenger decreased from six percent to two percent over the comparable period.
Historical enplaned passenger figures represent data provided by the Airport and capture revenue and non-revenue passenger demand. In order to properly size facility demand, these data were used in forecasts development and may differ from data provided by FAA databases.1
1 Federal Aviation Administration Terminal Area Forecasts report revenue enplaned passengers only.

FORT LAUDERDALE-HOLLYWOOD INTERNATIONAL AIRPORT JUNE 2016
FINAL
Airport Master Plan Update [3-4] Aviation Activity Forecast
Table 3.1-1: Historical Enplaned Passengers Summary
TOTAL ENPLANED PASSENGERS SHARE
FISCAL YEAR MAINLINE REGIONAL/ COMMUTER TOTAL
ANNUAL CHANGE (%) MAINLINE
REGIONAL/ COMMUTER
2005 10,700,688 666,303 11,366,991 13.2% 94% 6%
2006 10,090,621 590,115 10,680,736 -6.0% 94% 6%
2007 10,671,841 470,828 11,142,669 4.3% 96% 4%
2008 11,216,547 373,892 11,590,439 4.0% 97% 3%
2009 10,299,605 168,283 10,467,888 -9.7% 98% 2%
2010 10,765,310 147,608 10,912,918 4.3% 99% 1%
2011 11,562,052 109,478 11,671,530 7.0% 99% 1%
2012 11,604,546 137,187 11,744,478 0.6% 99% 1%
2013 11,619,869 174,402 11,794,271 0.4% 99% 1%
2014 11,847,300 177,414 12,024,714 2.0% 99% 1%
2015 12,998,259 216,210 13,214,469 9.9% 98% 2%
Compound Annual Growth Rate
2005 – 2008 1.6% -17.5% 0.7%
2008 – 2009 -8.2% -55.0% -9.7%
2009 – 2015 4.0% 4.3% 4.0%
2005 – 2015 2.0% -10.6% 1.5%
SOURCES: Broward County Aviation Department (Enplaned Passengers), March 2016..
PREPARED BY: Ricondo & Associates, Inc., June 2016.
The following subsections present additional information regarding enplaned passengers at the Airport, as well as comparisons with national trends in enplaned passengers between FY 2005 and FY 2015.
FY 2005. Passenger activity at the Airport increased from approximately 10.0 million enplaned passengers in FY 2004 to approximately 11.4 million enplaned passengers in FY 2005, an increase of 13.2 percent compared to an increase of 6.1 percent nationwide. This increase can primarily be attributed to continued growth in service by the low-cost airlines at the Airport, as well as increased service by legacy airlines striving to maintain their market share (e.g., low-fare service by Delta’s Song and United’s Ted). Delta Air Lines, the Airport’s largest airline based on enplaned passengers, enplaned approximately 2.2 million passengers in FY 2005.
FY 2006 – 2008. Enplaned passengers for FY 2006 decreased 6.0 percent from FY 2005 levels. The decrease was in part, due to Hurricane Wilma and its impact on Southern Florida and on the Airport. Hurricane Wilma made landfall in October 2005, causing extensive damage and power outages, and it also disrupted travel and closed the Airport for five days. In addition, as part of its strategy for emerging from bankruptcy and merging with Northwest Airlines, Delta Air Lines reduced domestic service and realigned its domestic hub system to increase load factors and to enhance revenue performance. This “rightsizing” by Delta Air Lines negatively impacted passenger activity at the Airport. In FY 2006, Delta Air Lines was the largest airline at the Airport, based on enplaned passengers. In FY 2008, Delta Air Lines dropped to the fourth largest airline at FLL, behind Spirit Airlines, Southwest Airlines, and JetBlue, with

FORT LAUDERDALE-HOLLYWOOD INTERNATIONAL AIRPORT JUNE 2016
FINAL
Airport Master Plan Update [3-5] Aviation Activity Forecast
approximately 1.3 million enplaned passengers. In FY 2007 and FY 2008, Delta Air Lines’ reduction in service was primarily attributed to increased service by Spirit Airlines. In FY 2008, Spirit Airlines enplaned approximately 2.1 million passengers—nearly double the approximately 1.1 million enplaned passengers in FY 2006. Enplaned passengers increased for AirTran Airways, JetBlue, and Southwest Airlines from FY 2006 to FY 2008. In addition, Allegiant Air initiated service at the Airport in FY 2008.
FY 2009. After experiencing a compound average growth rate (CAGR) of 0.7 percent from FY 2005 through FY 2008, the Airport’s enplaned passengers decreased in FY 2009 by 9.7 percent due to the impact of the economic recession. Contributing to this decrease were airline seat capacity reductions in FY 2009 (11.1 percent) and lower passenger demand caused by the economic downturn. Specifically contributing to these reductions were the following:
- Spirit Airlines reduced or eliminated seat capacity in 32 of the 42 markets served from the Airport in FY 2008. Departing seat capacity for Spirit Airlines decreased from approximately 2.7 million seats in FY 2008 to 2.6 million seats in FY 2009, or 5.8 percent.
- Delta Air Lines reduced capacity to all domestic markets (except Atlanta) and eliminated service to five markets. Delta Air Lines (including Northwest Airlines) decreased seat capacity 13.5 percent in FY 2009.
- American Airlines decreased seat capacity by 46.7 percent and eliminated service to six destinations.
- United Airlines discontinued service at the Airport.2
FY 2010 – 2013. With the economy recovering, enplaned passengers increased from 10.5 million in FY 2009 to 11.8 million in FY 2013, a CAGR of 3.0 percent. In FY 2010, enplaned passengers increased 4.3 percent, which was followed by a 7.0 percent increase in FY 2011. During this period, Spirit Airlines and JetBlue both increased seat capacity. Spirit Airlines more than doubled capacity to Boston and Las Vegas, and the two airlines combined added nine new destinations between FY 2010 and FY 2012. JetBlue initiated service to Hartford, Los Angeles, and Washington, D.C. (Reagan National) in FY 2011, and in FY 2012 the airline added the international destinations of Bogota, Colombia, and Kingston, Jamaica. In FY 2010, Condor, LAN Colombia, and Virgin America initiated scheduled service at the Airport, followed by Alaska Airlines and Sky Bahamas in FY 2012. United Airlines resumed service in FY 2012.
FY 2014. Enplaned passengers increased 2.0 percent in FY 2014. Enplaned passengers by JetBlue and Spirit Airlines increased 12.0 percent and 5.2 percent, respectively. Southwest Airlines’ (including AirTran Airways) enplaned passengers decreased 6.2 percent, while Delta Air Lines’ enplaned passengers increased 3.1 percent. During this period, two scheduled foreign-flag airlines (Copa and Norwegian Air Shuttle) initiated service at the Airport. In FY 2014, JetBlue (6 destinations), Spirit Airlines (2 destinations), Delta Air Lines (2 destinations), and Frontier Airlines (2 destinations) added or reinstated service to several destinations. Enplaned passengers served by Air Canada and WestJet, the two largest foreign flag airlines serving the Airport, based on international passengers, increased 20.6 percent and 4.3 percent, respectively.
2 United Airlines discontinued service at the Airport in FY 2009; however, Continental Airlines continued to serve the Airport upon the completed
merger with United Airlines. Continental Airlines merged with United Airlines, and the FAA granted a single operating certificate to United Airlines
on November 30, 2011.

FORT LAUDERDALE-HOLLYWOOD INTERNATIONAL AIRPORT JUNE 2016
FINAL
Airport Master Plan Update [3-6] Aviation Activity Forecast
FY 2015. Enplaned passengers increased 9.9 percent from FY 2014. Domestic enplaned passengers increased 6.8 percent, and international enplaned passengers increased 23.8 percent. JetBlue, the largest airline based on enplaned passengers, increased 17.5 percent, and Spirit Airlines, the second largest airline based on enplaned passengers, increased 11.6 percent. Southwest Airlines’ (including AirTran Airways) enplaned passengers increased 4.2 percent. Those increases were partially offset by American Airlines’ (including US Airways) decrease of 1.1 percent, primarily due to capacity shifts related to merger integration. International enplaned passengers flown by JetBlue and Spirit Airlines increased 29.3 percent and 24.1 percent, respectively. Air Canada and WestJet increased 10.8 percent and 2.0 percent, respectively. Azul Brazilian Airlines, Copa Airlines, TAME, and Volaris, all foreign flag airlines, initiated scheduled service in FY 2015.
Table 3.1-2 presents the historical split between domestic and international enplaned passengers at the Airport between FY 2005 and FY 2015. From FY 2005 to FY 2015, domestic and international enplaned passengers increased at a CAGR of 0.2 percent and 9.8 percent, respectively. As a result, the international share of enplaned passengers increased from 9 percent in FY 2005 to 20 percent in FY 2015. Between FY 2005 and FY 2015, the Airport’s share of U.S. total enplaned passengers increased from 1.52 percent to 1.67 percent, while the total growth rate at the Airport was greater than what was experienced nationally, as shown in Table 3.1-3.
Table 3.1-2: Historical Domestic and International Enplaned Passengers Comparison
ENPLANED PASSENGERS SHARE
FISCAL YEAR DOMESTIC
ANNUAL CHANGE (%) INTERNATIONAL
ANNUAL CHANGE (%) DOMESTIC INTERNATIONAL
2005 10,303,438 11.5% 1,063,553 33.9% 91% 9%
2006 9,503,386 -7.8% 1,177,350 10.7% 89% 11%
2007 9,776,771 2.9% 1,365,898 16.0% 88% 12%
2008 10,006,392 2.3% 1,584,047 16.0% 86% 14%
2009 8,947,048 -10.6% 1,520,840 -4.0% 85% 15%
2010 9,260,615 3.5% 1,652,303 8.6% 85% 15%
2011 9,836,257 6.2% 1,835,273 11.1% 84% 16%
2012 9,962,653 1.3% 1,779,080 -3.1% 85% 15%
2013 10,033,252 0.7% 1,761,019 -1.0% 85% 15%
2014 9,844,866 -1.9% 2,179,848 23.8% 82% 18%
2015 10,515,257 6.8% 2,699,212 23.8% 80% 20%
Compound Annual Growth Rate
2005 – 2008 -1.0% 14.2%
2008 – 2009 -10.6% -4.0%
2009 – 2015 2.7% 10.0%
2005 – 2015 0.2% 9.8%
SOURCE: Broward County Aviation Department, March 2016.
PREPARED BY: Ricondo & Associates, Inc., March 2016.

FORT LAUDERDALE-HOLLYWOOD INTERNATIONAL AIRPORT JUNE 2016
FINAL
Airport Master Plan Update [3-7] Aviation Activity Forecast
Table 3.1-3: Historical Airport and National Enplaned Passengers Comparison
FISCAL YEAR
ENPLANED PASSENGERS
ANNUAL CHANGE (%)
U.S. TOTAL ENPLANED PASSENGERS
ANNUAL CHANGE (%)
FLL SHARE OF U.S. TOTAL
2005 11,366,991 13.2% 745,970,000 6.1% 1.52%
2006 10,680,736 -6.0% 746,458,000 0.1% 1.43%
2007 11,142,669 4.3% 771,546,000 3.4% 1.44%
2008 11,590,439 4.0% 765,188,000 -0.8% 1.51%
2009 10,467,888 -9.7% 709,820,000 -7.2% 1.47%
2010 10,912,918 4.3% 718,158,000 1.2% 1.52%
2011 11,671,530 7.0% 737,568,000 2.7% 1.58%
2012 11,744,478 0.6% 743,044,000 0.7% 1.58%
2013 11,794,271 0.4% 744,920,000 0.3% 1.58%
2014 12,024,714 2.0% 762,367,000 2.3% 1.58%
2015 13,214,469 9.9% 792,066,000 3.9% 1.67%
Compound Annual Growth Rate
2005 – 2008 0.7% 0.9%
2008 – 2009 -9.7% -7.2%
2009 – 2015 4.0% 1.8%
2005 – 2015 1.5% 0.6%
SOURCES: Broward County Aviation Department, March 2016; Bureau of Transportation Statistics (U.S. total enplanements), March 2016.
PREPARED BY: Ricondo & Associates, Inc., March 2016.
3.1.2 AIR SERVICE
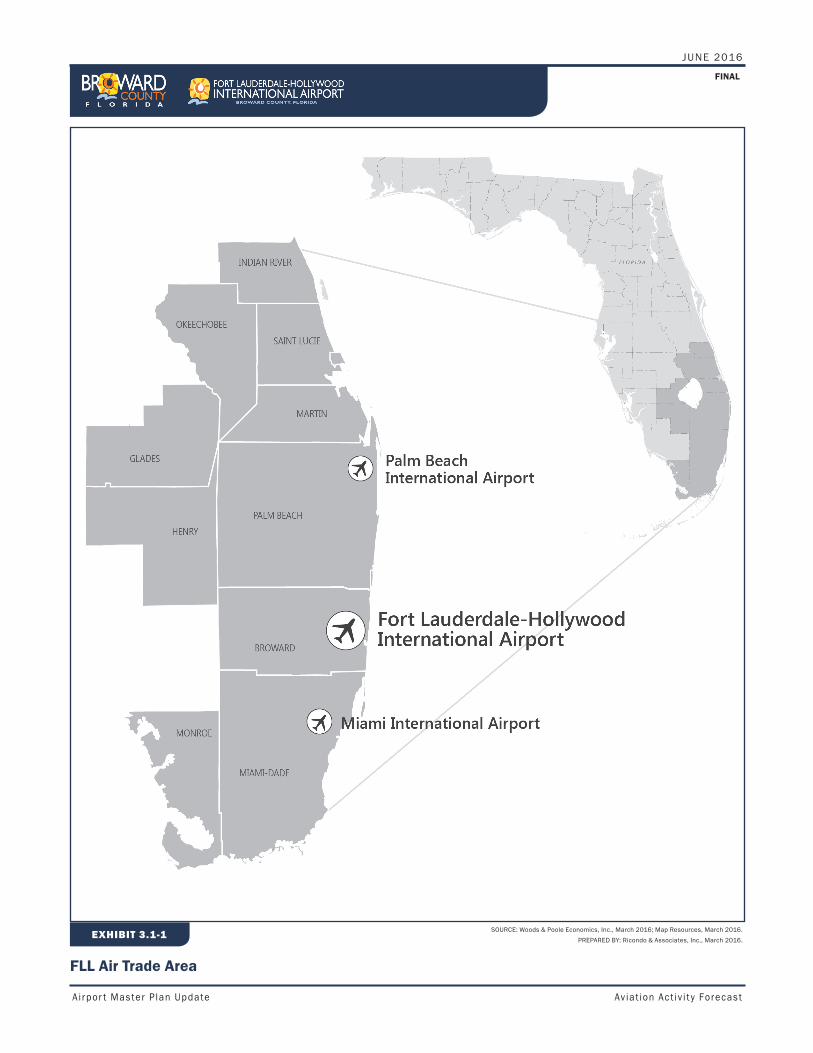
Table 3.1-4 presents the Airport’s base of airlines, comprising 12 domestic airlines, including 2 regional airlines and 13 foreign flag airlines. In addition, four all-cargo airlines operate at the Airport. Table 3.1-5 presents the airlines providing service at the Airport since FY 2005. The Airport has had the benefit of a large, diverse, and stable group of airlines during the years depicted. The following list presents specific points concerning the Airport’s historical airline base:
At the Airport, 13 of the 25 airlines operating in March, 2016 have operated at the Airport since FY 2005. Since FY 2008, 12 additional scheduled passenger airlines have commenced service at the Airport. These 12 additional airlines comprise four domestic airlines and eight foreign flag airlines.

FORT LAUDERDALE-HOLLYWOOD INTERNATIONAL AIRPORT JUNE 2016
FINAL
Airport Master Plan Update [3-8] Aviation Activity Forecast
In FY 2015, scheduled international service was provided by 17 airlines (4 domestic airlines and 13 foreign flag airlines) to 47 destinations. Nonstop scheduled service in 2016 is provided by 19 airlines (6 domestic airlines and 13 foreign flag airlines) to 51 international destinations. 3
Table 3.1-4: Airlines Currently Serving FLL1/
DOMESTIC AIRLINES (12) FOREIGN AIRLINES (13) ALL-CARGO SERVICE (4) 2/
Alaska Airlines Air Canada FedEx
Allegiant Air Air Transat GB Airlink
American Airlines 3/ Aerovías del Continente Americano (Avianca) Mountain Air Cargo
Cape Air Azul Linhas Aéreas Brasileiras (Azul) UPS
Delta Air Lines Bahamasair
Frontier Airlines Caribbean Airlines
JetBlue Airways Copa Airlines
Silver Airways Norwegian Air Shuttle ASA
Southwest Airlines 5/ Sunwing 4/
Spirit Airlines Sky Bahamas
United Airlines Transportes Aéreos Militares Ecuatorianos (TAME)
Virgin America Concesionaria Vuela Compañía de Aviación (Volaris)
WestJet
NOTES:
1/ Scheduled service as of March 2016, except where noted.
2/ All-cargo carriers as of December 2015.
3/ American Airlines and U.S. Airways merged on December 9, 2013, and a single operating certificate was issued to American Airlines on April 8, 2015.
4/ Provides seasonal service.
5/ AirTran Airways and Southwest Airlines merged on May 2, 2011. The airline completed integration on December 28, 2014.
SOURCES: Broward County Aviation Department, March 2016; Innovata, March 2016.
PREPARED BY: Ricondo & Associates, Inc., March 2016.
3 Nonstop scheduled service provided by Innovata.
FORT LAUDERDALE-HOLLYWOOD INTERNATIONAL AIRPORT JUNE 2016
FINAL
Airport Master Plan Update [3-9] Aviation Activity Forecast
Table 3.1-5: Historical and Current Scheduled Passenger Airline Base1/
AIRLINE FY
2005 FY
2006 FY
2007 FY
2008 FY
2009 FY
2010 FY
2011 FY
2012 FY
2013 FY
2014 FY
2015 FY
2016
Air Canada 2/ ● ● ● ● ● ● ● ● ● ● ● ● Air Transat 2/ ● ● ● ● ● ● ● ● ● ● ● ● American Airlines 2/ 4/ ● ● ● ● ● ● ● ● ● ● ● ● Aerovías del Continente Americano (Avianca) 2/ ● ● ● ● ● ● ● ● ● ● ● ● Bahamasair 2/ ● ● ● ● ● ● ● ● ● ● ● ● Delta Air Lines 5/ ● ● ● ● ● ● ● ● ● ● ● ● Frontier Airlines ● ● ● ● ● ● ● ● ● ● ● ● JetBlue Airways 2/ ● ● ● ● ● ● ● ● ● ● ● ● Silver Airways 2/ 6/ ● ● ● ● ● ● ● ● ● ● ● ● Southwest Airlines 7/ ● ● ● ● ● ● ● ● ● ● ● ● Spirit Airlines 2/ ● ● ● ● ● ● ● ● ● ● ● ● United Airlines 8/ ● ● ● ● ● ● ● ● ● ● ● ● WestJet 2/ ● ● ● ● ● ● ● ● ● ● ● ● Allegiant Air ● ● ● ● ● ● ● ● ● Caribbean Airlines 2/ ● ● ● ● ● ● ● ● ● Sunwing 2/ 9/ ● ● ● ● ● ● ● ● Virgin America ● ● ● ● ● ● ● Alaska Airlines ● ● ● ● ● Sky Bahamas 2/ ● ● ● ● ● Copa Airlines 2/ ● ● ● Norwegian Air Shuttle 2/ ● ● ● Azul Linhas Aéreas Brasileiras (AZUL) 2/ ● ● Transportes Aéreos Militares Ecuatorianos (TAME) 2/ ● ● Concesionaria Vuela Compañía de Aviación (Volaris) 2/ ● ● Cape Air ●
Airlines that have merged or discontinued service 10/ Condor ● ● ● ● ● ● US Airways 4/ ● ● ● ● ● ● ● ● ● ● ● AirTran Airways 7/ ● ● ● ● ● ● ● ● ● ● ● Continental Airlines 8/ ● ● ● ● ● ● ● ● Air Jamaica 11/ ● ● ● ● ● ● ● Northwest Airlines 5/ ● ● ● ● ● ●
NOTES:
1/ Where applicable, includes affiliated, regional, and merged airlines and includes scheduled data as of March 2016.
2/ Provided scheduled international service in 2015.
3/ Scheduled and/or has operated in 2015.
4/ American Airlines and U.S. Airways merged on December 9, 2013, and a single operating certificate was issued to American Airlines on April 8, 2015.
5/ Northwest Airlines merged with Delta Air Lines, and the FAA granted a single operating certificate to Delta Air Lines on December 31, 2009.
6/ Formerly Gulfstream International Airlines and rebranded as Silver Airways on December 15, 2011.
7/ AirTran Airways merged with Southwest Airlines, and the FAA granted a single operating certificate to Southwest Airlines on March 1, 2012. The airlines were fully integrated on December 28, 2014.
8/ Continental Airlines merged with United Airlines, and the FAA granted a single operating certificate to United Airlines on November 30, 2011.
9/ Provides seasonal scheduled service in 2015.
10/ Includes scheduled airlines that have served at least six of the past 10 years.
11/ Air Jamaica merged with Caribbean Airlines.
SOURCES: Broward County Aviation Department, March 2016; Innovata, March 2016.
PREPARED BY: Ricondo & Associates, Inc., March 2016.

FORT LAUDERDALE-HOLLYWOOD INTERNATIONAL AIRPORT JUNE 2016
FINAL
Airport Master Plan Update [3-10] Aviation Activity Forecast
Table 3.1-6 presents the historical share of enplaned passengers by airline at the Airport between FY 2010 and FY 2015. Enplaned passengers were spread over a large number of airlines, with no single airline having more than 22 percent of annual enplaned passengers during this time period. Over this period, enplaned passengers increased for 12 of the 15 airlines listed.
In FY 2015, JetBlue, Spirit Airlines, and Southwest Airlines represented the top three airlines serving the Airport in terms of enplaned passenger share. JetBlue’s enplaned passenger share increased from 14.9 percent to 21.8 percent between FY 2010 and FY 2015, and the airline surpassed Southwest Airlines as the airline with the highest share in FY 2014. JetBlue’s enplaned passengers increased 77.9 percent from FY 2010 to FY 2015, from approximately 1.6 million to 2.9 million. Spirit Airlines’ enplaned passengers increased from approximately 2.1 million in FY 2010 to 2.5 million in FY 2015, an increase of 19.6 percent. Prior to the merger with AirTran Airways, Southwest Airlines’ enplaned passengers increased 11.2 percent from FY 2010 to FY 2014. Combined, Southwest Airlines and AirTran Airways’ enplaned passengers averaged approximately 2.3 million from FY 2010 to FY 2015. In FY 2014, the combined airline’s enplaned passengers decreased to approximately 2.2 million as Southwest Airlines integrated AirTran Airways’ network and completed the merger on December 28, 2014. In FY 2015, Southwest Airlines’ enplaned passengers increased to approximately 2.3 million, or 4.2 percent.
Exhibit 3.1-2 and Exhibit 3.1-3 display the nonstop destinations served from the Airport. As of March 2016, regularly scheduled service was provided to 74 domestic destinations and to 51 international destinations (including seasonal service and destinations announced and scheduled to commence in FY 2016).
Table 3.1-7 presents the nonstop markets served from the Airport in March 2016. In March there were an average of 361 daily departures scheduled from the Airport and an average of 53,758 daily departing seats. Of the 120 destinations served in the month, 58 were served by more than one airline.
Traffic at the Airport primarily comprises origination and destination (O&D) passengers, those who begin or end their journey at the Airport. As shown in Table 3.1-8, in FY 2015, a high of 11.8 million O&D passengers was reached at the Airport, which reflects a recovery from a decade low of approximately 9.8 million in FY 2009. This recent growth represents a CAGR of 3.3 percent since FY 2009 and 1.1 percent in the 10-year period shown. Originating passenger share has decreased slightly from 94 percent in FY 2005 to 90 percent in FY 2015. In the period shown, connecting traffic has gradually increased from 6 percent in FY 2005 to 10 percent in FY 2015. From FY 2005 to FY 2015, connecting passengers nearly doubled from approximately 0.7 million to 1.4 million, a CAGR of 6.9 percent.
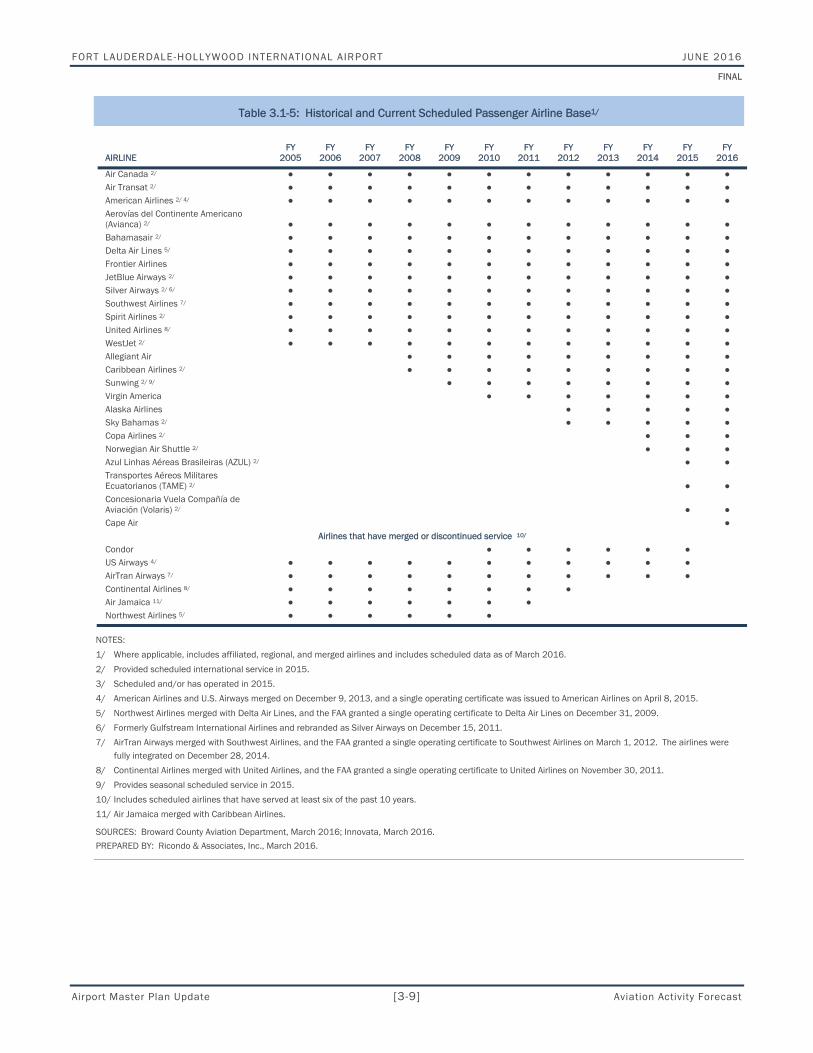
Table 3.1-9 presents the domestic O&D demand for the Airport’s top 20 markets in FY 2015, as measured by passengers per day, each way (PDEW). Over 38 percent, or 17,075 PDEW, travelled between FLL and one of the top five domestic destinations. The top 20 markets comprised approximately 73 percent, or 32,949 PDEW, of the Airport’s domestic O&D market. Of the top 20 markets, all are currently served nonstop from FLL.

FORT LAUDERDALE-HOLLYWOOD INTERNATIONAL AIRPORT JUNE 2016
FINAL
Airport Master Plan Update [3-11] Aviation Activity Forecast
Table 3.1-6: Historical Total Enplaned Passengers by Airline (sorted by FY 2015 share)
FY 2010 FY 2011 FY 2012 FY 2013 FY 2014 FY 2015
AIRLINE 1/ ENPLANED
PASSENGERS SHARE ENPLANED
PASSENGERS SHARE ENPLANED
PASSENGERS SHARE ENPLANED
PASSENGERS SHARE ENPLANED
PASSENGERS SHARE ENPLANED
PASSENGERS SHARE
JetBlue Airways 1,622,676 14.9% 1,810,330 15.5% 2,078,731 17.7% 2,193,831 18.6% 2,456,902 20.4% 2,886,760 21.8%
Spirit Airlines 2,083,999 19.1% 2,400,767 20.6% 2,164,131 18.4% 2,123,104 18.0% 2,233,230 18.6% 2,492,900 18.9%
Southwest Airlines 2/ 2,382,968 21.8% 2,415,695 20.7% 2,371,568 20.2% 2,344,448 19.9% 2,200,209 18.3% 2,293,689 17.4%
Delta Air Lines 3/ 1,631,512 15.0% 1,565,476 13.4% 1,542,924 13.1% 1,484,718 12.6% 1,523,422 12.7% 1,602,999 12.1%
US Airways 4/ 837,818 7.7% 819,741 7.0% 824,083 7.0% 860,332 7.3% 826,572 6.9% 785,620 5.9%
United Airlines 5/ 691,349 6.3% 769,838 6.6% 809,240 6.9% 862,197 7.3% 805,035 6.7% 770,579 5.8%
American Airlines 4/ 422,633 3.9% 558,800 4.8% 602,911 5.1% 589,395 5.0% 533,087 4.4% 559,405 4.2%
Air Canada 217,718 2.0% 245,189 2.1% 241,504 2.1% 265,071 2.2% 319,700 2.7% 354,148 2.7%
Allegiant Air 90,966 0.8% 98,075 0.8% 109,187 0.9% 110,235 0.9% 108,155 0.9% 168,598 1.3%
Virgin America 123,706 1.1% 163,688 1.4% 195,762 1.7% 167,570 1.4% 167,413 1.4% 162,283 1.2%
Silver Airways 6/ 86,339 0.8% 69,360 0.6% 92,963 0.8% 123,143 1.0% 116,991 1.0% 160,634 1.2%
WestJet 119,028 1.1% 120,178 1.0% 120,747 1.0% 114,200 1.0% 119,094 1.0% 121,477 0.9%
Frontier Airlines 75,572 0.7% 87,952 0.8% 80,294 0.7% 79,404 0.7% 87,708 0.7% 120,770 0.9%
Caribbean Airlines 44,534 0.4% 82,201 0.7% 173,651 1.5% 140,805 1.2% 115,490 1.0% 120,117 0.9%
Bahamasair 99,268 0.9% 117,213 1.0% 113,561 1.0% 117,020 1.0% 115,908 1.0% 109,439 0.8%
All Others 7/ 382,832 3.5% 347,027 3.0% 223,221 1.9% 218,798 1.9% 295,798 2.5% 505,051 3.8%
Airport Total 10,912,918 100.0% 11,671,530 100.0% 11,744,478 100.0% 11,794,271 100.0% 12,024,714 100.0% 13,214,469 100.0%
NOTES:
1/ Includes regional/commuter affiliates.
2/ AirTran Airways merged with Southwest Airlines, and the FAA granted a single operating certificate to Southwest Airlines on March 1, 2012. The airlines were fully integrated on December 28, 2014. Totals include Southwest Airlines and AirTran Airways.
3/ Northwest Airlines merged with Delta Air Lines, and the FAA granted a single operating certificate to Delta Air Lines on December 31, 2009. Totals include Delta Air Lines and Northwest Airlines.
4/ American Airlines and U.S. Airways merged on December 9, 2013, and a single operating certificate was issued to American Airlines on April 8, 2015.
5/ Continental Airlines merged with United Airlines, and the FAA granted a single operating certificate to United Airlines on November 30, 2011. Totals include United Airlines and Continental Airlines.
6/ Formerly Gulfstream International.
7/ Consists of other airlines that may no longer be serving the Airport, unaffiliated airlines, and charter airlines.
SOURCE: Broward County Aviation Department, March 2016.
PREPARED BY: Ricondo & Associates, Inc., March 2016.

EXHIBIT 3.1-2 SOURCE: Innovata, March 2016.PREPARED BY: Ricondo & Associates, Inc., March 2016.
Domestic Destinations Served From the Airport
LEGEND
2014 Destinations
2015 Destinations
2016 Planned Destinations
FINAL
JUNE 2016
A irpor t Master P lan Update Av iat ion Ac t iv i t y Forecas t

EXHIBIT 3.1-3 SOURCE: Innovata, March 2016.PREPARED BY: Ricondo & Associates, Inc., March 2016.
International Destinations Served From the Airport
FINAL
JUNE 2016
A irpor t Master P lan Update Av iat ion Ac t iv i t y Forecas t
LEGEND
2014 Destinations
2015 Destinations
2016 Planned Destinations

FORT LAUDERDALE-HOLLYWOOD INTERNATIONAL AIRPORT JUNE 2016
FINAL
Airport Master Plan Update [3-14] Aviation Activity Forecast
Table 3.1-7 (1 of 4): Scheduled Nonstop Service in March 2016
MARKET AVERAGE DAILY DEPARTURES
AVERAGE DAILY SEATS
NUMBER OF AIRLINES
Aguadilla, Puerto Rico 0.7 149 1
Akron/Canton, OH 0.3 51 1
Albany, NY 2.1 339 2
Armenia, Colombia 0.3 52 1
Asheville, NC 0.4 65 1
Atlanta, GA 22.7 4,046 3
Atlantic City, NJ 3.0 602 1
Austin, TX 3.4 495 2
Baltimore, MD 14.9 2,369 3
Bimini, Bahamas 3.0 27 1
Bogota, Colombia 3.0 473 3
Boston, MA 7.1 1,025 3
Buffalo, NY 3.3 435 2
Calgary, Canada 0.3 34 1
Campinas, Brazil 1.0 271 1
Cancun, Mexico 3.0 478 2
Cartagena, Colombia 1.6 247 2
Charleston, SC 1.0 100 1
Charlotte, NC 8.0 1,384 1
Chicago (Midway), IL 4.7 741 1
Chicago (O'Hare), IL 10.8 1,786 3
Cincinnati (Northern Kentucky International), OH 1.8 289 2
Cleveland, OH 3.0 461 3
Columbus (Rickenbacker), OH 0.3 46 1
Columbus, OH 1.1 161 1
Concord, NC 0.3 51 1
Copenhagen, Denmark 0.3 84 1
Dallas (Love), TX 2.9 447 1
Dallas/Ft. Worth (DFW), TX 8.2 1,316 2
Denver, CO 6.1 992 3
Detroit (Metro), MI 9.1 1,695 3
Freeport, Bahamas 3.3 149 2

FORT LAUDERDALE-HOLLYWOOD INTERNATIONAL AIRPORT JUNE 2016
FINAL
Airport Master Plan Update [3-15] Aviation Activity Forecast
Table 3.1-7 (2 of 4): Scheduled Nonstop Service in March 2016
MARKET AVERAGE DAILY DEPARTURES
AVERAGE DAILY SEATS
NUMBER OF AIRLINES
Governor’s Harbour, Bahamas 0.4 14 1
Grand Rapids, MI 0.3 51 1
Greenville/Spartanburg, SC 0.3 51 1
Guadalajara, Mexico 0.3 58 1
Guatemala City, Guatemala 0.7 103 1
Guayaquil, Ecuador 0.5 67 1
Halifax, Canada 0.4 54 2
Hartford, CT 3.1 467 2
Houston (Bush), TX 5.7 896 2
Houston (Hobby), TX 2.0 307 1
Indianapolis, IN 1.7 270 2
Jacksonville, FL 3.0 300 1
Kansas City, MO 1.7 250 1
Key West, FL 4.9 168 1
Kingston, Jamaica 3.0 354 2
Knoxville, TN 0.4 65 1
Las Vegas, NV 3.0 462 3
Latrobe, PA 1.0 156 1
Lexington, KY 0.4 74 1
Lima, Peru 1.1 169 2
London (Gatwick), England 0.3 83 1
Long Island (MacArthur), NY 2.0 292 1
Los Angeles, CA 5.7 843 3
Managua, Nicaragua 0.6 130 1
Manchester, NH 0.0 5 1
Marsh Harbour, Bahamas 2.6 90 2
Medellin, Colombia 2.0 325 2
Memphis, TN 0.3 46 1
Mexico City (Juarez), Mexico 1.6 260 2
Milwaukee, WI 1.8 268 1
Minneapolis/St. Paul, MN 4.0 741 3
Montego Bay, Jamaica 3.0 482 3

FORT LAUDERDALE-HOLLYWOOD INTERNATIONAL AIRPORT JUNE 2016
FINAL
Airport Master Plan Update [3-16] Aviation Activity Forecast
Table 3.1-7 (3 of 4): Scheduled Nonstop Service in March 2016
MARKET AVERAGE DAILY DEPARTURES
AVERAGE DAILY SEATS
NUMBER OF AIRLINES
Montreal, Canada 7.3 1,458 4
Moss Town, Bahamas 0.7 24 1
Myrtle Beach, SC 1.0 169 1
Nashville, TN 3.1 475 1
Nassau, Bahamas 6.0 578 2
New Orleans, LA 2.9 457 2
New York (Kennedy), NY 14.9 2,373 3
New York (LaGuardia), NY 16.1 2,711 3
New York (Stewart), NY 1.0 100 1
Newark/New York (Liberty), NJ 12.6 2,018 2
Niagara Falls, NY 1.0 156 1
North Eleuthera, Bahamas 2.3 77 1
Oranjestad, Aruba 0.1 19 1
Orlando, FL 5.4 470 2
Oslo, Norway 0.3 75 1
Ottawa, Canada 1.8 259 3
Panama City, Panama 1.0 124 2
Philadelphia, PA 9.0 1,357 3
Phoenix, AZ 3.0 519 2
Pittsburgh, PA 2.7 399 2
Plattsburgh, NY 1.7 309 2
Port of Spain, Trinidad and Tobago 2.0 304 2
Port-au-Prince, Haiti 4.9 765 3
Portsmouth, NH 0.3 51 1
Providence, RI 3.0 457 2
Providenciales, Turks & Caicos 1.0 100 1
Punta Cana, Dominican Republic 1.0 150 1
Quebec City, Canada 0.9 157 3
Quito, Ecuador 1.8 275 2
Raleigh/Durham, NC 3.1 329 3
Richmond, VA 1.0 100 1

FORT LAUDERDALE-HOLLYWOOD INTERNATIONAL AIRPORT JUNE 2016
FINAL
Airport Master Plan Update [3-17] Aviation Activity Forecast
Table 3.1-7 (4 of 4): Scheduled Nonstop Service in March 2016
MARKET AVERAGE DAILY DEPARTURES
AVERAGE DAILY SEATS
NUMBER OF AIRLINES
Rochester, NY 0.3 46 1
San Antonio, TX 0.3 51 1
San Francisco, CA 4.7 716 3
San Jose, Costa Rica 2.7 484 2
San Juan, Puerto Rico 7.6 1,134 3
San Pedro Sula, Honduras 0.9 156 1
San Salvador, El Salvador 0.3 52 1
Santiago, Dominican Republic 0.3 52 1
Santo Domingo, Dominican Republic 2.0 295 2
Seattle/Tacoma, WA 1.0 163 1
South Bimini, Bahamas 2.1 71 2
St. Louis, MO 2.2 320 1
St. Maarten, Netherlands Antilles 0.1 23 1
St. Thomas, U.S. Virgin Islands 1.0 145 1
Stockholm, Sweden 0.2 66 1
Syracuse, NY 1.3 151 2
Tallahassee, FL 0.5 19 1
Tampa, FL 9.6 993 3
Toronto (Pearson), Canada 7.7 1,489 4
Treasure Cay, Bahamas 1.1 38 1
Trenton, NJ 0.9 140 1
Washington (Reagan), D.C. 9.0 1,196 3
Westchester County, NY 2.0 250 1
Winnipeg, Canada 0.2 33 2
Worcester, MA 1.0 100 1
Total 360.9 53,758
NOTE: Average is calculated as the number of departures in the month of March divided by the number of days (31) in the month.
SOURCE: Innovata, March 2016.
PREPARED BY: Ricondo & Associates, Inc., March 2016.

FORT LAUDERDALE-HOLLYWOOD INTERNATIONAL AIRPORT JUNE 2016
FINAL
Airport Master Plan Update [3-18] Aviation Activity Forecast
Table 3.1-8: Historical O&D and Connection Enplaned Passenger Traffic
ENPLANED PASSENGERS SHARE
FISCAL YEAR ORIGINATING
ANNUAL CHANGE (%) CONNECTING
ANNUAL CHANGE (%) ORIGINATING CONNECTING
2005 10,663,925 10.7% 703,066 81.4% 94% 6%
2006 10,086,533 -5.4% 594,203 -15.5% 94% 6%
2007 10,623,944 5.3% 518,725 -12.7% 95% 5%
2008 10,611,068 -0.1% 979,371 88.8% 92% 8%
2009 9,764,042 -8.0% 703,846 -28.1% 93% 7%
2010 10,089,564 3.3% 823,354 17.0% 92% 8%
2011 10,637,212 5.4% 1,034,318 25.6% 91% 9%
2012 10,832,881 1.8% 908,852 -12.1% 92% 8%
2013 10,757,238 -0.7% 1,037,033 14.1% 91% 9%
2014 10,909,227 1.4% 1,115,487 7.6% 91% 9%
2015 11,849,538 8.6% 1,364,931 22.4% 90% 10%
Compound Annual Growth Rate
2005 – 2009 -0.2% 0.0%
2009 – 2015 3.3% 11.7%
2005 – 2015 1.1% 6.9%
NOTE: Foreign airlines do not report DB1B data to the U.S. DOT; foreign airline O&D activity has been estimated using U.S. DOT T-100 enplanement data.
SOURCES: U.S. Department of Transportation, T-100 and DB1B Survey, March 2016.
PREPARED BY: Ricondo & Associates, Inc., March 2016.
FORT LAUDERDALE-HOLLYWOOD INTERNATIONAL AIRPORT JUNE 2016
FINAL
Airport Master Plan Update [3-19] Aviation Activity Forecast
Table 3.1-9: FY 2015 Top 20 FLL Domestic O&D Markets
RANK MARKET STAGE LENGTH 1/ PDEW 2/ AVERAGE ONE-WAY
FARE NONSTOP SERVICE 3/
1 New York/Newark 4/ MH 8,040 $146 ●
2 Chicago 5/ MH 2,508 $132 ●
3 Atlanta SH 2,411 $103 ●
4 Baltimore MH 2,364 $93 ●
5 Boston MH 1,752 $154 ●
6 Detroit MH 1,721 $121 ●
7 Los Angeles LH 1,505 $207 ●
8 Dallas/Fort Worth 6/ MH 1,466 $116 ●
9 Washington, D.C. 7/ MH 1,387 $134 ●
10 San Juan MH 1,293 $130 ●
11 Philadelphia MH 1,271 $146 ●
12 San Francisco LH 1,097 $221 ●
13 Denver MH 1,004 $143 ●
14 Las Vegas LH 980 $152 ●
15 Hartford MH 793 $134 ●
16 Providence MH 714 $129 ●
17 Cleveland MH 677 $117 ●
18 Atlantic City MH 668 $73 ●
19 Houston 8/ MH 665 $144 ●
20 Buffalo MH 635 $134 ●
Total Top 20 Airports 32,949
Other O&D Markets 11,952
Total O&D Passengers 44,901
NOTES:
1/ Short Haul (SH) = 0 to 600 nautical miles, Medium Haul (MH) = 601 to 1,800 nautical miles, Long Haul (LH) = over 1,800 nautical miles.
2/ Passenger per Day, Each Way (PDEW).
3/ Nonstop service provided in FY 2015.
4/ Includes John F. Kennedy (JFK), LaGuardia (LGA), and Newark, NJ (EWR).
5/ Includes Chicago O'Hare (ORD) and Chicago Midway (MDW).
6/ Includes Dallas Love Field (DAL) and Dallas/Fort Worth (DFW).
7/ Includes Washington Reagan National (DCA) and Washington Dulles (IAD).
8/ Includes Houston Hobby (HOU) and Houston Bush Intercontinental (IAH).
SOURCES: U.S. Department of Transportation, DB1B Survey; Innovata, March 2016.
PREPARED BY: Ricondo & Associates, Inc., March 2016.
FORT LAUDERDALE-HOLLYWOOD INTERNATIONAL AIRPORT JUNE 2016
FINAL
Airport Master Plan Update [3-20] Aviation Activity Forecast
3.1.3 AIR FREIGHT AND MAIL
Table 3.1-10 presents air cargo activity (air freight and mail) in total U.S. tons that were handled at the Airport from FY 2005 to FY 2015. Overall cargo tons decreased at a CAGR of 7.6 percent per year, with the highest percentage decreases for mail volumes. As a result, air freight share of total cargo tons has increased from 93 percent in FY 2005 to 98 percent in FY 2015; however, over the same period, total air freight tons have decreased at a CAGR of 7.1 percent.
3.1.4 AIRCRAFT OPERATIONS
Table 3.1-11 presents historical aircraft operations at the Airport since FY 2015. Operations in each category of activity (passenger airlines, cargo, other air taxi, general aviation, and military) have fluctuated from year to year. Overall, the number of aircraft operations at the Airport decreased at a CAGR of 2.0 percent between FY 2005 and FY 2015. Passenger airline operations decreased at a CAGR of 0.9 percent, with the majority of the decline in the FY 2008–2009 period, which coincides with airline bankruptcies and service reductions during the economic recession. All-cargo operations decreased from 6,938 to 4,704 operations, a decreasing CAGR of 3.8 percent. Between FY 2011 and FY 2012, all-cargo operations decreased from 6,053 to 4,561, or 24.6 percent, but they have since stabilized, averaging approximately 4,500 annual operations. A significant portion of the all-cargo operations decrease in FY 2012 can be attributed to the elimination of service by Air Transport International and service reduction by UPS. Other air taxi operations declined at a CAGR of 2.7 percent between FY 2005 and FY 2015, compared to a decrease of 2.1 percent CAGR for general aviation/other air taxi traffic nationally. Since FY 2005, general aviation operations have steadily decreased from 71,995 in FY 2005 to 37,704 in FY 2015. From FY 2005 to FY 2012, the continued decrease in general aviation operations could be attributed to Hurricane Wilma, the economic recession, and the South Runway Program. The South Runway Program resulted in some general aviation operations diverting to Fort Lauderdale Executive (FXE) Airport. FXE is designated as a general aviation reliever airport for FLL. According to FAA estimates, FXE handled approximately 160,000 general aviation operations in FY 2015. At the Airport, military operations have fluctuated from year to year and have averaged approximately 550 operations from FY 2005 to FY 2015. In FY 2015, there were 431 military operations at FLL.
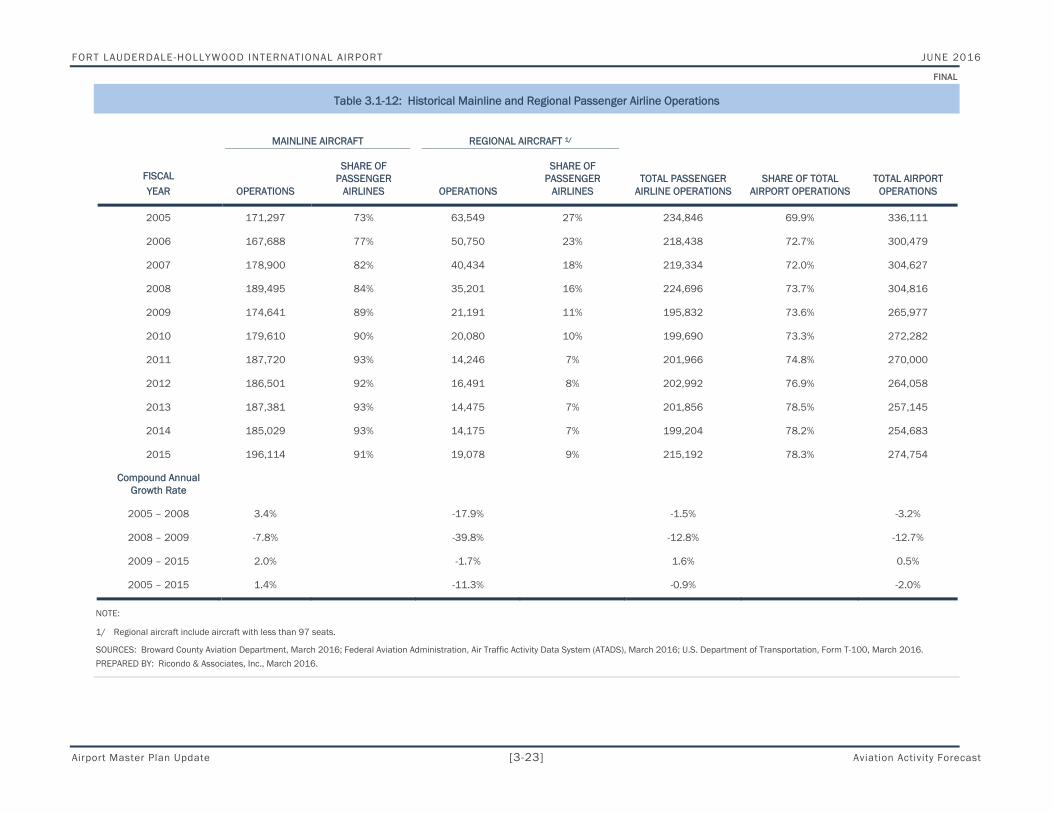
Table 3.1-12 presents the passenger airline operations by mainline and regional airlines. Mainline airlines are defined in this report as the large network airlines operating at the Airport (e.g., American Airlines, Delta Air Lines, etc.). Regional airlines are defined in this report as airlines operating flights on behalf of a mainline airline using their own operating certificate, or independent airlines operating aircraft with fewer than 97 seats and using their own operating certificate. Mainline airlines accounted for 91 percent of total passenger airline operations in FY 2015. Total mainline and regional passenger airline operations combined accounted for 78.3 percent of total airport operations in FY 2015. After a 10-year low of 73 percent of passenger airline operations in FY 2005, mainline passenger airline operations reached their largest share in FY 2011, and they have remained in the lower 90 percent range due, in large part, to Delta Air Lines and United Airlines (formerly under Continental) transition to larger mainline aircraft.

FORT LAUDERDALE-HOLLYWOOD INTERNATIONAL AIRPORT JUNE 2016
FINAL
Airport Master Plan Update [3-21] Aviation Activity Forecast
Table 3.1-10: Historical Cargo Tons
SHARE
FISCAL YEAR
AIR FREIGHT
ANNUAL CHANGE (%) MAIL
ANNUAL CHANGE (%)
TOTAL CARGO TONS
ANNUAL CHANGE (%)
AIR FREIGHT MAIL
2005 167,237 0.8% 11,922 -10.6% 179,159 0.0% 93% 7%
2006 154,333 -7.7% 10,853 -9.0% 165,186 -7.8% 93% 7%
2007 147,870 -4.2% 7,207 -33.6% 155,077 -6.1% 95% 5%
2008 131,053 -11.4% 6,782 -5.9% 137,835 -11.1% 95% 5%
2009 96,075 -26.7% 6,071 -10.5% 102,146 -25.9% 94% 6%
2010 93,024 -3.2% 2,186 -64.0% 95,210 -6.8% 98% 2%
2011 94,148 1.2% 2,715 24.2% 96,863 1.7% 97% 3%
2012 93,777 -0.4% 2,803 3.2% 96,580 -0.3% 97% 3%
2013 85,732 -8.6% 2,774 -1.0% 88,506 -8.4% 97% 3%
2014 82,583 -3.7% 4,329 56.0% 86,911 -1.8% 95% 5%
2015 79,898 -3.3% 1,424 -67.1% 81,322 -6.4% 98% 2%
Compound Annual
Growth Rate
2005 – 2008 -7.8% -17.1% -8.4%
2008 – 2009 -26.7% -10.5% -25.9%
2009 – 2015 -3.0% -21.5% -3.7%
2005 – 2015 -7.1% -19.1% -7.6%
NOTE: Figures in U.S. tons
SOURCE: Broward County Aviation Department, March 2016.
PREPARED BY: Ricondo & Associates, Inc., March 2016.

FORT LAUDERDALE-HOLLYWOOD INTERNATIONAL AIRPORT JUNE 2016
FINAL
Airport Master Plan Update [3-22] Aviation Activity Forecast
Table 3.1-11: Historical Aircraft Operations
FISCAL YEAR
PASSENGER AIRLINES ALL-CARGO
OTHER AIR TAXI
GENERAL AVIATION MILITARY TOTAL
ANNUAL CHANGE (%)
2005 234,846 6,938 22,020 71,955 352 336,111 9.0%
2006 218,438 6,783 18,202 56,686 370 300,479 -10.6%
2007 219,334 6,763 22,853 55,038 639 304,627 1.4%
2008 224,696 6,392 25,016 48,183 529 304,816 0.1%
2009 195,832 5,083 20,975 43,303 784 265,977 -12.7%
2010 199,690 5,336 21,310 45,041 905 272,282 2.4%
2011 201,966 6,053 19,915 41,589 477 270,000 -0.8%
2012 202,992 4,561 20,256 35,798 451 264,058 -2.2%
2013 201,856 4,279 15,039 35,399 572 257,145 -2.6%
2014 199,204 4,318 15,275 35,391 495 254,683 -1.0%
2015 215,192 4,704 16,723 37,704 431 274,754 7.9%
Compound Annual
Growth Rate
2005 – 2008 -1.5% -2.7% 4.3% -12.5% 14.5% -3.2%
2008 – 2009 -12.8% -20.5% -16.2% -10.1% 48.2% -12.7%
2009 – 2015 1.6% -1.3% -3.7% -2.3% -9.5% 0.5%
2005 – 2015 -0.9% -3.8% -2.7% -6.3% 2.0% -2.0%
SOURCES: Broward County Aviation Department, March 2016; Federal Aviation Administration, Air Traffic Activity Data System (ATADS), March 2016; U.S. Department of Transportation, Form T-100, March 2016.
PREPARED BY: Ricondo & Associates, Inc., March 2016.
FORT LAUDERDALE-HOLLYWOOD INTERNATIONAL AIRPORT JUNE 2016
FINAL
Airport Master Plan Update [3-23] Aviation Activity Forecast
Table 3.1-12: Historical Mainline and Regional Passenger Airline Operations
MAINLINE AIRCRAFT REGIONAL AIRCRAFT 1/
FISCAL YEAR OPERATIONS
SHARE OF PASSENGER
AIRLINES OPERATIONS
SHARE OF PASSENGER
AIRLINES TOTAL PASSENGER
AIRLINE OPERATIONS SHARE OF TOTAL
AIRPORT OPERATIONS TOTAL AIRPORT
OPERATIONS
2005 171,297 73% 63,549 27% 234,846 69.9% 336,111
2006 167,688 77% 50,750 23% 218,438 72.7% 300,479
2007 178,900 82% 40,434 18% 219,334 72.0% 304,627
2008 189,495 84% 35,201 16% 224,696 73.7% 304,816
2009 174,641 89% 21,191 11% 195,832 73.6% 265,977
2010 179,610 90% 20,080 10% 199,690 73.3% 272,282
2011 187,720 93% 14,246 7% 201,966 74.8% 270,000
2012 186,501 92% 16,491 8% 202,992 76.9% 264,058
2013 187,381 93% 14,475 7% 201,856 78.5% 257,145
2014 185,029 93% 14,175 7% 199,204 78.2% 254,683
2015 196,114 91% 19,078 9% 215,192 78.3% 274,754
Compound Annual Growth Rate
2005 – 2008 3.4% -17.9% -1.5% -3.2%
2008 – 2009 -7.8% -39.8% -12.8% -12.7%
2009 – 2015 2.0% -1.7% 1.6% 0.5%
2005 – 2015 1.4% -11.3% -0.9% -2.0%
NOTE:
1/ Regional aircraft include aircraft with less than 97 seats.
SOURCES: Broward County Aviation Department, March 2016; Federal Aviation Administration, Air Traffic Activity Data System (ATADS), March 2016; U.S. Department of Transportation, Form T-100, March 2016.
PREPARED BY: Ricondo & Associates, Inc., March 2016.

FORT LAUDERDALE-HOLLYWOOD INTERNATIONAL AIRPORT JUNE 2016
FINAL
Airport Master Plan Update [3-24] Aviation Activity Forecast
All-cargo, other air taxi, general aviation, and military aircraft operations are shown in Table 3.1-13, Table 3.1-14, Table 3.1-15, and Table 3.1-16. As shown in Table 3.1-15, local general aviation operations decreased from 134 in FY 2005 to 0 in FY 2009. Local general aviation operations have remained at zero from FY 2009 to FY 2015.
Table 3.1-13: Historical All-Cargo Aircraft Operations
FISCAL YEAR OPERATIONS
ANNUAL CHANGE (%) SHARE OF AIRPORT TOTAL AIRPORT TOTAL
ANNUAL CHANGE (%)
2005 6,938 46.4% 2.1% 336,111 9.0%
2006 6,783 -2.2% 2.3% 300,479 -10.6%
2007 6,763 -0.3% 2.2% 304,627 1.4%
2008 6,392 -5.5% 2.1% 304,816 0.1%
2009 5,083 -20.5% 1.9% 265,977 -12.7%
2010 5,336 5.0% 2.0% 272,282 2.4%
2011 6,053 13.4% 2.2% 270,000 -0.8%
2012 4,561 -24.6% 1.7% 264,058 -2.2%
2013 4,279 -6.2% 1.7% 257,145 -2.6%
2014 4,318 0.9% 1.7% 254,683 -1.0%
2015 4,704 8.9% 1.7% 274,754 7.9%
Compound Annual Growth Rate
2005 – 2008 -2.7% -3.2%
2008 – 2009 -20.5% -12.7%
2009 – 2015 -1.3% 0.5%
2005 – 2015 -3.8% -2.0%
SOURCES: Broward County Aviation Department, March 2016; Federal Aviation Administration, Air Traffic Activity Data System (ATADS), March 2016; U.S. Department of Transportation, Form T-100, March 2016.
PREPARED BY: Ricondo & Associates, Inc., March 2016.

FORT LAUDERDALE-HOLLYWOOD INTERNATIONAL AIRPORT JUNE 2016
FINAL
Airport Master Plan Update [3-25] Aviation Activity Forecast
Table 3.1-14: Historical Other Air Taxi Operations
FISCAL YEAR OPERATIONS
ANNUAL CHANGE (%) SHARE OF AIRPORT TOTAL AIRPORT TOTAL
ANNUAL CHANGE (%)
2005 22,020 0.0% 6.6% 336,111 9.0%
2006 18,202 -17.3% 6.1% 300,479 -10.6%
2007 22,853 25.6% 7.5% 304,627 1.4%
2008 25,016 9.5% 8.2% 304,816 0.1%
2009 20,975 -16.2% 7.9% 265,977 -12.7%
2010 21,310 1.6% 7.8% 272,282 2.4%
2011 19,915 -6.5% 7.4% 270,000 -0.8%
2012 20,256 1.7% 7.7% 264,058 -2.2%
2013 15,039 -25.8% 5.8% 257,145 -2.6%
2014 15,275 1.6% 6.0% 254,683 -1.0%
2015 16,723 9.5% 6.1% 274,754 7.9%
Compound Annual Growth Rate
2005 – 2008 4.3% -3.2%
2008 – 2009 -16.2% -12.7%
2009 – 2015 -3.7% 0.5%
2005 – 2015 -2.7% -2.0%
SOURCES: Broward County Aviation Department, March 2016; ; Federal Aviation Administration, Air Traffic Activity Data System (ATADS), March 2016; U.S. Department of Transportation, Form T-100, March 2016.
PREPARED BY: Ricondo & Associates, Inc., March 2016.

FORT LAUDERDALE-HOLLYWOOD INTERNATIONAL AIRPORT JUNE 2016
FINAL
Airport Master Plan Update [3-26] Aviation Activity Forecast
Table 3.1-15: Historical General Aviation Operations
OPERATIONS SHARE
FISCAL YEAR ITINERANT LOCAL TOTAL
ANNUAL CHANGE (%) ITINERANT LOCAL
SHARE OF AIRPORT
TOTAL AIRPORT
TOTAL
ANNUAL CHANGE
(%)
2005 71,821 134 71,955 1.6% 99.8% 0.2% 21.4% 336,111 9.0%
2006 56,382 304 56,686 -21.2% 99.5% 0.5% 18.9% 300,479 -10.6%
2007 55,006 32 55,038 -2.9% 99.9% 0.1% 18.1% 304,627 1.4%
2008 48,115 68 48,183 -12.5% 99.9% 0.1% 15.8% 304,816 0.1%
2009 43,303 0 43,303 -10.1% 100.0% 0.0% 16.3% 265,977 -12.7%
2010 45,041 0 45,041 4.0% 100.0% 0.0% 16.5% 272,282 2.4%
2011 41,589 0 41,589 -7.7% 100.0% 0.0% 15.4% 270,000 -0.8%
2012 35,798 0 35,798 -13.9% 100.0% 0.0% 13.6% 264,058 -2.2%
2013 35,399 0 35,399 -1.1% 100.0% 0.0% 13.8% 257,145 -2.6%
2014 35,391 0 35,391 0.0% 100.0% 0.0% 13.9% 254,683 -1.0%
2015 37,704 0 37,704 6.5% 100.0% 0.0% 13.7% 274,754 7.9%
Compound Annual Growth
Rate
2005 – 2008 -12.5% -20.2% -12.5% -3.2%
2008 – 2009 -10.0% -100.0% -10.1% -12.7%
2009 – 2015 -2.3% 0.0% -2.3% 0.5%
2005 – 2015 -6.2% -100.0% -6.3% -2.0%
SOURCES: Broward County Aviation Department;, March 2016; Federal Aviation Administration, Air Traffic Activity Data System (ATADS), March 2016.
PREPARED BY: Ricondo & Associates, Inc., March 2016.

FORT LAUDERDALE-HOLLYWOOD INTERNATIONAL AIRPORT JUNE 2016
FINAL
Airport Master Plan Update [3-27] Aviation Activity Forecast
Table 3.1-16: Historical Military Operations
OPERATIONS SHARE
FISCAL YEAR ITINERANT LOCAL TOTAL
ANNUAL CHANGE (%) ITINERANT LOCAL
SHARE OF AIRPORT
TOTAL AIRPORT
TOTAL ANNUAL
CHANGE (%)
2005 346 6 352 -44.3% 98.3% 1.7% 0.1% 336,111 9.0%
2006 370 0 370 5.1% 100.0% 0.0% 0.1% 300,479 -10.6%
2007 639 0 639 72.7% 100.0% 0.0% 0.2% 304,627 1.4%
2008 526 3 529 -17.2% 99.4% 0.6% 0.2% 304,816 0.1%
2009 784 0 784 48.2% 100.0% 0.0% 0.3% 265,977 -12.7%
2010 905 0 905 15.4% 100.0% 0.0% 0.3% 272,282 2.4%
2011 477 0 477 -47.3% 100.0% 0.0% 0.2% 270,000 -0.8%
2012 451 0 451 -5.5% 100.0% 0.0% 0.2% 264,058 -2.2%
2013 572 0 572 26.8% 100.0% 0.0% 0.2% 257,145 -2.6%
2014 495 0 495 -13.5% 100.0% 0.0% 0.2% 254,683 -1.0%
2015 431 0 431 -12.9% 100.0% 0.0% 0.2% 274,754 7.9%
Compound Annual Growth
Rate
2005 – 2008 15.0% -20.6% 14.5% -3.2%
2008 – 2009 49.0% -100.0% 48.2% -12.7%
2009 – 2015 -9.5% 0.0% -9.5% 0.5%
2005 – 2015 2.2% -100.0% 2.0% -2.0%
SOURCES: Broward County Aviation Department, March 2016; Federal Aviation Administration, Air Traffic Activity Data System (ATADS), March 2016.
PREPARED BY: Ricondo & Associates, Inc., March 2016.

FORT LAUDERDALE-HOLLYWOOD INTERNATIONAL AIRPORT JUNE 2016
FINAL
Airport Master Plan Update [3-28] Aviation Activity Forecast
3.1.5 BASED AIRCRAFT
As shown in Table 3.1-17, the overall decline in the number of based aircraft at FLL between FY 2005 and FY 2011 was, in part, the result of Hurricane Wilma, the economic recession and the South Runway Program. Based jet aircraft increased from 17 aircraft in FY 2005 to 43 aircraft in FY 2012. Since FY 2012, the number of based jet aircraft has remained constant.
Table 3.1-17: Based Aircraft
FISCAL YEAR SINGLE JET MULTI HELICOPTER TOTAL
2005 53 17 83 6 159
2006 9 40 48 3 100
2007 10 57 58 4 129
2008 8 40 42 4 94
2009 1 29 23 2 55
2010 5 38 12 2 57
2011 2 31 15 1 49
2012 7 43 23 3 76
2013 8 43 17 3 71
2014 12 54 22 6 94
2015 12 54 22 6 94
Compound Annual Growth Rate
2005 – 2008 -46.8% 33.0% -20.3% -12.6% -16.1%
2008 – 2009 -87.5% -27.5% -45.2% -50.0% -41.5%
2009 – 2015 51.9% 10.9% -0.7% 20.1% 9.3%
2005 – 2015 -13.8% 12.3% -12.4% 0.0% -5.1%
SOURCE: Federal Aviation Administration Terminal Area Forecast (TAF), March 2016.
PREPARED BY: Ricondo & Associates, Inc., March 2016.
3.2 Factors Affecting Aviation Demand at the Airport
This section discusses qualitative factors that could influence future aviation demand at the Airport throughout the forecast period. Data and information related to these factors have been either directly or indirectly incorporated into the development of activity forecasts for the Airport. The qualitative factors considered in forecasting aviation activity at FLL are discussed in the following subsections. These factors include broad economic and industry influences that are recognized to have a potential to inhibit or support growth in aviation activity. Each factor is unique and not dependent on any other factor. Therefore, each factor is discussed individually; however, multiple factors may influence future activity at the Airport at any point in time.

FORT LAUDERDALE-HOLLYWOOD INTERNATIONAL AIRPORT JUNE 2016
FINAL
Airport Master Plan Update [3-29] Aviation Activity Forecast
3.2.1 NATIONAL ECONOMY
Trends in airline travel demand, measured by either passenger volumes or passenger revenue, can be correlated with national and regional economic trends, including Gross Domestic/Regional Product, Population, Employment, Earnings, and Personal Income. Forecast growth of the key socioeconomic variables used in the forecast of airport activity is presented in Table 3.2-1. Notably, by most measures, regional economic growth is forecast to be higher for the region than the U.S. overall. Actual economic activity may differ from this independent projection, resulting in variations in demand relative to the forecast.
Table 3.2-1: Forecast Growth of U.S. and Regional Socioeconomic Activity Drivers
SOCIOECONOMIC MEASURE REGION FORECAST 2015-2035 CAGR
Population U.S. 0.9%
CSA 1.2%
MSA 1.2%
Employment U.S. 1.3%
CSA 1.6%
MSA 1.6%
Earnings U.S. 2.0%
CSA 2.3%
MSA 2.3%
Net Earnings U.S. 2.1%
CSA 2.3%
MSA 2.3%
Personal Income U.S. 2.2%
CSA 2.5%
MSA 2.5%
Per Capita Personal Income U.S. 1.3%
CSA 1.2%
MSA 1.2%
Gross Regional/National Product U.S. 2.1%
CSA 2.4%
MSA 2.4%
SOURCE: 2015 CEEDS Woods & Poole Economics, Inc., March 2016.
PREPARED BY: Ricondo & Associates, Inc., April 2016.
3.2.2 STATE OF THE AIRLINE INDUSTRY
In the aftermath of the terrorist attacks on September 11, 2001, the U.S. airline industry experienced an adverse shift in the demand for airline travel, which exacerbated problems for a U.S. airline industry already weakened by the slowing economy and the rising labor and fuel costs. This resulted in operating losses between 2001 through 2004 that totaled more than $22 billion (excluding extraordinary charges and gains). From 2005 through 2007,

FORT LAUDERDALE-HOLLYWOOD INTERNATIONAL AIRPORT JUNE 2016
FINAL
Airport Master Plan Update [3-30] Aviation Activity Forecast
airline industry performance improved, posting combined operating profits.4 However, in 2008 and through the first half of 2009, the combination of record-high fuel prices, weakening economic conditions, and a weak dollar resulted in the worst financial environment for the U.S. network and low-cost airlines since September 11, 2001. Since 2009, the airline industry has improved; industry consolidation, capacity realignment, and a recovering economy helped drive record industry profits in 2013 and 2014. North American airline members of the International Air Transport Association are projected to generate profits of $15.7 billion in 2015, after producing $11.2 billion in profits in 2014.5 Industry-wide profitability will have a direct impact on airline industry willingness to allocate capacity in the market, with a significant decrease in capacity potentially causing a reduction in passenger enplanements.
3.2.3 AIRLINE MERGERS AND ACQUISITIONS
Since 2009, airlines have merged or acquired competitors in order to become more competitive and cost-efficient. In 2009, Delta Air Lines completed its merger with Northwest Airlines, initiating a wave of U.S. airline mergers and acquisitions. That same year, Republic Airways Holdings, a regional airline holding corporation, acquired Frontier Airlines of Denver and Midwest Airlines of Milwaukee. In 2010, United Airlines and Continental Airlines merged. In 2011, Southwest Airlines acquired AirTran Holdings, Inc., the former parent company of low-cost competitor AirTran Airways. In 2013, American Airlines and US Airways merged, creating the largest airline in terms of operating revenue and revenue passenger miles. These mergers have enabled airlines to reduce capacity and achieve higher profitability. Additional consolidation in the U.S. industry could alter the competitive landscape at the Airport, affecting future activity.
3.2.4 COST OF AVIATION FUEL
The price of fuel is one of the most significant and volatile expenses for airlines. Historically, fuel has been the first or second largest operating expense for the airline industry, shifting with labor cost. As of the third calendar quarter of 2015, fuel was the second largest operating expense for the airline industry after labor, representing 18.9 percent of operating expenses. Exhibit 3.2-1 shows the quarterly average prices of jet fuel and crude oil from January 2007 through January 2016. Since 2007, the average quarterly price of jet fuel fluctuated between a high of $3.84 per gallon in July 2008 to a low of $1.27 in January 2016.
Fluctuating fuel costs will continue to impact airline profitability, and this could lead to changes in air service as airlines adjust air service to address increases or decreases in this significant expense.
4 Airlines for America, 2009 Economic Report, July 2009.
5 International Air Transport Association, Economic Performance of the Industry, June 2015.

FORT LAUDERDALE-HOLLYWOOD INTERNATIONAL AIRPORT JUNE 2016
FINAL
Airport Master Plan Update [3-31] Aviation Activity Forecast
Exhibit 3.2-1: Historical Monthly Averages of Jet Fuel and Crude Oil Prices
SOURCES: U.S. Bureau of Transportation Statistics (Average Jet Fuel Prices), January 2016; U.S. Energy Information Administration (Average Crude Oil Prices), March 2016.
PREPARED BY: Ricondo & Associates, Inc., March 2016.
3.2.5 THREAT OF TERRORISM AND GEOPOLITICAL ISSUES
Since September 11, 2001, the recurrence of terrorism incidents against either domestic or world aviation remains a risk to achieving the activity forecasts contained in this report. Tighter security measures have restored the public’s confidence in the safety of U.S. and world air travel. However, any terrorist incident aimed at aviation could have an impact on the demand for aviation services.
Additionally, geopolitical issues may affect aviation demand during the forecast period. Potential governmental or regional instability in certain countries or locations may affect access to, or demand for, aviation service in these places. Future governmental or regional instability may have an impact on demand for international aviation service at the Airport.
3.2.6 OPERATIONAL CAPACITY OF THE NATIONAL AIRSPACE SYSTEM
A significant concern of the FAA is how increased delays at busy airports impact the efficiency of the National Airspace System (NAS). In its January 2015 Airport Capacity Needs in the National Airspace System report, the FAA stated the need to address delays that remain at key airports since the 2007 assessment, as well as the need to implement NextGen airspace system improvements. The report emphasized the need to continue to invest in system improvements with airfield enhancements and NextGen capabilities.
$0.00
$0.50
$1.00
$1.50
$2.00
$2.50
$3.00
$3.50
$4.00
$4.50
$0
$20
$40
$60
$80
$100
$120
$140
$160Ja
n-07
Mar
-07
May
-07
Jul-0
7Se
p-07
Nov
-07
Jan-
08M
ar-0
8M
ay-0
8Ju
l-08
Sep-
08N
ov-0
8Ja
n-09
Mar
-09
May
-09
Jul-0
9Se
p-09
Nov
-09
Jan-
10M
ar-1
0M
ay-1
0Ju
l-10
Sep-
10N
ov-1
0Ja
n-11
Mar
-11
May
-11
Jul-1
1Se
p-11
Nov
-11
Jan-
12M
ar-1
2M
ay-1
2Ju
l-12
Sep-
12N
ov-1
2Ja
n-13
Mar
-13
May
-13
Jul-1
3Se
p-13
Nov
-13
Jan-
14M
ar-1
4M
ay-1
4Ju
l-14
Sep-
14N
ov-1
4Ja
n-15
Mar
-15
May
-15
Jul-1
5Se
p-15
Nov
-15
Jan-
16
Jet F
uel P
rice/
Gal
lon
Crud
e O
il Pr
ice/
Barr
el
Month - Year
Average Crude Oil Prices
Average Jet Fuel Prices

FORT LAUDERDALE-HOLLYWOOD INTERNATIONAL AIRPORT JUNE 2016
FINAL
Airport Master Plan Update [3-32] Aviation Activity Forecast
3.2.7 COMPETING AIRPORTS
The Airport is subject to competition for passengers traveling to and from South Florida, primarily from Miami International Airport (MIA) located approximately 30 miles to the south of FLL and Palm Beach International Airport (PBI) located approximately 50 miles to the north, shown previously on Exhibit 3-1.1.
As shown in Exhibit 3.2-2, total airline seat capacity among the region’s three airports has remained generally constant, and the Airport has maintained a uniform share relative to MIA and PBI, between 33 and 36 percent. In four of the past five years, FLL’s share was 35 percent. These departing airline seat shares are reflective of total enplaned passenger shares among the airports within the region.
FLL and PBI primarily serve passengers traveling to the South Florida region as the origin or destination point of their journeys (O&D passengers). MIA, a major hub for American Airlines, has historically served a greater component of connecting passengers using MIA as a waypoint on journeys between two other airports.
Exhibit 3.2-2: Annual Share of South Florida’s Airports Total Departing Airline Seat Capacity
SOURCE: Innovata, March 2016.
PREPARED BY: Ricondo & Associates, Inc., March 2016.
3.2.7.1 Domestic Passengers
The airlines serving FLL combine to offer the greatest volume of airline seats to domestic destinations among the airports in the region (Exhibit 3.2-3). As shown on Exhibit 3.2-4, competition among airlines serving domestic destinations differs markedly at the three regional airports, particularly when comparing FLL and PBI to MIA. In MIA, American Airlines provided over 80 percent of domestic seat capacity in FY 2015, while in FLL and PBI, service is spread more evenly across competitors. In FY 2015, no single airline at FLL had more than 22 percent of domestic seat capacity share.
67% 64% 65% 64% 64% 65% 65% 65% 66% 65% 65%
33% 36% 35% 36% 36%35% 35%
35% 34% 35% 35%
0.0
5.0
10.0
15.0
20.0
25.0
30.0
35.0
40.0
45.0
2005 2006 2007 2008 2009 2010 2011 2012 2013 2014 2015Annual Departing Seat Cap
acity (m
illions)
Fiscal Year
MIA and PBI FLL

F
A
FORT LAUDERD
Airport Master P
SOURCE: Inno
PREPARED BY
SOURCE: Inno
PREPARED BY
Annual Domestic Departing Seat Cap
acity
(millions)
DALE-HOLLYWO
Plan Update
Exhibit 3.2-3:
ovata, March 2016.
Y: Ricondo & Associa
Exh
FLL
ovata, March 2016.
Y: Ricondo & Associa
53%
47%
0.0
5.0
10.0
15.0
20.0
25.0
30.0
2005
OD INTERNATI
: Annual Share
ates, Inc., March 20
ibit 3.2-4: Airlin
ates, Inc., March 20
55% 5
45% 4
5 2006 2
ONAL AIRPORT
of South Florid
016.
ne Shares of Do
016.
55% 55%
45% 45%
2007 2008
Delta ALines, 11
United Airlines, 4
T
[3-33]
a’s Airports Tota
omestic Seat Ca
MIA
54% 56
46%44
2009 20
Fiscal
MIA and
AmeAirl8
ir 1%
%Fr
AirlOther, 0%
al Domestic De
apacity from Sou
6% 56%
4% 44%
10 2011
Year
d PBI FLL
erican ines, 2%
rontier lines, 2%
eparting Airline S
uth Florida Airp
56% 55%
44% 45%
2012 2013
AmericaAirlines,21%
Southwest Airlines, 11%
Other,
J
Aviation Activi
Seat Capacity
orts
PBI
% 56%
% 44%
3 2014 2
JetAirw2
Delta Lines, 2
n ,
, 14%
JUNE 2016
FINAL
ity Forecast
56%
44%
2015
Blue ways, 7%
Air 26%

FORT LAUDERDALE-HOLLYWOOD INTERNATIONAL AIRPORT JUNE 2016
FINAL
Airport Master Plan Update [3-34] Aviation Activity Forecast
With the robust competition among airlines operating domestically at the Airport, and because a substantial portion of American Airlines’ domestic seat capacity to and from MIA accommodates connecting passengers, FLL maintains a share of domestic O&D passenger activity that is disproportionately higher than its share of domestic airline seat capacity, as illustrated on Exhibit 3.2-5. As illustrated in Table 3.2-2, both FLL and MIA offered nonstop service to all of the top 20 domestic O&D markets. However, in each market, FLL had a lower average fare than the region as a whole. In 17 of the 20 markets, FLL held the largest share of O&D passengers.
Exhibit 3.2-5: Annual Share of South Florida’s Airports Domestic O&D Passengers
SOURCE: U.S. Department of Transportation, DB1B Survey, March 2016.
PREPARED BY: Ricondo & Associates, Inc., March 2016.
Continued robust competition at FLL and the continued use of MIA by American Airlines as a hub supporting both O&D and connecting passengers will support FLL’s continued role as the region’s primary domestic O&D airport. While American Airlines restructured the scheduling of its hub in MIA (referred to by the airline as “rebanking”), it has done so primarily in order to facilitate more efficient connections for passengers at that airport. Additional capacity from the airlines operating at FLL will further enable the Airport to capture O&D passengers in the South Florida region.
3.2.7.2 International Passengers
With MIA’s prominence as an international connecting hub within American Airlines’ route network, FLL has maintained a relatively small share of nonstop international airline seat capacity in the South Florida region (Exhibit 3.2-6). However, as with domestic O&D markets, and as reflected on Exhibit 3.2-7, FLL has maintained a disproportionately high share of international O&D passenger activity among the airports in South Florida, relative to its international seat share. Between FY 2005 and FY 2015, FLL’s share of international seat capacity has grown from 13 percent to 20 percent, while its international O&D passenger share has grown from 14 percent to 28 percent. As presented in Table 3.2-3, FLL maintains international seat capacity across regions also served from MIA (albeit in different proportions), with a focus primarily on destinations in Latin America, the Caribbean, and Mexico.
40% 46% 45% 46% 48% 47% 55% 46% 46% 48% 46%
60% 54% 55% 56% 52% 53% 55% 54% 54% 52% 54%
0
2
4
6
8
10
12
14
16
18
20
2005 2006 2007 2008 2009 2010 2011 2012 2013 2014 2015Annual Domestic Departing O&D
Passengers (millions)
Fiscal Year
MIA and PBI FLL

FORT LAUDERDALE-HOLLYWOOD INTERNATIONAL AIRPORT JUNE 2016
FINAL
Airport Master Plan Update [3-35] Aviation Activity Forecast
Table 3.2-2: Service and Fare Comparison from South Florida’s Airports to Top 20 Domestic O&D Markets
AVERAGE FARE (ONE WAY) NONSTOP SERVICE O&D
PASSENGER SHARE
O&D MARKET
ANNUAL ONE WAY O&D
PASSENGERS FLL REGION DIFFERENCE FLL MIA PBI FLL MIA PBI FLL
HIGHEST
NYC 1/ 3,830,411 147 158 -6.9% x x x 42% 30% 28% x
CHI 2/ 862,907 132 150 -12.1% x x x 53% 35% 12% x
ATL 847,974 103 116 -11.1% x x x 52% 34% 14% x
BOS 748,401 154 166 -7.4% x x x 43% 26% 31% x
WAS 3/ 661,331 134 143 -6.3% x x x 38% 44% 18%
BWI 607,015 93 104 -10.6% x x x 71% 15% 14% x
LAX 589,737 207 238 -13.0% x x x 47% 48% 6%
PHL 568,176 146 153 -4.6% x x x 41% 36% 23% x
DTW 478,240 121 135 -10.5% x x x 66% 24% 10% x
DFW 361,394 121 153 -21.3% x x x 52% 36% 13% x
SFO 357,405 221 245 -9.7% x x 56% 39% 5% x
SJU 352,899 130 145 -10.4% x x 67% 33% 0% x
DEN 336,466 143 155 -7.8% x x x 54% 37% 9% x
LAS 321,882 152 190 -20.0% x x 56% 39% 5% x
IAH 263,396 144 168 -14.3% x x x 46% 48% 6%
BDL 256,324 134 144 -6.8% x x x 56% 17% 27% x
MSP 205,683 175 193 -9.0% x x 50% 40% 10% x
RDU 199,677 110 120 -8.4% x x 50% 41% 9% x
PIT 186,376 117 128 -8.2% x x x 62% 23% 15% x
MSY 174,372 105 130 -19.0% x x 58% 36% 6% x
Total 12,210,066 Average -10.9%
NOTES:
Data represents fiscal year 2015 (October – September).
1/ The NYC market includes John F. Kennedy International Airport (JFK), LaGuardia Airport (LGA), Newark Liberty International Airport (EWR), Westchester Airport (HPN), and Long Island MacArthur Airport (ISP)
2/ The CHI market includes O'Hare International Airport (ORD) and Midway International Airport (MDW).
3/ The WAS market includes Reagan National Airport (DCA) and Dulles International Airport (IAD).
SOURCES: U.S. Department of Transportation, DB1B Survey; March 2016 Innovata, March 2016.
PREPARED BY: Ricondo & Associates, Inc., March 2016.

FORT LAUDERDALE-HOLLYWOOD INTERNATIONAL AIRPORT JUNE 2016
FINAL
Airport Master Plan Update [3-36] Aviation Activity Forecast
Exhibit 3.2-6: Annual Share of South Florida’s Airports International Departing Airline Seat Capacity
SOURCE: Innovata, March 2016.
PREPARED BY: Ricondo & Associates, Inc., March 2016.
Exhibit 3.2-7: Annual Share of South Florida’s Airports International O&D Passengers
SOURCE: U.S. Department of Transportation, T-100 and DB1B Survey, March 2016; Ricondo & Associates, Inc., (Analysis), March 2016.
PREPARED BY: Ricondo & Associates, Inc., March 2016.
87% 85% 84% 84% 83% 84% 84% 84% 84% 82% 80%
13% 15% 16%16%
17% 16%16%
16% 16% 18%20%
0.0
2.0
4.0
6.0
8.0
10.0
12.0
14.0
16.0
18.0
2005 2006 2007 2008 2009 2010 2011 2012 2013 2014 2015
Annual In
ternational Departing Seat Cap
acity
(millions)
Fiscal Year
MIA and PBI FLL
86% 85% 81% 78% 78% 78% 77% 77% 77% 74% 72%
14% 15% 19% 22% 22% 22% 23% 23% 23% 26% 28%
0
1
2
3
4
5
6
7
8
9
2005 2006 2007 2008 2009 2010 2011 2012 2013 2014 2015Annual In
ternational Departing O&D
Passengers (millions)
Fiscal Year
MIA and PBI FLL
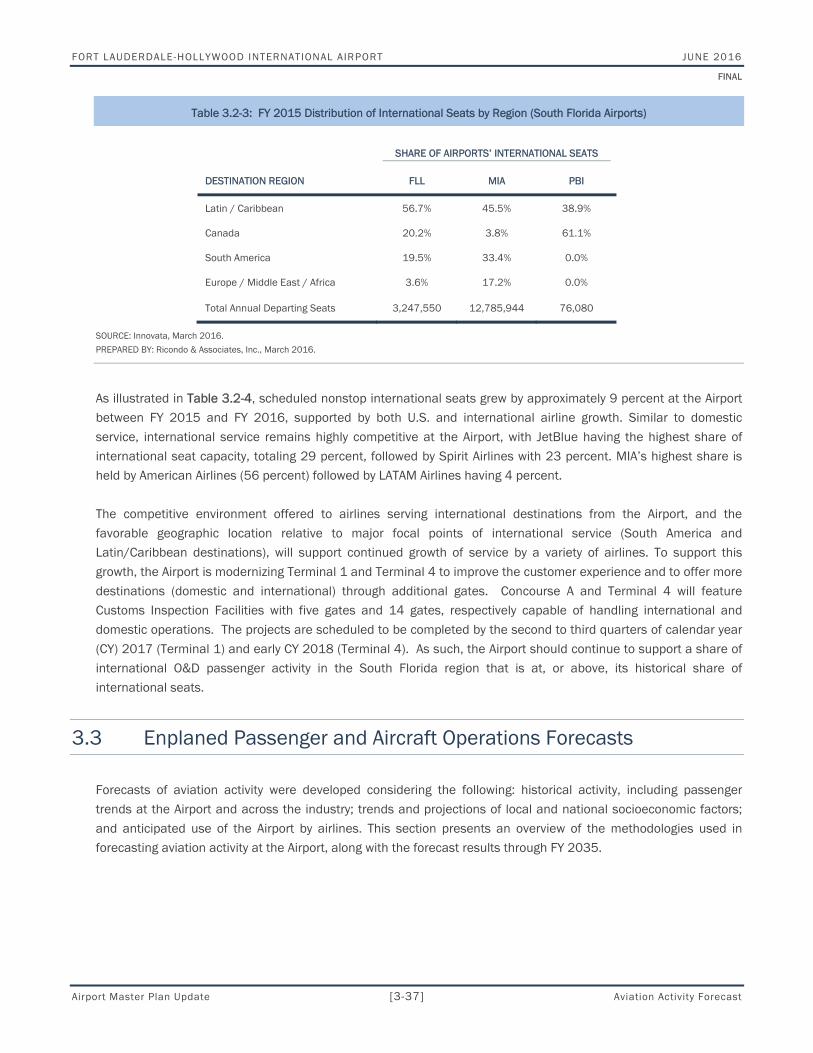
FORT LAUDERDALE-HOLLYWOOD INTERNATIONAL AIRPORT JUNE 2016
FINAL
Airport Master Plan Update [3-37] Aviation Activity Forecast
Table 3.2-3: FY 2015 Distribution of International Seats by Region (South Florida Airports)
SHARE OF AIRPORTS’ INTERNATIONAL SEATS
DESTINATION REGION FLL MIA PBI
Latin / Caribbean 56.7% 45.5% 38.9%
Canada 20.2% 3.8% 61.1%
South America 19.5% 33.4% 0.0%
Europe / Middle East / Africa 3.6% 17.2% 0.0%
Total Annual Departing Seats 3,247,550 12,785,944 76,080
SOURCE: Innovata, March 2016.
PREPARED BY: Ricondo & Associates, Inc., March 2016.
As illustrated in Table 3.2-4, scheduled nonstop international seats grew by approximately 9 percent at the Airport between FY 2015 and FY 2016, supported by both U.S. and international airline growth. Similar to domestic service, international service remains highly competitive at the Airport, with JetBlue having the highest share of international seat capacity, totaling 29 percent, followed by Spirit Airlines with 23 percent. MIA’s highest share is held by American Airlines (56 percent) followed by LATAM Airlines having 4 percent.
The competitive environment offered to airlines serving international destinations from the Airport, and the favorable geographic location relative to major focal points of international service (South America and Latin/Caribbean destinations), will support continued growth of service by a variety of airlines. To support this growth, the Airport is modernizing Terminal 1 and Terminal 4 to improve the customer experience and to offer more destinations (domestic and international) through additional gates. Concourse A and Terminal 4 will feature Customs Inspection Facilities with five gates and 14 gates, respectively capable of handling international and domestic operations. The projects are scheduled to be completed by the second to third quarters of calendar year (CY) 2017 (Terminal 1) and early CY 2018 (Terminal 4). As such, the Airport should continue to support a share of international O&D passenger activity in the South Florida region that is at, or above, its historical share of international seats.
3.3 Enplaned Passenger and Aircraft Operations Forecasts
Forecasts of aviation activity were developed considering the following: historical activity, including passenger trends at the Airport and across the industry; trends and projections of local and national socioeconomic factors; and anticipated use of the Airport by airlines. This section presents an overview of the methodologies used in forecasting aviation activity at the Airport, along with the forecast results through FY 2035.

FORT LAUDERDALE-HOLLYWOOD INTERNATIONAL AIRPORT JUNE 2016
FINAL
Airport Master Plan Update [3-38] Aviation Activity Forecast
Table 3.2-4: Recent Changes in International Nonstop Airline Service From South Florida Airports
FY 2015 FY 2016 CHANGE PERCENT CHANGE
FLL MIA PBI FLL MIA PBI FLL MIA PBI FLL MIA PBI
U.S. Airlines
Number 4 2 1 6 2 1 2 0 0 50.0% 0.0% 0.0%
Annual Departing Seats 1,851,118 7,458,319 11,220 2,082,958 7,301,841 12,002 231,840 (156,478) 782 12.5% 0 7.0%
International Airlines Number 14 42 2 13 45 3 (1) 3 1 -7.1% 0 50.0%
Annual Departing Seats 1,396,432 5,327,625 64,860 1,446,639 5,801,517 80,688 50,207 473,892 15,828 3.6% 0 24.4%
All Airlines
Number 18 44 3 19 47 4 1 3 1 5.6% 0 33.3%
Annual Departing Seats 3,247,550 12,785,944 76,080 3,529,597 13,103,358 92,690 282,047 317,414 16,610 8.7% 0 21.8%
Airline Competition
Highest Airline Seat Share 26% 58% 61% 29% 56% 56%
Airline JetBlue Airways
American Airlines
Air Canada JetBlue Airways
American Airlines
Air Canada
Second Highest Seat Share 24% 4% 24% 23% 4% 23%
Airline Spirit
Airlines LATAM Bahamasair
Spirit Airlines
LATAM Bahamasair
SOURCE: Innovata, March 2016.
PREPARED BY: Ricondo & Associates, Inc., March 2016.
FORT LAUDERDALE-HOLLYWOOD INTERNATIONAL AIRPORT JUNE 2016
FINAL
Airport Master Plan Update [3-39] Aviation Activity Forecast
3.3.1 ASSUMPTIONS UNDERLYING THE FORECASTS
The forecasts of enplaned passengers and aircraft operations were based on a number of underlying assumptions, including:
Unconstrained forecasts (facility wise).
The Airport will continue to serve as an O&D market for domestic and international airlines, including traditional network airlines and low-cost airlines.
The Airport will serve as a connecting point and as a gateway for international travel to destinations largely throughout the Caribbean and Latin/South America.
For these analyses, and similar to the FAA's nationwide forecasts, it was assumed that there will be no terrorist incidents during the forecast period that would have significant, negative, or prolonged effects on aviation activity at the Airport or nationwide.
Economic disturbances will occur during the forecast period, causing year-to-year variations in airline traffic. However, long-term increases in nationwide and Airport traffic are forecast.
It was assumed that no major “acts of God” that may disrupt the national or global airspace system will occur during the forecast period, which would negatively affect aviation activity at the Airport.
Many of the factors influencing aviation activity cannot be quantified, and any forecast is subject to uncertainties. Therefore, the forecasting process should not be viewed as precise. Actual airline traffic at the Airport may differ from the forecasts presented herein, because events and circumstances do not occur as expected, and those differences may be material.
3.3.2 ENPLANED PASSENGER AND PASSENGER AIRCRAFT OPERATIONS FORECAST METHODOLOGY AND RESULTS
Passenger-related activity forecasts were developed for two time horizons: a near-term forecast for FY 2016 and a longer-term forecast for the period FY 2017 through FY 2035. Specific forecasting methodologies are described in the following subsections.
3.3.2.1 Near-Term Forecast (FY 2016) Methodology
Published airline schedules through September 2016 were analyzed, and flight segment-level estimates of airline performance were developed based on trends in load factors and completion rates, which were identified through analysis of actual performance data furnished by the Airport, as well as thorough analysis of U.S. DOT enplaned passenger and O&D data available through June 2015. Estimates of load factors and completion rates were applied to scheduled capacity to derive forecasts of enplaned passengers and aircraft operations for FY 2016.
3.3.2.2 Longer-Term Forecast (FY 2017 through FY 2035) Methodology
Airline service at FLL is supported by the Airport’s underlying O&D passenger base and, in the case of hubbing or heavily concentrated airlines, a component of connecting passengers. Growth of the Airport’s underlying O&D passenger base was analyzed in the context of the Airport’s share of O&D passengers among other South Florida airports, specifically MIA and PBI. The Airport’s O&D passenger volume is expected to grow throughout the forecast period, due to a forecast of 2.1 percent overall growth in the South Florida O&D market (Table 3.3-1) and an increase in the Airport’s share of the South Florida market, resulting from disproportionately high growth in airline

FORT LAUDERDALE-HOLLYWOOD INTERNATIONAL AIRPORT JUNE 2016
FINAL
Airport Master Plan Update [3-40] Aviation Activity Forecast
activity at FLL. Connecting passenger volumes at FLL were forecast on an airline-by-airline basis. Consideration was given to how each airline is expected to develop its route network at the Airport, as well as how the design of those networks may support connecting passengers.
Segmentation of Passengers
Passengers who have historically used the airports in South Florida were categorized into four segments, beyond the more general classification of either a domestic or international enplanement, in order to more accurately identify the nature of passenger journeys and to better understand the drivers of that demand. Those four segments are:
Domestic O&D: Passengers using the airports as an origin or destination point for journeys within the United States.
International O&D: Passengers using the airports as an origin or destination point for journeys to or from points outside the United States. This category includes passengers whose ultimate destination is an international point, but who use a flight segment to or from another domestic airport that serves as the international gateway (for example, a passenger flying from FLL to London via Hartsfield-Jackson Atlanta International Airport [ATL]). While this type of passenger is on an international itinerary, this type of passenger is reported as a domestic enplaned passenger.
Domestic Connecting: Passengers using the airports as a waypoint for journeys between two other airports within the United States.
International Connecting: Passengers using the airports as a waypoint for journeys between two other airports, at least one of which is an international point. This category includes international-to-international journeys. This category also includes passengers who depart from an airport on a domestic flight after arriving at that airport on a flight from an international origin. While this type of passenger is on an international itinerary, they are reported as a domestic enplaned passenger.
Forecast Growth of the South Florida O&D Passenger Base
South Florida O&D passenger growth was forecast using socioeconomic regression analysis. Socioeconomic regression analysis is used to identify causal relationships between a dependent variable (e.g., number of O&D passengers) and one or more independent variables (e.g., socioeconomic factors, such as population, employment, per capita personal income, etc.). These relationships, in the form of regression models or equations, can be used in conjunction with projections of socioeconomic factors to forecast growth in aviation activity. A standard measure of how well each socioeconomic variable explains passenger demand (the quality of a particular regression model) is the regression model’s coefficient of determination, or R-squared value. A result of 100 percent is the maximum value possible for a coefficient of determination, and it represents a perfect fit among the variables analyzed.
Socioeconomic regression analysis was conducted to identify causal relationships between South Florida O&D passenger demand (comprising FLL, MIA, and PBI) and socioeconomic variables for the nation, the Miami-Fort Lauderdale-Port St. Lucie Combined Statistical Area (CSA), and the Miami-Fort Lauderdale-West Palm Beach Metropolitan Statistical Area (MSA). Regression analysis was performed separately for domestic and international O&D passengers. Several reasonable causal relationships were identified for both domestic and international O&D passengers considering R-squared values of those relationships. These relationships are summarized in Table 3.3-1.

FORT LAUDERDALE-HOLLYWOOD INTERNATIONAL AIRPORT JUNE 2016
FINAL
Airport Master Plan Update [3-41] Aviation Activity Forecast
These regression models were used in conjunction with independent projections of the relevant socioeconomic variables obtained from Woods & Poole Economics, Inc. to forecast South Florida domestic and international O&D passengers through FY 2035. Forecast results from the individual models were averaged to provide a consensus forecast for both domestic and international O&D passengers. Combining domestic and international O&D passenger forecasts of South Florida enplaned passengers resulted in a CAGR of 2.1 percent between FY 2015 and FY 2035.
Table 3.3-1: Summary of Regression Analysis Results
DEPENDENT VARIABLE INDEPENDENT VARIABLE RANGE OF
R-SQUARED 2015–2035 CAGR RANGE
CONSENSUS GROWTH
South Florida Domestic O&D Passengers
Population (U.S./CSA/MSA)
82% – 97% 1.6% – 2.2% 1.9%
Employment (U.S./CSA/MSA)
Earnings (U.S./CSA/MSA)
Personal Income (U.S./CSA/MSA)
Net Earnings (U.S./CSA/MSA)
Per Capita Personal Income (U.S./CSA/MSA)
GDP/GRP 1/ (U.S./CSA/MSA)
South Florida International O&D Passengers
Year (Time Series)
74% – 81% 2.0% – 3.0% 2.6%
Personal Income (U.S.)
Net Earnings (U.S./CSA/MSA)
Per Capita Personal Income (U.S.)
GDP (U.S.)
South Florida Total O&D Passengers
1.7% – 2.4% 2.1%
NOTE:
1/ Gross Regional Product (GRP)
SOURCES: 2015 CEEDS Woods and Poole Economics, Inc March 2016; Ricondo & Associates, Inc. (Analysis), March 2016.
PREPARED BY: Ricondo & Associates, Inc., March 2016.
O&D Passenger Growth at FLL and Apportioning of O&D Passengers by Airline
FLL domestic and international O&D passengers were grown at the rates forecast for the South Florida region through FY 2035. In addition to the O&D passenger growth at FLL resulting from the overall growth in the South Florida region, additional FLL O&D passenger growth was forecast to result from an O&D market share shift from other South Florida airports, as shown in Table 3.3-2.

FORT LAUDERDALE-HOLLYWOOD INTERNATIONAL AIRPORT JUNE 2016
FINAL
Airport Master Plan Update [3-42] Aviation Activity Forecast
Table 3.3-2: Airport Shares of Regional O&D Passengers (Baseline)
FLL SHARE OF O&D PASSENGERS MIA AND PBI SHARE OF O&D PASSENGERS
FISCAL YEAR DOMESTIC INTERNATIONAL TOTAL DOMESTIC INTERNATIONAL TOTAL
Historical
2005 60% 14% 47% 40% 86% 53%
2006 54% 15% 43% 46% 85% 57%
2007 55% 19% 45% 45% 81% 55%
2008 56% 22% 46% 44% 78% 54%
2009 52% 22% 43% 48% 78% 57%
2010 53% 22% 44% 47% 78% 56%
2011 55% 23% 45% 45% 77% 55%
2012 54% 23% 45% 46% 77% 55%
2013 54% 23% 44% 46% 77% 56%
2014 52% 26% 43% 48% 74% 57%
2015 54% 28% 46% 46% 72% 54%
Forecast
2016 58% 30% 49% 42% 70% 51%
2017 58% 31% 49% 42% 69% 51%
2018 58% 33% 50% 42% 67% 50%
2019 58% 34% 50% 42% 66% 50%
2020 58% 34% 50% 42% 66% 50%
2025 58% 34% 50% 42% 66% 50%
2030 58% 34% 50% 42% 66% 50%
2035 58% 34% 50% 42% 66% 50%
SOURCES: U.S. Department of Transportation, T-100 and DB1B Survey (Historical) March 2016; Ricondo & Associates, Inc. (Projected), March 2016.
PREPARED BY: Ricondo & Associates, Inc., March 2016.
O&D market share shift was estimated through the analysis of publicly available airline growth plans, as well as expectations of service changes at the Airport as new terminal facilities become available, enabling domestic and international service expansion.
The competitive cost environment offered to airlines serving international destinations from the Airport, and the favorable geographic location relative to major focal points of international service (South America and Latin/Caribbean destinations), are expected to support continued growth of service by a variety of airlines. As described in section 3.2.7, the Airport is modernizing Terminal 1 and Terminal 4. As such, it is forecast that the Airport will support a share of international O&D passenger activity in the South Florida region that is above its historical share. FLL’s O&D passenger volumes are forecast to grow 2.5 percent (CAGR) between 2015 and 2035, which is above the 2.1 percent forecast for the South Florida market.

FORT LAUDERDALE-HOLLYWOOD INTERNATIONAL AIRPORT JUNE 2016
FINAL
Airport Master Plan Update [3-43] Aviation Activity Forecast
Forecast FLL domestic and international O&D passengers were subsequently apportioned to airlines according to historical airline shares, which was then adjusted for changes in airline share expected to result from the service evolution previously described. O&D passengers were further segmented according to how each airline was expected to route its passengers, in order to accurately categorize those O&D passengers as enplaned passengers and to facilitate the forecasting of connecting passengers at FLL. Thus, for an airline that has historically routed outbound FLL international O&D passengers on an initial flight segment to another U.S. gateway airport (reported by the Airport as a domestic enplaned passenger), it was assumed to continue to accommodate future international O&D passengers in a similar way. However, if a change was expected to occur in that airline’s route network at FLL, such as the addition of new international nonstop flights, more of that airline’s international O&D passengers were forecast to be routed on nonstop international flights, resulting in an increase in international enplaned passengers.
Development of Connecting Passenger Forecast
To forecast connecting passengers, airline-specific ratios were developed between O&D passengers by routing and connecting passengers. These ratios were developed based on observations of historical passenger traffic at FLL and in other airports with similar types of geographies, airlines, and airline route networks. Ratios were constructed separately for each type of connecting passenger: domestic-to-domestic, international-to-domestic, domestic-to-international, and international-to-international. These ratios were applied to forecast O&D values to derive connecting passenger volumes.
For example, if a carrier historically carried one connecting passenger for every two O&D passengers carried on a nonstop international routing, a ratio of one connecting passenger per every two nonstop international O&D passengers was applied to the growth of nonstop international O&D passengers, as forecast for that particular airline. Ratios were assumed to remain constant throughout the forecast period. Therefore, if that particular airline’s volume of nonstop international O&D passengers was forecast to increase, connecting passengers associated with that nonstop international O&D passenger volume would grow in proportion to that O&D passenger type.
Fleet Mix and Operations Forecast to Accommodate Forecast Enplaned Passengers
Table 3.3-3 presents aggregated near-term, medium-term, and longer-term fleet mix forecasts for total passenger aircraft departures, categorized by average seat capacity.
Airline-specific forecasts of domestic and international enplaned passengers were used to develop the forecasts of passenger aircraft operations. Similar to the near-term forecasts of aircraft operations, trends in completion rates and load factors were applied across the fleet mix as presented in schedule data published through September 2016. To extrapolate an airline-specific fleet mix between FY 2017 and FY 2035 for both domestic and international aircraft operations, fleet plans for JetBlue, Southwest Airlines, and Spirit Airlines were specifically examined, and more general industry fleet trends were applied to other airlines serving FLL. Notable elements of the fleet mix analysis are the following:
JetBlue: Airbus A320neo, Airbus A321neo, and Embraer 190 aircraft are currently on order. The fleet will continue to consist of these three aircraft types over the forecast period.

FORT LAUDERDALE-HOLLYWOOD INTERNATIONAL AIRPORT JUNE 2016
FINAL
Airport Master Plan Update [3-44] Aviation Activity Forecast
Southwest Airlines: The use of larger 175-seat Boeing 737-800 and Boeing 737 MAX-8 aircraft (Boeing 737-700 aircraft have 143 seats) will increase. Southwest’s fleet mix will consist of the Boeing 737-700 and 737-800 series aircraft over the forecast period.
Spirit Airlines: Airbus A320neo and Airbus A321 aircraft are currently on order. In addition to these aircraft, Airbus A319s operate as part of Spirit Airlines’ fleet mix, and forecast operations in these aircraft indicate a decrease over the forecast period as the airlines transitions to the larger A320 and A321 aircraft. Spirit Airlines operates its aircraft with a high-density seating configuration.
In FY 2015 Norwegian Air Shuttle operated high-density Boeing 787-800s at the Airport. Norwegian Air Shuttle is expected to transition their operations from the Boeing 787-800 series aircraft (291 seats) to larger Boeing 787-900 series aircraft (344 seats) in order to meet projected passenger demand and align with the airline’s fleet mix and aircraft orders.
No large wide-body or large wide-body, high-density aircraft (i.e., Airbus 380 or Boeing 747-800 with all-coach seating configuration) are assumed to operate at the Airport over the forecast period.
Table 3.3-3: FLL Passenger Aircraft Fleet Mix (Baseline) 1/
FY 2015 FY 2020 FY 2025 FY 2035
AIRCRAFT 2/ SEAT
CAPACITY OPERATIONS SHARE
(%) OPERATIONS SHARE
(%) OPERATIONS SHARE
(%) OPERATIONS SHARE
(%)
Piston/Small Prop
(Cessna, Saab) 0 - 49 16,462 7.6% 18,803 7.1% 19,445 6.8% 21,213 6.3%
Regional Jets (Canadair CRJ) 50 - 97 2,617 1.2% 2,301 0.9% 2,551 0.9% 3,088 0.9% Small Narrow-body (Airbus 319, Boeing
717) 97 - 149 76,946 35.8% 74,100 28.1% 64,414 22.4% 45,025 13.3% Large Narrow-body (Airbus 321, Boeing
737-900) 150 - 225 117,559 54.6% 165,491 62.8% 198,856 69.0%% 264,968 78.6% Small Wide-body (Airbus
330-200, Boeing 787-800/900) 226 - 350 1,609 0.7% 2,700 1.0% 2,767 1.0% 3,014 0.9%
Large Wide-body (Airbus
380-800, Boeing 747-
800) 351+ seats 0 0.0% 0 0.0% 0 0.0% 0 0.0%
Total Passenger Aircraft Operations 215,192 263,395 288,033 337,308
NOTE:
1/ Fleet mix includes scheduled passenger airlines and regional and commuter activity only. Nonscheduled passenger operations are excluded. 2/ Examples of representative aircraft are included; however these aircraft may not operate in every year shown.
SOURCES: Broward County Aviation Department; U.S. Department of Transportation, Form T-100; Innovata (Historical) March 2016; Ricondo & Associates, Inc. (Forecast), March 2016.
PREPARED BY: Ricondo & Associates, Inc., June 2016.

FORT LAUDERDALE-HOLLYWOOD INTERNATIONAL AIRPORT JUNE 2016
FINAL
Airport Master Plan Update [3-45] Aviation Activity Forecast
3.3.2.3 Enplaned Passenger and Passenger Aircraft Operations Forecast Results (FY 2016– FY 2035)
Enplaned passengers
Table 3.3-4 presents forecast domestic, international, and total enplaned passengers at the Airport through FY 2035. In FY 2016, total enplaned passengers are forecast to grow 8.2 percent to 14.3 million, comprising approximately 90 percent O&D and 10 percent connecting passengers, similar to FY 2015 levels. International enplaned passengers are forecast to comprise approximately 21 percent of total enplaned passengers. Enplaned passenger growth is supported by a 9.3 percent increase in scheduled seat capacity spread proportionally across domestic and international flight segments. Spirit Airlines, Southwest Airlines, and, most notably, JetBlue are providing over 75 percent of the new seat capacity. JetBlue’s FY 2016 scheduled seat capacity growth at FLL is 21 percent, and this includes 13 new destinations (4 international and 9 domestic) on a FY 2015 base of 35 destinations.
The total number of enplaned passengers at the Airport is forecast to increase at a CAGR of 2.6 percent for the entire forecast period, from 13.2 million in FY 2015 to 22.3 million in FY 2035. The number of domestic enplaned passengers is forecast to increase from 10.5 million in FY 2015 to 17.1 million in FY 2035, a CAGR of 2.5 percent. The number of international enplaned passengers is forecast to increase at a higher CAGR (3.3 percent) than domestic enplaned passengers, partially due to the opportunity for expansion into Caribbean and Latin/South American markets by the Airport’s primary airlines, as well as from support by infrastructure improvements.
This expansion enables airlines at the Airport to capture O&D growth expected to occur in the South Florida market and to garner a higher share of the South Florida market overall. O&D passenger volumes, presented in Table 3.3-5, are forecast to increase from 11.8 million in FY 2015 to 19.3 million in FY 2035 (a 2.5 percent CAGR). FLL’s growing O&D market base, coupled with the expansion of service from the Airport, contribute to an increase in connecting passenger enplanements over the forecast period. This is particularly true for passengers making connections between domestic airports to airports in the Caribbean and Latin/South America. Connecting passengers are forecast to grow from 1.4 million in FY 2015 to 3.0 million in FY 2035 (a 4.0 percent CAGR), increasing from 10.3 percent of total enplaned passengers to 13.4 percent in 2035.
The percentage of total enplaned passengers flown on regional aircraft, presented in Table 3.3-6, is forecast to remain low, declining from 1.6 percent in FY 2015 to 1.4 percent in FY 2035. Demand in smaller and closer markets will continue to support some small aircraft use, while demand levels in the majority of markets served from FLL will be served by mainline aircraft.
Passenger Airline Operations
Forecasts of domestic, international, and total passenger airline aircraft operations are summarized in Tables 3.3-7, 3.3-8, and 3.3-9, respectively. Domestic passenger airline aircraft operations are forecast to increase from 169,399 in FY 2015 to 252,000 in FY 2035, a CAGR of 2.0 percent. During this period, the average domestic load factor is forecast to grow to 87.5 percent, while average seats per departure is forecast to increase from 145.8 in FY 2015 to 155.1 in FY 2035. International passenger aircraft operations are forecast to increase from 45,793 in FY 2015 to 85,300 in FY 2035, a CAGR of 3.2 percent. This increase is supported by a growth in load factor from 85.7 percent to 86.9 percent, as well as growth in average international aircraft seat capacity from 137.5 in FY 2015 to 140.2 in FY 2035. Total passenger airline aircraft operations are forecast to increase from 215,192 in FY 2015 to 337,300 in FY 2035, a CAGR of 2.3 percent.

FORT LAUDERDALE-HOLLYWOOD INTERNATIONAL AIRPORT JUNE 2016
FINAL
Airport Master Plan Update [3-46] Aviation Activity Forecast
Table 3.3-4: Historical and Forecast Domestic and International Enplaned Passengers (Baseline)
ENPLANED PASSENGERS
FISCAL YEAR DOMESTIC 1/
DOMESTIC SHARE (%) INTERNATIONAL
INTERNATIONAL SHARE (%) TOTAL
ANNUAL CHANGE (%)
Historical
2005 10,303,438 90.6% 1,063,553 9.4% 11,366,991 13.2%
2006 9,503,386 89.0% 1,177,350 11.0% 10,680,736 -6.0%
2007 9,776,771 87.7% 1,365,898 12.3% 11,142,669 4.3%
2008 10,006,392 86.3% 1,584,047 13.7% 11,590,439 4.0%
2009 8,947,048 85.5% 1,520,840 14.5% 10,467,888 -9.7%
2010 9,260,615 84.9% 1,652,303 15.1% 10,912,918 4.3%
2011 9,836,257 84.3% 1,835,273 15.7% 11,671,530 7.0%
2012 9,962,653 84.8% 1,779,080 15.2% 11,741,733 0.6%
2013 10,033,252 85.1% 1,761,019 14.9% 11,794,271 0.4%
2014 9,844,866 81.9% 2,179,848 18.1% 12,024,714 2.0%
2015 10,515,257 79.6% 2,699,212 20.4% 13,214,469 9.9%
Forecast
2016 11,365,000 79.5% 2,931,000 20.5% 14,295,000 8.2%
2017 11,830,000 79.3% 3,088,000 20.7% 14,918,000 4.4%
2018 12,227,000 79.1% 3,234,000 20.9% 15,461,000 3.6%
2019 12,542,000 78.3% 3,477,000 21.7% 16,019,000 3.6%
2020 12,813,000 78.2% 3,580,000 21.8% 16,393,000 2.3%
2025 14,213,000 77.6% 4,113,000 22.4% 18,327,000
2030 15,652,000 77.1% 4,658,000 22.9% 20,310,000
2035 17,095,000 76.7% 5,197,000 23.3% 22,293,000
Compound Annual Growth Rate
2005 – 2015 0.2% 9.8% 1.5%
2009 – 2015 2.7% 10.0% 4.0%
2015 – 2016 8.1% 8.6% 8.2%
2015 – 2035 2.5% 3.3% 2.6%
NOTES:
Fiscal Year (October – September).
Totals and percentages may not match due to rounding.
1/ Includes international-bound passengers whose flight segment from the Airport is domestic with a connecting international flight segment at another U.S. gateway airport.
SOURCES: Broward County Aviation Department; U.S. Department of Transportation T-100 and DB1B Survey (Historical) March 2016; Ricondo & Associates, Inc. (Forecast), March 2016.
PREPARED BY: Ricondo & Associates, Inc., March 2016.

FORT LAUDERDALE-HOLLYWOOD INTERNATIONAL AIRPORT JUNE 2016
FINAL
Airport Master Plan Update [3-47] Aviation Activity Forecast
Table 3.3-5: Historical and Forecast O&D and Connecting Enplaned Passengers (Baseline)
ENPLANED PASSENGERS
FISCAL YEAR ORIGINATING
ORIGINATING SHARE (%) CONNECTING
CONNECTING SHARE (%) TOTAL
ANNUAL CHANGE (%)
Historical
2005 10,663,925 93.8% 703,066 6.2% 11,366,991 13.2%
2006 10,086,533 94.4% 594,203 5.6% 10,680,736 -6.0%
2007 10,623,944 95.3% 518,725 4.7% 11,142,669 4.3%
2008 10,611,068 91.6% 979,371 8.4% 11,590,439 4.0%
2009 9,764,042 93.3% 703,846 6.7% 10,467,888 -9.7%
2010 10,089,564 92.5% 823,354 7.5% 10,912,918 4.3%
2011 10,637,212 91.1% 1,034,318 8.9% 11,671,530 7.0%
2012 10,832,881 92.3% 908,852 7.7% 11,741,733 0.6%
2013 10,757,238 91.2% 1,037,033 8.8% 11,794,271 0.4%
2014 10,909,227 90.7% 1,115,487 9.3% 12,024,714 2.0%
2015 11,849,538 89.7% 1,364,931 10.3% 13,214,469 9.9% Forecast
2016 12,806,000 89.6% 1,489,000 10.4% 14,295,000 8.2%
2017 13,256,000 88.9% 1,661,000 11.1% 14,918,000 4.4%
2018 13,662,000 88.4% 1,800,000 11.6% 15,461,000 3.6%
2019 14,076,000 87.9% 1,944,000 12.1% 16,019,000 3.6%
2020 14,390,000 87.8% 2,003,000 12.2% 16,393,000 2.3%
2025 16,013,000 87.4% 2,314,000 12.6% 18,327,000
2030 17,669,000 87.0% 2,642,000 13.0% 20,310,000
2035 19,315,000 86.6% 2,978,000 13.4% 22,293,000
Compound Annual Growth Rate
2005 – 2015 1.1% 6.9% 1.5%
2009 – 2015 3.3% 11.7% 4.0%
2015 – 2016 8.1% 9.1% 8.2%
2015 – 2035 2.5% 4.0% 2.6%
NOTES:
Fiscal Year (October – September).
Totals and percentages may not match due to rounding.
SOURCES: Broward County Aviation Department; U.S. Department of Transportation, T-100 and DB1B Survey (Historical) March 2016; Ricondo & Associates, Inc. (Analysis and Forecast), March 2016.
PREPARED BY: Ricondo & Associates, Inc., March 2016.

FORT LAUDERDALE-HOLLYWOOD INTERNATIONAL AIRPORT JUNE 2016
FINAL
Airport Master Plan Update [3-48] Aviation Activity Forecast
Table 3.3-6: Historical and Forecast Mainline and Regional Enplaned Passengers (Baseline)
ENPLANED PASSENGERS
FISCAL YEAR MAINLINE
MAINLINE SHARE (%)
REGIONAL/ COMMUTER
REGIONAL/ COMMUTER SHARE (%) TOTAL
ANNUAL CHANGE (%)
Historical
2005 10,700,688 94.1% 666,303 5.9% 11,366,991 13.2%
2006 10,090,621 94.5% 590,115 5.5% 10,680,736 -6.0%
2007 10,671,841 95.8% 470,828 4.2% 11,142,669 4.3%
2008 11,216,547 96.8% 373,892 3.2% 11,590,439 4.0%
2009 10,299,605 98.4% 168,283 1.6% 10,467,888 -9.7%
2010 10,765,310 98.6% 147,608 1.4% 10,912,918 4.3%
2011 11,562,052 99.1% 109,478 0.9% 11,671,530 7.0%
2012 11,604,546 98.8% 137,187 1.2% 11,741,733 0.6%
2013 11,619,869 98.5% 174,402 1.5% 11,794,271 0.4%
2014 11,847,300 98.5% 177,414 1.5% 12,024,714 2.0%
2015 12,998,259 98.4% 216,210 1.6% 13,214,469 9.9% Forecast
2016 14,062,000 98.4% 233,000 1.6% 14,295,000 8.2%
2017 14,680,000 98.4% 238,000 1.6% 14,918,000 4.4%
2018 15,218,000 98.4% 243,000 1.6% 15,461,000 3.6%
2019 15,771,000 98.5% 248,000 1.5% 16,019,000 3.6%
2020 16,141,000 98.5% 252,000 1.5% 16,393,000 2.3%
2025 18,053,000 98.5% 274,000 1.5% 18,327,000
2030 20,016,000 98.5% 295,000 1.5% 20,310,000
2035 21,977,000 98.6% 315,000 1.4% 22,293,000
Compound Annual Growth Rate
2005 – 2015 2.0% -10.6% 1.5%
2009 – 2015 4.0% 4.3% 4.0%
2015 – 2016 8.2% 7.7% 8.2%
2015 – 2035 2.7% 1.9% 2.6%
NOTES:
Fiscal Year (October – September).
Totals and percentages may not match due to rounding.
Regional/commuter enplaned passengers included aircraft with less than 97 seats.
SOURCES: Broward County Aviation Department; Innovata; U.S. Department of Transportation, Form T-100 (Historical), March 2016; Ricondo & Associates, Inc. (Forecast), March 2016.
PREPARED BY: Ricondo & Associates, Inc., March 2016.

FORT LAUDERDALE-HOLLYWOOD INTERNATIONAL AIRPORT JUNE 2016
FINAL
Airport Master Plan Update [3-49] Aviation Activity Forecast
Table 3.3-7: Domestic Passenger Airline Operations (Baseline)
FISCAL YEAR PASSENGERS LOAD FACTOR AVERAGE SEATS OPERATIONS
DOMESTIC SHARE OF TOTAL (%)
Historical
2005 10,303,438 78.5% 135.4 193,791 82.5%
2006 9,503,386 78.5% 136.9 176,813 80.9%
2007 9,776,771 79.8% 139.8 175,278 79.9%
2008 10,006,392 80.7% 138.8 178,633 79.5%
2009 8,947,048 81.6% 140.9 155,718 79.5%
2010 9,260,615 82.4% 141.5 158,958 79.6%
2011 9,836,257 83.0% 144.9 163,535 81.0%
2012 9,962,653 84.5% 143.9 163,994 80.8%
2013 10,033,252 84.5% 144.0 164,884 81.7%
2014 9,844,866 85.1% 146.1 158,293 79.5%
2015 10,515,257 85.1% 145.8 169,399 78.7%
Forecast
2016 11,365,000 84.4% 149.9 179,800 77.4%
2017 11,830,000 85.6% 150.3 184,000 76.1%
2018 12,227,000 85.8% 150.6 189,200 75.8%
2019 12,542,000 85.5% 150.9 194,500 75.4%
2020 12,813,000 85.7% 151.2 197,800 75.1%
2025 14,213,000 86.3% 152.5 215,800 74.9%
2030 15,652,000 87.0% 153.8 233,900 74.8%
2035 17,095,000 87.5% 155.1 252,000 74.7%
Compound Annual Growth Rate
2005 – 2015 0.2% -1.3%
2009 – 2015 2.7% 1.4%
2015 – 2016 8.1% 6.1%
2015 – 2035 2.5% 2.0%
NOTES:
Fiscal Year (October – September).
Totals and percentages may not match due to rounding.
SOURCES: Broward County Aviation Department; Innovata; U.S. Department of Transportation, Form T-100 (Historical), March 2016; Ricondo & Associates, Inc. (Forecast), March 2016.
PREPARED BY: Ricondo & Associates, Inc., March 2016.

FORT LAUDERDALE-HOLLYWOOD INTERNATIONAL AIRPORT JUNE 2016
FINAL
Airport Master Plan Update [3-50] Aviation Activity Forecast
Table 3.3-8: International Passenger Airline Operations (Baseline)
FISCAL YEAR PASSENGERS LOAD FACTOR AVERAGE SEATS OPERATIONS
INTERNATIONAL SHARE OF TOTAL (%)
Historical
2005 1,063,553 74.6% 69.4 41,055 17.5%
2006 1,177,350 71.9% 78.7 41,625 19.1%
2007 1,365,898 72.3% 85.7 44,056 20.1%
2008 1,584,047 72.9% 94.4 46,063 20.5%
2009 1,520,840 75.8% 100.0 40,114 20.5%
2010 1,652,303 78.2% 103.8 40,732 20.4%
2011 1,835,273 83.2% 114.8 38,431 19.0%
2012 1,779,080 80.7% 113.0 38,998 19.2%
2013 1,761,019 78.9% 120.7 36,972 18.3%
2014 2,179,848 83.1% 128.2 40,911 20.5%
2015 2,699,212 85.7% 137.5 45,793 21.3%
Forecast
2016 2,931,000 83.9% 132.8 52,600 22.6%
2017 3,088,000 79.7% 134.3 57,700 23.9%
2018 3,234,000 79.2% 134.9 60,500 24.2%
2019 3,477,000 81.0% 135.5 63,400 24.6%
2020 3,580,000 80.2% 136.1 65,600 24.9%
2025 4,113,000 82.9% 137.5 72,200 25.1%
2030 4,658,000 85.2% 138.9 78,800 25.2%
2035 5,197,000 86.9% 140.2 85,300 25.3%
Compound Annual Growth Rate
2005 – 2015 9.8% 1.1%
2009 – 2015 10.0% 2.2%
2015 – 2016 8.6% 14.8%
2015 – 2035 3.3% 3.2%
NOTES:
Fiscal Year (October – September).
Totals and percentages may not match due to rounding.
SOURCES: Broward County Aviation Department; Innovata; U.S. Department of Transportation, Form T-100 (Historical), March 2016; Ricondo & Associates, Inc. (Forecast), March 2016.
PREPARED BY: Ricondo & Associates, Inc., March 2016.
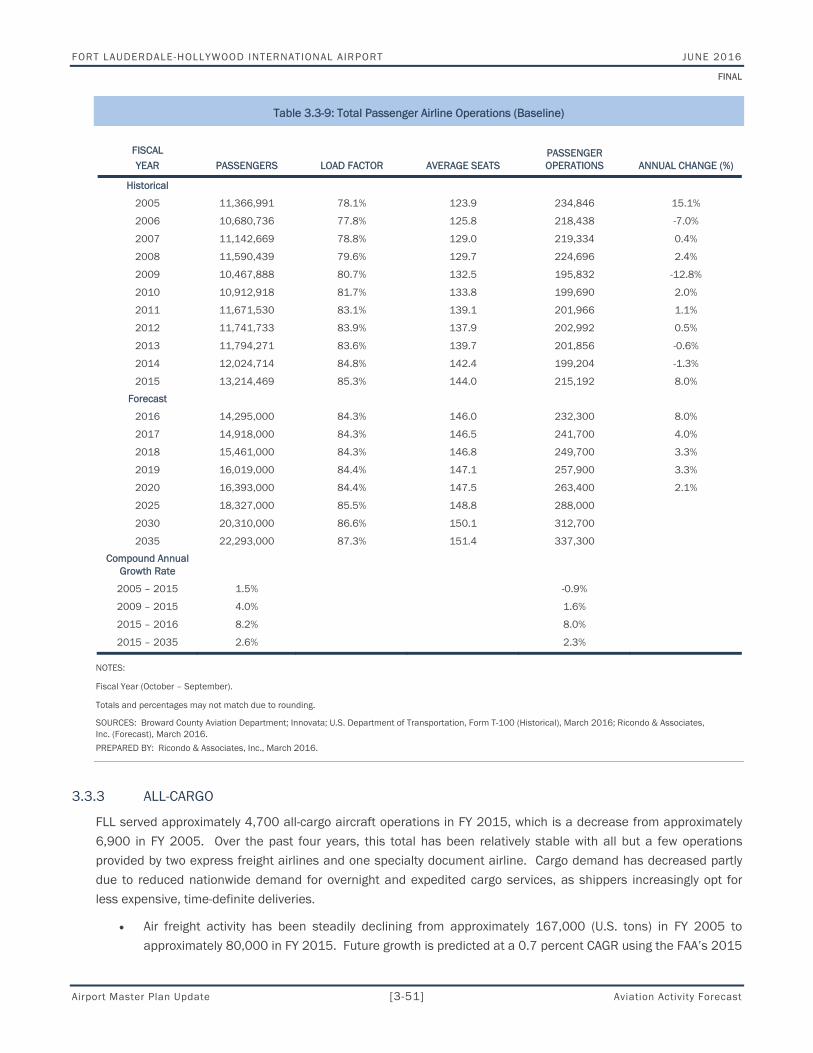
FORT LAUDERDALE-HOLLYWOOD INTERNATIONAL AIRPORT JUNE 2016
FINAL
Airport Master Plan Update [3-51] Aviation Activity Forecast
Table 3.3-9: Total Passenger Airline Operations (Baseline)
FISCAL YEAR PASSENGERS LOAD FACTOR AVERAGE SEATS
PASSENGER OPERATIONS ANNUAL CHANGE (%)
Historical
2005 11,366,991 78.1% 123.9 234,846 15.1%
2006 10,680,736 77.8% 125.8 218,438 -7.0% 2007 11,142,669 78.8% 129.0 219,334 0.4% 2008 11,590,439 79.6% 129.7 224,696 2.4% 2009 10,467,888 80.7% 132.5 195,832 -12.8% 2010 10,912,918 81.7% 133.8 199,690 2.0% 2011 11,671,530 83.1% 139.1 201,966 1.1% 2012 11,741,733 83.9% 137.9 202,992 0.5% 2013 11,794,271 83.6% 139.7 201,856 -0.6% 2014 12,024,714 84.8% 142.4 199,204 -1.3% 2015 13,214,469 85.3% 144.0 215,192 8.0%
Forecast 2016 14,295,000 84.3% 146.0 232,300 8.0% 2017 14,918,000 84.3% 146.5 241,700 4.0% 2018 15,461,000 84.3% 146.8 249,700 3.3% 2019 16,019,000 84.4% 147.1 257,900 3.3% 2020 16,393,000 84.4% 147.5 263,400 2.1% 2025 18,327,000 85.5% 148.8 288,000
2030 20,310,000 86.6% 150.1 312,700
2035 22,293,000 87.3% 151.4 337,300
Compound Annual Growth Rate
2005 – 2015 1.5% -0.9%
2009 – 2015 4.0% 1.6%
2015 – 2016 8.2% 8.0%
2015 – 2035 2.6% 2.3%
NOTES:
Fiscal Year (October – September).
Totals and percentages may not match due to rounding.
SOURCES: Broward County Aviation Department; Innovata; U.S. Department of Transportation, Form T-100 (Historical), March 2016; Ricondo & Associates, Inc. (Forecast), March 2016.
PREPARED BY: Ricondo & Associates, Inc., March 2016.
3.3.3 ALL-CARGO
FLL served approximately 4,700 all-cargo aircraft operations in FY 2015, which is a decrease from approximately 6,900 in FY 2005. Over the past four years, this total has been relatively stable with all but a few operations provided by two express freight airlines and one specialty document airline. Cargo demand has decreased partly due to reduced nationwide demand for overnight and expedited cargo services, as shippers increasingly opt for less expensive, time-definite deliveries.
Air freight activity has been steadily declining from approximately 167,000 (U.S. tons) in FY 2005 to approximately 80,000 in FY 2015. Future growth is predicted at a 0.7 percent CAGR using the FAA’s 2015

FORT LAUDERDALE-HOLLYWOOD INTERNATIONAL AIRPORT JUNE 2016
FINAL
Airport Master Plan Update [3-52] Aviation Activity Forecast
Aerospace Forecast. For this analysis, FLL’s air freight results are forecast to reach approximately 90,000 (U.S. tons) in FY 2035.
Despite historical declines, and as a conservative measure, mail cargo was assumed to remain at current share levels of approximately 2.0 percent of total cargo tons through FY 2035.
Air freight and mail cargo tons are presented in Table 3.3-10. Total cargo operations are forecast to increase from 4,704 in FY 2015 to 5,300 in FY 2035, a CAGR of 0.6 percent. Total cargo operations were based on historical ratios of cargo volume to all-cargo aircraft operations. The all-cargo fleet mix is presented in Table 3.3-11.
Table 3.3-10: Air Freight and Mail Cargo Tons (Baseline)
SHARE
FISCAL YEAR AIR FREIGHT MAIL TOTAL AIR FREIGHT MAIL
Historical
2005 167,237 11,922 179,159 93% 7%
2006 154,333 10,853 165,186 93% 7%
2007 147,870 7,207 155,077 95% 5%
2008 131,053 6,782 137,835 95% 5%
2009 96,075 6,071 102,146 94% 6%
2010 93,024 2,186 95,210 98% 2%
2011 94,148 2,715 96,863 97% 3%
2012 93,777 2,803 96,580 97% 3%
2013 85,732 2,774 88,506 97% 3%
2014 82,583 4,329 86,911 95% 5%
2015 79,898 1,424 81,322 98% 2%
Forecast
2016 81,000 1,000 82,000 98% 2%
2017 82,000 1,000 83,000 98% 2%
2018 83,000 1,000 84,000 98% 2%
2019 84,000 1,000 85,000 98% 2%
2020 85,000 1,000 86,000 98% 2%
2025 88,000 1,000 89,000 98% 2%
2030 89,000 1,000 91,000 98% 2%
2035 90,000 1,000 92,000 98% 2%
Compound Annual Growth Rate
2005 – 2015 -7.1% -19.1% -7.6%
2009 – 2015 -3.0% -21.5% -3.7%
2015 – 2016 1.0% -1.7% 0.9%
2015 – 2035 0.6% -0.1% 0.6%
NOTES:
Fiscal Year (October – September).
Totals and percentages may not match due to rounding.
Figures in U.S. tons.
SOURCES: Broward County Aviation Department; U.S. Department of Transportation, Form T-100 (Historical), March 2016; Ricondo & Associates, Inc. (Forecast), March 2016.
PREPARED BY: Ricondo & Associates, Inc., March 2016.
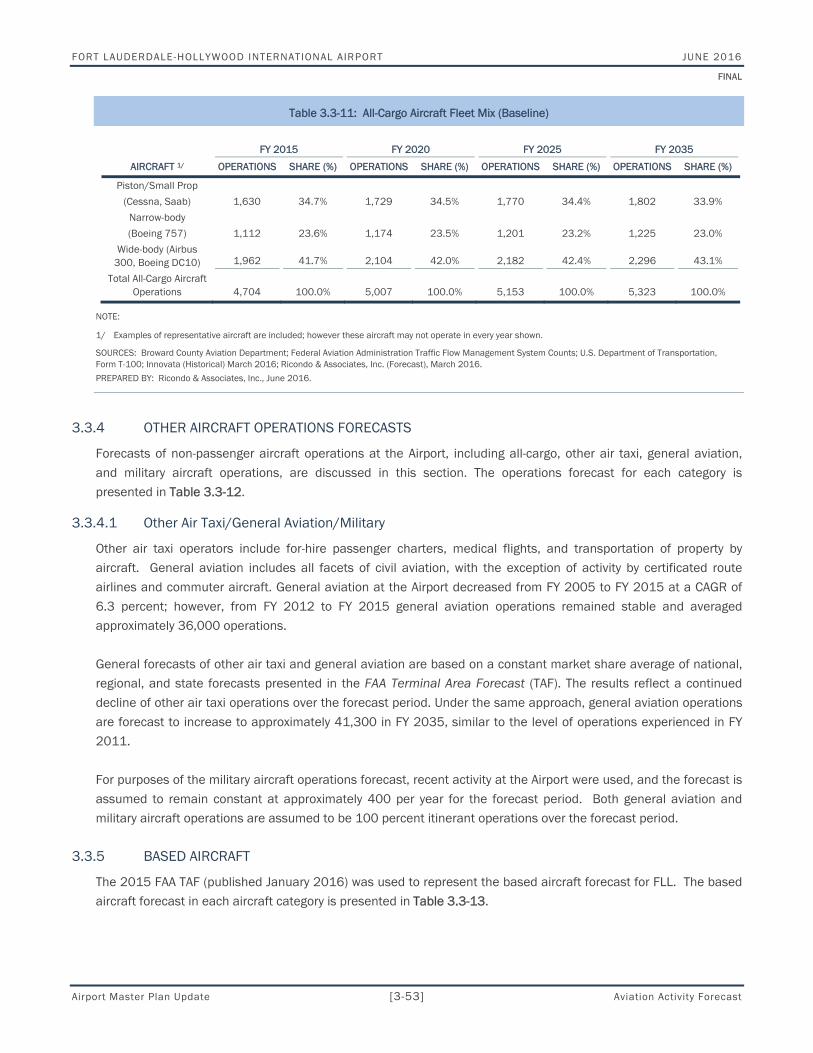
FORT LAUDERDALE-HOLLYWOOD INTERNATIONAL AIRPORT JUNE 2016
FINAL
Airport Master Plan Update [3-53] Aviation Activity Forecast
Table 3.3-11: All-Cargo Aircraft Fleet Mix (Baseline)
FY 2015 FY 2020 FY 2025 FY 2035
AIRCRAFT 1/ OPERATIONS SHARE (%) OPERATIONS SHARE (%) OPERATIONS SHARE (%) OPERATIONS SHARE (%)
Piston/Small Prop
(Cessna, Saab) 1,630 34.7% 1,729 34.5% 1,770 34.4% 1,802 33.9%
Narrow-body
(Boeing 757) 1,112 23.6% 1,174 23.5% 1,201 23.2% 1,225 23.0%
Wide-body (Airbus 300, Boeing DC10) 1,962 41.7% 2,104 42.0% 2,182 42.4% 2,296 43.1%
Total All-Cargo Aircraft Operations 4,704 100.0% 5,007 100.0% 5,153 100.0% 5,323 100.0%
NOTE:
1/ Examples of representative aircraft are included; however these aircraft may not operate in every year shown.
SOURCES: Broward County Aviation Department; Federal Aviation Administration Traffic Flow Management System Counts; U.S. Department of Transportation, Form T-100; Innovata (Historical) March 2016; Ricondo & Associates, Inc. (Forecast), March 2016.
PREPARED BY: Ricondo & Associates, Inc., June 2016.
3.3.4 OTHER AIRCRAFT OPERATIONS FORECASTS
Forecasts of non-passenger aircraft operations at the Airport, including all-cargo, other air taxi, general aviation, and military aircraft operations, are discussed in this section. The operations forecast for each category is presented in Table 3.3-12.
3.3.4.1 Other Air Taxi/General Aviation/Military
Other air taxi operators include for-hire passenger charters, medical flights, and transportation of property by aircraft. General aviation includes all facets of civil aviation, with the exception of activity by certificated route airlines and commuter aircraft. General aviation at the Airport decreased from FY 2005 to FY 2015 at a CAGR of 6.3 percent; however, from FY 2012 to FY 2015 general aviation operations remained stable and averaged approximately 36,000 operations.
General forecasts of other air taxi and general aviation are based on a constant market share average of national, regional, and state forecasts presented in the FAA Terminal Area Forecast (TAF). The results reflect a continued decline of other air taxi operations over the forecast period. Under the same approach, general aviation operations are forecast to increase to approximately 41,300 in FY 2035, similar to the level of operations experienced in FY 2011.
For purposes of the military aircraft operations forecast, recent activity at the Airport were used, and the forecast is assumed to remain constant at approximately 400 per year for the forecast period. Both general aviation and military aircraft operations are assumed to be 100 percent itinerant operations over the forecast period.
3.3.5 BASED AIRCRAFT
The 2015 FAA TAF (published January 2016) was used to represent the based aircraft forecast for FLL. The based aircraft forecast in each aircraft category is presented in Table 3.3-13.

FORT LAUDERDALE-HOLLYWOOD INTERNATIONAL AIRPORT JUNE 2016
FINAL
Airport Master Plan Update [3-54] Aviation Activity Forecast
Table 3.3-12: Non-Passenger Airline Operations (Baseline)
FISCAL YEAR ALL-CARGO
OTHER AIR TAXI
GENERAL AVIATION MILITARY
NON-PASSENGER TOTAL
SHARE OF AIRPORT
TOTAL AIRPORT
TOTAL
Historical
2005 6,938 22,020 71,955 352 101,265 30.1% 336,111
2006 6,783 18,202 56,686 370 82,041 27.3% 300,479
2007 6,763 22,853 55,038 639 85,293 28.0% 304,627
2008 6,392 25,016 48,183 529 80,120 26.3% 304,816
2009 5,083 20,975 43,303 784 70,145 26.4% 265,977
2010 5,336 21,310 45,041 905 72,592 26.7% 272,282
2011 6,053 19,915 41,589 477 68,034 25.2% 270,000
2012 4,561 20,256 35,798 451 61,066 23.1% 264,058
2013 4,279 15,039 35,399 572 55,289 21.5% 257,145
2014 4,318 15,275 35,391 495 55,479 21.8% 254,683
2015 4,704 16,723 37,704 431 59,562 21.7% 274,754
Forecast
2016 4,700 16,100 37,900 400 59,200 20.3% 291,500
2017 4,800 16,000 38,000 400 59,300 19.7% 301,000
2018 4,900 15,700 38,200 400 59,200 19.2% 309,000
2019 4,900 15,500 38,400 400 59,200 18.7% 317,000
2020 5,000 15,200 38,500 400 59,200 18.3% 322,600
2025 5,200 14,400 39,400 400 59,400 17.1% 347,400
2030 5,200 15,100 40,300 400 61,100 16.4% 373,800
2035 5,300 15,900 41,300 400 63,000 15.7% 400,300
Compound Annual Growth
Rate
2005 – 2015 -3.8% -2.7% -6.3% 2.0% -5.2% -2.0%
2009 – 2015 -1.3% -3.7% -2.3% -9.5% -2.7% 0.5%
2015 – 2016 1.0% -3.8% 0.5% 0.0% -0.7% 6.1%
2015 – 2035 0.6% -0.2% 0.5% 0.0% 0.3% 1.9%
NOTES:
Fiscal Year (October – September).
Totals and percentages may not match due to rounding.
SOURCES: Broward County Aviation Department; Federal Aviation Administration, Air Traffic Activity Data System (ATADS); U.S. Department of Transportation, Form T-100 (Historical), March 2016; Ricondo & Associates, Inc. (Forecast), March 2016.
PREPARED BY: Ricondo & Associates, Inc., March 2016.

FORT LAUDERDALE-HOLLYWOOD INTERNATIONAL AIRPORT JUNE 2016
FINAL
Airport Master Plan Update [3-55] Aviation Activity Forecast
Table 3.3-13: Based Aircraft (Baseline)
FISCAL YEAR SINGLE JET MULTI HELICOPTER TOTAL
Historical
2005 53 17 83 6 159
2006 9 40 48 3 100
2007 10 57 58 4 129
2008 8 40 42 4 94
2009 1 29 23 2 55
2010 5 38 12 2 57
2011 2 31 15 1 49
2012 7 43 23 3 76
2013 8 43 17 3 71
2014 12 54 22 6 94
2015 12 54 22 6 94
Forecast
2016 12 54 22 6 94
2017 12 54 22 6 94
2018 12 54 22 6 94
2019 12 54 22 6 94
2020 12 54 22 6 94
2025 12 54 22 6 94
2030 12 54 22 6 94
2035 12 54 22 6 94
Compound Annual Growth Rate
2005 – 2015 -13.8% 12.3% -12.4% 0.0% -5.1%
2009 – 2015 51.3% 10.9% -0.7% 20.1% 9.3%
2015 – 2016 0.0% 0.0% 0.0% 0.0% 0.0%
2015 – 2035 0.0% 0.0% 0.0% 0.0% 0.0%
SOURCE: Federal Aviation Administration, Terminal Area Forecast (TAF), March 2016.
PREPARED BY: Ricondo & Associates, Inc., June 2016.

FORT LAUDERDALE-HOLLYWOOD INTERNATIONAL AIRPORT JUNE 2016
FINAL
Airport Master Plan Update [3-56] Aviation Activity Forecast
3.3.6 ANNUAL ACTIVITY FORECAST COMPARISONS
Table 3.3-14 and Exhibit 3.3-1 present a comparison of the total enplaned passenger forecasts prepared for FLL’s Master Plan Update presented herein referenced as the Baseline Forecasts and the 2015 FAA Terminal Area Forecast (TAF). In assessing the reasonableness of a forecast, the FAA will typically evaluate the forecast against the latest approved TAF for variance at two time horizons—at five years a variance in excess of 10 percent and at ten years a variance in excess of 15 percent. The Baseline Forecast of enplaned passengers is 7.7 percent higher than the 2015 TAF forecast for FY 2020 and 7.6 percent higher in for FY 2025, which are both within the variance guidelines established by the FAA. In FY 2020, enplaned passengers in the Baseline Forecasts are projected to reach 16.4 million, compared to 15.2 million in the TAF. In FY 2025, enplaned passengers in the Baseline Forecasts reach 18.3 million, compared to 17.0 million in the TAF. It should be noted that forecast enplaned passenger amounts include nonrevenue passengers, while TAF amounts do not.
Exhibit 3.3-1: Enplaned Passengers Forecast Comparison—Baseline Forecasts versus TAF
NOTES:
Fiscal Year (October – September).
The FAA TAF is based on Federal Fiscal Year (October–September) and excludes nonrevenue passengers.
SOURCES: Broward County Aviation Department (Historical), March 2016; Federal Aviation Administration, Terminal Area Forecast, January 2016; Ricondo & Associates, Inc. (Forecast), March 2016.
PREPARED BY: Ricondo & Associates, Inc., March 2016.
0.0
5.0
10.0
15.0
20.0
25.0
2005
2006
2007
2008
2009
2010
2011
2012
2013
2014
2015
2016
2017
2018
2019
2020
2021
2022
2023
2024
2025
2026
2027
2028
2029
2030
2031
2032
2033
2034
2035
Tota
l Enp
lane
d Pa
ssen
gers
(mill
ions
)
Fiscal Year
Historical Baseline FAA TAF

FORT LAUDERDALE-HOLLYWOOD INTERNATIONAL AIRPORT JUNE 2016
FINAL
Airport Master Plan Update [3-57] Aviation Activity Forecast
Table 3.3-14: Enplaned Passengers Forecast Comparison—Baseline Forecasts versus TAF
FISCAL YEAR BASELINE FORECASTS 2015 FAA TAF VARIANCE (BASELINE FORECASTS VS. TAF)
Historical
2005 11,366,991
2006 10,680,736
2007 11,142,669
2008 11,590,439
2009 10,467,888
2010 10,912,918
2011 11,671,530
2012 11,744,478
2013 11,794,271
2014 12,024,714
2015 13,214,469 12,760,232 3.6%
Forecast
2016 14,295,000 13,708,574 4.3%
2017 14,918,000 14,096,665 5.8%
2018 15,461,000 14,456,073 7.0%
2019 16,019,000 14,822,277 8.1%
2020 16,393,000 15,219,539 7.7%
2025 18,327,000 17,034,391 7.6%
2030 20,310,000 18,894,322 7.5%
2035 22,293,000 20,815,595 7.1%
Compound Annual Growth Rate
2005 – 2015 1.5% N/A
2009 – 2015 4.0% N/A
2015 – 2035 2.6% 2.5%
NOTES:
Fiscal Year (October – September).
Totals and percentages may not match due to rounding.
The FAA TAF is based on Federal FY (October–September) and excludes nonrevenue passengers.
SOURCES: Broward County Aviation Department (Historical), March 2016; Federal Aviation Administration, Terminal Area Forecast, January 2016; Ricondo & Associates, Inc. (Forecast), March 2016.
PREPARED BY: Ricondo & Associates, Inc., March 2016.

FORT LAUDERDALE-HOLLYWOOD INTERNATIONAL AIRPORT JUNE 2016
FINAL
Airport Master Plan Update [3-58] Aviation Activity Forecast
Table 3.3-15 and Exhibit 3.3-2 present a similar comparison of total aircraft operations between the Master Plan Update’s Baseline Forecasts and the TAF. The forecast of operations does not exceed the variance thresholds set forth by the FAA. The Baseline Forecasts of total operations is 7.7 percent higher than the 2015 TAF for 2020 and 6.5 percent higher in 2025; however, both are within the variance guidelines established by the FAA.
Table 3.3-15: Operations Forecast Comparison—Baseline Forecasts versus TAF
FISCAL YEAR BASELINE FORECASTS 2015 FAA TAF VARIANCE (BASELINE FORECASTS VS. TAF)
Historical
2005 336,111
2006 300,479
2007 304,627
2008 304,816
2009 265,977
2010 272,282
2011 270,000
2012 264,058
2013 257,145
2014 254,683
2015 274,754 270,540 1.6%
Forecast
2016 291,500 276,511 5.4%
2017 301,000 282,807 6.4%
2018 309,000 288,619 7.1%
2019 317,100 294,088 7.8%
2020 322,600 299,564 7.7%
2025 347,400 326,352 6.5%
2030 373,800 355,374 5.2%
2035 400,300 387,160 3.4%
Compound Annual Growth Rate
2005 – 2015 -2.0% N/A
2009 – 2015 0.5% N/A
2015 – 2035 1.9% 1.8%
NOTES:
Fiscal Year (October – September). Fiscal Year 2015 represents the base year.
Totals and percentages may not match due to rounding.
The FAA TAF is based on Federal FY (October–September).
SOURCES: Broward County Aviation Department (Historical March 2016); Federal Aviation Administration, Terminal Area Forecast, January 2016; Ricondo & Associates, Inc. (Forecast), March 2016.
PREPARED BY: Ricondo & Associates, Inc., March 2016.

FORT LAUDERDALE-HOLLYWOOD INTERNATIONAL AIRPORT JUNE 2016
FINAL
Airport Master Plan Update [3-59] Aviation Activity Forecast
Exhibit 3.3-2: Operations Forecast Comparison—Baseline Forecasts versus TAF
NOTE: The FAA TAF is based on Federal FY (October–September).
SOURCES: Broward County Aviation Department (Historical), March 2016; Federal Aviation Administration, Terminal Area Forecast, January 2016; Ricondo & Associates, Inc. (Forecast), March 2016.
PREPARED BY: Ricondo & Associates, Inc., March 2016.
3.3.7 ANNUAL ITINERANT OPERATIONS BY FUTURE CRITICAL DESIGN AIRCRAFT
The analysis included in the Master Plan Update concluded that the Airport would be served by air carrier aircraft as large as full ADG V aircraft (typical aircraft Boeing 787). The Boeing 787 aircraft had 700 scheduled operations in 2015 and is projected to increase to 2,280 annual operations in 2035. In order to protect the Airport’s ability to accommodate widebody passenger aircraft, the ADG V aircraft (represented by the B787-900) was designated as FLL’s future critical aircraft. Forecast operations by the future critical design aircraft are presented in Table 3.3-16.
Table 3.3-16: Forecast Annual Itinerant Operations by Future Critical Design Aircraft
FISCAL YEAR OPERATIONS BY
CRITICAL AIRCRAFT
2015 (Base Year) 700
2020 740
2025 1,810
2035 2,280
CAGR 2015 - 2035 6.1%
NOTE: CAGR = Compound Annual Growth Rate.
SOURCES: Innovata, March 2016; Ricondo & Associates, Inc., March 2016.
PREPARED BY: Ricondo & Associates, Inc., April 2016
0.0
50.0
100.0
150.0
200.0
250.0
300.0
350.0
400.0
450.0
2005
2006
2007
2008
2009
2010
2011
2012
2013
2014
2015
2016
2017
2018
2019
2020
2021
2022
2023
2024
2025
2026
2027
2028
2029
2030
2031
2032
2033
2034
2035
Tota
l Airc
raft
Ope
ratio
ns (t
hous
ands
)
Fiscal Year
Historical Baseline FAA TAF

FORT LAUDERDALE-HOLLYWOOD INTERNATIONAL AIRPORT JUNE 2016
FINAL
Airport Master Plan Update [3-60] Aviation Activity Forecast
3.3.8 ALTERNATIVE FORECAST SCENARIO – ACCELERATED BASELINE FORECASTS
In addition to the Baseline forecasts presented in this report, a second forecast scenario was developed for purposes of sensitivity analyses in the Master Plan Update that estimated the effect of accelerated passenger airline growth at the Airport. Assumptions on the magnitude and timing of passenger airline growth in this scenario were developed considering information gathered during individual discussions with several of the Airport's airlines regarding growth plans at FLL, which included details such as daily activity levels for FLL, regions and timing of growth, capacity increases, load factor estimates, and potential aircraft use. O&D revenue market share analysis was subsequently conducted to determine the ability of the airlines to concurrently implement and sustain various levels of that potential service, and the alternative forecast levels were adjusted to fall within those potentially sustainable levels.
3.3.9 ASSUMPTIONS UNDERLYING THE ACCELERATED BASELINE FORECASTS
Similar to the Baseline forecast, the Accelerated Baseline forecasts of enplaned passengers and aircraft operations were based on a number of underlying assumptions, including:
Assumes no facility constraints. Certain domestic and international facilities were limited based on gate availability through FY 2020.
The Airport will continue to serve as an O&D market for domestic and international airlines, including traditional network airlines and low-cost airlines.
The Airport will serve as a connecting point and as a gateway for international travel to destinations largely throughout the Caribbean and Latin/South America.
For these analyses, and similar to the FAA's nationwide forecasts, it was assumed that there will be no terrorist incidents during the forecast period that would have significant, negative, or prolonged effects on aviation activity at the Airport or nationwide.
Economic disturbances will occur during the forecast period, causing year-to-year variations in airline traffic. However, long-term increases in nationwide and Airport traffic are forecast.
It was assumed that no major “acts of God” that may disrupt the national or global airspace system will occur during the forecast period, which would negatively affect aviation activity at the Airport.
Initial Baseline forecast results were shared with the Airport’s three primary airlines (JetBlue, Spirit, and Southwest) during separate discussions. All expressed concern that the Baseline forecast values were too low, and individually discussed their plans for growth at the Airport. Based on information gathered during those discussions, several additional data points and assumptions were incorporated in the development of an Accelerate Baseline forecast:
More aggressive planned capacity increases by the Airport’s primary carriers over the next three to five years, which are expected to materialize through larger aircraft and additional operations relative to the Baseline forecast.
Total daily departures operated by these carriers increase from 183 in FY 2015 to 365 in FY 2020 based on a peak month average day.
Capacity increases will occur in a combination of current routes and new destinations. New destinations will be added with minimal overlap (however, no market-specific new market details were provided).
Average annual load factors adjusted to not exceed 85 to 87 percent for these primary carriers.
FORT LAUDERDALE-HOLLYWOOD INTERNATIONAL AIRPORT JUNE 2016
FINAL
Airport Master Plan Update [3-61] Aviation Activity Forecast
The Airport’s share of South Florida’s O&D market will increase over the forecast period relative to the Baseline forecast.
Increased capacity by these carriers will lead to an increase in connecting passenger volumes, primarily through domestic/international and international/international connections with relatively little change in domestic/domestic connections.
Using on the information provided by the airlines individually, subsequent analyses were conducted to determine the economic feasibility of these growth plans when considered collectively. Adjustments were made accordingly to reduce growth assumptions to levels estimated to be sustainable from an airline profitability perspective.
3.3.10 ENPLANED PASSENGER AND PASSENGER AIRCRAFT OPERATIONS FORECAST METHODOLOGY AND RESULTS
Passenger-related activity forecasts were developed for two time horizons: a near-term forecast for FY 2016 and a longer-term forecast for the period FY 2017 through FY 2035. Specific forecasting methodologies are described in the following subsections.
3.3.10.1 Near-Term Forecast (FY 2016) Methodology
Published airline schedules through September 2016 were analyzed, and flight segment-level estimates of airline performance were developed based on trends in load factors and completion rates, which were identified through analysis of actual performance data furnished by the Airport, as well as thorough analysis of U.S. DOT enplaned passenger and O&D data available through June 2015. Estimates of load factors and completion rates were applied to scheduled capacity to derive forecasts of enplaned passengers and aircraft operations for FY 2016.
3.3.10.2 Longer-Term Forecast (FY 2017 through FY 2035) Methodology
Based on information gathered during discussions with the Airport’s three primary carriers, a longer-term forecast was developed that incorporated the information provided by these carriers. In some instances, additional capacity growth described by the carriers was allocated beyond the carrier’s estimated time horizon in consideration of the economic feasibility of the carriers’ collective growth plans. The development process for each primary carrier is listed below.
Carrier 1: FY 2020 capacity targets (operations, average seat capacity, and load factor) described by the airline were modeled to fully materialize in FY 2020. In this timeframe, the targets of domestic and international average daily departures were incorporated on an annual basis commencing in FY 2015. Enplaned passenger forecasts for domestic and international segments were developed by applying the average seat size and load factor information to the annual departures as described by the carrier. For the remainder of the forecast period (FY 2021 – FY 2035), this carrier’s forecast was developed in accordance with the long-term operational metrics provided by the carrier (i.e., turns per gate, average seats size, fleet mix, load factors, and O&D percentages).
Carrier 2: FY 2020 capacity targets (operations, average seat capacity, and load factor) described by the airline were modeled to fully materialize in FY 2025. Using a process that is similar to Carrier 1, enplaned passenger forecasts for domestic and international segments were developed by applying average seat size and load factor targets. Average daily departures were increased at a constant annual rate from FY 2015 to the departure targets developed for FY 2025 (originally FY 2020 targets as described by the

FORT LAUDERDALE-HOLLYWOOD INTERNATIONAL AIRPORT JUNE 2016
FINAL
Airport Master Plan Update [3-62] Aviation Activity Forecast
carrier). For the remainder of the forecast period (FY 2026 – FY 2035), this carrier’s forecast was developed in accordance with the long-term operational metrics provided by the carrier.
Carrier 3: FY 2020 capacity targets (operations, average seat capacity, and load factor) described by the airline were modeled to fully materialize in FY 2035. Enplaned passenger forecasts for domestic and international segments were developed by applying average seat size and load factor targets. Average daily departures were increased at a constant annual rate from FY 2015 to the departure targets developed for FY 2035 (originally FY 2020 targets as described by the carrier).
Other Carriers: Enplaned passengers and average departures declined when compared to the Baseline forecast due to a reduced share of total Airport O&D passengers. Incorporated O&D targets provided by the three primary carriers resulted in a lower allocation of O&D passengers for the other carriers. The other carriers’ allocation of O&D passengers were applied to similar operational metrics used in the Baseline forecast. Other carriers’ O&D percentage was assumed to remain stable (lower 90th percentile) over the forecast period.
O&D Passenger Growth at FLL Relative to the South Florida Market
The Airport’s O&D passenger share of the South Florida market is projected to increase due to disproportionately high growth in airline activity at FLL, as shown in Table 3.3-17. South Florida’s O&D market share shift was estimated through information gathered from the Airport’s primary airlines (both in private individual airline meetings and through publicly available airline growth plans), as well as through expectations of service changes at the Airport as new terminal facilities become available enabling domestic and international service expansion. In FY 2017, international O&D passengers are forecast to increase at all South Florida airports; however the majority of the passenger volume increase is allocated to FLL. FLL’s share of South Florida’s international O&D is forecast to increase from 30 percent (FY 2016) to 42 percent (FY 2017) as new international gate capacity becomes available upon completion of new terminal facilities. From FY 2018 to FY 2035, international O&D passenger volumes are forecast to continue to increase at all South Florida airports; however FLL’s international O&D passenger volumes are projected to increase at a rates equal to or slightly greater than other South Florida airports, based on carrier discussions and the incorporated timeline of capacity targets noted above. As a result, FLL’s share of international O&D passengers is forecast to increase from 42 percent (FY 2018) to 46 percent (FY 2035). FLL’s O&D passenger volumes are forecast to grow at a 2.6 percent CAGR between 2015 and 2035, which is above the 2.1 percent CAGR forecast for the South Florida market. This disproportionately high growth at FLL is due, in part, to a significant increase in international operations expected to begin in FY 2017.
Development of Connecting Passenger Forecast
To forecast connecting passengers for the Airport’s primary carriers, airline-specific O&D to connecting passenger ratios were developed based on guidance provided by those airlines, adjusted for subsequent ‘feasibility’ analyses described above. Those ratios were incorporated into the forecast at a high level, but were constructed separately for each type of connecting passenger: domestic-to-domestic, international-to-domestic, domestic-to-international, and international-to-international. Connection percentages for all other carriers remain minimal and align with connection percentages projected in the Baseline Forecast.
As presented in the Baseline forecast, Table 3.3-18 through Table 3.3-24 provide the Accelerated Baseline forecast results for the following: South Florida O&D market share, passenger aircraft fleet mix, enplaned passengers breakout (domestic vs. international, originating vs. connecting, and mainline vs. regional/commuter), and passenger aircraft operations segmented by domestic, international, and total. The Accelerated Baseline forecast

FORT LAUDERDALE-HOLLYWOOD INTERNATIONAL AIRPORT JUNE 2016
FINAL
Airport Master Plan Update [3-63] Aviation Activity Forecast
for non-passenger aircraft operations remains unchanged when compared to the Baseline forecast. Table 3.3-25 presents the Airport’s Total Aircraft Operations.
Table 3.3-17: Airport Shares of Regional O&D Passengers (Accelerated Baseline)
FLL SHARE OF O&D PASSENGERS MIA AND PBI SHARE OF O&D PASSENGERS
FISCAL YEAR DOMESTIC INTERNATIONAL TOTAL DOMESTIC INTERNATIONAL TOTAL
Historical
2005 60% 14% 47% 40% 86% 53%
2006 54% 15% 43% 46% 85% 57%
2007 55% 19% 45% 45% 81% 55%
2008 56% 22% 46% 44% 78% 54%
2009 52% 22% 43% 48% 78% 57%
2010 53% 22% 44% 47% 78% 56%
2011 55% 23% 45% 45% 77% 55%
2012 54% 23% 45% 46% 77% 55%
2013 54% 23% 44% 46% 77% 56%
2014 52% 26% 43% 48% 74% 57%
2015 54% 28% 46% 46% 72% 54%
Forecast
2016 57% 30% 48% 43% 70% 52%
2017 57% 42% 52% 43% 58% 48%
2018 57% 42% 52% 43% 58% 48%
2019 57% 42% 52% 43% 58% 48%
2020 57% 43% 52% 43% 57% 48%
2025 57% 44% 53% 43% 56% 47%
2030 57% 45% 53% 43% 55% 47%
2035 57% 46% 53% 43% 54% 47%
SOURCES: U.S. Department of Transportation, T-100 and DB1B Survey (Historical) March 2016; Ricondo & Associates, Inc. (Projected), March 2016.
PREPARED BY: Ricondo & Associates, Inc., June 2016.

FORT LAUDERDALE-HOLLYWOOD INTERNATIONAL AIRPORT JUNE 2016
FINAL
Airport Master Plan Update [3-64] Aviation Activity Forecast
Table 3.3-18: FLL Passenger Aircraft Fleet Mix (Accelerated Baseline) 1/
FY 2015 FY 2020 FY 2025 FY 2035
AIRCRAFT 2/ SEAT
CAPACITY OPERATIONS SHARE
(%) OPERATIONS SHARE
(%) OPERATIONS SHARE
(%) OPERATIONS SHARE
(%)
Piston/Small Prop
(Cessna, Saab) 0 - 49 16,462 7.6% 17,093 5.9% 16,956 5.3% 16,788 4.5%
Regional Jets (Canadair CRJ) 50 - 97 2,617 1.2% 2,219 0.8% 1,687 0.5% 1,467 0.4%
Small Narrow-body (Airbus 319, Boeing
717) 97 - 149 76,946 35.8% 84,456 29.4% 69,548 21.9% 45,811 12.4%
Large Narrow-body (Airbus 321, Boeing
737-900) 150 - 225 117,559 54.6% 180,409 62.8% 226,254 71.1% 294,459 79.7%
Small Wide-body (Airbus
330-200, Boeing 787-
900) 226 - 350 1,609 0.7% 3,227 1.1% 3,619 1.1% 11,003 3.0%
Large Wide-body (Airbus
380-800, Boeing 747-
800) 351+ seats 0 0.0% 0 0.0% 0 0.0% 0 0.0%
Total Passenger Aircraft Operations 215,192 287,404 318,064 369,529
NOTE:
1/ Fleet mix includes scheduled passenger airlines and regional and commuter activity only. Nonscheduled passenger operations are excluded.
2/ Examples of representative aircraft are included; however these aircraft may not operate in every year shown.
SOURCES: Broward County Aviation Department; U.S. Department of Transportation, Form T-100; Innovata (Historical) March 2016; Ricondo & Associates, Inc. (Forecast), March 2016.
PREPARED BY: Ricondo & Associates, Inc., June 2016.
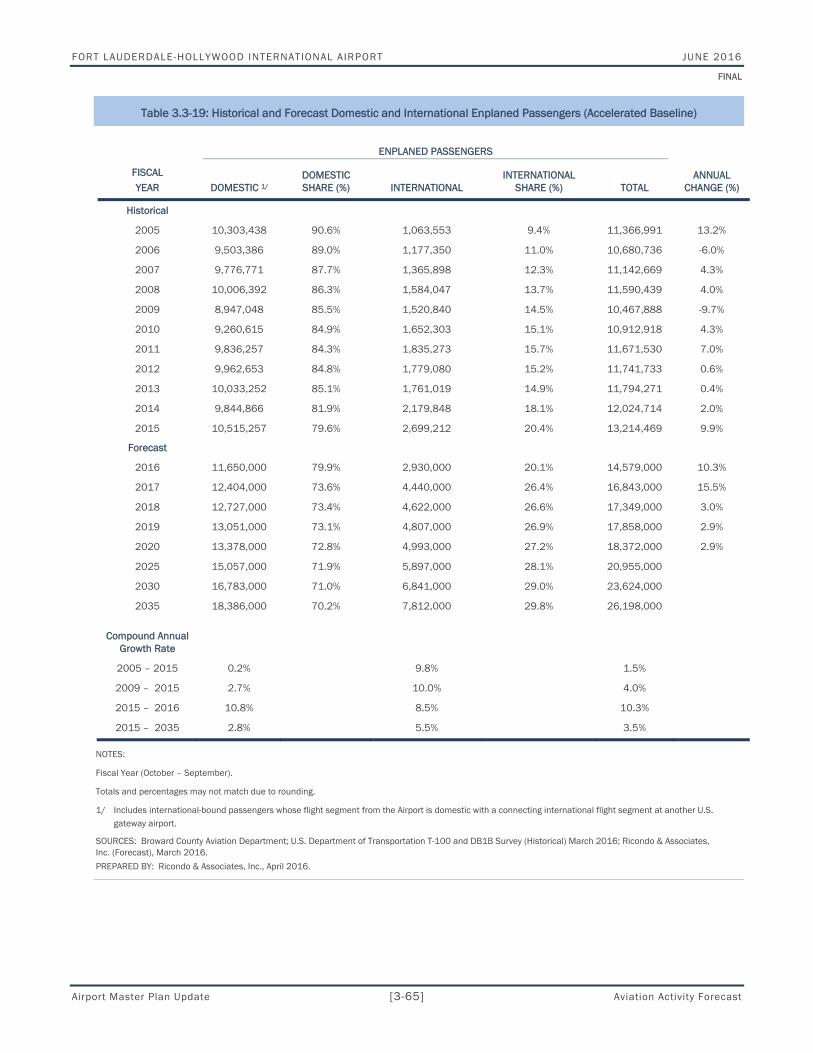
FORT LAUDERDALE-HOLLYWOOD INTERNATIONAL AIRPORT JUNE 2016
FINAL
Airport Master Plan Update [3-65] Aviation Activity Forecast
Table 3.3-19: Historical and Forecast Domestic and International Enplaned Passengers (Accelerated Baseline)
ENPLANED PASSENGERS
FISCAL YEAR DOMESTIC 1/
DOMESTIC SHARE (%) INTERNATIONAL
INTERNATIONAL SHARE (%) TOTAL
ANNUAL CHANGE (%)
Historical
2005 10,303,438 90.6% 1,063,553 9.4% 11,366,991 13.2%
2006 9,503,386 89.0% 1,177,350 11.0% 10,680,736 -6.0%
2007 9,776,771 87.7% 1,365,898 12.3% 11,142,669 4.3%
2008 10,006,392 86.3% 1,584,047 13.7% 11,590,439 4.0%
2009 8,947,048 85.5% 1,520,840 14.5% 10,467,888 -9.7%
2010 9,260,615 84.9% 1,652,303 15.1% 10,912,918 4.3%
2011 9,836,257 84.3% 1,835,273 15.7% 11,671,530 7.0%
2012 9,962,653 84.8% 1,779,080 15.2% 11,741,733 0.6%
2013 10,033,252 85.1% 1,761,019 14.9% 11,794,271 0.4%
2014 9,844,866 81.9% 2,179,848 18.1% 12,024,714 2.0%
2015 10,515,257 79.6% 2,699,212 20.4% 13,214,469 9.9%
Forecast
2016 11,650,000 79.9% 2,930,000 20.1% 14,579,000 10.3%
2017 12,404,000 73.6% 4,440,000 26.4% 16,843,000 15.5%
2018 12,727,000 73.4% 4,622,000 26.6% 17,349,000 3.0%
2019 13,051,000 73.1% 4,807,000 26.9% 17,858,000 2.9%
2020 13,378,000 72.8% 4,993,000 27.2% 18,372,000 2.9%
2025 15,057,000 71.9% 5,897,000 28.1% 20,955,000
2030 16,783,000 71.0% 6,841,000 29.0% 23,624,000
2035 18,386,000 70.2% 7,812,000 29.8% 26,198,000
Compound Annual Growth Rate
2005 – 2015 0.2% 9.8% 1.5%
2009 – 2015 2.7% 10.0% 4.0%
2015 – 2016 10.8% 8.5% 10.3%
2015 – 2035 2.8% 5.5% 3.5%
NOTES:
Fiscal Year (October – September).
Totals and percentages may not match due to rounding.
1/ Includes international-bound passengers whose flight segment from the Airport is domestic with a connecting international flight segment at another U.S. gateway airport.
SOURCES: Broward County Aviation Department; U.S. Department of Transportation T-100 and DB1B Survey (Historical) March 2016; Ricondo & Associates, Inc. (Forecast), March 2016.
PREPARED BY: Ricondo & Associates, Inc., April 2016.

FORT LAUDERDALE-HOLLYWOOD INTERNATIONAL AIRPORT JUNE 2016
FINAL
Airport Master Plan Update [3-66] Aviation Activity Forecast
Table 3.3-20: Historical and Forecast O&D and Connecting Enplaned Passengers (Accelerated Baseline)
ENPLANED PASSENGERS
FISCAL YEAR ORIGINATING
ORIGINATING SHARE (%) CONNECTING
CONNECTING SHARE (%) TOTAL
ANNUAL CHANGE (%)
Historical
2005 10,663,925 93.8% 703,066 6.2% 11,366,991 13.2%
2006 10,086,533 94.4% 594,203 5.6% 10,680,736 -6.0%
2007 10,623,944 95.3% 518,725 4.7% 11,142,669 4.3%
2008 10,611,068 91.6% 979,371 8.4% 11,590,439 4.0%
2009 9,764,042 93.3% 703,846 6.7% 10,467,888 -9.7%
2010 10,089,564 92.5% 823,354 7.5% 10,912,918 4.3%
2011 10,637,212 91.1% 1,034,318 8.9% 11,671,530 7.0%
2012 10,832,881 92.3% 908,852 7.7% 11,741,733 0.6%
2013 10,757,238 91.2% 1,037,033 8.8% 11,794,271 0.4%
2014 10,909,227 90.7% 1,115,487 9.3% 12,024,714 2.0%
2015 11,849,538 89.7% 1,364,931 10.3% 13,214,469 9.9% Forecast
2016 12,806,000 87.8% 1,773,000 12.2% 14,579,000 10.3%
2017 13,959,000 82.9% 2,884,000 17.1% 16,843,000 15.5%
2018 14,337,000 82.6% 3,012,000 17.4% 17,349,000 3.0%
2019 14,716,000 82.4% 3,142,000 17.6% 17,858,000 2.9%
2020 15,098,000 82.2% 3,274,000 17.8% 18,372,000 2.9%
2025 17,012,000 81.2% 3,943,000 18.8% 20,955,000
2030 18,973,000 80.3% 4,651,000 19.7% 23,624,000
2035 20,829,000 79.5% 5,369,000 20.5% 26,198,000
Compound Annual
Growth Rate
2005 – 2015 1.1% 6.9% 1.5%
2009 – 2015 3.3% 11.7% 4.0%
2015 – 2016 8.1% 29.9% 10.3%
2015 – 2035 2.9% 7.1% 3.5%
NOTES:
Fiscal Year (October – September).
Totals and percentages may not match due to rounding.
SOURCES: Broward County Aviation Department; U.S. Department of Transportation, T-100 and DB1B Survey (Historical) March 2016; Ricondo & Associates, Inc. (Analysis and Forecast), March 2016.
PREPARED BY: Ricondo & Associates, Inc., April 2016.

FORT LAUDERDALE-HOLLYWOOD INTERNATIONAL AIRPORT JUNE 2016
FINAL
Airport Master Plan Update [3-67] Aviation Activity Forecast
Table 3.3-21: Historical and Forecast Mainline and Regional Enplaned Passengers (Accelerated Baseline)
ENPLANED PASSENGERS
FISCAL YEAR MAINLINE
MAINLINE SHARE (%)
REGIONAL/ COMMUTER
REGIONAL/ COMMUTER SHARE (%) TOTAL
ANNUAL CHANGE (%)
Historical
2005 10,700,688 94.1% 666,303 5.9% 11,366,991 13.2%
2006 10,090,621 94.5% 590,115 5.5% 10,680,736 -6.0%
2007 10,671,841 95.8% 470,828 4.2% 11,142,669 4.3%
2008 11,216,547 96.8% 373,892 3.2% 11,590,439 4.0%
2009 10,299,605 98.4% 168,283 1.6% 10,467,888 -9.7%
2010 10,765,310 98.6% 147,608 1.4% 10,912,918 4.3%
2011 11,562,052 99.1% 109,478 0.9% 11,671,530 7.0%
2012 11,604,546 98.8% 137,187 1.2% 11,741,733 0.6%
2013 11,619,869 98.5% 174,402 1.5% 11,794,271 0.4%
2014 11,847,300 98.5% 177,414 1.5% 12,024,714 2.0%
2015 12,998,259 98.4% 216,210 1.6% 13,214,469 9.9% Forecast
2016 14,346,000 98.4% 233,000 1.6% 14,579,000 10.3%
2017 16,605,000 98.6% 238,000 1.4% 16,843,000 15.5%
2018 17,105,000 98.6% 243,000 1.4% 17,349,000 3.0%
2019 17,610,000 98.6% 248,000 1.4% 17,858,000 2.9%
2020 18,120,000 98.6% 252,000 1.4% 18,372,000 2.9%
2025 20,681,000 98.7% 274,000 1.3% 20,955,000
2030 23,329,000 98.8% 295,000 1.2% 23,624,000
2035 25,882,000 98.8% 315,000 1.2% 26,198,000
Compound Annual Growth Rate
2005 – 2015 2.0% -0.1% 1.5%
2009 – 2015 4.0% 4.3% 4.0%
2015 – 2016 10.4% 7.7% 10.3%
2015 – 2035 3.5% 1.9% 3.5%
NOTES:
Fiscal Year (October – September).
Totals and percentages may not match due to rounding.
Regional/commuter enplaned passengers included aircraft with less than 97 seats.
SOURCES: Broward County Aviation Department; Innovata; U.S. Department of Transportation, Form T-100 (Historical), March 2016; Ricondo & Associates, Inc. (Forecast), March 2016.
PREPARED BY: Ricondo & Associates, Inc., April 2016.

FORT LAUDERDALE-HOLLYWOOD INTERNATIONAL AIRPORT JUNE 2016
FINAL
Airport Master Plan Update [3-68] Aviation Activity Forecast
Table 3.3-22: Domestic Passenger Airline Operations (Accelerated Baseline)
FISCAL YEAR PASSENGERS LOAD FACTOR AVERAGE SEATS OPERATIONS
DOMESTIC SHARE OF TOTAL (%)
Historical
2005 10,303,438 78.5% 135.4 193,791 82.5%
2006 9,503,386 78.5% 136.9 176,813 80.9%
2007 9,776,771 79.8% 139.8 175,278 79.9%
2008 10,006,392 80.7% 138.8 178,633 79.5%
2009 8,947,048 81.6% 140.9 155,718 79.5%
2010 9,260,615 82.4% 141.5 158,958 79.6%
2011 9,836,257 83.0% 144.9 163,535 81.0%
2012 9,962,653 84.5% 143.9 163,994 80.8%
2013 10,033,252 84.5% 144.0 164,884 81.7%
2014 9,844,866 85.1% 146.1 158,293 79.5%
2015 10,515,257 85.1% 145.8 169,399 78.7%
Forecast
2016 11,650,000 85.5% 150.8 180,700 77.4%
2017 12,404,000 85.4% 151.9 191,200 70.8%
2018 12,727,000 85.4% 153.0 194,700 70.6%
2019 13,051,000 85.5% 154.1 198,200 70.4%
2020 13,378,000 85.5% 155.2 201,800 70.2%
2025 15,057,000 86.0% 157.8 222,000 69.8%
2030 16,783,000 86.4% 160.3 242,300 69.5%
2035 18,386,000 87.1% 164.9 256,000 69.3%
Compound Annual Growth Rate
2005 – 2015 0.2% -1.3%
2009 – 2015 2.7% 1.4%
2015 – 2016 10.8% 6.7%
2015 – 2035 2.8% 2.1%
NOTES:
Fiscal Year (October – September).
Totals and percentages may not match due to rounding.
SOURCES: Broward County Aviation Department; Innovata; U.S. Department of Transportation, Form T-100 (Historical), March 2016; Ricondo & Associates, Inc. (Forecast), March 2016.
PREPARED BY: Ricondo & Associates, Inc., April 2016.

FORT LAUDERDALE-HOLLYWOOD INTERNATIONAL AIRPORT JUNE 2016
FINAL
Airport Master Plan Update [3-69] Aviation Activity Forecast
Table 3.3-23: International Passenger Airline Operations (Accelerated Baseline)
FISCAL YEAR PASSENGERS LOAD FACTOR AVERAGE SEATS OPERATIONS
INTERNATIONAL SHARE OF TOTAL (%)
Historical
2005 1,063,553 74.6% 69.4 41,055 17.5%
2006 1,177,350 71.9% 78.7 41,625 19.1%
2007 1,365,898 72.3% 85.7 44,056 20.1%
2008 1,584,047 72.9% 94.4 46,063 20.5%
2009 1,520,840 75.8% 100.0 40,114 20.5%
2010 1,652,303 78.2% 103.8 40,732 20.4%
2011 1,835,273 83.2% 114.8 38,431 19.0%
2012 1,779,080 80.7% 113.0 38,998 19.2%
2013 1,761,019 78.9% 120.7 36,972 18.3%
2014 2,179,848 83.1% 128.2 40,911 20.5%
2015 2,699,212 85.7% 137.5 45,793 21.3%
Forecast
2016 2,930,000 82.9% 133.7 52,800 22.6%
2017 4,440,000 82.0% 137.3 78,800 29.2%
2018 4,622,000 82.2% 138.7 81,100 29.4%
2019 4,807,000 82.4% 140.0 83,400 29.6%
2020 4,993,000 82.6% 141.3 85,600 29.8%
2025 5,897,000 83.0% 148.0 96,000 30.2%
2030 6,841,000 83.5% 154.0 106,400 30.5%
2035 7,812,000 84.2% 163.5 113,500 30.7%
Compound Annual Growth
Rate
2005 – 2015 9.8% 1.1%
2009 – 2015 10.0% 2.2%
2015 – 2016 8.5% 15.4%
2015 – 2035 5.5% 4.6%
NOTES:
Fiscal Year (October – September).
Totals and percentages may not match due to rounding.
SOURCES: Broward County Aviation Department; Innovata; U.S. Department of Transportation, Form T-100 (Historical), March 2016; Ricondo & Associates, Inc. (Forecast), March 2016.
PREPARED BY: Ricondo & Associates, Inc., April 2016.

FORT LAUDERDALE-HOLLYWOOD INTERNATIONAL AIRPORT JUNE 2016
FINAL
Airport Master Plan Update [3-70] Aviation Activity Forecast
Table 3.3-24: Total Passenger Airline Operations (Accelerated Baseline)
FISCAL YEAR PASSENGERS LOAD FACTOR AVERAGE SEATS
PASSENGER OPERATIONS ANNUAL CHANGE (%)
Historical
2005 11,366,991 78.1% 123.9 234,846 15.1%
2006 10,680,736 77.8% 125.8 218,438 -7.0%
2007 11,142,669 78.8% 129.0 219,334 0.4%
2008 11,590,439 79.6% 129.7 224,696 2.4%
2009 10,467,888 80.7% 132.5 195,832 -12.8%
2010 10,912,918 81.7% 133.8 199,690 2.0%
2011 11,671,530 83.1% 139.1 201,966 1.1%
2012 11,741,733 83.9% 137.9 202,992 0.5%
2013 11,794,271 83.6% 139.7 201,856 -0.6%
2014 12,024,714 84.8% 142.4 199,204 -1.3%
2015 13,214,469 85.3% 144.0 215,192 8.0%
Forecast
2016 14,579,000 85.0% 147.0 233,500 8.5%
2017 16,843,000 84.5% 147.6 270,000 15.6%
2018 17,349,000 84.6% 148.8 275,800 2.1%
2019 17,858,000 84.6% 149.9 281,600 2.1%
2020 18,372,000 84.7% 151.0 287,400 2.1%
2025 20,955,000 85.1% 154.8 318,100
2030 23,624,000 85.5% 158.4 348,700
2035 26,198,000 86.2% 164.5 369,500
Compound Annual Growth
Rate
2005 – 2015 1.5% -0.9%
2009 – 2015 4.0% 1.6%
2015 – 2016 10.3% 8.5%
2015 – 2035 3.5% 2.7%
NOTES:
Fiscal Year (October – September).
Totals and percentages may not match due to rounding.
SOURCES: Broward County Aviation Department; Innovata; U.S. Department of Transportation, Form T-100 (Historical), March 2016; Ricondo & Associates, Inc. (Forecast), March 2016.
PREPARED BY: Ricondo & Associates, Inc., April 2016.

FORT LAUDERDALE-HOLLYWOOD INTERNATIONAL AIRPORT JUNE 2016
FINAL
Airport Master Plan Update [3-71] Aviation Activity Forecast
Table 3.3-25: Non-Passenger Airline Operations (Accelerated Baseline)
FISCAL YEAR ALL-CARGO
OTHER AIR TAXI
GENERAL AVIATION MILITARY
NON-PASSENGER TOTAL
SHARE OF AIRPORT
TOTAL AIRPORT
TOTAL
Historical
2005 6,938 22,020 71,955 352 101,265 30.1% 336,111
2006 6,783 18,202 56,686 370 82,041 27.3% 300,479
2007 6,763 22,853 55,038 639 85,293 28.0% 304,627
2008 6,392 25,016 48,183 529 80,120 26.3% 304,816
2009 5,083 20,975 43,303 784 70,145 26.4% 265,977
2010 5,336 21,310 45,041 905 72,592 26.7% 272,282
2011 6,053 19,915 41,589 477 68,034 25.2% 270,000
2012 4,561 20,256 35,798 451 61,066 23.1% 264,058
2013 4,279 15,039 35,399 572 55,289 21.5% 257,145
2014 4,318 15,275 35,391 495 55,479 21.8% 254,683
2015 4,704 16,723 37,704 431 59,562 21.7% 274,754
Forecast
2016 4,700 16,100 37,900 400 59,200 20.2% 292,700
2017 4,800 16,000 38,000 400 59,300 18.0% 329,300
2018 4,900 15,700 38,200 400 59,200 17.7% 335,000
2019 4,900 15,500 38,400 400 59,200 17.4% 340,800
2020 5,000 15,200 38,500 400 59,200 17.1% 346,600
2025 5,200 14,400 39,400 400 59,400 15.7% 377,400
2030 5,200 15,100 40,300 400 61,100 14.9% 409,800
2035 5,300 15,900 41,300 400 63,000 14.6% 432,600
Compound Annual Growth
Rate
2005 – 2015 -3.8% -2.7% -6.3% 2.0% -5.2% -2.0%
2009 – 2015 -1.3% -3.7% -2.3% -9.5% -2.7% 0.5%
2015 – 2016 1.0% -3.8% 0.5% 0.0% -0.7% 6.5%
2015 – 2035 0.6% -0.2% 0.5% 0.0% 0.3% 2.3%
NOTES:
Fiscal Year (October – September).
Totals and percentages may not match due to rounding.
SOURCES: Broward County Aviation Department; Federal Aviation Administration, Air Traffic Activity Data System (ATADS); U.S. Department of Transportation, Form T-100 (Historical), March 2016; Ricondo & Associates, Inc. (Forecast), March 2016.
PREPARED BY: Ricondo & Associates, Inc., April 2016.

FORT LAUDERDALE-HOLLYWOOD INTERNATIONAL AIRPORT JUNE 2016
FINAL
Airport Master Plan Update [3-72] Aviation Activity Forecast
Table 3.3-26, Table 3.3-27, Exhibit 3.3-3, and Exhibit 3.3-4 present a comparison of the enplaned passenger and operations results of the Baseline, as well as the Accelerated Baseline forecasts through FY 2035. Passenger growth in the Accelerated Baseline forecast scenario increases at a CAGR of 3.5 percent and totals approximately 26.2 million enplaned passengers annually through FY 2035, compared with a 2.6 percent CAGR and 22.3 million annual enplaned passenger total in the Baseline forecasts. Annual aircraft operations also grow at a faster pace in the Accelerated Baseline forecast scenario (a 2.3 percent CAGR to 432,600 in FY 2035) than in the Baseline forecasts (a 1.9 percent CAGR to 400,300 in FY 2035).
Table 3.3-26: Enplaned Passengers Forecast Comparison—Baseline versus Accelerated Baseline Forecasts
FISCAL YEAR BASELINE FORECASTS ACCELERATED
BASELINE FORECASTS
Historical
2005 11,366,991
2006 10,680,736
2007 11,142,669
2008 11,590,439
2009 10,467,888
2010 10,912,918
2011 11,671,530
2012 11,744,478
2013 11,794,271
2014 12,024,714
2015 13,214,469 13,214,469
Forecast
2016 14,295,000 14,579,000
2017 14,918,000 16,843,000
2018 15,461,000 17,349,000
2019 16,019,000 17,858,000
2020 16,393,000 18,372,000
2025 18,327,000 20,955,000
2030 20,310,000 23,624,000
2035 22,293,000 26,198,000
Compound Annual Growth Rate
2005 – 2015 1.5% 1.5%
2009 – 2015 4.0% 4.0%
2015 – 2016 8.2% 10.3%
2015 – 2035 2.6% 3.5%
NOTES:
Fiscal Year (October – September).
Totals and percentages may not match due to rounding.
SOURCES: Broward County Aviation Department (Historical) March 2016; Ricondo & Associates, Inc. (Forecast), March 2016.
PREPARED BY: Ricondo & Associates, Inc., March 2016.

FORT LAUDERDALE-HOLLYWOOD INTERNATIONAL AIRPORT JUNE 2016
FINAL
Airport Master Plan Update [3-73] Aviation Activity Forecast
Table 3.3-27: Operations Forecast Comparison— Baseline versus Accelerated Baseline Forecasts
FISCAL YEAR BASELINE FORECASTS ACCELERATED
BASELINE FORECASTS
Historical
2005 336,111
2006 300,479
2007 304,627
2008 304,816
2009 265,977
2010 272,282
2011 270,000
2012 264,058
2013 257,145
2014 254,683
2015 274,754 274,754
Forecast
2016 291,500 292,700
2017 301,000 329,300
2018 309,000 335,000
2019 317,100 340,800
2020 322,600 346,600
2025 347,400 377,400
2030 373,800 409,800
2035 400,300 432,600
Compound Annual Growth Rate
2005 – 2015 -2.0% -2.0%
2009 – 2015 0.5% 0.5%
2015 – 2016 6.1% 6.5%
2015 – 2035 1.9% 2.3%
NOTES:
Fiscal Year (October – September).
Totals and percentages may not match due to rounding.
SOURCES: Broward County Aviation Department (Historical) March 2016; Ricondo & Associates, Inc. (Forecast), March 2016.
PREPARED BY: Ricondo & Associates, Inc., March 2016.

FORT LAUDERDALE-HOLLYWOOD INTERNATIONAL AIRPORT JUNE 2016
FINAL
Airport Master Plan Update [3-74] Aviation Activity Forecast
Exhibit 3.3-3: Enplaned Passengers Forecast Comparison— Baseline versus Accelerated Baseline Forecasts
SOURCES: Broward County Aviation Department (Historical); Ricondo & Associates, Inc. (Forecast), March 2016.
PREPARED BY: Ricondo & Associates, Inc., March 2016.
Exhibit 3.3-4: Operations Forecast Comparison— Baseline versus Accelerated Baseline Forecasts
SOURCES: Broward County Aviation Department (Historical) March 2016; Ricondo & Associates, Inc. (Forecast), March 2016.
PREPARED BY: Ricondo & Associates, Inc., March 2016.
0.0
5.0
10.0
15.0
20.0
25.0
30.0
35.0
2005
2006
2007
2008
2009
2010
2011
2012
2013
2014
2015
2016
2017
2018
2019
2020
2021
2022
2023
2024
2025
2026
2027
2028
2029
2030
2031
2032
2033
2034
2035
Annu
al E
npla
ned
Pass
enge
rs (m
illio
ns)
Fiscal YearHistorical Baseline Accelerated Baseline
0.0
50.0
100.0
150.0
200.0
250.0
300.0
350.0
400.0
450.0
500.0
2005
2006
2007
2008
2009
2010
2011
2012
2013
2014
2015
2016
2017
2018
2019
2020
2021
2022
2023
2024
2025
2026
2027
2028
2029
2030
2031
2032
2033
2034
2035
Tota
l Airc
raft
Ope
ratio
ns (t
hous
nads
)
Fiscal Year
Historical Baseline Accelerated Baseline

FORT LAUDERDALE-HOLLYWOOD INTERNATIONAL AIRPORT JUNE 2016
FINAL
Airport Master Plan Update [3-75] Aviation Activity Forecast
3.3.11 PEAKING PROFILE
The derivation of peak month and peak month average day (PMAD) is typically based on average percentages – the historical ratio of activity in the peak month to annual activity levels. The peak month for enplaned passengers and operations at the Airport has historically been March. Peak month accounts for approximately 10.2 percent of annual enplaned passengers and 10.0 percent of annual operations. Peak month, PMAD, and peak hour enplaned passengers and operations are presented in Table 3.3-28.
Table 3.3-28: Peaking Profiles
BASELINE ACCELERATED BASELINE
FY 2015 FY 2020 FY 2025 FY 2035 FY 2015 FY 2020 FY 2025 FY 2035
Annual
Enplaned Passengers 13,214,469 16,393,000 18,327,000 22,293,000 13,214,469 18,372,000 20,955,000 26,198,000
Operations 274,754 322,600 347,400 400,300 274,754 346,600 377,400 432,600
Peak Month 1/
Enplaned Passengers 1,329,882 1,674,000 1,871,500 2,276,500 1,329,882 1,876,100 2,139,900 2,675,300
Operations 27,487 32,170 34,640 39,920 27,487 34,560 37,630 43,140
PMAD 2/
Enplaned Passengers 42,900 52,300 58,200 70,400 42,900 58,600 66,600 82,700
Operations 887 1,041 1,116 1,280 887 1,119 1,213 1,384
Peak Hour 2/
Enplaned Passengers 4,136 4,944 5,201 6,224 4,136 5,540 5,952 7,312
Operations 57 70 75 89 57 75 81 96
NOTES:
PMAD = Peak month average day 1/ FY 2015 is actual data. Historical 5-year average of peak month to annual data used to calculate FY 2020, FY 2025, and FY 2035. 2/ Peak data represents Design Day Flight Schedule results for Accelerated Baseline. Baseline results based on Accelerated Baseline ratios.
SOURCES: Broward County Aviation Department (Historical) March 2016; Ricondo & Associates, Inc. (Forecast), June 2016.
PREPARED BY: Ricondo & Associates, Inc., June 2016.
3.4 Preferred Forecasts
The Accelerated Baseline forecasts are the preferred forecast and being sought for the FAA’s approval in the master planning process. Based on information gathered during discussions with the Airport’s three primary carriers, the Accelerated Baseline forecasts were developed and incorporated the information provided by these carriers. The expansion/redevelopment of Terminals 1 and 4 will increase Airport gate capacity/capabilities and likely lead to increased passenger airline activity (domestic and international) as described by the Airport’s three primary carriers.
As noted in section 3.3, the primary carriers provided projected peak day operation targets for FY 2020 and overall annualized load factors, average seat size, and O&D percentages for the forecast period. The Accelerated Baseline forecast incorporated these targets; however peak daily operations for two carriers were incorporated at a later date than provided by these carriers. The Accelerated Baseline forecast does not incorporate all three carriers’ planned FY 2020 peak day operations targets in FY 2020. FAA summary tables are provided in Appendix A for the Baseline and Accelerate Baseline forecasts.

AAirport Master P
Plan Update
FFederaal Avia
ation AAdminiA
istratio
J
Aviation Activi
Appendon Rev
JUNE 2016
FINAL
ity Forecast
dix A view

FORT LAUDERDALE-HOLLYWOOD INTERNATIONAL AIRPORT JUNE 2016
FINAL
Airport Master Plan Update [A-1] Aviation Activity Forecast
Tables A-1 through A-3 include data provided for internal FAA review. Data are presented in templates provided in the document Forecasting Aviation Activity By Airport. 6
6 GRA, Incorporated, Forecasting Aviation Activity By Airport, July 2001.

FORT LAUDERDALE-HOLLYWOOD INTERNATIONAL AIRPORT JUNE 2016
FINAL
Airport Master Plan Update [A-2] Aviation Activity Forecast
Table A-1 (1 of 2): FAA Forecast Summary
A. FORECAST LEVELS AND GROWTH RATES AVERAGE ANNUAL COMPOUND GROWTH RATES
BASE YEAR: 2015 BASE YEAR
LEVEL BASE YEAR +
1 YEAR BASE YEAR +
5 YEARS BASE YEAR +
10 YEARS BASE YEAR +
15 YEARS BASE YEAR
TO +1 BASE YEAR
TO +5 BASE YEAR
TO +10 BASE YEAR
TO +15
PASSENGER ENPLANEMENTS
Air Carrier 13,034,774 14,117,086 16,196,223 18,122,455 20,098,901 8.3% 4.4% 3.4% 2.9%
Commuter 1/ 179,695 178,290 197,006 204,161 211,316 -0.8% 1.9% 1.3% 1.1%
Total Enplanements 13,214,469 14,295,376 16,393,229 18,326,616 20,310,217 8.2% 4.4% 3.3% 2.9%
OPERATIONS
Itinerant
Air Carrier (incl. Air Cargo) 198,668 217,311 247,129 271,970 295,793 9.4% 4.5% 3.2% 2.7%
Commuter/Air Taxi 37,951 35,863 36,458 35,601 37,217 -5.5% -0.8% -0.6% -0.1%
Total Commercial Operations 236,619 253,174 283,587 307,571 333,010 7.0% 3.7% 2.7% 2.3%
General Aviation 37,704 37,890 38,541 39,408 40,341 0.5% 0.4% 0.4% 0.5%
Military 431 431 431 431 431 0.0% 0.0% 0.0% 0.0%
Local
General Aviation 0 0 0 0 0 - - - -
Military 0 0 0 0 0 - - - -
Total Operations 274,754 291,495 322,559 347,410 373,782 6.1% 3.3% 2.4% 2.1%
Instrument Operations 259,926 275,763 305,151 328,660 353,620 6.1% 3.3% 2.4% 2.1%
Peak Hour Operations 57 60 67 72 78 5.3% 3.3% 2.4% 2.1%

FORT LAUDERDALE-HOLLYWOOD INTERNATIONAL AIRPORT JUNE 2016
FINAL
Airport Master Plan Update [A-3] Aviation Activity Forecast
Table A-1 (2 of 2): FAA Forecast Summary
A. FORECAST LEVELS AND GROWTH RATES AVERAGE ANNUAL COMPOUND GROWTH RATES
BASE YEAR: 2015 BASE YEAR
LEVEL BASE YEAR +
1 YEAR BASE YEAR +
5 YEARS BASE YEAR +
10 YEARS BASE YEAR +
15 YEARS BASE YEAR
TO +1 BASE YEAR
TO +5 BASE YEAR
TO +10 BASE YEAR
TO +15
CARGO
Cargo/mail (tons) 2/ 81,322 82,062 86,438 88,916 90,544 0.9% 1.2% 0.9% 0.7%
BASED AIRCRAFT
Single Engine (Nonjet) 12 12 12 12 12 0.0% 0.0% 0.0% 0.0%
Multi Engine (Nonjet) 22 22 22 22 22 0.0% 0.0% 0.0% 0.0%
Jet Engine 54 54 54 54 54 0.0% 0.0% 0.0% 0.0%
Helicopter 6 6 6 6 6 0.0% 0.0% 0.0% 0.0%
Other 0 0 0 0 0 0.0% 0.0% 0.0% 0.0%
Total 94 94 94 94 94 0.0% 0.0% 0.0% 0.0%
B. OPERATIONAL FACTORS
Average aircraft size (seats)
Air carrier 154.6 155.6 156.8 157.5 158.3
Commuter 34.0 31.5 31.5 29.0 26.5
Average enplaning load factor
Air carrier 85.7% 84.6% 84.7% 85.8% 86.9%
Commuter 63.0% 63.0% 64.0% 64.5% 65.0%
General aviation operations per based aircraft 531 534 543 555 568
NOTES:
1/ Commuter as defined by FAA. Commuter operations include takeoff and landings by aircraft with 60 or fewer seats that transport regional passengers on scheduled commercial flights.
2/ Cargo/mail in total U.S. tons (enplaned and deplaned).
SOURCES: Federal Aviation Administration (Template); Broward County Aviation Department; Federal Aviation Administration, Air Traffic Activity Data System (ATADS); U.S. Department of Transportation, Form T-100 (Historical), March 2016; Ricondo & Associates, Inc. (Forecast), March 2016.
PREPARED BY: Ricondo & Associates, Inc., March 2016.

FORT LAUDERDALE-HOLLYWOOD INTERNATIONAL AIRPORT JUNE 2016
FINAL
Airport Master Plan Update [A-4] Aviation Activity Forecast
Table A-2 (1 of 2): FAA Forecast Summary (Accelerated Baseline)
A. FORECAST LEVELS AND GROWTH RATES AVERAGE ANNUAL COMPOUND GROWTH RATES
BASE YEAR: 2015 BASE YEAR
LEVEL BASE YEAR +
1 YEAR BASE YEAR +
5 YEARS BASE YEAR +
10 YEARS BASE YEAR +
15 YEARS BASE YEAR
TO +1 BASE YEAR
TO +5 BASE YEAR
TO +10 BASE YEAR
TO +15
PASSENGER ENPLANEMENTS
Air Carrier 13,034,774 14,398,694 18,191,978 20,796,026 23,478,859 10.5% 6.9% 4.8% 4.0%
Commuter 1/ 179,695 180,718 179,763 158,577 144,905 0.6% 0.0% -1.2% -1.4%
Total Enplanements 13,214,469 14,579,412 18,371,741 20,954,603 23,623,764 10.3% 6.8% 4.7% 3.9%
OPERATIONS
Itinerant
Air Carrier (incl. Air Cargo) 198,668 218,390 272,848 304,491 335,327 9.9% 6.6% 4.4% 3.6%
Commuter/Air Taxi 37,951 35,954 34,748 33,111 33,713 -5.3% -1.7% -1.4% -0.8%
Total Commercial Operations 236,619 254,344 307,596 337,602 369,040 7.5% 5.4% 3.6% 3.0%
General Aviation 37,704 37,890 38,541 39,408 40,341 0.5% 0.4% 0.4% 0.5%
Military 431 431 431 431 431 0.0% 0.0% 0.0% 0.0%
Local
General Aviation 0 0 0 0 0 - - - -
Military 0 0 0 0 0 - - - -
Total Operations 274,754 292,665 346,568 377,441 409,812 6.5% 4.8% 3.2% 2.7%
Instrument Operations 259,926 276,870 327,865 357,072 387,695 6.5% 4.8% 3.2% 2.7%
Peak Hour Operations 57 60 75 81 88 5.3% 5.6% 3.6% 2.9%

FORT LAUDERDALE-HOLLYWOOD INTERNATIONAL AIRPORT JUNE 2016
FINAL
Airport Master Plan Update [A-5] Aviation Activity Forecast
Table A-2 (2 of 2): FAA Forecast Summary (Accelerated Baseline)
A. FORECAST LEVELS AND GROWTH RATES AVERAGE ANNUAL COMPOUND GROWTH RATES
BASE YEAR: 2015 BASE YEAR
LEVEL BASE YEAR +
1 YEAR BASE YEAR +
5 YEARS BASE YEAR +
10 YEARS BASE YEAR +
15 YEARS BASE YEAR
TO +1 BASE YEAR
TO +5 BASE YEAR
TO +10 BASE YEAR
TO +15
CARGO
Cargo/mail (tons) 2/ 81,322 82,062 86,438 88,916 90,544 0.9% 1.2% 0.9% 0.7%
BASED AIRCRAFT
Single Engine (Nonjet) 12 12 12 12 12 0.0% 0.0% 0.0% 0.0%
Multi Engine (Nonjet) 22 22 22 22 22 0.0% 0.0% 0.0% 0.0%
Jet Engine 54 54 54 54 54 0.0% 0.0% 0.0% 0.0%
Helicopter 6 6 6 6 6 0.0% 0.0% 0.0% 0.0%
Other 0 0 0 0 0 0.0% 0.0% 0.0% 0.0%
Total 94 94 94 94 94 0.0% 0.0% 0.0% 0.0%
B. OPERATIONAL FACTORS
Average aircraft size (seats)
Air carrier 154.6 157.1 159.4 162.2 165.1
Commuter 34.0 31.5 31.5 29.0 26.5
Average enplaning load factor
Air carrier 85.7% 85.4% 84.8% 85.1% 85.5%
Commuter 63.0% 63.0% 64.0% 64.5% 65.0%
General aviation operations per based aircraft 531 534 543 555 568
NOTES:
1/ Commuter as defined by FAA. Commuter operations include takeoff and landings by aircraft with 60 or fewer seats that transport regional passengers on scheduled commercial flights.
2/ Cargo/mail in total U.S. tons (enplaned and deplaned).
SOURCES: Federal Aviation Administration (Template); Broward County Aviation Department; Federal Aviation Administration, Air Traffic Activity Data System (ATADS); U.S. Department of Transportation, Form T-100 (Historical), March 2016; Ricondo & Associates, Inc. (Forecast), March 2016.
PREPARED BY: Ricondo & Associates, Inc., March 2016.

FORT LAUDERDALE-HOLLYWOOD INTERNATIONAL AIRPORT JUNE 2016
FINAL
Airport Master Plan Update [A-6] Aviation Activity Forecast
Table A-3: FAA TAF Comparison
FISCAL YEAR
BASELINE FORECASTS FAA TAF
BASELINE VS. TAF (%
DIFFERENCE)
ACCELERATED BASELINE
FORECASTS
ACCELERATED BASELINE VS.
TAF (% DIFFERENCE)
Passenger Enplanements
Base year 2015 13,214,469 12,760,232 3.6% 13,214,469 3.6%
Base year + 5 years 2020 16,393,229 15,219,539 7.7% 18,371,741 20.7%
Base year + 10 years 2025 18,326,616 17,034,391 7.6% 20,954,603 23.0%
Base year + 15 years 2030 20,310,217 18,894,322 7.5% 23,623,764 25.0%
Commercial Operations
Base year 2015 236,619 234,899 0.7% 236,619 0.7%
Base year + 5 years 2020 283,587 263,393 7.7% 307,596 16.8%
Base year + 10 years 2025 307,570 289,643 6.2% 337,602 16.6%
Base year + 15 years 2030 333,021 318,118 4.7% 369,040 16.0%
Total Operations
Base year 2015 274,754 270,540 1.6% 274,754 1.6%
Base year + 5 years 2020 322,559 299,564 7.7% 346,568 15.7%
Base year + 10 years 2025 347,409 326,352 6.5% 377,441 15.7%
Base year + 15 years 2030 373,793 355,374 5.2% 409,812 15.3%
NOTE: Year = Fiscal Year (October–September).
FAA TAF excludes nonrevenue passengers.
SOURCES: Federal Aviation Administration (Template); Broward County Aviation Department; Federal Aviation Administration, Air Traffic Activity Data System (ATADS); U.S. Department of Transportation, Form T-100 (Historical), March 2016; Ricondo & Associates, Inc. (Forecast), March 2016.
PREPARED BY: Ricondo & Associates, Inc., March 2016.