Embed Size (px)
Citation preview

Infrastructure Needs Assessment for Distribution of FrozenProcessed Potato Products in Southeast Asian Countries
Final Report on Cooperative Agreement #5599-109To Foreign Agricultural Service, Emerging Markets Program,
U.S. Department of Agriculture
by
Catherine L. ViatorWu-yi (Dennis) FangJennifer L. Hadley
Wipon (Marty) Aiew
Under the direction ofDr. Victoria SalinDr. Rodolfo Nayga
Department of Agricultural EconomicsTexas A&M University
December 2000
Contact information:Dr. Victoria SalinDepartment of Agricultural EconomicsTexas A&M University2124 TAMUCollege Station, Texas [email protected]: 979-845-8103Full report available at http://agecon.tamu.edu/faculty/salin/research/aptapg.htm


Executive Summary
As U.S. food trade increasingly includes high-value fresh or processed products that require coldstorage to maintain their quality, there will be a need to develop infrastructure to support thedistribution and storage of chilled and frozen foods. This report addresses cold chaininfrastructure in the Philippines and Thailand, and includes a preliminary study of Vietnam. Thestudy was prepared with the American Potato Trade Alliance (APTA), with support from theForeign Agricultural Service, U.S. Department of Agriculture. The purpose of this project is toassess the commercial feasibility of investments in cold chain infrastructure improvement neededto distribute frozen foods in and beyond major cities in these emerging markets. The exploratorystudy of business culture and the investment climate in Vietnam will provide the foundation for apossible follow-up effort.
The objectives of this project were to:
(1) Develop pilot projects illustrating business opportunities with commercial potential in theinfrastructure needed for transportation and handling of frozen foods to secondary cities inthe Philippines and Thailand; and
(2) Draw conclusions about feasibility of projects, using risk analysis based on economicconditions and institutional constraints.
A research team visited the capital cities and major secondary cities in the Philippines andThailand during May and June 2000. Representatives of approximately 80 companies wereinterviewed including cold storage businesses, transportation service companies (shipping linesand trucking and railway cargo service companies), port authorities, frozen food companies,quick service restaurants, banks, and government officials.
Philippines
Insufficient quality cold storage is the main issue facing companies that distribute frozenprocessed potato products in the Philippines, especially in secondary cities such as Bacolod andCebu. Cold storage business is seasonal, with monthly utilization rates ranging from 60 percentto 100 percent. Expensive inter-island shipping from Manila to secondary cities on the southernislands is another bottleneck. Freight rates for inter-island shipping are higher than internationalshipping charges. For example, the cost from Hong Kong or Japan to Manila is about $1,500 per40-foot container, while from Manila to Cebu the cost is $1,800 to $2,000 per 40-foot container.Furthermore, although Manila and Cebu have modern seaports, the port in Bacolod is incapableof handling 40-foot containers. Because the seafood industry in Bacolod is declining, coldstorage and port facilities have not been developed. It was also noticed that traffic congestion isa serious problem in Manila and makes inter-city deliveries more difficult.
The proposed pilot project in the Philippines was to build medium-sized cold storage warehousesin designated secondary cities. Two scenarios were used to assess commercial feasibility of theproposed new cold storage. The first is a “worst-case” scenario that assumes that the newwarehouse is not used at full capacity utilization. The project would break even if it is filled to63 percent of capacity, on average. This result assumes a 15 percent discount rate, 300 pesos per

ii
cubic meter per month in storage charges, and a 15,000 cubic meter facility. These and otherbaseline assumptions are based on information provided in interviews conducted in thePhilippines. Annual net income is 4.5 million pesos and the Net Present Value of the 10-yearproject is 340,550 pesos, when discounted at 15 percent. This is a modestly attractive investmentopportunity given these pessimistic assumptions.
Most cold storage facilities in the Philippines described a seasonal pattern of demand for theirservices. These businesses operate at full capacity utilization in the fall and winter, leading up tothe holiday season. To model the seasonal variation, the utilization rate was simulated to followan empirical distribution developed according to the usage patterns described by officials of coldstorage companies in the Philippines. All other assumptions were the same as in the previous setof financial statements. The average annual capacity utilization rate is 78 percent, according tothe simulation. The expected Net Present Value (NPV) for the project is positive, at 22.3 millionpesos, discounted at 15 percent. Thus, a new cold storage facility that experiences variation inits business similar to those warehouses now in the market appears to be an attractive investment.If an investor has a higher discount rate, the simulated project was found to break even at 27percent.
The project team feels that the market for frozen french fries is well developed and will continueto expand in the Philippines. Investment in cold storage warehouses in Cebu City and Cagayande Oro will be feasible given declining tariffs, the favorable market situation, and the absence ofcompetition at the moment. A caution is the effect of recent political issues on future economicgrowth and the capital market in the Philippines.
Thailand
Compared with the Philippines, Thailand has less severe problems in distributing frozenprocessed potato products from ports to secondary cities. Ports in Bangkok and Laem Chabanghave good facilities to handle imports and exports of frozen food products. Thailand has a well-built highway system connecting the Bangkok ports to secondary cities. Private cold storagefacilities (owned by frozen food exporters and importers, including an importer of french fries)are modernized and can meet strict quality standards. In addition, the capacity is enough tosatisfy current demand. However, there is only one public cold storage facility available in theBangkok area and none in the other cities visited. Thus if the market for frozen and chilled foodswere to grow rapidly, the limited amount of cold storage could present a barrier in the future.
Cold chain infrastructure in Thailand is basically sufficient to meet the current distribution needsof frozen processed potatoes. Thai consumer acceptance of western-style quick servicerestaurant foods is lower than the level observed in the Philippines. However, it is possible thattrucking fleets near ports could help improve the efficiency of distribution if the demandincreases in the near future.
The proposed pilot project in Thailand was to establish a refrigerated trucking company to helpmove frozen food products between Bangkok and secondary cities. The trucking fleet wouldconsist of twenty refrigerated vans. The initial scenario reported reflects conditions as ofOctober 2000, with fuel costs relatively high (14.58 baht per liter). Based on this “worst-case”

iii
scenario, the trucking fleet is an attractive investment. The Net Present Value of the five yearproject is 8.7 million baht using a 15 percent discount rate. Variation in fuel costs couldsignificantly affect investment outcomes, and is thus simulated from an empirical probabilitydistribution. The simulation shows the pressure on current profits from the prospect of higherfuel costs. Annual profits are expected to be 9.9 million baht under the stochastic model.However, the expected fuel cost in the simulation reflects 18 months of historical data on retailfuel costs and is more favorable to the investment than the most recently observed oil prices.Given the market demand for trucking services, current competitiveness in the industry,operational and financial risks, and profitability of the proposed pilot project, the research teambelieves it is commercially viable.
Vietnam
Operating a business in Vietnam can be difficult; however, infrastructure improvements andincreasing demand for frozen potato products makes investing increasingly more feasible.Current infrastructure is limited and consumer demand for frozen foods is modest. Only 10quick service restaurants operated in Vietnam as of summer 2000, and total imports of frozenpotatoes were approximately a container load per year. The possibility of normalized traderelations between Vietnam and the U.S. could help to improve the economy and enhance theprospects for investing in the cold chain infrastructure.
iv
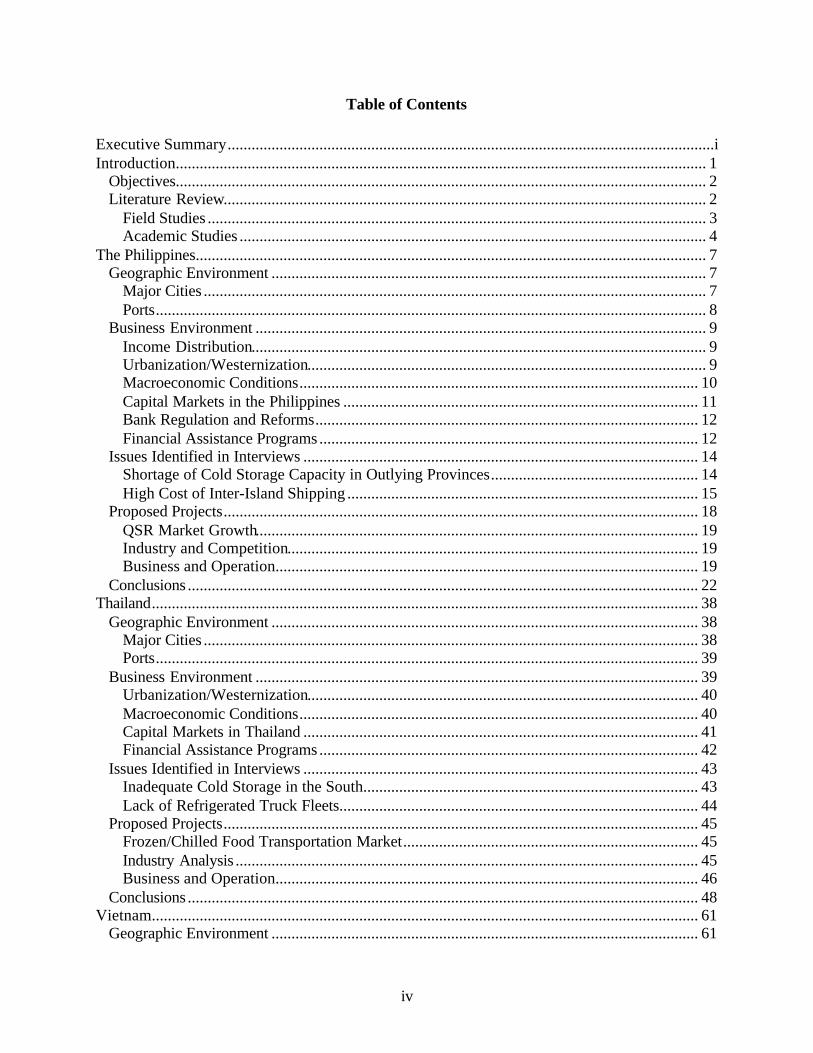
Table of Contents
Executive Summary..........................................................................................................................iIntroduction..................................................................................................................................... 1
Objectives..................................................................................................................................... 2Literature Review......................................................................................................................... 2
Field Studies ............................................................................................................................. 3Academic Studies ..................................................................................................................... 4
The Philippines................................................................................................................................ 7Geographic Environment ............................................................................................................. 7
Major Cities .............................................................................................................................. 7Ports.......................................................................................................................................... 8
Business Environment ................................................................................................................. 9Income Distribution.................................................................................................................. 9Urbanization/Westernization.................................................................................................... 9Macroeconomic Conditions.................................................................................................... 10Capital Markets in the Philippines ......................................................................................... 11Bank Regulation and Reforms................................................................................................ 12Financial Assistance Programs ............................................................................................... 12
Issues Identified in Interviews ................................................................................................... 14Shortage of Cold Storage Capacity in Outlying Provinces.................................................... 14High Cost of Inter-Island Shipping ........................................................................................ 15
Proposed Projects....................................................................................................................... 18QSR Market Growth............................................................................................................... 19Industry and Competition....................................................................................................... 19Business and Operation.......................................................................................................... 19
Conclusions ................................................................................................................................ 22Thailand......................................................................................................................................... 38
Geographic Environment ........................................................................................................... 38Major Cities ............................................................................................................................ 38Ports........................................................................................................................................ 39
Business Environment ............................................................................................................... 39Urbanization/Westernization.................................................................................................. 40Macroeconomic Conditions.................................................................................................... 40Capital Markets in Thailand ................................................................................................... 41Financial Assistance Programs ............................................................................................... 42
Issues Identified in Interviews ................................................................................................... 43Inadequate Cold Storage in the South.................................................................................... 43Lack of Refrigerated Truck Fleets.......................................................................................... 44
Proposed Projects....................................................................................................................... 45Frozen/Chilled Food Transportation Market.......................................................................... 45Industry Analysis .................................................................................................................... 45Business and Operation.......................................................................................................... 46
Conclusions ................................................................................................................................ 48Vietnam......................................................................................................................................... 61
Geographic Environment ........................................................................................................... 61
v
Major Cities ............................................................................................................................ 61Ports........................................................................................................................................ 62
Business Environment ............................................................................................................... 62Urbanization/Westernization.................................................................................................. 62Macroeconomic Conditions.................................................................................................... 63
Issues Identified in Interviews ................................................................................................... 64References ..................................................................................................................................... 66
List of Figures
Figure 1. Shaded Relief Map of the Philippines. ........................................................................ 24Figure 2. Cumulative Distribution Function for Cold Storage Utilization. ................................ 25Figure 3. Cumulative Distribution Function for Cold Storage Net Income................................ 25Figure 4. Cumulative Distribution Function for Cold Storage NPV. ......................................... 26Figure 5. Shaded Relief Map of Thailand................................................................................... 50Figure 6. Volume of Traffic Handled in Bangkok Port and Laem Chabang Port....................... 51Figure 7. Cumulative Distribution Function for Trucking Diesel Price. .................................... 51Figure 8. Cumulative Distribution for Trucking Net Income. .................................................... 52Figure 9. Cumulative Distribution Function for Trucking NPV. ................................................ 52Figure 10. Shaded relief map of Vietnam. .................................................................................... 65
List of Tables
Table 1. Number and Length of Bridges in the Philippines, 1990-1996. .................................. 27Table 2. Distance in Nautical Miles Between Major Cities in the Philippines.......................... 27Table 3. Passenger and Cargo Volume Handled at Philippine Ports, January – June 1999. ..... 28Table 4. Projected Population, 2000 and 2005, and 1997 Average Income in the Philippines, by Region. ................................................................................................ 29Table 5. Total Number of Families by Income Class, 1997. ..................................................... 29Table 6. Number of McDonalds Units in Major Cities of the Philippines, 2000. ..................... 30Table 7. Eating Establishments in the Philippines, 1996-1997.................................................. 30Table 8. Summary of Macroeconomic Indicators for the Philippines, 1990-2001.................... 31Table 9. Performance Measures for Commercial Banks in the Philippines............................... 31Table 10. Philippine National Bank and Subsidiaries Consolidated Statement of Income for the Year Ended December 31................................................................................. 32Table 11. Number of Banks in the Philippines at the End of 1998.............................................. 32Table 12. Summary of Door-to-Door Freight Rates from Manila to Secondary Cities............... 33Table 13. Sales Volume and Earnings for Jollibee Foods............................................................ 33Table 14. Assumptions for Cold Storage Income Statements...................................................... 34Table 15. Income Statement for Deterministic Cold Storage Model. .......................................... 35Table 16. Income Statement for Stochastic Cold Storage Model. ............................................... 36Table 17. Descriptive Statistics for Stochastic Cold Storage Model. .......................................... 37Table 18. NPV for Cold Storage Deterministic Model, Under Various Discount Rate Assumptions................................................................................................................. 37

vi
Table 19. Major Cities/Provinces in Thailand, 2000, Population and Distance from Bangkok. ...................................................................................................................... 53Table 20. Comparison of Main Thailand Port Facilities.............................................................. 53Table 21. Comparison of Major QSRs in Thailand Versus the Philippines, 2000. ..................... 53Table 22. Thailand Macroeconomic Indicators, 1990-2000. ....................................................... 54Table 23. Bangkok Bank Financial Statements for the Year Ended, Dec. 31. ............................ 55Table 24. Assumptions for Trucking Project Income Statement. ................................................ 56Table 25. Income statement for deterministic trucking model..................................................... 57Table 26. Cash Flows and NPV for Deterministic Trucking Model, Assuming Various Discount Rates.............................................................................................................. 58Table 27. Income Statement for Stochastic Trucking Model....................................................... 59Table 28. Descriptive Statistics for Stochastic Trucking Model.................................................. 60Table 29. Cash Flows and NPV under Different Discount Rates. ............................................... 60

1
Infrastructure Needs Assessment for Distribution of FrozenProcessed Potato Products in Southeast Asian Countries
Introduction
Infrastructure is a critical component that supports international trade in food and agriculturalproducts. There is a need for the development of infrastructure that is suited for distribution andstorage of chilled and frozen foods, as trade in food products increasingly includes high-value,processed and prepared foods.
The equipment and processes used to protect chilled and frozen foods are referred to as the "coldchain." The integrity of the cold chain must be preserved from the point of production andprocessing, through the transport phases -- loading, unloading, handling, and storage -- to storageat the consuming household or restaurant. There may be several different points at whichloading and storage is required. Potential problems may result from the size of shipments,reliability of equipment, and ownership transfers of products moving through the system. Inorder to unlock the vast emerging markets of Southeast Asia for U.S. frozen food exports, the"cold chain" infrastructure must be strengthened. Both U.S. exports and within-countrycommerce will depend on efficient infrastructure systems, including facilities owned by publicagencies and private commercial interests.
The United States is a major supplier of frozen processed potato products in Southeast Asia. Thecountries in the Asia-Pacific Economic Community (APEC) purchased nearly 80 percent of allU.S. frozen processed potatoes in 1998, which accounted for 1.5 billion pounds of potatoesgrown by U.S. farmers or an estimated 10 percent of the U.S. crop. The value of U.S. frozenprocessed potato exports increased by 140 percent from 1992 to 1997. Export expansion isexpected to continue, especially to the industry's priority growth markets of the Philippines,Thailand, and Vietnam. However, the infrastructure supporting frozen processed potato productsis a limiting factor in supplying markets in and beyond major cities and hampers U.S. exportgrowth potential in the region. As trade barriers decline through the WTO process, the logisticalissues linked with expanded shipments will take on more prominence for U.S. exporterstargeting these emerging markets in Southeast Asia. Primary competition will come from otherthird country producers (the Netherlands, Canada, and Australia) because none of the SoutheastAsian countries have local production of frozen processed potatoes.
This report focuses on the linkages needed to extend the cold chain for distribution of frozenfoods between major capital cities, where most imports arrive, and important secondarypopulation centers throughout the Philippines and Thailand. These two countries represent mostof the diverse transportation situations of Southeast Asia, including archipelagic nations,mountainous conditions, congested cities, and heavy traffic of many types of vehicles onsecondary roads. The study built on previous efforts to develop the cold chain, and focused on adetailed examination of investment conditions and prospects for specific projects that might havecommercial potential and enhance the cold chain.
The following report will outline the objectives of the project and review literature from previousstudies on the subject. Furthermore, an overview of the geographic and business environments,as well as the cold chain logistics for the Philippines and Thailand will be considered. Pilot

2
projects will be developed for both countries as a means of improving the cold chaininfrastructure. The term “infrastructure” encompasses a wide range of facilities and equipment,from roadways and railcars to ports and harbors. This study focuses on the type of infrastructureinvestments that can be commercially viable in the private sector, rather than large public sectorfacilities. Thus, the pilot projects are evaluated using standard business decision rules forinvestments, supplemented with simulations to reflect major uncertainties in the economicenvironment. Conclusions and recommendations for further research are drawn from the pilotproject feasibility assessments. Also included is a brief look at the conditions in Vietnam.
Objectives
The purpose of this project was to assess the commercial feasibility of investments in cold chaininfrastructure improvement needed to distribute frozen foods from ports in major cities intosecondary population centers in the target countries.
Major objectives were to:
(1) Develop pilot projects illustrating business opportunities with commercial potential in theinfrastructure needed for transportation and handling of frozen foods for marketing in thesecondary cities of the Philippines and Thailand; and
(2) Draw conclusions about feasibility of the projects, using risk analysis based on economicconditions and institutional constraints.
There are a great deal of potential benefits for all parties involved. Due to the recent economicdownturn in Asia, it is expected that government investments in major infrastructureimprovements will not be rapidly forthcoming. However, the cold chain infrastructureencompasses many smaller-scale projects, such as refrigerated transportation equipment, that arelikely to be commercially viable for private investment. Therefore, the goal of the research wasto focus less on major public infrastructure, such as ports or roads, than on recommendations forcommercial projects. Nevertheless, basic knowledge of the entire cold chain for imports, fromports to final consuming locations, was necessary. The primary research method was tointerview business and government officials who are involved with food and trade business on aregular basis.
In beginning this study, it was necessary to review some of the major research already publishedon the subject of the cold food chain infrastructure in Southeast Asia.
Literature Review
This review of literature consists of two parts -- field studies and academic studies. While thefindings of this literature search indicate that information on food distribution in Asia,specifically the Philippines and Thailand, is available, there has been limited research on fooddistribution outside of the capital cities. Very little, if any, financial analysis concerning capitalinvestments in the distribution system has been published. In addition, this study providesrelevant geographical and macroeconomic background information on both countries, which was

3
excluded from other reports. Thus, this research serves to add the perspectives of business andeconomic factors to the infrastructure assessments that have previously been available.
Field Studies
The Foreign Agricultural Service and Agricultural Marketing Service conducted two separate butrelated studies in 1998 and 1999, respectively. The purpose of these studies was to expand U.S.agricultural exports that are constrained by cold chain impediments in the Philippines andThailand. Winrock International also completed two studies on the cold chain in Asia, althoughtheir focus was on Indonesia. These four studies established the necessary framework for thisresearch project.
The first USDA study (Beasley) assessed the current state of the cold chain in both countries,and had a broad focus on all U.S. perishable food products. The study presented detailedfindings on distribution from the U.S. to the capital cities of Metro Manila and Bangkok, but didnot evaluate distribution systems within secondary cities. The researchers focused on thetechnical aspects of maintaining the cold chain, such as the use of humidity control, ethyleneoxidizers to prevent premature fruit ripening, proper air circulation in chiller rooms, regulardefrost cycles, and automated cold storage inventory control techniques. In addition, aqualitative demand analysis for perishable foods was done. As a follow-up to the USDA study,educational seminars were conducted to inform those involved in cold chain distribution aboutproper transportation, handling and storage of specific products. Over 200 representatives werein attendance at each country's seminar, and because of the positive response generated, moreseminars are being planned for the future.
The second USDA study (Caron et. al) examined shipments of containerized U.S. agriculturalproducts, including frozen vegetables, to both countries. It primarily discussed internationalshipments into the capital cities, and briefly mentioned within-country shipments. Specificlogistical data was provided, such as the major ocean carriers, refrigerated container rates forvarious Asian ports, and specific time requirements for shipments from the capital city tosecondary cities. Other relevant data in the AMS study includes the following:
• In 1998, only 4 percent of agricultural products were shipped from the U.S. directly to thePhilippines and only 14 percent were shipped directly to Thailand. Reasons cited includeinsufficient port depth and lack of Philippine and Thailand bound cargo per ship.
• The Cebu port in the Philippines, in the southern Visayan Islands, does not have roll-on/roll-off facilities for containers. The Songkhla port in southern Thailand has no cranes and mustrely on the ship's equipment to load and unload containers.
Information on cold storage warehouses was not included in this report. Additionally, neitherstudy mentioned specific business opportunities for improving the cold chain, nor did theyprovide financial analysis for potential investors.
Winrock International completed two studies on infrastructure development for fresh fruitdistribution in eastern Indonesia. The primary goal of their first project was to make guaranteedsoft loans available to local businesses in the shipping and food transportation industries. These

4
loans were for the acquisition of transportation and refrigeration equipment. Another goal of theresearch project was to provide training programs for the recipients of the loans and theiremployees to educate them on fruit handling technology. This training program was part of theloan approval criteria. Winrock discovered that the major infrastructure needs for fruitdistribution in eastern Indonesia were cold storage warehouses, refrigeration units for boats andtrucks, and packing sheds in or near fruit production areas. The researchers also compared costsof air and sea distribution, and of domestic and international shipping. Results indicate that it isabout six times less expensive to ship apples from the U.S. West Coast to eastern Indonesia thanto ship between two ports within eastern Indonesia. As expected, air freight was much moreexpensive than ocean freight. However, the major limitation in air freight was not the cost, butrather the lack of capacity to handle large tonnage.
Winrock’s second study was done in collaboration with the U.S. Agricultural Trade Office inJakarta, and had three major objectives. They were 1) to identify weaknesses in the cold chaininfrastructure that hinder sales of quality U.S. foods in eastern and northeastern Indonesia, 2) tomake technical and economic recommendations to vendors and transportation companies, and 3)to build a network that will develop into a Cold Chain Association. One finding that deals withfrozen french fries is their acceptance into major supermarkets, but the lack of freezer storageand refrigerated trucks or vans (generally referred to as reefers) hinders their expansion intosecondary cities. The researchers also discovered that reefers are mainly used for the exportationof seafood, and that reefer containers are usually backhauled empty. This procedure addssignificantly to transportation costs. There is also a problem with temperature management dueto lack of monitoring of reefers at the ports and to non-functioning data recorders. To deal withthe problem of pilferage and vandalism, the study made the following recommendations:
• Use smaller vehicles to transport reefers, such as a truck with 20-foot containers.• Hire shippers with the best reputation; avoid shippers with known problems.• Hire forwarding agents that have experience dealing with paperwork and port procedures.
Recommendations were also made to help solve the problem of inadequate cold storage, whichincluded building a warehouse that is locally situated, perhaps shared by several companies thatare interested in food distribution. This warehouse would ideally have four rooms, one of whichto store frozen foods and the remainder for different types of fresh fruits and vegetables.
The Winrock International studies were very technical in nature, suggesting specific mechanicaland chemical techniques to improve the cold chain. Again, detailed financial analysis ofpotential improvements was not done in either of these studies.
Academic Studies
Ashley and Epperson (1989) identified several barriers to exporting commodities, which include1) increased transportation difficulties, 2) lack of current and/or accurate information, 3)differences in international currency exchange rates, 4) language and labeling differences, 5)varying governmental policies and restrictions, and 6) cultural acceptance. The objective of theirstudy was to identify the barriers, opportunities, and factors influencing the internationalmarketing of vegetables. Data were obtained from a survey of companies in the vegetablebusiness from 22 countries, of which Hong Kong and Japan represented Asia.
5
Half of the companies surveyed were in the vegetable business; one-fourth were retailers; andprocessors and distributors were each 12.5 percent of the sample. Key findings are:
• 98.8 percent of all U.S. processed vegetables are transported to Asia via sea vessel,• 71.4 percent of Asian importers always prefer the elimination of tariffs, duties, and
government regulations; and• 66.6 percent of Asian importers perceived an increasing demand for potatoes in their country,
while 33.3 percent perceived constant demand for potatoes.
The authors concluded that Asia has the most potential for growth in the export market forvegetables. Reasons cited include 1) a high percentage of Asian firms predicting an increase inimport levels of vegetables compared with firms in other regions, 2) lack of emphasis on theprice of vegetable imports by Asian importers, 3) expected ability of U.S. agribusinesses to adoptsuggested changes of Asian importers - specifically greater market knowledge and interest andhigher quality standards, 4) apparent inability of exporters to decrease the price of vegetables asdesired by European and Latin American importers, and 5) a greater commitment to internationalmarkets by Asian importers.
Lanclos, Devadoss, and Guenthner (1997) examined the factors that affect the export demand forU.S. frozen potatoes, such as advertising, foreign investments, income, and prices. Fourcategories of importers were studied from 1978 to 1993 based on 1993 import volume: Japan,Mexico, the Philippines, and Thailand. Geweke's Bayesian estimation procedure was used toestimate the per-capita demand equations for the four countries. Prices of substitutes andcomplements, exchange rates, and the percentage of young people in the population wereeliminated due to low significance and little contribution to the explanatory power of the models.
The results show that the Philippine and Thailand markets for frozen potatoes are very priceinelastic (-0.13 and -0.02, respectively). The Philippines has the highest income elasticity (2.50),while Thailand has the lowest (0.04). The effectiveness of U.S. Potato Board advertising has aninverse relationship with the degree of market development of the country. Third partyadvertising is ten times more effective than Potato Board advertising in the Philippines andThailand. Conventional economic factors, such as prices and income, may become moreimportant as the market becomes more established, as was the case in Japan. Advertising andfood service industry investments primarily influence the import demand of smaller, newermarkets.
As the composition of agricultural and food trade shifts from bulk agricultural commodities tomore processed food products, more knowledge is needed about Asian food safety regulations.The objective of Wang and Caswell's (1998) study was to compare the levels of food safetyregulations of three U.S.-Asian trading groups, in which the third group was developingcountries. The developing countries included China, India, Thailand, and the Philippines.
Food safety, as defined by the authors, includes quality attributes such as foodborne pathogens,heavy metals, pesticide residues, food additives, naturally occurring toxins, and veterinaryresidues.

6
In 1995, of all U.S.-Asian food and agricultural trade, 25 percent of U.S. exports were directedtowards the developing countries, while 87 percent of U.S. imports were from developingcountries. Probably due to the high percentage of imports, the authors focused on the food safetyregulations that these countries need to meet to gain greater access to the U.S. market, rather thanwhat the regulations should be for the U.S. to gain greater access to export markets.
Of all the developing countries, Thailand supplied the greatest volume of imports to the U.S. in1995, and had the lowest number of import detentions. This suggests that Thailand has morefood safety regulations than the other developing countries. Developing countries in Asia havebeen criticized for poorly established food safety laws, primarily in the areas of pesticideresidues, packaging and labeling, and government inspection.
Finally, one study by researchers at the University of the Philippines offered important detail ontransportation within the country. Garsuta (1995) completed a study on urban goods movementin Metro Manila in which a survey was conducted of traffic enforcers, truckers, foodmanufacturers and producers, and merchants. This research was limited to food distribution withboth the origin and destination within the Metro Manila area. Survey results indicate thefollowing:
• Trucks represent only 6.2 percent of the total traffic in Metro Manila. The low relativevolume of truck traffic resulted in its exclusion from the urban planning process.
• Almost 60 percent of firms that use trucks for delivery do not follow a scheduling plan.• Over 80 percent of trucks failed to arrive on scheduled time.• 89 percent of trucks are backhauled empty.• 64 percent of trucking firms do not have a terminal or garage facility.
Garsuta also mentioned that traffic congestion is a severe problem near the port areas. This isdue to peaked and irregular demand generated by the arrival of vessels, the truck ban whichresults in delays to trucks which are sent to pick up cargo, and the presence of squatters on thestreets.
The previous research available offered a useful foundation regarding the role of cold chaininfrastructure in trade between the U.S. and Asia. To build on the prior efforts, this studyfocused on economic conditions and financial feasibility of specific cold chain improvements. Inorder to form conclusions about the feasibility of projects, it was necessary to consider thegeographic and business environments and the cold chain logistics of the target countries. Thisprovided an insight into the overall economic conditions and institutional constraints, which wasimportant in achieving the objectives of the project. The following section includes a review ofthe physical and business environments for the Philippines, followed by a parallel presentationabout Thailand.

7
The Philippines
The Philippines has seen many economic and political changes in the 1980s and 1990s. Afterthe Marcos regime was overthrown in 1986, a vigorous economic reform program was adopted.This included privatization of many government enterprises, tariff reductions, liberalized foreignexchange and investment policies, and infrastructure modernization.
The following section outlines the geographic information that is important in assessing thefeasibility of commercial projects. Following the review of physical conditions andinfrastructure, economic indicators are presented.
Geographic Environment
The Philippines is an archipelago country in Southeast Asia, located between the Philippine Seaand the South China Sea (Figure 1). Total land area includes 298,170 km, with 334,539 km ofcoastline (CIA). It extends 1,850 km north to south, and 1,100 km east to west (De Villa). In1998, there were 199,950 km of roads, of which 39,590 km were paved (CIA). The number andlength of existing bridges in the Philippines is listed in Table 1. Although the number of bridgeshas remained stable, the length of the bridges increased by more than eight percent from 1990 to1996. The terrain is mostly mountainous with narrow to extensive coastal lowlands, which isprone to volcanoes and earthquakes. The climate is tropical marine, with typhoons and flashfloods common during the rainy season (May-November).
The official language of the country is Filipino (based on Tagalog), but English is widely used incommercial and legal transactions. The Philippines is the world's third-largest English-speakingcountry in terms of population, after the United States and the United Kingdom. There are alsoover 100 regional dialects.
Major Cities
The 880 inhabited islands of the Philippines are divided into three main regions: Luzon, Visayas,and Mindanao. Luzon is the largest and northernmost island, Visayas is comprised of the centralislands, and Mindanao is the southernmost island. The capital city of Manila and surroundingcities comprise Metro Manila, the most populous area in Luzon as well as the entire country.Other major cities include Cebu City and Bacolod City in Visayas, and Davao City and Cagayande Oro in Mindanao. The distance between the major cities in the Philippines can be seen inTable 2. Population data for each city was not available.
Cebu City is the country's oldest city, having been named the capital by the Spaniards in 1565.Today it is a bustling trade port. Bacolod City is the capital of the Negros Occidental province,and lies in the northwestern part of the province. Twenty-five percent of the province'spopulation lives in Bacolod City. The province's major crop grown is sugarcane. One of theworld's largest cities in terms of land area is Davao City, comprising 244,000 hectares. It isconsidered Mindanao's center for education and commerce, and accounts for the majority ofsouthern Mindanao's exports and imports. Davao exports various agricultural goods such asbananas and crude and refined coconut oil, as well as furniture and processed foods. Cagayan deOro is also becoming an educational and commerce center as the capital of the Misamis Oriental

8
province. This city has many large manufacturing companies which process goods for both localand export markets.
Ports
The main international seaports are located in Manila, Subic, and Cebu City. The ports handlealmost 98 percent of materials and products imported and exported by the Philippines (PhilippinePort Authority). Shipping statistics for the ports operated by the Philippine Port Authority arelocated in Table 3. International Container Terminal Services Incorporated (ICTSI) manages thecontainer terminal yard at the Manila international port. The ICTSI is responsible for loadingand unloading containers from vessels, as well as temporarily storing containers. They handle alittle less than 60 to 70 percent of all imports that come into the Philippines. The ManilaInternational Container Terminal (MICT) was once government operated, but was privatizedwith the signing of a 25-year BOT (Build-Operate-Transfer) contract with ICTSI. According toofficials at ICTSI, the terminal capacity is 1.5 million TEU's (twenty-foot equivalent units); in1999 the volume handled exceeded 800,000+ TEU's. ICTSI prefers to operate at 60 percentcapacity because they can be more efficient at this level. If the containers are stacked, morecontainers must be handled to move the bottom container. The capacity for reefer containers is730 slots, including 100 temporary slots that were recently added. ICTSI monitors thetemperature requirements. The average dwell time is five days for dry goods and 2.5 days forchilled or frozen goods. All customers are charged handling fees, and customers who own reefercontainers are charged for electricity (minimum six hour charge). There is an additional chargewhen containers are stored at the terminal for more than five days. The Philippine PortAuthority regulates the rates.
Ports in outlying provinces are variable in capacity and quality. The port in Cebu is comparableto that in Manila, based on visits by the research team, although it is smaller. Oriental Port &Allied Services Corporation (OPASCOR) is a private firm that manages the international port inCebu. They have had a contract with the Cebu International Port (CIP), a government agency, tooperate the port since 1990. In 2001 they will renegotiate the contract for 15 to 20 years. Theport that OPASCOR manages handles foreign vessels only; the domestic carriers load andunload vessels at the domestic port next door to the international port. Sixty percent of thecontainers handled at CIP are 20-footers, according to the officials interviewed, while fortypercent are 40-footers. The CIP has the capacity to berth two foreign vessels at one time.Inbound containers can remain in the yard for six days with no charge, and outbound containersare allowed two days without charge. Reefer containers are typically only at the port for oneday, according to OPASCOR representatives. There are 25 reefer outlets at this port, which isjust enough to handle the amount of reefer container volume that they currently have. The CebuPort Authority (CPA) can add more reefer outlets if OPASCOR requests it; the port has landcapacity for 100-150 more outlets. The international port has two forty-year old gantry cranesand 10 transtainers, but does not have roll-on/roll-off capabilities.
Bacolod port includes a public section operated by the Philippine Port Authority (PPA) and aprivate section operated by Negros Navigation Company, Inc. The facilities are not capable ofhandling 40-foot containers, and no reefer plugs were visible in the container yard visited byresearchers.

9
The port at Cagayan de Oro is managed by the PPA. According to information gathered fromtheir website, this is an advanced, modern port. The total area is 191,400 square meters, withopen storage areas in Phase 1 of 15,232 square meters, and Phase 2 of 31,460 square meters. Ithandles foreign and domestic containerized cargo and has approximately 36 reefer outlets, aswell as roll-on/ roll-off capabilities.
Business Environment
Another important factor in considering the feasibility of a commercial project is the businessenvironment of the target country. The following section establishes a picture of thisenvironment through discussions of the income distribution, urbanization and westernization,and the macroeconomic and banking situations of the Philippines.
Income Distribution
Population projections for the Philippines by region for the years 2000 and 2005 are listed inTable 4, as well as the average income by region for 1997. Thirty-seven percent of thepopulation ranges from 0-14 years, while fifty-nine percent range from 15-64 years. This issignificant because it is the younger generation that typically frequents quick service restaurants(QSRs) where many frozen potatoes reach the final consumer. However, a 1997 estimate statesthat 32 percent of the population lives in poverty (CIA). The total number of families by incomeclass is listed in Table 5. In 1997, 45.6 percent of Filipinos derived their income source fromwages and salaries, 26.2 percent from entrepreneurial activities, and 28.2 percent from othersources, such as net share of crops, receipts from abroad, and family sustenance activities(Philippines National Statistics Office).
Urbanization/Westernization
The Philippines is one of the most westernized countries in Southeast Asia, due to the fact that itwas under U.S. political administration from 1898 to 1946. During this time period, the U.S.introduced their system of education, style of government, and commercial products (De Villa).Many U.S. companies, particularly QSRs, have subsidiaries in the Philippines, includingMcDonalds, Pizza Hut, KFC, Shakey's, Dunkin' Donuts, Subway, Dairy Queen, TGI Fridays,etc. There are currently 228 McDonalds outlets in the Philippines, of which 161 are in the majorcities. By the end of 2000 there will be 240 total McDonalds outlets (Cochico). There are 23outlets in the Visayas and Mindanao regions, with the remainder in Luzon (Table 6).
"Malling" is a popular pastime, in which Filipinos spend hours at a mall shopping, walking,watching movies, playing games, and eating. Refreshment stands, kiosks, and counters arecommonly found in shopping malls, with many serving processed potato products such asflavored french fries, potato rosettes, and hash browns. The number of restaurants, fast foodcenters, refreshment stands, and kiosks increased between five to six percent from 1996 to 1997(Table 7).
Despite the high degree of urbanization and westernization, there is still less than completeconsumer acceptance of frozen foods. A common thought is that only leftover foods are frozen.For example, many Filipinos refer to frozen seafood as "double dead." Shopping at open-air wet
10
markets is common, where consumers purchase what they consider "fresh" meats and seafood,some of which may have been un-refrigerated all day. This mentality carries over to thesupermarkets, where many consumers are reluctant to purchase frozen vegetables for homeconsumption. Adding to this problem is the lack of refrigerators in many rural homes.
The changes in income and urbanization present potential market opportunities for businessesinvolved in frozen foods. At the same time, the growth in urban sectors presents challenges indistribution. Due to the rapid pace of urbanization in Metro Manila, there has been a significantincrease in traffic volume in recent years and there is severe traffic congestion in many parts ofthe metropolitan area. Garsuta (1995) also attributes the heavy traffic congestion to theunplanned industrial developments, the undisciplined behavior of both drivers and pedestrians,and the way in which truck movements have been allowed to grow in the past. In addition, theseventeen local government units (LGUs) of Metro Manila all have their own traffic regulationsand enforcement agencies. Failure to coordinate among the various LGUs compounds theproblem of traffic congestion (Garsuta). On a country-wide basis, there was a 10 percentincrease in the number of motor vehicles registered and a nine percent increase in the number ofdrivers licenses issued in only one year, 1996 to 1997 (Road Handbook in the Philippines ‘98).While secondary cities are smaller than Manila, visits by the research team to Cebu indicate thattraffic congestion may be a growing problem.
Macroeconomic Conditions
The economy of the Philippines has improved over the past ten years, with only a few setbacks(Table 8). Of the six principal macroeconomic indicators (nominal and real Gross DomesticProduct, average lending rate of banks, inflation rate, exchange rate, and unemployment rate),only the exchange rate and unemployment rate situation worsened. This was primarily due to theAsian financial crisis in 1997, which began when the Thai government floated its currency. Thevalue of the Thai Baht fell by 15 percent on July 2, 1997, and the Philippine Peso declinedshortly thereafter (Coyle, McKibbin, Wang, and Lopez). Although the Asian financial crisisseverely affected the economy of the Philippines, the effect was less severe than in otherSoutheast Asian countries (U.S.-ASEAN Business Council, Inc.(b), 2000).
On the demand side, nominal GDP increased every year over the past ten years, showing a 178percent improvement from 1990 to 1999. Furthermore, GDP is expected to increase in 2000 and2001 by eight to twelve percent each year. It is predicted that services will be the fastestgrowing segment in 2000. Real GDP, which is adjusted for inflation, has also improved over thepast ten years, showing decreases in only two years, 1991 and 1998. The unemployment ratehovered between eight and ten percent during the 1990s. It was showing an improvement whenthe financial crisis hit, causing unemployment to rise again to the ten percent level. It appears asif unemployment is now decreasing to the level that it was at in the mid-1990's.
More signs of the recent recession are visible in the credit and money indicators. The averagelending rate of banks has decreased by 14 percent since 1990, with the largest decrease in 1999.In 1994, 1997, and 1998, the lending rate increased marginally, but the large decreases over theten-year time period more than offset this. The inflation rate also decreased significantly, fromdouble-digit numbers in the early 1990s to a low of 3.5 percent for the beginning of 2000. Smallincreases in the inflation rate were realized in 1994 and 1996, with a larger increase in 1998

11
during the Asian financial crisis. Inflation in the food sector decreased from 7.8 percent in thesame quarter/month last year to 0.20 percent this year, and in Metro Manila inflation decreasedfrom 6.7 percent to 2.8 percent. The Philippines National Economic and Development Authoritypredicts that the inflation rate will remain between five and six percent for the years 2000 and2001. As previously stated, the foreign exchange rate is the only macroeconomic indicator thathas not shown an improvement. Until 1997, the foreign exchange rate fluctuated in the mid- toupper- twenties. However, there was a dramatic decrease in the value of the peso in 1998, to40.89 pesos/U.S. Dollar. The exchange rate has been in this range ever since.
According to the Philippines National Economic and Development Authority (2000), 1999 was arecovery year for the Philippines. The general outlook for 2000 is one of stronger growth, lowerinflation, fiscal consolidation, and an acceleration of the reform process.
Capital Markets in the Philippines
The macroeconomic data presented in the previous section suggest solid economic fundamentalsand modest growth for the Philippines. In spite of the signs of economic strength, there is a needto continue to improve the financial system to ensure recovery from the effects of the Asiancrisis (Buenaventura).
Banks have undergone some shaky times and face challenges in the current depressed businessenvironment. Measures of banks’ performance suggest several positives (Table 9), althoughthere is continued concern about the shrinking of bank lending. The overhang of non-performingdebt continues to constrain banks’ ability and willingness to lend. Table 10 is the balance sheetand income statement for a major Philippine bank, and it shows the constraints on banks due tothe need for provisioning (loan loss reserves).
Bank officials interviewed for this research indicated that lending terms were relatively strict inorder to prevent future problems with repayment. One leading bank required that net incomeafter debt service be at least 30 percent of sales revenues before lending based on cash flows.Collateral was also required, with loan amounts restricted to no more than 60 percent ofcollateral asset value. Interest terms offered were for annually adjustable rates, with 13.75percent reported as a typical rate available to commercial borrowers in May 2000. These termswere similar to those reported by a competing large bank.
Major commercial banks typically do not lend to very small businesses, except occasionally onthe basis of a personal loan secured with a home or other personal property. The number ofbanks by business type is shown in Table 11. The Development Bank of the Philippines wasconsidered a potential source of credit for start-up concerns that cannot obtain loans fromcommercial banks.
While the evidence suggests that banks have tightened up lending policies, it is not entirely clearif Philippine businesses face serious credit constraints. Some sources indicate that debt capitalis an important source of funds for small and medium sized businesses in the Philippines.Reported typical leverage ratios exceeded 2:1, sometimes as high as 5:1. These high leverageratios could be the result of past generous credit terms or they could indicate falling assetvaluations.

12
While interest rates have fallen below those in the market at the peak of the Asian crisis, (Table8), the real cost of funds has remained relatively high as inflation has fallen. Policies of theBangko Sentral ng Pilipinas (BSP, the Philippine Central Bank) in response to broader pressureshave contributed to the high cost of funds. The Philippine currency is extremely sensitive tochanges in U.S. interest rates, so during the tightening of U.S. monetary policy in spring 2000,the BSP increased its overnight rates repeatedly to prevent the peso from depreciating furtheragainst the U.S. Dollar. The overnight rate was 10 percent for borrowing and 12.25 percent forlending in mid-May 2000. Higher rates are an effort to keep funds in pesos rather than in foreignexchange. The military conflict in Mindanao has also contributed to capital flight and leads torelatively high interest rates in the Philippines.
Equity capital is a potential source of liquidity and investment funds, and reportedly equity hasgrown to partly compensate for the weakness in bank credit in Asian countries (Sender). Thekey role of equity funds was underscored in personal interviews with several firms in the coldchain businesses in the Philippines. National equity markets are a potential resource, but thePhilippine stock market has reportedly been stagnant (Booth and Hilsenrath). Few of the firmsinterviewed for this research were publicly traded corporations. Thus the primary source ofequity capital for small and medium enterprises wishing to expand in businesses related to thecold chain appears to be personal or family savings, or through affiliations with closely heldenterprises. Interlocking relationships among major businesses are a common characteristic inthe Philippine business community. Often important families control the linked businesses.While it is important to consider the potential for equity from these important conglomerates,there is no published information available on this topic.
Bank Regulation and Reforms
Philippine President Joseph Estrada signed a new law widening the supervisory powers of theBSP, to take effect in June 2000 (Philippine Star). The Revised General Banking Act (RA 8791)also opens the banking sector to more foreign investment. A foreign bank may now own theentire voting stock of an existing local bank, whether distressed or healthy.
This reform program was prompted by several bank failures and related runs on banks bynervous depositors. The Philippines has a deposit insurance system, but the coverage limit of100,000 pesos was insufficient for many of the failed banks’ customers, according to pressreports.
The BSP requires a capital adequacy ratio of 10 percent, which is higher than the eight percentstandard recommended by the Bank for International Settlements. There is a restriction oncommercial bank loans to the property sector of no more than 20 percent of the portfolio, inorder to limit the exposure to volatile real estate loans.
Financial Assistance Programs
The review of financial markets in the Philippines indicates some recovery, but lingeringproblems from the severe economic downturn of 1997. In addition to in-country sources offinancing, investors in cold chain infrastructure may consider U.S. export assistance programs

13
that cover equipment related to handling exports. This section introduces the Export-ImportBank and USDA programs that may be relevant to cold chain investments.
The Export-Import Bank of the U.S. in the Philippines.
The Export-Import Bank of the U.S. (EX-IM Bank) is an independent U.S. Government agencythat helps finance the overseas sales of U.S. goods and services. It provides guarantees ofworking capital loans for U.S. exporters, guarantees the repayment of loans or makes loans toforeign purchasers of U.S. goods and services. EX-IM Bank also provides credit insurance thatprotects U.S. exporters against the risks of non-payment by foreign buyers for political orcommercial reasons.
Two different programs, according to an interview with an EX-IM officer in Houston (Crilley),are applicable to exporters from the U.S. and importers from overseas:
1) Short-term credit: EX-IM bank will guarantee the receivables, from oversea importers, viaexporters’ banks in the U.S., therefore the default risk is transferred to EX-IM bank. Whenexporters obtain the receivables from importers, the exporters will use them as collateral for aline of credit from banks in the U.S. However, EX-IM bank must credit the receivables fromimporters. This service has reportedly been used for frozen french fry exports.
2) Medium-term credit: This service is applied for refrigeration equipment and vehicles. Thepayment terms are up to five years. The amount of loan has no restriction in “improving theexisting cold storage chain”, or “building a new facility”, but the equipment must be made orassembled in the U.S. The seller of the equipment will receive a promissory note from theoverseas importer. EX-IM bank will guarantee up to 85 percent of the CIF value.1 Once theseller of the equipment presents the promissory note to banks in the U.S., the EX-IM bank willtake over the responsibility for default risk due to non-payment by the overseas importer.
U.S. Department of Agriculture Facility Guarantee Program in the Philippines
The Commodity Credit Corporation's (CCC) Facility Guarantee Program (FGP) providespayment guarantees to facilitate the financing of manufactured goods and services exported fromthe U.S. to improve or establish agricultural related facilities in emerging markets. By supportingsuch facilities, the FGP is designed to enhance sales of U.S. agricultural commodities andproducts to emerging markets where the demand for such commodities and products may beconstrained due to inadequate storage, processing, or handling capabilities (United StatesDepartment of Agriculture).
Although other government and multi-national programs finance export sales of manufacturedgoods and services, the FGP is aimed initially at financing moderate sized agricultural projects—including small businesses that may be overlooked by other export credit programs thatpredominately support projects unrelated to agriculture.
1 CIF is cargo value inclusive of charges, insurance and freight.

14
During interviews with business officers in various companies in the Philippines and Thailand,most of the business officers were aware of the FGP, but none of them used or plan to use FGPto finance their projects related to manufactured goods and services exported from the U.S.Most of officers do not know the application process. A couple of officers mentioned that theprocess is too complicated or involves extensive paper work.
The preceding review of the geography and economy of the Philippines illustrated the potentialmarket for frozen foods and the broad financial constraints to improving the cold chaininfrastructure. The next section shifts to the specific comments of the business personnelinterviewed in the Philippines. Based mainly on those discussions, specific improvements willbe proposed.
Issues Identified in Interviews
A team of four researchers traveled to the Philippines from May 18, 2000 to June 10, 2000.Approximately half of the time was spent in Metro Manila, while the remaining time was spentin Bacolod City and Cebu City. A trip to Davao City was planned but cancelled upon arrival inManila as a safety precaution due to the political unrest in southern Mindanao. Forty interviewswere conducted to determine the bottlenecks to distributing frozen foods in the Philippines.Persons interviewed consisted of four government officials, and responsible officials at threebanks, nine cold storage warehouses, ten shippers, brokers, and port management officials, threeimporters, four retailers and QSRs, and seven others involved in food distribution.
The main issues identified related to the cold storage facilities and inter-island shippingindustries.
Shortage of Cold Storage Capacity in Outlying Provinces
Two factors are creating a greater demand for cold storage warehouses in the Philippines -Filipinos are becoming more quality conscious and westernized as incomes slowly rise. This isevidenced by the near-full capacity level of most warehouses, particularly during the peak seasonof November and December. In Manila, capacity levels range from 66 percent to 99 percentduring the off-peak season.
In Bacolod, there is only one public cold storage warehouse that was built for the purpose ofleasing space, and this is at full capacity. Other warehouses in Bacolod were built for the privateuse of seafood processing companies, but are now being leased because of the decline in thedemand for seafood storage. These warehouses are not at full capacity due to quality issues. InCebu, there are three public cold storage warehouses, but only one that can reach a temperaturelevel that is adequate for frozen french fries.
If extra capacity is needed at a warehouse, the manager may opt to rent a reefer container totemporarily store product. The cost for this is 2,000 pesos per day, which includes rental andelectricity costs. The reefer container can usually be delivered within one day of the order.Customers will also use ice chests to temporarily store frozen or chilled products when all of thepublic cold storage warehouses are full. Many food processors discussed plans to build privatecold storage warehouses to overcome the shortage in the south.

15
The QSR chains have strict quality guidelines, which many of the cold storage warehousesoutside of Manila cannot meet. Poor quality at a warehouse was defined as the following:variable or high temperatures, dial temperature gauges rather than digital, no racks and perhapsno pallets, lack of ante-rooms, insulation, and loading docks, and no mechanization. As oneQSR representative stated, "The cold storage facilities in the provinces cater to the seafoodindustry, rather than the QSRs." One of the QSR chains requires all of its retail stores in theprovinces to have a large enough freezer to accommodate a 20-foot container so that they do nothave to rent space in cold storage facilities.
Most of the cold storage warehouses in the Philippines require their customers to rent an entireroom and require yearly contracts. Some are starting to partition rooms to accommodatecustomers with smaller volume, although the customers must agree on the room temperature asdifferent products have different temperature requirements. Rates in Manila range from 8.10pesos per cubic meter per day (not inclusive of pallet rental, handling charges, etc.) to 60 pesosper pallet per day (inclusive of inventory maintenance, loading/unloading, etc.). It is common inthe provinces to charge by the room, for instance 120,000 pesos per room per month is theamount that one facility in Bacolod charges. However, one representative in Cebu mentionedthat it is not effective to charge by the room because the customer may overstock the freezer,which can cause maintenance problems. This particular representative charges five centavos perkilo per day plus electricity by the hour when a customer plugs in a reefer container.
High electricity costs were consistently rated as the number one problem that the cold storagefacilities face. The representatives attribute the high rates to the government owned and operatedenergy companies. Energy costs comprise between 30 and 50 percent of total costs at coldstorage facilities in Manila and Bacolod. One representative in Cebu stated that energy costscomprise between 80 and 90 percent of the budget. Electricity rates in secondary cities are 5 to25 percent higher than in Manila, depending on which city is chosen for the project. Cebu hasthe highest energy costs in the country; they have risen from 3.0 to 4.7 pesos per kilowatt hourover the past few years. Another problem in Cebu is erratic electricity voltage, ranging from190-250 volts. This causes compressors to wear out quickly.
To maintain efficient use of energy, the cold storage owners and operators should limit thenumber of freezer door openings as well as perform preventative maintenance on equipment andinsulation.
Another major cost for cold storage warehouses is labor. Labor costs comprise 30 percent of onecold storage warehouse's variable costs. Labor costs are higher in Manila than in the provinces.Labor unions are strong in the Philippines, so one warehouse in Bacolod hires the majority of itsemployees through temp agencies. Labor laws in the Philippines dictate that employees whohave worked for more than six months must be treated as full-time regular employees. To avoidthis labor law, the cold storage facility often hires someone for less than six months.
High Cost of Inter-Island Shipping
There are three major inter-island shipping companies in the Philippines - Negros NavigationCompany, Inc., Sulpicio Lines, Inc., and WG&A. WG&A is the result of a recent merger
16
between three inter-island shipping companies. Although this industry was deregulated a fewyears ago, sources state that the government still allows shippers to confer like a cartel and theshipping lines all charge the same rate.
All three shipping lines transport both passengers and cargo, with cargo representing between 33and 50 percent of their revenues. Of the cargo that is handled, only a small portion isrefrigerated or frozen. The shipping lines offer either pier-to-pier or door-to-door services fortheir customers. They also offer other services, such as providing the reefer containers andloading and unloading of product into the containers. Their customers are primarily brokers whohandle all of the details and negotiations for the food processors or QSRs. One broker allows itsclients to have the container for 48 hours to load or unload without charge; the client is chargedbetween 1,000 and 2,000 pesos per day after this time. The client is also charged between 300and 400 pesos per day for use of the chassis.
High inter-island freight rates were viewed as the largest problem to distributing frozen foods inthe Philippines. See Table 12 for a summary of rates from Manila to the secondary cities.Companies cited many examples to show that it costs more to ship from Manila to another portin the Philippines than to ship from Manila to another port in Asia. It is also less expensive foran importer to ship directly to Cebu or Davao from the U.S. West Coast than it is to transshipthrough Manila. Inter-island freight rates increased by more than 30 percent between December1999 and May 2000. Several reasons were given for the high freight rates. The shipping linesaccredit some of this increase to increasing fuel prices. The government allows them to pass thison to their customers if the increase is greater than 10 percent. Effective August 2, 2000, therates listed in Table 12 will increase by six to seven percent as a result of the latest increase infuel. One representative attributes the high freight rates to pilferage from the containers either onthe ship or at the port. Clients can file claims against the shipping line for missing products, butthe cost is ultimately passed to the customer. Another representative stated that governmentpolicies protect the industry and allow the high rates. Many of those interviewed stated thatmore shipping lines should enter the market to make the industry more competitive. It was alsosuggested that the government allow foreign carriers to ship goods from Manila to secondaryports in the Philippines.
Inadequate reefer outlet plugs on vessels is also seen as a problem to distributing frozen food inthe Philippines, although the shipping lines feel that more outlets are not needed. Onerepresentative in the reefer container industry stated that the shipping lines do not realize a profitwhen transporting reefer containers, therefore it is not a high priority to increase the number ofoutlets. In addition to inadequate number of outlets, there are concerns about the voltageconstraints on some vessels. One carrier's vessels have a voltage range of only 220 to 240 volts,but a 40-foot reefer container requires 440 volts. To overcome this problem, some 40-footcontainers have dual voltage systems that allow one container to be plugged into two 220-voltoutlets.
One of the major industry players explains that the access to ship space and reefer containers isnot a problem. The costs of shipping are high, but they reflect the pressure on prices fromalternative business opportunities in passenger traffic.
17
While 40-foot containers are primarily used in international shipping, 20-foot containers areprimarily used in inter-island shipping of chilled or frozen foods. Reasons for this include lackof market demand for 40-foot volume, inadequate facilities at secondary ports to load and unload40-foot containers, voltage constraints (as discussed above) and narrow roads, which do notaccommodate 40-foot container truck transport. Some french fry importers in Manila do notbreak up the loads of 40-foot containers; therefore their customers must order in 40-footquantities. When a city does not have the demand for this amount of volume or if it cannotaccommodate a 40-foot container, the importer will not service the area.
The inadequate number of 20-foot reefer containers was cited as a major problem to distributingfrozen foods within the country, although some representatives explained that it is theavailability and positioning of the reefer containers that presents the real problem. Moreproducts are shipped from Manila than to Manila; therefore empty reefer containers stay in thesecondary cities waiting to be filled and then shipped. Otherwise they must be shipped backempty. One broker stated that only 20 percent of reefer containers are backhauled from Bacolodto Manila with product inside. Another example is that an average of 60 reefer containers areshipped from Manila to Cebu per month, while only 40 reefer containers are shipped from Cebuto Manila per month. One broker has plans to purchase additional reefer containers to deal withthis problem, at a cost of 500,000 pesos per container (brand new). Reefer containers have anaverage useful life of 20 years depending on the maintenance. One broker who has a 50 percentmarket share in reefer container usage owns approximately 200 reefer containers, of which 70percent are new and 40 percent have a digital temperature recording system.
Alternatives to Shipping Via Sea Carrier
The problems of high freight rates and inadequate reefer outlets associated with sea carriers hasprompted some in the Philippines to utilize alternate distribution systems. Although thePhilippines consists of a group of islands, it is physically possible to truck goods from thenorthernmost island to the southernmost island with the aid of only two ferries. The total triptime from Manila to Davao City is 37 hours, by road. The costs for the two methods ofdistribution are similar, at 34,685 pesos for shipping via sea vs. 48,000 pesos for shipping viatruck. There are two problems, however, with shipping frozen foods for such a long distance viatruck. The first is that the frequency of the ferry crossings is not reliable, and the second is thatthe long drive is too stressful on the driver.
Instead of trucking frozen foods from Manila to Mindanao, some are using trucks for shorterdistances, for instance from Cebu to Bacolod. One source stated that the length of time is thesame, and it is less expensive. Another source, a food manufacturer in Bacolod City, plans tobegin trucking shipments to the capital of Negros Oriental, a four-hour drive with good roadconditions. A food distributor in Cebu City delivers thirty percent of orders via truck tosurrounding cities. The stores that obtain products via truck receive a lower volume more often,but the product is fresher. Each of their stores have a freezer capacity for one week of product.Since the store manager pays for the shipping costs, they are responsible for making thedecisions regarding delivery times and quantities. Still others will place an entire refrigeratedtruck on a vessel to travel from Cebu to Mindanao so that it can be driven around Mindanaoupon arrival.

18
Delivery trucks have an average useful life of between five and fifteen years, depending on themaintenance and the damage they receive from poor road conditions. The refrigerationequipment attached to the truck usually lasts longer than the actual truck. A new refrigeratedtruck costs two million pesos. To overcome this large expense, many purchase used or surplustrucks from Japan for between 300,000 and 400,000 pesos. One company is assembling theirown trucks, saving 30 to 40 percent by using second-hand cabs, chassis and compressors. Asavings of 20 percent would be realized if new cabs and chassis were used.
Another alternative to shipping via sea carrier is by air carrier. There are two major domesticairlines in the Philippines, of which one was interviewed. The cargo that is currently shipped viaair consists of mostly live or frozen seafood. Live shipments require a shipping permit from thegovernment; frozen shipments do not require this. Customers must schedule the cargo one dayin advance and must deliver the product to the airport 30 minutes before departure. The averageamount of cargo per flight is 2.5 tons, and the rates charged are dependent on volume or weight,whichever is less expensive. Even though the flights cover short distances, a customer shippingproduct from Manila to Bacolod must allow two hours for loading, flight time, and unloading.The containers are not plugged into an energy source during transit. Door-to-door services arenot offered by the airlines.
The average container size shipped via air is 39x39x46 centimeters. To ship frozen french friesin this manner, a distributor in Manila would be required to break up a container into smallerpackages. This may be a viable alternative for a city that does not meet the demand for an entire20-foot container of french fries.
The airline that was interviewed did an economic comparison of shipping fish by air rather thanby sea, and found that there is a 50 percent savings when shipping by air. This is due to the factthat rates are determined by weight. Since the shipping time by boat is much longer, largeamounts of ice are used on boats, which is not needed on airplanes. Therefore a customer canship more fish per container by air.
Possible Solution
To avoid the heavy traffic congestion in Manila and expensive inter-island freight rates, it isrecommended that frozen potato products be shipped directly to other international ports in thePhilippines when possible. One QSR chain is already taking advantage of this, by shipping 40-foot containers directly from the U.S. into the Cebu port.
In order to assess the feasibility of commercial investment in the Philippines, pilot projects wereestablished. These projects were chosen based on the identification of the links in the cold chaininfrastructure that had the most need for improvement and potential for growth within the region.These factors were identified through both the research and interview stages of this project.
Proposed Projects
The proposed pilot project in the Philippines was to build medium-sized cold storage warehouses(15,000 cubic meters) in designated secondary cities. Given the currently growing demand for

19
cold storage triggered by expansion of QSR business in these cities, the moderate marketcompetition, and an expected high utilization rate, the investment project can be profitable.
QSR Market Growth
Major customers for this cold storage project will be QSRs. With the gradually changing eatinghabits and influence of western culture, the outlook for QSRs in the Philippines is positive. Boththe domestic and U.S. based QSRs interviewed are looking to expand their business in the nextfew years. As can be seen from Table 13, the sales volume and earnings for Jollibee FoodsCorporation, the largest QSR in the Philippines, has increased continuously in recent years, eventhrough the Asian financial crisis of 1997. Increasing sales and number of stores will stimulatethe demand for cold storage service in the area.
Industry and Competition
Cold storage business in the Philippines is seasonal. From October to December is the highseason with 100 percent average storage capacity utilization rate. May to July represents the lowseason with 60 percent average utilization rate. According to interviews conducted in June 2000,business profitability largely depends on average utilization rate. Stimulated by the growingdemand for storing frozen food for both QSR and export/import food businesses, many coldstorage warehouses have been built in recent years. However, high quality cold storageavailability is still a problem, especially in the regions outside Metro Manila. In secondary citiessuch as Bacolod and Cebu, quality public cold storage warehouses are basically unavailable. Inorder to expand their business to these cities, QSRs must either build their own storage facilitiesor ship frozen raw materials from Manila more frequently. Neither option would be economicalgiven the cost of building a facility and the high cost of inter-island shipping. Building a qualitypublic cold storage would solve this problem. Those storage warehouses that can meet the strictrequirement of QSRs and semiconductor manufacturers can charge premium prices. Also, QSRsand food processing companies would sign long-term contracts with storage warehouses (at leastone year) and rent entire rooms. These long-term business contracts could largely reduce thefluctuation of seasonal utilization rate in cold storage and would be critical to the profitability ofa project. Also, the competition in this high-end market is not as fierce as in the medium or low-end cold storage market. Therefore, the market potential is great.
Business and Operation
This pilot project involves building medium sized modern cold storage facilities that canaccommodate major QSRs and other food processing companies. These facilities would belocated in Cebu and Cagayan de Oro. These cities were chosen because of market size,population, and central location. The main customers would be Jollibee Foods, McDonald’s,KFC, Burger King and other QSRs. The secondary customers would be those food processors,importers and exporters that currently have their own facilities and only use public facilities toaccommodate peak season demand. Also, some business would come from semiconductormanufacturers who require cold storage for electronic spaceports such as computer chips. Thecompany could be a joint venture or completely foreign owned (by U.S. investors), depending onwhich venture would receive more tax and tariff benefits. The main goal for the company shouldbe quality and service, which are highly valued by all QSRs in the Philippines.

20
Assumptions
Table 14 lists the assumptions used in the financial analysis of the proposed cold storage facility.The size of each cold storage facility would be 15,000 cubic meters. An initial investment of 45million pesos includes facility construction and equipment costs such as compressors (U.S.made), storage room panels, generators and computers, forklifts, plates, etc. There are alsobusiness set-up costs for government documentation, certification and legal issues. The size ofthe facility, the cost of construction and equipment, and rental rate are all within the range thatwas obtained during the interviews. It is estimated that construction would take approximatelysix to ten months to complete.
Operational expenses include electricity costs, salaries and wages, maintenance costs, rent,licenses and fees, and other costs. Electricity rates, as discussed earlier, vary widely throughoutthe country. An unofficial average is 4 pesos per kilowatt hour, which was used as the baseassumption when figuring electricity costs. The unit price for electricity would largely decide thetotal cost of operation, given the stable usage rate per month. The monthly kilowatt usage wasobtained for one cold storage facility in Cebu, and from this usage for a 15,000 cubic meterfacility was determined. We estimated a non-linear relationship between energy usage and thesize of the facility to account for energy efficiency. Salary and wage costs are for a total offourteen employees. These include four managerial / office staff with a salary of $300 per monthand ten warehouse employees whose wages equal $100 per month. Maintenance costs, rent,licenses and fees, and other costs were assumed to be a percentage of the value of receipts.
The final assumptions made with regards to the financial statements are the interest and tax rates.These are also reasonable estimates based on information obtained during interviews. ThePhilippines National Economic Development Authority (NEDA) reports an estimated interestrate of 10.3 percent for January to June of 2000 (Table 8), while an interviewee reports aninterest rate of 13.75 percent for May 2000. The assumed rate of 12 percent in this analysis fallsbetween the two reported figures, and tends to favor the project’s acceptance.
Methodology
Almost all investment decisions are made under conditions of risk and uncertainty. One toolavailable for decision making under risk is to simulate the different scenarios, resulting in aprobability distribution or range of possible values and their likelihood of occurrence. The firststep in doing this is to identify the variables that are likely to influence the success or failure ofthe project (Richardson and Mapp). Deterministic variables are those that have certain values,while stochastic variables have unknown or uncertain values. It was concluded by the researchteam that the key stochastic portion of the cold storage model was capacity utilization rate.Using a random number generator, many samples of the stochastic variable were drawn to form adistribution. The nature of the uncertainty of utilization rate could best be described with anempirical distribution. Empirical distributions are used when the variable has a finite minimumand maximum, and when there are limited observations (Richardson). The computer programused was @Risk (Palisade Corporation).
The next step is to link stochastic and deterministic variables through accounting equations(Richardson and Mapp). For example, the stochastic annual utilization rate was multiplied by
21
the rental rate to determine the revenue for the cold storage facility. This also allows aprobability distribution to be formed for every variable that is linked either directly or indirectlyto the stochastic variable. In order to conclude the probability of having an investment thatcontributes to the owners’ total value, a distribution was created for one particular outputvariable, Net Present Value (NPV).
Financial Analysis/Sensitivity Analysis
The first assessment of the pilot project for cold storage warehouses in the southern islands of thePhilippines represents a pessimistic case: it is assumed that this warehouse operates at lowcapacity utilization. The income statement for this case is shown in Table 15. The purpose ofthis deterministic baseline model is to underscore the break-even level of usage that the newfacility will require in order to cover the initial investment. If it is assumed that the warehouseoperates at 63 percent capacity utilization (9,450 cubic meters per month) over its 10-year life,and the rate charged is 300 pesos per cubic meter per month, then the project will just break evenat a 15 percent cost of capital. The NPV of 340,550 pesos presents an acceptable investment,especially considering the conservative assumptions regarding the level of business in the newfacility.
The break even level of capacity utilization rises if the investment is evaluated with a higher costof capital. If the project is assessed using a 25 percent discount rate, then it must be operated at76 percent capacity utilization in order to be acceptable. It is possible that investors wouldrequire this higher discount factor, to account for additional risk. It is not expected that coldstorage operators would need to obtain contracts with importers or QSR companies in order tomaintain a 76 percent utilization rate.
The interviews conducted by the research team with cold storage businesses in the Philippinesindicated that seasonal variation in usage is typical. Therefore, to supplement the baselinedeterministic model, a stochastic simulation of annual capacity utilization was conducted. Coldstorage warehouses are typically full during the fall months, leading to the holiday season, andthen usually are 60 to 70 percent full during spring and summer. An empirical distributionfunction was generated, using the range of 9,360 cubic meters to 15,000 cubic meters as inputsfor the random variable monthly quantity stored. When simulated with 100 random iterations,the input random variable for quantity stored has an expected value of 11,762 cubic meters(Figure 2). These levels of storage correspond to an expected capacity utilization rate of 78percent in each month. This average utilization rate exceeds all the break-even levels found inthe deterministic models described previously. The income statement for this case is shown inTable 16. The standard deviation of 1,906 cubic meters represents the risk (Table 17). Thefigure indicates some positive skewness of the distribution, with the highest (modal) probabilityaround 9,800 cubic meters (65 percent full). The longer right tail generates a higher meancapacity level. It is expected that the project will have a favorable outlook. However, thesimulation draws independently from the random variables in each month, thus allowing for thechance of higher or lower utilization rates in any period, and an overall result that accounts forthe risk of unfavorable utilization rates.
The simulation of annual net income mirrors the pattern of the utilization levels, given the linearrelationship between amounts stored, total revenue, and many of the cost items in this model.

22
The cumulative distribution function indicates a distribution centered around 8.9 million pesosper year in net income (Figure 3). The standard error on net income is 3.6 million, indicatingthat in any year, it is quite likely to find net income within the range of 7.2 million pesos aboveor below the 8 million peso average. It is interesting to note that there is almost no chance of anannual loss, based on this simulation.
The simulation of NPV also indicates strongly favorable outcomes for the project (Figure 4).There is almost no chance of an outcome with an NPV less than zero, and the average of thesimulated values for NPV exceeds 22 million pesos, using a 15 percent discount rate and a 10year project life.
Sensitivity analysis was conducted to determine if changes in major assumptions would beexpected to change the outcome of the project. The cost of capital used in the analysis canchange the results. As shown in Table 18, the break even discount rate using the stochasticmodel is 27 percent. This high rate might be the required return held by some investors tocompensate for risk of this project but it exceeds market costs of debt capital.
The rental rate charged for storage has an impact on the outcome as well. At a 15 percentdiscount rate, the business must charge at least 245 pesos per cubic meter per month for theproject to have an NPV greater than zero.
The interest expense on borrowed capital was also examined. This variable has little effect onthe project outcome. The model is built with the assumption that 40 percent of the initialinvestment uses borrowed funds and annual interest expenses are incurred. Even if 100 percentof the initial expense uses borrowed funds, interest expenses reduce net cash flows somewhat,yet the project still has a positive NPV (11.4 million pesos).
Conclusions
This cold storage pilot project is considered commercially viable. There are other factors, bothnegative and positive, that should affect the investment decision. One negative factor is theunstable political situation in southern Mindanao. While the political situation has affected theentire country, it has especially impacted business conditions on that island. Cagayan de Oro, acity in northern Mindanao, was a proposed site for a cold storage facility. An investor maydecide to postpone construction there until the political situation is settled. More recent politicalinstability relating to the possible impeachment of the president is another factor to consider.
Another negative aspect of investing in the Philippines is the high exchange rate. A risingexchange rate equates to decreased purchasing power for Filipinos with respect to imports, thusthe market demand for QSRs may begin to shrink. The utilization rate for cold storage facilitiescould suffer in this situation.
On the positive side, as of Fall 2000, economic conditions have improved since the Asian crisisof 1997. Additionally, there is little competition for high-quality cold storage facilities in regionsoutside of Manila. The demand for cold storage space is a derived demand, and depends on thedemand for frozen and chilled foods. This research suggests that consumer acceptance of certain

23
frozen foods is growing, including frozen potatoes, ice cream, and other foods sold in QSRs,.The continuation of this trend in demand will offer a positive outlook for this investment project.Those investors who can offer quality service to one of the major QSR chains and obtain theircommitment to fill the warehouse space will have even greater prospects for success.

24
Figure 1. Shaded Relief Map of the Philippines.
Source: University of Texas at Austin, 2000.

25
Figure 2. Cumulative Distribution Function for Cold Storage Utilization.
Figure 3. Cumulative Distribution Function for Cold Storage Net Income.
0
0.1
0.2
0.3
0.4
0.5
0.6
0.7
0.8
0.9
4.39
5.16
5.97
6.77
7.57
8.37
9.17
9.97
10.7
7
11.5
7
12.3
7
13.1
7
13.9
8
14.7
8
Pesos (in millions)
Prob
of
Val
ue <
= X
-axi
s V
alue
0
0.1
0.2
0.3
0.4
0.5
0.6
0.7
0.8
0.993
.7
97.8
102.
1
106.
3
110.
5
114.
8
119.
0
123.
2
127.
4
131.
7
135.
9
140.
1
144.
4
148.
6
Cubic Meters (values in hundreds)
Prob
of
Val
ue <
= X
-axi
s V
alue
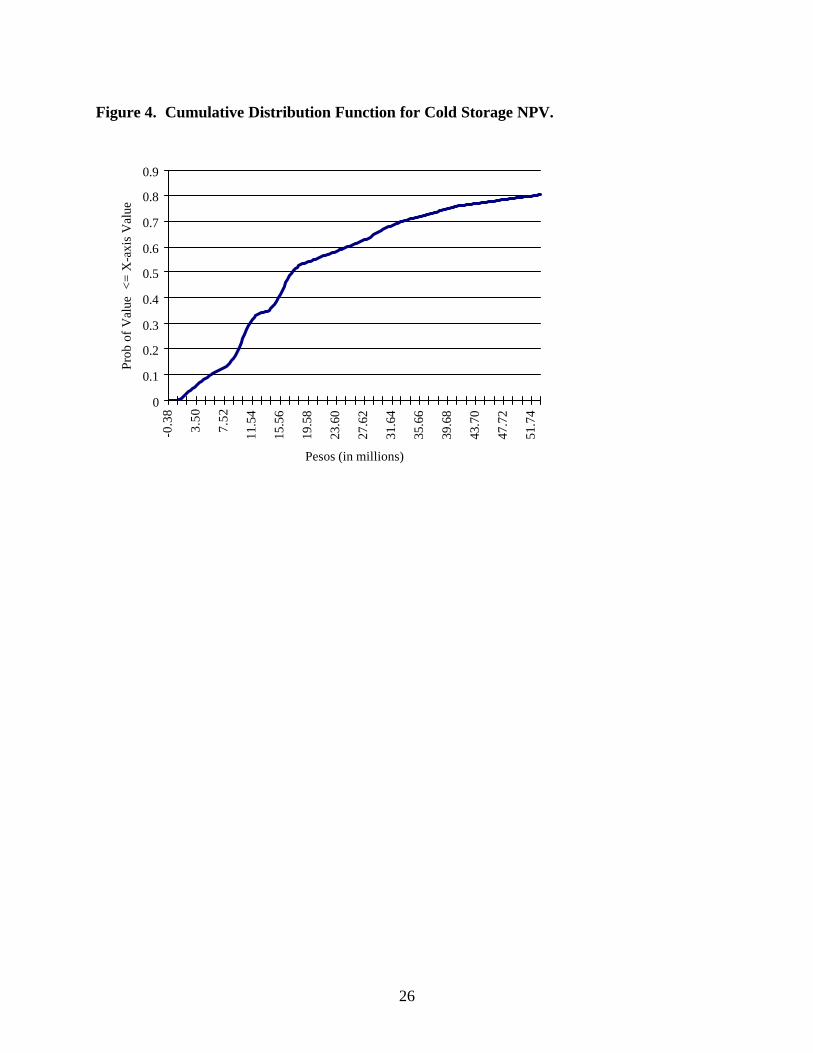
26
Figure 4. Cumulative Distribution Function for Cold Storage NPV.
0
0.1
0.2
0.3
0.4
0.5
0.6
0.7
0.8
0.9-0
.38
3.50
7.52
11.5
4
15.5
6
19.5
8
23.6
0
27.6
2
31.6
4
35.6
6
39.6
8
43.7
0
47.7
2
51.7
4
Pesos (in millions)
Prob
of
Val
ue <
= X
-axi
s V
alue

27
Table 1. Number and Length of Bridges in the Philippines, 1990-1996.Year Number Total length (km)1990 7,346 240,2511991 7,031 243,4381992 7,031 250,1911993 7,046 248,7661994 7,112 255,2611995 7,402 256,7381996 7,347 261,015
Source: Road Handbook in the Philippines ‘98, 1998.
Table 2. Distance in Nautical Miles* Between Major Cities in the Philippines.City Manila Bacolod City Cebu City Cagayan de Oro Davao CityManila -- 328 382 504 529Bacolod City -- 163 N/A 567Cebu City -- 135 428Cagayan de Oro -- 419Davao City --* 1 nautical mile = 1.852 kmSource: Go, 2000.
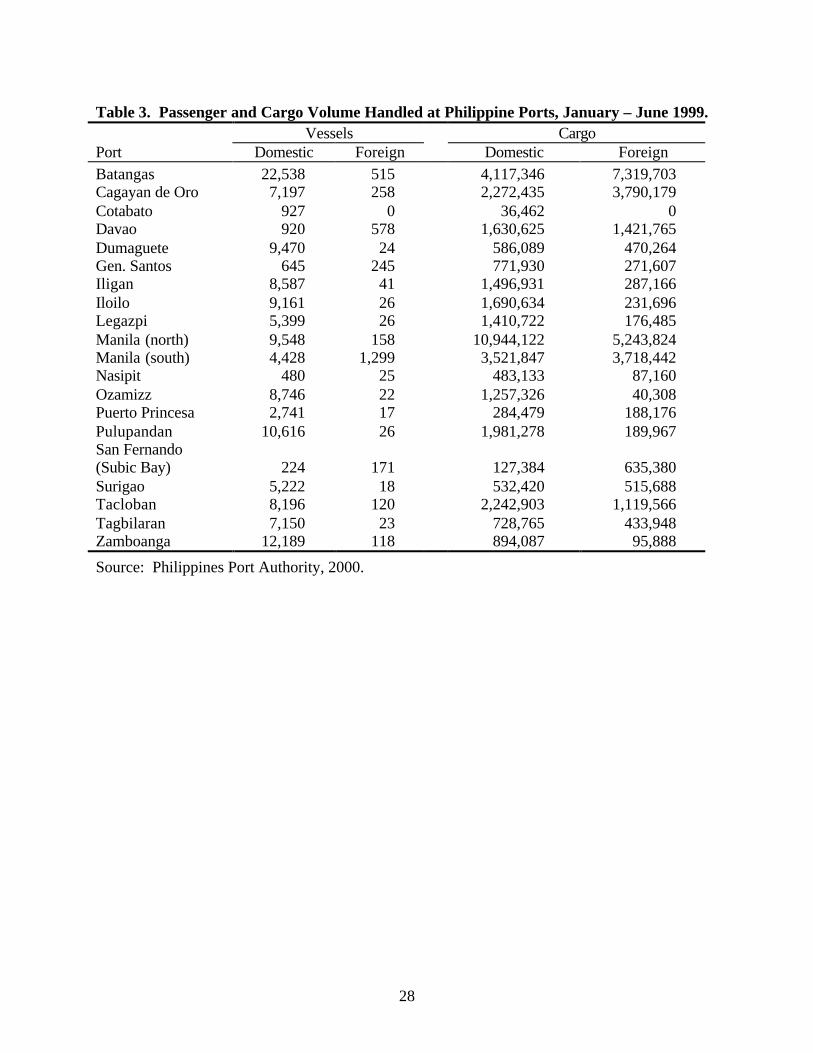
28
Table 3. Passenger and Cargo Volume Handled at Philippine Ports, January – June 1999.Vessels Cargo
Port Domestic Foreign Domestic ForeignBatangas 22,538 515 4,117,346 7,319,703Cagayan de Oro 7,197 258 2,272,435 3,790,179Cotabato 927 0 36,462 0Davao 920 578 1,630,625 1,421,765Dumaguete 9,470 24 586,089 470,264Gen. Santos 645 245 771,930 271,607Iligan 8,587 41 1,496,931 287,166Iloilo 9,161 26 1,690,634 231,696Legazpi 5,399 26 1,410,722 176,485Manila (north) 9,548 158 10,944,122 5,243,824Manila (south) 4,428 1,299 3,521,847 3,718,442Nasipit 480 25 483,133 87,160Ozamizz 8,746 22 1,257,326 40,308Puerto Princesa 2,741 17 284,479 188,176Pulupandan 10,616 26 1,981,278 189,967San Fernando(Subic Bay) 224 171 127,384 635,380Surigao 5,222 18 532,420 515,688Tacloban 8,196 120 2,242,903 1,119,566Tagbilaran 7,150 23 728,765 433,948Zamboanga 12,189 118 894,087 95,888
Source: Philippines Port Authority, 2000.

29
Table 4. Projected Population, 2000 and 2005, and 1997 Average Income in thePhilippines, by Region.
RegionPopulation
2000Population
2005Average income
(pesos)*Philippines 76,320,126 84,214,747 98,692National Capital Region 10,405,479 11,289,368 216,621Cordillera Administrative Region 1,400,490 1,553,173 92,554Region I – Ilocos 4,140,531 4,481,820 82,873Region II – Cagayan Valley 2,812,589 3,086,812 69,681Region III – Central Luzon 7,686,845 8,426,578 106,932Region IV – Southern Tagalog 11,301,272 12,810,064 106,316Region V – Bicol 4,755,820 5,165,243 59,607Region VI – Western Visayas 6,324,098 6,884,429 71,652Region VII - Central Visayas 5,539,177 6,068,238 67,846Region VIII - Eastern Visayas 3,743,895 4,133,242 53,196Region IX - Western Mindanao 3,152,009 3,522,722 69,226Region X - Northern Mindanao 4,441,739 4,955,545 79,589Region XI - Southern Mindanao 5,749,821 6,456,464 76,135Region XII - Central Mindanao 2,660,270 2,971,763 66,470Autonomous Region for Muslim Mindanao 2,206,106 2,409,317 57,961
*One U.S. Dollar was approximately 40 Philippine Pesos in May 2000.Source: Philippines National Statistics Office, 2000.
Table 5. Total Number of Families by Income Class, 1997.Income range (pesos) Number of families Percentage of familiesUnder P10,000 66,917 0.410,000-19,999 482,827 3.420,000-29,999 1,132,664 8.030,000-39,999 1,473,041 10.440,000-49,999 1,438,575 10.150,000-59,999 1,163,897 8.260,000-79,999 1,828,642 12.980,000-99,999 1,285,026 9.1100,000-149,999 2,072,417 14.6150,000-249,999 1,853,665 13.1250,000-499,999 1,063,498 7.5500,000 and over 331,293 2.3
*One U.S. Dollar was approximately 40 Philippine Pesos in May 2000.Source: Philippines National Economic and Development Authority, 2000.

30
Table 6. Number of McDonalds Units in Major Cities of the Philippines, 2000.City Number of unitsMetro Manila 143Bacolod City 5Cagayan de Oro 2Cebu City 4Davao City 4Iloilo 3
Source: Rellosa, 2000.
Table 7. Eating Establishments in the Philippines, 1996-1997 (values in million pesos).1996 1997
Restaurants,cafes, and fast-
food centers
Refreshmentstands, kiosks,and counters
Restaurants,cafes, and fast-
food centers
Refreshmentstands, kiosks,and counters
Number ofestablishments 4,220 453 4,474 477Total Revenues 27,692 2,284 31,018 2,668Total Costs 19,527 1,376 21,942 1,625Source: Annual Survey of Establishments, 1996-1997.

31
Table 8. Summary of Macroeconomic Indicators for the Philippines, 1990-2001.
YearNominal
GDP
RealGDP
1985 prices
Averagelending
rateInflation
rateExchange
rate
Unem-ployment
rateMillionpesos
Millionpesos % 1994 = 100
Averagepesos/USD %
1990 1,077,237 720,691 24.3 13.2 24.31 8.31991 1,248,011 716,523 23.5 18.5 27.48 10.51992 1,351,559 718,942 19.4 8.6 25.51 9.81993 1,474,457 734,156 14.6 7.0 27.12 9.31994 1,692,932 766,451 15.0 8.3 26.42 9.51995 1,905,951 802,224 14.6 8.0 25.71 9.51996 2,171,922 849,122 14.8 9.1 26.22 8.61997 2,426,743 893,017 16.2 5.9 29.47 8.71998 2,678,187 887,905 18.4 9.8 40.89 10.101999 2,996,371 917,382 11.8 6.6 39.09 9.7Jan.-Jun. 00 10.3 (Mar.) 3.5 41.26 9.300 est. low 3,256,566 5.000 est. high 3,348,897 6.001 est. low 3,571,865 5.501 est. high 3,744,099 6.5Source: Bautista, 2000 (GDP, inflation rate, and exchange rate).Philippines National Economic and Development Authority, 2000 (real GDP, interest rate,unemployment rate).
Table 9. Performance Measures for Commercial Banks in the Philippines.Date Total %
Non-performing loan ratio April 1999 14.48May 1999 14.45June 1999 (preliminary) 13.65
Percent of lending in property sector March 1999 13.2Capital adequacy ratio March 1999 17.7Provision for loan losses May 1999 4.82Change in loans outstanding May 1999 - 5.6Bank failures as share of total 0.3
Source: Buenaventura, 1999.

32
Table 10. Philippine National Bank and Subsidiaries Consolidated Statement of Incomefor the Year Ended December 31.*
1999 1998 1997Net interest income 3,663 5,299 5,878Provision for probable loan andother losses 8,515 8,884 1,949
Other income (losses) 5,967 4,338 4,497Other expenses 8,050 8,960 6,759Net income (loss) (P 9,874) (P 7,251) P 1,141* In million pesos.Source: Philippine National Bank, 1999.
Table 11. Number of Banks in the Philippines at the End of 1998.Type of bank NumberCommercial banks (locally owned) 53Commercial banks (foreign owned) 13Thrift banks 117Rural banks 826Source: Buenaventura, 1999.

33
Table 12. Summary of Door-to-Door Freight Rates* from Manila to Secondary Cities.City 10-foot reefer container 20-foot reefer container
pesos pesosBacolod City 11,944.05 21,926.65Butuan City 15,246.21 28,660.02Cagayan City 12,508.87 24,512.43Cebu City 12,581.03 23,233.60Cotabato City 17,023.39 32,147.34Gen. Santos City 15,553.80 31,150.82Davao City 17,237.50 34,684.68Dipolog City 13,356.59 25,524.27Dumaguete City 12,879.93 24,086.42Iligan City 14,081.82 26,330.68Iloilo City 11,882.60 21,835.75Masbate City 10,865.86 ---Ozamis City 13,785.21 25,885.97Puerto Princesa 11,827.58 21,871.72Surigao City 13,586.97 25,340.99Tacloban City 12,098.85 22,386.74Tagbilaran City 12,914.19 24,143.38Zamboanga City 14,295.35 26,906.25* inclusive of freight, cargo handling charge, trucking, documentary stamp, and wharfagefor both ports of origin and destination.Source: Go, 2000. (Source states that these rates should not be considered official price
quotations.)
Table 13. Sales Volume and Earnings for Jollibee Foods.
Year Sales* Sales growth (%) EBITDA**
1995 4.851 N/C 0.772
1996 6.905 42.3 1.020
1997 8.757 26.8 1.215
1998 11.518 31.5 1.490
1999 12.758 10.8 1.458
2000 (first two quarters) 6.590 7.2 N/C* In billions of pesos.** Earnings before interest, taxes, depreciation, and amortization.Source: Corporate Information, 2000.
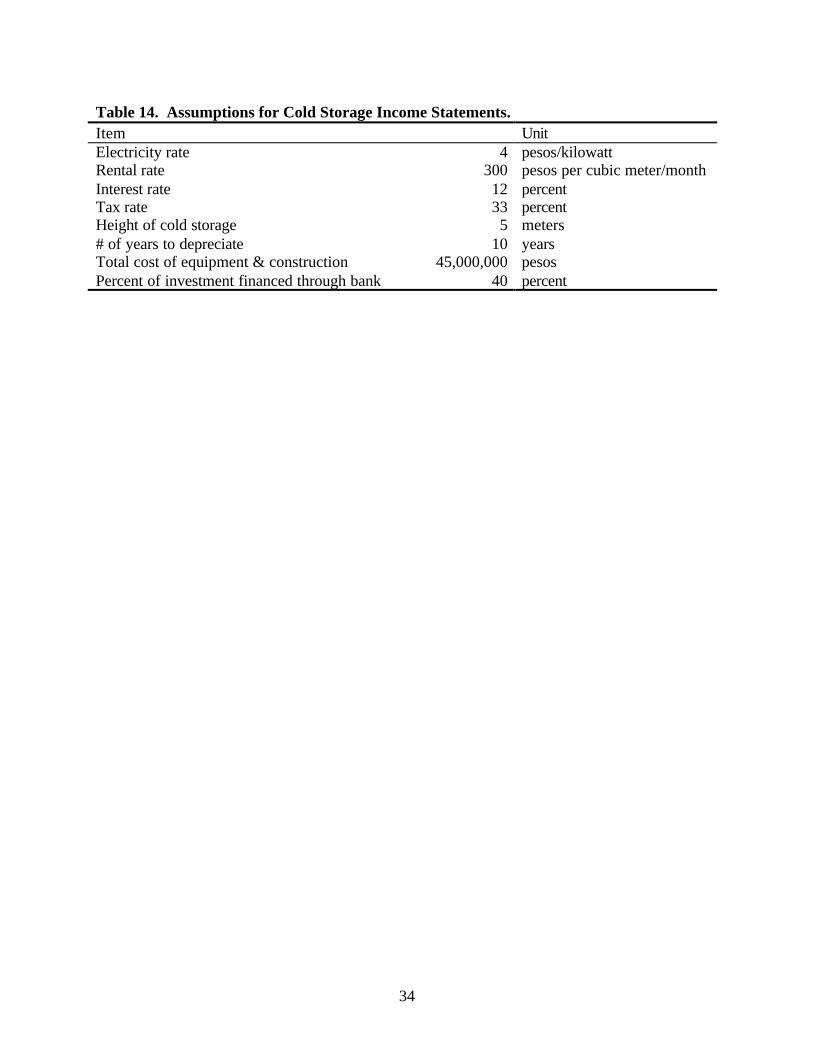
34
Table 14. Assumptions for Cold Storage Income Statements.Item UnitElectricity rate 4 pesos/kilowattRental rate 300 pesos per cubic meter/monthInterest rate 12 percentTax rate 33 percentHeight of cold storage 5 meters# of years to depreciate 10 yearsTotal cost of equipment & construction 45,000,000 pesosPercent of investment financed through bank 40 percent

35
Table 15. Income Statement for Deterministic Cold Storage Model.Pesos per year
Receipts 34,020,0001
Expenses:Operating Expenses
Electricity Costs2 12,195,840Maintenance Costs3 3,402,000Salary & Wages4 1,082,400Rent5 2,381,400License & Fees6 170,100Other7 1,020,600
Depreciation 4,500,000Selling, General, & Admin.8 340,200
Total Expenses 25,092,540
Earnings before interest & taxes (EBIT) 8,927,460Interest expense9 2,160,000Earnings before taxes 6,767,460Taxes 2,233,262
Net Income 4,534,198
Depreciation 4,500,000Net operating cash flows 9,034,198
1 Calculated as rental rate (300) * 12 * 15,000 cubic meters * 0.63.2 Electricity rate (4 pesos) * monthly usage * 12.3 Ten percent of receipts.4 Assume 4 managers at $300/month and 10 employees at $100/month, with exchange rate of 41.5 Seven percent of receipts.6 One half percent of receipts.7 Three percent of receipts.8 One percent of receipts.9 Total cost of investment * % financed * interest rate on borrowed funds.

36
Table 16. Income Statement for Stochastic Cold Storage Model.Expected values in pesos per year
Receipts 48,600,000
Expenses:Operating Expenses
Electricity Costs2 12,195,840Maintenance Costs3 4,860,000Salary & Wages4 1,082,400Rent5 3,402,000License & Fees6 243,000Other7 1,458,000
Depreciation 4,500,000Selling, General, & Admin.8 486,000
Total Expenses 28,227,240
Earnings before interest & taxes (EBIT) 20,372,760Interest expense9 2,160,000Earnings before taxes 18,212,760Taxes 6,010,211
Net Income 12,202,549
Depreciation 4,500,000Net operating cash flows 16,702,549
1 This was simulated. Rental rate * simulated annual capacity.2 Electricity rate * monthly usage * 12.3 Ten percent of receipts.4 Assume 4 managers at $300/month and 10 employees at $100/month, withexchange rate of 41.5 Seven percent of receipts.6 One half percent of receipts.7 Three percent of receipts.8 One percent of receipts.9 Total cost of investment * % financed * interest rate.
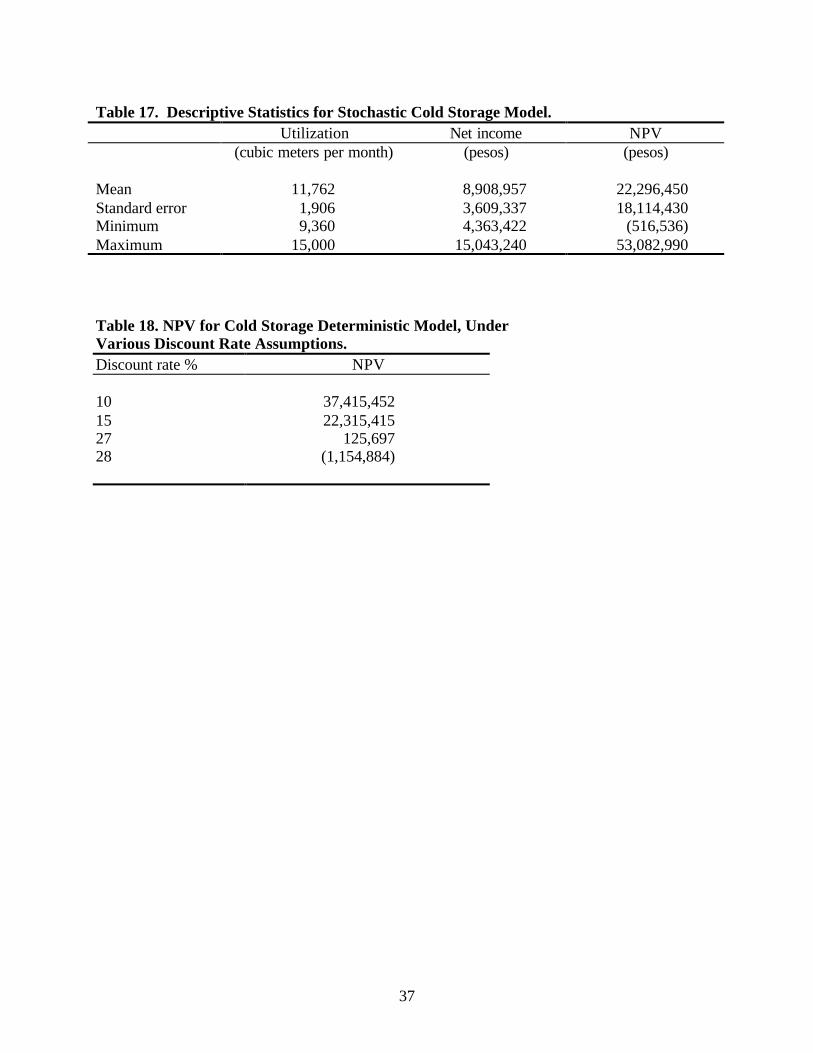
37
Table 17. Descriptive Statistics for Stochastic Cold Storage Model.Utilization Net income NPV
(cubic meters per month) (pesos) (pesos)
Mean 11,762 8,908,957 22,296,450Standard error 1,906 3,609,337 18,114,430Minimum 9,360 4,363,422 (516,536)Maximum 15,000 15,043,240 53,082,990
Table 18. NPV for Cold Storage Deterministic Model, UnderVarious Discount Rate Assumptions.Discount rate % NPV
10 37,415,45215 22,315,41527 125,69728 (1,154,884)

38
Thailand
Thailand’s government is a politically stable constitutional monarchy, headed by a king whoselegal powers are limited but whose presence is influential. Thailand has trade policies that areopen with the rest of the world. As an example, Thailand is a member of the World TradeOrganization and is committed to tariff reductions and trade reforms. Additionally,improvements have been made in both industrial and transportation infrastructure in recent years(Beasley).
From the point of view of U.S. exporters, one of the biggest concerns is the Thai import tariff onfrozen french fries. In the past, the tariff rate was 60 percent or 50 baht per kg. The listed tariffin the custom brochure is now 30 percent or 25 baht per kg. However, according to an interviewwith executives at one multinational QSR, the actual rate paid for imported french fries is 42percent and will be reduced by three percent each year in the future.
The following section outlines the geographic information that is important in assessing thefeasibility of commercial projects to enhance the cold chain infrastructure in Thailand.
Geographic Environment
The country of Thailand is located in Southeast Asia, bordering Myanmar (or Burma),Cambodia, Laos, and Malaysia (Figure 5). Total land area includes 511,770 square meters, with3,219 kilometers of coastline. The terrain is mostly mountainous, with the exception of theKorat Plateau in the east and plains in the central part of the country. Thailand has a tropicalclimate, with a rainy and warm southwest monsoon from mid-May to September and a dry, coolnortheast monsoon from November to mid-March. One important aspect of Thailand'sgeography is that it controls the only land route from northern Asia to Malaysia and Singapore.
In August 2000, the Thai population included 61,293,686 people, of whom 24 percent werebetween the ages of 0-14 and 70 percent were between the ages of 15-64. Languages includeThai, with regional and ethnic dialects. English is the secondary language of the elite.
Major Cities
Thailand has 76 provinces, of which 17 are in northern Thailand, 15 in southern Thailand, 25 incentral and eastern Thailand, and 19 in northeastern Thailand. The major cities and theirpopulations, as well as their distance from Bangkok are listed in Table 19. Bangkok is thecapital of Thailand, and is the most populous city in the country. It is known as the center foreducation, economics and business, government, tourism, and industries. Ayutthaya was thecapital of Thailand for 417 years, and is known as the ancient city of Thailand.
Chiang Mai is a major city in northern Thailand, and is the second most populated city with 1.5million people. Seventy percent of the terrain of Chiang Mai is mountainous and covered byforests. Nakhonratchasima, commonly known as Korat, is situated on a plateau. The city servesas the gateway to the northeastern region of Thailand. Khon Kaen is another major city in thenortheastern region. It is a major regional university and development center.

39
Songkhla is the third most populated city in the country and a major city in southern Thailand; itis a principal sea port and coastal trading post. Although not a highly populated city, Phuket isthe major tourist area in the south. Phuket is an island connected by bridges to southernThailand’s Andaman Sea coast, in the Indian Ocean. About 70 percent of the land in Phuket ismountainous. Chon Buri is a province situated on the east coast and faces the Gulf of Thailand.Within the last 20 years, two towns in Chon Buri have become a tourist area and major sea port.They include Pattaya, a premier beach resort, and Laem Chabang, the second major sea port ofThailand.
Ports
The two main international ports in Thailand are in Bangkok and Laem Chabang. While theBangkok port is solely managed by the Port Authority of Thailand (PAT), the Laem Chabangport is managed by a joint venture company named the Laem Chabang International TerminalCompany (LCIT). The Laem Chabang port is newer, more modernized, and more efficient thanthe port in Bangkok. For this reason, the service charge is more expensive there, although thereis still more traffic that flows through the Laem Chabang port (Figure 6). See Table 20 for acomparison of equipment and efficiency of the two ports. The distance between the two ports isabout 100 kilometers (National Inland Container Depot).
Both ports have expansion plans for the future. According to interviews with the PAT, theBangkok port aims to standardize their container terminal operation to an international level,while the Laem Chabang port will focus on the addition of more berths to accommodate morevessels.
To ease the traffic congestion inside the Bangkok port, an inland container depot (ICD) was builtby the State Railway of Thailand (SRT). Located in Lat Krabang on the eastern side ofBangkok, it is 38 km from the Bangkok port and 113 km from the Laem Chabang port. Althoughit serves both ports, it was originally built for the Laem Chabang port and there is a railwayconnecting Lat Krabang with Laem Chabang. There are six shipping companies that currentlyoperate at the ICD. They are as follows: Evergreen, Esco, Maersk, NICD, Hanjin, and Tiffa. Itis the responsibility of the shipping line to transport containers from the ICD to the port, or viceversa. The ICD is more commonly used for Thai exports than imports. To appeal to the shippinglines, the ICD claims to have several advantages over shipping directly to one of the ports. Theyhave one stop service for imports (customs formalities, cargo delivery), better cargo handling,availability of cargo fumigation service, and no unofficial expenses.
Business Environment
The business environment of the target country is an important factor in considering thefeasibility of implementing any commercial project. The following section discusses thisenvironment based on urbanization and westernization, macroeconomic, and banking situationsof Thailand.

40
Urbanization/Westernization
Thailand’s predominantly Buddhist population and lack of western colonization in the past hasled to the preservation of the Thai culture. The major food item consumed in Thailand is rice,which is not surprising since Thailand is the largest rice exporter in the world.
These factors have contributed to the reluctance of Thais to eat at western-style QSRs. Acommon meal for Thai people is rice, fresh meat or fish, and fresh vegetables. These items arepurchased at either wet markets or supermarkets for consumption at home. Consumption of foodoutside of the home is becoming more common among two-income families.
American QSRs, such as A&W, McDonalds, and KFC, introduced french fries to Thailand,which have become popular with teenagers. The population of southern Thailand eats lots ofpotatoes with curry, so it may be easier for them to adapt to french fries than people in otherregions of the country. Potato processors may find it easier to enter the market if they add spicesand flavors that are prevalent in Thai foods. One major QSR has expansion plans, but willprimarily focus on Bangkok and the tourists that visit Chiang Mai and other regions. ChiangMai, with a population of 1.5 million people, has only five QSRs. Table 21 outlines the numberof units this QSR intends to open, as well as the number it currently maintains in Thailand ascompared to the Philippines.
Two factors are preventing a higher demand for frozen foods in Thailand. One, Thairefrigerators are small and compact, mostly of Japanese design, and do not allow for the storageof frozen foods. Refrigerators in Thai homes are becoming more common, particularly in urbanareas, but the larger, higher quality designs are not affordable by the average Thai consumer.Two, Thai people still have the concept that frozen food is not fresh. However it is unclear ifthese are the only reasons, or if the recent financial crisis and recession that followed alsocontribute to the problem.
Macroeconomic Conditions
Thailand's economy enjoyed several "boom years" up through the mid-1990s, with real GDPgrowth exceeding eight percent in most years. However the economy suffered greatly in 1997and 1998 as a result of the Asian financial crisis. The crisis actually began in Thailand when thegovernment floated its currency, the baht, on July 2, 1997. The value of the baht subsequentlyfell by 15 percent (Coyle, McKibbin, Wang, and Lopez). Refer to Table 22 for a summary ofmacroeconomic indicators.
Economic growth in Thailand was interrupted by a severe crisis in 1997. Real GDP fell morethan 10 percent following the collapse of the value of the Thai Baht. However, in 1999 real GDPstarted to show a slight increase (four percent growth). Considering that improvement, the Thaigovernment expects the economy to grow by 4.5 to 5 percent in 2000. The recent expansion hasbeen attributed to increased domestic consumption and exports.
The exchange rate of the Thai Baht and the U.S. dollar experienced a trend similar to the GDP.The exchange rate hovered in the mid-20s from 1990 to 1996, then increased sharply in 1997 and1998. It decreased in 1999 and in the first quarter of 2000, but it is still above the level that it

41
was in 1997. The average minimum lending rate of commercial banks was in the double-digitsfrom 1990 to 1998, ranging from 10.92 percent in 1994 to 15.50 percent in 1991. However,there was a substantial drop in the lending rate in 1999 to a ten-year low of 8.79 percent. Theinflation rate showed a decreasing trend from 1990 to 1993, but this trend reversed itself as itrose from 3.3 percent in 1993 to 8.1 percent in 1998 before falling to 0.3 percent in 1999.
The macroeconomic indicators suggest that Thailand is beginning a modest recovery. Most ofthe Thai people are confident that the country has surpassed the 1998 lows, but there is concernamong them that the recovery will not be sustained. The American Embassy in Bangkok expectsmoderate growth in the Thai economy in 2001. Thai officials feel that their economy is muchbetter prepared to handle external shock than it was before the crisis (American Embassy).
Capital Markets in Thailand
The slowing of the Thai economy since the Asian economic crisis continues to place stress onthe financial sector. Concerns remain about structural problems, including crony capitalism, lackof competition, and inadequate management of problem loans (Rohwer). These features arelikely to burden the financial sector for some time, although increasing foreign competition maystimulate reforms and the basic soundness of retail and consumer sectors is encouraging.
Banks are significantly stressed by the monumental size of non-performing loans. Half the totaldebt of publicly listed companies is reportedly non-performing (Rohwer). Sources interviewedfor this research indicated that a major cause of the non-performing debt was the practice ofborrowing in dollars, prior to the 1997 devaluation. Borrowers who earned revenues in ThaiBaht could not easily repay the dollar loans after the baht declined in value. Total loan losses forthe financial system are estimated to be $40 billion, around 30 percent of Thailand’s nominalGDP (Rohwer). The banks’ policies of restructuring troubled loans has not fully corrected theproblems. Loans were re-scheduled, but not properly restructured based on realistic cash flows,thus many loans are falling back into the non-performing category (Mertens).
The financial statements of a large commercial bank (Bangkok Bank) for 1998-99 illustrate theserious difficulty for the Thai banking sector (Table 23). In contrast, Thai Farmer’s Bank andSiam Commercial Bank are considered to be strong (Mertens).
International financial service companies have entered Thailand’s capital market. GE Capitaland Goldman Sachs bought many distressed loans. It is expected that half of Thai banks willsoon be foreign owned (Rohwer).
Thai banks have adequate liquidity, but many banks are not lending (Sender). Bank officialsinterviewed for this research in June 2000 confirmed the press reports that lending was at astandstill. Companies with proven records of performance, particularly those involved inexports, felt that bank loans were readily available. However, new ventures will likely face moredifficulty obtaining credit. Larger firms are able to avoid the difficulties of obtaining commercialbank credit by issuing corporate bonds in the lower interest rate environment.
Equity capital is a potential source of liquidity and investment funds, and reportedly equity hasgrown to partly compensate for the weakness in bank credit in Asian countries (Sender).

42
National equity markets are a potential resource, but the Thai stock market has not seensignificant activity in recent months. Only one of the firms interviewed for this research was apublicly traded corporation, which suggests that national equity markets may be of limitedassistance for new projects in infrastructure related to the cold chain.
Thus the primary source of equity capital for small and medium enterprises wishing to expand inbusinesses related to the cold chain appears to be personal or family savings, or throughaffiliations with closely held enterprises. Interlocking relationships among major businesses area common characteristic in the Thai business community. While it is important to consider thepotential for equity from these important conglomerates, there is no published informationavailable on this topic.
Financial Assistance Programs
The status of the Thai financial sector suggests that investors will face credit constraints in thedomestic capital market. In addition to capital access, investors in cold chain infrastructure maybenefit from the tax advantages and credit assistance offered by the Thai and U.S. governments.The following section provides information about those programs.
The Board of Investment (BOI) is the government agency responsible for providing incentives tostimulate investment in Thailand. It is officially governed by the Investment Promotion Act.The BOI promotes only projects that strengthen Thailand’s industrial and technologicalcapabilities, make use of domestic resources, create employment opportunities, develop basicand support industries, and generate more exports.
The BOI offers two kinds of benefits to investors, tax-based incentives, such as tax holidays ortariff exemptions, and non-tax privileges, such as guarantees, protections, permissions, andservices. Tax-based incentives depend on several factors. All projects will receive certainbenefits; however, additional incentives are available for those locating in special investmentpromotion zones, producing for export, or engaging in industries identified as priority activities.The non-tax privileges are available to all BOI-promoted projects, regardless of location,industry, or condition.
BOI also offers a range of valuable business-related services. The office helps prospectiveinvestors and promoted firms in obtaining official permits and documents required forconducting business, including visas, work permits, and permanent residency permits. The BOIalso assists investors in gaining access to utilities such as water, electricity andtelecommunications. The services are free of charge.
The officers of businesses that our project team interviewed claim that the tax and non-taxincentives provided by the BOI are one of the major factors that affect their investment decision.Given the fact that Thailand is still an agricultural country, investment in agriculture andagricultural products is identified as the priority activity for BOI incentives. The applicationprocess, according to those officers interviewed, is easy and fast. BOI made a significant effortto make service more efficient and provide a one-stop service for investors. The detailedapplication process and related issues can be found in the BOI website(http://www.boi.go.th/english/boi/c2.html).

43
Conditions for the EX-IM Bank and the USDA Facility Guarantee Program in Thailand aresimilar to those in the Philippines, discussed earlier in this report.
Issues Identified in Interviews
In June 2000, forty-three interviews were conducted with business officers from a variety oforganizations, including banking, food import and processing, cold storage warehousing,shipping and government institutions. The research team visited Bangkok, Chiang Mai, ChiangRai, Mahachai and Phuket. The main issues identified were inadequate cold storage and truckingfleets in the south.
Inadequate Cold Storage in the South
According to one source, there is only one public cold storage warehouse in Bangkok and it is at100 percent capacity utilization. However, three new public cold storage facilities are beingplanned. Two of these will be in Bangkok, near the port and at Ta Lat Thai, and the third will benear Laem Chabang, in the Chonburi province. The peak season for cold storage in Bangkok isfrom November to May.
Most of the public cold storage facilities in Thailand charge on a weight basis. One charges 1baht per kilogram per month, with a minimum of one month storage time. Another charges 1.5baht per kilogram per month plus 0.2 baht per kilogram for handling services during the firstmonth. After this, the handling charge is eliminated.
Northern Thailand, near Chiang Mai, is home to many food manufacturers, processors,producers, and exporters. The businesses are oriented to exporting frozen food. All of thesecompanies have their own private cold storage warehouses, and do not feel the need for publicwarehouse space. The private warehouses in northern Thailand are very modern and employ thelatest technology. There are currently no cold storage warehouses that are available for publiclease. This presents a problem for distributors. However, since the trucking distance fromBangkok to Chiang Mai is only 10 to 12 hours, the distributors simply make deliveries once ortwice per week to each individual store. There is a possibility that they could rent space in oneof the private warehouses if necessary, but the timing and amount of space would have tocoordinate perfectly.
The cold storage situation in southern Thailand is similar to that of northern Thailand. There areno public cold storage warehouses in Phuket; only private warehouses that are not available forlease. Most vegetable growers and processors are located in the north, while the seafoodexporting industry is concentrated in the south (Phuket, Songkhla, and Samut Songkhram). Themajor markets are in Japan and Taiwan. In the past, these countries have received shipmentsfrom suppliers in the Philippines and Indonesia. However, they have recently switched tosuppliers in Thailand because of shrinking resources in the Philippines and Indonesia. Thailandalso offers competitive prices. Cold storage and reefer trucking services in the south are mainlyutilized for seafood exporting. Large fishing and seafood processing companies usually maintaintheir own cold storage warehouse and refrigerated trucking fleet. There is a new cold storage inPhuket, which is a joint venture between a local fishing company and a Taiwanese seafood

44
importer. During the off season, fishing and processing companies have excess cold storagespace available for rent to the public. Thus, the seasonal availability of private cold storage toan outside customer varies, and may not be as reliable as a public cold storage. In addition, theprivate warehouses in the south are old and outdated. Unlike northern Thailand, the truckingdistance from Bangkok to Phuket is eighteen hours and therefore more difficult to make. Sincesouthern Thailand, specifically Phuket, attracts many tourists. There is potentially higherdemand for frozen potato products and may be future demand for cold storage in this area. Onepublic cold storage warehouse that recently closed its business, reportedly because of inadequatedemand in Phuket.
All companies interviewed cited high energy costs as a major problem. In addition, blackoutsfrequently occur in Phuket, lasting for approximately two hours at a time. When this occurs, thecold storage warehouses close their doors and will not load or unload products to prevent cold airfrom escaping. However, some have generators to overcome the blackout problem. The qualityof labor is also viewed as a problem, which may be due to the high turnover rate. There is a needfor education of laborers on proper handling of frozen french fries. One person stated that thebreakage of french fries could be as high as 10 percent per box.
Lack of Refrigerated Truck Fleets
Highway conditions in Thailand are generally good, leading most persons interviewed toconclude that road infrastructure is adequate for shipment of chilled and frozen foods fromBangkok into secondary cities. High-speed, four-lane roads connect Bangkok to the Songkhlaseaport area, Chiang Mai, and Phuket. Mountainous conditions on the route to Phuket requiretrucks to reduce speeds at some points, making the route last more than 18 hours. In the areasaway from Bangkok, travel on two lane roads is slowed somewhat by local motorbike trafficwithin villages and on the outskirts of secondary cities. As an island location, delivery to Phuketis constrained by bridge access, but no serious problems with bridge capacity were noted.
During the high season, the current fleet of refrigerated trucks is fully utilized. However, duringthe mid-summer period, truck capacity utilization was reportedly only 20 to 30 percent.Trucking services for hire are easily found, but many of those interviewed did not specialize inrefrigerated cargo. Many of the trucking companies offer open trucks that are not well suited forprotecting food cargo, so the quality of trucking services was a concern. Another companyindicated that temperature control of the reefer trucks hired was insufficient at times, and led tocondensation that ruined food packages.
Local delivery is often more problematic than inter-city trucking. For example, one company inPhuket must break up 40-foot containers into four smaller loads before delivery to its privatecold storage warehouse because the road is too narrow for a 40-foot container. Within Bangkok,trucks with more than 10 wheels are banned from using inner-Bangkok roads during the peakhours of 6 a.m. to 10 a.m. and 3 p.m. to 9 p.m. on non-holiday days (“Thailand: ban imposed inBangkok on trucks”). The weight limit on highways, according to interviews with businessofficers, is 21 tons for 10 wheelers with two axles and 37.4 tons for 18 wheelers. Exportshippers in the Chiang Mai area plan for loads to depart at midnight in order to arrive in Bangkokbefore the road restrictions are enforced. Some of the businesses interviewed considered theBangkok road restrictions to be a problem, but others did not.

45
In the south, access to refrigerated trucks for local delivery was reportedly lacking. Phuket onlyhas one reefer fleet, consisting of eight reefer vans, each in the 12 to 13 ton capacity range.Other companies engaged in chilled and frozen food manufacturing or distribution owned privatefleets for local shipping.
Pilot projects were created as a result of extensive research and interviews. These projects werechosen based on the identification of the links in the cold chain infrastructure that had the mostneed for improvement and potential for growth within the region.
Proposed Projects
Compared to the Philippines, Thailand has a more developed cold chain infrastructure with fewerproblems in distribution of frozen foods from ports to secondary cities. However, with theexpected growth in the demand for refrigerated trucking in secondary cities in northern andsouthern Thailand, there is justification for considering the establishment of a refrigeratedtrucking company to help move frozen products from Bangkok to outlying cities.
Frozen/Chilled Food Transportation Market
Because Thai people prefer “fresh” food and have a deep rooted belief that “live means fresh,”frozen food is not popular in most parts of Thailand other than Bangkok and tourist cities such asChiang Mai and Phuket. There are three basic market segments that require frozen or chilledfood transportation service. The first, and most important, is the food exporting business. Thisincludes the seafood processing and exporting business in the south and the vegetable processingand exporting business in the north. Second, QSRs need to distribute raw materials from ports tosecondary cities. Third, dairy farm manufacturers and distributors need this service to movetheir products (milk and ice cream) within the country.
The market for distribution of frozen or chilled food products has been growing in recent yearsthanks to the booming food export business, which largely benefited from the depreciation oflocal currency. One of the major food exporters in northern Thailand stated that the businesswith Japanese and Taiwanese markets (two major markets for the food export business inThailand) has gone up from 426 million baht in 1995 to 960 million baht in 1999. The companyis using more than one thousand 40-foot containers per year for food export purposes
In addition to the demand on cold chain infrastructure due to exporting, the growth of QSRsinfluences the market for storage and transportation. One U.S. based QSR in Thailand isreportedly adding more than 20 new stores this year and will build more in the near future withthe recovery of Thailand’s economy. Another potential market for refrigerated trucking servicecomes from vegetable growers that need to ship products from the north to major cities withbetter selling prices.
Industry Analysis
Two kinds of refrigerated trucking services are available. The first is refrigerated containerservice. This service is mainly required by frozen/chilled food importers and exporters to

46
provide one-stop service (door to door delivery) for their products. The major players in thismarket are international shipping lines and professional container trucking companies. OneJapanese shipping line has more than 50 tractors with generator-sets to serve the needs oftransporting refrigerated containers for their export customers. Professional container truckingcompanies provide refrigerated trucking service to small food exporters and importers; they alsoaccept leasing contracts from shipping lines during the peak season (December to June forprocessed vegetable export) when demand is high.
The second kind of refrigerated distribution service is provided by refrigerated vans. This ismainly suited for domestic distribution of frozen or chilled food products in small quantities.Some QSRs, food processing companies, and vegetable growers use this kind of service todistribute their products. Large food processing companies may have their own reefer van fleetsin order to ship raw materials to processing factories upon purchase. However, most QSRs,small and medium sized food processing companies, and vegetable growers use the service ofprofessional trucking companies. Currently, no sizeable companies dominate this marketsegment.
Business and Operation
The pilot project for Thailand was to build a trucking company of reefer vans in Bangkok, andfocus on domestic frozen and chilled food distribution. The main customers would be QSRs,vegetable and seafood companies, and vegetable growers in northern Thailand. QSRs would usethe trucking service to ship raw materials from ports or capital cities to their central warehouseslocated in secondary cities such as Chiang Mai, Phuket and Songkhla where weeklyreplenishment is needed. Seafood and vegetable processing and exporting companies would usethe service to move raw materials from the source to the factory. Also, distribution serviceswould be provided to vegetable growers who need to ship products to other parts of Thailandwith higher selling prices. The key competitive edge for the company would be quality andservice, which is required especially by QSRs in the country.
Assumptions
Table 24 lists the assumptions used in the financial analysis of the proposed trucking company.Initial investment would include 20 new reefer vans each with 12-ton cargo carrying capacityand a purchase price of 1.9 million baht each. According to interviews, this is a suitable numberof vans for a professional reefer trucking company. It is recommended that the firm be a jointventure with local partners to enjoy investment incentives provided by the Thai government(BOI) and local customer sources. The set-up time for this company is estimated to be four tosix months.
According to interviews in June 2000, refrigerated trucking companies charge an average of23,000 baht for a round trip between Bangkok and Chiang Mai. During the regular businessseason, it is reasonable to assume two round trips each week between the two cities.
Operational expenses include diesel fuel, truck maintenance, truck depreciation, licenses andfees, insurance, salaries and wages, rent, and other expenses. Diesel fuel costs were derived for astochastic simulation model, as described below. Truck maintenance would not be a problem for
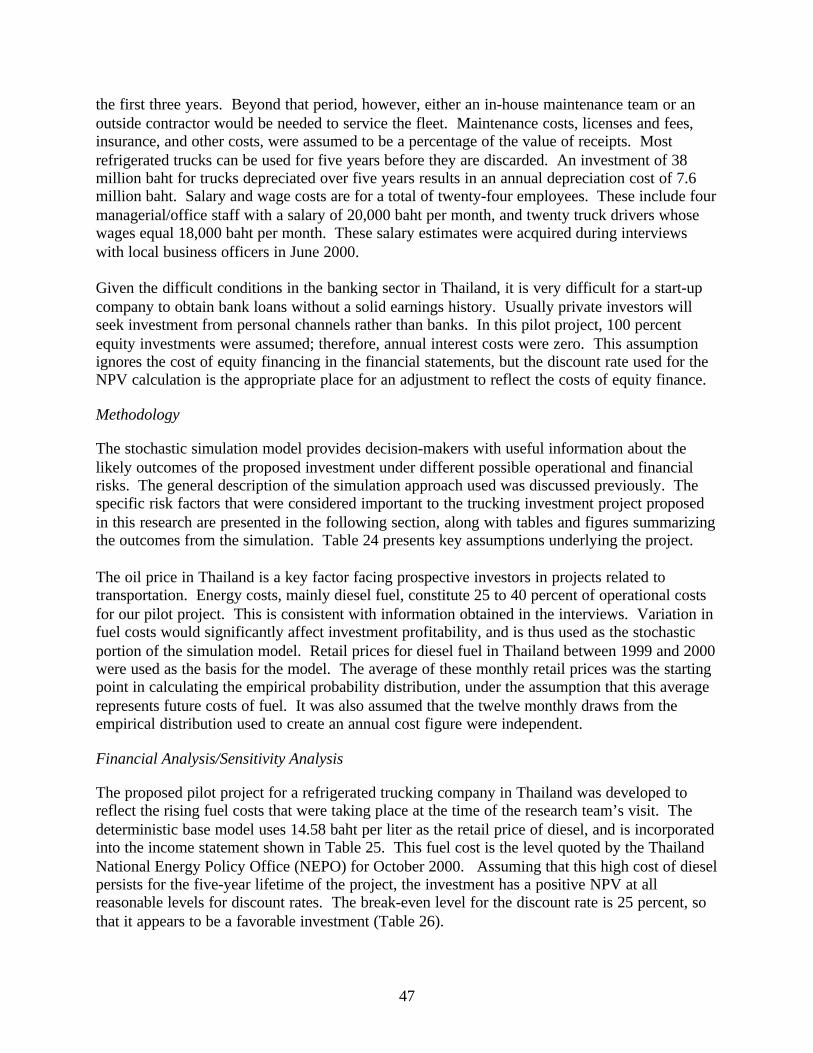
47
the first three years. Beyond that period, however, either an in-house maintenance team or anoutside contractor would be needed to service the fleet. Maintenance costs, licenses and fees,insurance, and other costs, were assumed to be a percentage of the value of receipts. Mostrefrigerated trucks can be used for five years before they are discarded. An investment of 38million baht for trucks depreciated over five years results in an annual depreciation cost of 7.6million baht. Salary and wage costs are for a total of twenty-four employees. These include fourmanagerial/office staff with a salary of 20,000 baht per month, and twenty truck drivers whosewages equal 18,000 baht per month. These salary estimates were acquired during interviewswith local business officers in June 2000.
Given the difficult conditions in the banking sector in Thailand, it is very difficult for a start-upcompany to obtain bank loans without a solid earnings history. Usually private investors willseek investment from personal channels rather than banks. In this pilot project, 100 percentequity investments were assumed; therefore, annual interest costs were zero. This assumptionignores the cost of equity financing in the financial statements, but the discount rate used for theNPV calculation is the appropriate place for an adjustment to reflect the costs of equity finance.
Methodology
The stochastic simulation model provides decision-makers with useful information about thelikely outcomes of the proposed investment under different possible operational and financialrisks. The general description of the simulation approach used was discussed previously. Thespecific risk factors that were considered important to the trucking investment project proposedin this research are presented in the following section, along with tables and figures summarizingthe outcomes from the simulation. Table 24 presents key assumptions underlying the project.
The oil price in Thailand is a key factor facing prospective investors in projects related totransportation. Energy costs, mainly diesel fuel, constitute 25 to 40 percent of operational costsfor our pilot project. This is consistent with information obtained in the interviews. Variation infuel costs would significantly affect investment profitability, and is thus used as the stochasticportion of the simulation model. Retail prices for diesel fuel in Thailand between 1999 and 2000were used as the basis for the model. The average of these monthly retail prices was the startingpoint in calculating the empirical probability distribution, under the assumption that this averagerepresents future costs of fuel. It was also assumed that the twelve monthly draws from theempirical distribution used to create an annual cost figure were independent.
Financial Analysis/Sensitivity Analysis
The proposed pilot project for a refrigerated trucking company in Thailand was developed toreflect the rising fuel costs that were taking place at the time of the research team’s visit. Thedeterministic base model uses 14.58 baht per liter as the retail price of diesel, and is incorporatedinto the income statement shown in Table 25. This fuel cost is the level quoted by the ThailandNational Energy Policy Office (NEPO) for October 2000. Assuming that this high cost of dieselpersists for the five-year lifetime of the project, the investment has a positive NPV at allreasonable levels for discount rates. The break-even level for the discount rate is 25 percent, sothat it appears to be a favorable investment (Table 26).

48
The interviews conducted by the research team with representatives of the trucking industry inThailand indicated that periodic variation in fuel costs are a major uncertainty affecting theirbusiness. Therefore, to supplement the baseline deterministic model, a stochastic simulation offuel expenses was conducted. Using the Thailand NEPO data from the 18 month period July1999 to October 2000, an empirical distribution function was generated. The range on theempirical distribution input was 8.7 baht per liter to 14.58 baht per liter. When simulated with100 random iterations, the input random variable for fuel cost has an expected value of 11.46baht per liter (Figure 7).
The simulation of annual net income mirrors the pattern of the diesel price, as would be expectedgiven the importance of fuel costs in the income statement (Table 27). The cumulativedistribution function has an unusual linear shape (Figure 8). This is because the distribution isnot unimodal and has negative skewness. In fact, there are three peaks in the frequency chartbetween 10 and 12 baht per liter price. Thus it is reasonable to expect a lower cost of fuel if thepast patterns of fuel markets were to continue in the future. The expected net income is justunder 10 million baht with a standard deviation of 612,000 baht (Table 28). This indicates thatin any year, it is quite likely to find net income within the range of 1.2 million above or belowthe 9.9 million baht average. It is interesting to note that there is almost no chance of an annualloss, based on this simulation.
The simulation of NPV also indicates strongly positive outcomes for the project (Figure 9).There is almost no chance of an outcome with NPV less than 8.7 million baht. The average ofthe simulated values for NPV is nearly 12 million baht, using a 15 percent discount rate and afive year project life (Table 29).
Conclusions
Food processing and export businesses, just as other export business in Thailand, are boominglargely because of the currency depreciation after the financial crisis, beginning in 1997. As thenational economic recovery stage is achieved, it is possible that the baht will again be strong,creating fewer opportunities for competitive advantage. This will certainly affect the foodprocessing and exporting business, and could result in lower usage of refrigerated truckingservices. In this case, revenue would decline.
Another factor that affects the return on investment is the rising price of oil. According to theindustry, 20 to 40 percent of the total operational cost comes from gasoline or diesel fuel. Truckoperators are planning to raise the cargo transport rates by 10 percent due to soaring gas prices,in order to remain profitable (“Thailand: truck operators to increase charges”). Finding a way toabsorb this increasing operational cost will be a challenge to management and could change theinvestment’s expected NPV. Results indicate that the project is an attractive investment, evenwith high oil costs. And, it is possible that oil prices will decline over the life of the project, thusreducing operational expenses from those currently in effect.
Compared with the Philippines, the market demand for frozen french fries is not as strong inThailand. However there are many industries besides the frozen french fry industry that demandrefrigerated trucking services. The business can have a diversified customer base, if needed, toreduce demand variability.

49
Given the market demand for trucking services, current competitiveness in the industry,operational and financial risks, and profitability of the proposed pilot project, the research teambelieves it is commercially viable.
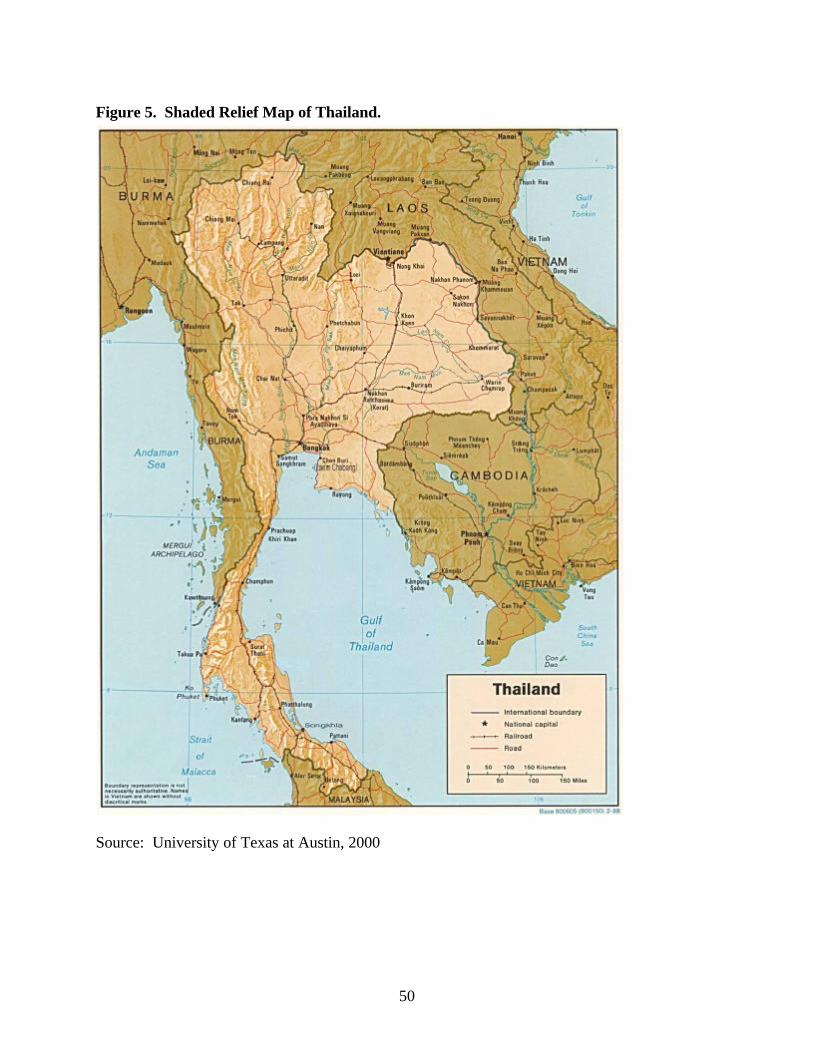
50
Figure 5. Shaded Relief Map of Thailand.
Source: University of Texas at Austin, 2000

51
Figure 6. Volume of Traffic Handled in Bangkok Port and Laem Chabang Port.
0
500000
1000000
1500000
2000000
2500000
3000000
3500000
1993 1994 1995 1996 1997 1998 1999 Apr-00
Year
Vol
ume
(TE
U)*
Laem Chabang Port
Bangkok Port
Total
*TEU = ton equivalent unitsSource: Laem Chabang International Terminal Co., Ltd., 2000.
Figure 7. Cumulative Distribution Function for Trucking Diesel Price.
0
0.1
0.2
0.3
0.4
0.5
0.6
0.7
0.8
0.9
1
87.1
91.4
95.8
100.
2
104.
6
109.
1
113.
5
117.
9
122.
3
126.
7
131.
1
135.
5
139.
9
144.
3
Baht (values in 10^-1)
Prob
of V
alue
<=
X-a
xis
Val
ue

52
Figure 8. Cumulative Distribution for Trucking Net Income.
Figure 9. Cumulative Distribution Function for Trucking NPV.
0
0.1
0.2
0.3
0.4
0.5
0.6
0.7
0.8
0.9
187
49
8905
9067
9230
9392
9554
9716
9878
1004
0
1020
2
1036
4
1052
6
1068
9
1085
1
Baht (values in thousands)
Prob
of V
alue
<=
X-a
xis
Val
ue
0
0.1
0.2
0.3
0.4
0.5
0.6
0.7
0.8
0.9
1
8675
9122
9585
1004
8
1051
1
1097
4
1143
6
1189
9
1236
2
1282
5
1328
8
1375
1
1421
3
1467
6
Baht (values in thousands)
Prob
of V
alue
<=
X-a
xis
Val
ue

53
Table 19. Major Cities/Provinces in Thailand, 2000, Population and Distance fromBangkok.City/Province Population Males Females Distance from BangkokBangkok 5,695,999 2,774,652 2,921,347Ayutthaya 733,378 357,293 376,085 76 km NChiang Mai 1,590,774 788,475 802,299 700 km NSongkhla 1,227,974 605,819 622,155 950 km SPhuket 246,470 120,798 125,672 867 km SKorat 2,547,535 1,264,805 1,282,730 259 km NEChon Buri 1,064,402 535,128 529,274 147 km EKhon Kaen 1,743,651 869,710 873,941 449 km NESource: Thailand Ministry of the Interior, 2000.
Table 20. Comparison of Main Thailand Port Facilities.Bangkok port Laem Chabang port
Rail mounted shoreside container crane (Unit) 14 15Yard gantry crane 36 34Reefer plug 660 277Tractor for trailer 150 110ISO 9002 adoption N/A YesContainer handling efficiency 20 containers/hour 25 containers/hour
IT system EDSEDS, SPARCS, TRD,
expert system.
Source: Port Authority of Thailand, 2000.
Table 21. Comparison of Major QSRs in Thailand Versus the Philippines, 2000.Philippines Thailand
Current local store number of U.S.-based QSRs 200 plus 89Number of new stores of U.S.-based QSRs to beopened next year About 40 20
Current store number of one local QSR 350 N/A
Source: Company interviews, 2000.

54
Table 22. Thailand Macroeconomic Indicators, 1990-2000.
YearNominal
GDP1
Real GDP1988
prices1Per capita
GDP2Exchange
rate3
Averagemin.
loan rate4Inflation
rate5
Billionbaht
Billionbaht Baht
Avgbaht/USD % %
1990 2,183.5 1,945.4 39,104 25.61 14.65 5.91991 2,506.6 2,111.9 44,307 25.53 15.50 5.71992 2,830.9 2,282.6 49,410 25.42 12.18 4.11993 3,170.3 2,473.9 54,650 25.33 11.18 3.31994 3,634.5 2,695.4 61,903 25.16 10.92 5.21995 4,185.6 2,935.3 70,464 24.93 13.43 5.81996 4,608.5 3,109.3 76,804 25.36 13.69 5.91997 4,727.0 3,057.0 76,991 31.07 13.07 5.61998 4,636.0 2,746.0 69,093 41.32 15.07 8.11999 4,688.0 2,860.0 75,608 37.88 8.79 0.32000* 5,035.0 2,989.0 83,916 42 (Sept) 8.00 3.0
*ProjectedSource: 1 Thailand National Economic and Social Development Board (NESDB), 2000.2 Asian Development Bank (ADB), 2000.3 Federal Reserve Bank of St. Louis, 2000.4 Bank of Thailand (a), 2000.5 Bank of Thailand (b), 2000.

55
Table 23. Bangkok Bank Financial Statements for the Year Ended, Dec. 31.
1999 1998Percentage
changeConsolidated financial performance (thousand baht)Assets 1,181,685,366 1,271,273,525 -7.0Loans and advances (net of provision forpossible loan losses )1 758,570,907 855,396,100 -11.3Deposits1 961,458,893 975,037,935 -1.4Liabilities 1,136,412,385 1,170,105,798 -2.9Shareholders’ equity – net 45,282,980 101,167,727 -55.2Interest and dividend income 65,621,185 113,570,422 -42.2Total income 92,360,022 133,781,570 -31.0Profit (loss) before tax2 (59,828,246) (49,862,924) + 20.0Net profit (loss)3 (59,829,094) (49,863,017) + 20.0
Per share (baht)Profit (loss) before tax2 (40.80) (37.92) + 7.6Income tax - - -Net profit (loss)3 (40.80) (37.92) + 7.6Dividends paid - - -Par value 10.00 10.00 -Book value 30.87 68.99 - 55.3Share prices - range 89.50 – 37.75 108.00 – 19.25 - -year end 61.00 52.00 + 17.3
Financial ratio (%)Rate of return on average assets (4.88) (3.71) - 1.17Rate of return on average equity (81.71) (48.65) - 33.06Net profit (loss) to total income (64.78) (37.27) - 27.51Capital to risk assets 11.64 13.42 - 1.78
Remarks:1 Not including interbank and money market items2 Including minority interests3 Not including minority interests
Source: Bangkok Bank, 1999.

56
Table 24. Assumptions for Trucking Project Income Statement.Item UnitNumber of trucks 20Purchase price of trucks 1,900,000 bahtTotal cost of trucks 38,000,000 bahtDelivery charge 23,000 bahtTax rate 35 percentYears to depreciate 5Liters of fuel consumed per week 589.04Price per liter (Stochastic) 11.46 baht per literPrice per liter (deterministic) 14.86 baht per literWeeks per year 48

57
Table 25. Income statement for deterministic trucking modelExpected values in baht per year
Receipts1 44,160,000
Operation CostEnergy 2 8,244,724Maintenance3 3,800,000Truck Depreciation4 7,600,000Licenses & Fees5 380,000Insurance6 1,900,000Salaries and Wages7 5,280,000Rent (Office & Parking Lot)8 2,400,000Other 9 441,600
Total Operation Cost 30,046,324Other Cost
SG&A( Office) 662,400Interest -
Total Cost 30,708,724Income Before Tax 13,451,276Tax 4,707,947Net Income 8,743,330
Depreciation 7,600,000Net Operating Cash Flows 16,343,330
1 Assume one truck can make two round trips from Bangkok to Chiang Mai per week at acharge of 23,000 baht/trip
2 700 km * 2/3.33(km/liter)* baht/Li * 48 weeks/year * 20 trucks3 Assume 10% of truck value each year4 Depreciate over 5 years5 Assume one percent of truck value6 Assume five percent of truck value7 Assume 4 office staff each @20,000 baht per month and 20 drivers each @ 18,000 baht
per month8 Assume 2,400,000 per year9 One percent of Revenue

58
Table 26. Cash Flows and NPV for Deterministic Trucking Model,Assuming Various Discount Rates.
Cash FlowsDiscount rate
15%Discount rate
25%Discount rate
35%--------------------------- baht -----------------------------
Year 0 (38,000,000) (38,000,000) (38,000,000)Year 1 14,211,591 13,074,664 12,106,170Year 2 12,357,905 10,459,731 8,967,533Year 3 10,746,004 8,367,785 6,642,617Year 4 9,344,352 6,694,228 4,920,457
NPV 8,659,852 596,407 (5,363,222)
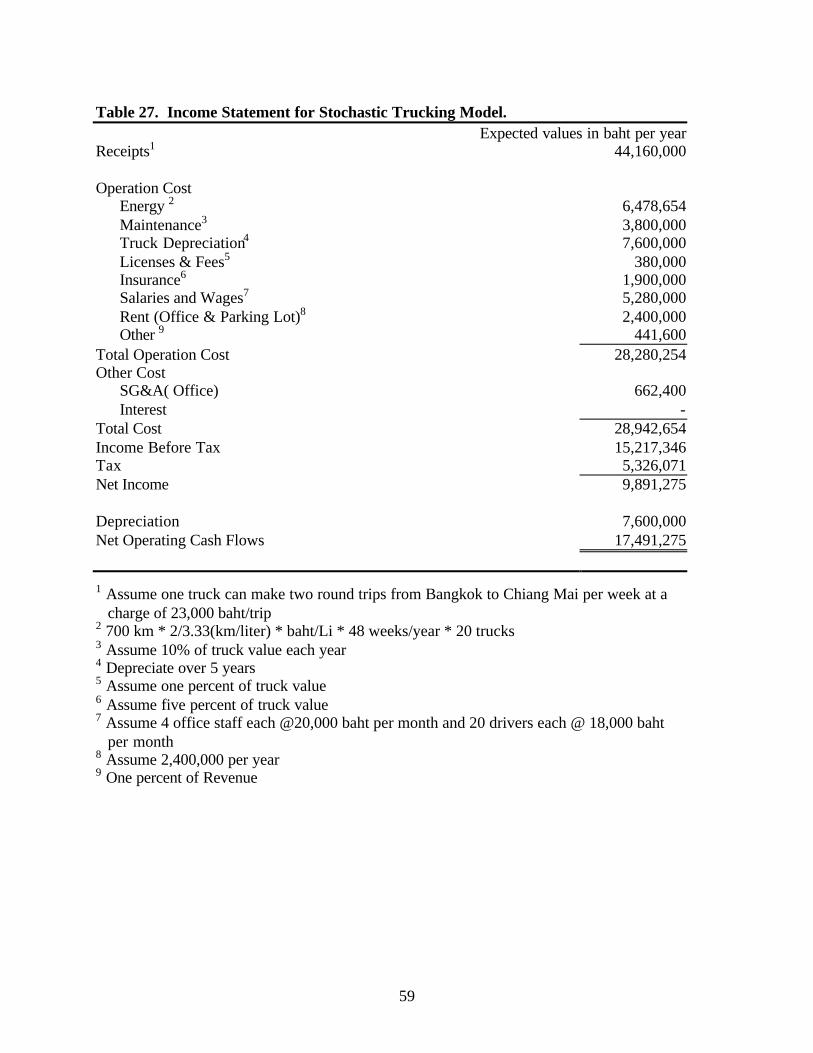
59
Table 27. Income Statement for Stochastic Trucking Model.Expected values in baht per year
Receipts1 44,160,000
Operation CostEnergy 2 6,478,654Maintenance3 3,800,000Truck Depreciation4 7,600,000Licenses & Fees5 380,000Insurance6 1,900,000Salaries and Wages7 5,280,000Rent (Office & Parking Lot)8 2,400,000Other 9 441,600
Total Operation Cost 28,280,254Other Cost
SG&A( Office) 662,400Interest -
Total Cost 28,942,654Income Before Tax 15,217,346Tax 5,326,071Net Income 9,891,275
Depreciation 7,600,000Net Operating Cash Flows 17,491,275
1 Assume one truck can make two round trips from Bangkok to Chiang Mai per week at acharge of 23,000 baht/trip
2 700 km * 2/3.33(km/liter) * baht/Li * 48 weeks/year * 20 trucks3 Assume 10% of truck value each year4 Depreciate over 5 years5 Assume one percent of truck value6 Assume five percent of truck value7 Assume 4 office staff each @20,000 baht per month and 20 drivers each @ 18,000 baht
per month8 Assume 2,400,000 per year9 One percent of Revenue
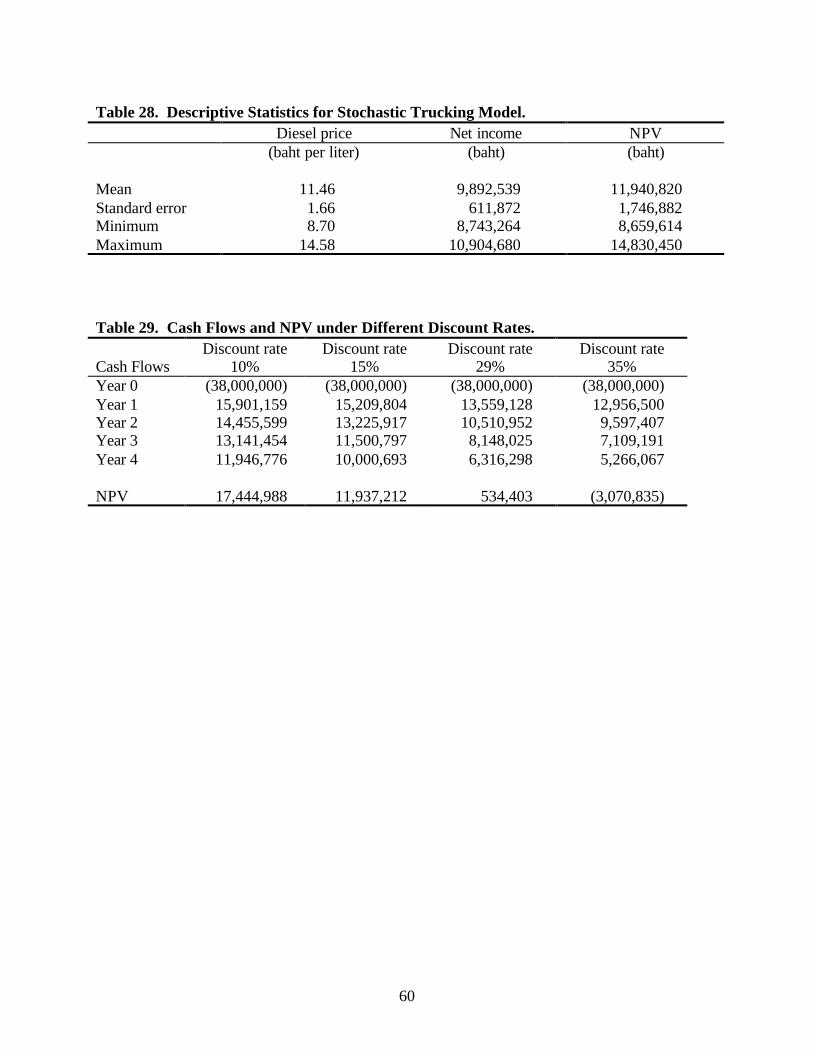
60
Table 28. Descriptive Statistics for Stochastic Trucking Model.Diesel price Net income NPV
(baht per liter) (baht) (baht)
Mean 11.46 9,892,539 11,940,820Standard error 1.66 611,872 1,746,882Minimum 8.70 8,743,264 8,659,614Maximum 14.58 10,904,680 14,830,450
Table 29. Cash Flows and NPV under Different Discount Rates.
Cash FlowsDiscount rate
10%Discount rate
15%Discount rate
29%Discount rate
35%Year 0 (38,000,000) (38,000,000) (38,000,000) (38,000,000)Year 1 15,901,159 15,209,804 13,559,128 12,956,500Year 2 14,455,599 13,225,917 10,510,952 9,597,407Year 3 13,141,454 11,500,797 8,148,025 7,109,191Year 4 11,946,776 10,000,693 6,316,298 5,266,067
NPV 17,444,988 11,937,212 534,403 (3,070,835)

61
Vietnam
Today, Vietnam is promoting tourism and striving to improve foreign trade relations. The year2000 is being called the “Year of Tourism” in Vietnam, and the country is actively seekingmembership in the World Trade Organization (WTO). This opening toward trade, and recentnegotiations to improving trade relations with the U.S., suggests that the long-run marketpotential of Vietnam should be re-examined. For this reason, Vietnam was considered as anexploratory market in this research.
The following sections outline the geographic environment and the current business environmentof the country. This information should serve as a basis for future research into the feasibility ofcommercial investment in the region.
Geographic Environment
Vietnam borders Cambodia, Laos, and China, as well as the Gulf of Thailand, the Gulf ofTonkin, and the South China Sea (Figure 10). The total land area is 325,360 square kilometers,with 3,444 kilometers of coastline (excluding islands). The terrain is mainly low, flat delta in thenorth and south, with mountainous areas in the far north and northwest, and an area of highlandsin the central region. Vietnam has two distinct climatic areas. The south is characterized by ayear-round warm, tropical climate. However, the north is characterized by a more monsoonalclimate. In this region, the rainy season extends from mid-May to mid-September and the dryseason from mid-October to mid-March (CIA).
As of July 2000, the estimated population was 73,773,873, of whom 33 percent were betweenthe ages of 0 and 14 years, 62 percent were between the ages of 15 and 64 years, and only fivepercent were over the age of 65. The official language is Vietnamese; however, Chinese,Russian, English, French, Khmer, and other tribal languages are spoken. Buddhism is the mainreligion, but there are some substantial groups of Taoist, Confucian, Hoa Hao, Caodaists,Muslim and Christians (CIA).
Major Cities
Vietnam is composed of 54 provinces with four central cities, Hanoi, Ho Chi Minh City, HaiPhong, and Danang.
The capital, Hanoi, covers an area of 913 square kilometers, with a population of 3,300,000. It islocated in the plains of north Vietnam, where there are a number of rivers that flow eastwards tothe sea. This makes it the main transport area for all of the other northern provinces. The city iscomposed of seven inner districts and five suburban districts. The Hoan Kiem district is thetrade, cultural and administrative center. It houses the Central Bank and other important stateoffices. Trade and administrative zones characterize the Hai Ba Trung district. The Dong Dadistrict includes many living quarters, colleges, hospitals and factories built throughout the 1960sand 1970s. The more suburban districts were once agricultural areas; however, new factory,industrial, and export zones are being established there (Vietnam Embassy). Even with the sizeof this city, there are currently no quick service restaurants (QSR) in Hanoi.

62
Ho Chi Minh City (formerly Saigon) is located on the Saigon River, in the southeastern part ofsouth Vietnam, 1725 kilometers south of Hanoi. It covers an area of 2,029 square kilometers,with a coastline of 12 kilometers, and a population of 3, 934,000. The city is of great importanceto the south. It is home to a major port, the terminal station for the trans-Vietnam railway, andthe largest airport in Vietnam (within seven km of the city). Furthermore, the city has highwaysrunning to all of the southern provinces (Vietnam Embassy). Unlike Hanoi, Ho Chi Minh Cityhas an initial development of western-style QSRs. There are currently about 10 QSRs located inthe city, which constitutes the total number of QSRs in the country.
Hai Phong covers an area of 1,503 square kilometers, with a population of 1,448,000. The city islocated 102 kilometers east of Hanoi, on the Cam River, and is one of the major internationalseaports of the north. Hai Phong is also an industrial center of the north. This area has becomepart of the movement to renovate and upgrade Vietnam’s aging infrastructure. Furthermore, thecity is becoming a major tourist attraction thanks to nearby Ha Long Bay (Vietnam Embassy).
Danang covers an area of 942.46 square kilometers, with a population of 663,115. It is theindustrial center of the central region, and deals mainly in the export of frozen seafood.
Some other smaller cities are developing as tourist centers. While these cities were not visitedby researchers for this project, sources in Ho Chi Minh City indicate that some restaurants utilizefrozen french fries.
Ports
There are seven major seaports in Vietnam. Ho Chi Minh City has relatively modern containerfacilities and serves most of the south. Also, Vung Tau port was identified in interviews as amajor source entry point for imported frozen french fries. The port that serves Hanoi and mostof the north is located in Hai Phong. However, to alleviate some of the problems encounteredthere, the government is establishing an alternative port at Cai Lan Bay. The port at Danang, onthe Song Han River serves the central region of the country; however, the facilities there are notparticularly modern (Vietnam Ministry of Foreign Affairs).
Business Environment
The major challenges to business operations relate to the lack of overall economic developmentand governmental constraints on business practices. Food importers interviewed for thisresearch discussed permitting problems, taxation and fees charged by multiple governmentalunits, and various other uncertainties. Western-style foods and frozen foods in general are notfrequent parts of the typical Vietnamese diet. In addition, infrastructure development is at a lowlevel. Many roads in the Ho Chi Minh City vicinity are unpaved.
Urbanization/Westernization
The history of conflict, war and lack of investment have left the infrastructure of Vietnam in asomewhat run-down state; however, this is beginning to change. The country is offeringincentives to foreign investors and taking advantage of some international aid packages.

63
Unfortunately, difficult economic conditions in recent years have prevented the country frommaking some of the much-needed major improvements (Vietnam Embassy).
Only about 15 percent of Vietnam’s 105,000 kilometers of roadway is paved, and most of theseare narrow and in poor condition. Generally, the roads in the north are in a more deterioratedstate than those in the south. However, some of the major highways are being repaired withmoney from international aid programs. These include Highway 1, which connects Hanoi andHo Chi Minh City, and Highway 5, which connects Hanoi and Hai Phong. The country’srailways are also in desperate need of improvements (Vietnam Embassy). According toinformation gathered in interviews during June 2000, the infrastructure has improved greatlyover the past few years.
Beyond the physical state of the roadways, the traffic can be a major problem. There has been anincrease in the number of vehicles on the roads. Furthermore, heavy use of bicycles andespecially motorcycles adds to the problem of congestion.
Macroeconomic Conditions
Vietnam has seen difficult economic conditions since 1997, brought on by the Asian economiccrisis. The GDP growth fell continuously from 9.3 percent in 1996 to 8.15 percent in 1997, 5.83percent in 1998, and 4.85 percent in 1999. Also, Foreign Direct Investments (FDI) have beendown. This is an important factor in the economic conditions of the country, in that FDIaccounted for 10 percent of the GDP and 21 percent of exports, as well as 300,000 jobs(Vietnam Ministry of Foreign Affairs).
Vietnam, along with other Asian countries, has however seen some relief from the crisis of thepast few years. As of 1999, the GDP rose five percent, and the GDP per capita purchasingpower parity was estimated to be $1,850 (CIA). Furthermore, the amount of officialdevelopment assistance has increased over the past few years, with a total committed capitalfrom donors of $15.14 billion (Vietnam Ministry of Foreign Affairs). Also, the unemploymentrate and number of people below the poverty line has shown a decline.
In order to further growth and prosperity in the country, the Vietnamese Government hasapproved the socio-economic orientations and tasks for the year 2000. In general, the tasksinclude speeding economic growth and promoting a competitive economy, improving theeffectiveness of foreign economic relations, developing technological resources, and ensuringsocial and political stability. Completion of these tasks should lead Vietnam to the goal ofbecoming an industrial country by the year 2020 (Vietnam Ministry of Foreign Affairs).
After five years of talks, the U.S. and Vietnam signed a trade pact on July 13, 2000. However,Congress must now approve the agreement before any trading rights will be granted. This isexpected to happen, but not during the Clinton Administration. The agreement would grantnormal trade relations, similar to those with other foreign countries. If approved, tariffs wouldlikely drop from an average of 40 percent to three percent. The main Vietnamese imports thatwill be affected are textiles, shoes, and electronics. On the other hand, Americans would haveaccess to telecommunications, financial services, retail and distribution markets in Vietnam

64
(Kahn). The signing of this pact is also expected to create momentum for Vietnam’s bid to jointhe WTO.
Issues Identified in Interviews
According to interviews conducted in July 2000, there are both positive and negative factorsaffecting investment in the cold chain infrastructure of Vietnam. The willingness of banks tolend investment capital, constantly changing tax rates, and the high costs of tariffs on U.S. goodsare major concerns. Also, the condition of infrastructure, availability of refrigerated trucks andstorage, and the actual demand for frozen potato products must be considered.
Doing business in Vietnam can be extremely complicated. Borrowing investment capital isdifficult and time consuming. Banks tend to be uncooperative and generally make loans againstcollateral property as opposed to issuing letters of credit. Furthermore, tax rates are constantlychanging, and are much higher for joint ventures than corporations. According to interviews,some 80 percent of these joint ventures have failed. Also, customs duties on U.S. goods arecurrently quite high, generally 50 percent. However, on pre-cooked food items, the tariffs are ashigh as 75 percent. Furthermore, changes in taxes and tariffs are generally not formalized andcan occur at any time. These changes can be quite difficult to follow, and the use of anexperienced Vietnamese staff may be the only way to handle constantly changing laws andregulations.
In general, the infrastructure throughout Vietnam is somewhat deteriorated. However, therehave been many improvements on the major route connecting northern provinces to Ho ChiMinh City, Highway 1. There are an abundance of refrigerated trucks in Vietnam due toshipments of dairy, fruits, and vegetables within the country. However, obtaining new trucks canbe extremely expensive. There is a 200 percent tax on imported used trucks, and a 100 percenttax on imported truck parts to be assembled in the country. Furthermore, interviews indicatedthat there is sufficient space available in cold storage facilities in Ho Chi Minh City. One of themost state of the art facilities is located in the industrial park 20 kilometers from town.However, there is some concern that the location may not be convenient for food processing orimporting companies located nearer the central city.
There is a growing demand for frozen potatoes in the country, although total imports remainquite low. The volume of shipments is increasing monthly, and by next year, it is projected thattwo to three containers per year of frozen french fries will be needed to meet the demand. Mostof this demand comes from the quick service restaurants in Ho Chi Minh City, hypermarkets(super grocery stores) in major cities, and some vacation resorts.
Operating a business in Vietnam can be difficult; however, infrastructure improvements andincreasing demand for frozen potato products makes investing increasingly more feasible.Furthermore, the possibility of normalized trade relations between Vietnam and the U.S. couldhelp to lower customs duties and thereby the cost of investing in the cold chain infrastructurewithin the country.

65
Figure 10. Shaded relief map of Vietnam.
Source: University of Texas at Austin, 2000.

66
References
American Embassy. Thailand economic trends and outlook. Economic Section.Bangkok, Thailand. June 2000.
Annual survey of establishments. National Statistics Office, Republic of the Philippines,1996-1997.
Ashley, Gregory A., and James E. Epperson. "An analysis of potential internationalmarket penetration of U.S. vegetables: foreign importers perspective." Universityof Georgia Research Bulletin, June 1989, Vol. 380, 1-34.
Asian Development Bank. http://www.adb.org/Statistics/thaki00.pdf DownloadedFebruary 4, 2000.
Bangkok Bank. Annual Report 1999.
Bank of Thailand (a)http://bot.or.th/bothomepage/databank/Financial_Institutions/Key_finance/Mont-19c.htmDownloaded February 3, 2000.
Bank of Thailand (b) http://bot.or.th Downloaded February 2, 2000.
Bank of Thailand. Economic Research Department.http://www.bot.or.th/research/public/DataBank/Databank.htm 1990-1996 DownloadedAugust 29, 2000.
Bautista, Dennis. National Economic Development Authority. E-mail received July 25and 27, 2000.
Beasley, Steve. "The current state of the cold chain in the Philippines." United StatesDepartment of Agriculture, Trade and Investment Program of Food Industries Division,Foreign Ag Service. November 1998.
Beasley, Steve. "The current state of the cold chain in Thailand." United StatesDepartment of Agriculture, Trade and Investment Program of Food Industries Division,Foreign Ag Service. November 1998.
Booth, Jason and Jon Hilsenrath. “Markets in Indonesia, Thailand, Philippines are so lowclimbing up could be difficult.” Wall Street Journal, August 8, 2000, C-12.
Buenaventura, Rafael. “The 1999 guide to the Philippines.” Euromoney, September1999.
CIA, World Fact Book 2000. http://www.odci.gov/cia/publications/factbook/index.htmlDownloaded September 29, 2000.

67
Caron, James, Charles Alexander, Joy Canono, and H. Reichert. "Shipping containerizedU.S. agricultural products to the Philippines." United States Department of Agriculture,Ag Marketing Service. July 15, 1999.
Caron, James, Charles Alexander, Joy Canono, and Heidi Reichert. "Shippingcontainerized U.S. agricultural products to Thailand." United States Department ofAgriculture, Ag Marketing Service. July 15, 1999.
City of Bacolod, Philippines. http://www.geocities.com/TheTropics/Island/1479/Downloaded August 9, 2000.
Cochico, Willie. McDonalds Philippines, Purchasing Director. Personal communication,August 2000.
Corporate Information.http://profiles.wisi.com/profiles/scripts/page3.asp?cusip=C60881150&curconv=608Downloaded December 8, 2000.
Coyle, William T., Warwick J. McKibbin, Zhi Wang, and Michael Lopez. "The Asianfinancial crisis: impact on U.S. agriculture." Choices. 1998: Fourth quarter, 28-33.
Crilley, Patrick, EX-IM Bank, Director of Houston Regional Office, Personal interview, March2000.
Danang tourism. http://www.vnn.vn/province/danang/tourism Downloaded October 19,2000.
De Villa, Jill Gale. Philippines guide: be a traveler – not a tourist! Cold Harbor Springs,NY: Open Road Publishing, 1997.
Ex-Im Bank. http://www.exim.gov/mover.html Downloaded March 22, 2000.
Federal Reserve Bank of St. Louis. http://www.stls.frb.org/fred/data/exchange/exthusDownloaded February 16, 2000.
Federal Reserve Board http://www.stls.frb.org/fred/data/exchange/exthus DownloadedMarch 16, 2000.
Garsuta, Rebecca. "Basic study of urban goods movement in Metro Manila: anassessment of physical distribution facilities and commodity flow pattern." M.S. Thesis,University of the Philippines, March 1995.
Go, James. Sulpicio Lines, Inc. Fax received August 9, 2000.
Kahn, Joseph. “U.S. and Vietnam are said to agree on normal trade.” The New YorkTimes. July 13, 2000.

68
Laem Chabang International Terminal Co., Ltd. LCIT brochure. Received in interview.July 2000.
Lanclos, D. Kent, Stephen Devadoss, and Joseph Guenthner. "Impacts of foreign directinvestment and advertising on the export demand for U.S. frozen potatoes." Agribusiness,1997, Vol. 13, No. 3, 273-284.
Mertens, Brian. “It’s all up from here…” Asian Business. December 1999, Vol. 35, No.12, 33-35.
National Inland Container Depot. NICD brochure. Received in interview July 2000.
Palisade Corporation. @ Risk: Advanced risk analysis for spreadsheets. Windows Version.Newfield, NY:Palisade Corporation, July 1997.
Philippine National Bank. 1999 Annual Report.
Philippine Port Authority. http://www.ppa.gov.ph/Statistics/download.htm DownloadedAugust 28, 2000.
Philippine Star. “New GBA means more security for deposits.” May 26, 2000, B-1.
Philippines Consular Information Sheet. http://travel.state.gov/philippines.htmDownloaded January 26, 2000.
Philippines Department of Tourism. http://www.tourism.gov.ph/ Downloaded August 9,2000.
Philippines National Economic and Development Authority. Economic Indicators Online.http://www.neda.gov.ph/~ioneda/national.html Downloaded August 22, 2000.
Philippines National Statistics Office. Sectoral Statistics.http://www.census.gov.ph/data/sectordata/poproj09.txt Downloaded September 6, 2000.
Port Authority of Thailand. PAT brochure. Received in interview. July 2000.
Rasmussen, Mark. “Better infrastructure, bigger sales: The Facility Guarantee Program.”http://www.fas.usda.gov/info/agexporter/1998/facility.htm Downloaded February 21,2000.
Rellosa, Dindo. HAVI Food Services Philippines, Inc, Operations Director. Personalcommunication. May 2000.
Richardson, James W. Simulation: A tool for decision making under risk. Texas A&MUniversity, Department of Agricultural Economics. March 2000.

69
Richardson, James W. and Harry P. Mapp, Jr. “Use of probabilistic cash flows in analyzinginvestments under conditions of risk and uncertainty.” Southern Journal of AgriculturalEconomics. December 1976, p. 19-24.
Road handbook in the Philippines ‘98. Department of Public Works and Highways,Republic of the Philippines, 1998.
Rohwer, Jim. “Asia’s economy: a precarious balancing act,” Fortune. June 26, 2000,211-218.
Royal Thai Government. “A guide to the Board of Investment.” Office of the board ofInvestment. Office of the Prime Minister. September 1998.
Sender, Henny. “A false dawn.” Far Eastern Economic Review, July 2000, Vol. 163,No. 30, 52-56.
Setyawati, Indah and William Ruscoe. "Fresh fruit distribution infrastructuredevelopment program for eastern Indonesia." Proposal and third quarterly report.Winrock International Kupang. November 1998.
“Thailand: ban imposed in Bangkok on trucks.” Nation, June 15, 2000, 2.
Thailand Board of Investment http://www.boi.go.th Downloaded March 28, 2000.
Thailand Ministry of Interior. Department of Local Administration. http://www.dola.go.th/Downloaded August 4, 2000.
Thailand National Economic & Social Development Board.http://nesdb.go.th/Main_menu/Macro/gdp_data/mainaccount.htmDownloaded February 9, 2000.
Thailand National Energy Policy Office. “Retail price of petroleum products in Bangkok.”November 16, 2000. http://www.nepo.go.th/info/T15.html Downloaded December 19,2000.
“Thailand: truck operators to increase charges.” Nation, January 6, 2000, 3.
Tourism Authority of Thailand. http://www.tat.or.th/province/ Downloaded August 9,2000.
U.S.-ASEAN Business Council, Inc. (a)http://www.us-asean.org/Thailand/Thailand_economic_data.htmDownloaded August 8, 2000.

70
U.S.-ASEAN Business Council, Inc. (b) "U.S., Philippines private sector leaders presentbusiness priorities to President Estrada." July 27, 2000.http://www.us-asean.org/Press_Releases/philippine_committee_meeting.htmDownloaded August 8, 2000.
United States Department of Agriculture http://www.fas.usda.gov/excredits/facility.htmlDownloaded April 12, 2000.
University of Texas at Austin. PCL Map Collection. World atlas and maps: shadedrelief map of the Philippines. http://geography.about.com/science/geography/library/mapsDownloaded September 29, 2000.
University of Texas at Austin. PCL Map Collection. World atlas and maps: shadedrelief map of Thailand. http://geography.about.com/science/geography/library/mapsDownloaded September 29, 2000.
University of Texas at Austin. PCL Map Collection. World atlas and maps: shadedrelief map of Vietnam. http://geography.about.com/science/geography/library/mapsDownloaded September 29, 2000.
Vietnam Embassy. http://www.vietnamembassy-usa.org Downloaded October 19, 2000.
Vietnam Ministry of Foreign Affairs. http://www.mofa.gov.vn Downloaded October 19,2000.
Vismin.com. http://www.vismin.com/destination/bacolod/ Downloaded August 9, 2000.
Wang, Yuan and Julie Caswell. "Comparative levels of food safety regulations in threeU.S.-Asian trading groups." Journal of Agribusiness, Fall 1998, Vol. 16, No. 2, 115-128.