Embed Size (px)
Citation preview
fibers
Article
Infrared Imaging of Cotton Fiber Bundles Using aFocal Plane Array Detector and a SingleReflectance Accessory
Michael Santiago Cintrón 1,*, Joseph G. Montalvo 1, Terri Von Hoven 1, James E. Rodgers 1,Doug J. Hinchliffe 2, Crista Madison 2, Gregory N. Thyssen 2 and Linghe Zeng 3
1 Cotton Structure & Quality Research Unit, Southern Regional Research Center (SRRC),Agricultural Research Service (ARS), United States Department of Agriculture (USDA),New Orleans, LA 70124, USA; [email protected] (J.G.M.);[email protected] (T.V.H.); [email protected] (J.E.R.)
2 Cotton Chemistry & Utilization Research Unit, Southern Regional Research Center (SRRC), ARS, USDA,New Orleans, LA 70124, USA; [email protected] (D.J.H.); [email protected] (C.M.);[email protected] (G.N.T.)
3 Crop Genetics Research Unit, Jamie Whitten Delta States Research Center, ARS, USDA, Stoneville,MS 38776, USA; [email protected]
* Correspondence: [email protected]; Tel.: +1-504-286-4273
Academic Editor: Ton PeijsReceived: 29 September 2016; Accepted: 18 October 2016; Published: 10 November 2016
Abstract: Infrared imaging is gaining attention as a technique used in the examination of cottonfibers. This type of imaging combines spectral analysis with spatial resolution to create visual imagesthat examine sample composition and distribution. Herein, we report on the use of an infraredinstrument equipped with a reflection accessory and an array detector system for the examination ofcotton fiber bundles. Cotton vibrational spectra and chemical images were acquired by groupingpixels in the detector array. This technique reduced spectral noise and was employed to visualizecell wall development in cotton fibers bundles. Fourier transform infrared spectra reveal bandchanges in the C–O bending region that matched previous studies. Imaging studies were quick, reliedon small amounts of sample and provided a distribution of the cotton fiber cell wall composition.Thus, imaging of cotton bundles with an infrared detector array has potential for use in cottonfiber examinations.
Keywords: cotton; imaging; Fourier transform infrared spectroscopy (FTIR); attenuated totalreflection (ATR); maturity; cell wall
1. Introduction
Millions of cotton fiber examinations are performed every year. A bundle sample from allcommercial bales of cotton produced in the United States is examined with a high volume instrument(HVI) as part of a cotton classification system [1–3]. Classing of cotton determines marketable fiberproperties, such as fiber strength, length, micronaire, trash content (grade), and uniformity [2,4,5].In addition, the advanced fiber information system (AFIS) can provide information on fiber lengthand maturity [2,3]. Similar classing examinations are becoming standard in other cotton-producingcountries [6]. Moreover, cotton breeders rely on studies of fiber properties and fiber development(e.g., cell wall development, maturity ratio) when selecting new cotton varieties. Given the highvolume of examinations, there is a need for developing new methods and technologies that mightimprove the efficiency and informative capability of current cotton characterization systems.
Fibers 2016, 4, 27; doi:10.3390/fib4040027 www.mdpi.com/journal/fibers
Fibers 2016, 4, 27 2 of 11
Infrared spectroscopy (IR) can be used to examine the quality, development and structure of cottonfibers [2,7–9]. While IR spectroscopy has long been used in cotton fiber studies, recent studies haveestablished the use of Fourier transform infrared spectroscopy (FTIR) and an attenuated total reflection(ATR) attachment for fiber characterization [7,10–12]. ATR is an infrared sampling technique used toroutinely sample solid or liquid materials [13–16]. Most ATR techniques rely on multiple reflections ofthe IR sampling beam along a sample. Abidi and coworkers used FTIR-ATR for the examination ofcotton fiber cell wall development [10–12], while Lui and coworkers explored maturity determinationswith FTIR-ATR [7]. Fortier and collaborators explored the use of FTIR-ATR and near-IR in cotton trashidentification [17]. The ATR accessory presents significant improvements over classic IR techniques;it offers minimal sample preparation while also providing fast determinations [7,10,17]. Limitations ofFTIR-ATR include the small total sample area examined with each scan (typical ATR crystals have adiameter of 1.5–5 mm) and the one-dimensional aspect of data acquisition (traditional ATR data haslow or no spatial resolution).
Chemical imaging represents an emerging research field in the characterization of cotton fibers.Chemical images are prepared by collecting a multitude of spectra in spatially defined sample areas.The combination of spatial resolution and spectral signatures results in a visual image that canbe used to pinpoint sample composition, uniformity, and distribution. Sample composition anduniformity are difficult to measure with traditional ATR units given their low spatial resolution.Recently, Mustafic and coworkers used fluorescence imaging to identify foreign matter in smallcotton bundles [18]. The number of studies applying IR imaging to cotton fibers has been limited.Early studies concentrated on cell wall development or composition [19–24]. More recently, a highresolution focal plane array (FPA) detector [25] was used with an IR microscope to image developingcotton fibers [26]. The FPA-equipped system presented significant improvements over previousimaging studies; notably, the detector allowed for the simultaneous collection of thousands of spectralpoints. Still, that study was limited to the imaging of individual cotton fibers. An FPA detectorwas also used in a macro sampling chamber to image trash commonly found in cotton samples [27].The preliminary study used a single reflectance ATR accessory to sample botanical and field trash.Single reflectance ATR techniques have gained attention following the widespread adoption of moresensitive IR detectors. The macro sampling chamber allows for the imaging of larger samples (bundles).While this technique proved effective in identifying various trash samples, the study made evidentthe limited reflectance of cotton fiber bundles [27]. Compared to the trash components, the cottonspectra lacked definition and showed significant spectral noise. Herein, we further explore the use of asingle reflectance ATR accessory for the infrared imaging of cotton fiber bundles. Our study soughtto establish a working technique that produced IR spectra of cotton bundles with reduced spectralnoise or artifacts. To accomplish this end, spatial IR data was grouped into delineated data clusters.Data grouping is a tool that simplifies spectral analysis [28]. A potential application for the ATR-FPAtechnique was also explored. Data grouping was used to image bundles of developing cotton fibersand to examine the uniformity of their cell wall development and sample composition.
2. Materials and Methods
2.1. Plant Materials
Cotton samples from four varieties, Stoneville 474 (STV474; PI578877), Deltapine Acala 90(DP90; PI564767), Tamcot Pyramid (Pyramid; PI617042), and M-240 RNR (M240; PI592511), weregrown in 2015 under standard field conditions in Stoneville, MS, USA. Samples were harvested atdifferent developmental time points between 18 and 24 days post-anthesis (DPA). Mature samples werealso collected from open cotton bolls (60+ DPA). Fibers for all developmental points were removed fromthe cotton seed by hand, cleaned with water to remove excess plant and soluble material, and allowedto dry overnight in an oven (~90 ◦C). Each sample is composed of fibers from multiple cotton bollsand plants. The samples were not subjected to mechanical cleaning or blending.
Fibers 2016, 4, 27 3 of 11
2.2. FTIR Examination
Cotton fiber bundles were examined with an IMAC macro sampling chamber (Bruker Optics,Billerica, MA, USA) equipped with a Mid-IR focal-plane array (FPA) detector and a FastIR singlereflection ATR unit (Harrick Scientific Products, Pleasantville, NY, USA; Figure S1). The macro chamberand ATR unit were used as provided by the manufacturers. Small bundles (~500 mg) of the fibersamples were combed and placed atop the ATR crystal. Each cotton bundle was secured with a metalclamp and metal plate in a manner that assured consistent pressure for all samples. All FTIR datawas collected in reflectance mode. Unless noted differently, samples were examined with 128 scanswith a resolution of 8 cm−1 (3800 cm−1–900 cm−1). Spectra were corrected against an air background.Spectra for each sample were corrected for atmospheric CO2 and baseline-corrected using the OPUS3D spectroscopy software (version 6.5) (Bruker Optics, Billerica, MA, USA). Under these conditions,examination of the 15 mm × 15 mm sampling window was completed in about 10 min under thesesettings, each examination produced a total of 16,834 spectra (128 pixels × 128 pixels). Pixel grouping(co-addition of adjacent pixels) was performed, 2 × 2, 4 × 4, 8 × 8, or 16 × 16, as indicated. Exceptwhen otherwise noted, spectra are the average of eight distinct fiber bundle areas within a sample.Sampling points were selected in areas that showed high intensity for cotton spectral bands. Spectrawere plotted with IGOR Pro (version 6.2, Wavemetrics, Portland, OR, USA). IR bands assignments aretaken from previous studies [26,29,30].
Single-point IR studies were performed with a Vertex 70 (Bruker Optics) equipped with an ATRsampling accessory (Pike Technologies, Madison, WI, USA). Cotton samples were placed on top of theATR crystal (1.5 mm in diameter) and secured with a metal clamp. A total of 128 scans were measuredfor each sample point with a resolution of 8 cm−1 (3800 cm−1–900 cm−1). Spectra are presentedwithout ATR correction.
2.3. Chemical Imaging
Three-dimensional data analysis was performed with the 3D function of the OPUS softwarepackage (Bruker Optics, Billerica, MA, USA). Spectral bands were integrated using the measurementfunction in OPUS. Grouping of spectral data was performed as indicated. The default integrationmethod was used. Unless otherwise noted, chemical images are presented scaled to the highestobserved integration. These points correspond to the red and pink tones observed in the chemicaldistribution maps while blue tones correspond to integrations at or below zero.
2.4. Fiber Analysis
The hand harvested/hand ginned fibers were analyzed at the Southern Regional Research Center.Cotton bundles were analyzed on the advanced fiber information system 2 (AFIS 2) (Uster TechnologiesAG, Uster, Switzerland). This is a fully automated instrument, based on single fiber testing. A samplein sliver form is fed into the fiber individualizer, which separates the matrix into individual entitiescomposed of fibers, neps, trash, and dust. The 22 DPA cotton samples were analyzed using 0.1 g sliversdue to limited sample size [31]. All the other cotton slivers were 0.5 g, 30 cm long of randomly selectedfibers with five replicates of each being analyzed.
3. Results
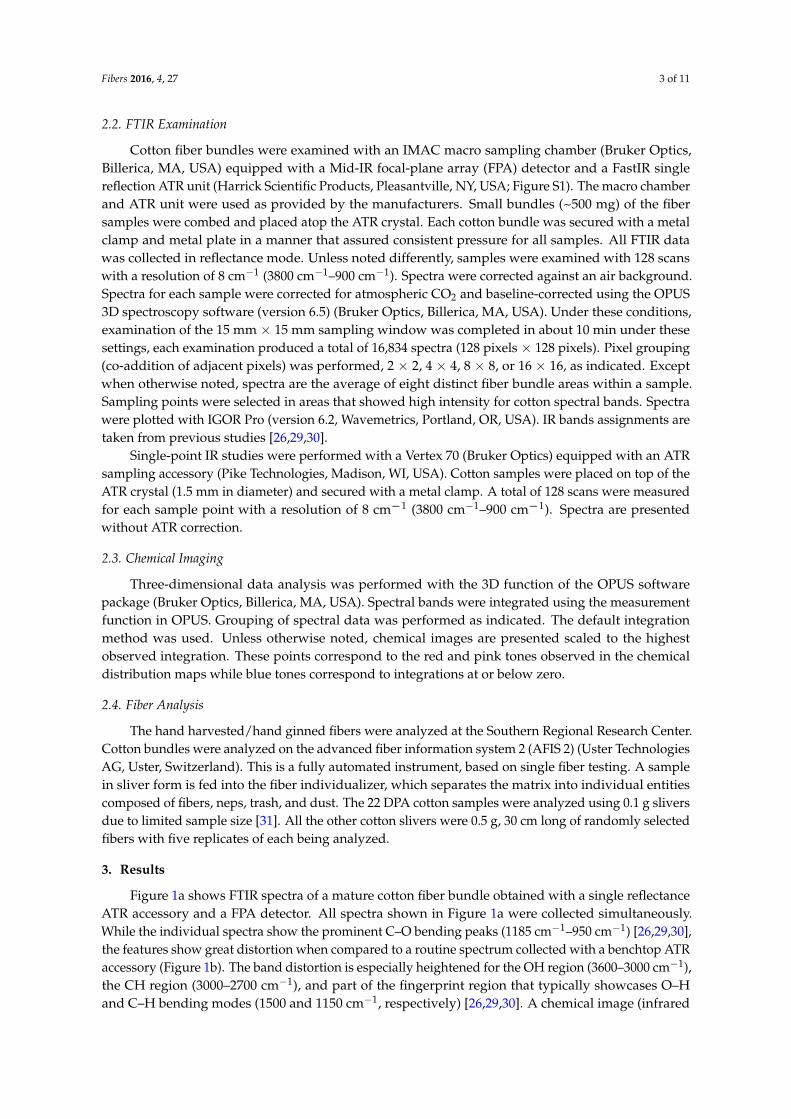
Figure 1a shows FTIR spectra of a mature cotton fiber bundle obtained with a single reflectanceATR accessory and a FPA detector. All spectra shown in Figure 1a were collected simultaneously.While the individual spectra show the prominent C–O bending peaks (1185 cm−1–950 cm−1) [26,29,30],the features show great distortion when compared to a routine spectrum collected with a benchtop ATRaccessory (Figure 1b). The band distortion is especially heightened for the OH region (3600–3000 cm−1),the CH region (3000–2700 cm−1), and part of the fingerprint region that typically showcases O–Hand C–H bending modes (1500 and 1150 cm−1, respectively) [26,29,30]. A chemical image (infrared
Fibers 2016, 4, 27 4 of 11
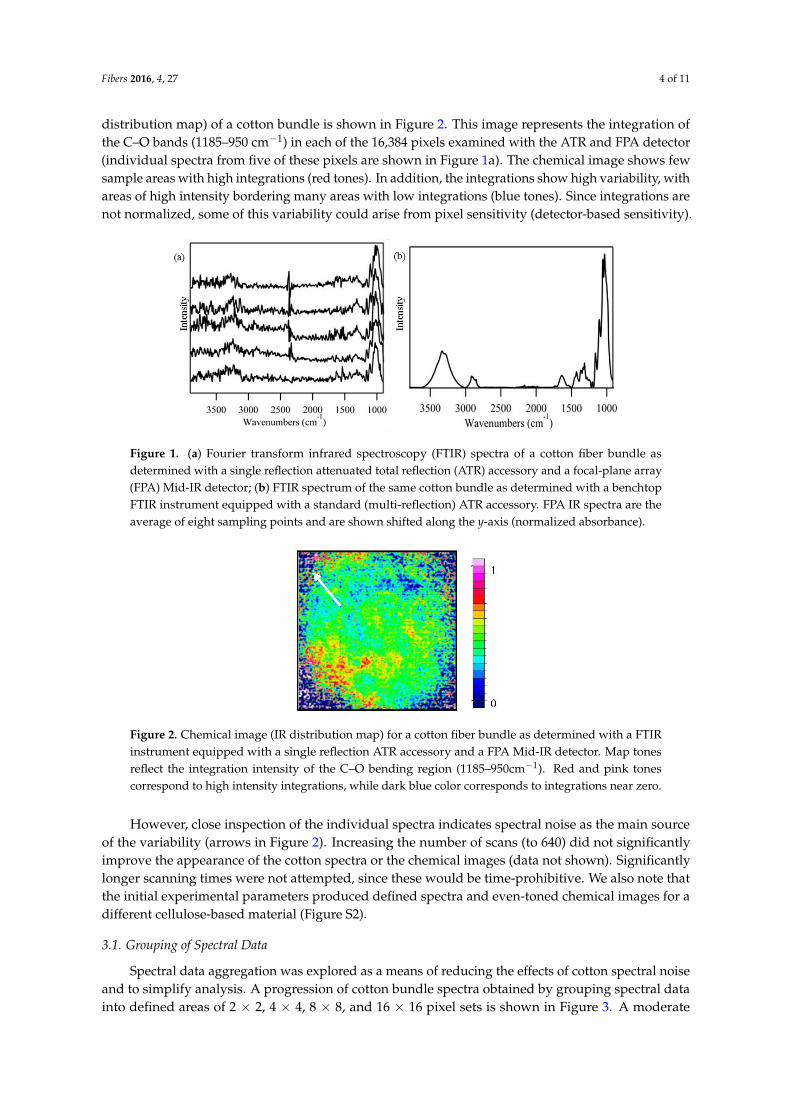
distribution map) of a cotton bundle is shown in Figure 2. This image represents the integration ofthe C–O bands (1185–950 cm−1) in each of the 16,384 pixels examined with the ATR and FPA detector(individual spectra from five of these pixels are shown in Figure 1a). The chemical image shows fewsample areas with high integrations (red tones). In addition, the integrations show high variability, withareas of high intensity bordering many areas with low integrations (blue tones). Since integrations arenot normalized, some of this variability could arise from pixel sensitivity (detector-based sensitivity).
Fibers 2016, 4, 27 4 of 11
C–H bending modes (1500 and 1150 cm−1, respectively) [26,29,30]. A chemical image (infrared
distribution map) of a cotton bundle is shown in Figure 2. This image represents the integration of the
C–O bands (1185–950 cm−1) in each of the 16,384 pixels examined with the ATR and FPA detector
(individual spectra from five of these pixels are shown in Figure 1a). The chemical image shows few
sample areas with high integrations (red tones). In addition, the integrations show high variability, with
areas of high intensity bordering many areas with low integrations (blue tones). Since integrations are
not normalized, some of this variability could arise from pixel sensitivity (detector-based sensitivity).
Figure 1. (a) Fourier transform infrared spectroscopy (FTIR) spectra of a cotton fiber bundle as
determined with a single reflection attenuated total reflection (ATR) accessory and a focal-plane array
(FPA) Mid-IR detector; (b) FTIR spectrum of the same cotton bundle as determined with a benchtop
FTIR instrument equipped with a standard (multi-reflection) ATR accessory. FPA IR spectra are the
average of eight sampling points and are shown shifted along the y-axis (normalized absorbance).
Figure 2. Chemical image (IR distribution map) for a cotton fiber bundle as determined with a FTIR
instrument equipped with a single reflection ATR accessory and a FPA Mid-IR detector. Map tones
reflect the integration intensity of the C–O bending region (1185–950cm−1). Red and pink tones
correspond to high intensity integrations, while dark blue color corresponds to integrations near zero.
However, close inspection of the individual spectra indicates spectral noise as the main source of
the variability (arrows in Figure 2). Increasing the number of scans (to 640) did not significantly improve
the appearance of the cotton spectra or the chemical images (data not shown). Significantly longer
scanning times were not attempted, since these would be time-prohibitive. We also note that the initial
experimental parameters produced defined spectra and even-toned chemical images for a different
cellulose-based material (Figure S2).
3.1. Grouping of Spectral Data
Spectral data aggregation was explored as a means of reducing the effects of cotton spectral noise
and to simplify analysis. A progression of cotton bundle spectra obtained by grouping spectral data
Figure 1. (a) Fourier transform infrared spectroscopy (FTIR) spectra of a cotton fiber bundle asdetermined with a single reflection attenuated total reflection (ATR) accessory and a focal-plane array(FPA) Mid-IR detector; (b) FTIR spectrum of the same cotton bundle as determined with a benchtopFTIR instrument equipped with a standard (multi-reflection) ATR accessory. FPA IR spectra are theaverage of eight sampling points and are shown shifted along the y-axis (normalized absorbance).
Fibers 2016, 4, 27 4 of 11
C–H bending modes (1500 and 1150 cm−1, respectively) [26,29,30]. A chemical image (infrared
distribution map) of a cotton bundle is shown in Figure 2. This image represents the integration of the
C–O bands (1185–950 cm−1) in each of the 16,384 pixels examined with the ATR and FPA detector
(individual spectra from five of these pixels are shown in Figure 1a). The chemical image shows few
sample areas with high integrations (red tones). In addition, the integrations show high variability, with
areas of high intensity bordering many areas with low integrations (blue tones). Since integrations are
not normalized, some of this variability could arise from pixel sensitivity (detector-based sensitivity).
Figure 1. (a) Fourier transform infrared spectroscopy (FTIR) spectra of a cotton fiber bundle as
determined with a single reflection attenuated total reflection (ATR) accessory and a focal-plane array
(FPA) Mid-IR detector; (b) FTIR spectrum of the same cotton bundle as determined with a benchtop
FTIR instrument equipped with a standard (multi-reflection) ATR accessory. FPA IR spectra are the
average of eight sampling points and are shown shifted along the y-axis (normalized absorbance).
Figure 2. Chemical image (IR distribution map) for a cotton fiber bundle as determined with a FTIR
instrument equipped with a single reflection ATR accessory and a FPA Mid-IR detector. Map tones
reflect the integration intensity of the C–O bending region (1185–950cm−1). Red and pink tones
correspond to high intensity integrations, while dark blue color corresponds to integrations near zero.
However, close inspection of the individual spectra indicates spectral noise as the main source of
the variability (arrows in Figure 2). Increasing the number of scans (to 640) did not significantly improve
the appearance of the cotton spectra or the chemical images (data not shown). Significantly longer
scanning times were not attempted, since these would be time-prohibitive. We also note that the initial
experimental parameters produced defined spectra and even-toned chemical images for a different
cellulose-based material (Figure S2).
3.1. Grouping of Spectral Data
Spectral data aggregation was explored as a means of reducing the effects of cotton spectral noise
and to simplify analysis. A progression of cotton bundle spectra obtained by grouping spectral data
Figure 2. Chemical image (IR distribution map) for a cotton fiber bundle as determined with a FTIRinstrument equipped with a single reflection ATR accessory and a FPA Mid-IR detector. Map tonesreflect the integration intensity of the C–O bending region (1185–950cm−1). Red and pink tonescorrespond to high intensity integrations, while dark blue color corresponds to integrations near zero.
However, close inspection of the individual spectra indicates spectral noise as the main sourceof the variability (arrows in Figure 2). Increasing the number of scans (to 640) did not significantlyimprove the appearance of the cotton spectra or the chemical images (data not shown). Significantlylonger scanning times were not attempted, since these would be time-prohibitive. We also note thatthe initial experimental parameters produced defined spectra and even-toned chemical images for adifferent cellulose-based material (Figure S2).
3.1. Grouping of Spectral Data
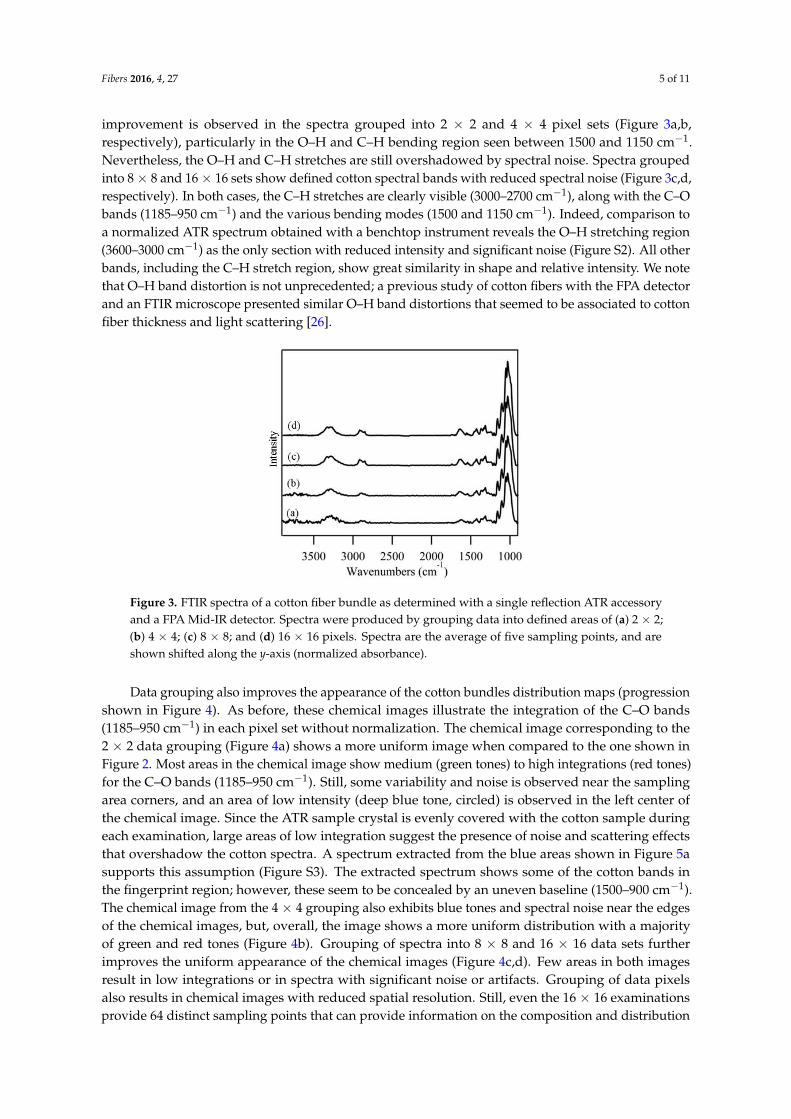
Spectral data aggregation was explored as a means of reducing the effects of cotton spectral noiseand to simplify analysis. A progression of cotton bundle spectra obtained by grouping spectral datainto defined areas of 2 × 2, 4 × 4, 8 × 8, and 16 × 16 pixel sets is shown in Figure 3. A moderate
Fibers 2016, 4, 27 5 of 11
improvement is observed in the spectra grouped into 2 × 2 and 4 × 4 pixel sets (Figure 3a,b,respectively), particularly in the O–H and C–H bending region seen between 1500 and 1150 cm−1.Nevertheless, the O–H and C–H stretches are still overshadowed by spectral noise. Spectra groupedinto 8 × 8 and 16 × 16 sets show defined cotton spectral bands with reduced spectral noise (Figure 3c,d,respectively). In both cases, the C–H stretches are clearly visible (3000–2700 cm−1), along with the C–Obands (1185–950 cm−1) and the various bending modes (1500 and 1150 cm−1). Indeed, comparison toa normalized ATR spectrum obtained with a benchtop instrument reveals the O–H stretching region(3600–3000 cm−1) as the only section with reduced intensity and significant noise (Figure S2). All otherbands, including the C–H stretch region, show great similarity in shape and relative intensity. We notethat O–H band distortion is not unprecedented; a previous study of cotton fibers with the FPA detectorand an FTIR microscope presented similar O–H band distortions that seemed to be associated to cottonfiber thickness and light scattering [26].
Fibers 2016, 4, 27 5 of 11
into defined areas of 2 × 2, 4 × 4, 8 × 8, and 16 × 16 pixel sets is shown in Figure 3. A moderate
improvement is observed in the spectra grouped into 2 × 2 and 4 × 4 pixel sets (Figure 3a,b,
respectively), particularly in the O–H and C–H bending region seen between 1500 and 1150 cm−1.
Nevertheless, the O–H and C–H stretches are still overshadowed by spectral noise. Spectra grouped
into 8 × 8 and 16 × 16 sets show defined cotton spectral bands with reduced spectral noise (Figure
3c,d, respectively). In both cases, the C–H stretches are clearly visible (3000–2700 cm−1), along with
the C–O bands (1185–950 cm−1) and the various bending modes (1500 and 1150 cm−1). Indeed,
comparison to a normalized ATR spectrum obtained with a benchtop instrument reveals the O–H
stretching region (3600–3000 cm−1) as the only section with reduced intensity and significant noise
(Figure S2). All other bands, including the C–H stretch region, show great similarity in shape and
relative intensity. We note that O–H band distortion is not unprecedented; a previous study of cotton
fibers with the FPA detector and an FTIR microscope presented similar O–H band distortions that
seemed to be associated to cotton fiber thickness and light scattering [26].
Figure 3. FTIR spectra of a cotton fiber bundle as determined with a single reflection ATR accessory
and a FPA Mid-IR detector. Spectra were produced by grouping data into defined areas of (a) 2 × 2;
(b) 4 × 4; (c) 8 × 8; and (d) 16 × 16 pixels. Spectra are the average of five sampling points, and are shown
shifted along the y-axis (normalized absorbance).
Data grouping also improves the appearance of the cotton bundles distribution maps
(progression shown in Figure 4). As before, these chemical images illustrate the integration of the C–
O bands (1185–950 cm−1) in each pixel set without normalization. The chemical image corresponding
to the 2 × 2 data grouping (Figure 4a) shows a more uniform image when compared to the one shown
in Figure 2. Most areas in the chemical image show medium (green tones) to high integrations (red
tones) for the C–O bands (1185–950 cm−1). Still, some variability and noise is observed near the
sampling area corners, and an area of low intensity (deep blue tone, circled) is observed in the left
center of the chemical image. Since the ATR sample crystal is evenly covered with the cotton sample
during each examination, large areas of low integration suggest the presence of noise and scattering
effects that overshadow the cotton spectra. A spectrum extracted from the blue areas shown in Figure
5a supports this assumption (Figure S3). The extracted spectrum shows some of the cotton bands in
the fingerprint region; however, these seem to be concealed by an uneven baseline (1500–900 cm−1).
The chemical image from the 4 × 4 grouping also exhibits blue tones and spectral noise near the edges
of the chemical images, but, overall, the image shows a more uniform distribution with a majority of
green and red tones (Figure 4b). Grouping of spectra into 8 × 8 and 16 × 16 data sets further improves
the uniform appearance of the chemical images (Figure 4c,d). Few areas in both images result in low
integrations or in spectra with significant noise or artifacts. Grouping of data pixels also results in
chemical images with reduced spatial resolution. Still, even the 16 × 16 examinations provide 64
Figure 3. FTIR spectra of a cotton fiber bundle as determined with a single reflection ATR accessoryand a FPA Mid-IR detector. Spectra were produced by grouping data into defined areas of (a) 2 × 2;(b) 4 × 4; (c) 8 × 8; and (d) 16 × 16 pixels. Spectra are the average of five sampling points, and areshown shifted along the y-axis (normalized absorbance).
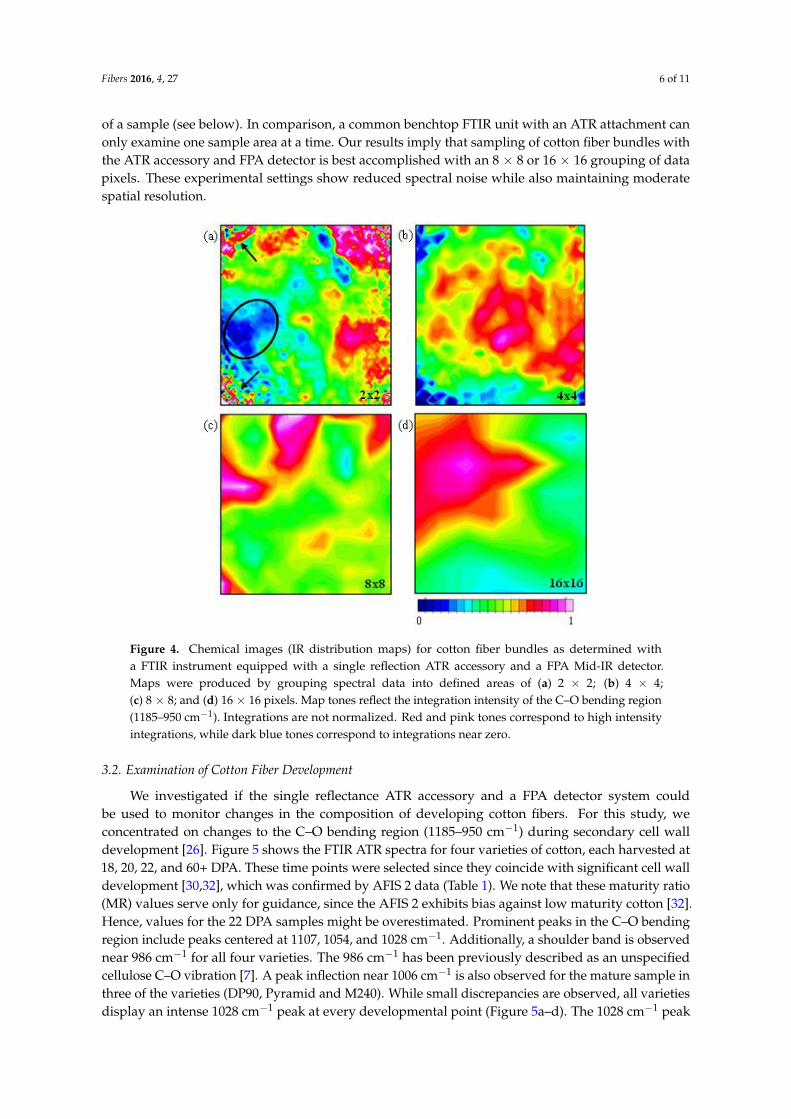
Data grouping also improves the appearance of the cotton bundles distribution maps (progressionshown in Figure 4). As before, these chemical images illustrate the integration of the C–O bands(1185–950 cm−1) in each pixel set without normalization. The chemical image corresponding to the2 × 2 data grouping (Figure 4a) shows a more uniform image when compared to the one shown inFigure 2. Most areas in the chemical image show medium (green tones) to high integrations (red tones)for the C–O bands (1185–950 cm−1). Still, some variability and noise is observed near the samplingarea corners, and an area of low intensity (deep blue tone, circled) is observed in the left center ofthe chemical image. Since the ATR sample crystal is evenly covered with the cotton sample duringeach examination, large areas of low integration suggest the presence of noise and scattering effectsthat overshadow the cotton spectra. A spectrum extracted from the blue areas shown in Figure 5asupports this assumption (Figure S3). The extracted spectrum shows some of the cotton bands inthe fingerprint region; however, these seem to be concealed by an uneven baseline (1500–900 cm−1).The chemical image from the 4 × 4 grouping also exhibits blue tones and spectral noise near the edgesof the chemical images, but, overall, the image shows a more uniform distribution with a majorityof green and red tones (Figure 4b). Grouping of spectra into 8 × 8 and 16 × 16 data sets furtherimproves the uniform appearance of the chemical images (Figure 4c,d). Few areas in both imagesresult in low integrations or in spectra with significant noise or artifacts. Grouping of data pixelsalso results in chemical images with reduced spatial resolution. Still, even the 16 × 16 examinationsprovide 64 distinct sampling points that can provide information on the composition and distribution
Fibers 2016, 4, 27 6 of 11
of a sample (see below). In comparison, a common benchtop FTIR unit with an ATR attachment canonly examine one sample area at a time. Our results imply that sampling of cotton fiber bundles withthe ATR accessory and FPA detector is best accomplished with an 8 × 8 or 16 × 16 grouping of datapixels. These experimental settings show reduced spectral noise while also maintaining moderatespatial resolution.
Fibers 2016, 4, 27 6 of 11
distinct sampling points that can provide information on the composition and distribution of a
sample (see below). In comparison, a common benchtop FTIR unit with an ATR attachment can only
examine one sample area at a time. Our results imply that sampling of cotton fiber bundles with the
ATR accessory and FPA detector is best accomplished with an 8 × 8 or 16 × 16 grouping of data pixels.
These experimental settings show reduced spectral noise while also maintaining moderate spatial
resolution.
Figure 4. Chemical images (IR distribution maps) for cotton fiber bundles as determined with a FTIR
instrument equipped with a single reflection ATR accessory and a FPA Mid-IR detector. Maps were
produced by grouping spectral data into defined areas of (a) 2 × 2; (b) 4 × 4; (c) 8 × 8; and (d) 16 × 16
pixels. Map tones reflect the integration intensity of the C–O bending region (1185–950 cm−1).
Integrations are not normalized. Red and pink tones correspond to high intensity integrations, while
dark blue tones correspond to integrations near zero.
3.2. Examination of Cotton Fiber Development
We investigated if the single reflectance ATR accessory and a FPA detector system could be used
to monitor changes in the composition of developing cotton fibers. For this study, we concentrated
on changes to the C–O bending region (1185–950 cm−1) during secondary cell wall development [26].
Figure 5 shows the FTIR ATR spectra for four varieties of cotton, each harvested at 18, 20, 22, and 60+
DPA. These time points were selected since they coincide with significant cell wall development
[30,32], which was confirmed by AFIS 2 data (Table 1). We note that these maturity ratio (MR) values
serve only for guidance, since the AFIS 2 exhibits bias against low maturity cotton [32]. Hence, values
for the 22 DPA samples might be overestimated. Prominent peaks in the C–O bending region include
peaks centered at 1107, 1054, and 1028 cm−1. Additionally, a shoulder band is observed near 986 cm−1 for
all four varieties. The 986 cm−1 has been previously described as an unspecified cellulose C–O vibration
[7]. A peak inflection near 1006 cm−1 is also observed for the mature sample in three of the varieties
(DP90, Pyramid and M240). While small discrepancies are observed, all varieties display an intense
Figure 4. Chemical images (IR distribution maps) for cotton fiber bundles as determined witha FTIR instrument equipped with a single reflection ATR accessory and a FPA Mid-IR detector.Maps were produced by grouping spectral data into defined areas of (a) 2 × 2; (b) 4 × 4;(c) 8 × 8; and (d) 16 × 16 pixels. Map tones reflect the integration intensity of the C–O bending region(1185–950 cm−1). Integrations are not normalized. Red and pink tones correspond to high intensityintegrations, while dark blue tones correspond to integrations near zero.
3.2. Examination of Cotton Fiber Development
We investigated if the single reflectance ATR accessory and a FPA detector system couldbe used to monitor changes in the composition of developing cotton fibers. For this study, weconcentrated on changes to the C–O bending region (1185–950 cm−1) during secondary cell walldevelopment [26]. Figure 5 shows the FTIR ATR spectra for four varieties of cotton, each harvested at18, 20, 22, and 60+ DPA. These time points were selected since they coincide with significant cell walldevelopment [30,32], which was confirmed by AFIS 2 data (Table 1). We note that these maturity ratio(MR) values serve only for guidance, since the AFIS 2 exhibits bias against low maturity cotton [32].Hence, values for the 22 DPA samples might be overestimated. Prominent peaks in the C–O bendingregion include peaks centered at 1107, 1054, and 1028 cm−1. Additionally, a shoulder band is observednear 986 cm−1 for all four varieties. The 986 cm−1 has been previously described as an unspecifiedcellulose C–O vibration [7]. A peak inflection near 1006 cm−1 is also observed for the mature sample inthree of the varieties (DP90, Pyramid and M240). While small discrepancies are observed, all varietiesdisplay an intense 1028 cm−1 peak at every developmental point (Figure 5a–d). The 1028 cm−1 peak

Fibers 2016, 4, 27 7 of 11
has been previously described as a cellulose C6–O6–H vibration [26,29]. In contrast to the 1028 cm−1
peak, the shoulder band near 986 cm−1 increases in relative intensity as the development of the cottonincreases. The relative intensity of the 986 cm−1 differs among the undeveloped (18 DPA) cottonfibers, with the Pyramid sample (Figure 5ci) appearing to have the lowest intensity, and the M240sample the highest (Figure 5di). Still, the intensity of the 986 cm−1 for the undeveloped fiber bundlesat 18 DPA does not predict the intensity observed in the fully developed sample. For example, therelative intensity of the 986 cm−1 peak in the fully grown Pyramid bundle sample (Figure 5civ) ishigher than the one observed for the M240 bundle (Figure 5div). The progression of these two bandssuggests that the ATR-FPA technique presented herein can be used to monitor cell wall developmentin cotton fiber bundles.
Fibers 2016, 4, 27 7 of 11
1028 cm−1 peak at every developmental point (Figure 5a–d). The 1028 cm−1 peak has been previously
described as a cellulose C6–O6–H vibration [26,29]. In contrast to the 1028 cm−1 peak, the shoulder
band near 986 cm−1 increases in relative intensity as the development of the cotton increases. The
relative intensity of the 986 cm−1 differs among the undeveloped (18 DPA) cotton fibers, with the
Pyramid sample (Figure 5ci) appearing to have the lowest intensity, and the M240 sample the highest
(Figure 5di). Still, the intensity of the 986 cm−1 for the undeveloped fiber bundles at 18 DPA does not
predict the intensity observed in the fully developed sample. For example, the relative intensity of
the 986 cm−1 peak in the fully grown Pyramid bundle sample (Figure 5civ) is higher than the one
observed for the M240 bundle (Figure 5div). The progression of these two bands suggests that the
ATR-FPA technique presented herein can be used to monitor cell wall development in cotton fiber
bundles.
Figure 5. FTIR spectra of the C–O stretching region for cotton fibers harvested at different developmental
time points. Spectra were collected utilizing a single reflection ATR attachment and a FPA Mid-IR
detector. Four varieties were examined: (a) STV474; (b) DP90; (c) Pyramid; and (d) M240. For each
variety, four time points are shown: (i) 18 DPA; (ii) 20 DPA; (iii) 22 DPA; and (iv) mature fibers from
open cotton bolls (~60 DPA). Spectra are shown shifted along the y-axis (normalized absorbance). A
dashed line is shown crossing the region (1015 and 970 cm−1) that undergoes significant changes during
cell wall development. Indicated numbers are in wavenumbers.
Table 1. Advanced fiber information system (AFIS 2) maturity ratio values for four cotton varieties.
STDEV: standard deviation; CV: coefficient of variation.
STV474 DP90 M240 Pyramid
22 DPA * Mature 22 DPA * Mature 22 DPA * Mature 22 DPA * Mature
Mean 0.798 0.942 0.812 0.958 0.840 0.968 0.846 0.974
STDEV 0.015 0.013 0.008 0.008 0.014 0.015 0.015 0.021
CV 1.859 1.384 1.030 0.873 1.684 1.532 1.793 2.129
* Maturity ration (MR) values affected by the instrument being insensitive to values below a certain threshold.
Figure 5. FTIR spectra of the C–O stretching region for cotton fibers harvested at differentdevelopmental time points. Spectra were collected utilizing a single reflection ATR attachment and aFPA Mid-IR detector. Four varieties were examined: (a) STV474; (b) DP90; (c) Pyramid; and (d) M240.For each variety, four time points are shown: (i) 18 DPA; (ii) 20 DPA; (iii) 22 DPA; and (iv) mature fibersfrom open cotton bolls (~60 DPA). Spectra are shown shifted along the y-axis (normalized absorbance).A dashed line is shown crossing the region (1015 and 970 cm−1) that undergoes significant changesduring cell wall development. Indicated numbers are in wavenumbers.
Table 1. Advanced fiber information system (AFIS 2) maturity ratio values for four cotton varieties.STDEV: standard deviation; CV: coefficient of variation.
STV474 DP90 M240 Pyramid
22 DPA * Mature 22 DPA * Mature 22 DPA * Mature 22 DPA * Mature
Mean 0.798 0.942 0.812 0.958 0.840 0.968 0.846 0.974STDEV 0.015 0.013 0.008 0.008 0.014 0.015 0.015 0.021
CV 1.859 1.384 1.030 0.873 1.684 1.532 1.793 2.129
* Maturity ration (MR) values affected by the instrument being insensitive to values below a certain threshold.
Fibers 2016, 4, 27 8 of 11
3.3. Examination of Sample Distribution
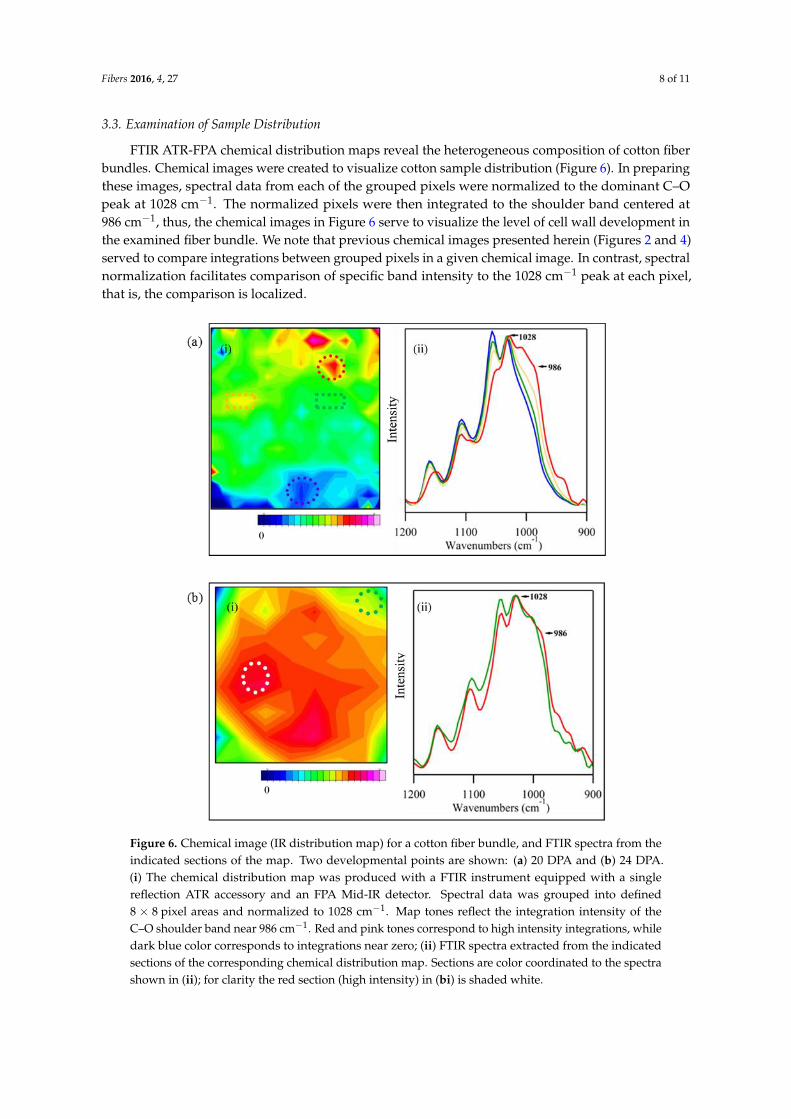
FTIR ATR-FPA chemical distribution maps reveal the heterogeneous composition of cotton fiberbundles. Chemical images were created to visualize cotton sample distribution (Figure 6). In preparingthese images, spectral data from each of the grouped pixels were normalized to the dominant C–Opeak at 1028 cm−1. The normalized pixels were then integrated to the shoulder band centered at986 cm−1, thus, the chemical images in Figure 6 serve to visualize the level of cell wall development inthe examined fiber bundle. We note that previous chemical images presented herein (Figures 2 and 4)served to compare integrations between grouped pixels in a given chemical image. In contrast, spectralnormalization facilitates comparison of specific band intensity to the 1028 cm−1 peak at each pixel,that is, the comparison is localized.Fibers 2016, 4, 27 9 of 11
Figure 6. Chemical image (IR distribution map) for a cotton fiber bundle, and FTIR spectra from the
indicated sections of the map. Two developmental points are shown: (a) 20 DPA and (b) 24 DPA. (i) The
chemical distribution map was produced with a FTIR instrument equipped with a single reflection ATR
accessory and an FPA Mid-IR detector. Spectral data was grouped into defined 8 × 8 pixel areas and
normalized to 1028 cm−1. Map tones reflect the integration intensity of the C–O shoulder band near 986
cm−1. Red and pink tones correspond to high intensity integrations, while dark blue color corresponds
to integrations near zero; (ii) FTIR spectra extracted from the indicated sections of the corresponding
chemical distribution map. Sections are color coordinated to the spectra shown in (ii); for clarity the red
section (high intensity) in (bi) is shaded white.
4. Conclusions
An FTIR instrument equipped with a single reflection ATR accessory and FPA detector can be
used to create chemical images of cotton fiber bundles. Previous IR imaging studies that examined large
numbers of cotton fibers relied either on point by point examinations or on FTIR spectra with low
sensitivity (low signal-to-noise ratio). In this study, FTIR spectra and chemical images with improved
sensitivity were acquired by the grouping of multiple adjacent pixels in the detector array. The single
reflectance FPA technique was employed to examine cotton fibers undergoing secondary cell wall
development, and to visualize the distribution of this developmental process in a cotton fiber bundle.
Observed changes to the C–O bending region, matched previous FTIR studies of developing cotton
fibers. These examinations were quick (~10 min), produced a sampling distribution, required little in
the way of sample size (~500 mg), and were not destructive to the cotton samples. While preliminary,
our results point to the use of IR chemical imaging as a tool in the examination of cotton fiber bundles.
Figure 6. Chemical image (IR distribution map) for a cotton fiber bundle, and FTIR spectra from theindicated sections of the map. Two developmental points are shown: (a) 20 DPA and (b) 24 DPA.(i) The chemical distribution map was produced with a FTIR instrument equipped with a singlereflection ATR accessory and an FPA Mid-IR detector. Spectral data was grouped into defined8 × 8 pixel areas and normalized to 1028 cm−1. Map tones reflect the integration intensity of theC–O shoulder band near 986 cm−1. Red and pink tones correspond to high intensity integrations, whiledark blue color corresponds to integrations near zero; (ii) FTIR spectra extracted from the indicatedsections of the corresponding chemical distribution map. Sections are color coordinated to the spectrashown in (ii); for clarity the red section (high intensity) in (bi) is shaded white.
Fibers 2016, 4, 27 9 of 11
Figure 6a shows the normalized chemical image of a 20 DPA cotton bundle (STV 474). The imageshows mostly green tones, which correspond to integrations with moderate—low intensity for the986 cm−1 shoulder band (Figure 6ai). Three other tones are observed: an area with yellow (moderatehigh) integrations and two small areas with red (high integrations) and blue (low integrations).Figure 6aii presents infrared cotton bundle spectra from the indicated data groups in the chemicalimage. As expected, there is a progression in the intensity of the 986 cm−1 that parallels the intensity inthe chemical image. The spectrum from the blue region of the image shows the least intense shoulderband, and the spectra from the green to yellow to red areas show increasing shoulder band intensity.Since the majority of the chemical image is shaded green, it is not surprising that the representativespectrum from the green region shown in Figure 6aii displays great similarity to the average spectrumpresented for the 20 DPA STV474 bundle shown in Figure 5aii. A normalized chemical image of a22 DPA STV474 cotton bundle shows a more uniform composition (Figure 6bi). While there are minorchanges in the composition, the majority of the chemical image represents bundle sections that show amoderately high integration for the 986 cm−1 shoulder band. There are, however, some sections thatshow green and yellow integrations, indicative of less developed cotton fibers. The spectral differencebetween the green and red section is small, but perceptible in Figure 6bii. Noticeably, the rapid changein 986 cm−1 shoulder band intensity observed between the 20 and 22 DPA chemical images coincideswith the change observed in Figure 5aii, aiii. Additional chemical images for the 18 DPA and maturefiber bundle sample are shown in Figure S4. Our results confirm that normalized chemical images forcotton bundles can be used to visually monitor cell wall development and to depict the diversity ofsample composition.
4. Conclusions
An FTIR instrument equipped with a single reflection ATR accessory and FPA detector can beused to create chemical images of cotton fiber bundles. Previous IR imaging studies that examinedlarge numbers of cotton fibers relied either on point by point examinations or on FTIR spectra with lowsensitivity (low signal-to-noise ratio). In this study, FTIR spectra and chemical images with improvedsensitivity were acquired by the grouping of multiple adjacent pixels in the detector array. The singlereflectance FPA technique was employed to examine cotton fibers undergoing secondary cell walldevelopment, and to visualize the distribution of this developmental process in a cotton fiber bundle.Observed changes to the C–O bending region, matched previous FTIR studies of developing cottonfibers. These examinations were quick (~10 min), produced a sampling distribution, required little inthe way of sample size (~500 mg), and were not destructive to the cotton samples. While preliminary,our results point to the use of IR chemical imaging as a tool in the examination of cotton fiber bundles.
Disclaimer: Mention of a product does not constitute a warranty by the U.S. Department of Agriculture and doesnot imply its approval to the exclusion of other products that may also be suitable.
Supplementary Materials: The following are available online at www.mdpi.com/2079-6439/4/4/27/s1.
Acknowledgments: The authors thank H.N. Cheng and Chris Mattison for their suggestions on the manuscript.
Author Contributions: Michael Santiago Cintrón performed all FT-IR experiments and interpreted the results.Doug J. Hinchliffe, Gregory N. Thyssen, Linghe Zeng, and Crista Madison designed the cotton cultivationprogram. In addition, they cultivated, harvested, ginned, and prepared all cotton samples used in the study.Joseph G. Montalvo and Terri von Hoven performed all fiber quality measurements and interpreted their results.Michael Santiago Cintrón, James E. Rodgers, Doug J. Hinchliffe, Joseph G. Montalvo, and Terri von Hovenconceived significant parts of the research, and wrote portions of the manuscript.
Conflicts of Interest: The authors declare no conflict of interest.
Fibers 2016, 4, 27 10 of 11
References
1. Agricultural-Marketing-Service. The Classification of Cotton; United States Department of Agriculture:Washington, DC, USA, 1995.
2. Wakelyn, P.J.; Bertoniere, N.R.; French, A.D.; Thibodeaux, D.P.; Triplett, B.A.; Rouselle, M.-A.; Goynes, W.R.;Edwards, J.V.; Hunter, L.; McAllister, D.D.; et al. Cotton Fiber Chemistry and Technology; CRC Press: New York,NY, USA, 2007.
3. McCreight, D.J.; Feil, R.W.; Booterbaugh, J.H.; Backe, E.E. Test instruments and quality assurance methods.In Short Staple Yarn Manufacturing; Carolina Academic Press: Durham, NC, USA, 1997; pp. 439–480.
4. Naylor, G.R.; Delhom, C.D.; Cui, X.; Gourlot, J.-P.; Rodgers, J. Understanding the influence of fiber lengthon the high volume instrument™ measurement of cotton fiber strength. Text. Res. J. 2014, 84, 979–988.[CrossRef]
5. Turhan, Y.; Toprakci, O. Comparison of high-volume instrument and advanced fiber information systemsbased on prediction performance of yarn properties using a radial basis function neural network. Text. Res. J.2012, 83, 130–147. [CrossRef]
6. Drieling, A.; Gourlot, J.-P. Cotton/worldwide harmonisation. In Industrial Applications of Natural Fibres:Structure, Properties and Technical Applications; Müssig, J., Ed.; Wiley: Hoboken, NJ, USA, 2010; pp. 353–370.
7. Liu, Y.; Thibodeaux, D.; Gamble, G. Development of fourier transform infrared spectroscopy in direct,non-destructive, and rapid determination of cotton fiber maturity. Text. Res. J. 2011, 81, 1559–1567.
8. Montalvo, J.; VonHoven, T. Analysis of cotton. In Near-Infrared Spectroscopy in Agriculture; Roberts, C.A.,Workman, J., Reeves, J.B., Eds.; American Society of Agronomy, Agronomy Monograph: Madison, WI, USA,2004; Volume N0. 44, pp. 671–728.
9. Rodgers, J.; Montalvo, J.; Davidonis, G.; VonHoven, T. Near infrared measurement of cotton fiber micronaire,maturity and fineness-A comparative investigation. Text. Res. J. 2010, 80, 780–793. [CrossRef]
10. Abidi, N.; Cabrales, L.; Hequet, E. Fourier transform infrared spectroscopic approach to the study of thesecondary cell wall development in cotton fiber. Cellulose 2010, 17, 309–320. [CrossRef]
11. Abidi, N.; Hequet, E.; Cabrales, L. Applications of fourier transform infrared spectroscopy to study cottonfibers. In Fourier Transforms-New Analytical Approaches and Ftir Strategies; Nikolic, G., Ed.; InTech: Cairo,Egypt, 2011.
12. Abidi, N.; Hequet, E.; Cabrales, L.; Gannaway, J.; Wilkins, T.; Wells, L.W. Evaluating cell wallstructure and composition of developing cotton fibers using fourier transform infrared spectroscopy andthermogravimetric analysis. J. Appl. Polym. Sci. 2008, 107, 476–486. [CrossRef]
13. Fahrenfort, J. Attenuated total reflection. Spectrochim. Acta Mol. Biomol. Spectrosc. 1989, 45, 251–263.[CrossRef]
14. Oberg, K.A.; Fink, A.L. A new attenuated total reflectance fourier transform infrared spectroscopy methodfor the study of proteins in solution. Anal. Biochem. 1998, 256, 92–106. [CrossRef] [PubMed]
15. Hind, A.R.; Bhargava, S.K.; McKinnon, A. At the solid/liquid interface: FTIR/ATR-The tool of choice.Adv. Colloid Interface Sci. 2001, 93, 91–114. [CrossRef]
16. Offermann, V.; Grosse, P.; Feuerbacher, M.; Dittmar, G. Experimental aspects of attenuated total reflectancespectroscopy in the infrared. Vib. Spectrosc. 1995, 8, 135–140. [CrossRef]
17. Fortier, C.A.; Rodgers, J.E.; Cintrón, M.S.; Cui, X.; Foulk, J.A. Identification of cotton and cotton trashcomponents by fourier transform near-infrared spectroscopy. Text. Res. J. 2011, 81, 230–238. [CrossRef]
18. Mustafic, A.; Jiang, Y.; Li, C. Cotton contamination detection and classification using hyperspectralfluorescence imaging. Text. Res. J. 2016, 86, 1574–1584. [CrossRef]
19. Lang, P.L.; Katon, J.E.; O’Keefe, J.F.; Schiering, D.W. The identification of fibers by infrared and ramanmicrospectroscopy. Microchem. J. 1986, 34, 319–331. [CrossRef]
20. Himmelsbach, D.S.; Khalili, S.; Akin, D.E. The use of FT-IR microspectroscopic mapping to study the effectsof enzymatic retting of flax (Linum usitatissimum L) stems. J. Sci. Food. Agric. 2002, 82, 685–696. [CrossRef]
21. McCann, M.C.; Hammouri, M.; Wilson, R.; Belton, P.; Roberts, K. Fourier transform infraredmicrospectroscopy is a new way to look at plant cell walls. Plant Physiol. 1992, 100, 1940–1947. [CrossRef][PubMed]
22. Tungol, M.W.; Bartick, E.G.; Montaser, A. The development of a spectral data base for the identification offibers by infrared microscopy. Appl. Spectrosc. 1990, 44, 543–549. [CrossRef]

Fibers 2016, 4, 27 11 of 11
23. Wang, Q.; Fan, X.; Gao, W.; Chen, J. Characterization of bioscoured cotton fabrics using FT-IR ATRspectroscopy and microscopy techniques. Carbohydr. Res. 2006, 341, 2170–2175. [CrossRef] [PubMed]
24. Tungol, M.W.; Bartick, E.G.; Montaser, A. Forensic examination of synthetic textile fibers by microscopicinfrared spectrometry. In Practical Guide to Infrared Microspectroscopy; Humecki, H.J., Ed.; Marcel Dekker, Inc.:New York, NY, USA, 1995; pp. 245–286.
25. Lewis, E.N.; Treado, P.J.; Reeder, R.C.; Story, G.M.; Dowrey, A.E.; Marcott, C.; Levin, I.W. Fourier transformspectroscopic imaging using an infrared focal-plane array detector. Anal. Chem. 1995, 67, 3377–3381.[CrossRef] [PubMed]
26. Cintrón, M.S.; Fortier, C.; Hinchliffe, D.J.; Rodgers, J.E. Chemical imaging of secondary cell wall developmentin cotton fibers using a mid-infrared focal-plane array detector. Text. Res. J. 2016. [CrossRef]
27. Fortier, C.; Cintròn, M.S.; Rodgers, J. Fourier transform infrared macro-imaging of botanical cotton trash.AATCC J. Res. 2015, 2, 1–6. [CrossRef]
28. De-Juan, A.; Piqueras, S.; Maeder, M.; Hancewicz, T.; Duponchel, L.; Tauler, R. Chemometric tools for imageanalysis. In Infrared and Raman Spectroscopic Imaging, 2nd ed.; Salzer, R., Siesler, H.W., Eds.; Wiley-VCH:Weinheim, Germany, 2014.
29. Maréchal, Y.; Chanzy, H. The hydrogen bond network in Iβ cellulose as observed by infrared spectrometry.J. Mol. Struct. 2000, 523, 183–196. [CrossRef]
30. Cintrón, M.S.; Hinchliffe, D. FT-IR examination of the development of secondary cell wall in cotton fibers.Fibers 2015, 3. [CrossRef]
31. Hoven, T.V.; Montalvo, J.; Santiago, M.C.; Dowd, M.; Armijo, C.B.; Byler, R.K. Fundamental researchon spiking, recovery and understanding seed coat nep counts in AFIS analysis of pre-opened cotton.Text. Res. J. 2016. [CrossRef]
32. Kim, H.J.; Rodgers, J.; Delhom, C.; Cui, X. Comparisons of methods measuring fiber maturity and finenessof upland cotton fibers containing different degrees of fiber cell wall development. Text. Res. J. 2014, 84,1622–1633. [CrossRef]
© 2016 by the authors; licensee MDPI, Basel, Switzerland. This article is an open accessarticle distributed under the terms and conditions of the Creative Commons Attribution(CC-BY) license (http://creativecommons.org/licenses/by/4.0/).


![Investigation of naturally coloured cotton of different ... · cal data gathered in Uster® Statistics [17]. n Results and discussion Quality of naturally coloured cotton according](https://img.dokumen.tips/doc/110x75/5e67f6e9cf8c39763f0ddb92/investigation-of-naturally-coloured-cotton-of-different-cal-data-gathered-in.jpg)