Embed Size (px)
Citation preview

EVALUATION OF THE USE OF ISOTESTER IN MEASURING COTTON FIBER
PROPERTIES
by
DEEPAK KHATRI
(Under the Direction of Helen H. Epps)
ABSTRACT
Cotton remains one of the most important natural fibers. Color of the cotton fibers and
trash associated with it, are primarily of interest in this research. The IsoTester, a gin based
classing instrument, was used for measuring cotton color and trash particles. Schaffner
Technologies developed the IsoTester based on the long term vision that Gin-based classing will
be implemented by 2020. In addition to Rd and + b, cotton color is also defined in terms of CIE
L* a* b* and in this research cotton color measured from IsoTester is compared with the
measurements obtained from two spectrophotometers - Hunter Lab LabScan XE and Macbeth
Optiview. In addition to this, repeatability and reproducibility of IsoTester is measured.
INDEX WORDS: Cotton, IsoTester, Gin based classing, CIE L* a* b*, Hunter Lab LabScan
XE, Macbeth Optiview, Repeatability and Reproducibility
EVALUATION OF THE USE OF ISOTESTER IN MEASURING COTTON FIBER
PROPERTIES
by
DEEPAK KHATRI
Bachelor of Engineering, SVITS, India, 1999
A Thesis Submitted to the Graduate Faculty of The University of Georgia in Partial Fulfillment
of the Requirements for the Degree
MASTER OF SCIENCE
ATHENS, GEORGIA
2005

© 2005
Deepak Khatri
All Rights Reserved
EVALUATION OF THE USE OF ISOTESTER IN MEASURING COTTON FIBER
PROPERTIES
by
DEEPAK KHATRI
Major Professor: Dr. Helen H. Epps
Committee: Dr. Karen Leonas Dr. J. Nolan Etters
Electronic Version Approved: Maureen Grasso Dean of the Graduate School The University of Georgia May 2005

ACKNOWLEDGEMENTS
It has been a great experience for me to complete this thesis. I would like to extend my
thanks and appreciation to all those who helped me and encouraged me during this process.
First of all, I wish to express my sincere gratitude to Dr. Helen Epps, my major professor.
During my graduate studies, Dr. Epps has been a great source of inspiration and encouragement.
Her kindness and guidance paved my way to successfully finishing the graduate degree.
I am also grateful to my committee members, Dr. Karen Leonas and Dr. Nolan Etters,
who have also contributed greatly to my success. Dr. Leonas helped me a lot with conceptual
framework of my proposal, which made a firm background for my thesis success. I am thankful
to Dr. Etters for his support in analyzing the data of my research.
Special appreciation goes to lab technician Cindy Jones and to my colleague Xialing Xu
for their time and support.
Finally, I would like to express my thanks to my family, friends and all those who gave
me support and help.
v
TABLE OF CONTENTS
Page
ACKNOWLEDGEMENTS.............................................................................................................v
LIST OF TABLES....................................................................................................................... viii
LIST OF FIGURES ....................................................................................................................... ix
CHAPTER
1 INTRODUCTION .........................................................................................................1
OBJECTIVES ...........................................................................................................3
HYPOTHESES .........................................................................................................3
ASSUMPTIONS .......................................................................................................3
LIMITATIONS .........................................................................................................4
2 LITERATURE REVIEW ..............................................................................................5
COTTON FIBER ......................................................................................................5
QUALITY MEASUREMENT SYSTEMS...............................................................6
ISOTESTER: GIN BASED CLASSING MACHINE ............................................12
REPEATIBILITY AND REPRODUCIBILITY ....................................................16
3 METHODS AND PROCEDURE................................................................................17
MATERIALS ..........................................................................................................17
PROCEDURE .........................................................................................................17
4 RESULTS AND DISCUSSION..................................................................................20
5 CONCLUSIONS AND RECOMMENDATIONS ......................................................27
vi
REFERENCES ..............................................................................................................................29
APPENDICES ...............................................................................................................................31
A CIE L* a* b* data of cotton fiber from three color measurement systems ................31
B Data for measuring repeatability and reproducibility of IsoTester for CIE L* ...........34
C The effect of trash removal on CIE L* a* b* value of cotton fiber.............................35
vii

LIST OF TABLES
Page
Table 1: Raw Cotton Composition . ................................................................................................6
Table 2: Fiber quality data for classing purposes. .........................................................................15
Table 3: ANOVA table. .................................................................................................................19
Table 4: Regression analysis of CIE L* ........................................................................................21
Table 5: Regression analysis of CIE b*.........................................................................................22
Table 6: Regression analysis of CIE a*. ........................................................................................23
Table 7: Measurement system repeatability and reproducibility of IsoTester for CIE L*. ...........25
Table 8: Measurement system repeatability and reproducibility of IsoTester for CIE a*.............26
viii

LIST OF FIGURES
Page
Figure 1: Official color grades for American upland cotton............................................................8
Figure 2: Calculation of Tristimulus values...................................................................................10
Figure 3: Opponent color theory....................................................................................................11
Figure 4: CIE L* a* b* Color space ..............................................................................................12
Figure 5: IsoTester. ........................................................................................................................14
ix
CHAPTER 1
INTRODUCTION
Cotton is the most used textile fiber in the world. Its current market share is 56 percent
for all fibers used for apparel and home furnishings and sold in the U.S (1). The Cotton industry
is truly one of America’s cornerstone industries with the growing popularity of cotton in
nonwoven textiles and personal care items. It is generally recognized that most consumers prefer
cotton personal care items to those containing synthetic fibers. Cotton color plays an important
role in price – quality relationship in the market. Textile processing is influenced by the trash
components found in cotton bales, which are inhomogeneous in color and contaminated with
troublesome trash.
Traditionally, cotton grade has been based on four physical properties: color, trash,
preparation, and extraneous material (2). In the USDA system, the reflectance (Rd) and the
degree of yellowness (+b) describe cotton color. Degree of reflectance shows the brightness of
the sample and yellowness depicts the degree of cotton pigmentation. Each color code is
represented by a defined area located in a Nickerson-Hunter cotton colorimeter diagram. The
color of the fibers is affected by climatic conditions, impact of insects and fungi, type of soil,
storage conditions etc. There are five recognized groups of color: white, gray, spotted, tinged,
and yellow stained. As the color of cotton deteriorates, the processability of the fibers decreases.
Work at the University of Tennessee has led to color measurement using both a spectrometer
CIE-based average color measurement and a color uniformity measurement using image analysis
to improve the accuracy and provide additional measurement for color grading (3).
1
Trash is a measure of the amount of non-lint material, such as leaf and bark, in cotton.
Trash content is assessed from scanning the cotton sample surface with a video- camera and
calculating the percentage of the surface area occupied by trash particles. The values of trash
content should be within the range from 0 to 1.6%. Trash content is highly correlated to leaf
grade of the sample. Leaf grade is provided visually as the amount of cotton plant particles
within the sample. There are seven leaf grades from one to seven and one below grade, eight.
The term preparation describes the smoothness of the sample, i.e., lack of lumps and twists. The
United States Department of Agriculture (USDA) and Agricultural Marketing Service (AMS),
classes and grades cotton. These cotton fiber measurements have progressed from a subjective
human classer to the objective High Volume Instrument (HVI).
The purpose of this study can be seen in the proposed context that by 2020 cotton
classing will be done at the gin and warehouses under the AMS supervision and the classing will
be based entirely on instrumental measurements (2, 11, 12, 13). Frederick Michael Shofner and
Christopher Kyle Shofner (2, 13) envisioned that the Commission Internationale de l'Eclairage
(CIE) color measurement will replace current USDA method of defining cotton color. CIE
(Commission Internationale de l'Eclairage) is the primary international organization concerned
with color and color measurement. Therefore it becomes important to study the color of cotton
fibers in terms of CIE L* a* b* as measured by IsoTester and other color measuring instruments,
for example spectrophotometers. IsoTester, a gin based classing machine introduced by
Schaffner Technologies, Inc., was used in this study. The IsoTester® is a stand-alone instrument
capable of measuring color, trash, and moisture of each sample produced at the gin. (Other
available measurement modules are length, micronaire, neps, stickiness, and GinWizard.)
2
OBJECTIVES
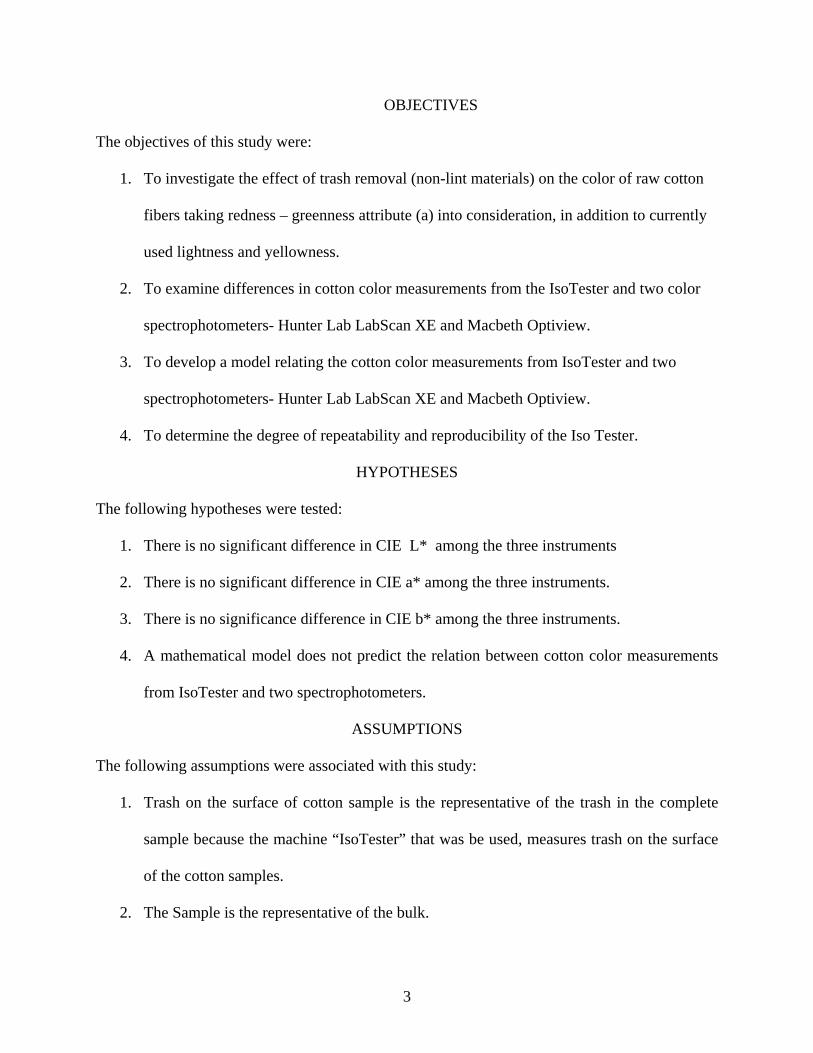
The objectives of this study were:
1. To investigate the effect of trash removal (non-lint materials) on the color of raw cotton
fibers taking redness – greenness attribute (a) into consideration, in addition to currently
used lightness and yellowness.
2. To examine differences in cotton color measurements from the IsoTester and two color
spectrophotometers- Hunter Lab LabScan XE and Macbeth Optiview.
3. To develop a model relating the cotton color measurements from IsoTester and two
spectrophotometers- Hunter Lab LabScan XE and Macbeth Optiview.
4. To determine the degree of repeatability and reproducibility of the Iso Tester.
HYPOTHESES
The following hypotheses were tested:
1. There is no significant difference in CIE L* among the three instruments
2. There is no significant difference in CIE a* among the three instruments.
3. There is no significance difference in CIE b* among the three instruments.
4. A mathematical model does not predict the relation between cotton color measurements
from IsoTester and two spectrophotometers.
ASSUMPTIONS
The following assumptions were associated with this study:
1. Trash on the surface of cotton sample is the representative of the trash in the complete
sample because the machine “IsoTester” that was be used, measures trash on the surface
of the cotton samples.
2. The Sample is the representative of the bulk.
3

LIMITATIONS
There were two main limitations to this study:
1. Because trash was removed manually, complete trash removal was not possible.
2. Moisture affects the measurements, and moisture was not controlled in this study.
3. From the pretest conducted on the IsoTester, it was found that the instrument showed
zero percentage area for trash particles but the samples still contains trash particles. This
observation can be explained by the fact that the area of trash particles is so small that the
instrument cannot detect the trash particles. So these infinitely small trash particles still
influence the color measurements.
4
CHAPTER 2
LITERATURE RIVIEW
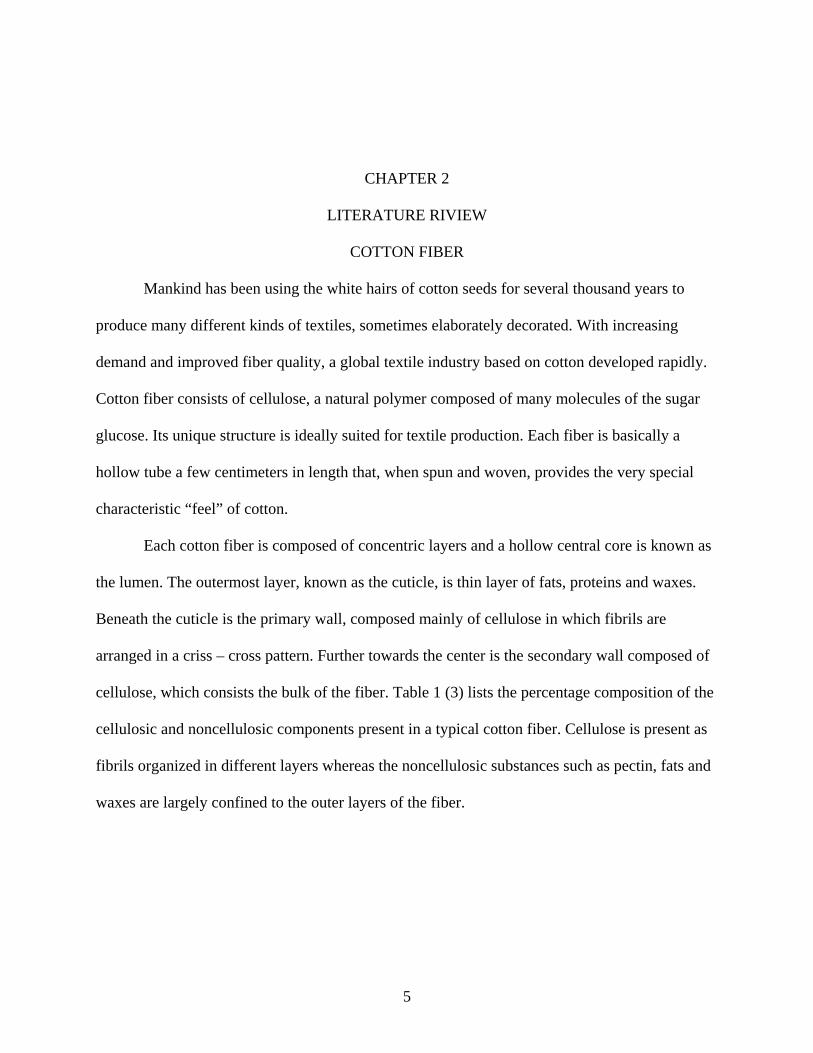
COTTON FIBER
Mankind has been using the white hairs of cotton seeds for several thousand years to
produce many different kinds of textiles, sometimes elaborately decorated. With increasing
demand and improved fiber quality, a global textile industry based on cotton developed rapidly.
Cotton fiber consists of cellulose, a natural polymer composed of many molecules of the sugar
glucose. Its unique structure is ideally suited for textile production. Each fiber is basically a
hollow tube a few centimeters in length that, when spun and woven, provides the very special
characteristic “feel” of cotton.
Each cotton fiber is composed of concentric layers and a hollow central core is known as
the lumen. The outermost layer, known as the cuticle, is thin layer of fats, proteins and waxes.
Beneath the cuticle is the primary wall, composed mainly of cellulose in which fibrils are
arranged in a criss – cross pattern. Further towards the center is the secondary wall composed of
cellulose, which consists the bulk of the fiber. Table 1 (3) lists the percentage composition of the
cellulosic and noncellulosic components present in a typical cotton fiber. Cellulose is present as
fibrils organized in different layers whereas the noncellulosic substances such as pectin, fats and
waxes are largely confined to the outer layers of the fiber.
5

Table – 1: Raw Cotton Composition (3)
80-90% Cellulose 6-8% Water
0.5 - 1% Waxes and fats 0 - 1.5% Proteins 4 - 6% Hemicelluloses and pectin’s
1 - 1.8% Ash
QUALITY MEASUREMENT SYSTEMS
There is a continuous demand for improved cotton fiber quality. Cotton fiber quality is
determined by various parameters such as the tearing strength of the cotton fiber, by the overall
length and length uniformity of the cotton fibers, color, and trash and by the circumference,
maturation and moisture content of the harvested cotton fiber. All these characteristics influence
the spinning of the cotton fiber into yarn. Practically all cotton grown in the United States is
classed by USDA (7). All instrument measurements currently utilized in USDA cotton
classification are from Uster High Volume Instrument (HVI) systems (High Volume Instrument
(HVI) is patented by Uster Technologies). Cotton fiber properties primarily of interest in this
research were cotton color and trash content.
The USTER® HVI classing is the standard classification system in the United States and
also for the international cotton trade. USTER® HVI is used for measurement of the most
important cotton fiber properties of micronaire, fiber length (UHML), uniformity, short fiber
index, strength, elongation, color, trash content and degree of maturity. HVI classing has been
available to all growers since 1981. The fiber properties primarily of interest in this research are
cotton color and trash content. The color of cotton is measured by the degree of reflectance (Rd)
6
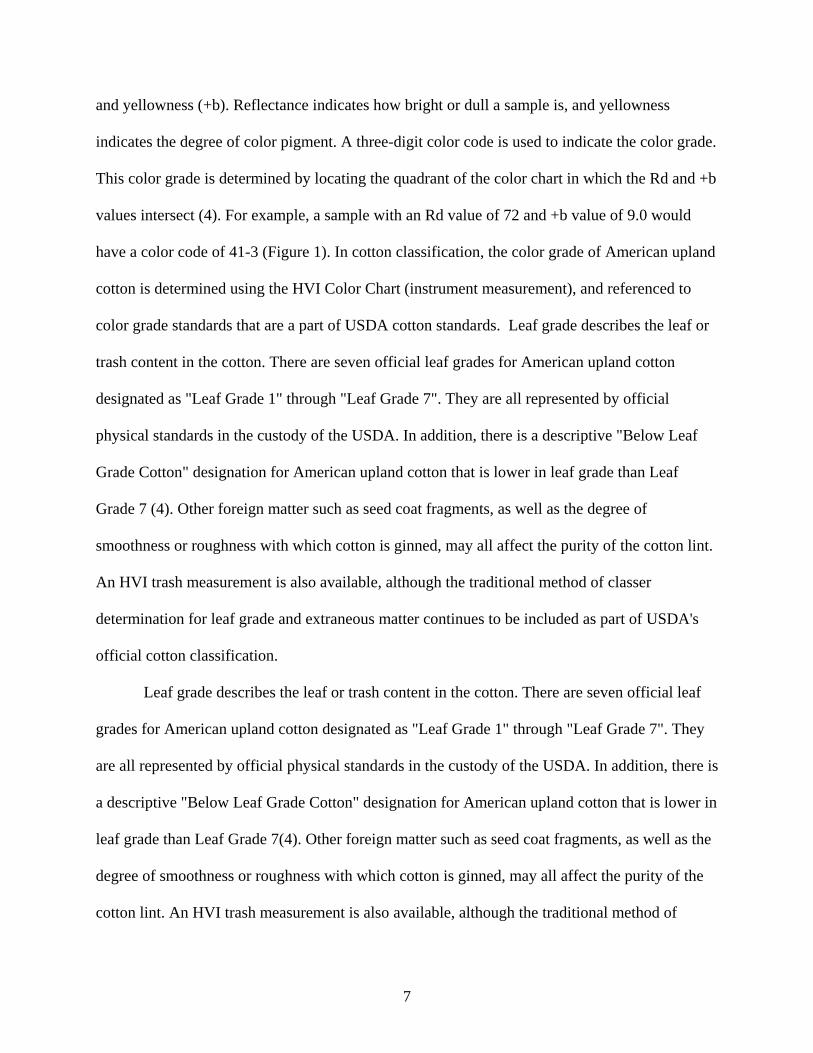
and yellowness (+b). Reflectance indicates how bright or dull a sample is, and yellowness
indicates the degree of color pigment. A three-digit color code is used to indicate the color grade.
This color grade is determined by locating the quadrant of the color chart in which the Rd and +b
values intersect (4). For example, a sample with an Rd value of 72 and +b value of 9.0 would
have a color code of 41-3 (Figure 1). In cotton classification, the color grade of American upland
cotton is determined using the HVI Color Chart (instrument measurement), and referenced to
color grade standards that are a part of USDA cotton standards. Leaf grade describes the leaf or
trash content in the cotton. There are seven official leaf grades for American upland cotton
designated as "Leaf Grade 1" through "Leaf Grade 7". They are all represented by official
physical standards in the custody of the USDA. In addition, there is a descriptive "Below Leaf
Grade Cotton" designation for American upland cotton that is lower in leaf grade than Leaf
Grade 7 (4). Other foreign matter such as seed coat fragments, as well as the degree of
smoothness or roughness with which cotton is ginned, may all affect the purity of the cotton lint.
An HVI trash measurement is also available, although the traditional method of classer
determination for leaf grade and extraneous matter continues to be included as part of USDA's
official cotton classification.
Leaf grade describes the leaf or trash content in the cotton. There are seven official leaf
grades for American upland cotton designated as "Leaf Grade 1" through "Leaf Grade 7". They
are all represented by official physical standards in the custody of the USDA. In addition, there is
a descriptive "Below Leaf Grade Cotton" designation for American upland cotton that is lower in
leaf grade than Leaf Grade 7(4). Other foreign matter such as seed coat fragments, as well as the
degree of smoothness or roughness with which cotton is ginned, may all affect the purity of the
cotton lint. An HVI trash measurement is also available, although the traditional method of
7
classer determination for leaf grade and extraneous matter continues to be included as part of
USDA's official cotton classification. Trash in raw cotton is measured by a video scanner,
commonly referred to as a trash meter. It is a measure of leaf and other elements such as grass
and bark. The surface of the cotton sample is scanned by the camera and the percentage of the
surface area occupied by trash particles is calculated.
Figure 1: Official color grades for American upland cotton (4)
8

In this research two cotton fiber properties were investigated, namely – trash content and
color. Color of the cotton fibers is also defined in terms of CIE L * a * b*, measured by
spectrophotometers. Two spectrophotometers were used – Macbeth Color-Eye 7000A and
Hunter Lab Scan. Spectrophotometers measure the reflectance from, or the transmittance
through, materials as a function of wavelength. Color Eye 7000A is a bench top
spectrophotometer with d/8O sphere illumination geometry, and has the capability to measure
both specular and total transmission. It measures reflection at 10nm intervals from 360nm to 750
nm. Four measurement aperture sizes are available to provide versatility in dealing with various
sample sizes. Illuminant D65 simulates north sky daylight and is used for general evaluation of
color, metamersim testing, providing visual correlation with spectrophotometric instrumental
reading, and conformance with European and Japanese standard. Color temperature for D65 is
6500K. Illuminant C simulates the CIE average daylight with color temperature of 6770K (5).
Each color has its own distinct appearance, based on three elements: hue, chroma and
value (lightness). By describing a color using these three attributes, it is possible to accurately
identify a particular color and distinguish it from any other. In 1905, artist Albert H. Munsell
originated a color ordering system - or color scale based on human perception. The Munsell
System assigns numerical values to the three properties of color: hue, value and chroma.
Adjacent color samples represent equal intervals of visual perception (5).
The CIE, or Commission Internationale de l'Eclairage (translated as the International
Commission on Illumination), is the body responsible for international recommendations for
photometry and colorimetry. The CIE Color Systems use three coordinates to locate a color in a
color space. These color spaces include CIE XYZ, CIE L*a*b* and CIE L*C*h. The CIE
Tristimulus Values (XYZ) are calculated from these CIE Standard Observer functions, taking
9

into account the type of illumination and reflectance of the sample. At each wavelength x, y, and
z are multiplied by the spectral energy emitted by the light source. Then that value is multiplied
by the reflectance of the sample at each wavelength. The values for all the wavelengths are then
summed (Figure 2). There are two problems with the specification of colors in terms of
tristimulus values and chromaticity space. Firstly, this specification is not easily interpreted in
terms of the psychophysical dimensions of color perception namely, brightness, hue, and chroma
(5). While Y relates to value (lightness), X and Z do not correlate to hue and chroma. Secondly,
the XYZ system and the associated chromaticity diagrams are not perceptually uniform. To
overcome these limitations, the CIE recommended two alternate, uniform color scales: CIE 1976
(L*a*b*) and CIE LCH (L*C*h). The latter was intended for use with self-luminous colors
while the former was intended for use with opaque surface colors.
Figure 2: Calculation of Tristimulus values (7)
These color scales are based on the opponent-color theory of color vision (Figure 3).
Opponent color theory developed by Ewald Hering (1920/1964) states that there are three
opposing color pairs: blue/yellow, red/green, and black/white. Consistent with this theory, no
two members of a pair can be seen at the same location, which explains why it is not possible to
10

experience such colors as "bluish yellow" or "reddish green". This theory also helps to explain
the after-image effect (if the eye is adapted to a yellow stimulus the removal of the stimulus
leaves a blue sensation or after-effect) and the non-intuitive fact that an additive mixture of red
and green light gives yellow and not a reddish-green.
Figure 3: Opponent color theory (9)
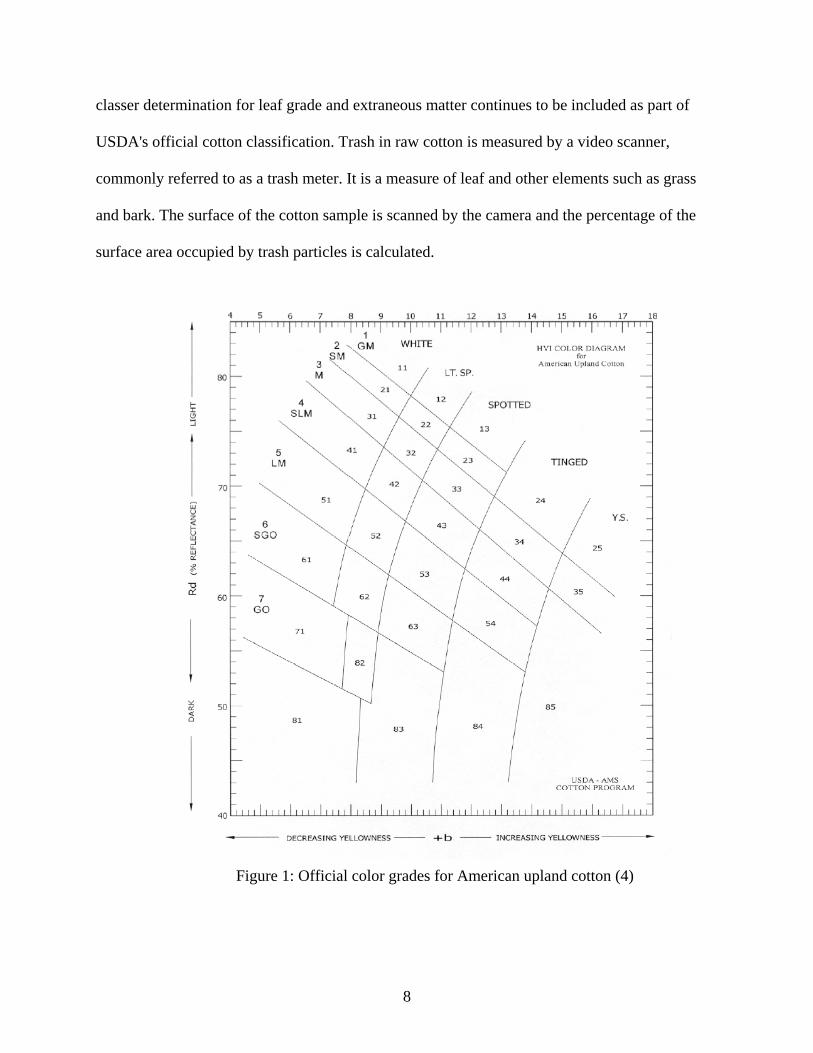
CIELAB describes the specification of color perceptions in terms of a three-dimensional
space (Figure 4). The L*-axis is known as the lightness and extends from 0 (black) to 100
(white). The other two coordinates a* and b* represents redness-greenness and yellowness-
blueness respectively. Samples for which a* = b* = 0 are achromatic and thus the L*-axis
represents the achromatic scale of grey from black to white. The quantities L*, a*, and b* are
obtained from the tristimulus values according to the following transformations (5):
L* = 116(Y/Yn)1/3 -16,
a* = 500[(X/Xn)1/3 - (Y/Yn)1/3],
b* = 200[(Y/Yn)1/3 - (Z/Zn)1/3],
11
where Xn, Yn, and Zn are the values of X, Y, and Z for the illuminant that was used for the
calculation of X, Y, and Z of the sample, and the quotients X/Xn,Y/Yn, and Z/Zn are all greater
than 0.008856. When any of the quotients are less than or equal to 0.008856 a slightly different
set of equations is used.
Figure 4: CIE L* a* b* Color space (12)
ISOTESTER: GIN BASED CLASSING INSTRUMENT
Gin-Based Classing, by definition, means classing cotton locally (in gins, warehouses, or
mills) and transfer of the fiber quality measurements, including images, over the internet to the
government-implemented classing office. The objective of the grading and classing program for
cotton is to facilitate interstate and foreign commerce in cotton by providing official quality
determinations that aid in marketing. A great progress has been occurring in cotton quality
assessment for the last 20 years, during which a transition from human classing to instrumental
classing began with the introduction of high volume instrument (HVI) lines being installed in the
USDA/ AMS classing office. In 1991 USDA/ AMS added HVI instrumental measurement of
fiber quality, in combination with the human classer measurements. The cotton is being
12

classified by instruments, for micronaire, length and strength, and by human classers, for color
grade, trash, extraneous matter, and preparation (13). The system, operated by USDA, is one that
produces data that are accepted by all segments of the industry for both marketing and utilizing
the cotton in the spinning mills. In the current process of classing cotton, bale samples are taken
at the gin and sent to USDA classing office (CO), where samples are properly conditioned and
tested. The data form that area classing office are sent to the gin and to Memphis to be complied
into a national bank of HVI data. With the introduction of many fully automated measurement
systems like HVI Spectrum, AFIS, Fiber Lab, IsoTester, Premier Automated Rapid Tester
(ART), the concept of classing cotton at the gin is envisioned. Approximately 7 % of the US gins
have invested in process monitoring and process control technology, so the first step towards
Gin-based classing have already been made (14). These gins maximize the added value for their
Producers, yielding them on average 1.5 cents/pound and they provide better fiber and added
value for their Merchant and Spinner Customers (14). Technological advances in computers,
networks, Internet, and image-based measurement technology are in place to support Gin-based
Classing (GBC). Since trash is one of the fiber qualities most influenced by the gin, GBC can
move forward rapidly when the Human Classer is replaced with the instrument.
Schaffner Technologies developed the IsoTester and GinWizard System based on the
long term vision that Gin-based classing will be implemented by 2020 (Table 2). IsoTester, the
new name for the predecessor RapidTester, is a stand-alone instrument capable of measuring
color, trash, final bale moisture and length of cotton samples. Gin Wizard is a process monitoring
system and software program that can acquire and present fiber quality data from IsoTester and
as many gin processing parameters as desired. IsoTester robust design and its ability to operate in
any environment, particularly gins, in combination with GinWizard enables gins to perform
13

better job by controlling the amount of leaf, moisture, and length to avoid the discounts for the
producers and to provide higher quality and more useable fiber to the mill.
Iso Tester utilizes advanced digital image scanning algorithm for color, trash bark and
grass, and length measurements. Due to the size of the sample area, 64in2, the IsoTester utilizes
larger area than any other device for testing color and trash. Another advantage of the Iso Tester
color and trash module is the utilization of the physical USDA color grades samples (18). By
utilizing the USDA samples the machine requires no calibration. The trash module software
evaluates the same representative digital image for trash, as color, using segmentation and
pattern recognition. This image based system will certainly improve the measurement of
important fiber qualities over current methods and will accelerate replacement of the human
classer measurements with instrumental measurements. This instrument have smaller footprint
than HVI (high volume instrument) as shown in figure 5.
Figure 5: IsoTester
14

Table 2: Fiber quality data for classing purposes (13)
1980 Pre HVI
2000 Current USDA - AMS
2020
Human Measurements
Grade Extraneous Matter Preparation Stable
Color grade Leaf grade Extraneous Matter Preparation
Instrumental measurements Micronaire
Micronaire Length UHM LU Strength Tenacity Color Rd, +b HVI color grade Trash % area HVI leaf grade)
Micronaire Length UHM LU SFC Strength Tenacity Elongation Color CIE l* a* b* Color grade Trash % area Size, shape, color Type (extraneous matter) Moisture content Stickiness Maturity (fineness)
15

REPEATABILITY AND REPRODUCIBILITY (R&R)
Whether in a laboratory or a production line, taking measurements is a necessary part of
any process or system. An adequate level of precision of the system is critical as it determines
the capacity of the system to detect differences between the parts, samples, etc. It is therefore
necessary to quantify the detection capability of the measurement process which is achieved by
quantifying the variability therein. The total variation can be further decomposed into variation
due to the instrument, variation due to the operators and variation due to the parts or samples.
Although variations in the system can be caused by many different phenomena such as
calibration error, stability and linearity of the instrument, typical R&R studies focus on the
evaluation of repeatability and reproducibility of the process.
The main objectives in performing an R&R study are to identify and quantify the
absolute and relative contribution of each source of variation, to decide if the measurement
process is adequate or not and, if not, to correct the errors by recalibrating the instrument,
training the operators, other mathematical corrections, etc. Repeatability and Reproducibility
(R&R) studies analyses operator variation (repeatability) and Gage variation (reproducibility).
Repeatability is the variation when an operator measures the same sample with same gage
several times. Reproducibility is the additional variation observed when several operators use the
same gage to measure the same sample (16). The combination of both sources of variation is
referred as R&R. The term gage refers to any device used to make measurements and it refers to
IsoTester in this work.
16

CHAPTER 3
METHODS AND PROCEDURE
MATERIALS
Cotton samples used in this research were a part of the OVT (Official Variety Trial)
conducted at the UGA Department of Crop and Soil Sciences in Tifton, Georgia.
Spectrophotometers used in this research were Macbeth Color-Eye 7000A and Hunter Lab Scan.
The IsoTester, a gin based classing instrument, was used for all cotton measurements.
PROCEDURE
To investigate the effect of trash removal on the color of cotton fibers, samples from five
different varieties of cotton were analyzed and for each sample three replications were
performed. The varieties that were studied include FM 991RR, ST5599BR, DP424BII/R,
ST4793RR, T5599B/R, DP555B/RR, FM966LL, SG521RR and DELTAPEARL. For each
sample, cotton color was measured before and after trash removal and the change in CIE L* a*
b* was studied. To study the cotton color data from three different color measuring instruments
and to develop a model, samples from 15 different varieties of cotton were analyzed and for each
sample five replications were performed. For all the color measurements, illuminants D65 and C
were used at 10o observer.
Repeatability and Reproducibility of IsoTester was analyzed by ANOVA method as
described by Engineered Software Inc., Belleville, MI (16). Different fields often have different
incentives for performing R&R studies and there are different methods for performing R&R
17
study depending on the depth of understanding of the measurement performance required. The
R&R can be measured by using the following methods.
1. The Range Method
2. The Range Average Method
3. The ANOVA method The range method provides a quick approximation of measurement variability, whereas the
average and range method will determine both repeatability and reproducibility for a
measurement system. The ANOVA method is preferred to the average range method. The
ANOVA method quantifies the interaction between repeatability and reproducibility, and is
considered to be more accurate than the average and range method. In this R&R study of
IsoTester, ANOVA method as described by Engineered Software Inc., Belleville, MI, was used.
When conducting a study, the recommended procedure is to use 10 parts, 3 appraisers and 2
trials, for a total of 60 measurements (16). The ANOVA design used is a two-way, fixed effects
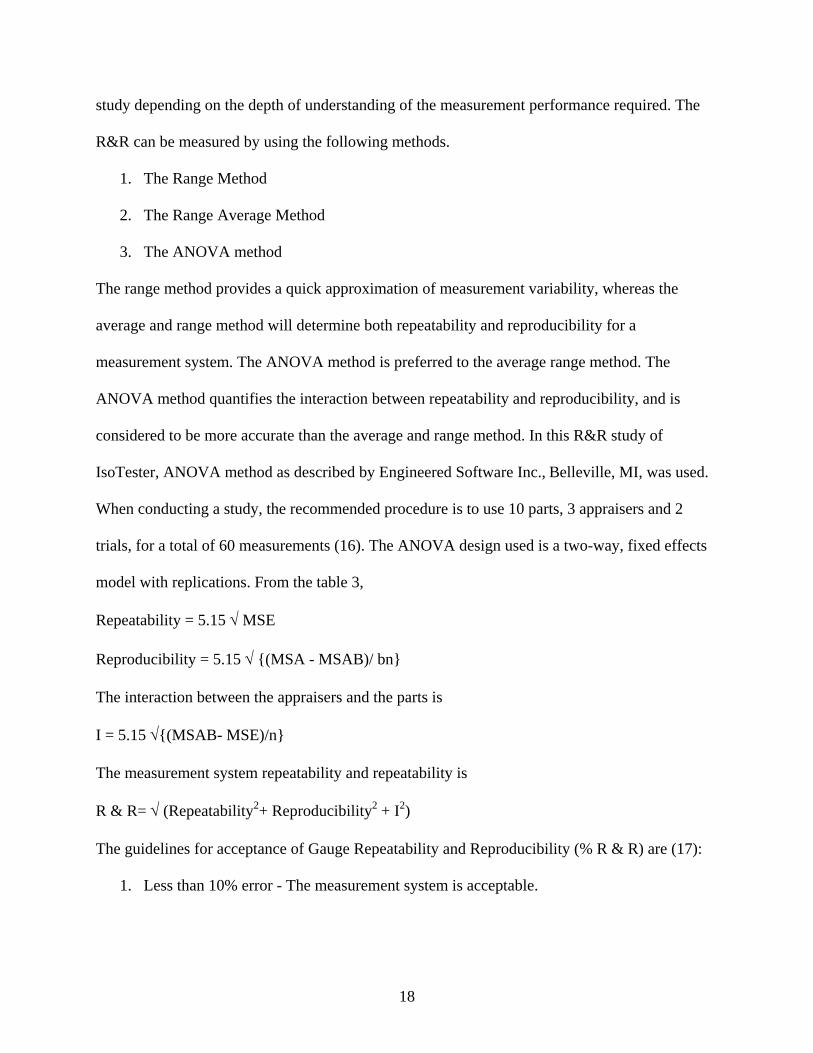
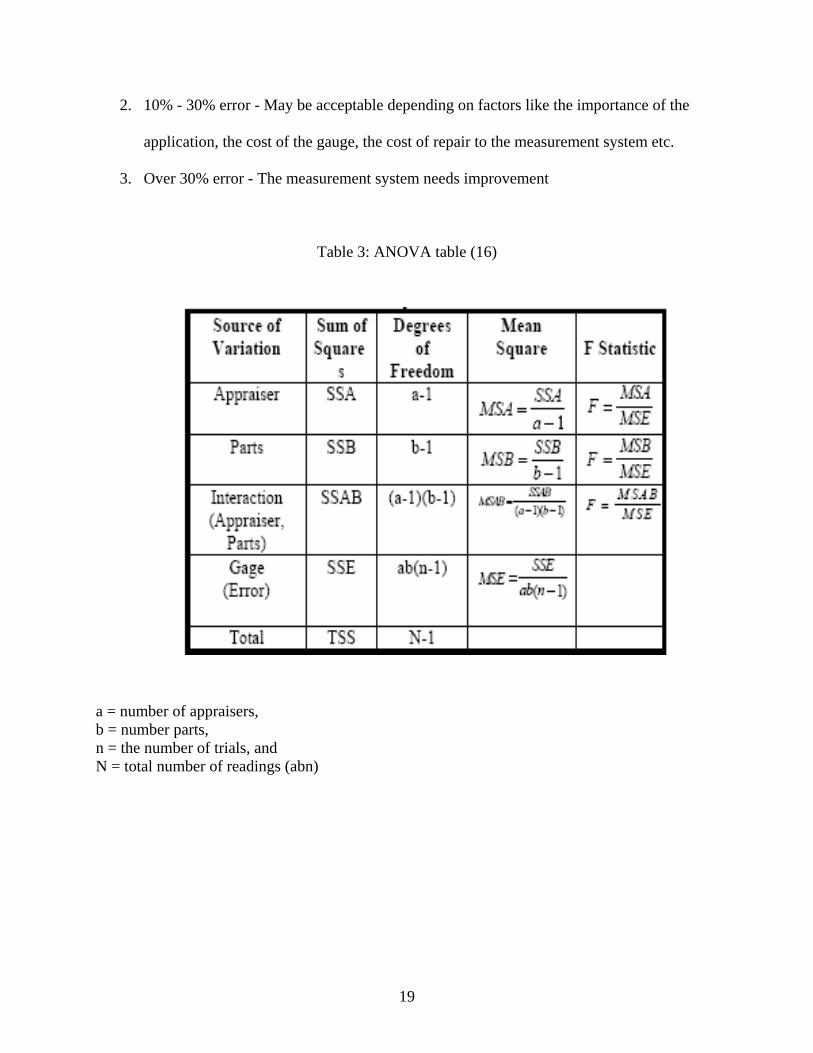
model with replications. From the table 3,
Repeatability = 5.15 √ MSE
Reproducibility = 5.15 √ {(MSA - MSAB)/ bn}
The interaction between the appraisers and the parts is
I = 5.15 √{(MSAB- MSE)/n}
The measurement system repeatability and repeatability is
R & R= √ (Repeatability2+ Reproducibility2 + I2)
The guidelines for acceptance of Gauge Repeatability and Reproducibility (% R & R) are (17):
1. Less than 10% error - The measurement system is acceptable.
18
2. 10% - 30% error - May be acceptable depending on factors like the importance of the
application, the cost of the gauge, the cost of repair to the measurement system etc.
3. Over 30% error - The measurement system needs improvement
Table 3: ANOVA table (16)
a = number of appraisers, b = number parts, n = the number of trials, and N = total number of readings (abn)
19
CHAPTER 4
RESULTS AND DISCUSSION
The data obtained from three different color measurement systems, IsoTester, Macbeth
Color eye 7000A and LabScan XE, were analyzed by regression analysis. The regression
analysis shows that the CIE L*, a* and b* values of cotton fiber were affected by the type of
color measurement system used. This can easily be explained on the basis of the different
techniques employed in these instruments for measuring color of the sample. MacBeth 7000A
and LabScan XE have different optical geometry. The term "geometry" refers to the placement
of a sample relative to the light source and measuring lens in a spectrophotometer. MacBeth
7000A has Diffuse/8° geometry while labscan has 0/450 geometry. For the tested samples, the
value of CIE L* from isotester ranged from 89.78 to 93.26, for macbeth this range was from
83.79 to 87.66 and for labscan CIE L* was from 81.25 to 84.82. CIE a* reading from isotester
ranged from 0.50 to 0.86, for macbeth this value was from 0.48 to 1.20 and for labscan, CIE a*
was from 0.70 to 1.41. CIE b* value from isotester was from 9.68 to 13.22, for macbeth this
value was from 6.76 - 9.31 and for labscan the value was from 8.30 to 10.66. For the complete
CIE L* a* b* data values from the three machines, refer to appendix A.
Regression analysis with color measuring system as independent variable and CIE L*, a*
and b* as dependent variables, were done to find out whether color measuring instrument
significantly affects CIE L*, a* and b* value of the cotton fiber. A model was developed to
predict the color value from IsoTester given the values from the two spectrophotometers. The
models were in the form as shown below:
20

L*Iso = α + β1 L*Mac + β2 L*Lab
a*Iso = α + β1 a*Mac + β2 a*Lab
b*Iso = α + β1 b*Mac + β2 b*Lab
Regression analysis between the CIE L* and color measuring system was done to analyze
the effect of color measuring system used on CIE L*. Regression analysis shows that CIE L* of
cotton fiber was affected by the type of color measuring system used (Table 4). R square of the
linear model is .92, indicating that 92 % of the variation in the CIE L* value could be attributed
to the type of color measuring system used.
Table 4: Regression Analysis of CIE L*
Source DF Sum of Squares
Mean Square F value Pr> F
Model 2 19.74049
9.87024
77.23
<.0001
Error 12 1.53355
0.12780
Corrected Total
14 21.83653
Root MSE 0.35749
R Square 0.9279
Dependent Mean 91.85800
Adj. R Square 0.9159
Coeff of Variation 0.38917
21
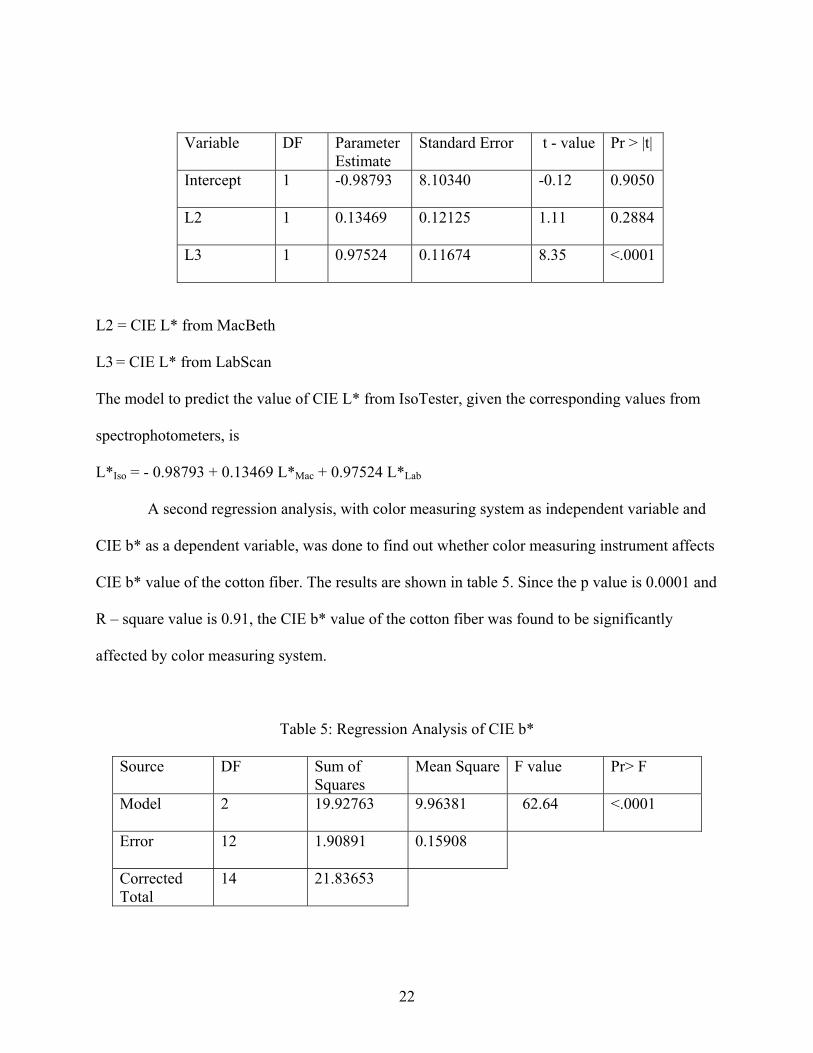
Variable
DF
Parameter Estimate
Standard Error t - value Pr > |t|
Intercept
1 -0.98793
8.10340
-0.12
0.9050
L2 1 0.13469
0.12125
1.11
0.2884
L3 1 0.97524
0.11674
8.35
<.0001
L2 = CIE L* from MacBeth
L3 = CIE L* from LabScan
The model to predict the value of CIE L* from IsoTester, given the corresponding values from
spectrophotometers, is
L*Iso = - 0.98793 + 0.13469 L*Mac + 0.97524 L*Lab
A second regression analysis, with color measuring system as independent variable and
CIE b* as a dependent variable, was done to find out whether color measuring instrument affects
CIE b* value of the cotton fiber. The results are shown in table 5. Since the p value is 0.0001 and
R – square value is 0.91, the CIE b* value of the cotton fiber was found to be significantly
affected by color measuring system.
Table 5: Regression Analysis of CIE b*
Source DF Sum of Squares
Mean Square F value Pr> F
Model 2 19.92763
9.96381
62.64
<.0001
Error 12 1.90891
0.15908
Corrected Total
14 21.83653
22

Root MSE 0.39884
R Square 0.9126
Dependent Mean 11.71333
Adj. R Square 0.8980
Coeff of Variation 3.40503
Variable
DF
Parameter Estimate
Standard Error
t - value Pr > |t|
Intercept
1 -0.00979
1.11743
-0.01
0.9932
b2 1 1.40256
0.26042
5.39
0.0002
b3 1 0.02423
0.23484
0.10
0.9195
b2 = CIE b* from Macbeth
b3 = CIE b* from LabScan
The model to predict the IsoTester CIE b* value from the corresponding values from
spectrophotometers, is
b*Iso = -0.00979 + 1.40256 b*Mac + 0.02423 b*Lab
The results of the regression analysis, with color measuring instrument as independent
variable and CIE a* of the cotton fiber, are shown in table 6
Table 6: Regression Analysis of CIE a*
Source
DF Sum of Squares
Mean Square F value Pr> F
Model 6 0.07470
0.01245
3.14
0.0690
Error 8 0.03174
0.00397
Corrected Total
14 0.10644
23
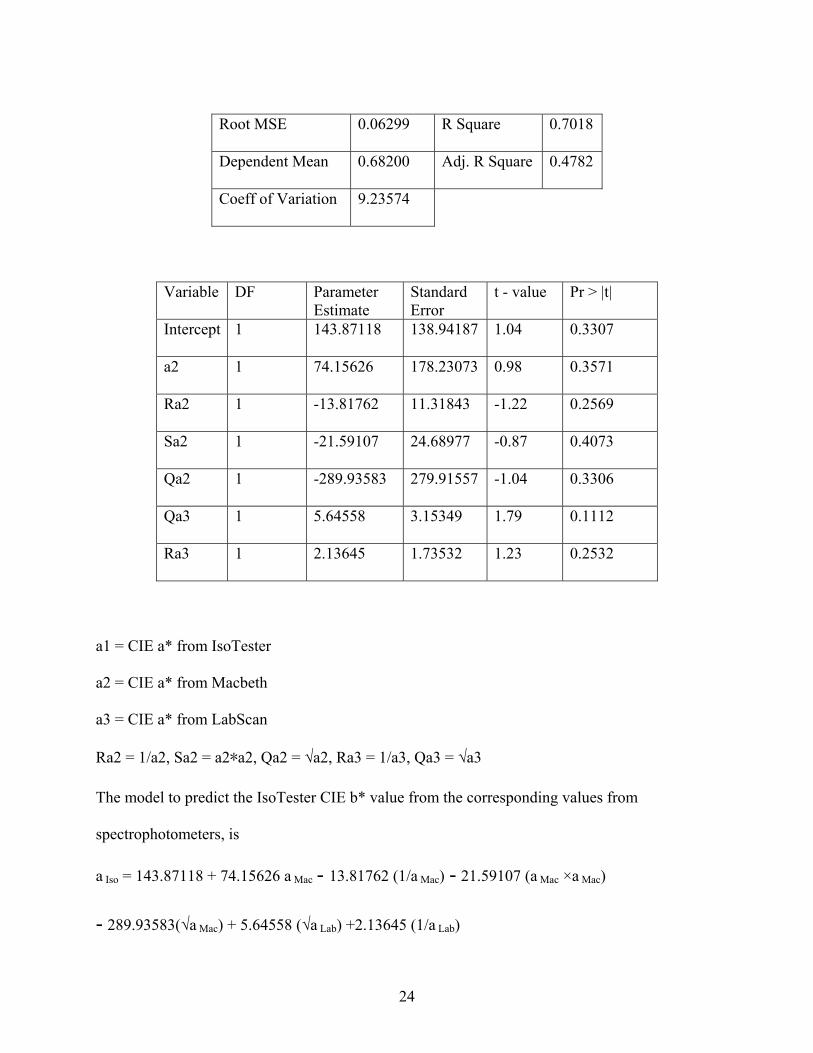
Root MSE 0.06299
R Square 0.7018
Dependent Mean 0.68200
Adj. R Square 0.4782
Coeff of Variation 9.23574
Variable
DF
Parameter Estimate
Standard Error
t - value Pr > |t|
Intercept
1 143.87118
138.94187
1.04
0.3307
a2 1 74.15626
178.23073
0.98
0.3571
Ra2
1 -13.81762
11.31843
-1.22
0.2569
Sa2 1 -21.59107
24.68977
-0.87
0.4073
Qa2 1 -289.93583
279.91557
-1.04
0.3306
Qa3 1 5.64558
3.15349
1.79
0.1112
Ra3 1 2.13645
1.73532
1.23
0.2532
a1 = CIE a* from IsoTester
a2 = CIE a* from Macbeth
a3 = CIE a* from LabScan
Ra2 = 1/a2, Sa2 = a2∗a2, Qa2 = √a2, Ra3 = 1/a3, Qa3 = √a3
The model to predict the IsoTester CIE b* value from the corresponding values from
spectrophotometers, is
a Iso = 143.87118 + 74.15626 a Mac - 13.81762 (1/a Mac) - 21.59107 (a Mac ×a Mac)
- 289.93583(√a Mac) + 5.64558 (√a Lab) +2.13645 (1/a Lab)
24
From the tables 4, 5 and 6 and corresponding models, it can be concluded that the CIE L*
and b* values can be predicted easily as compared with CIE a* values. The predicted values of
CIE L*, a* and b* from these models and the original values of the analyzed samples, are given
in appendix B.
Repeatability and Reproducibility (R&R) of IsoTester was analyzed by ANOVA method
as described by Engineered Software Inc. R&R of IsoTester was measured for CIE L* and CIE
a* of cotton fiber. ANOVA for R&R analysis of CIE L* is shown in table 7.
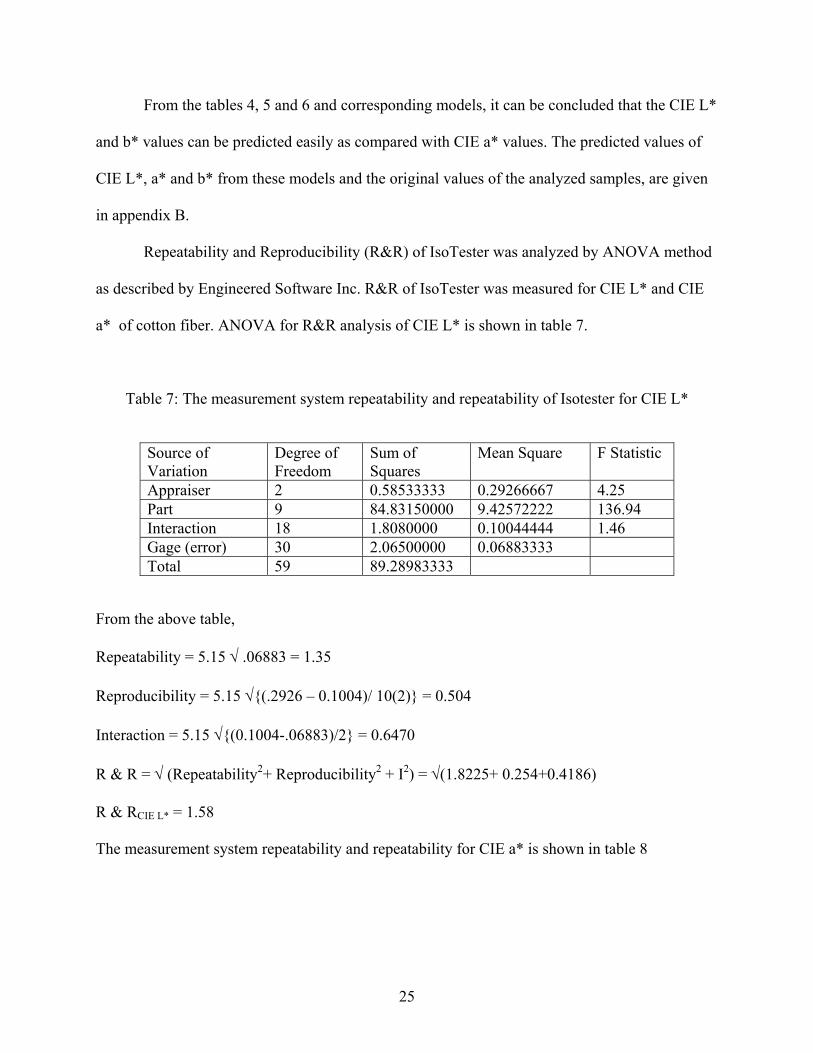
Table 7: The measurement system repeatability and repeatability of Isotester for CIE L*
Source of Variation
Degree of Freedom
Sum of Squares
Mean Square F Statistic
Appraiser 2 0.58533333 0.29266667 4.25 Part 9 84.83150000 9.42572222 136.94 Interaction 18 1.8080000 0.10044444 1.46 Gage (error) 30 2.06500000 0.06883333 Total 59 89.28983333
From the above table,
Repeatability = 5.15 √ .06883 = 1.35
Reproducibility = 5.15 √{(.2926 – 0.1004)/ 10(2)} = 0.504
Interaction = 5.15 √{(0.1004-.06883)/2} = 0.6470
R & R = √ (Repeatability2+ Reproducibility2 + I2) = √(1.8225+ 0.254+0.4186)
R & RCIE L* = 1.58
The measurement system repeatability and repeatability for CIE a* is shown in table 8
25
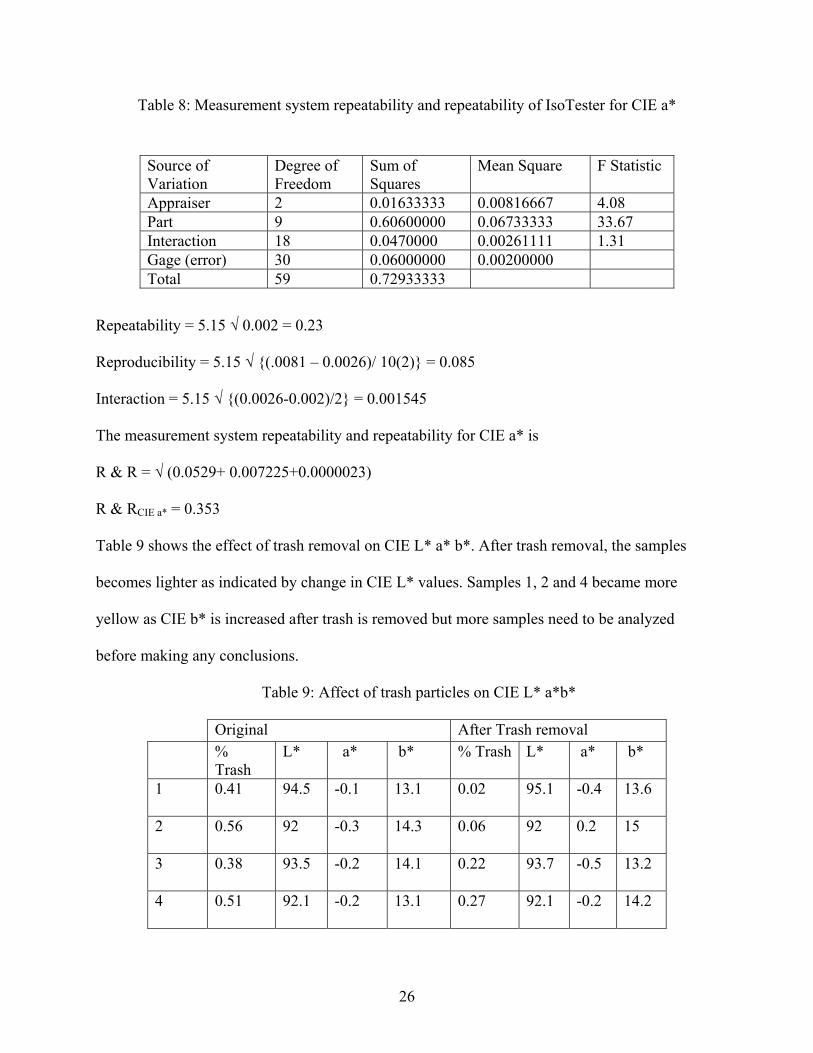
Table 8: Measurement system repeatability and repeatability of IsoTester for CIE a* Source of
Variation Degree of Freedom
Sum of Squares
Mean Square F Statistic
Appraiser 2 0.01633333 0.00816667 4.08 Part 9 0.60600000 0.06733333 33.67 Interaction 18 0.0470000 0.00261111 1.31 Gage (error) 30 0.06000000 0.00200000 Total 59 0.72933333
Repeatability = 5.15 √ 0.002 = 0.23
Reproducibility = 5.15 √ {(.0081 – 0.0026)/ 10(2)} = 0.085
Interaction = 5.15 √ {(0.0026-0.002)/2} = 0.001545
The measurement system repeatability and repeatability for CIE a* is
R & R = √ (0.0529+ 0.007225+0.0000023)
R & RCIE a* = 0.353
Table 9 shows the effect of trash removal on CIE L* a* b*. After trash removal, the samples
becomes lighter as indicated by change in CIE L* values. Samples 1, 2 and 4 became more
yellow as CIE b* is increased after trash is removed but more samples need to be analyzed
before making any conclusions.
Table 9: Affect of trash particles on CIE L* a*b*
Original After Trash removal %
Trash L* a* b* % Trash L* a* b*
1 0.41
94.5
-0.1
13.1
0.02 95.1 -0.4 13.6
2 0.56
92
-0.3
14.3
0.06 92 0.2 15
3 0.38 93.5
-0.2
14.1
0.22 93.7 -0.5 13.2
4 0.51
92.1
-0.2
13.1
0.27 92.1
-0.2
14.2
26
CHAPTER 5
CONCLUSIONS AND RECOMMENDATIONS
This study showed that there were prominent differences among the CIE L* a* b* values
measured from the three color measuring instruments.
Based on the original hypotheses, the conclusions are:
1. Hypothesis one, that there is no significance difference in CIE L* among the three
instruments, is rejected.
2. Hypothesis two, that there is no significance difference in CIE a* among the three
instruments, is rejected.
3. Hypothesis three, that there is no significance difference in CIE b* among the
three instruments, is rejected.
4. Hypothesis four, that a mathematical model does not predict the relation between
cotton color measurements from IsoTester and two spectrophotometers, is
rejected.
After trash removal, CIE L* increased, as anticipated. More samples need to be
analyzed for statistical inference.
The results of this project have indicated the need for further research. This research
can be extended to compare HVI color data with IsoTester data. It will be of interest
because all instruments currently utilized in USDA cotton classification are from Uster
High Volume Instrument (HVI) systems (High Volume Instrument (HVI) is patented by
Uster Technologies).
27

Also, for future work, this research could be made more specific by comparing
Tristimulus values (X, Y, Z) of cotton color from the different color measurement
systems. A further recommendation would be to conduct a research project designed to
analyze and compare the cotton fiber properties from HVI and newly fully automated
measurement systems like HVI Spectrum, AFIS, Fiber Lab, IsoTester, Premier
Automated Rapid Tester (ART). This project can give some significant results that will
help the cotton industry in the proposed change from current HVI measurements to newly
introduced gin based classing machines like IsoTester, HVI spectrum, Premier
Automated Rapid Tester.
28
REFERENCES
1. Cotton for NonWovens: A Technical Guide, Cotton Incorporated
2. Shofner F. M. and Shofner C. K. (March 2000). Cotton Classing in the New Millennium,
Schaffner Technologies, Inc. Knoxville, Tennessee. USA Invited Paper for 25th
International Cotton Conference Bremen.
3. http://www.apparelsearch.com/education_research_nonwoven_cotton_fiber.htm
4. Kermit E. Duckett. (January 5-8, 1999). Color grading of cotton-measurement. Beltwide
cotton conference, Orlando.
5. Epps H. H., Foulk J. A. (January 8-12, 2002). Cotton Color and Trash: 1990 HVI, 2001
HVI, and Spectrophotometric Measurements. Proceedings of the Beltwide Cotton
Production Conference, Vol. Part 4, p289, 3p.
6. Roy S. Berns, Billmeyer and Saltzman's Principles of Color Technology, 3rd Edition
7. http://www.pcimag.com/CDA/ArticleInformation/features/BNP__Features__Item/0,1846
,91729,00.html
8. Cheng L., Duckett K. E., Zapletalova T., Watson M., Ghorashi H. (January 3-7, 1999).
Color Grading of Cotton. Grading (Part II). Proceedings of the Beltwide Cotton
Production Conference, Vol. 1, p649.
9. http://www.colourware.co.uk/
10. Lieberman M. A., Siddaiah M. (January 3-7, 1999). Evolution of Video Color/Trash
Processing at Southwestern Cotton Ginning Research Laboratory. Proceedings of the
Beltwide Cotton Production Conference, Vol. 1, p657.
29

11. Byler R. K., Anthony. (January 5-9, 1998). An Examination of the Accuracy of HVI
Color/Trash Meters for Use in Gins. Proceedings of the Beltwide Cotton Production
Conference, Vol. 2, p1567, 6p.
12. http://www.hunterlab.com/appnotes/an07_96a.pdf
13. Xu B., Ting Y.-L., Watson M. (January 9-12, 1996). Cotton Trash Measurement Using
Image Analysis. Proceedings of the Beltwide Cotton Production Conference, Vol. 2,
p1701, 5p.
14. Couch Fred D., Shofner C. Kyle and Yupeng Zhang. (March 2002). Analysis of Trash
Particles in Cotton by Image Analysis. 26th International Cotton Conference Bremen,
Germany.
15. Jesse F. Moore, C. Kyle Shofner and Frederick M. Shofner: Control Tool for Quality
Ginning - Schaffner Technologies, Inc Knoxville, Tennessee.
16. Shofner C. K., Shofner Frederick M, and Yupeng Zhang. (June 10-12, 2002). Gin-Based
Classing, Internet Classing, and Internet Trading - EFS System Conference.
17. Julius K. W., Shofner C. K., Shofner F. M. (January 6-10, 2003). Gin-Based Classing:
First Steps, Beltwide Cotton Conference Nashville, Tennessee.
18. http://journal.cotton.org/2000/issue01/Review/art01/article.pdf
19. Shofner F.M., Shofner C. K., and Yupeng Z. (March 13-16, 2002). New Fiber
Classification Methods, Schaffner Technologies, Inc Knoxville, Tennessee. USA - 26th
International Cotton Conference Bremen, Germany.
20. http://www.engineeredsoftware.com/papers/msa_rr.pdf
30
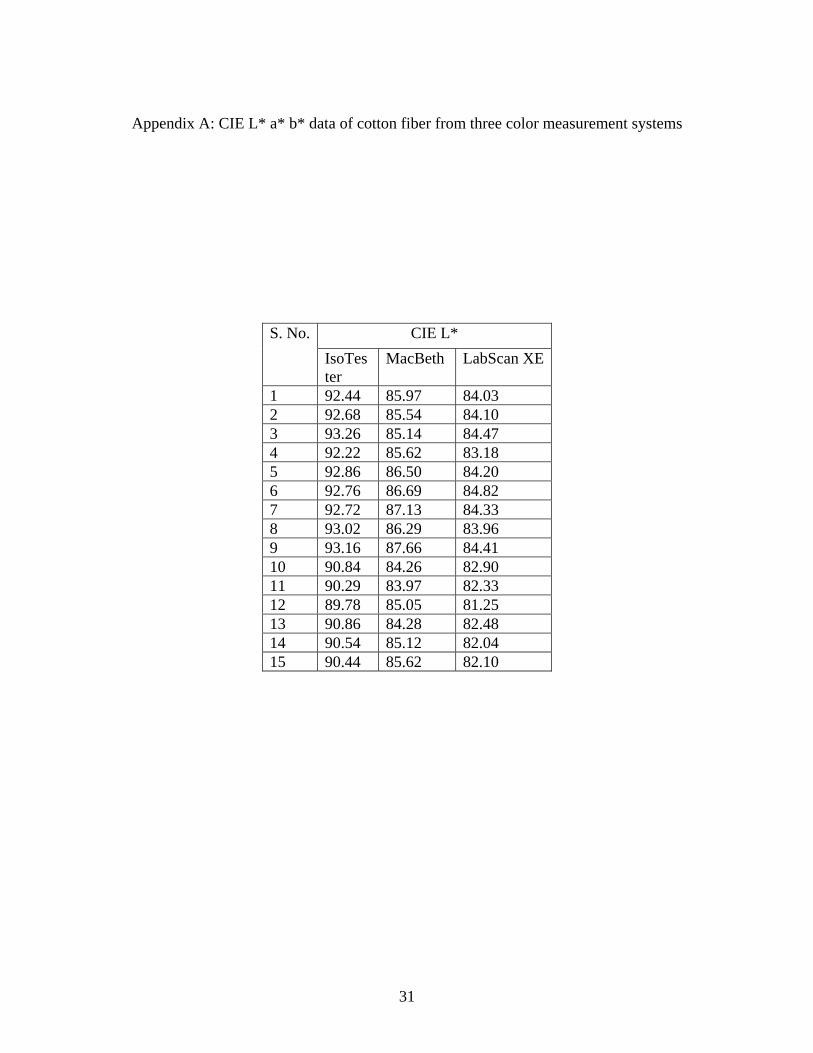
Appendix A: CIE L* a* b* data of cotton fiber from three color measurement systems
CIE L* S. No. IsoTester
MacBeth LabScan XE
1 92.44 85.97 84.03 2 92.68 85.54 84.10 3 93.26 85.14 84.47 4 92.22 85.62 83.18 5 92.86 86.50 84.20 6 92.76 86.69 84.82 7 92.72 87.13 84.33 8 93.02 86.29 83.96 9 93.16 87.66 84.41 10 90.84 84.26 82.90 11 90.29 83.97 82.33 12 89.78 85.05 81.25 13 90.86 84.28 82.48 14 90.54 85.12 82.04 15 90.44 85.62 82.10
31

CIE a* S. No. IsoTester MacBeth LabScan XE
1 0.86 1.20 1.41 2 0.66 0.80 1.21 3 0.8 0.91 1.28 4 0.74 0.93 1.25 5 0.68 0.85 1.16 6 0.72 0.75 1.05 7 0.74 0.96 1.23 8 0.50 0.92 1.14 9 0.58 0.89 1.11 10 0.62 0.48 0.70 11 0.71 0.55 0.76 12 0.64 0.79 1.05 13 0.66 0.51 0.76 14 0.68 0.63 0.80 15 0.64 0.659 0.88
32

CIE b* S. No. IsoTester MacBeth LabScan XE
1 12.86 9.31 10.66 2 13.06 8.77 10.67 3 12.6 8.48 10.28 4 13.22 9.01 10.46 5 12.72 8.55 8.48 6 11.58 8.11 9.78 7 12.4 8.92 10.18 8 12.66 8.74 10.28 9 12.34 8.85 10.27 10 9.68 6.76 8.34 11 10.12 6.91 8.30 12 11.54 8.31 9.77 13 10.00 6.90 8.48 14 10.26 7.48 8.56 15 10.66 7.78 8.95
33
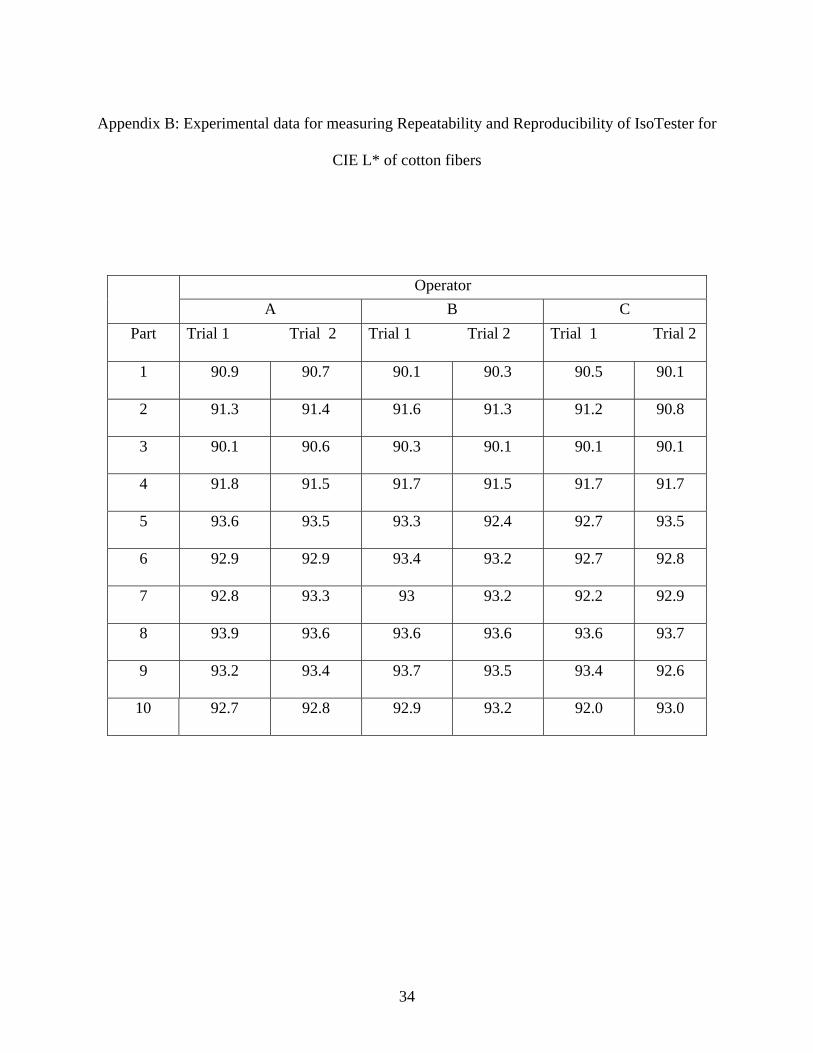
Appendix B: Experimental data for measuring Repeatability and Reproducibility of IsoTester for
CIE L* of cotton fibers
Operator A B C
Part Trial 1 Trial 2 Trial 1 Trial 2 Trial 1 Trial 2
1 90.9
90.7
90.1
90.3
90.5
90.1
2 91.3
91.4
91.6
91.3
91.2
90.8
3 90.1
90.6
90.3
90.1
90.1
90.1
4 91.8
91.5
91.7
91.5
91.7
91.7
5 93.6
93.5
93.3
92.4
92.7
93.5
6 92.9
92.9
93.4
93.2
92.7
92.8
7 92.8
93.3
93
93.2
92.2
92.9
8 93.9
93.6
93.6
93.6
93.6
93.7
9 93.2
93.4
93.7
93.5
93.4
92.6
10 92.7
92.8
92.9
93.2
92.0
93.0
34
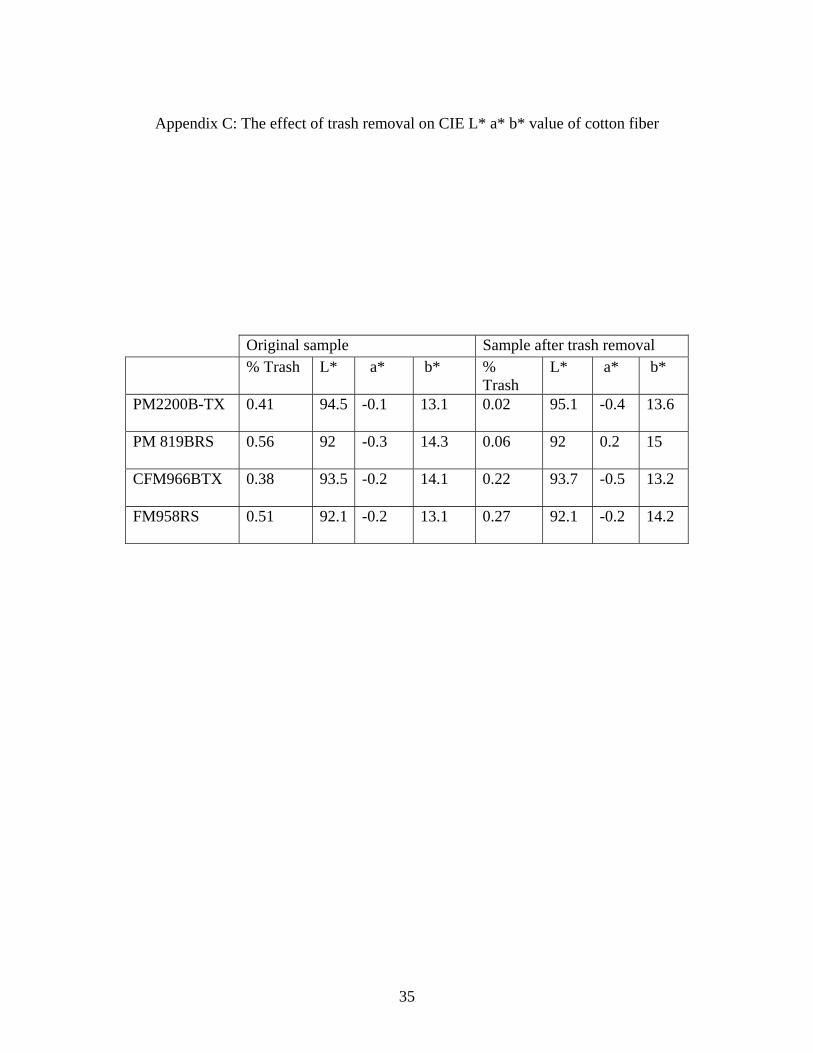
Appendix C: The effect of trash removal on CIE L* a* b* value of cotton fiber
Original sample Sample after trash removal % Trash L* a* b* %
Trash L* a* b*
PM2200B-TX
0.41
94.5
-0.1
13.1
0.02 95.1 -0.4 13.6
PM 819BRS
0.56
92
-0.3
14.3
0.06 92 0.2 15
CFM966BTX
0.38 93.5
-0.2
14.1
0.22 93.7 -0.5 13.2
FM958RS
0.51
92.1
-0.2
13.1
0.27 92.1
-0.2
14.2
35