Embed Size (px)
Citation preview
1
Information and long term memory in calcium signals Ildefonso M. De la Fuente1,2, Iker Malaina2, Alberto Pérez-Samartín3, Jesús M. Cortés4, Asier Erramuzpe4, María Dolores Boyano5, Carlos Bringas1, María Fedetz1 and Luis Martínez2.
1 Department of Biochemistry and Pharmacology, Institute of Parasitology and
Biomedicine “López-Neyra”, CSIC, Granada, Spain. 2 Department of Mathematics, Faculty of Science and Technology, University of the
Basque Country, UPV/EHU. Leioa, Spain. 3 Department of Neurosciences, Faculty of Medicine and Dentistry, University of the
Basque Country, UPV/EHU. Leioa, Spain. 4 Biocruces Health Research Institute. Hospital Universitario de Cruces. Barakaldo,
Spain. Ikerbasque: The basque foundation for Science. 5 Department of Cell Biology and Histology, School Faculty of Medicine and
Dentistry, University of the Basque Country, UPV/EHU. Leioa, Spain. Keywords: Calcium signaling, Conditional Entropy, Shannon entropy, Hurst exponent, time-series analysis, dissipative processes. Corresponding Author: Ildefonso Mtz. de la Fuente Mtz. Instituto de Parasitología y Biomedicina “López-Neyra”, CSIC, Parque Tecnológico de Ciencias de la Salud Avda. del Conocimiento s/n. 18016 Granada. ESPAÑA. E-Mail: [email protected] Tel.: +34- 958-18-16-21; Fax: +34- 958-18-16-32.

2
Abstract Unicellular organisms are open metabolic systems that need to process information about their external environment in order to survive. In most types of tissues and organisms, cells use calcium signaling to carry information from the extracellular side of the plasma membrane to the different metabolic targets of their internal medium. This information might be encoded in the amplitude, frequency, duration, waveform or timing of the calcium oscillations. Thus, specific information coming from extracellular stimuli can be encoded in the calcium signal and decoded again later in different locations within the cell. Despite its cellular importance, little is known about the quantitative informative properties of the calcium concentration dynamics inside the cell. In order to understand some of these informational properties, we have studied experimental Ca2+ series of Xenopus laevis oocytes under different external pH stimulus. The data has been analyzed by means of information-theoretic approaches such as Conditional Entropy, Information Retention, and other non-linear dynamics tools such as the power spectra, the Largest Lyapunov exponent and the bridge detrended Scaled Window Variance analysis. We have quantified the biomolecular information flows of the experimental data in bits, and essential aspects of the information contained in the experimental calcium fluxes have been exhaustively analyzed. Our main result shows that inside all the studied intracellular Ca2+ flows a highly organized informational structure emerge, which exhibit deterministic chaotic behavior, long term memory and complex oscillations of the uncertainty reduction based on past values. The understanding of the informational properties of calcium signals is one of the key elements to elucidate the physiological functional coupling of the cell and the integrative dynamics of cellular life.

3
Author Summary Cells need a permanent exchange of energy and matter with the external medium to maintain their self-organized biochemical functionality. As a consequence, metabolic life would not be possible without it having the capacity to adequately respond to the large possible combinations of external variables to which the cell is exposed. These external inputs can be understood in terms of molecular information. Calcium signaling is a ubiquitous mode of biological communication, able to carry information from the extracellular side of the plasma membrane to the different metabolic targets in the internal medium. Intracellular calcium signals show complex oscillatory behavior and play an essential role in cellular metabolism participating in a multiplicity of physiological and pathological functions. Many aspects of the molecular mechanisms involved in the generation of intracellular concentration of calcium dynamics have been relatively well studied, but how information is processed is still unknown. Here, we have exhaustively analyzed experimental calcium time series of Xenopus laevis oocytes under different pH stimuli using information-based dynamic tools, and our results show that inside the intracellular Ca2+ flows emerges a new kind of dynamical informational structure, in which organizes specific information contained in calcium series.

4
Introduction Calcium ions play a fundamental role in cell physiology, particularly in signal
transduction processes. In fact, calcium signaling represents one of the few universal
intracellular messengers that are able to carry information from the extracellular side of
the plasma membrane to different metabolic targets in the internal medium [1, 2].
From a biochemical point of view, one of the essential characteristics of Ca2+ ion fluxes
is their capacity to exert regulatory effects on many enzymes [3-6], which allows the
modulation of the metabolic activity of the cell. As a consequence, calcium signaling
participates in a multiplicity of key functions, such as the regulation of cell
differentiation [7], cellular migration [8], cell division [9], ROS signaling [10,11],
synaptogenesis [12], apoptosis [13,14], autophagy [15], exocytosis [16], neuronal
plasticity [17], cytoskeleton activity [18], cellular growth [19], dendritic development
[20], neurotransmitter release [21], and gene expression [22-27].
At a molecular level, the mechanisms involved in the generation of calcium signaling
essentially result from a complex interplay among extracellular calcium, permeable
channels and the activation/inactivation of intracellular Ca2+ pools, mainly located at the
endoplasmic or sarcoplasmic reticulum and mitochondria. These processes are highly
regulated by complexly interrelated metabolic reactions [28, 29].
In general, external stimuli are often converted into intracellular Ca2+ ion fluxes which
encode the input information by means of signal transduction processes, i.e., an
extracellular stimulus activates a specific receptor located on either the cell surface or
the inside, triggering a biochemical chain of molecular processes, which originates
different metabolic responses, a large part of them in the form of intracellular calcium
oscillations [30].
In many cells, these molecular processes involve G protein-coupled receptors and the
phospholipase C enzymes, located in the cell membrane. Specific phospholipase C can
hydrolyse phosphatidylinositol 4,5-bisphosphate (PIP2) into two products: inositol
1,4,5-trisphosphate (IP3) and diacylglycerol (DAG), two classical second messengers.
The level of external stimulation on the cell determines the degree of activation of the
receptor and therefore can be directly linked to the intracellular IP3 concentration. IP3
mainly diffuses to the endoplasmic reticulum, and binds to its specific receptor, which is
located in an intracellular calcium channel; thus releases Ca2+ ions from the

5
endoplasmic reticulum, triggering oscillations in the cytoplasmic calcium concentration
[31]. As a result of these complex metabolic processes the temporal behavior of the
intracellular Ca2+ levels are highly regulated [32].
In spite of its physiological importance, many aspects of the molecular mechanisms
involved in the generation of the intracellular calcium concentration dynamics are still
poorly understood.
Intracellular Ca2+ fluxes can either be localized or invade the whole cell; and depending
on the cell type and the stimulus, Ca2+ signals are characterized by a rich variety of
oscillating patterns, in which the frequency and amplitude can vary practically
infinitely [28,33].
Calcium concentration rhythms represent a genuine manifestation of the dissipative
self-organization in the enzymatic activities of the cell. Experimental observations and
numerical studies have shown that metabolic processes shape functional structures in
which these kinds of molecular rhythms may spontaneously emerge far from
thermodynamic equilibrium [34,35].
It is well established that non-equilibrium states can be a source of order in the sense
that metabolic irreversible processes may lead to a new type of dynamic state in which
the system becomes ordered in space and time. In fact, the non-linearity associated with
irreversible enzymatic reactions seems to be an essential mechanism that may allow
dissipative metabolic organization far from thermodynamic equilibrium [36,37].
Self-organization is based on the concept of dissipative structures, and its theoretical
roots can be traced back to the Nobel Prize Laureate in Chemistry Ilya Prigogine [38].
Two main kinds of metabolic dissipative structures exist in cellular conditions: temporal
oscillations and spatial biochemical waves [34]. Both kinds of dissipative structures can
be observed in Ca2+ dynamics. Thus, when spatial inhomogeneities develop instabilities
in the intracellular medium, in addition to temporal calcium oscillation [39], it may lead
to the emergence of spatio-temporal dissipative structures which can take the form of
propagating calcium concentration waves [40,41]. Phase-coupled NAD(P)H waves and
calcium oscillations have also been observed [42].
Since the first observations of the calcium rhythmic phenomena, experimental
investigation of its molecular mechanism has been accompanied by numerous
computational modeling approaches. The use of these numerical studies on Ca2+
oscillations can lead to different important conclusions mainly about the nonlinear
feedback processes involved in the spontaneous generation of oscillations [43-50]. For a

6
review on calcium numerical studies, see Dupont et al. [28]. Despite numerous studies
on calcium signalling, how information is processed is still insufficiently known.
Different experimental and numerical analysis have shown that the information might
be encoded in the amplitude, frequency, duration, waveform or timing of calcium
oscillations [51-54]. Thus, specific information coming from extracellular stimuli can
be encoded in the calcium signal and decoded again later in different metabolic targets
in the cellular internal medium.
These researches on the calcium information have motivated a number of experimental
and theoretical studies. For instance, it has been estimated by means of mathematical
simulations the information encoded in a Ca2+ series upon hormonal stimulation in
hepatocytes [55]. Mutual information has also been used to calculate the amount of
information transferred over a calcium signaling channel, using a computational model
[56]. Long-term correlations have been observed in calcium-activated potassium
channels [57-60]; other biochemical processes also present long-term correlation, for
example, the intracellular transport pathway of Chlamydomonas reinhardtii [61], the
NADPH series of mouse liver cells [62] and the mitochondrial membrane potential of
cardiomyocytes [63].
Likewise, the information transfer from the calcium signal to a target enzyme under
different physiological conditions has been analyzed using transfer entropy [64] in a
computational model, a technique widely used to quantify directed biological
interactions [65,66].
Here, we have studied experimental calcium series of Xenopus laevis oocytes under
different external pH stimuli. The data has been exhaustively analyzed by means of
information-theoretic approaches such as Conditional Entropy, Information Retention,
and other non-linear dynamics tools, such as the power spectra, the Largest Lyapunov
exponent and the bridge detrended Scaled Window Variance analysis. We have
quantified the biomolecular information flows of the experimental data in bits, and
essential aspects of the information contained in experimental calcium fluxes have been
exhaustively analyzed. They correspond to the fractional Brownian motion, and our
main result shows that in the intracellular Ca2+ flows a highly organized complex
informational structure emerges which is characterized by exhibiting long-term
memory, deterministic chaotic dynamics and oscillations of the uncertainty in respect of
the past values.
7
Materials and Methods 1. Calcium oscillations in Xenopus laevis oocytes Different concentrations of serum are known to promote chaotic oscillations due to
alterations of Ca2+ concentrations in the cytoplasm, which, as a consequence, evoke Cl-
and K+ currents across the oocyte membrane (67, 68) through to the activation of
different Ca2+ affinity channels (69). Adult Xenopus laevis frogs were obtained from
Blades Biological (Cowden, Kent, UK). Oocytes at stage V were plucked from the
ovaries and defolliculated by collagenase treatment (type 1, Sigma-Aldrich Quimica,
S.A., Madrid, Spain) at 80–630 units/ml in frog Ringer’s solution (115 mM NaCl, 2
mM KCl, 1.8 mM CaCl2, 5 mM HEPES at pH 7.0) for 20 min to remove the
surrounding follicular and epithelial cell layers. Oocytes were maintained at 18ºC in
sterile unsupplemented modified Barth's medium containing (mM): 88 NaCl, 0.2 KCl,
2.4 NaHCO3, 0.33 Ca(NO3)2, 0.41 CaCl2, 0.82 MgSO4, 0.88 KH2PO4, 2.7 Na2HPO4,
with gentamicin 70 µg ml−1 and adjusted to pH 7.4. Membrane currents were recorded
with a standard two-electrode voltage clamp (Warner Instruments, Oocyte Clamp OC-
725C) and digitized in a PC (Digidata 1200 and Axoscope 8.0 software, Axon
Instruments). Oocytes were continually superfused with Ringer’s solution (115 NaCl, 2
KCl, 1.8 CaCl2, 5 Hepes) at room temperature (22ºC). The membrane was usually
voltage clamped at -60 mV. Fetal Bovine Serum (FBS) (Sigma-Aldrich) diluted 1:1000
Ringer’s solution was used for oocytes perfusion to achieve the generation of currents
oscillations. Three different pH conditions were considered, Ringer’s solution at pH 5.0,
7.0 and 9.0.
2. Shannon Entropy
Time series of calcium concentration flows, correlated to electrical potential measures,
were first stationarized by performing a sliding window process as follows: �� → ��− ���� + ���� + ��� + ��� + ���� + �� + ���� + ��� + ��� + ���� + ����11 .(1) Then, the series were normalized within the (0,1) range. We will refer to this modified
series as "stationarized series".

8
Let {�(�)}�∈� be a probability distribution over a finite set X with states � ∈ �. The
Shannon Entropy of X, denoted H(X), is defined as �(�) ≡ −��(�) · log �(�).(2) When the log is computed in base 2 (the case considered here), the Entropy is measured
in bits. In particular, H(X) is the expected value of the number of bits required to specify
a concrete event in X [70]. Thus, because0 ≤ �(�) ≤ 1, Entropy satisfies that �(�) ≥0. The joint Entropy H(X,Y) between two random variables X and Y is just an extension
of (2) to 2-dimensions, i.e. �(�, %) ≡ −��(�, &) · '() �(�, &),(3) where {�(�, &)}�∈�,+∈, is the joint probability distribution of X and Y for events in
which the variable X is in the state x and simultaneously the variable Y is in y.
3. Conditional Entropy
To measure how much uncertainty in future events is reduced by conditioning from past
events, we calculated the Conditional Entropy. To compute it, we first denoted XP as the
past of X and XF as the future of X. The Conditional Entropy is then defined as �(�-|�/) ≡ �(�- , �/) − �(�/),(4) being H(XP) the Shannon Entropy of XP and H(XF,XP) the joint Entropy of XP and XF
[70]. Thus, the Conditional Entropy is by definition the remaining uncertainty in XF
known XP. H(XF│XP) is a positive-definite quantity such that its minimum value
corresponds to �(�-|�/) = 0, which happens when knowing XP implies that the
uncertainty in XF is completely determined. The maximum value corresponds to �(�-|�/) = �(�-), which occurs when knowing XP does not affect the uncertainty in
XF, so that both XP and XF are statistically independent variables.
4. Information Retention
We introduced the Information Retention index (η) as the Conditional Entropy
normalized between 0 and 1, which allows comparing different time series within a
common scenario. In particular, we defined it as
2≡1 − �(�-|�/)�(�-) .(5) Thus, this statistic will be closer to 0 as the future becomes harder to predict, and closer
to 1 as the future becomes more dependent on the past.

9
5. Hurst exponent
The Scaled Windowed Variance Analysis is one of the most reliable methods that have
been thoroughly tested on fBm signals [71]. In particular, we have used the bridge
detrended Scaled Windowed Variance analysis (bdSWV) for the study of these
temporal sequences of metabolic activities [72]. This method generates an estimation of
the Hurst exponent (H) for each series. For a random process with independent
increments, the expected value of H is 0.5. When H differs from 0.5, it indicates the
existence of long-term memory, which is to say, dependence among the values of the
process. If � > 0.5, it was produced by a biased random process which exhibits
persistent behaviour. In this case, for several previous transitions, an increment on the
phase-shift average value implies an increasing trend in the future. Conversely, a
previously decreasing trend for a sequence of transitions usually implies a decrease for a
similar sequence. Antipersistent behavior is obtained for 0 < � < 0.5, a previously
decreasing trend implies a probable increasing trend in the future and an increase is
usually followed by decreases [71-72].
According to the bdSWV method, if the signal is of the form xt, where 6 = 1,… ,8, then
the following steps are carried out for each one of the window sizes 9 = 2,4, … , : , 8 (if
N is not a power of 2, then n takes the values 2,4,…,2k, where k is the integer part of log8):
1) Partition of the data points in :;adjacent non-overlapping windows {<�, … ,<=>}
of size n, where <� = {�(���)·;��, … , ��·;}. If N is not a power of 2 and N is not
divisible by n, then the last remaining points are ignored for this value of n. For
instance, if 8 = 31 and 9 = 4, the first 28 points are partitioned into seven
windows.
2) Subtraction of the line between the first and last points of the points in the n-th
window.
3) For each ? = 1,… , :;, calculation of the standard deviation SDi of the points in
each window, by using the formula

10
@A� = B � (�C − �̅�)9 − 1�·;CE(���)·;�� ,(6)
where �GH is the average in the window Wi.
4) Evaluation of the average @AIIII of the :; standard deviations corresponding to
equation (6).
5) Observation of the range of the window sizes n over which the regression line of log(@AIIII) versus log(9) gives a good fit (usually some initial and end pairs are
excluded).
6) In this range, the slope of the regression line gives the estimation of the Hurst
coefficient H.
We have used the program bdSWV, available on the web of the Fractal Analysis
Programs of the National Simulation Resource [73].
6. Dispersion Analysis
The Dispersion Analysis program is designed for the analysis of fractional Gaussian
noise (fGn) [74].
For different bins of length J, varying from one to ;, where n is the length of the series,
the standard deviation SD(J) of the series formed by the mean of the J consecutive
values of the original series x(i) are considered (that is, SD(J) is the standard deviation
of the series yJ(i), where
&J(?) = �(?) +⋯+ �(? + L − 1)L ).(7) Now, the relation between log @A(L)and log(L) is approximately linear: @A(L) = @A(1) · LN��,(8) with slope H-1, where H is the Hurst coefficient and with SD(1) the standard deviation
of a single point.
Previously, we have studied the Hurst exponent in a biochemical pathway [75-77]
described by a system of differential equations with delay [78], in metabolic networks
[79], and in experimental rabbit brain electrical signals [80].
11
Results In order to study the informational properties of calcium signals, we have obtained
experimental Ca2+ measurements from seven different Xenopus laevis oocytes, each of
them under three different external pH stimuli, gathering 21 time series, in which
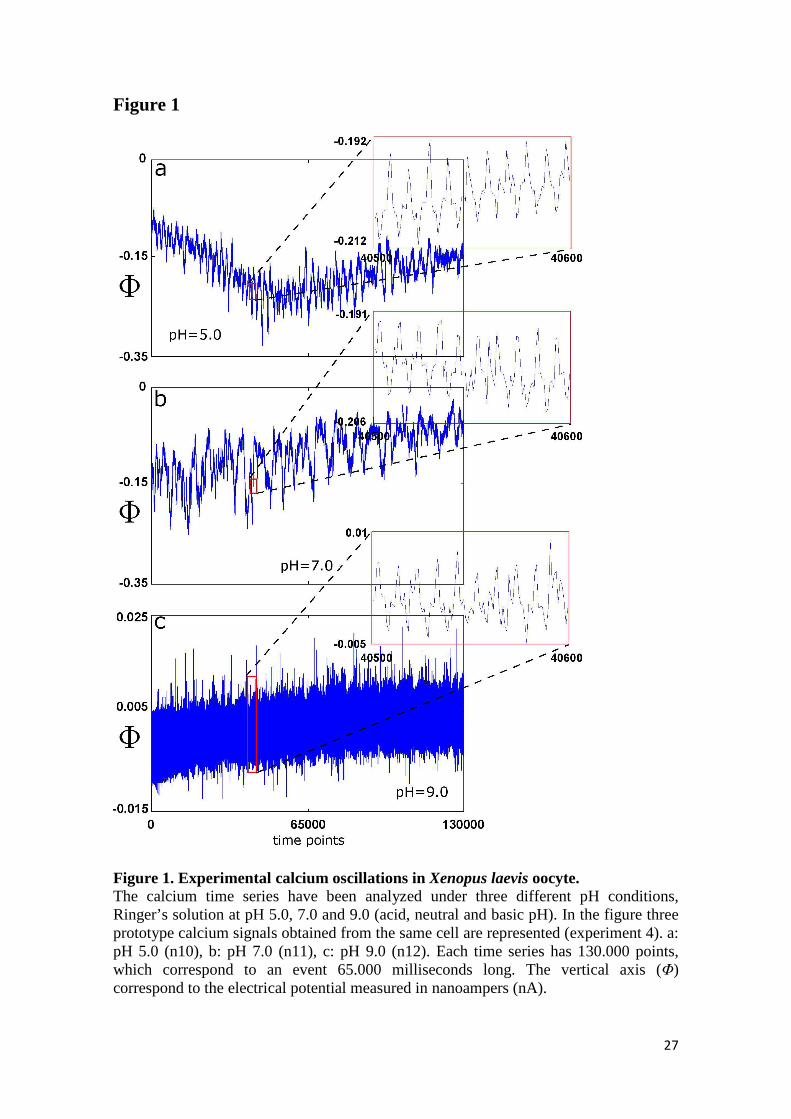
130.000 data points were considered. Figure 1 shows three representative experimental
calcium flows under three different pH conditions, Ringer’s solution at pH 5.0, 7.0 and
9.0 (acid, neutral and basic pH).
First, the data has been analyzed according to Shannon's information theory, calculating
the entropy of the time series (Shannon Entropy). This statistic quantifies the mean of
the amount of information necessary to reproduce each calcium signal which is also
interpreted as a measure of the average of uncertainty in the series. The obtained
entropy values of our calcium data are in the order of 0.725 ± 0.11(QRS9 ± @A) bits.
All values are shown in Table 1. To have a comparative reference for the amount of
information in our calcium series, we calculated the entropy of 100 fractional Gaussian
noise series (fully unpredictable events by definition, thus, series that need a lot of
information to be transmitted). The fGn series were normalized between (0,1) as in the
calcium flows, and the obtained entropy values were0.987 ± 0.01(QRS9 ± @A). This
implies that next to 73% in average of the information needed to represent a random
event is necessary to represent our calcium series.
After analyzing the degree of uncertainty in the Ca2+ ion flows we were interested in
knowing how much uncertainty in the future is conditioned by the past. For it, we
calculated the Conditional Entropy (4) applied to each stationarized time series
(considered the past) and the stationarized time series t steps/lags further (considered the
future). In other words, we cyclically permuted the data in order to compare this
"future" series with the non-permuted ones. Thus, when the Conditional Entropy is
minimum, the uncertainty is small and therefore the future becomes easier to predict.
We can observe that there is a local minimum every 0.005 seconds in the experimental
Ca2+ series. The maximum values of (4) are shown in Table 1, and these results suggest
the presence of a type of memory in the calcium flows, in the sense that the information
known in the past of the series decreases the uncertainty in the future.
To quantify the long-term memory, we have first determined whether the series is a
fractional Gaussian noise (fGn) or a fractional Brownian motion (fBm); fGn and fBm
12
can be distinguished by calculating the slope of the Power Spectral Density plot [72].
The signal is said to exhibit power law scaling if the relationship between its Fourier
spectrum and the frequency is approximated asymptotically by @(U) ≈ @(UW)/UY for
adequate constants S(f0) and β. If −1 < Z < 1, then the signal corresponds to an fGn.
When1 < Z < 3, then the signal corresponds to a fBm.
The regression line was estimated for the pairs ('()@(U), '()U), where f is the
frequency and S(f) the absolute value of the Fourier transform, and the β constant was
taken to be the opposite of the x coefficient in that regression line. The analysis of the
data in Table 2 shows that all the calcium signals that we have studied present power
law scaling with β in the range 1.507 − 2.991, which suggests that the series are fBm.
In Figure 2 the Spectral Density plot of the n1, n2 and n3 series are represented. The
opposite of the slope have the values of 2.02 (n1, pH=5.0), 1.97 (n2, pH=7.0) and 2.37
(n3, pH=9.0), which shows that the process is a fractional Brownian motion (fBm).
A number of tools for estimating the long-term correlations of a fBm time series are
available. The Scaled Windowed Variance analysis is one of the most reliable methods
that have been thoroughly tested on fBm signals [72]. In particular, we have used the
bridge detrended Scaled Windowed Variance analysis (bdSWV) on these temporal
sequences [72,81]. By using this method, the estimated Hurst exponent values were
around 0.191 ± 0.101(QRS9 ± @A), which implies long-range memory and
antipersistence in all experimental calcium series. The obtained Hurst exponent values
are included in Table 2; in these results we have also observed that after an anova
test, Hurst exponents were significantly different for time series corresponding to
pH=9.0 in comparison to pH=7.0 (� − [S'\R = 10��) and pH=5.0 (� − [S\'R =10��), but no distinction was found between pH=7 and pH=5 (� − [S'\R = 0.42).
In order to estimate the significance of our results, we have performed a shuffling
procedure. If the data exhibit persistency, there is a long-range memory effect in place
and the ordering of the data is fundamental. However, when we scramble the data, the
structure of the series will be destroyed and, therefore, a Hurst analysis will show a
value of H close to 0.5. In this way, we have generated 21.000 scrambled series (1.000
for each calcium series) with the same number of points as the original ones (130.000
points) by taking values at random from the original data set without replacement. Next
we have estimated the Hurst exponent H for each of these scrambled series applying
Dispersion Analysis [74], because after the shuffling they became fractional Gaussian

13
noise, therefore we must not apply bdSWV [72,74] (for more details see section 6,
Material and Methods). The result of the Hurst analysis for the scrambled series is �\]^6R��.= 0.499 ± 0.01(QRS9 ± @A) which indicates that in all scrambled series
the long-term memory structure was destroyed. The Wilcoxon rank-sum test performed
to compare the Hurst exponents of original calcium series with the exponents of the
shuffled data, gave a � − [S'\R = 2.13 · 10���. Therefore, the shuffling procedure
analysis has shown that our Hurst exponent analysis of the Ca2+ ion series presents a
high significance level.
In Figure 3a the regression lines of a bdSWV process applied to an example of calcium
series (n13, experiment 5, pH5.0) and the regression line of a Dispersion Analysis
applied to the same data after randomly permuting all its 130.000 points are shown. In
Figure 3b, 100 Hurst exponent values from one shuffled time series versus the exponent
obtained from the original time series are illustrated. It can be observed that when the
series were shuffled, the long-term memory completely disappeared(�\]^6R��. =0.498 ± 0.01) (mean ±SD). In this figure, for more graphic clarity, instead of
representing the 21.000 obtained Hurst exponent values from the respective scrambled
time series, we have only illustrated 100 Hurst exponent values.
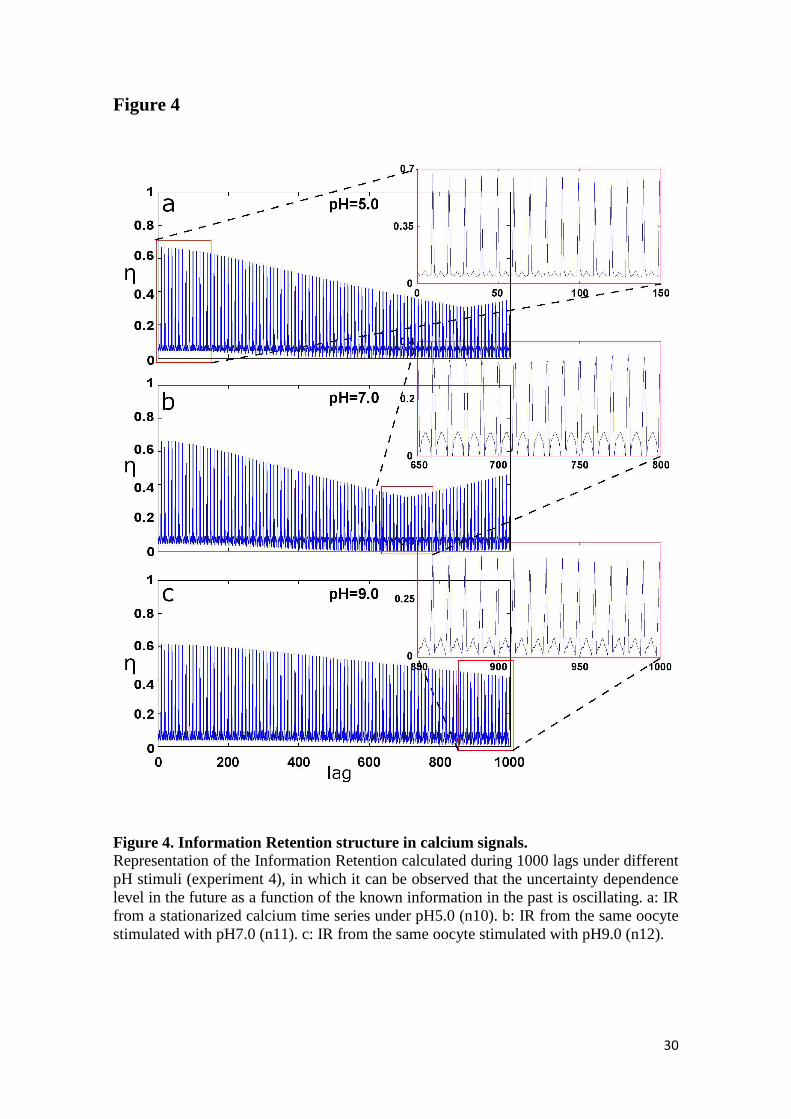
Once the presence of long-term memory in calcium flows was corroborated, we
quantified the Information Retention (5) at each time step (for more details see section
4, Material and Methods). This statistic represents the amount of uncertainty that is
reduced by knowing the past in order to determine the future. In our analysis, we have
found that the values of this "certainty" oscillate periodically in all the calcium signals.
Three examples of these informational structures for pH=5, pH=7 and pH9 can be
observed in Figure 4.
In addition, we have observed that the highest and lowest peaks of the oscillation
fluctuate erratically, an example of these dynamics is shown in Figure 5. To quantify
the level of stability of these peaks, we have calculated the Largest Lyapunov exponent,
a statistic associated to the predictability level of a dynamic system, when it is positive
it reflects the presence of deterministic chaos. We calculated this statistic on the highest
and lowest peaks separately. The Largest Lyapunov exponents of the highest peaks are
around 0.062 ± 0.03 (QRS9 ± @A, all values are shown in table 2) and the ones of the
lowest peaks are around0.111 ± 0.09(QRS9 ± @A). We also performed a B-L test for
chaos [82, 83] to corroborate the presence of chaotic dynamics, and found that all p-
14
values were equal to 1, implying that we do not reject the presence of chaos at _ =0,005 level of significance.
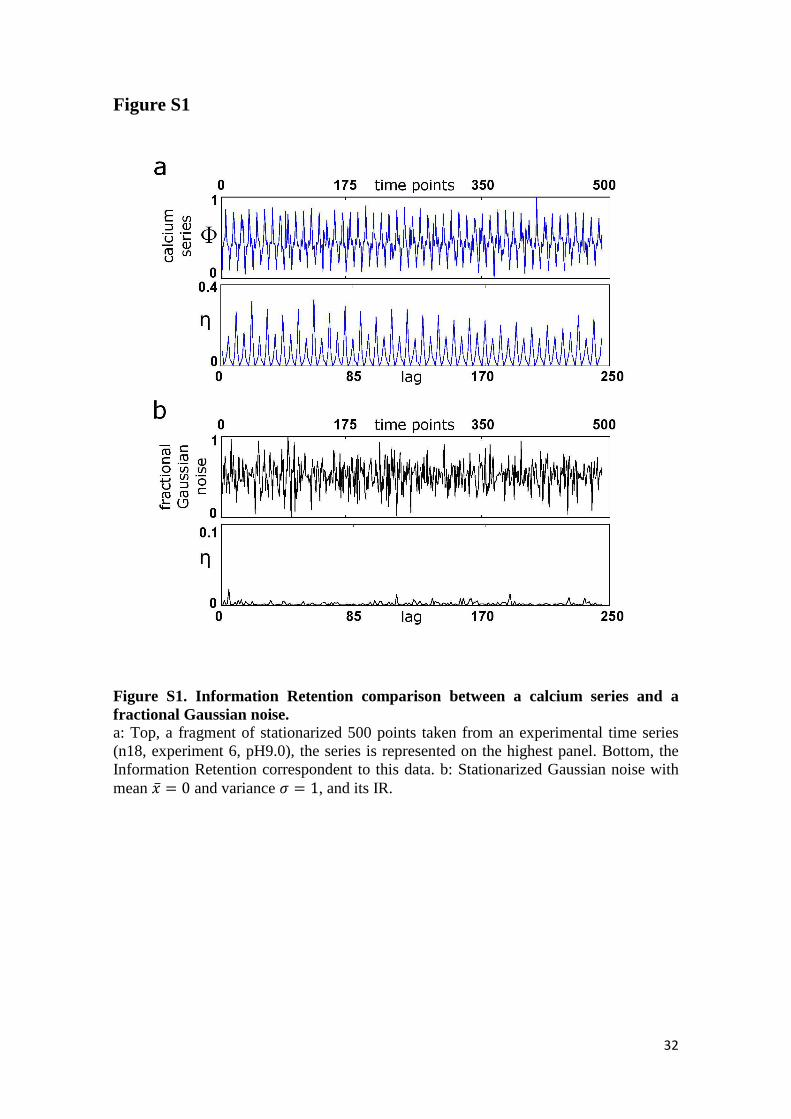
In addition, a comparison between the structure of the Information Retention obtained
from our experimental data with a different dynamic behaviors, a fractional Gaussian
noise, is illustrated in Figure S1. As expected, the IR of the fGn does not exhibit
significant oscillatory structure (range of IR values between 0 and 0.018).
Finally, to verify whether the structure of the Information Retention observed could be
achieved by chance, we shuffled each stationarized time series and recalculated their
ηmax1.000 times; thus, 21.000 scrambled series were used for the shuffling procedure. In
Figure S2a we show the ηmax values of our data versus the values from 100 shuffled
procedures of one time series (for more graphic clarity, instead of including the 1.000
obtained ηmax from the respective scrambled time series, we have only illustrated 100
ηmax). The probability distribution of ηmax values from our original data and the
probability distribution of the ηmax values from the 100 shuffled series are respectively
illustrated in Figure S2b and S2c. The result of this Information Retention analysis for
the scrambled series indicates that the values from the shuffled series (2.98 · 10�� ±1.78 · 10��, QRS9 ± @A) are at least four orders of magnitude smaller than the non-
shuffled ones, implying that the informational structures in all shuffled series were
completely lost, and therefore, the IR structure in the original calcium flows could not
be found by chance (� − [S'\R = 2.1 · 10��� in the Wilcoxon rank-sum test). In
conclusion, the Information Retention structure analysis of the experimental Ca2+ ion
series presents a high significance level.

15
Discussion Calcium is a key chemical element of the cell which participates in a wide variety of
physiological processes and plays a crucial role as a universal messenger in cellular
metabolism and signaling.
Here, in order to understand some of the informational properties of the intracellular
calcium signals we have studied experimental Ca2+ series of Xenopus laevis oocytes
under different external pH stimulus (acid, neutral and basic pH) by means of
information-theoretic approaches.
In short, the main conclusions of our study are the following:
I. Calcium series carry information.
The amount of information contained in the experimental time series has been analyzed
by means of Shannon's Entropy, finding that the quantity of information needed to
reproduce these calcium signals is high, close to the amount needed to reproduce a
completely unpredictable event such as fractional Gaussian noise.
II. Calcium series exhibit long-term memory.
The amount of uncertainty that can be predicted in the future when the past is known
has been measured in the Ca2+ ion fluxes using conditional Entropy. Our analysis has
shown that a lot of the information in the future is conditioned by the past in every
experimental time series (up to 86.3%of the uncertainty in the future on average was
conditioned by past information). This implies a high dependency between values and
also suggests the presence of memory.
The studied experimental series strongly correspond to the fractional Brownian motion
(see the Power Spectral Density plot analysis), and in order to quantify the level of
long-term memory in the Ca2+ ion flows, the data was studied by means of the bridge
detrended Scaled Windowed Variance analysis (Hurst exponent analysis) finding values
for the Hurst exponent 0.05 < � < 0.35, indicative of long-term memory effects in
all series. Values of � < 0.5 are interpreted as characteristic of ‘trend-reversing’ or
antipersistence. The behavior of the time series tends to reverse itself, for instance, a
decreasing trend in the past usually implies an increasing trend on average in the future
and conversely, an increase in the past is likely to be followed, on average, by a
decrease. The high reliability of our Hurst analysis was tested with a shuffling
procedure in which we scrambled the data in the original calcium signals. The values of
16
the Hurst exponent measured in the original series (which are strongly non-Gaussian)
were significantly different from the ones obtained in the randomly shuffled series. In
the Wilcoxon rank-sum test performed to compare the Hurst exponents of the calcium
series with the exponents of the shuffled data, we obtained a � − [S'\R = 2.13 · 10���.
Therefore, the significance of the values of the Hurst exponent measured in the original
calcium series is extremely high, practically impossible to be obtained by chance.
III. Calcium series are characterized by a highly organized informational structure.
The analysis of Information Retention shows an informational structure in which the
memory (uncertainty dependence level in the future as a function of the known
information in the past) is oscillating. In addition, the highest and lowest peaks of the
oscillation fluctuate erratically. The instability level of these maximums and minimums
of the informational structure was analyzed by means of the Largest Lyapunov
exponent, and all the calculated values were positive, which is characteristic of
deterministic chaotic behavior. This dynamics were corroborated by B-L method for
detecting chaos [82,83] with a p-value of 1, rejecting the absence of chaos.
The existence of chaotic patterns and long-term correlation properties in the
informational structure of the calcium series may constitute a biological advantage.
Chaotic patterns exhibit sensitive dependence on initial conditions, i.e., a small change
in the initial state will lead to large changes in posterior system states and the
fluctuations of the chaotic patterns are conditioned by the degree of perturbation of the
initial conditions. These changes show exponential divergence, provoking fast
separations in the chaotic trajectories. For “slow dynamic systems” the typical time
scale of the chaotic fluctuations is of the order of 1 µs [84, 85] and in “very fast chaotic
systems” the characteristic time scale is of about 1 ns [86,87]. Furthermore, different
studies have shown that chaos permits fast and highly efficiency transmission of
information [86].
The existence of chaos and long-term correlations in calcium series seems to constitute
a biological advantage by allowing fast, efficient and specific responses during the
adaptation of the cellular systems to environmental perturbations.
Besides, the informational structure with memory properties in the calcium series seems
to be related to the dynamic memory of the recently proposed theory of the Cellular
Metabolic Structure (CMS in short) [88]. At a systemic level, cells display a CMS,
which behaves as very complex decentralized information processing system with the
capacity to store metabolic memory [88, 89]. According to this newly published
17
framework, the CMS exhibits two essential dynamic informational mechanisms. The
first one occurs at the self-organized metabolic networks level, in which Hopfield-like
attractor dynamics regulate the enzymatic activities. These attractors have the capacity
to store functional catalytic patterns that can be correctly recovered by specific input
stimuli. Hopfield-like metabolic dynamics are stable and can be maintained as long-
term biochemical memory. The second mechanism occurs at the post-translational
modification level. Specific molecular information can be transferred from the
functional dynamics of the metabolic networks to the enzymatic activity involved in
covalent post-translational modification, so that determined functional memory can be
reversibly embedded in multiple stable molecular marks [88].
Since the beginning of the neuronal network modeling of associative memory, the
connectivity matrix in the Hopfield network was assumed to result from a long-term
memory learning process, occurring over a much slower time scale than neuronal
dynamics [90-95]. Therefore, it is well accepted that the attractors emerging in neuronal
dynamics described by Hopfield networks are the result of a long-term memory process.
Besides, extensive physiological recordings of neuronal processes have revealed the
presence of long range correlations in plasticity dynamics for measured synaptic
weights. For instance, long tails in the synaptic distribution of weights correspond to a
short-term memory in neural dynamics [96].
These studies and others support the thesis that neuronal dynamics exhibit both long-
term and short-term memory, and the same may happen with the CMS. In fact, long-
term correlations (mimicking short-term memory in neuronal systems) have also been
analyzed in different metabolic processes not belonging to the neuronal cell-type. One
of the most studied is the calcium-activated potassium channels, which have been
observed in Leydig cells [57, 97], kidney Vero cells [59] and human bronchial epithelial
cells [60]. Other biochemical processes also present long-term correlations, for
example, the intracellular transport pathway of Chlamydomonas reinhardtii [61], the
NADPH series of mouse liver cells [62], and the mitochondrial membrane potential of
cardiomyocytes [63]. Moreover, different biochemical numerical studies on enzymatic
pathways and dissipative metabolic networks also show long-term correlations [75-77].
We think that the long-term memory in the calcium series could correspond to the short
term memory of the dynamics in complex metabolic networks involved in the
regulation of intracellular calcium signals, but this issue requires further detailed
research.

18
Here, essential aspects of the information contained in experimental calcium fluxes have
been exhaustively analyzed. We have quantified this information in bits, finding a
highly organized informational structure which exhibits deterministic chaotic behavior,
long term memory and complex oscillations of the uncertainty reduction in the future
based on past values.
Understanding the informational properties of intracellular calcium signals is one of the
key elements to elucidate the physiological functional coupling of the cell and the
integrative dynamics of cellular life.

19
References 1. Berridge MJ, Bootman MD, Lipp P. Calcium – a life and death signal. Nature. 1998;395: 645–648. doi: 10.1038/27094. 2. Berridge MJ, Bootman MD, Roderick HL. Calcium signalling: dynamics, homeostasis and remodelling. Nature Reviews Molecular Cell Biology. 2003;4: 517–529. doi: 10.1038/nrm1155. 3. Vaughan H, Thornton SD, Newsholme EA. The effects of calcium ions on the activities of trehalase, hexokinase, phosphofructokinase, fructose diphosphatase and pyruvate kinase from various muscles. Biochem J. 1973;132(3): 527-535. 4. Goldie AH, Sanwal BD. Allosteric control by calcium and mechanism of desensitization of phosphoenolpyruvate carboxykinase of Escherichia coli. J Biol Chem. 1980;255(4): 1399-1405. 5. Sola-Penna M, Da Silva D, Coelho WS, Marinho-Carvalho MM, Zancan P. Regulation of mammalian muscle type 6-phosphofructo-1-kinase and its implication for the control of the metabolism. IUBMB Life. 2010;62(11): 791-796. doi: 10.1002/iub.393. 6. Robinson R. Structure of signaling enzyme reveals how calcium turns it on. PLoS Biol. 2010;8(7): e1000427. doi: 10.1371/journal.pbio.1000427 7. Bikle DD, Xie Z, Tu CL. Calcium regulation of keratinocyte differentiation. Expert Rev Endocrinol Metab. 2012;7(4): 461-472. doi: 10.1586/eem.12.34 8. Komuro H, Kumada T. Ca2+ transients control CNS neuronal migration. Cell Calcium. 2005;37: 387–393. doi: 10.1016/j.ceca.2005.01.006 9. Hepler PK. The role of calcium in cell division. Cell Calcium. 1994;16(4): 322-330. doi: 10.1016/0143-4160(94)90096-5 10. Orrenius S, Gogvadze V, Zhivotovsky B. Mitochondrial oxidative stress: implications for cell death. Annu Rev Pharmacol Toxicol. 2007;47: 143–183. doi: 10.1146/annurev.pharmtox.47.120505.105122 11. Steinhorst L, Kudla J. Calcium and reactive oxygen species rule the waves of signaling. Plant Physiol. 2013;163(2): 471-485. doi: 10.1104/pp.113.222950. 12. Lohmann C, Finski A, Bonhoeffer T. Local calcium transients regulate the spontaneous motility of dendritic filopodia. Nature Neuroscience. 2005;8: 305–312. doi: 10.1038/nn1406 13. Szalai G, Krishnamurthy R, Hajnoczky G. Apoptosis driven by IP3 linked mitochondrial calcium signals. EMBO J. 1999;18: 6349–6361. doi: 10.1093/emboj/18.22.6349

20
14. Jangi SM, Ruiz-Larrea MB, Nicolau-Galmés F, Andollo N, Arroyo-Berdugo Y, Ortega-Martínez I, et al. Terfenadine-induced apoptosis in human melanoma cells is mediated through Ca2+ homeostasis modulation and tyrosine kinase activity, independently of H1 histamine receptors. Carcinogenesis. 2008;29(3): 500–509. doi: 10.1093/carcin/bgm292 15. Nicolau-Galmés F, Asumendi A, Alonso-Tejerina E, Pérez-Yarza G, Jangi SM, Gardeazabal J, et al. Terfenadine induces apoptosis and autophagy in melanoma cells through ROS-dependent and -independent mechanisms. Apoptosis. 2011;16(12): 1253-1267. doi: 10.1007/s10495-011-0640-y. 16. Barclay JW, Morgan A, Burgoyne RD. Calcium-dependent regulation of exocytosis. Cell Calcium. 2005;38(3-4): 343-353. doi: 10.1016/j.ceca.2005.06.012 17. Spitzer NC, Olson E, Gu X. Spontaneous calcium transients regulate neuronal plasticity in developing neurons. J Neurobiol. 1995;26: 316–324. 18. Furukawa R, Maselli A, Thomson SA, Lim RW, Stokes JV, Fechheimer M. Calcium regulation of actin crosslinking is important for function of the actin cytoskeleton in Dictyostelium. J Cell Sci. 2003;116: 187-196. doi: 10.1242/jcs.00220 19. Gomes TM, Spitzer NC. In vivo regulation of axon extension and pathfinding by growth-cone calcium transients. Nature. 1999;397: 350–355. doi: 10.1038/16927 20. Redmond L, Gosh A. Regulation of dendritic development by calcium signalling. Cell Calcium. 2005;37: 411–416. doi: 10.1016/j.ceca.2005.01.009 21. Sudhof TC. The synaptic vesicle cycle. Annu Rev Neurosci. 2004;27: 509–547. doi: 10.1146/annurev.neuro.26.041002.131412 22. Fields RD, Eshete F, Stevens B, Itoh K. Action potential-dependent regulation of gene expression: temporal specificity in Ca2 +, cAMP-responsive element binding proteins, and mitogen-activated protein kinase signaling. J Neurosci. 1997;17(19): 7252–7266. 23. Hu Q, Deshpande S, Irani K, Ziegelstein RC. [Ca2 +](i) oscillation frequency regulates agonist-stimulated NF-kappaB transcriptional activity. J Biol Chem. 1999;27(4): 33995–33998. doi: 10.1074/jbc.274.48.33995 24. Fields RD, Lee PR, Cohen JE. Temporal integration of intracellular Ca2+ signaling networks in regulating gene expression by action potentials. Cell Calcium. 2005;37(5): 433-442. doi: 10.1016/j.ceca.2005.01.011 25. Zhang S-J, Zou M, Lu L, Lau D, Ditzel DAW, Delucinge-Vivier C, et al. Nuclear Calcium Signaling Controls Expression of a Large Gene Pool: Identification of a Gene Program for Acquired Neuroprotection Induced by Synaptic Activity. Plos Genet. 2009;5(8): e1000604. doi: 10.1371/journal.pgen.1000604
21
26. Nakao A, Takada Y, Mori Y. [Calcium channels regulate neuronal function, gene expression, and development]. Brain Nerve. 2011;63(7): 657-667. 27. Bengtson CP, Bading H. Nuclear calcium signaling. Adv Exp Med Biol. 2012;970: 377-405. doi: 10.1007/978-3-7091-0932-8_17. 28. Hayer SN, Bading H. Nuclear Calcium Signaling Induces Expression of the Synaptic Organizers Lrrtm1 and Lrrtm2. J Biol Chem. 2014;2015 290: 5523-5532. doi: 10.1074/jbc.M113.532010 29. Dupont G, Combettes L, Bird GS, Putney JW. Calcium oscillations. Cold Spring Harb Perspect Biol. 2011;3(3). pii: a004226. doi: 10.1101/cshperspect.a004226. 30. Dawson AP. Calcium signalling: how do IP3 receptors work? Curr Biol. 1997;7(9): R544-R547. doi: 10.1016/S0960-9822(06)00277-6 31. Krauss G. Biochemistry of Signal Transduction and Regulation. 4th edition. Silverthorn; 2007. 32. Brini M, Calì T, Ottolini D, Carafoli E. Intracellular calcium Hhomeostasis and signaling. In: Banci L, Eeditors. Metallomics and the cell. Metal ions in life sciences. Springer; 2013; 12. pp 120-154. doi: 10.1007/978-94-007-5561-1_5. 33. Dupont G. Modeling the intracellular organization of calcium signaling. Wiley Interdiscip Rev Syst Biol Med. 2014;6(3): 227-237. doi: 10.1002/wsbm.1261. 34. De la Fuente IM. Quantitative analysis of cellular metabolic dissipative, self organized structures. Int J Mol Sci. 2010;11(9): 3540-3599. doi: 10.3390/ijms11093540. 35. De la Fuente IM. Metabolic Dissipative Structures in Systems Biology of Metabolic and signaling Networks: Energy, Mass and Information Transfer In: Aon MA, Saks V, Schlattner U, Editors. Systems Biology of Metabolic and Signaling Networks. Springer; 2013. pp 179-211 36. Goldbeter A. Computational approaches to cellular rhythms. Nature. 2002;420(6912): 238-245. doi: 10.1038/nature01259. 37. Goldbeter A. Biological rhythms as temporal dissipative structures. In: Special volume in memory of Ilya Prigogine: Adv Chem Phys. 2007;135: 253-295. doi: 10.1002/9780470121917.ch8. 38. Nicolis G, Prigogine I. Self-organization in nonequilibrium systems: From dissipative structures to order through fluctuations. Wiley; 1977. 39. Ishii K, Hirose K, Iino M. Ca2+ shuttling between endoplasmic reticulum and mitochondria underlying Ca2+ oscillations. EMBO. 2006;7: 390–396. doi: 1038/sj.embor.7400620 40. Newman EA. Propagation of intercellular calcium waves in retinal astrocytes and Müller cells. J Neurosci. 2001;21(7): 2215-2223.

22
41. Bernardinelli Y, Magistretti PJ, Chatton JY. Astrocytes generate Na+-mediated metabolic waves. Proc Natl Acad Sci USA. 2004;101(41): 14937–14942. doi: 10.1073/pnas.0405315101 42. Slaby O, Lebiedz D. Oscillatory NAD(P)H waves and calcium oscillations in neutrophils? A modeling study of feasibility. Biophys J. 2009;96: 417–428. doi: 10.1016/j.bpj.2008.09.044 43. Goldbeter A, Dupont G, Berridge MJ. Minimal model for signal-induced Ca2+ oscillations and for their frequency encoding through protein phosphorylation. Proc Nat Acad Sci. 1990;87: 1461–1465 44. Thomas AP, Bird GS, Hajnóczky G, Robb-Gaspers LD, Putney JW. Spatial and temporal aspects of cellular calcium signalling. FASEB J. 1996;10: 1505–1517 45. Schuster S, Marhl M, Höfer T. Modelling of simple and complex calcium oscillations. From single-cell responses to intercellular signalling. Eur J Biochem. 2002;269: 1333-1355. doi: 10.1046/j.0014-2956.2001.02720.x
46. Dupont G, Combettes L. Modeling the effect of specific inositol 1,4,5-trisphosphate receptor isoforms on cellular Ca2+ signals. Biol Cell. 2006;98: 171–182. doi: 10.1042/BC20050032
47. Ventura AC, Sneyd J. Calcium oscillations and waves generated by multiple release mechanisms in pancreatic acinar cells. Bull Math Biol. 2006;68: 2205–2231. doi: 10.1007/s11538-006-9101-0 48. Dupont G, Abou-Lovergne A, Combettes L. Stochastic aspects of oscillatory Ca2+
dynamics in hepatocytes. Biophys J. 2008;95: 2193–2202. doi: 10.1529/biophysj.108.133777. 49. Wieder N, Fink R, von Wegner F. Exact stochastic simulation of a calcium microdomain reveals the impact of Ca²⁺ fluctuations on IP₃R gating. Biophys J. 2015;108(3): 557-567. doi: 10.1016/j.bpj.2014.11.3458. 50. Rückl M, Parker I, Marchant JS, Nagaiah C, Johenning FW, Rüdiger S. Modulation of elementary calcium release mediates a transition from puffs to waves in an IP3R cluster model. Plos Comput Biol. 2015;11(1): e1003965. doi: 10.1371/journal.pcbi.1003965 51. Berridge M. Inositol trisphosphate and calcium signalling. Nature. 1993;361(6410): 315–325 52. Larsen AZ, Kummer U. Information Processing in Calcium Signal Transduction. In: Falcke M, Malchow D, editors. Understanding Calcium Dynamics: Experiments and Theory (Lecture Notes in Physics). Berlin: Springer Verlag. 2003. 53. Larsen AZ, Olsen L, Kummer U. On the encoding and decoding of calcium signals in hepatocytes. Biophys Chem. 2004;107: 83-99. doi: 10.1016/j.bpc.2003.08.010
23
54. De Pittà M, Volman V, Levine H, Ben-Jacob E. Multimodal encoding in a simplified model of intracellular calcium signaling. Cogn Process. 2009;10 Suppl 1:S55-70. doi: 10.1007/s10339-008-0242-y. 55. Prank K, Gabbiani F, Brabant G. Coding efficiency and information rates in transmembrane signaling. Biosystems. 2000;55(1-3):15-22. 56. Nakano T, Liu J-Q. Information transfer through calcium signaling In: Schmid A, Goel S, Wang W, Beiu V, Carrara S, editors. Lecture Notes of the Institute for Computer Sciences, Social Informatics and Telecommunications Engineering. Springer; 2009. pp 29-33 57. Nogueira RA, Varanda WA, Liebovitch LS. Hurst analysis in the study of ion channel kinetics. Braz J Med Biol Res. 1995;28(4): 491-496. 58. Varanda WA, Liebovitch LS, Figueiroa JN, Nogueira RA. Hurst analysis applied to the study of single calcium-activated potassium channel kinetics. J Theor Biol. 2000;206(3): 343-353. 59. Kazachenko VN, Astashev ME, Grinevic AA. Multifractal analysis of K+ channel activity. Biochemistry. 2007;2: 169-175. 60. Wawrzkiewicz A, Pawelek K, Borys P, Dworakowska B, Grzywna ZJ. On the simple random-walk models of ion-channel gate dynamics reflecting long-term memory. Eur Biophys J. 2012;41(6): 505-526. doi: 10.1007/s00249-012-0806-8. 61. Ludington WB, Wemmer KA, Lechtreck KF, Witman GB, Marshall WF. Avalanche-like behavior in ciliary import. Proc Natl Acad Sci USA. 2013;110(10): 3925-3930. doi: 10.1073/pnas.1217354110. 62. Ramanujan VK, Biener G, Herman B. Scaling behavior in mitochondrial redox fluctuations. Biophys J. 2006;90: L70-L72. doi: 10.1529/biophysj.106.083501. 63. Aon MA, Roussel MR, Cortassa S, O’Rourke B, Murray DB, Beckmann M, et al. The scale-free dynamics of eukaryotic cells. Plos One. 2008;3(11):e3624. doi: 10.1371/journal.pone.0003624. 64. Pahle J, Green AK, Dixon CJ, Kummer U. Information transfer in signaling pathways: a study using coupled simulated and experimental data. BMC Bioinformatics. 2008;9: 139. doi: 10.1186/1471-2105-9-139. 65. Wibral M, Lizier JT, Vögler S, Priesemann V, Galuske R. Local active information storage as a tool to understand distributed neural information processing. Front Neuroinform. 8:1. doi: 10.3389/fninf.2014.00001 66. Wibral M, Pampu N, Priesemann V, Siebenhühner F, Seiwert H, Lindner M, et al. Measuring information-transfer delays. Plos One. 2013;8(2): e55809. doi: 10.1371/journal.pone.0055809.
24
67. Dascal N, Landau EM, Lass Y. Xenopus oocyte resting potential, muscarinic responses and the role of calcium and guanosine 3’,5’-cyclic monophosphate. J Physiol. 1984 Jul;352: 551-574. 68. Dascal N, Gillo B, Lass Y. Role of calcium mobilization in mediation of acetylcholine-evoked chloride currents in Xenopus laevis oocytes. J Physiol. 1985;366: 299-313. 69. Tigyi G, Dyer D, Matute C, Miledi R. A serum factor that activates the phosphatidylinositol phosphate signaling system in Xenopus oocytes. Proc Natl Acad Sci USA. 1990;87(4): 1521-1525. 70. Thomas JA, Thomas JA. Elements of information theory. 2nd ed. Wiley; 2006 71. Cannon MJ, Percival DB, Caccia DC, Raymond GM, Bassingthwaighte JB. Evaluating scaled windowed variance methods for estimating the Hurst coefficient of time series. Physica A. 1997;241: 606-626. doi: 10.1016/S0378-4371(97)00252-5 72. Eke A, Hermán P, Bassingthwaighte JB, Raymond GM, Percival DB, Cannon M, et al. Physiological time series: distinguishing fractal noises from motions. Pflugers Arch. 2000;439(4):403-415.
73. Raimond G. Fractal analysis programs of the national simulation resource. 2013. Available: http://www.physiome.org/software/fractal/
74. Caccia DC, Percival DB, Cannon MJ, Raymond GM, Bassingthwaight JB. Analyzing exact fractal time series: evaluating dispersional analysis and rescaled range methods. Physica A. 1997;246: 609-632. doi: 10.1016/S0378-4371(97)00363-4 75. De la Fuente IM, Martínez L, Aguirregabiria JM, Veguillas J. R/S analysis in strange attractors. Fractals. 1998;6(2): 95-100. doi: 10.1142/S0218348X98000110 76. De la Fuente IM, Martínez L, Benitez N, Veguillas J, Aguirregabiria JM. Persistent behavior in a phase-shift sequence of periodical biochemical oscillations. Bull Mathemat Biol. 1998;60(4): 689-702. doi: 10.1006/bulm.1997.0036 77. De la Fuente IM, Martínez L, Aguirregabiria JM, Veguillas J, Iriarte M. Long-range correlations in the phase-shifts of numerical simulations of biochemical oscillations and in experimental cardiac rhythms. Journal of Biological Systems. 1999; 7(2):113-130. doi: 10.1142/S0218339099000103 78. De la Fuente IM, Martínez L, Veguillas J and Aguirregabiria J M. Coexistence of multiple periodic and chaotic regimes in biochemical oscillations. Acta Biotheoretica. 1998; 46:37-51. doi: 10.1023/A:1000899820111 79. De La Fuente IM, Benítez N, Santamaría A, Veguillas J, Aguirregabiria JM. Persistence in metabolic nets. Bull Mathemat Biol. 1999; 61:573–595.
25
80. De la Fuente IM, Pérez-Samartín A, Martínez L, García MA, Vera-López A. Long-range correlations in rabbit brain neural activity. Annals of Biomedical Engineering. 2006; 34: 295-299. doi: 10.1007/s10439-005-9026-z 81. Herman P, Eke A. Nonlinear analysis of blood cell flux fluctuations in the rat brain cortex during stepwise hypotension challenge. J Cereb Blood Flow Metab. 2006; 26(9): 1189-1197. doi: 10.1038/sj.jcbfm.9600266 82. Ben Saïda A, Litimi H. High level chaos in the exchange and index markets. Chaos, Solitons & Fractals. 2013;2054: 90-95. doi: 10.1016/j.chaos.2013.06.004 83. BenSaïda A. Noisy chaos in intraday financial data: Evidence from the American index. Applied Mathematics and Computation. 2014;226: 258-265. 84. Blakely NJ, Illing L, Gauthier JD. Controlling fast chaos in delay dynamical. Syst Phys Rev Lett. 2004;92: 193901. 85. Garfinkel A, Spano ML, Ditto WL, Weiss JN. Controlling cardiac chaos. Science. 1992;257: 1230–1235. 86. VanWiggeren GD, Roy R. Communication with chaotic lasers. Science. 1998;279: 1198–1200. doi: 10.1126/science.279.5354.1198 87. Dronov V, Hendrey MR, Antonsen TM, Ott E. Communication with a chaotic travelling wave tube microwave generator. Chaos. 2004;14(1);30-37 doi: 10.1063/1.1622352 88. De la Fuente IM. Elements of the cellular metabolic structure. Front Mol Biosci. 2015;2: 16. doi: 10.3389/fmolb.2015.00016 89. De la Fuente IM, Cortes JM, Pelta DA, Veguillas J. Attractor Metabolic Networks. Plos One. 2013; 8(3): e58284. doi: 10.1371/journal.pone.0058284 90. Willshaw DJ, Buneman OP, Longuet-Higgins HC. Non-holographic associative memory. Nature. 1969;222: 960-962. doi: 10.1038/222960a0. 91.Van Heerden PJ. Models for the brain. Nature. 1970;225: 177-178. doi: 10.1038/225177a0. 92. Amari S-I. Homogeneous nets of neuron-like elements. Biol Cybern. 1975;17: 211-220. doi: 10.1007/BF00339367. 93. Hopfield JJ. Neural networks and physical systems with emergent collective computational abilities. Proc Nat Acad Sci USA. 1982;79(8): 2554-2558. doi: 10.1073/pnas.79.8.2554. 94. Amit DJ. Modeling brain function. – the world of attractor neural networks. New York: Cambridge University Press; 1989.

26
95. Hertz J, Krogh A, Palmer RG. Introduction to the theory of neural computation. Boston: Addison-Wesley Longman Publishing Co; 1991 96. Barbour B, Brunel N, Hakim V, Nadal JP. What can we learn from synaptic weight distributions? Trends Neurosci. 2007;30(12): 622-629. doi: 10.1016/j.tins.2007.09.005. 97. Bandeira HT, Barbosa CT, De Oliveira RA, Aguiar JF, Nogueira RA. Chaotic model and memory in single calcium-activated potassium channel kinetics. Chaos. 2008;18(3): 033136. doi: 10.1063/1.2944980.93. Hopfield JJ. Neural networks and physical systems with emergent collective computational abilities. Proc. Nat. Acad. Sci. USA. 1982;79(8): 2554-2558. doi: 10.1073/pnas.79.8.2554. 94. Amit D. Modeling Brain Function. New York: Cambridge University Press; 1989. 95. Hertz J, Krogh A, Palmer RG. Introduction to the theory of neural computation. Boston: Addison-Wesley Longman Publishing Co; 1991 96. Barbour B, Brunel N, Hakim V, Nadal JP. What can we learn from synaptic weight distributions?. Trends Neurosci. 2007;30(12): 622-629. doi:10.1016/j.tins.2007.09.005. 97. Bandeira HT, Barbosa CT, De Oliveira RA, Aguiar JF, Nogueira RA. Chaotic model and memory in single calcium-activated potassium channel kinetics. Chaos. 2008;18(3): 033136. doi: 10.1063/1.2944980.
27
Figure 1
Figure 1. Experimental calcium oscillations in Xenopus laevis oocyte. The calcium time series have been analyzed under three different pH conditions, Ringer’s solution at pH 5.0, 7.0 and 9.0 (acid, neutral and basic pH). In the figure three prototype calcium signals obtained from the same cell are represented (experiment 4). a: pH 5.0 (n10), b: pH 7.0 (n11), c: pH 9.0 (n12). Each time series has 130.000 points, which correspond to an event 65.000 milliseconds long. The vertical axis (Φ) correspond to the electrical potential measured in nanoampers (nA).

28
Figure 2
Figure 2: Power spectrum estimation for the three pH values. Illustration of the power spectrum estimation (in a log-log scale) of the calcium series for different pH values. a: n1, experiment 1, pH=5.0; b: n2, experiment 1, pH=7.0; c: n3, experiment 1, pH=9.0. Slope values (from top to bottom) were 2.02, 1.97, 2.37, indicating for the three cases a fractional Brownian motion (fBm).

29
Figure 3
Figure 3. Hurst exponents obtained by the bdSWV analysis in calcium series. a: In red, the slope of a log-log plot of the SDi versus the window size for a calcium series (n13, experiment 5, pH5.0) gives � = 0.104 for Hurst’s exponents which indicates the presence of long term memory. In blue, the slope of a dispersion analysis applied to a 'scrambled' time series obtained by permuting randomly all of the 130.000 time points of the same series (n13). In these scrambled series the informational structure is destroyed and the values of H are close to 0.5, which is indicative that the long-term memory has been lost. b: in red, Hurst exponent values of the all experimental time series; in blue, Hurst exponent values obtained after being shuffled all the original calcium series.
30
Figure 4
Figure 4. Information Retention structure in calcium signals. Representation of the Information Retention calculated during 1000 lags under different pH stimuli (experiment 4), in which it can be observed that the uncertainty dependence level in the future as a function of the known information in the past is oscillating. a: IR from a stationarized calcium time series under pH5.0 (n10). b: IR from the same oocyte stimulated with pH7.0 (n11). c: IR from the same oocyte stimulated with pH9.0 (n12).

31
Figure 5
Figure 5. Chaotic behavior emerges in the Information retention structure. Representation of the IR maximum values (n20, experiment 7, pH7.0). This maximums where obtained from the IR of a time series along 10.000 lags. The vertical axis correspond to the maximum Information Retention (γ), the horizontal axis shows the time lag.
32
Figure S1
Figure S1. Information Retention comparison between a calcium series and a fractional Gaussian noise. a: Top, a fragment of stationarized 500 points taken from an experimental time series (n18, experiment 6, pH9.0), the series is represented on the highest panel. Bottom, the Information Retention correspondent to this data. b: Stationarized Gaussian noise with mean �̅ = 0 and variance b = 1, and its IR.

33
Figure S2
Figure S2. Shuffling procedure analysis of the Information Retention. a: In red, maximum IR values belonging to the 21 experimental time series. In blue, the maximum IR values obtained after all the original calcium series were shuffled. The IR of the shuffled time series are four orders of magnitude smaller than the ones from the non-shuffled series, which indicates that in these scrambled series the information retention structure has been destroyed. b: Probability distribution of the IR from the shuffled time series. c: Probability distribution of the IR from the experimental time series.

34
Table 1 Experiment Stimulus Number E CE η 1
pH5.0 n1 0,7903 0,3139 0,6028 pH7.0 n2 0,7838 0,2941 0,6247 pH9.0 n3 0,7107 0,2440 0,6567
2
pH5.0 n4 0,9156 0,4059 0,5566 pH7.0 n5 0,9174 0,4035 0,5601 pH9.0 n6 0,9095 0,3757 0,5869
3
pH5.0 n7 0,8410 0,3685 0,5617 pH7.0 n8 0,8314 0,3781 0,5447 pH9.0 n9 0,8133 0,3628 0,5538
4
pH5.0 n10 0,6921 0,2529 0,6320 pH7.0 n11 0,6101 0,2360 0,6086 pH9.0 n12 0,6561 0,2405 0,6307
5
pH5.0 n13 0,6110 0,2577 0,5731 pH7.0 n14 0,6274 0,2533 0,5935 pH9.0 n15 0,6670 0,2810 0,5757
6
pH5.0 n16 0,5525 0,2503 0,5433 pH7.0 n17 0,6429 0,2548 0,6027 pH9.0 n18 0,5495 0,2733 0,5022
7
pH5.0 n19 0,6728 0,2221 0,6698 pH7.0 n20 0,7118 0,2382 0,6653 pH9.0 n21 0,7330 0,2818 0,6155
The first column shows the number of the experiment, each corresponding to a single oocyte. The second column contains the pH stimuli applied to each experiment. The third shows the number assigned to each obtained series. The rest of the values correspond to informational measures: Shannon Entropy (E), conditional Entropy (CE) and Information Retention (η).
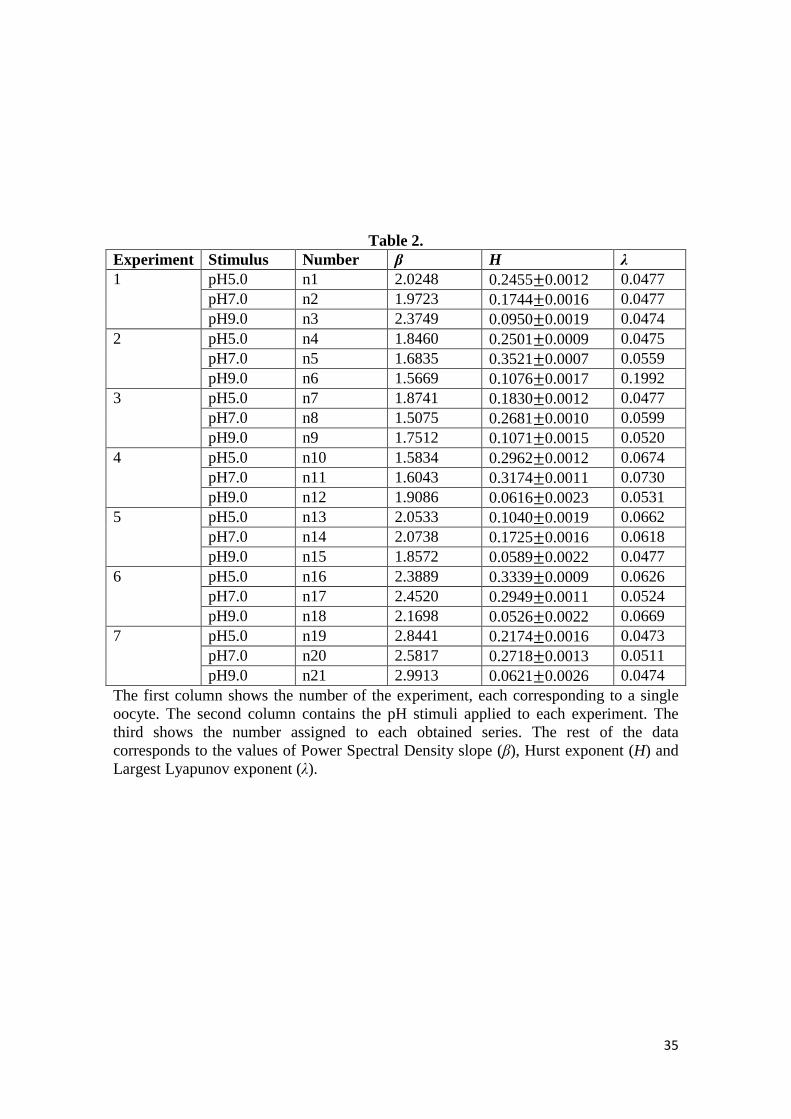
35
Table 2. Experiment Stimulus Number β H λ 1
pH5.0 n1 2.0248 0.2455±0.0012 0.0477 pH7.0 n2 1.9723 0.1744±0.0016 0.0477 pH9.0 n3 2.3749 0.0950±0.0019 0.0474
2
pH5.0 n4 1.8460 0.2501±0.0009 0.0475 pH7.0 n5 1.6835 0.3521±0.0007 0.0559 pH9.0 n6 1.5669 0.1076±0.0017 0.1992
3
pH5.0 n7 1.8741 0.1830±0.0012 0.0477 pH7.0 n8 1.5075 0.2681±0.0010 0.0599 pH9.0 n9 1.7512 0.1071±0.0015 0.0520
4
pH5.0 n10 1.5834 0.2962±0.0012 0.0674 pH7.0 n11 1.6043 0.3174±0.0011 0.0730 pH9.0 n12 1.9086 0.0616±0.0023 0.0531
5
pH5.0 n13 2.0533 0.1040±0.0019 0.0662 pH7.0 n14 2.0738 0.1725±0.0016 0.0618 pH9.0 n15 1.8572 0.0589±0.0022 0.0477
6
pH5.0 n16 2.3889 0.3339±0.0009 0.0626 pH7.0 n17 2.4520 0.2949±0.0011 0.0524 pH9.0 n18 2.1698 0.0526±0.0022 0.0669
7
pH5.0 n19 2.8441 0.2174±0.0016 0.0473 pH7.0 n20 2.5817 0.2718±0.0013 0.0511 pH9.0 n21 2.9913 0.0621±0.0026 0.0474
The first column shows the number of the experiment, each corresponding to a single oocyte. The second column contains the pH stimuli applied to each experiment. The third shows the number assigned to each obtained series. The rest of the data corresponds to the values of Power Spectral Density slope (β), Hurst exponent (H) and Largest Lyapunov exponent (λ).


![Regulation of Intracellular Calcium Signaling, Localized Signals … · 2015-12-25 · in Cerebellar Purkinje Cells Rat cerebellar slice [12 days PN]; Polyclonal antibody for type](https://img.dokumen.tips/doc/110x75/5cd3fee888c993de288ba23c/regulation-of-intracellular-calcium-signaling-localized-signals-2015-12-25.jpg)