Embed Size (px)
DESCRIPTION
INFORMATICS PLANNING CONFERENCE (27-28 November ) Domestic Student Numbers and Trends for 2009. Postgraduate Trends. Overall downward trend Research enrolments decreasing since 2002 Coursework enrolments decreasing since 2002 PhD enrolments decreasing since 2002. Undergraduate Trends. - PowerPoint PPT Presentation
Citation preview

University of Wollongong
Faculty of Informatics
INFORMATICS PLANNING CONFERENCE
(27-28 November)
Domestic Student Numbers and Trends for 2009

University of Wollongong
Faculty of Informatics
95
57
75
4245 43
36
0
10
20
30
40
50
60
70
80
90
100
2002 2003 2004 2005 2006 2007 2008
Total PG Domestic Commencers 2002 - 2008

University of Wollongong
Faculty of Informatics
55
8
4
11
1
4
6
1
2
8
1 1
3
1
5
4
2 2 2
0
1
2
3
4
5
6
7
8
2002 2003 2004 2005 2006 2007 2008
SECTE PG Domestic Commencers 2002 - 2008
Research
Coursework
PhD

University of Wollongong
Faculty of Informatics
12
42
18
7
27
12
13
34
11
5
14
6
11
16
8 75
10
3 2
6
1
75
0
5
10
15
20
25
30
35
40
45
2002 2003 2004 2005 2006 2007 SCSSE SISAT
SITACS / SCSSE-SISAT PG Domestic Commencers 2002 - 2008
Research
Coursework
PhD

University of Wollongong
Faculty of Informatics
1
2 2
0
2
3
2
1
33
2
1
0 0
5
0
4
7
0
3 3
0
1
2
3
4
5
6
7
2002 2003 2004 2005 2006 2007 2008
SMAS PG Domestic Enrolment 2002 - 2008Research
Coursework
PhD

University of Wollongong
Faculty of Informatics
Postgraduate Trends
• Overall downward trend
• Research enrolments decreasing since 2002
• Coursework enrolments decreasing since 2002
• PhD enrolments decreasing since 2002
University of Wollongong
Faculty of Informatics
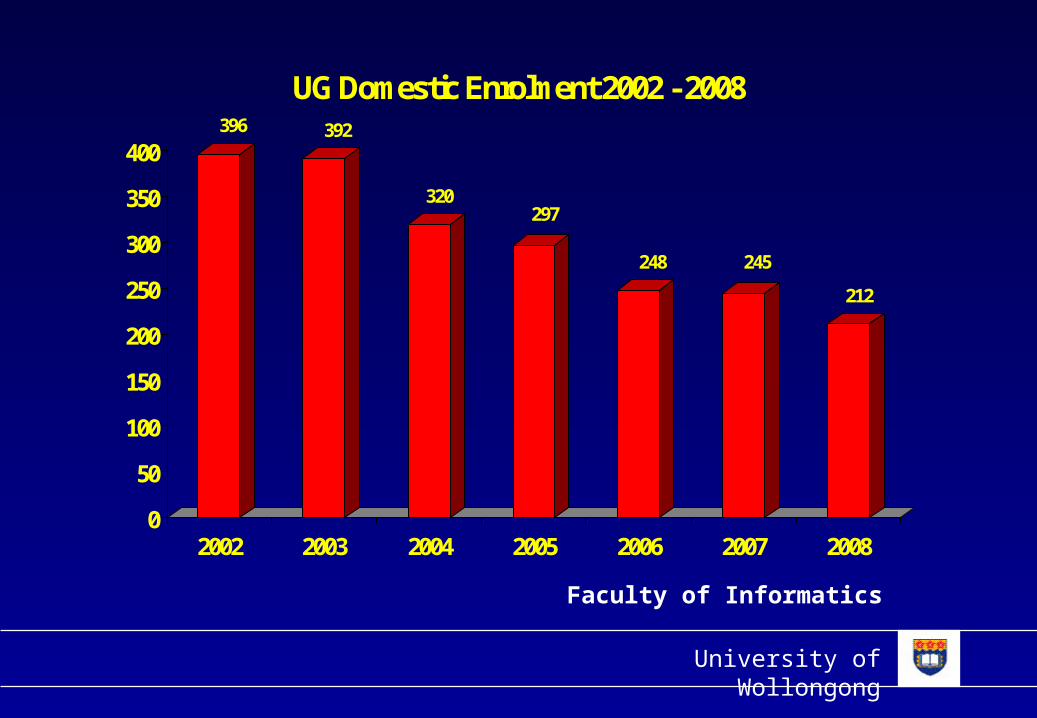
396 392
320297
248 245
212
0
50
100
150
200
250
300
350
400
2002 2003 2004 2005 2006 2007 2008
UG Domestic Enrolment 2002 - 2008
University of Wollongong
Faculty of Informatics
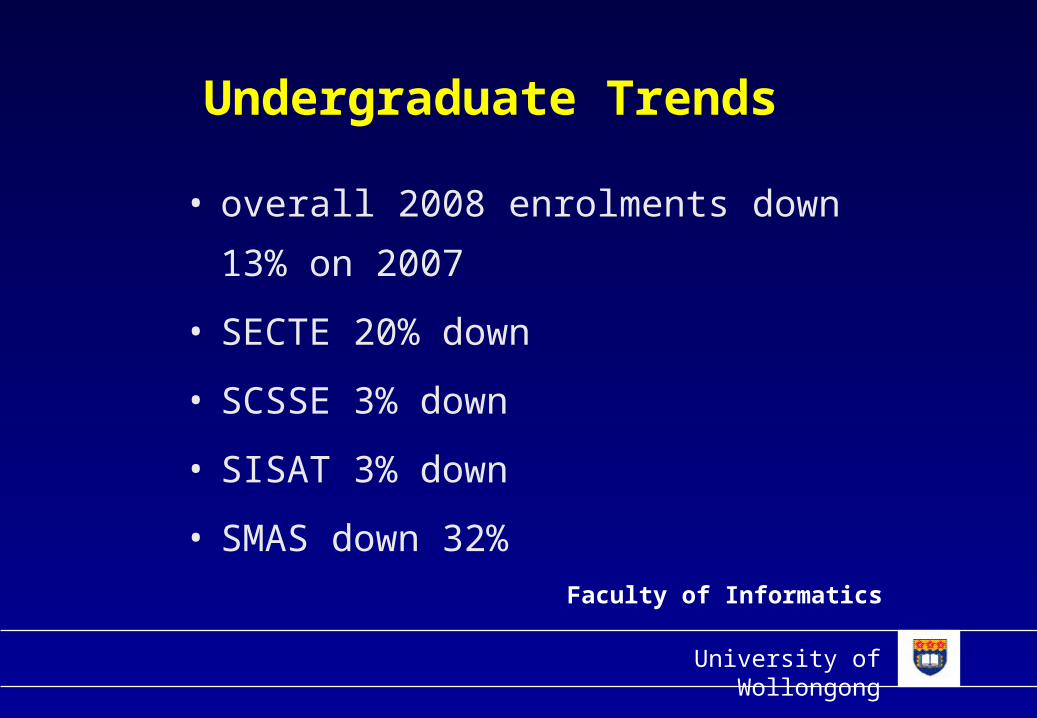
Undergraduate Trends
• overall 2008 enrolments down 13% on 2007
• SECTE 20% down
• SCSSE 3% down
• SISAT 3% down
• SMAS down 32%
University of Wollongong
Faculty of Informatics
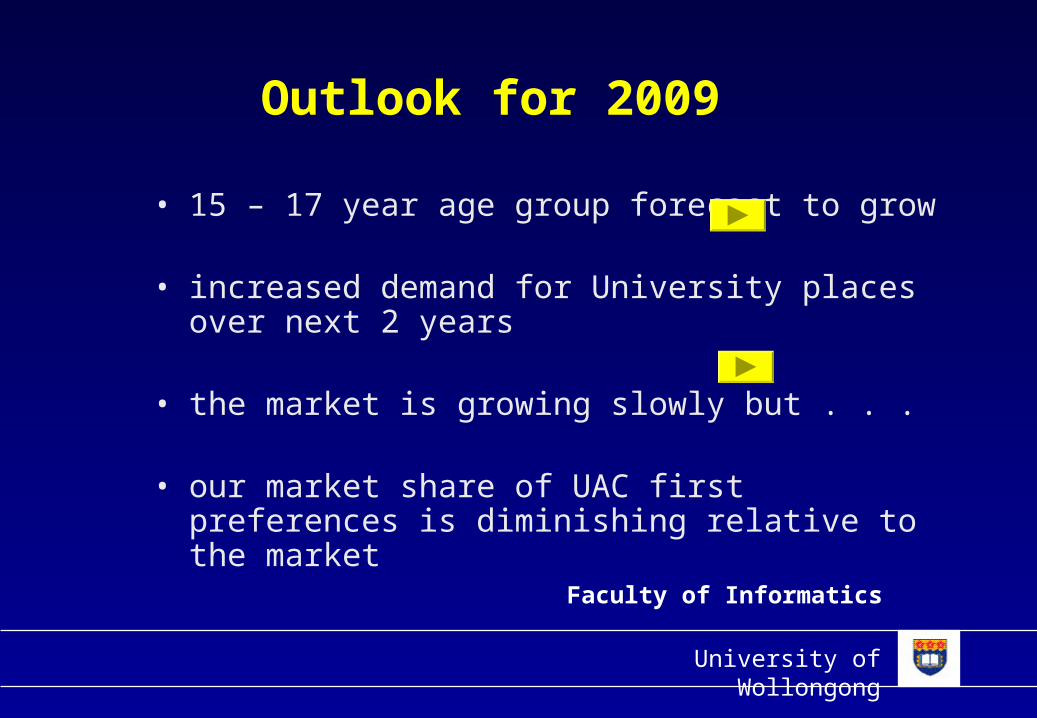
Outlook for 2009
• 15 – 17 year age group forecast to grow
• increased demand for University places over next 2 years
• the market is growing slowly but . . .
• our market share of UAC first preferences is diminishing relative to the market

University of Wollongong
Faculty of Informatics
0
50
100
150
200
250
300
2002 2003 2004 2005 2006 2007 2008
UG Domestic Enrolment 2002 - 2008
UAC
Direct

University of Wollongong
Faculty of Informatics
2003 2004 2005 2006 2007 2008
241
220
178
264
251
234
0
50
100
150
200
250
300
Total Early Entry Registrations 2003 - 2008

University of Wollongong
Faculty of Informatics
Current First Preferences against Quota( as at 21 November 2008)
239237
210
215
220
225
230
235
240
245
250
Total Pref s Quota

University of Wollongong
Faculty of Informatics
UAC First Prefs against Quota by School
55
92
4943
53
81
69
33
0
20
40
60
80
100
SECTE SCSSE SISAT SMAS
Total Prefs
Quota
University of Wollongong
Faculty of Informatics
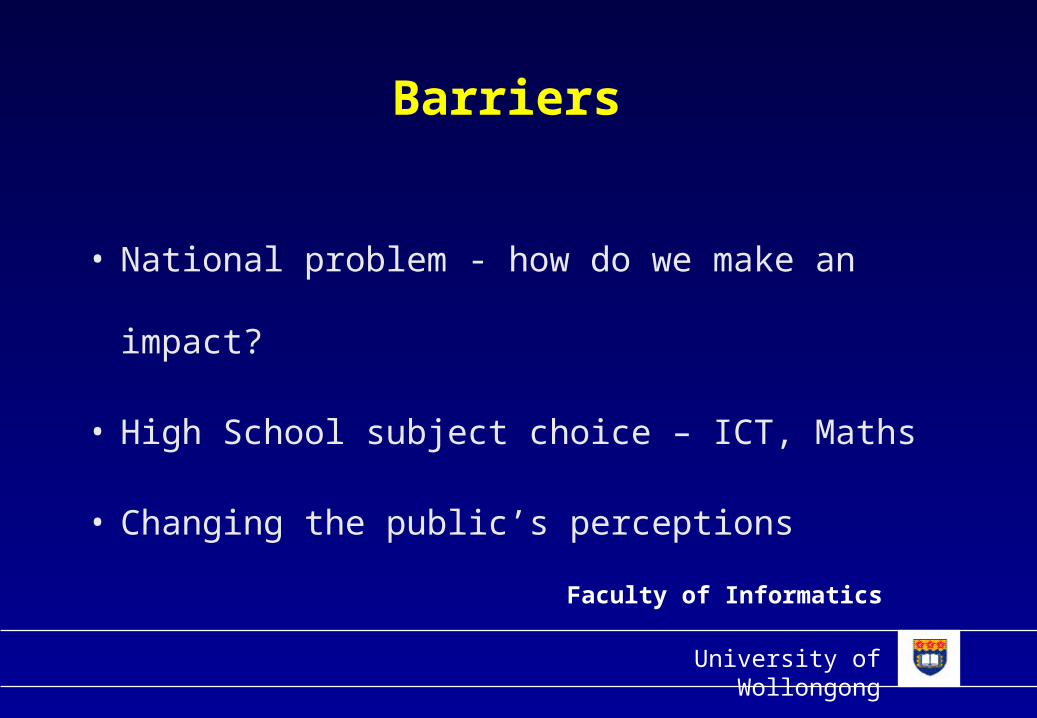
Barriers
• National problem - how do we make an impact?
• High School subject choice – ICT, Maths
• Changing the public’s perceptions

University of Wollongong
Faculty of Informatics
Challenges
• Marketing– Enrichment program, High School Challenge, Women in
Engineering
– New ideas wanted!!
University of Wollongong
Faculty of Informatics
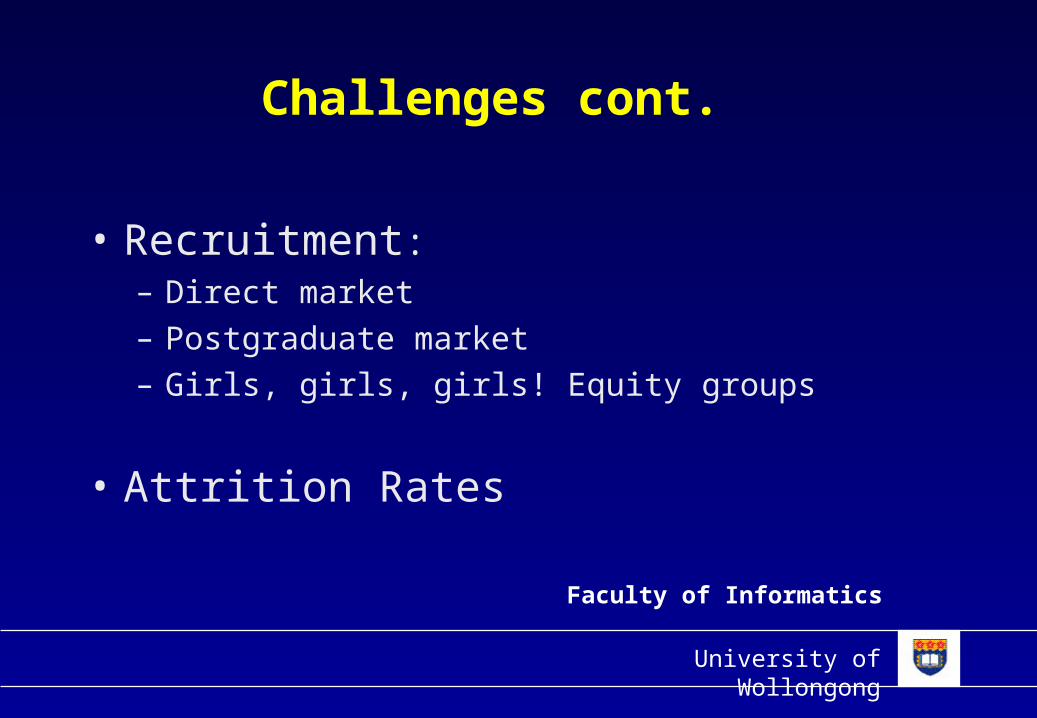
Challenges cont.
• Recruitment:– Direct market– Postgraduate market– Girls, girls, girls! Equity groups
• Attrition Rates

University of Wollongong
Faculty of Informatics
• Things are looking up…our first preferences are currently
higher than last year’s at this time
• Ring-around and forced offers process is still vital
Where to Now?