Embed Size (px)
Citation preview

Influence of test parameters on the on-load tap changer’s dynamic resistance measurement
Julian Aditya
Delft University of Technology
Electrical Engineering, Mathematics and Computer Science
High Voltage Components and Power System
August 2010

Influence of test parameters on the on-load tap changer’s dynamic resistance measurement
Julian Aditya
Delft University of Technology Electrical Engineering, Mathematics and Computer Science
High Voltage Components and Power System
Delft, August 2010
MSc thesis committee: Prof. dr. J.J. Smit dr. ir. P. Bauer
J.J. Erbrink, MSc

iii
Acknowledgements
This master graduation project has been done based on personal interest of the author to the high voltage technology. It requires a lot of effort, creativities, responsibilities, as well as technical support. Therefore this work would not be accomplished without cooperation and information from other people. Their generosity is countless.
First of all, I address my gratitude to my supervisors: Prof. Dr. Ir. Edward Gulski for giving the opportunity to work on this project, and for his enthusiasm and guidance during the thesis work. Special gratitude is addressed to Jur Erbrink MSc, for his kindness, guidance and valuable discussion. He has spent his valuable time to support me theoretically as well as technically.
The technical part of this project was done in the field as well as in the High Voltage laboratory of TU Delft. Thus I would like to thank people from Liandon: Rory Leich, Nico Sinnige and Philip Salverda for allowing me conducted the measurement in Liandon’s substations. To Piet, Bob, Jur, Velco and other maintenance crews for their support and discussion during the measurement in the substation. At university, I would like to address my thanks to Ing. Paul van Nes, Aad van der Graaf and Wim Termorshuizen for their support, valuable thinking and discussion.
Furthermore, there are people who have been indirectly involved in this graduation project. My laboratory colleagues: Endah, Corné, Richard, Arie, Felicia, Ravish and Jin; and all my friends in Netherlands as well as in Indonesia. I thank them for their cooperation, time to share and support. Last but not least, my deepest gratitude to my parents and my sister for their endless love and support.
iv
Abstract
The role of a power transformer in maintaining the network voltage is very important. It is used to link the different nominal voltages in the high voltage network. In order to maintain a constant voltage in the network, tap changers are used to regulate the output level of the voltage.
Due to its dynamic and continuous operation under load condition, OLTC is prone to many different defects, for example caused by the load current or high operation temperature. The current leads to direct impact on contacts deterioration by eroding the contact material. Another source of contacts deterioration is a resistive layer. It is developed on contacts due to the heating of insulation oil by the load current. As a major cause of OLTC failure, these defects might take place after some years of operation and their frequency increases with the operation time. Thus it is necessary to maintain the condition of OLTC through a regular maintenance. Dynamic Resistance Measurement (DRM) can be conducted during this regular maintenance activity. It measures the resistance of power transformers when the OLTC operates, then any change of resistance can be determined from the measurement. The measurement results provide important information in assessing the actual condition of an OLTC.
The aim of this thesis is to analyze the effect of test parameters on DRM results from OLTC and its implementation in the condition assessment. Two test parameters were selected to be observed, which were test current and circuit resistance. Their amplitude was varied during the measurements and experiments in the laboratory as well as in the field. To do so, a test setup has been built which allows varying both parameters.
An analytical tool was introduced to convert DRM results into 4 parameters. The analysis showed that the measurement results were influenced by variation of test parameters. Thus, it is proven that the measurement results have dependency to the test parameters.
Based on the effect of the test parameters on measurement results, an optimal level of test parameter is determined. It can be used to perform the DRM in such a way that the reliable results can be expected. They provide valuable information for condition assessment. The presence of a defect can be identified as a deviation in the DRM graph. But to have a more reliable identification, the level of the deviation shall be calculated. For that reason, an interpretation concept has been developed to interpret DRM results in a practical way. A three dimensional graph (3D graph) is used as system to identify the defect and classify the result into certain defects. As the outcome, the 3D graph can be used to determine the actual condition of OLTC. It simplifies the condition assessment of OLTC.

v
Table of contents ___________________________________________
Acknowledgement....................................................................................................iii
Abstract.................................................................................................................... iv
Table of contents ....................................................................................................... v
Chapter 1: Introduction ..........................................................................................1
1.1 On-Load Tap Changer.................................................................. .......................1
1.2 Dynamic Resistance Measurement....................................................................1
1.3 Definition of Problems......................................................................................2
1.4 Objective of Study ............................................................................................3
Chapter 2: Working Principle of On-Load Tap Changers....................................5
2.1 Types of On-Load Tap Changer.................................................................. ........5
2.2 Principle of Operation.......................................................................................6
Chapter 3: Dynamic Resistance Measurement (DRM)..........................................8
3.1 Description of Test Setup ...................................................................................8
3.1.1 Transformer Diagnostic System...................................................................9
3.1.2 External Power Supply .......................................................... .................. 10
3.2 Conclusions .................................................................................................... 11
Chapter 4: Investigated Defects............................................................................ 12
4.1 Identification of Defects.................................................................................... 12
4.2 Contact Deterioration ....................................................................................... 13
4.2.1 Healthy Condition .................................................................................. 13
4.2.2 Light Aging............................................................................................ 14
4.2.3 Medium Aging....................................................................................... 15
4.2.4 Advanced Aging .................................................................................... 16
4.2.5 Contacts Wear........................................................................................ 18
4.3 Damaged Transition Resistors ..................................... ....................................19
4.4 Maintenance Error .......................................................................................... 20
4.5 Conclusions .................................................................................................... 20
Chapter 5: Experimental Test Setup and Measurement Methods...................... 22
5.1 Test Parameters............................................ .................................................... 22
5.1.1 Test Current ........................................................................................... 23
5.1.2 Circuit Resistance................................................................................... 24
5.2 Measurements Procedures...............................................................................25
5.2.1 Laboratory Measurement on Healthy OLTC........................................... 27

vi
5.2.2 Field Measurements on Service-aged Contacts ....................................... 28
5.3 Conclusions .................................................................................................... 29
Chapter 6: Experimental Results of the Investigated Defects.............................. 31
6.1 Measurement Results of Good Contacts OLTC............................................... 31
6.2 Measurement Results of Light Aged OLTC .................................................... 34
6.3 Measurement Results of Medium Aged OLTC............................................... 36
6.4 Measurement Results of Advance Aged OLTC............................................... 37
6.5 Conclusions .................................................................................................... 40
Chapter 7: Development of an Analytical Tool.................................................... 41
7.1 Parameters of Analysis.................................................................................... 41
7.1.1 Parameter 1 (P1): Winding Resistance.................................................... 42
7.1.2 Parameter 2 (P2): Contact Resistance - Short Term Effect ...................... 44
7.1.3 Parameter 3 (P3): Contact Resistance - Long Term Effect ...................... 45
7.1.4 Parameter 4 (P4): Timing of Transition Resistor(s)................................. 46
7.2 Conclusions .................................................................................................... 47
Chapter 8: Application of the Analytical Tool to Experiment Results................ 49
8.1 Analysis for Good Contacts ............................................................................49
8.1.1 Test Current ........................................................................................... 49
8.1.2 Circuit Resistance................................................................................... 53
8.2 Analysis for Light Aged Contacts ................................................................... 55
8.2.1 Test Current ........................................................................................... 55
8.2.2 Circuit Resistance................................................................................... 56
8.3 Analysis for Medium Aged Contacts............................................................... 58
8.3.1 Test Current ........................................................................................... 58
8.3.2 Circuit Resistance................................................................................... 59
8.4 Analysis for Advanced Aged Contacts ............................................................ 60
8.4.1 Test Current ........................................................................................... 60
8.4.2 Circuit Resistance................................................................................... 61
8.5 Analysis for Contacts Wear............................................................................. 62
8.5.1 Good Condition...................................................................................... 62
8.5.2 Contacts Wear........................................................................................ 64
8.6 Analysis for Damaged Transition Resistor(s) .................................................. 66
8.7 Effect of Test Parameters to the Measurement Results ................................... 67
8.7.1 Test Current ........................................................................................... 67
8.7.2 Circuit Resistance................................................................................... 71
8.8 Conclusions .................................................................................................... 74
vii
Chapter 9: Application of the Analytical Tool during Regular Maintenance .... 76
9.1 Condition Assessment....................................................................................... 76
9.2 Selection of the Optimal Test Parameters........................................................ 76
9.3 Concept of a Three Dimensional Classification Systems ................................. 77
9.4 The Application of Three Dimensional Classification Systems
on a Measurement Results............................................................................... 80
9.5 Conclusions .................................................................................................... 83
Chapter 10: Conclusions and Recommendations................................................. 85
10.1 Conclusions .................................................................................................... 85
10.2 Recommendations........................................................................................... 87
References.............................................................................................................. 88
1
Chapter 1
Introduction
1.1 On-load Tap Changer
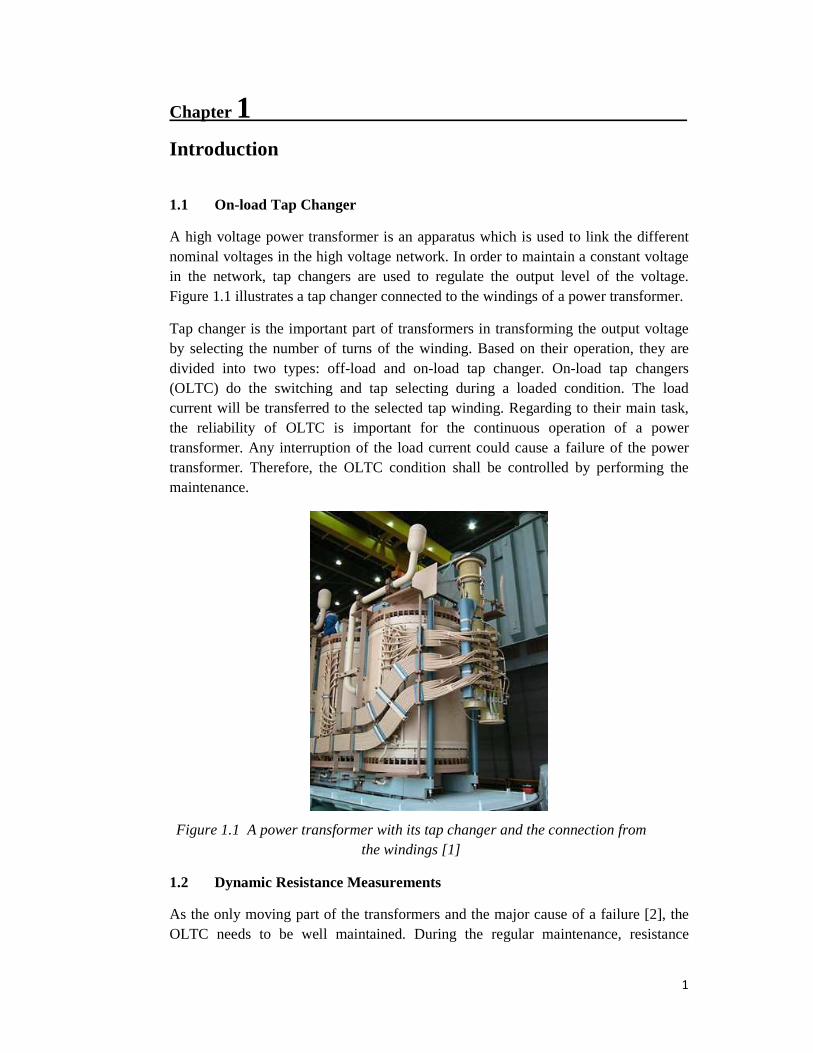
A high voltage power transformer is an apparatus which is used to link the different nominal voltages in the high voltage network. In order to maintain a constant voltage in the network, tap changers are used to regulate the output level of the voltage. Figure 1.1 illustrates a tap changer connected to the windings of a power transformer.
Tap changer is the important part of transformers in transforming the output voltage by selecting the number of turns of the winding. Based on their operation, they are divided into two types: off-load and on-load tap changer. On-load tap changers (OLTC) do the switching and tap selecting during a loaded condition. The load current will be transferred to the selected tap winding. Regarding to their main task, the reliability of OLTC is important for the continuous operation of a power transformer. Any interruption of the load current could cause a failure of the power transformer. Therefore, the OLTC condition shall be controlled by performing the maintenance.
Figure 1.1 A power transformer with its tap changer and the connection from the windings [1]
1.2 Dynamic Resistance Measurements
As the only moving part of the transformers and the major cause of a failure [2], the OLTC needs to be well maintained. During the regular maintenance, resistance

2
measurement can be performed in order to observe the condition of the OLTC. One of the measurement methods is Dynamic Resistance Measurement (DRM), which will be used in this thesis. The implementation of the measurement will be performed using Transformer Diagnostic System (TDS).
Dynamic resistance measurement is used to diagnose the resistance of OLTC contacts. The result of measurement is in a form of current graph, which will be called DRM graph in this thesis. Any deviation in the DRM graph is reflecting a presence of resistance on the tap changer contacts. The measurement method (DRM) will be discussed further in Chapter 3.
1.3 Definition of Problems
A defective OLTC can lead into a total failure of power transformer, where the load current is totally interrupted. It could be caused by different kinds of defects on different parts of OLTC. [3] has described the types of defects, which only certain defects will be discussed within this thesis:
1. contact deterioration - aged contact due to grow of carbon - wear of contact due to switching arc
2. damaged transition resistors
Those defects are interested to be analyzed because it influences the performance of OLTC in transferring the load current. A resistive layer is formed on the OLTC contacts due to a heating of insulation oil by the load current. It results in contacts deterioration which causes a current disruption. Damaged transition resistors will make the OLTC fails to transfer the load current. It could lead to a failure of power transformers.
To prevent any transformer failure caused by aged OLTC, DRM shall be performed during the regular maintenance. It measures the change of current due to presence of resistance or damaged of transition resistors. A test current will be injected to the transformer and measures the presence of resistive layer on OLTC contacts. The measured resistive layer will be indicated as deviation in DRM graph.
One value of test current is selected to charge the transformers and perform the measurement. 1ADC is widely used in performing the dynamic resistance measurement. But then some questions emerged regarding the influence of test parameters with different test levels to the measurement results. The measurement results from different test levels and test parameters may lead to different response signals from the same object. The dependency of the measurement results to the test parameters will be investigated further in this thesis.
A defective OLTC due to aging or wear of contacts could be measured with DRM. The measurement results are expected to be highly dependant on test parameters, which are:

3
1. test current 2. circuit resistance 3. secondary windings short circuit
Only the first two parameters will be conducted in this thesis. The value of the test current and circuit resistance will be varied during the measurements to obtain different characteristic results. The influence of test parameters could be observed from the results.
The application of dynamic resistance measurements with different test parameters will be investigated in this thesis. Figure 1.3 shows the schematic diagram of the project. DRM with different test parameters will be conducted to the defective OLTC with different aging stages. By applying different test levels, the influence of test parameters expected to be seen in the measurement results. The measurements were done in the field as well as in the laboratory. Both measurements have different purposes. Field measurement was performed to measure the resistance on service-aged contacts. A measurement result of good contacts was gained from the measurement on power transformer at High Voltage laboratory of TU Delft.
Figure 1.2 Scheme of Dynamic Resistance Measurement with different test parameters and test levels
1.4 Objective of Study
Dynamic resistance measurement is commonly performed by transformer maintenance engineers to check the condition of the OLTC. Single test level of 1ADC is applied to inject the winding and the tap changers. As a result, a linear graph of current is recorded which can be used to derive the condition of OLTC contacts.
This thesis aims to observe the relation between different aging stages with the test parameters in the measurement results. Two different test parameters were used: test current and circuit resistance. The ratings of both parameters were varied when conducting the DRM. An analysis was performed to determine the effect of test parameters to the measurement results from different aging stages. To do so, an analytical tool has been developed. It was used to calculate the deviation. Thus the behaviour of each measurement result will explain the influence of test parameters. Lastly, a concept will be proposed to interpret the result of calculation. It has purpose to simplify the identification of OLTC actual condition.

4
In order to reach the aim of the study, following points are essential to be performed:
1. Preparation of an overview about: - The working principle of an OLTC - The OLTC aging phenomenon - The working principle of dynamic resistance measurement - Any possible test setup to conduct the measurement
2. Experimental work is conducted to gain measurement data with different
parameters and test value. A test setup is prepared which must be adequate to perform the DRM with the selected test current and circuit resistance. Those parameters are varied from low to high value:
- test current; in the range of 1.2ADC – 20ADC and lower than 1ADC
- circuit resistance; in the range of 1Ω - 8Ω
The measurements are performed in two different circumstances: a. Laboratory measurement in TU Delft High Voltage laboratory. DRM is
conducted to a good condition of OLTC. b. During regular maintenance in the substation. DRM is conducted to
different level of aged OLTCs.
3. Parameters are developed to analyze the measurement results systematically. These parameters will be applied to each type of defects as described previously. By this method, the analysis results will illustrate the behaviour of different aging stages. A summary of analysis will be presented in form of graph, based on the test parameters.
4. Develop a concept to interpret the DRM results. This concept is expected to be
easily applied during a regular maintenance. It will help the engineers in determining the condition of the OLTC, thus providing a confidence in taking decision for maintenance.

5
Chapter 2
Working Principle of On-Load Tap Changer
The duty of power transformers in regulating the output voltage is done by the tap changers. Different types of tap changers are distinguished based on their condition of operation. Off-circuit tap changers are operated when the transformer is offline. The other type of OLTC is working online, named as on-load tap changer (OLTC). This chapter will discuss the types of OLTCs and their principle of operation.
2.1 Types of On-Load Tap Changers
Based on their working mechanism during switching the load current, OLTCs are divided into two types (Figure 2.1): Diverter switch and Selector switch type OLTCs. Diverter switch type consists of a tap selector and a diverter switch. A tap selector pre-selects the tap winding without switching any current. Then the diverter switch transfers the load current from selected to the pre-selected tap during the switching operation. The other type of OLTC is selector switch which combines both functions of tap selector and diverter switch. It selects a tap winding while transferring the load current.
Figure 2.1 On load tap changers: Diverter switch type (left) and Selector switch type (right)[5]
An OLTC is commonly mounted in the primary side of power transformer. A lower load current at the primary side is preferred to be switched because it may reduce the switching arc. Small switching arc will prolong the contact lifetime and slow down

6
the formation of carbon when oil is used as an insulating medium. Another insulating media is vacuum. It is mostly used in the diverter switch type of OLTC.
There are three different kinds of tapped-winding arrangement according to the type of switching: linear, plus/minus and coarse/fine switching [6]. Figure 2.2 shows the arrangements.
Figure 2.2 Tapped-winding arrangements
OLTCs in linear arrangement add the tapped winding in series with the main winding and thus change the ratio since the number of winding turns is changed. The plus/minus arrangement provides an ability to add or subtract the voltage of the tapped windings from the voltage of the main winding. Then the regulating range can be doubled or the number of the tapped windings can be reduced. The other arrangement is coarse/fine. It connects and disconnects the coarse winding during the operation which has a higher voltage than the fine tapped windings. This coarse/fine type OLTC is chosen as the test object of this thesis.
2.2 Principle of Operation
The main principle of switching is not to interrupt the load current while the tap changer is selecting the tap winding. Therefore, the “make before break contact” concept is applied. During the switching, the on-load tap changer bridges the adjacent/pre-selected tap for the purpose of transferring load current from one tap to next tap without interrupting the load current. The circulating current flows through a transition impedance when the tap changer bridges the adjacent taps. In this way, the circulating current is limited by transition impedance, which could be resistors or inductors.
A switching sequence of an OLTC comprises several steps. It is illustrated in sequence in Figure 2.3. These figures show an OLTC with one main contact (M) and two transition contacts (T1 and T2). Figure 2.4 magnifies a switching movement of

7
OLTC from the DRM graph with the sequences related to Figure 2.3. The DRM graph will be discussed in Chapter 3. Figure 2.3-1 illustrates a normal position of the OLTC when transferring the load current (IL). A switching sequence begins when the OLTC contacts start to move. It continues to position 2.3-2 when contact M leaves stator contact (A) and the transition contact (T1) is on the stator contact A. The load current (or the test current in the case of a resistance measurement) is transferred to contact T1. The current (Figure 2.4-2) starts to decrease steeply because load current has to flow through the transition resistor (Rt) of T1. The OLTC is moving further to the position shown in figure 2.3-3, where the T2 contact gets onto stator contact B. T1 and T2 contacts are in parallel and bridge the stator contacts. It causes a circulating current (IC) between those transition contacts through the tap winding. At this moment two transition contacts share the load current. Thus the load current has a less steep decrease (Figure 2.4-3) due to half value of transition resistor (1/2*Rt). In the next period, figure 2.3-4, current has been transferred to the next tap (stator contact B). It flows through T2, with the same situation as position 2. Switching operation of OLTC is completed when the load (test) current has been transferred to next tap (contact B) and fully borne by contact M.
Figure 2.3 A switching sequence of an OLTC with one main contact and two transition contacts
Figure 2.4 DRM graph with the switching steps related to Figure 2.3. The graph will be discussed later in Chapter 3.

8
Chapter 3
Dynamic Resistance Measurement (DRM)
3.1 Description of Test Setup
Dynamic Resistance Measurement (DRM) was proposed by KEMA [7] and is already in operation for more than a decade. Their commercial product is named Regelschakelaar Diagnostiek (RSD) meaning tap changer diagnostic.
Dynamic resistance measurement is used as a method to diagnose the contact condition of on-load tap changers offline. This method is able to detect many types of defects or deterioration of change-over selector contacts and arcing switch contacts without accessing these contacts. A DC current is injected into the transformer and flows through the tap changer. The measurement reads the flow of current through the tap changer during its operation. Since DRM measures the OLTC while it is moving through its entire taps, the measurement is done without static impedance. Therefore this resistance measurement is dynamic.
By injecting a test current and recording the flow of current through the tap changer, dynamic resistance measurement indentifies the condition of OLTC contacts. At one hand contacts resistance can be measured simultaneously in three phases of star connected winding with OLTC included. All secondary windings are short circuited. Three current measurements are recorded separately. At other hand, the measurement of OLTC attached to delta connected winding need to be done separately for each phase of winding, as can be seen in Figure 3.1.
Figure 3.1 Test setup of Dynamic Resistance Measurement with OLTC in delta connected winding. Three measurements need to be performed for phase U-V, V-W
and U-W.
A short circuit connection of secondary winding provides a path for the test current in case the test current in primary side is accidentally interrupted. Without a secondary short circuit, a current interruption of primary side will produce a steep dI/dt and thus causes a high voltage over the inductance. An arc will occur. Therefore a secondary short circuit increases the safety condition during the measurement. Besides safety

9
function, a secondary short circuit allows a fast response of current change. When a secondary short circuit is available, current will flow through the secondary short circuit. It causes the large inductance of the transformer to have no effect and the current is allowed to change fast due to changes in supply voltage or circuit resistance. This function is necessary in responding to a small deviation of resistance during the measurement.
The result of dynamic resistance measurement will be shown in a form of DRM graph. It figures the flow of current through the OLTC during a complete operation through its entire taps. Figure 3.2 shows a result of dynamic resistance measurement of an OLTC with good condition. The winding resistance changes when tap windings are deselected subsequently by OLTC. A good condition OLTC will show a linear form of DRM graph. Drops of current between each taps are caused by transition resistor(s) of OLTC. It shows the moment when OLTC is in switching operation, where the load current flows through the transition contact and thus the transition resistors. Defected or deteriorated OLTC are recognized as deviations of DRM graph.
1.4
0
0.2
0.4
0.6
0.8
1
1.2
Time [s]
18910 20 30 40 50 60 70 80 90 100 110 120 130 140 150 160 170 180
Figure 3.2 DRM graph of dynamic resistance measurement result
There are two different approaches of dynamic resistance measurement which were used during this graduation project. Both two setups have the same principle of measurement and utilize the same diagnostic tool to record the measurement data. Those setups were implemented for the measurements in the laboratory as well as in the field during a regular maintenance of OLTC.
3.1.1 Transformer Diagnostic System (TDS)
As a diagnostic tool, Transformer Diagnostic System (TDS) is used to diagnose the condition of power transformer in general. It has features to perform four different measurements: dynamic resistance measurement, winding resistance measurement, transformer turns ratio and mechanical drive system of OLTC [8]. It has been designed to test the transformers with high inductance and allows fast analysis of DRM results.
Within this graduation project, the transformer diagnostic system has been utilized to perform dynamic resistance measurement. The setup configuration of dynamic resistance measurement can be seen in Figure 3.3. TDS146 is a prototype of transformer diagnostic tool. It acts as a DC power source as well as a recorder of the measurement results.
10
DC
U
V
W
N
Embedded Control and
Data Acquisition
Laptop
u
v
w
TDS 146 Transformer
Short Circuit
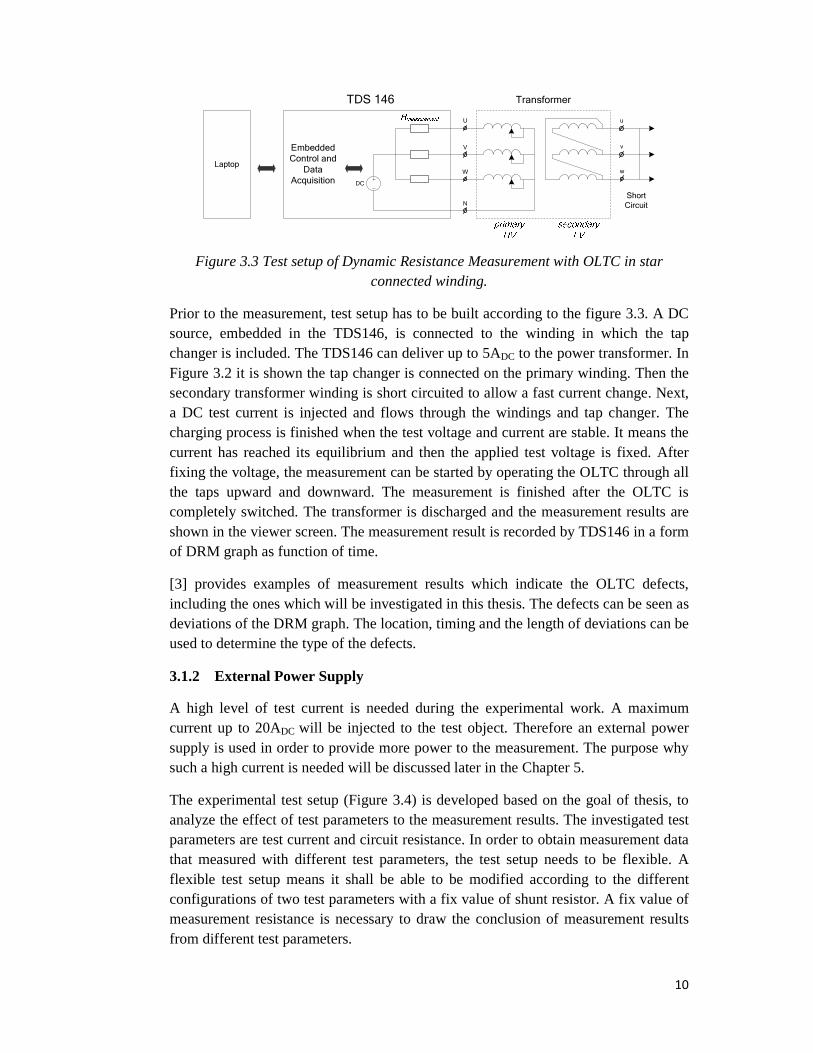
Figure 3.3 Test setup of Dynamic Resistance Measurement with OLTC in star connected winding.
Prior to the measurement, test setup has to be built according to the figure 3.3. A DC source, embedded in the TDS146, is connected to the winding in which the tap changer is included. The TDS146 can deliver up to 5ADC to the power transformer. In Figure 3.2 it is shown the tap changer is connected on the primary winding. Then the secondary transformer winding is short circuited to allow a fast current change. Next, a DC test current is injected and flows through the windings and tap changer. The charging process is finished when the test voltage and current are stable. It means the current has reached its equilibrium and then the applied test voltage is fixed. After fixing the voltage, the measurement can be started by operating the OLTC through all the taps upward and downward. The measurement is finished after the OLTC is completely switched. The transformer is discharged and the measurement results are shown in the viewer screen. The measurement result is recorded by TDS146 in a form of DRM graph as function of time.
[3] provides examples of measurement results which indicate the OLTC defects, including the ones which will be investigated in this thesis. The defects can be seen as deviations of the DRM graph. The location, timing and the length of deviations can be used to determine the type of the defects.
3.1.2 External Power Supply
A high level of test current is needed during the experimental work. A maximum current up to 20ADC will be injected to the test object. Therefore an external power supply is used in order to provide more power to the measurement. The purpose why such a high current is needed will be discussed later in the Chapter 5.
The experimental test setup (Figure 3.4) is developed based on the goal of thesis, to analyze the effect of test parameters to the measurement results. The investigated test parameters are test current and circuit resistance. In order to obtain measurement data that measured with different test parameters, the test setup needs to be flexible. A flexible test setup means it shall be able to be modified according to the different configurations of two test parameters with a fix value of shunt resistor. A fix value of measurement resistance is necessary to draw the conclusion of measurement results from different test parameters.
11
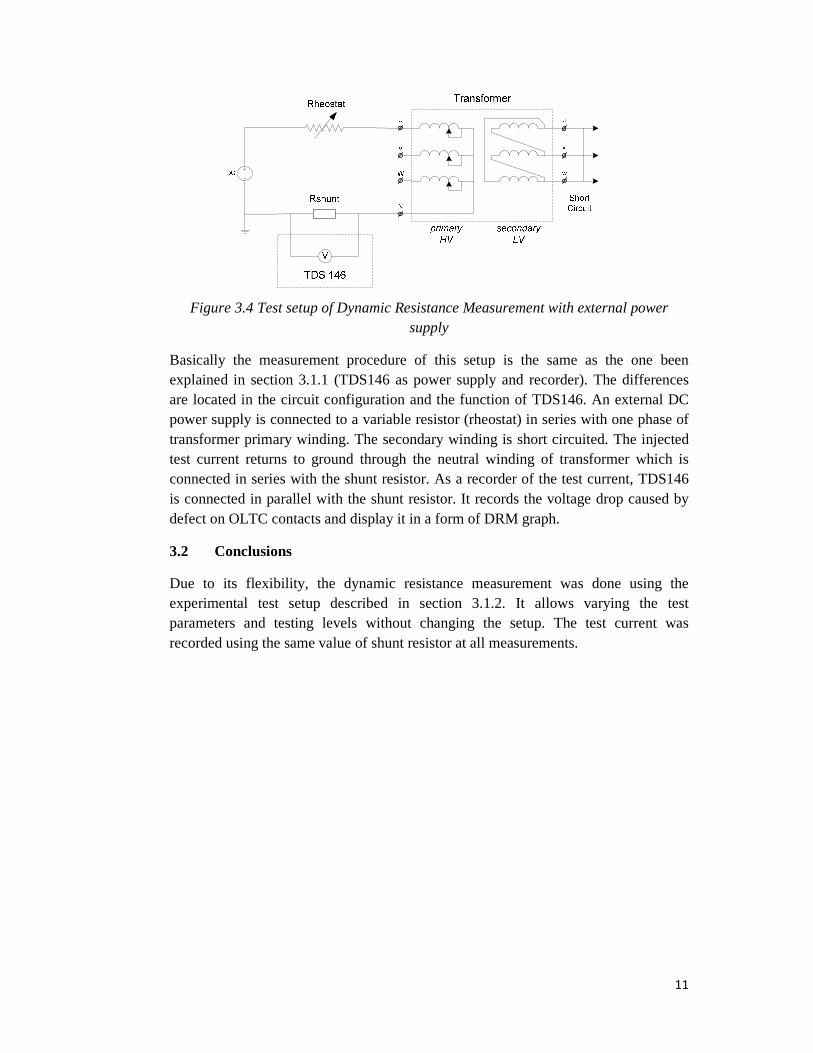
Figure 3.4 Test setup of Dynamic Resistance Measurement with external power supply
Basically the measurement procedure of this setup is the same as the one been explained in section 3.1.1 (TDS146 as power supply and recorder). The differences are located in the circuit configuration and the function of TDS146. An external DC power supply is connected to a variable resistor (rheostat) in series with one phase of transformer primary winding. The secondary winding is short circuited. The injected test current returns to ground through the neutral winding of transformer which is connected in series with the shunt resistor. As a recorder of the test current, TDS146 is connected in parallel with the shunt resistor. It records the voltage drop caused by defect on OLTC contacts and display it in a form of DRM graph.
3.2 Conclusions
Due to its flexibility, the dynamic resistance measurement was done using the experimental test setup described in section 3.1.2. It allows varying the test parameters and testing levels without changing the setup. The test current was recorded using the same value of shunt resistor at all measurements.

12
Chapter 4
Investigated Defects
On-load tap changers operate frequently to regulate the output voltage of power transformers because of changes in power demand. A large amount of operations during its long service life makes the OLTC prone to development of defects. Identifying these defects can prevent OLTC failure. The identification of defects will provide information of OLTC condition.
There are several types of defects that can occur in the OLTC which are caused by aging phenomena as well as human error during maintenance work. Some examples are contact deterioration, damaged transition resistors, maintenance errors and mechanical problems (damaged springs or drive axis) which lead to synchronization problems between phases or abnormal switch times. Only the effect of the test parameters on the first two defects will be investigated in this thesis: contact deterioration and damaged transition resistors.
4.1 Identification of Defects from the Measurement Results
It is beneficial to identify the defects before they can cause a failure. Recognition of defects can be done by visual inspection during the overhaul. It is needed to open the transformer tank during the regular maintenance to get the access to the tap changer inside the transformer tank. Apparently this is not a practical way to observe the condition of these OLTC parts. The results of visual observation can only be recorded in photographs, without any measured value. Therefore a measurement is needed which can diagnose the tap changers condition without opening the transformer tank. The measurement result provides information of the OLTC condition in a form of graph.
Without visual inspection, abnormal situations can be recognized based on measurement results and experience. The timing, location and length of disruption of test current determine the type of defects and its aging phase.
To identify the OLTC condition based on the measurement results, certain boundary values of the conditions need to be determined. Visual inspection of the physical condition during the overhaul and after failure, fingerprints of historical diagnostic data and experiences of measurement are the tools to determine reliable boundary values. Furthermore these values can be used to create condition indices that represent the OLTC condition. For example, condition indices have been derived for the deviations in DRM graphs measured at 1ADC [4].
On-site measurements on service aged OLTCs have been done prior to this project by a team of service engineers at a Dutch utility company. The measurement results were

13
used to identify the defect(s) of the measured OLTCs [3]. It showed the DRM graphs from various defects of service aged OLTC.
Unlike the other defects, pitting on the arcing switch contacts surface seems have no impact to the measurement. An experiment has been carried out to see the effect of pitting to the measurement results [9]. All of the measurement results of pitting defect showed that there is no disruption in the DRM graph. The graphs have a same form as the one measured on OLTCs with a healthy condition.
4.2 Contacts Deterioration
OLTC contacts can deteriorate due to aging effect. They are classified into three phases: light, medium and advance aging. In relation with the load current, the temperature and operation time are the most influence factors of contacts deterioration. A high temperature and long period of operation will stimulate a deterioration of OLTC contacts. High load current increases the temperature significantly. A long period of operation causes the OLTC exposed to load current continuously. The high density of current in a form of switching arc accelerates the contact deterioration. Besides under load condition, the aging effect can be developed at no-load condition.
OLTCs with a selector switch have been investigated. They are insulated by transformer oil and have two separate compartments: one compartment of the change-over selector and the other for the arcing switch.
The change-over selector operates at no-load condition. A resistive layer can be formed due to a high temperature and infrequent use of change-over selector. This situation allows the development of insulation oil into resistive layer which is attached on the stator contacts blocks, rollers (rotor contacts), sliders and holders of change-over selector. A long term aging will gradually occur in the OLTC and form pyrolytic carbon because of insulating oil decomposition [10]. An experimental research has been done to simulate this aging process in OLTC [9].
The arcing switch works under load condition. It selects the tap while transferring the load current. Due to the frequent movement of arcing switch, the switching arc will heat up the oil regularly and erode the material of the contacts.
4.2.1 Healthy Condition
The long period of OLTC operation may not always cause any defects. An optimal maintenance schedule, low operating temperature and less switching arcs may be the main factors to keep the OLTC in a healthy condition. The formation of oil film may not be avoided. Nevertheless it can be diminished or even eliminated due to wiping effect from frequent movement of rotor contacts, break of the thin film layer by the load current, by choosing an optimal contact material or by cleaning activity during maintenance. Figure 4.1 shows a good contact after maintenance and a DRM measurement result for healthy condition of OLTC.

14
tungsten
Figure 4.1 Left: An arcing switch stator contact has been revised and the tungsten contacts on the edges have been replaced with the new ones. The paths of rollers
movement are seen as parallel lines of wear. Right: A DRM graph of a healthy OLTC measured with TDS and a close up image of current pattern during the switching
period.
The measurement result of a healthy condition of OLTC is used as a reference in determining the boundary value for analysis. It has a pyramid shaped of DRM graph. Any deviation of the graph indicates the presence of resistance on the contacts or contacts timing differences which disrupt the flow of current during the operation of OLTC.
4.2.2 Light Aging
It is known that some aging processes in an OLTC starts with the formation of a thin oil film [9]. This organic film is a less conducting layer; built and bonded to the copper or silvered contacts of OLTC. The rotor and stator contacts of an OLTC touch each other at only a few spots, namely the contacts interface. It results in a non-uniform current density on the contacts interface and thus creates a local hotspot. Due to localized heating, oxidation is likely to occur. This oxidation forms an insulating film which is less conductive. It will increase the resistance rapidly and the contacts will be heated. The increase of temperature due to heating will increase the deposition rate of the oil film on the contacts.
Light aging is a phase where the deposition of oil film is still in an early period. It forms a thin resistive layer on the OLTC contacts (see Figure 4.2). It can disrupt the current when it flows through the film layer between the arcing contacts.

15
Figure 4.2 Light aged contact with thin oil film on left hand side and good/clean contact on the right hand side
There is a big tendency that a thin film layer will be wiped off by the frequent movement of arcing contacts. A good condition of contact can be restored due to this movement. Therefore the light contact aging stage is mainly found in the change-over selector due to its infrequent operation.
4.2.3 Medium Aging
Medium aging phase is characterized by a thick layer of oil on the contacts and starting of carbon formation on the spot where the contact is positioned for a long period. This early carbon is formed due to heating of a thick oil film. Carbon is formed on the interface area and this process is called contact coking. This medium aging phase gives indication that the OLTC is in the beginning phase of advance aging and needs to be scheduled for maintenance. Figure 4.3 shows the location of carbon spot on the stator contact of change-over selector and the wiped path due to the movement of the contacts. The rest area of the contact is covered by oil.
Figure 4.3 Thin carbon is developed on the parking spots. The movement of rotor contacts wipe the film layer and restore a low resistance contact.

16
4.2.4 Advanced Aging
Advanced aging is a final phase of OLTC. A long period is needed to reach this phase of aging. It can be started with the formation of oil film on the OLTC contacts, as been described in section 4.2.2. A non-frequent movement of change-over selector and a high temperature will accelerate the growth of resistive film layer and cause contact coking. The coking will increase the resistance and act as heat insulator. Finally it will heat up and burn the contact area of both contacts. Figure 4.4 shows the development of coking until it burns the contact surface and leave holes called pitting.
Figure 4.4 Development of coking in sequence: (1) starting process with a thin oil film on stator contact, (2) current heat up the oil layer between roller and stator
contact, carbonize the oil and then causes coking, (3) pitting occurred after long-term process, (4) pitting, a burnt hole on stator contact. Only the last part of this aging
process is the advanced stage.

17
The advanced aging is likely to occur on infrequently moved contacts, for example in the change-over selector. The carbon layers are formed on the sliders and holders of the rollers, as shown in Figure 4.5. As a result, the contacts can have less contact force. Besides the sliders and holders, carbon can develop on the stator and rotor contacts of a change-over selector. The oil film is built on the contacts surface. A long term idle position of contacts and a high temperature can heat up oil film at the contacts. Figure 4.6 shows coking on the rotor and stator contact of a change-over selector.
Figure 4.5 Carbon layer on the sliders (left) and holders (right)
Figure 4.6 Coking on the rotor rollers (left) and on the edge of stator contacts (right). Those are the interface spots of both contacts, where the oil film was trapped in
between and heated up.

18
In the advance aging stage, pitting occurred on the change-over selector contacts even though they switch under no-load condition. A high temperature, high load current and long term idle position of change-over selector are the source of this continuation process. The occurrence of pitting takes place not only on the rotor contacts (rollers) but also on the stator contacts. In the end this can lead to the example in Figure 4.7.
Figure 4.7 Extreme pitting on the stator contact surface
4.2.5 Contacts Wear
An OLTC works under load condition when regulating the output voltage of a power transformer. They transfer the load current from one tap to another during their switching work. The make-and-break process of switching generates an arc, namely switching arc. This switching arc is the main factor of contacts erosion [11].
A pair of OLTC arcing contacts is made of arc resistant materials which contain tungsten or copper. In the selector switch type of OLTCs which were investigated, tungsten stator blocks are attached on the edges of copper stator contacts and outer part of the rotor contacts. Tungsten material is chosen to be attached on the edges where the switching arc takes place. It has a high resistance to arc erosion, a similar purpose as in circuit breaker application. During the make-and-break process, a pair of arcing switch contacts switched the load current. If the load current is high, it will cause a high temperature and melt the contacts surface locally. This process leaves the holes on the surface [11]. It results in pitting on the rollers as shown in Figure 4.8. The rollers of transition contacts (on the right and left) have more pitting compare to the main contact in the middle. Their movement of leaving the stator contacts under load condition produces switching arc, which erodes the material.

19
Figure 4.8 Pitting on the rollers surface of arcing switch after long term operation.
Although arcing contact wear is a normal process, advanced aging of arcing contacts can be classified as the phase of contacts deterioration that involves extreme wear. This phenomenon can only take place when the contacts have been imposed to the switching arc for many frequent times, especially at high load current. The hardness of the contacts materials makes it uneasy to be eroded by the arc. The contacts erosion can be clearly seen from Figure 4.9. The stator contact of arcing switch is eroded on both sides, where the tungsten materials are attached on and exposed to the switching arc. A wear of contacts lead to a use of transition resistor(s) longer than normal switching operation and causes a delay of current transfer to next tap.
Figure 4.9 Wear of stator contact due to erosion of tungsten material by switching arc
4.3 Damaged Transition Resistors
The transition resistor(s) are designed not to carry load current for a long time. They can be heated up and get damage. A damage of transition resistor(s) will lead to an interruption of the load current and thus a failure.
20
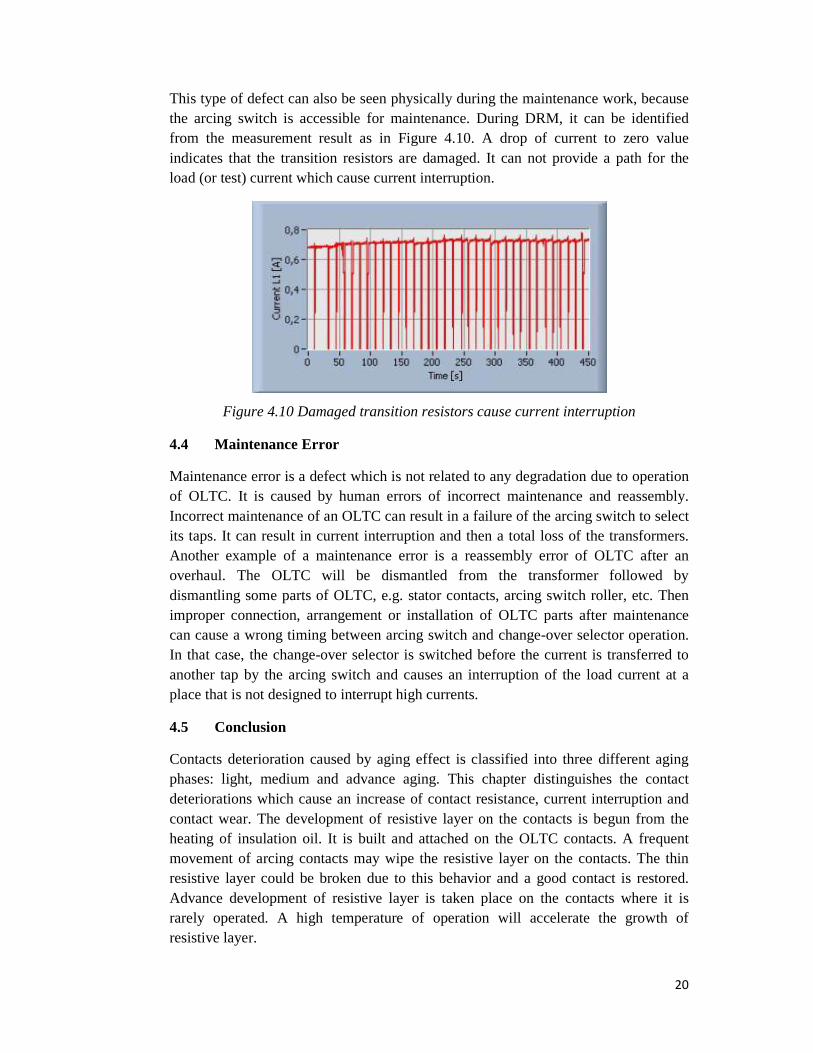
This type of defect can also be seen physically during the maintenance work, because the arcing switch is accessible for maintenance. During DRM, it can be identified from the measurement result as in Figure 4.10. A drop of current to zero value indicates that the transition resistors are damaged. It can not provide a path for the load (or test) current which cause current interruption.
Figure 4.10 Damaged transition resistors cause current interruption
4.4 Maintenance Error
Maintenance error is a defect which is not related to any degradation due to operation of OLTC. It is caused by human errors of incorrect maintenance and reassembly. Incorrect maintenance of an OLTC can result in a failure of the arcing switch to select its taps. It can result in current interruption and then a total loss of the transformers. Another example of a maintenance error is a reassembly error of OLTC after an overhaul. The OLTC will be dismantled from the transformer followed by dismantling some parts of OLTC, e.g. stator contacts, arcing switch roller, etc. Then improper connection, arrangement or installation of OLTC parts after maintenance can cause a wrong timing between arcing switch and change-over selector operation. In that case, the change-over selector is switched before the current is transferred to another tap by the arcing switch and causes an interruption of the load current at a place that is not designed to interrupt high currents.
4.5 Conclusion
Contacts deterioration caused by aging effect is classified into three different aging phases: light, medium and advance aging. This chapter distinguishes the contact deteriorations which cause an increase of contact resistance, current interruption and contact wear. The development of resistive layer on the contacts is begun from the heating of insulation oil. It is built and attached on the OLTC contacts. A frequent movement of arcing contacts may wipe the resistive layer on the contacts. The thin resistive layer could be broken due to this behavior and a good contact is restored. Advance development of resistive layer is taken place on the contacts where it is rarely operated. A high temperature of operation will accelerate the growth of resistive layer.

21
As one of OLTC defects, maintenance error is not caused by contact deterioration. It can cause failure to transfer load current by the OLTC. In that case a maintenance error has the same indication like a damaged transition resistors, which causes current interruption. Both can be investigated in the same way but have a different origin. To avoid a misinterpretation of measurement results, only current interruption due to damaged transition resistors are investigated in this report. In addition, this thesis investigates the three stages of contact deterioration: light, medium and advanced.

22
Chapter 5
Experimental Test Setups and Measurement Methods
Dynamic resistance measurements have been conducted on several selector switch type OLTCs. The measurement results provided information about the condition of the OLTC.
In the previous experience, it was seen that the measurement readings have different amplitudes based on the parameters of the test [4]. This chapter is aimed to discuss the tools that are used to gain information for investigation. The variation of test parameters in the measurement may have effect to the measurement results. To achieve the expected information, a test setup has been built. It allows varying the level of different test parameters using single test setup in one time measurement.
5.1 Test Parameters
The dependency of the measurement results to the test parameters need to be observed. It is intended to gain information about the influence of test parameters to the measurement results. Thus, an optimal value of test parameters could be defined. It will provide a reliable measurement reading of resistive layer developed in OLTC.
There are only two test parameters are discussed in this thesis, the test current and circuit resistance. The value of both parameters will be varied in order to see their influence to the measurement results. The other parameter, which is secondary short circuit, is applied but its influence on the results is not going to be analyzed. Due to influence of the transformer’s large inductance, the time constant for LR circuit (τ = L/R) is large. By short circuiting the secondary, the main inductance has no effect and it allows a fast current change due to changes of circuit resistance. Only a small leakage of inductance is noticed and may slightly influence the time constant of response signal.
The level classification of the test parameters is determined based on analysis of the good contacts measurement results. This good OLTC has a thin resistive oil film. A series of measurement were performed by tuning the test level. Then the classification of test levels was determined based on the sensitivity and the strength of the measurement signal in reading the change of current caused by defects. They are used for the experiments described in this thesis. The test levels are also classified based on the moment when the test current has broken the resistive oil film during the measurement. It will be explained later in Chapter 8, when an example of measurement using varied test current is discussed.
23
5.1.1 Test Current
1ADC test current has been commonly used in dynamic resistance measurement to charge the transformers windings. It is advised in the IEEE C57.12.90 test code that the test current during resistance-testing of power transformers shall not exceed 15% of the rated current of the windings [12]. A higher value may cause inaccuracy by heating the winding. It changes the temperature and the resistance of the transformers windings.
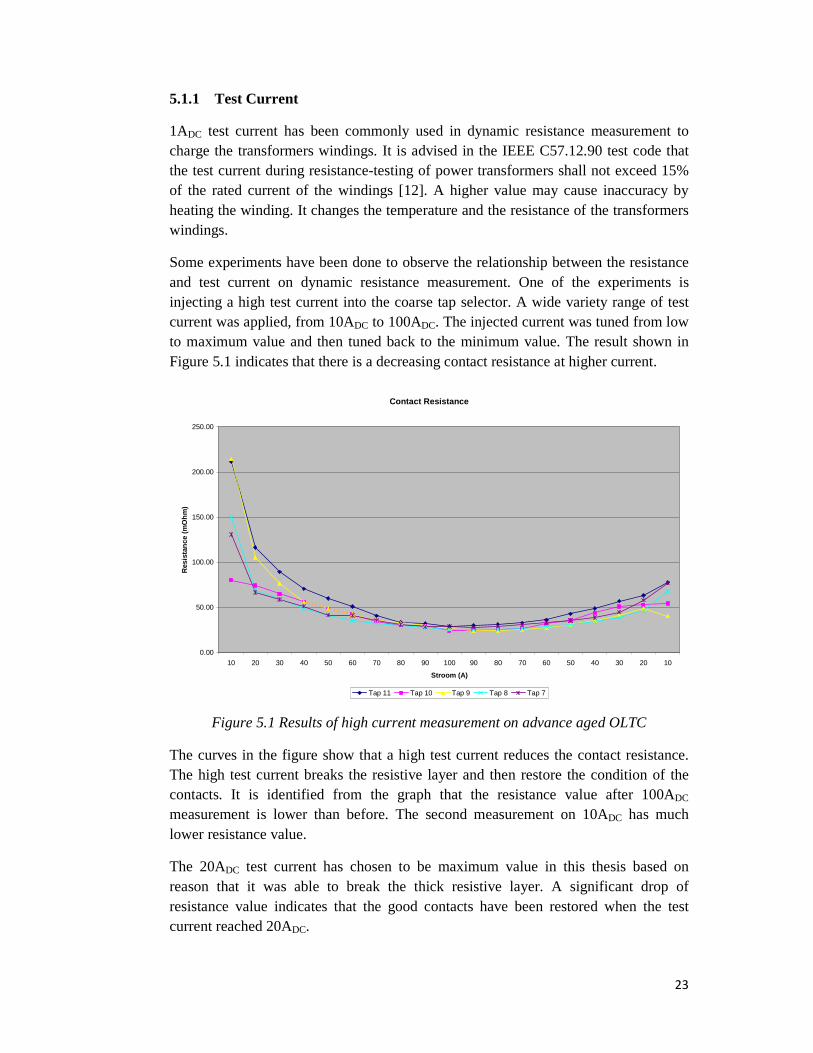
Some experiments have been done to observe the relationship between the resistance and test current on dynamic resistance measurement. One of the experiments is injecting a high test current into the coarse tap selector. A wide variety range of test current was applied, from 10ADC to 100ADC. The injected current was tuned from low to maximum value and then tuned back to the minimum value. The result shown in Figure 5.1 indicates that there is a decreasing contact resistance at higher current.
Contact Resistance
0.00
50.00
100.00
150.00
200.00
250.00
10 20 30 40 50 60 70 80 90 100 90 80 70 60 50 40 30 20 10
Stroom (A)
Res
ista
nce
(m
Oh
m)
Tap 11 Tap 10 Tap 9 Tap 8 Tap 7
Figure 5.1 Results of high current measurement on advance aged OLTC
The curves in the figure show that a high test current reduces the contact resistance. The high test current breaks the resistive layer and then restore the condition of the contacts. It is identified from the graph that the resistance value after 100ADC
measurement is lower than before. The second measurement on 10ADC has much lower resistance value.
The 20ADC test current has chosen to be maximum value in this thesis based on reason that it was able to break the thick resistive layer. A significant drop of resistance value indicates that the good contacts have been restored when the test current reached 20ADC.

24
The test levels were classified into a certain range of test values which are determined based on the effect of the current ratings to the resistive layer. Three levels are used: low, medium and high level. Another factor of determining classification is the maximum and minimum current rating that can be reached by the 40VDC power supply. Thus the low test level comprises the range of 0.2ADC to 0.5ADC test current. Range of 1ADC to 1.5ADC test current is classified as Medium test level. And the High test level is started from 5ADC and above. The decision of selecting 5ADC as high test level is based on two reasons. Firstly, it breaks the resistive layer already and restores a good condition of the contacts. Secondly, 5ADC is the maximum value can be supplied if TDS146 is used as a single power supply. Then it will be applicable if the measurement is done only using TDS146 without any additional power supply.
5.1.2 Circuit Resistance
The total circuit resistance of the test circuit is one of the test parameters, which can influence the measurement readings. It has effects to the sensitivity of the measurement and the amplitude of the response signal. A high circuit resistance enables the measurement to read a fast change of current. Due to the high resistance value, time constant of the circuit is small. It compensates the leakage inductance of power transformer. Thus it enables the measurement to respond a fast change of current and increases the accuracy of reading a short current deviation. The increase of circuit resistance also produces a weak signal. The response signal has low amplitude which can be even lower than the noises. It causes difficulty to identify the response signal from the noises. Another effect of high circuit resistance is that the measurement needs to apply more voltage, to reach the same current. A high voltage level can damage or break the resistive layer and restore the condition of contacts, so that light contact aging is not discovered by the measurement. The increase of resistance can also increase the noises, which will disturb the measurement result and blurred by the spikes.
The chosen values for circuit resistance, as another test parameter, are 0.2Ω, 1Ω and 4Ω. The low value of 0.2Ω is the lowest value can be reached by a variable resistor as the additional resistor. 4Ω is selected as the high category since it gives high sensitivity to respond any change of test current due to a presence of resistance on OLTC contacts. Besides a high sensitivity response, high resistance causes the response signal amplitude too small, and covered by noises. It causes difficulty to distinguish the response signal from the noise.
Measurement with varied circuit resistance was conducted on a fix test current, 1ADC. The maximum value is 8Ω which has been selected due to its high sensitivity and its low amplitude of response signal. A measurement result of 8Ω circuit resistance produce a DRM graph which is fully covered by spikes. The response signal is hardly to be distinguished from the noises.

25
5.2 Measurement Procedures
Dynamic resistance measurement has been used to gain information during the experiment. And therefore a test setup was developed with the additional tools added to the normal DRM test setup. The model of the setup can be seen in Figure 3.4 and its application is shown in Figure 5.2. An external power supply is used to reach 20ADC test current. It is connected in series with a variable resistor and the OLTC in the transformer. Since a relatively high current is injected during the measurement, a special measuring device needed to be added. A shunt resistor made by resistor plates has been developed. It consists of seven (7) plates, connected in series and form a 0.2Ω shunt resistor. This shunt resistor has proven able to bear higher current without any change of its resistance value. The TDS146 is used as voltage recorder and it is connected parallel with the shunt resistor. It records the voltage over the shunt resistor, which represents the current through the tap changer. Then it will be displayed in a form of current graph in the viewer screen.
Figure 5.2 Experimental test setup for dynamic resistance measurement with varied test current and circuit resistance. The photograph was taken during the measurement
in a substation.
To perform the DRM with varied test current and circuit resistance, there is a step by step procedure to be followed:
- A DC source is connected to the winding in which the tap changer is included. Mostly it is the primary winding where the tap changer connected on. The other transformer winding, which has no tap changer connected on it, is short circuited to allow a fast current change. The connection on primary and secondary side of transformer is shown in Figure 5.3.
26
- The test setup shall be built up as been described in Section 3.12, where an external power supply is used to reach higher value of test current. The connection of test setup can be seen in Figure 5.2.
- A selected value of test current is injected and flows through the windings and tap changer.
- The charging test current and test voltage need to stabilize. It means the current has to reach its equilibrium and then the applied test voltage is fixed. When it is stable, the charging stage has completed.
- The value of circuit resistance can be varied by tuning the variable resistor. During the measurement, the test current is kept to be constant at one value. When a measurement of varied test current is performed, the variable resistor has to be short circuited before hand (see Figure 5.3). Thus the circuit resistance is kept minimum.
- Start the measurement by operating the OLTC by switching it through its entire taps, upward and downward.
- The current is recorded and displayed in a form of graph as a function of time, namely as DRM graph. Deviations in DRM graph can be caused by presence of irregular contacts resistance, contacts wear and/or damaged of transition resistor.
- Discharging part takes place when the measurement has finished and the power supply has been switched off. The injected current flows to the ground through the neutral connection. To prevent the current flows back to the power supply, the positive terminal of power supply need to be short circuited with the neutral terminal. It has to be done after tuning down the power supply but before it is switched off.

27
Figure 5.3 Circuit connections on high voltage and low voltage side of transformers. Short circuit connection of secondary winding is shown on left hand side, while
another side shows the connection on the bushings of primary winding. 5.2.1 Laboratory Measurement on Healthy OLTC
The measurements on good contacts OLTC have been performed on a power transformer in the High Voltage Laboratory of TU Delft (Figure 5.4). It has a diverter switch type OLTC attached to the star-connected high voltage winding of the transformer.
Beside measurements on good contacts, some experiments have been done in the laboratory. They were meant to define the fix and reliable setup. It is intended to have a test setup which applicable to do measurements for both parameters without making any disconnection of the circuit. It can save a lot of time since only one time charging is needed for the whole measurements.
A measurement result on good contacts OLTC is intended to be used as reference, where linear DRM graph can be gained. Its pyramidal shaped graph will be used to be compared with the results from other measurement of different aging phase. By doing so, the effect of the winding resistance and the transition resistors can be investigated. Then a conclusion can be drawn about the effect of test parameters on different aged OLTC.
28
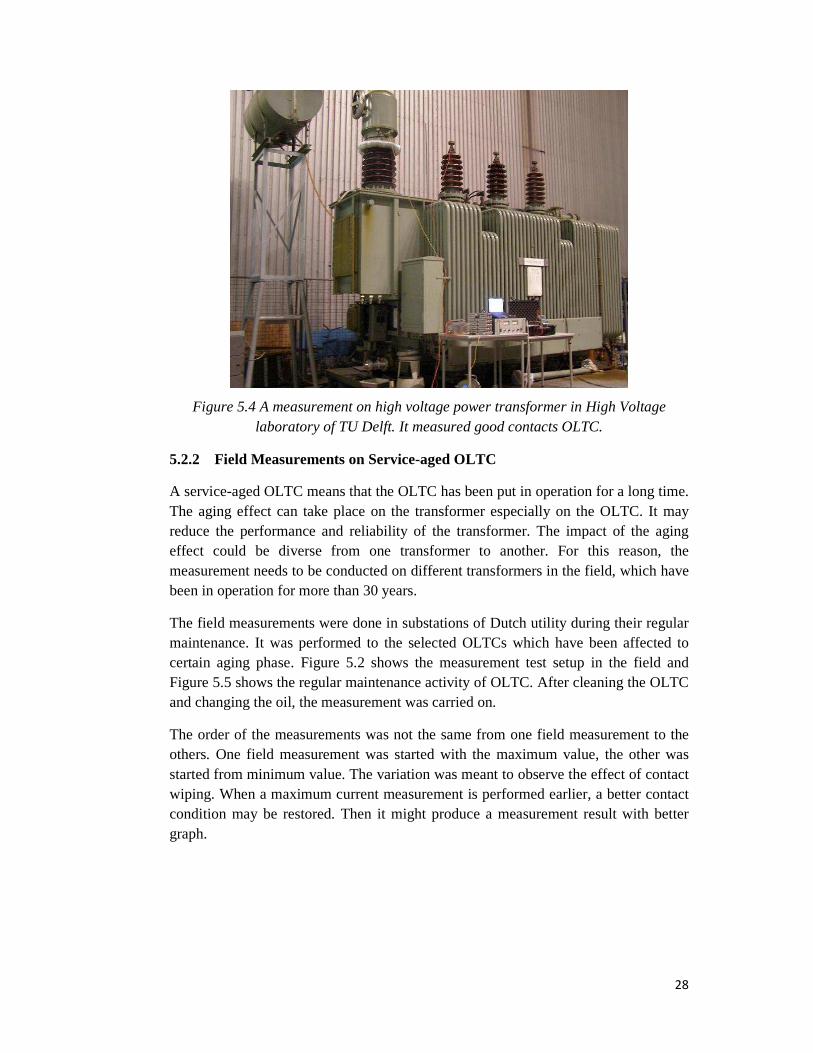
Figure 5.4 A measurement on high voltage power transformer in High Voltage laboratory of TU Delft. It measured good contacts OLTC.
5.2.2 Field Measurements on Service-aged OLTC
A service-aged OLTC means that the OLTC has been put in operation for a long time. The aging effect can take place on the transformer especially on the OLTC. It may reduce the performance and reliability of the transformer. The impact of the aging effect could be diverse from one transformer to another. For this reason, the measurement needs to be conducted on different transformers in the field, which have been in operation for more than 30 years.
The field measurements were done in substations of Dutch utility during their regular maintenance. It was performed to the selected OLTCs which have been affected to certain aging phase. Figure 5.2 shows the measurement test setup in the field and Figure 5.5 shows the regular maintenance activity of OLTC. After cleaning the OLTC and changing the oil, the measurement was carried on.
The order of the measurements was not the same from one field measurement to the others. One field measurement was started with the maximum value, the other was started from minimum value. The variation was meant to observe the effect of contact wiping. When a maximum current measurement is performed earlier, a better contact condition may be restored. Then it might produce a measurement result with better graph.

29
Figure 5.5 Regular maintenance activity of a power transformer in substation. It can be seen that the workers clean the OLTC, which is located inside the transformer tank
in a separate chamber.
5.3 Conclusion
There are three test parameters of dynamic resistance measurement: test current, circuit resistance and secondary winding short circuit. Only the first two are interested to be observed in order to see their effect to the measurement results, because they can be easily varied during the field measurement. The variation of test level during the measurement is expected to provide particular results from each test parameter.
The classifications of test levels were made based on analysis of good contacts measurement results. The sensitivity of the measurement responding a change of current due to certain defects, and the strength of the response signal are the main considerations in
The level classification of the test parameters is determined based on analysis of the good contacts measurement results. This good OLTC has a thin resistive oil film. A series of measurement were performed by tuning the test level. Then the classification of test levels was determined based on the sensitivity and the strength of the measurement signal in reading the change of current caused by defects. They are used for the experiments described in this thesis. The test levels are also classified based on the moment when the test current has broken the resistive oil film during the measurement. It will be explained later in Chapter 8, when an example of measurement using varied test current is discussed
A fix and flexible test setup was developed and described in this chapter. It shall be able to do measurements for those parameters without any disconnection of the circuit. Much time can be saved since a charging process is only done one time in the
30
beginning of the measurement. During the measurement, one test parameter is varied while the others are kept constant. The test current is kept constant at one value while the circuit resistance is varied. And does the measurement with varied test current, the circuit resistance is kept constant at its minimum value by short circuiting the variable resistor.
The measurements took place in the High Voltage Laboratory of TU Delft as well as in a number of the substations (mostly 50kV and 150kV). The laboratory measurement was done on good contacts OLTC, and field measurements were carried on different aged OLTC. They were expected to provide measurement result of different aging phases: good contacts as a reference, light, medium and advance aging.

31
Chapter 6
Experimental Results of Investigated Defects
Experiments have been done in measuring OLTCs with different aging phases: good contacts, light, medium and advance aging. The results of measurement are plotted in this chapter. It is intended to give overview of the influence of test parameters to the measurement results by showing the DRM graphs. The detail calculation and analysis will be explained later in Chapter 8, using an analytical tool which is introduced in the next chapter.
Due to some noises, filter was applied to the measurement results. It is used in order to determine the most actual signal by filtering the noise or disturbance. There should not be too much or too less filter. A higher filter can sieve the actual signal become lower in amplitude, while lower filters may not exclude the noise from the response signal. Thus a proper applied filter can avoid a misinterpretation of deviation value and produce a reliable calculation.
6.1 Measurement Results of Good Contacts OLTC
Dynamic resistance measurements on good contacts were performed on a power transformer in the High Voltage Laboratory of TU Delft. It has an OLTC with 19 taps, consists of 9 fine taps and 2 coarse taps. The availability of a test object in the laboratory gives chances to do experiments in measurements. More measurements can be performed with different test levels.
DRM with test current was performed in eight (8) different values: 0.2ADC, 0.5ADC, 1ADC, 1.5ADC, 3ADC, 5ADC, 10ADC, 20ADC. The measurement results are depicted in Figure 6.1. It can be seen from the figure that there are differences between the graphs. Variations of applied test current value have influenced. The low test current was disrupted by very thin resistive layer on the contacts. Many deviations are produced and blurred the DRM graph. A maximum test current, in this case 20ADC, produces a clean graph. It eases the interpretation of deviation value, but decreases the sensitivity to thin contact films.
32
0.28
0
0.05
0.1
0.15
0.2
0.25
Time [s]
2000 10 20 30 40 50 60 70 80 90 100 110 120 130 140 150 160 170 180 190
0.7
0
0.1
0.2
0.3
0.4
0.5
0.6
Time [s]
1900 10 20 30 40 50 60 70 80 90 100 110 120 130 140 150 160 170 180
1.4
0
0.2
0.4
0.6
0.8
1
1.2
Time [s]
19010 20 30 40 50 60 70 80 90 100 110 120 130 140 150 160 170 180
2.25
0
0.25
0.5
0.75
1
1.25
1.5
1.75
2
Time [s]
1900 10 20 30 40 50 60 70 80 90 100 110 120 130 140 150 160 170 180
4
0
0.5
1
1.5
2
2.5
3
3.5
Time [s]
1900 10 20 30 40 50 60 70 80 90 100 110 120 130 140 150 160 170 180
7
0
1
2
3
4
5
6
Time [s]
1900 10 20 30 40 50 60 70 80 90 100 110 120 130 140 150 160 170 180
14
0
2
4
6
8
10
12
Time [s]
1900 10 20 30 40 50 60 70 80 90 100 110 120 130 140 150 160 170 180
25
0
5
10
15
20
Time [s]
19010 20 30 40 50 60 70 80 90 100 110 120 130 140 150 160 170 180
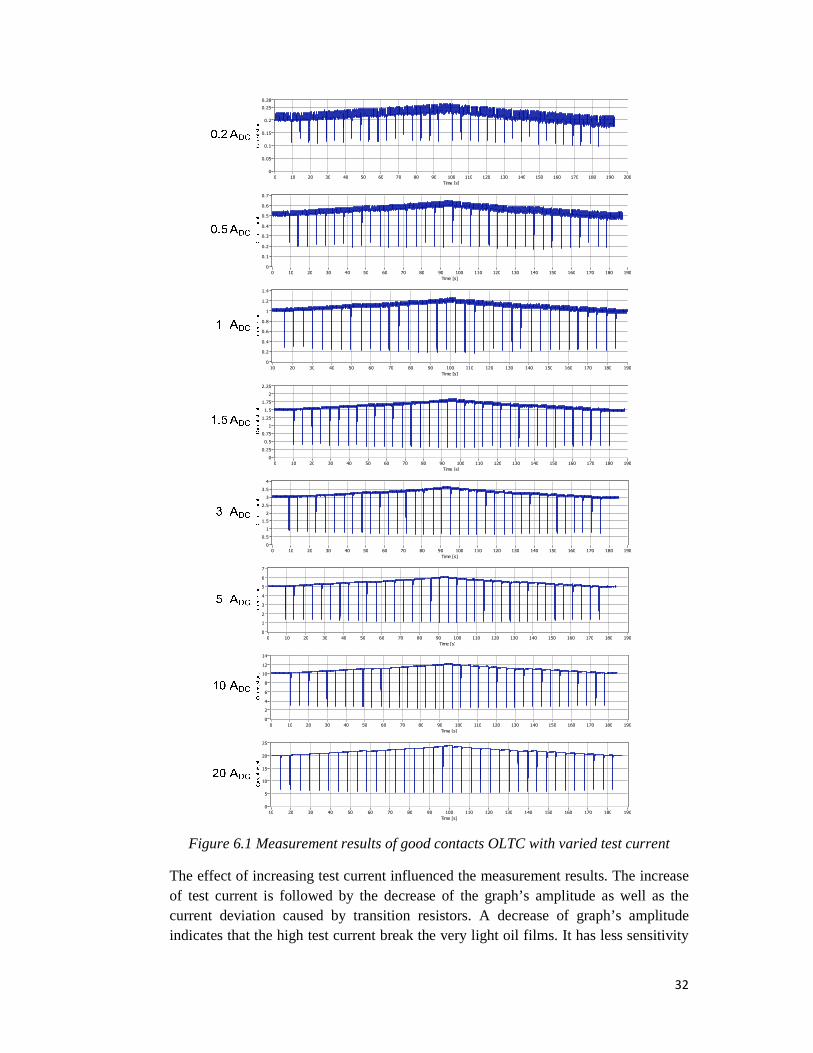
Figure 6.1 Measurement results of good contacts OLTC with varied test current
The effect of increasing test current influenced the measurement results. The increase of test current is followed by the decrease of the graph’s amplitude as well as the current deviation caused by transition resistors. A decrease of graph’s amplitude indicates that the high test current break the very light oil films. It has less sensitivity

33
measuring the light oil films. A low deviation value captured in measurement with high test current indicates the flow of current is less disrupted due to its high quantity.
Figure 6.2 shows the measurement results of good contact OLTC where the circuit resistance was tuned during the measurement. A same level of filter was always applied on DRM results with varied circuit resistance. As they are shown in the figure, the minimum circuit resistance seems has less disturbances in the graph. It is easier to identify the response signal.
1.4
0
0.2
0.4
0.6
0.8
1
1.2
Time [s]
1800 10 20 30 40 50 60 70 80 90 100 110 120 130 140 150 160 170
1.4
0
0.2
0.4
0.6
0.8
1
1.2
Time [s]
1800 10 20 30 40 50 60 70 80 90 100 110 120 130 140 150 160 170
1.3
0
0.2
0.4
0.6
0.8
1
1.2
Time [s]
1800 10 20 30 40 50 60 70 80 90 100 110 120 130 140 150 160 170
1.4
0
0.2
0.4
0.6
0.8
1
1.2
Time [s]
1800 10 20 30 40 50 60 70 80 90 100 110 120 130 140 150 160 170
1.4
0
0.2
0.4
0.6
0.8
1
1.2
Time [s]
1800 10 20 30 40 50 60 70 80 90 100 110 120 130 140 150 160 170
Ω
Ω
Ω
Ω
Ω
Figure 6.2 Measurement results of good contacts OLTC with varied circuit resistance
The influence of circuit resistance can be seen from the current deviation between taps. High circuit resistance reduces the deviation value of current during the switching operation. An increase of total circuit resistance produces low amplitude of response signal. It can be seen from the shape of the DRM graphs. Higher circuit resistance leads to more flat DRM graph. The actual shape of the graph is covered by noises due to its weak signal. Thus the circuit resistance and signal’s amplitude has opposite relationship.
34
6.2 Measurement Results of Light Aged OLTC
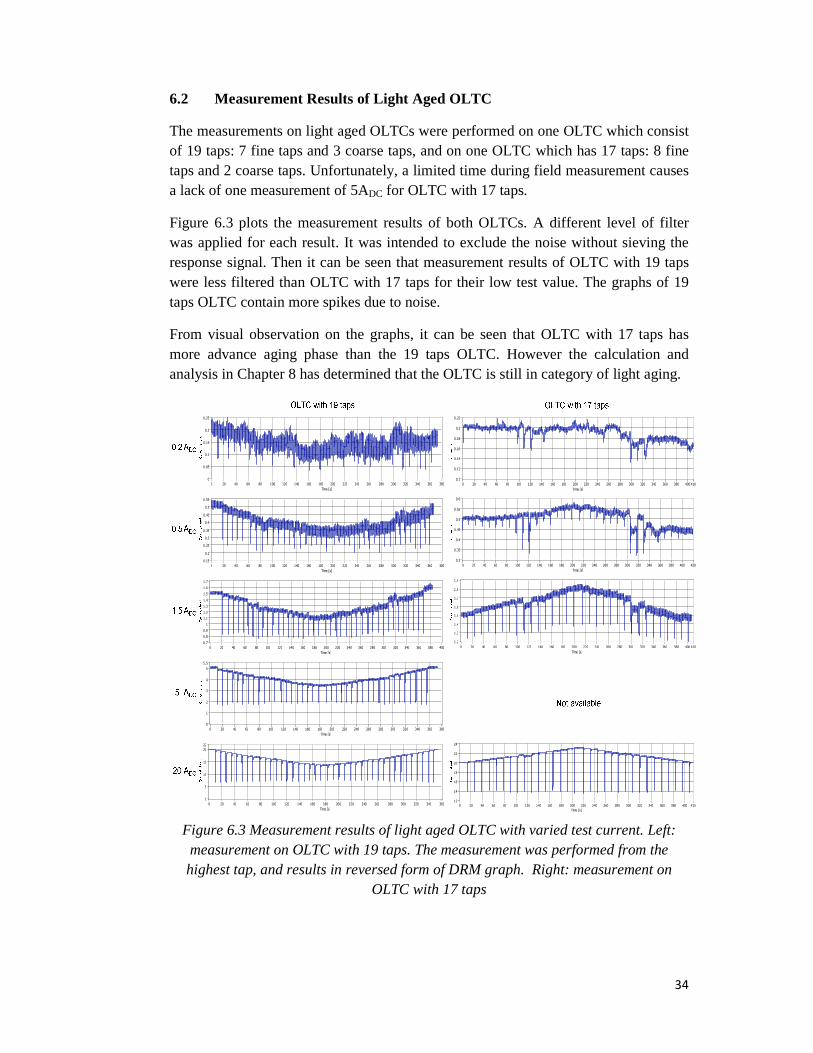
The measurements on light aged OLTCs were performed on one OLTC which consist of 19 taps: 7 fine taps and 3 coarse taps, and on one OLTC which has 17 taps: 8 fine taps and 2 coarse taps. Unfortunately, a limited time during field measurement causes a lack of one measurement of 5ADC for OLTC with 17 taps.
Figure 6.3 plots the measurement results of both OLTCs. A different level of filter was applied for each result. It was intended to exclude the noise without sieving the response signal. Then it can be seen that measurement results of OLTC with 19 taps were less filtered than OLTC with 17 taps for their low test value. The graphs of 19 taps OLTC contain more spikes due to noise.
From visual observation on the graphs, it can be seen that OLTC with 17 taps has more advance aging phase than the 19 taps OLTC. However the calculation and analysis in Chapter 8 has determined that the OLTC is still in category of light aging.
0.25
0
0.05
0.1
0.15
0.2
Time [s]
3800 20 40 60 80 100 120 140 160 180 200 220 240 260 280 300 320 340 360
0.55
0.15
0.2
0.25
0.3
0.35
0.4
0.45
0.5
Time [s]
3800 20 40 60 80 100 120 140 160 180 200 220 240 260 280 300 320 340 360
1.7
0.7
0.8
0.9
1
1.1
1.2
1.3
1.4
1.5
1.6
Time [s]
4000 20 40 60 80 100 120 140 160 180 200 220 240 260 280 300 320 340 360 380
5.5
0
1
2
3
4
5
Time [s]
3800 20 40 60 80 100 120 140 160 180 200 220 240 260 280 300 320 340 360
22
0
5
10
15
20
Time [s]
3600 20 40 60 80 100 120 140 160 180 200 220 240 260 280 300 320 340
0.22
0.1
0.12
0.14
0.16
0.18
0.2
Time [s]
4100 20 40 60 80 100 120 140 160 180 200 220 240 260 280 300 320 340 360 380 400
0.6
0.3
0.35
0.4
0.45
0.5
0.55
Time [s]
4200 20 40 60 80 100 120 140 160 180 200 220 240 260 280 300 320 340 360 380 400
1.9
1.2
1.3
1.4
1.5
1.6
1.7
1.8
Time [s]
4100 20 40 60 80 100 120 140 160 180 200 220 240 260 280 300 320 340 360 380 400
24
12
14
16
18
20
22
Time [s]
4150 20 40 60 80 100 120 140 160 180 200 220 240 260 280 300 320 340 360 380 400
Figure 6.3 Measurement results of light aged OLTC with varied test current. Left: measurement on OLTC with 19 taps. The measurement was performed from the highest tap, and results in reversed form of DRM graph. Right: measurement on
OLTC with 17 taps

35
Figure 6.4 shows the effect of resistive layer to the measurement results. Resistive layer on OLTC contact provides additional resistance to the circuit. Thus it increases the sensitivity of the measurement and produce low amplitude of response signal. The measurement on 17 tapped OLTC (with higher resistive layer) has measured any short current deviation and noises. It contains more spikes due to higher contact resistance than OLTC with 19 taps.
1.1
0.4
0.5
0.6
0.7
0.8
0.9
1
Time [s]
3900 20 40 60 80 100 120 140 160 180 200 220 240 260 280 300 320 340 360 380
1.3
0.5
0.6
0.7
0.8
0.9
1
1.1
1.2
Time [s]
4000 20 40 60 80 100 120 140 160 180 200 220 240 260 280 300 320 340 360 380
1.1
0.6
0.65
0.7
0.75
0.8
0.85
0.9
0.95
1
1.05
Time [s]
3600 20 40 60 80 100 120 140 160 180 200 220 240 260 280 300 320 340
1.05
0.65
0.7
0.75
0.8
0.85
0.9
0.95
1
Time [s]
3600 20 40 60 80 100 120 140 160 180 200 220 240 260 280 300 320 340
1.1
0.75
0.8
0.85
0.9
0.95
1
1.05
Time [s]
3600 20 40 60 80 100 120 140 160 180 200 220 240 260 280 300 320 340
Ω
Ω
Ω
Ω
Ω
1.15
0.65
0.7
0.75
0.8
0.85
0.9
0.95
1
1.05
1.1
Time [s]
4150 20 40 60 80 100 120 140 160 180 200 220 240 260 280 300 320 340 360 380 400
1.1
0.75
0.8
0.85
0.9
0.95
1
1.05
Time [s]
4300 20 40 60 80 100 120 140 160 180 200 220 240 260 280 300 320 340 360 380 400 420
1.1
0.8
0.85
0.9
0.95
1
1.05
Time [s]
4300 20 40 60 80 100 120 140 160 180 200 220 240 260 280 300 320 340 360 380 400 420
1.1
0.85
0.875
0.9
0.925
0.95
0.975
1
1.025
1.05
1.075
Time [s]
5000 50 100 150 200 250 300 350 400 450
1.08
0.92
0.94
0.96
0.98
1
1.02
1.04
1.06
Time [s]
4100 20 40 60 80 100 120 140 160 180 200 220 240 260 280 300 320 340 360 380 400
Figure 6.4 Measurement results of light aged OLTC with varied circuit resistance. Left: measurement on OLTC with 19 taps. The measurement was performed from the highest tap, and results in reversed form of DRM graph. Right: measurement on OLTC with 17 taps

36
6.3 Measurement Results of Medium Aged OLTC
The measurement on medium aged OLTC was performed on OLTC which has 17 taps: 8 fine taps and 2 coarse taps. The deteriorated contacts are clearly seen in the measurement results (Figure 6.5). A quiet severe of defect occurs in the change-over selector measured as deviation on the taps where change-over selector moved. The presence of thick resistive layer causes the current is disrupted during its flow through the change-over contacts. Its typical appearance can be seen in the measurement results which the deviation also occurs in the fine taps after the change-over selector has moved to the deteriorated tap. The graph was deviated at that area.
When the measurement applied high test current, a normal and linear DRM graph was restored. The resistive layer has been broken, thus the presence of thick resistive layer was measured as thin layer. A restored of good graph is depicted from the measurement result of 20ADC. The graph has a linear pattern with its peak tap has higher current value than the low tap.
0.225
0
0.025
0.05
0.075
0.1
0.125
0.15
0.175
0.2
Time [s]
3550 20 40 60 80 100 120 140 160 180 200 220 240 260 280 300 320 340
0.6
0.15
0.2
0.25
0.3
0.35
0.4
0.45
0.5
0.55
Time [s]
3500 25 50 75 100 125 150 175 200 225 250 275 300 325
1.7
1
1.1
1.2
1.3
1.4
1.5
1.6
Time [s]
3600 20 40 60 80 100 120 140 160 180 200 220 240 260 280 300 320 340
5.4
3.8
4
4.2
4.4
4.6
4.8
5
5.2
Time [s]
3350 20 40 60 80 100 120 140 160 180 200 220 240 260 280 300 320
23
15
16
17
18
19
20
21
22
Time [s]
3600 20 40 60 80 100 120 140 160 180 200 220 240 260 280 300 320 340
Figure 6.5 Measurement results of medium aged OLTC with varied test current. High filter is applied on 0.2ADC in order to remove the noises. As result, it filtered more the
current deviation due to transition resistors. It causes the deviation is disappeared.

37
Figure 6.6 shows DRM results which were measured with varied circuit resistance on medium aged OLTC. The effect of increase circuit resistance is clearly seen where the graphs of high test level become more blur due to noises. In comparison to the previous measurement on light aged OLTC, the graph of medium aged OLTC contains more spikes. The thick layer causes a higher total circuit resistance. In consequence it increases the thermal noises from circuit resistors and disturbs the measurement results.
1.1
0.5
0.6
0.7
0.8
0.9
1
Time [s]
3400 20 40 60 80 100 120 140 160 180 200 220 240 260 280 300 320
1.1
0.6
0.7
0.8
0.9
1
Time [s]
3300 10 20 30 40 50 60 70 80 90 100 110 120 130 140 150 160 170 180 190 200 210 220 230 240 250 260 270 280 290 300 310 320
1.2
0.7
0.8
0.9
1
1.1
Time [s]
3400 20 40 60 80 100 120 140 160 180 200 220 240 260 280 300 320
1.05
0.775
0.8
0.825
0.85
0.875
0.9
0.925
0.95
0.975
1
1.025
Time [s]
3300 20 40 60 80 100 120 140 160 180 200 220 240 260 280 300 320
1.04
0.88
0.9
0.92
0.94
0.96
0.98
1
1.02
Time [s]
3550 20 40 60 80 100 120 140 160 180 200 220 240 260 280 300 320 340
Ω
Ω
Ω
Ω
Ω
Figure 6.6 Measurement results of medium aged OLTC with varied circuit resistance
The current deviation due to coking is best captured in the measurement with 0.2Ω circuit resistance. Effect of coking can be seen that it disrupts the current more on the particular taps. They have lower value compare to other taps. This measurement with low circuit resistance also measured the increase of contact resistance due to short term. The graph is clear enough which can show the small deviation caused by thin resistive layer. An increase of circuit resistance leads to unclear measurement results.
6.4 Measurement Results of Advance Aged OLTC
The measured advance aged OLTC has the same number of taps like the one measured on medium aged. The OLTC is measured has more severe condition, where

38
large deviation occur. The DRM graphs in Figure 6.7 has measured that the presence of coking on change-over selector has disrupt the current quite bad. It is captured in the graph that the current has been disrupted 30% of its normal value.
A low test current can be easily disrupted by thin resistive layer, thus measurement on advance aged OLTC produce a graph full of noise. To get the actual signal, high filter need to be applied. In consequence it removed the effect of transition resistors during the switching.
0.225
0
0.025
0.05
0.075
0.1
0.125
0.15
0.175
0.2
Time [s]
3550 20 40 60 80 100 120 140 160 180 200 220 240 260 280 300 320 340
0.8
0.2
0.3
0.4
0.5
0.6
0.7
Time [s]
3400 20 40 60 80 100 120 140 160 180 200 220 240 260 280 300 320
1.9
1
1.1
1.2
1.3
1.4
1.5
1.6
1.7
1.8
Time [s]
3550 20 40 60 80 100 120 140 160 180 200 220 240 260 280 300 320 340
5.8
4
4.2
4.4
4.6
4.8
5
5.2
5.4
5.6
Time [s]
3500 25 50 75 100 125 150 175 200 225 250 275 300 325
23
15
16
17
18
19
20
21
22
Time [s]
3500 25 50 75 100 125 150 175 200 225 250 275 300 325
Figure 6.7 Measurement results of advance aged OLTC with varied test current
These graphs should give a warning that the OLTC need to be revised in the next maintenance schedule, particularly the change-over selector. But surely an analysis on the fingerprints of the measurement should be done to see the trend of the aging effect.
When the measurements were done with varied test current on advance aged OLTC, it produces DRM graphs which have different patterns. Figure 6.7 also shows the influence of high resistance of contacts. Measurements with low test current produce different pattern with the one done in medium test current. The low test current is

39
disrupted easily by any presence of contact films. In contrary, the medium test current can not be disrupted by very thin resistive layer. As results the graph is shown to have better form. This trend occurs only in measurement on advance aged OLTC where the test current is varied. The measurement on medium aged OLTC (Figure 6.5) has considerably similar pattern of DRM graph, even though the test current was varied. This explains that the presence of advance defect can cause a significant different of the measurement results when the test parameters are varied.
1.15
0.7
0.75
0.8
0.85
0.9
0.95
1
1.05
1.1
Time [s]
3600 20 40 60 80 100 120 140 160 180 200 220 240 260 280 300 320 340
1.2
0.6
0.7
0.8
0.9
1
1.1
Time [s]
3450 20 40 60 80 100 120 140 160 180 200 220 240 260 280 300 320
1.15
0.75
0.8
0.85
0.9
0.95
1
1.05
1.1
Time [s]
3550 20 40 60 80 100 120 140 160 180 200 220 240 260 280 300 320 340
1.1
0.88
0.9
0.92
0.94
0.96
0.98
1
1.02
1.04
1.06
1.08
Time [s]
3500 25 50 75 100 125 150 175 200 225 250 275 300 325
1.06
0.88
0.9
0.92
0.94
0.96
0.98
1
1.02
1.04
Time [s]
3500 25 50 75 100 125 150 175 200 225 250 275 300 325
Ω
Ω
Ω
Ω
Ω
Figure 6.8 Measurement results of advance aged OLTC with varied circuit resistance
The measurement with varied circuit resistance did not change the value of test current. It has impact on the sensitivity of measurement. Figure 6.8 shows that advance aged OLTC measured with high circuit resistance produces a DRM graph which is fully covered by spikes. More noise has been produced due to high total circuit resistance. It is hard to identify the effect of transition resistor during the switching operation.
A low circuit resistance provides less additional resistance to the circuit. Then it allows the test current measured the resistive layer with minimum influence of

40
resistance. It also produced a higher deviation than other test value, for the same measured contacts. This indication may lead to the influence of circuit resistance measuring the contact resistance.
6.5 Conclusion
- It is essential to apply filter on measurement results. There are some noises measured and could distract the response signal. In order to get the real value, applied filter should be controlled. Too much filter will change the actual shape of signal. It makes the signal lower than it should be. For example, too many filter applied on P4 analysis will neglect the fast current change during the switching and produce lower amplitude of response signal. It leads to misinterpretation in defining the exact value of deviating current.
- The increase of total circuit resistance produces a measurement result which has lot of spikes. The spikes represent noises which may have different sources, such as wires, power supply or from the transformer itself.
- Based on the results, a measurement using Medium level of test current with minimum circuit resistance has a good balance between the sensitivity and the quality of the response signal. Its sensitivity is high enough to measure the presence of light resistive layer. It did not break the layer and it did not measure a very thin layer. The produced response signal has high amplitude, much more than the noise. It eases the identification of the response signal. Thus, DRM using medium test current will provide a reliable measurement results.

41
Chapter 7
Development of an Analytical Tool
A systematic method of analyzing the measurement results is developed in this chapter. Four parameters will be applied to quantify each measurement result. The outcomes are percentage values of current deviations in the DRM graph. These quantities will be used to determine the condition of an OLTC.
7.1 Parameters of Analysis
The development of an analytical tool is intended to help engineers to analyze their DRM results. It can be applied to each DRM graph to measure the deviations. The output information will be the deviations in percentage of the normal graph (reference). The deviation value is an important factor to determine the aging phases of an OLTC.
The implementation of the analytical tool is described in Figure 7.1. Four parameters of analysis are used to measure the deviations in DRM graph. The defects on OLTC cause deviations in particular location in the graph. Then the selected parameters of analysis can reveal the most common of OLTC defects.
The percentage of deviation from the normal pattern of DRM graph is calculated. It indicates how big the current is deviated from the reference (which is an OLTC in healthy condition) due to defects. Finally, the output is a diagnostic result of the OLTC, indicating whether there are any defects identified or whether it is a healthy OLTC.
Figure 7.1 Overall parameters of analysis applied on a DRM graph
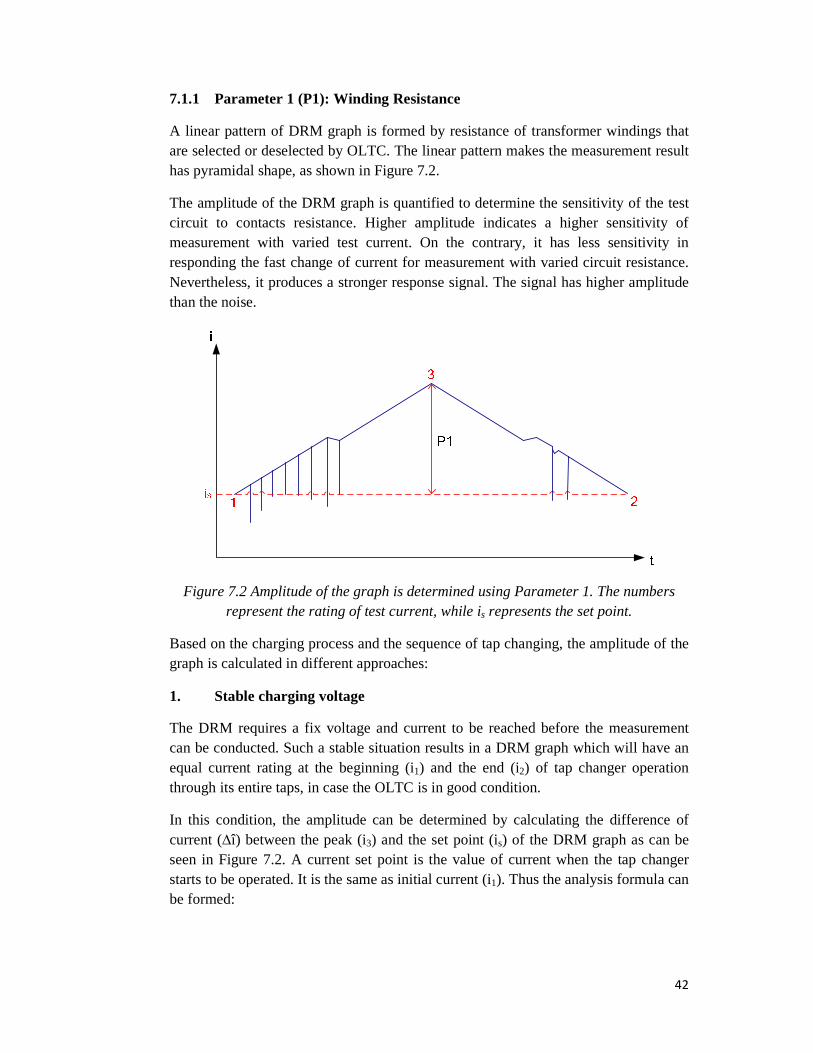
42
7.1.1 Parameter 1 (P1): Winding Resistance
A linear pattern of DRM graph is formed by resistance of transformer windings that are selected or deselected by OLTC. The linear pattern makes the measurement result has pyramidal shape, as shown in Figure 7.2.
The amplitude of the DRM graph is quantified to determine the sensitivity of the test circuit to contacts resistance. Higher amplitude indicates a higher sensitivity of measurement with varied test current. On the contrary, it has less sensitivity in responding the fast change of current for measurement with varied circuit resistance. Nevertheless, it produces a stronger response signal. The signal has higher amplitude than the noise.
Figure 7.2 Amplitude of the graph is determined using Parameter 1. The numbers represent the rating of test current, while is represents the set point.
Based on the charging process and the sequence of tap changing, the amplitude of the graph is calculated in different approaches:
1. Stable charging voltage
The DRM requires a fix voltage and current to be reached before the measurement can be conducted. Such a stable situation results in a DRM graph which will have an equal current rating at the beginning (i1) and the end (i2) of tap changer operation through its entire taps, in case the OLTC is in good condition.
In this condition, the amplitude can be determined by calculating the difference of current (Ɣ) between the peak (i3) and the set point (is) of the DRM graph as can be seen in Figure 7.2. A current set point is the value of current when the tap changer starts to be operated. It is the same as initial current (i1). Thus the analysis formula can be formed:

43
3 1
1
i iP1 ( î) = 100%
i
−∆ ×
2. Un-stable charging voltage
When the tap changer is operated before a fix voltage is reached, the end current rating (i2) after the measurement will be different, either higher or lower than initial value (i1). This condition causes the linear pattern of DRM graph is slightly tilted. It means, the end value (i2) needs to be adjusted to have the same value with the initial current (i1). In result, the peak (i3) will be added or subtracted based on the adjustment value. Two situations are distinguished:
2.1. Initial value < end value (i1 < i2)
The charging voltage may rise during the measurement and causes the DRM graph to be shifted upward. The end value (i2) is then higher than initial value (i1). To do the calculation, the end value (i2) need to be equalized as initial value (i1). The difference between i1 and i2 is used to subtract the value of the peak DRM graph (i3).
( )3 2 1 1
1
i i i iP1 ( î) = 100%
i
− − − ∆ ×
2.2. Initial value > end value (i1 > i2)
If the voltage is decrease during the measurement, it means the DRM graph will be shifted downward due to lower end value (i2). With the same approach as the previous one, the end value (i2) need to be levelized with the initial value (i1). The difference between i1 and i2 is used to add the value of the peak DRM graph (i3).
( )3 1 2 1
1
i i i iP1 ( î) = 100%
i
+ − − ∆ ×
3. Reversed peak
In some measurements, the operation of OLTC is started from the tap with the lowest winding resistance. As result the DRM graph is reversed, the pyramid shaped graph has a peak value which is lower than the set point (see Figure 7.3)

44
Figure 7.3 DRM graph has reversed shape since the tap changer is operated from the highest to lowest tap.
3.1. Initial value < end value (i1 < i2)
The same condition is presence where a fix voltage has not been reached yet before the measurement is started. Therefore the same approach is valid where end value (i2) need to be levelized with the initial value (i1):
( )1 3 2 1
s
i i i iP1 ( î) = 100%
i
− − − ∆ ×
3.2. Initial value > end value (i1 > i2)
And for the condition where the voltage is decrease at the end of measurement:
( )1 3 1 2
s
i i i iP1 ( î) = 100%
i
− + − ∆ ×
7.1.2 Parameter 2 (P2): Contact Resistance – Short Term Effect
The thickness of resistance on the OLTC contacts is calculated through this second parameter. There is a small chance for thin oil film to grow because of the wiping actions by the contacts. It prevents the growth of thin oil film into the thicker one. This formation of thin resistive layer of oil is occurred in the beginning of aging phase. Therefore this parameter reflects the short-term effect.
The principle of the measurement is to measure the presence of resistive layer on the OLTC. The injected test current flows through the rotor contacts during its movement on the surface of stator contacts. Thus the measurement interprets the condition of contacts surface. A clean contact surface from resistive layer is interpreted as a flat

45
curve of one tap in DRM graph. The presence of resistive layer on contacts’ surface will disrupt the flow of test current. It is indicated as deviation of one tap in DRM graph.
Figure 7.4 The deviation is captured on the tap where arcing switch is operated
The deviation in the DRM graph can occur in the moment of arcing switch is moved. The location where the arcing switch has some resistive layer is shown in Figure 7.4 in the closed up image. The largest disruption is selected to be calculated. An imaginary line is used to form a normal graph of the selected tap. Two trigger points are plotted at the lowest point of disruption (i5) and at place where the normal current value should be (i4). Then the difference between both values is calculated in percentage. This calculation is described in the following formula:
4 5
4
i iP2 (%) = 100%
i
− ×
7.1.3 Parameter 3 (P3): Contact Resistance – Long Term Effect
This parameter determines the difference in resistance between change-over selector contacts which are infrequently moved. Those change-over selector contacts are prone to advanced aging and a long term effect of carbon development. Any deviation on surface contacts will not be measured due to the use of trend-line.
Figure 7.5 illustrates the method to calculate a DRM graph deviation located on the change-over selector. The deviation of a DRM graph at the change-over selector can be recognized when it occurs on the tap(s) where the change-over selector is operated. The result is one part of the graph is shifted into lower current value due to the increase of resistance on the change-over selector contacts.

46
i
P3
t
7
6
Figure 7.5 Parameter 3 is used to calculate the deviation on the change-over selector. An OLTC with two coarse windings is illustrated. A deviation on the change-over
selector causes one part of DRM graph is shifted into lower value of current.
To measure the amplitude of deviation on the change-over selector, a trend-line is used. It is drawn by extending the linear pattern line from the normal fine taps before the change-over selector has switched to the degraded one. Thus the difference value between the imaginary line and the shifted line is calculated. In order to get the exact point, two trigger points should be located perpendicularly on the change-over tap which has the largest deviation (i7) and at the imaginary line (i6). This method can be formulated:
6 7
6
i iP3 (%) = 100%
i
− ×
7.1.4 Parameter 4 (P4): Timing of Transition Resistor(s)
The changes in contact timing (indicated by the length of current drop) and changes in the value of transition resistors during an OLTC switching period is measured in this parameter. This fourth parameter is sensitive to the changes in the circuit time constant (L/R). A large time constant may not allow the measurement to read the fast current change during the switching.
A different length of current drop indicates a wear of contacts, and a drop of current to zero signifies a damaged transition resistors. The variation of time consumed by transition resistors to carry load current indicates that there is a wear on some contacts. It takes longer time before the transition contact reaches the next tap and thus the current is dropped lower due to the resistance of transition resistors. This kind of defect has been discussed previously in Chapter 4.
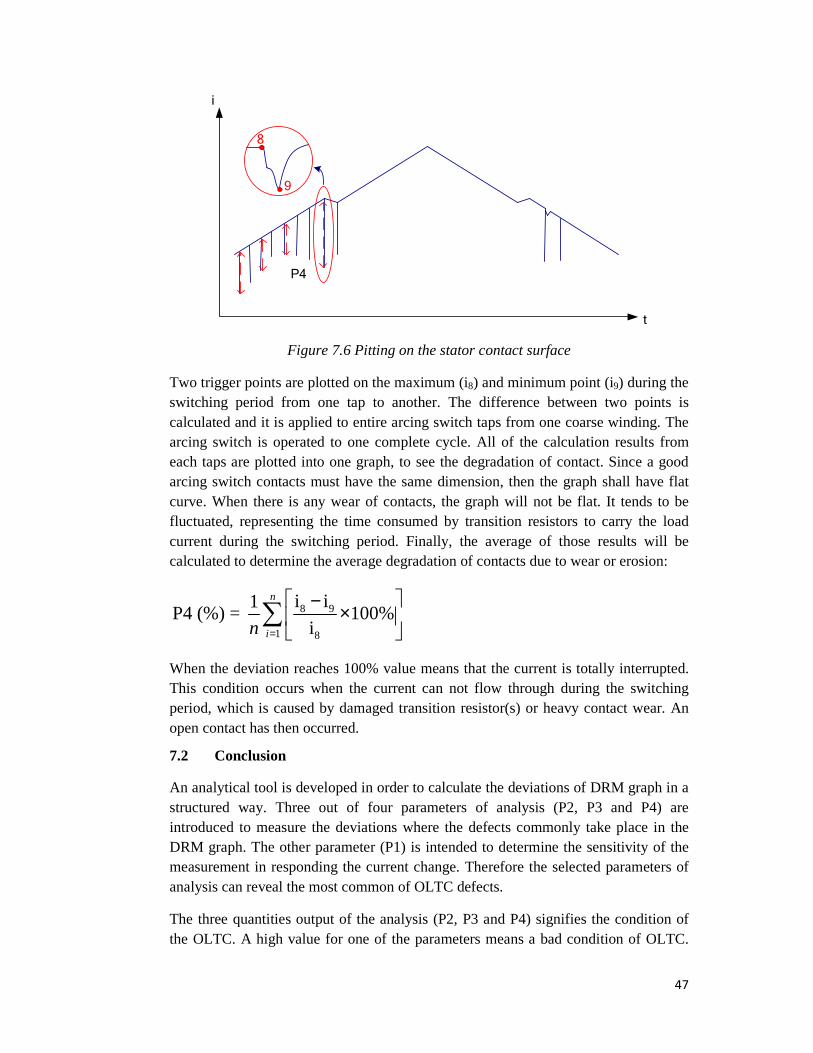
47
i
t
P4
8
9
Figure 7.6 Pitting on the stator contact surface
Two trigger points are plotted on the maximum (i8) and minimum point (i9) during the switching period from one tap to another. The difference between two points is calculated and it is applied to entire arcing switch taps from one coarse winding. The arcing switch is operated to one complete cycle. All of the calculation results from each taps are plotted into one graph, to see the degradation of contact. Since a good arcing switch contacts must have the same dimension, then the graph shall have flat curve. When there is any wear of contacts, the graph will not be flat. It tends to be fluctuated, representing the time consumed by transition resistors to carry the load current during the switching period. Finally, the average of those results will be calculated to determine the average degradation of contacts due to wear or erosion:
8 9
1 8
i i1P4 (%) = 100%
i
n
in =
− ×
∑
When the deviation reaches 100% value means that the current is totally interrupted. This condition occurs when the current can not flow through during the switching period, which is caused by damaged transition resistor(s) or heavy contact wear. An open contact has then occurred.
7.2 Conclusion
An analytical tool is developed in order to calculate the deviations of DRM graph in a structured way. Three out of four parameters of analysis (P2, P3 and P4) are introduced to measure the deviations where the defects commonly take place in the DRM graph. The other parameter (P1) is intended to determine the sensitivity of the measurement in responding the current change. Therefore the selected parameters of analysis can reveal the most common of OLTC defects.
The three quantities output of the analysis (P2, P3 and P4) signifies the condition of the OLTC. A high value for one of the parameters means a bad condition of OLTC.
48
The largest deviations of DRM graph should be selected to be analyzed since they represent the worst case of all taps.
Exclusively, Parameter 4 has different approach of analysis. It is intended to calculate the timing of transition resistor to see how long the transition resistors bear the load current. The result shall be plotted on the graph. A fluctuating plotted curve indicates a wear of arcing switch contacts due to different timing of current borne by the resistors. Nevertheless, the different length of deviation in P4 analysis can not be directly subjected as defects. Due to a various designs of arcing switch contacts, there is different toleration value of current deviation. The range of toleration is determined based on the rating of transition resistors.

49
Chapter 8
Application of Analytical Tool to the Measurement Results
In order to analyze the measurement results from Chapter 6, an analytical tool has been developed as discussed in Chapter 7. It will be applied to each measurement results to calculate the deviations of the current in the DRM graph. As the outcome, the analysis will determine the influence of test parameters to the measurement results, in particular at degraded contacts. Therefore, it is also necessary to apply the same categorical level of each test parameters (low, medium and high level) to observe their effect to the measurement results from each level and draw the conclusions out of it.
8.1 Analysis for the Good Contacts
The measurement result of good OLTC contacts will be used as reference to calculate the deviations as well as to make comparison with DRM graphs from aged OLTCs. Hence, the conclusions can be drawn by referring to the measurement results of good OLTC.
8.1.1 Test Current
The analytical tool is used on the measurement results for every test parameters. An example where the analytical tool is applied to a low test current (0.2ADC) is described below. The behaviour of the test current from each analysis parameter is shown through the graphs in Figure 8.1 up to Figure 8.4.
Parameter 1: Winding Resistance (i1 > i2)
There are four parameters of analysis applied to calculate the DRM graph of low category test current 0.2ADC. The first parameter (P1) calculated the amplitude of DRM graph from a complete operation of OLTC. It determines the relationship of the measurement sensitivity to the change of contacts resistance. When the dynamic resistance measurement is performed using low current level, the sensitivity to read the presence of resistance on contacts is high. The low test current is easily disrupted by the thin resistive layer.
( )
( )
3 1 2 1
1
i i i iP1 ( î) = 100%
i
0.225 0.2 0.175 0.2 = 100%
0.2 = 25%
+ − − ∆ ×
+ − − ×

50
0.26
0.14
0.16
0.18
0.2
0.22
0.24
Time [s]
1900 10 20 30 40 50 60 70 80 90 100 110 120 130 140 150 160 170 180
Figure 8.1 DRM graph of full operation of OLTC. The method of calculation for
Parameter 1 and Parameter 4 is shown by P1 and P4.
Parameter 2: Contacts Resistance – Short Term
P2 as the second parameter calculates the deviation of test current on each tap. The largest deviation on one tap shall be selected for calculation. Figure 8.2 shows the method to determine the deviation using one imaginary line and two trigger points on the disrupted tap. Since it was applied on good contacts, there is only small deviation detected on the graph.
4 5
4
i iP2 (%) = 100%
i
0.19 0.165 = 100%
0.19 = 13.16%
− ×
− ×
0.285656
0.127421
0.14
0.16
0.18
0.2
0.22
0.24
0.26
Time [s]
24.82963622.362292 22.5 22.75 23 23.25 23.5 23.75 24 24.25 24.5
Figure 8.2 Closed up of DRM graph on 2 taps of OLTC with a small deviation.
Parameter 3: Contact Resistance – Long Term
The next parameter (P3) is used to calculate the deviation of DRM graph due to long term effect. This long term effect is mostly occurred on the change-over selector, which is rarely moved. Thus the calculation is done by applying two parallel lines for calculation: one to the series of fine taps before change-over selector is switched and one to the next series of fine taps after change-over selector has switched (see Figure 8.3).

51
6 7
6
i iP3 (%) = 100%
i
0.216 0.214 = 100%
0.216 = 0.93%
− ×
− ×
0.26
0.14
0.16
0.18
0.2
0.22
0.24
Time [s]
61.70940245.934066 48 50 52 54 56 58 60
Figure 8.3 A closed up of DRM graph on 4 taps of OLTC, where the change-over selector moved to the next tap at tap 10. Deviation of current is detected on tap 10
which is lower than tap 9.
Parameter 4: Timing of Transition Resistors
The last parameter (P4) calculates the timing when the transition resistors are used to carry the current during the switching from one tap to another. Using this method, a wear of contacts can be detected from a fluctuated curve as shown in Figure 8.4. The fluctuated curve indicates that the arcing switch contacts have differences in size, and causes different deviations of current for each taps (see Table 8.1). The most worn contact is indicated has the biggest deviation. For measurement using 0.2ADC, it is typical if the deviations vary a lot. Its low current level is disrupted easily due to small wear or imperfect connection of the contacts. Thus a low deviation indicated at tap 4 might be occurred due to those possibilities. Another measurement has been done using the same value and shown the same indication at tap 4. Besides wear of contacts, P4 can also be used to detect damaged of transition resistors. A current drop to zero indicates that the transition resistors are damage, no current can flow through the transition contacts of OLTC during the switching. The analysis to the wear of contacts will be discussed in section 8.5.
8 9
1 8
i i1P4 (%) = 100%
i
= 82.35%
n
in =
− ×
∑

52
Table 8.1 Current deviation during the OLTC switching through complete fine taps before change-over selector moves to the next tap.
Taps i8 (A) i9 (A) ∆isw (%) 1 0.2 0.03 85.00 2 0.2 0.02 90.00 3 0.2 0.03 85.00 4 0.2 0.11 45.00 5 0.2 0.025 87.50 6 0.2 0.035 82.50 7 0.201 0.012 94.03 8 0.201 0.03 85.07 9 0.201 0.026 87.06
Low I = 0.2A
0
10
20
30
40
50
60
70
80
90
100
1 2 3 4 5 6 7 8 9
Taps
Dev
iati
on
(%)
∆isw (%)
Figure 8.4 Plotted graph of DRM on one set of fine taps. The un-flatted graph is caused by small wear on contacts.
There is not much different of deviation when the current level is tuned during the measurement to good contacts, as shown in Table 8.2. It is only small disturbance of current flow due to a very thin built up layer of oil. Figure 8.5 shows that the deviation of P2 is higher when the test current is 0.2ADC. The thin oil film could not be broken by low test current. Starting in 1ADC up to 1.5ADC, the current can partly break the oil film. Further the thin oil film on arcing contacts was broken when the injected current reached 3ADC. The zero value indicates there is no voltage drop measured on the contacts. The current flows through the contacts, without any disruption. This phenomenon is one of the factors in classifying the test level into low, medium and high level; as has been discussed in Chapter 5.

53
Table 8.2 Calculated current deviation using four parameters of analysis from different ratings of test current
I (A) P1 (%) P2 (%) P3 (%) P4 (%) 0.2 25.00 13.16 0.93 82.35 0.5 23.00 6.12 0.55 81.67 1 23.00 5.00 0.46 76.74
1.5 21.33 3.91 0.61 75.34 3 21.00 0.00 0.61 73.67 5 20.40 0.00 0.90 75.79
10 20.00 0.00 0.63 72.69 20 19.50 0.00 0.91 70.81
Test current - Good Contacts
0
10
20
30
40
50
60
70
80
90
100
0.2 0.5 1 1.5 3 5 10 20
Test current (A)
Dev
iati
on
(%
) P1 (%)
P2 (%)
P3 (%)
P4 (%)
Figure 8.5 Application of four analysis parameters to show the effect of different levels of test current on good contacts OLTC.
8.1.2 Circuit Resistance
For the second test parameter, an additional resistance was added to the circuit resistance in order to see its effect to the measurement results. The test current was charged to 1ADC prior to the measurement, while the additional resistance was tuned from low to the high value. The range of the resistance was selected from 0.2Ω to 8Ω.
The measurement was performed to the same transformer with good condition of contacts. The calculation results from measurements can be seen in Table 8.3 and plotted in Figure 8.6. The circuit resistance has effect to the ability to capture the current disruption. Higher circuit resistance has higher sensitivity in reading the current change but lower amplitude of response signal. A fast current change can be detected by high circuit resistance. The deviation becomes smaller along with the increase of circuit resistance, resulting in a big different of deviation value between
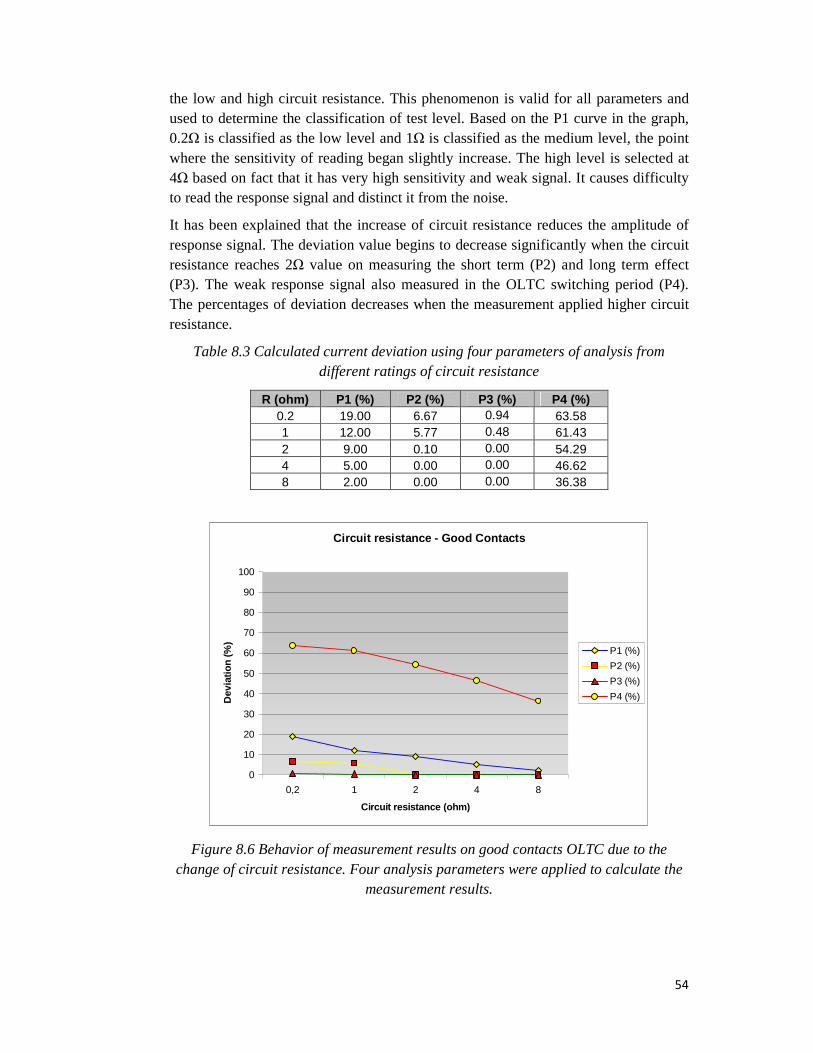
54
the low and high circuit resistance. This phenomenon is valid for all parameters and used to determine the classification of test level. Based on the P1 curve in the graph, 0.2Ω is classified as the low level and 1Ω is classified as the medium level, the point where the sensitivity of reading began slightly increase. The high level is selected at 4Ω based on fact that it has very high sensitivity and weak signal. It causes difficulty to read the response signal and distinct it from the noise.
It has been explained that the increase of circuit resistance reduces the amplitude of response signal. The deviation value begins to decrease significantly when the circuit resistance reaches 2Ω value on measuring the short term (P2) and long term effect (P3). The weak response signal also measured in the OLTC switching period (P4). The percentages of deviation decreases when the measurement applied higher circuit resistance.
Table 8.3 Calculated current deviation using four parameters of analysis from different ratings of circuit resistance
R (ohm) P1 (%) P2 (%) P3 (%) P4 (%) 0.2 19.00 6.67 0.94 63.58 1 12.00 5.77 0.48 61.43 2 9.00 0.10 0.00 54.29 4 5.00 0.00 0.00 46.62 8 2.00 0.00 0.00 36.38
Circuit resistance - Good Contacts
0
10
20
30
40
50
60
70
80
90
100
0,2 1 2 4 8
Circuit resistance (ohm)
Dev
iati
on
(%)
P1 (%)
P2 (%)
P3 (%)
P4 (%)
Figure 8.6 Behavior of measurement results on good contacts OLTC due to the change of circuit resistance. Four analysis parameters were applied to calculate the
measurement results.

55
8.2 Analysis for Light Aged Contacts
The measurement on light aged OLTC was performed on OLTC 1 which has 17 taps: 8 fine taps and 2 coarse taps and OLTC 2 which consist of 19 taps: 7 fine taps and 3 coarse tap. For the next phase of aging, (section 8.3 and 8.4), all measurements were performed on the selector type OLTCs with 17 taps: 8 fine taps and 2 coarse taps.
Due to limitation of time in the field, only few test levels can be applied. Five test levels for each test parameters were conducted during the measurement: three categories of test level (low, medium, high) and two additional selected test levels.
8.2.1 Test Current
Two measurements on light aged OLTCs provides an advantage for analysis. Based on calculations results shown in Figures 8.7, the influence of test current to the measurement results can be observed from the trends of two graphs. Except P4, both graphs show indication that the deviation decreases when the test current is increased. Same phenomenon as observed at the measurement on a good OLTC is valid here, where higher test current increases the possibility to break the thin resistive layer. P2 and P3 have clear indication when the current starts to break the film at 1.5ADC and is completely broken at 5ADC for OLTC 2.
The sensitivity of the measurement (P1) also intends to decrease when the test current is tuned to a higher level. The P1 curve is started at lower deviation at 0.2ADC. The deviation increases at 0.5ADC, and then starts to decrease along with the increase of test current into medium and high test level. The low deviation value of 0.2ADC occurred at both OLTCs. It determines that 0.2ADC has low sensitivity in measuring the thin resistive layer.
Based on visual observation of measurement results in Chapter 6, light aged OLTC 1 (17 taps) has more severe aging than OLTC 2 (19 taps). It is matched with the calculation results using the analytical tool: P2 and P3 of OLTC 1 have larger deviation than OLTC 2. Even though measurement on OLTC 1 was not complete, without 5ADC, it shows similar trend as OLTC 2. Deviation value of P2 and P3 are decreased when the test current is tuned to higher value. Indication of breaking very thin oil film is shown when test current reached 1.5ADC. Further a completely broken of resistive layer occurred at 20ADC.
P4 curve has tendency to be stable when the test current is increased. It has no relation to the presence of contacts resistance.
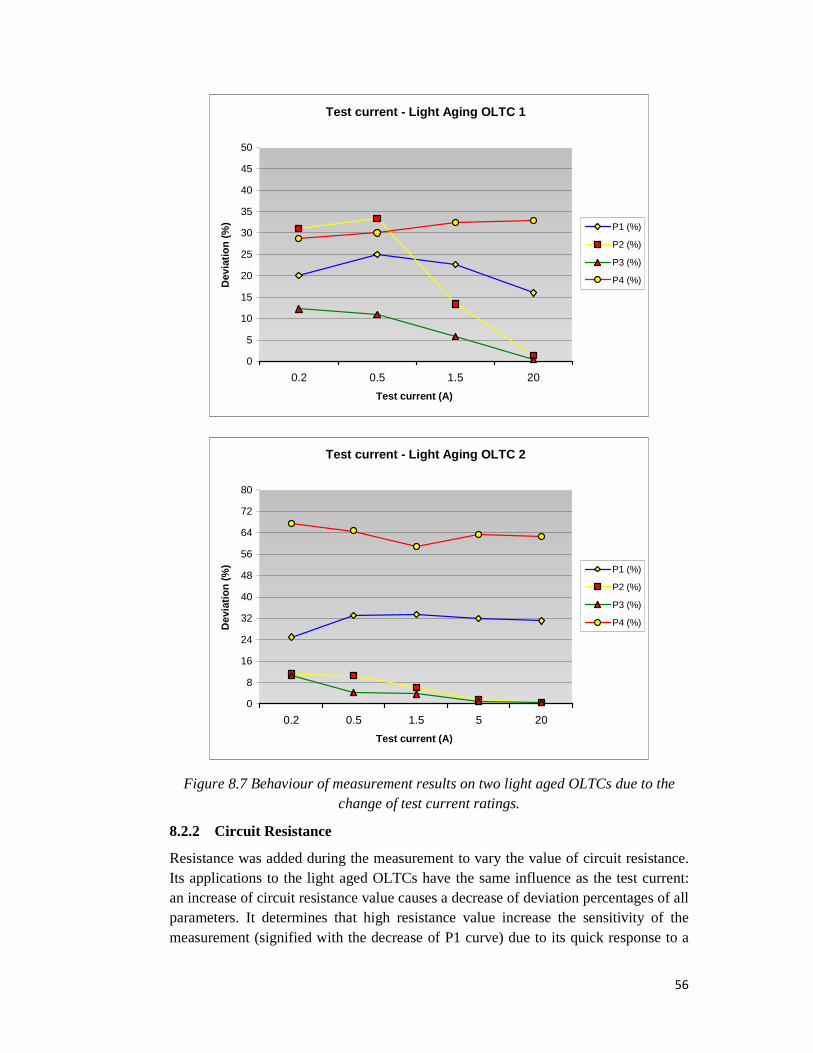
56
Test current - Light Aging OLTC 1
0
5
10
15
20
25
30
35
40
45
50
0.2 0.5 1.5 20
Test current (A)
Dev
iati
on
(%
) P1 (%)
P2 (%)
P3 (%)
P4 (%)
Test current - Light Aging OLTC 2
0
8
16
24
32
40
48
56
64
72
80
0.2 0.5 1.5 5 20
Test current (A)
Dev
iati
on
(%
) P1 (%)
P2 (%)
P3 (%)
P4 (%)
Figure 8.7 Behaviour of measurement results on two light aged OLTCs due to the change of test current ratings.
8.2.2 Circuit Resistance
Resistance was added during the measurement to vary the value of circuit resistance. Its applications to the light aged OLTCs have the same influence as the test current: an increase of circuit resistance value causes a decrease of deviation percentages of all parameters. It determines that high resistance value increase the sensitivity of the measurement (signified with the decrease of P1 curve) due to its quick response to a

57
fast current change. This factor is important in measuring the thin resistive layer which only causes small disruption of test current. Nevertheless, higher circuit resistance requires higher voltage rating of supply. It breaks the thin resistive layer on OLTC contacts. P2 and P3 curves in Figures 8.8 indicate a tendency of breaking the thin resistive layer when the circuit resistance is increased.
P4 deviation value is decrease because the high circuit resistance produces a weak response signal (signified by low deviation at 8Ω measurement of P1 curve). It has low amplitude which is more or less same height as noises. A bigger deviation at 1Ω measurement on OLTC 2 occurred due to unstable test current during the measurement. The measurement was performed when the charging phase has not completed yet. As result the test current stabilized during the measurement. The DRM graph has curved pattern instead of linear with much higher current at the end of measurement.
Circuit resistance - Light Aging OLTC 1
0
10
20
30
40
50
60
70
80
90
100
0.2 1 2 4 8
Circuit resistance (ohm)
Dev
iati
on
(%
) P1 (%)
P2 (%)
P3 (%)
P4 (%)

58
Circuit resistance - Light Aging OLTC 2
0
10
20
30
40
50
60
70
80
90
100
0.2 1 2 4 8
Circuit resistance (ohm)
Dev
iati
on
(%
) P1 (%)
P2 (%)
P3 (%)
P4 (%)
Figure 8.8 Behaviour of measurement results on two light aged OLTCs due to the change of circuit resistance ratings
8.3 Analysis for Medium Aged Contacts
8.3.1 Test Current
The behaviour of test current to the measurement result from medium aged OLTC can be observed from Figure 8.9. The same behaviour is valid, where the deviation is decreased if the test current is increased. A medium aged resistive layer still can be damaged by high test current. When the test current has reached 20ADC, it nearly broke the resistive layer completely and restored the clean contacts condition (see P2 and P3 curve). It determines that 20ADC has low sensitivity in measuring the presence of resistance (P1).
A field measurement with varied test current was started in sequence: 0.2ADC, 1.5ADC, 20ADC, 0.5ADC then 5ADC. The effect of high test current can be seen in the graph that the deviation value of 0.5ADC is much lower than 0.2ADC. This condition occurred because high test current damaged the thick resistive layer. Cleaner contacts were measured at 0.5ADC causes less disruption of test current.
There is no significance influence of test current to the fourth parameter (P4), the length of current deviation during the switching from one tap to another is about the same. The P4 curve shows tendency to drop when the test current is increased. A low test current can be easily disrupted due to contacts wear or partial damage of transition resistors, but high test current can still flow through the contacts with less disruption.

59
Test current - Medium Aging
0
10
20
30
40
50
60
70
80
90
100
0,2 0,5 1,5 5 20
Test current (A)
Dev
iati
on
(%
)P1 (%)
P2 (%)
P3 (%)
P4 (%)
Figure 8.9 Behaviour of measurement results on medium aged OLTCs due to the variety of test current
8.3.2 Circuit Resistance
It has been discussed that high circuit resistance produces weak response signal. The circuit resistance even becomes higher due to additional resistance from resistive layer on OLTC contacts. It can be seen from Figure 8.10 that the deviation value of medium contacts resistance is decreasing along with the increase of circuit resistance. In terms of P1, 8Ω circuit resistance has much weaker signal than 0.2Ω. It leads to DRM graph which is covered by noises. The deviation value for both P2 and P3 are higher than those measured on light aged OLTC. It is a typical result because the thick resistive layer disrupts the current and causes a bigger deviation than the one measured on light aged OLTC.
The influence of the circuit resistance to P4 is clearly shown by the curve in the graph. It has the same behaviour where the deviation is decrease if the circuit resistance is increased. The value of deviation is lower compared to measurement results of a light aged OLTC. It is happened due to additional resistance from the resistive layer on OLTC contacts, which has higher value than the light aging.

60
Circuit resistance - Medium Aging
0
5
10
15
20
25
30
35
40
45
50
0.2 1 2 4 8
Circuit resistance (ohm)
Dev
iati
on
(%
)P1 (%)
P2 (%)
P3 (%)
P4 (%)
Figure 8.10 Behaviour of measurement results on medium aged OLTCs due to the change of circuit resistance
8.4 Analysis for Advanced Aged Contacts
8.4.1 Test Current
A different levels of test current have significance influence to the measurement results of advance aged OLTC. The presence of heavy resistive layer on OLTC contacts gives particular response based on the level of test current. The low test current is heavily disrupted and results in high percentage of deviation. The heavy resistive layer is damaged when medium test current is applied. Finally a high level of test current broke the layer at 5ADC and a good condition is restored at 20ADC test current. This behaviour is indicated clearly by P2 and P3 curves at Figure 8.11. The percentages of deviation drop significantly when the resistive layer is broken at 5ADC.
The effect of test current to the measurement sensitivity (P1) is similar for every measurement on aged OLTC. It has tendency to decrease if the test current tuned to higher rating. The aging phase has influence to the measurement. More advance aged OLTC has thicker resistive layer. It leads to more disruption of current. Then any variation of test level has significant difference of deviation when measured an advance aged OLTC. It can be seen from Figure 8.11 that P1 is decreased with quite big difference of deviation value. Compare to the measurement on light aged OLTC (Figure 8.7), P1 curve is more stable.
Another sequence of measurement is applied, where maximum test current of 20ADC was measured at the last. The effect is that the resistive layer was not damaged during the measurement with low test current. The deviation value of 0.2ADC and 0.5ADC are high since they are easily disrupted by the resistive layer.

61
The same condition occurs in P4 where there is no significance influence of changing the test current ratings. The deviation has tendency to slightly decrease as the test current increase. The low deviation at 0.2ADC is caused by over filter. A high filter had to be applied since the measurement result is fully covered by noise. It was impossible to distinguish the current signal out of noises. In consequence, the effect of the transition resistor is filtered and the deviation is low.
Test current - Advance Aging
0
10
20
30
40
50
60
70
80
90
100
0,2 0,5 1,5 5 20
Test current (A)
Dev
iati
on
(%
)
P1 (%)
P2 (%)
P3 (%)
P4 (%)
Figure 8.11 Behaviour of measurement results on advance aged OLTCs due to the change of test current
8.4.2 Circuit Resistance
In general, the same effect is valid to the measurement results of advance aged OLTC. The deviation value of all parameters is decreased when the test levels tuned into higher level. It can be seen in Figure 8.12 that all curves from different parameters indicates the similar behaviour as previous measurements done on the other aging phases.
A decrease of deviation value was measured on P2 and P3 parameters, when the circuit resistance was increased. The thick resistive layer and rather high circuit resistance needed higher voltage supply. It may damage the layer and produce lower disruption.
P1 and P4 show a similar trend as other aging. P1 deviation value is decreased if the circuit resistance become higher, and P4 has quite stable curve. It is slightly decreased at higher test value.
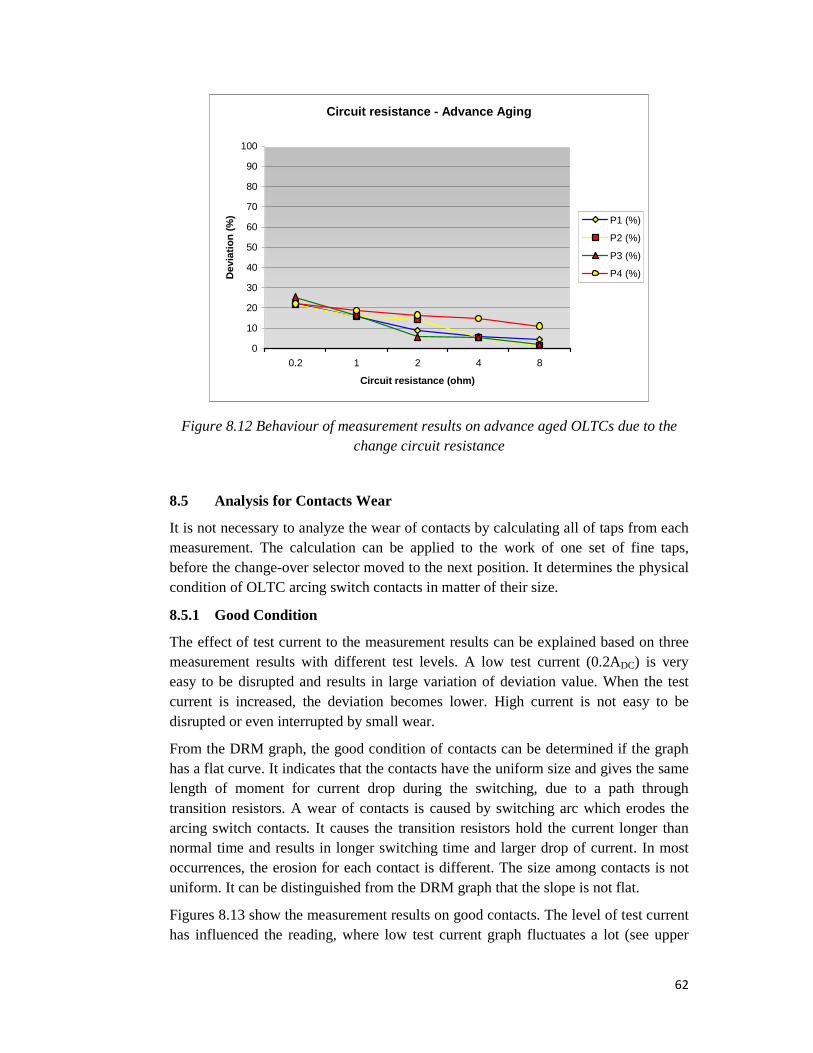
62
Circuit resistance - Advance Aging
0
10
20
30
40
50
60
70
80
90
100
0.2 1 2 4 8
Circuit resistance (ohm)
Dev
iati
on
(%
) P1 (%)
P2 (%)
P3 (%)
P4 (%)
Figure 8.12 Behaviour of measurement results on advance aged OLTCs due to the change circuit resistance
8.5 Analysis for Contacts Wear
It is not necessary to analyze the wear of contacts by calculating all of taps from each measurement. The calculation can be applied to the work of one set of fine taps, before the change-over selector moved to the next position. It determines the physical condition of OLTC arcing switch contacts in matter of their size.
8.5.1 Good Condition
The effect of test current to the measurement results can be explained based on three measurement results with different test levels. A low test current (0.2ADC) is very easy to be disrupted and results in large variation of deviation value. When the test current is increased, the deviation becomes lower. High current is not easy to be disrupted or even interrupted by small wear.
From the DRM graph, the good condition of contacts can be determined if the graph has a flat curve. It indicates that the contacts have the uniform size and gives the same length of moment for current drop during the switching, due to a path through transition resistors. A wear of contacts is caused by switching arc which erodes the arcing switch contacts. It causes the transition resistors hold the current longer than normal time and results in longer switching time and larger drop of current. In most occurrences, the erosion for each contact is different. The size among contacts is not uniform. It can be distinguished from the DRM graph that the slope is not flat.
Figures 8.13 show the measurement results on good contacts. The level of test current has influenced the reading, where low test current graph fluctuates a lot (see upper

63
graph of Figure 8.13). It is caused by the small wear of contacts which easily disrupt the low test current. The measurement with medium and high test current results in considerably flat of curves. Small fluctuations are caused by small wear of contacts.
The circuit resistance has influence on value of deviation. Measurement with minimum circuit resistance results in largest deviations since it generates response signal with high amplitude. A slightly higher deviation at the last tap (9th) indicates that there is a small wear. It has similar indication with the one measured at medium test current. The small wear can not be identified in measurement with high circuit resistance. Its low amplitude of signal produces low deviation of current change during the switching.
test current - P4 (good contacts)
0
10
20
30
40
50
60
70
80
90
100
1 2 3 4 5 6 7 8 9
Taps
Dev
iati
on
(%
)
low I
med I
high I
circuit resistance - P4 (good contacts)
0
10
20
30
40
50
60
70
80
90
100
1 2 3 4 5 6 7 8 9
Taps
Dev
iatio
n (%
)
low R
med R
high R
Figure 8.13 Behavior of test current (top) and circuit resistance (bottom) on good condition of arcing switch contacts.
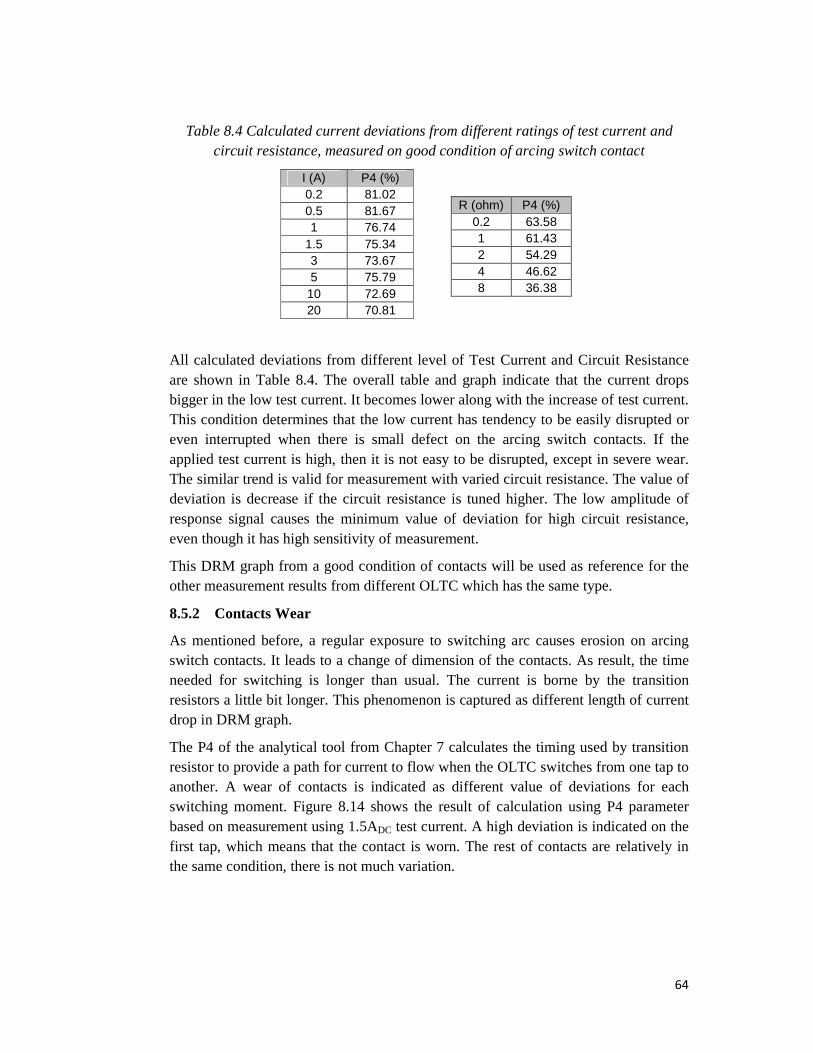
64
Table 8.4 Calculated current deviations from different ratings of test current and circuit resistance, measured on good condition of arcing switch contact
I (A) P4 (%) 0.2 81.02 0.5 81.67 1 76.74
1.5 75.34 3 73.67 5 75.79
10 72.69 20 70.81
R (ohm) P4 (%) 0.2 63.58 1 61.43 2 54.29 4 46.62 8 36.38
All calculated deviations from different level of Test Current and Circuit Resistance are shown in Table 8.4. The overall table and graph indicate that the current drops bigger in the low test current. It becomes lower along with the increase of test current. This condition determines that the low current has tendency to be easily disrupted or even interrupted when there is small defect on the arcing switch contacts. If the applied test current is high, then it is not easy to be disrupted, except in severe wear. The similar trend is valid for measurement with varied circuit resistance. The value of deviation is decrease if the circuit resistance is tuned higher. The low amplitude of response signal causes the minimum value of deviation for high circuit resistance, even though it has high sensitivity of measurement.
This DRM graph from a good condition of contacts will be used as reference for the other measurement results from different OLTC which has the same type.
8.5.2 Contacts Wear
As mentioned before, a regular exposure to switching arc causes erosion on arcing switch contacts. It leads to a change of dimension of the contacts. As result, the time needed for switching is longer than usual. The current is borne by the transition resistors a little bit longer. This phenomenon is captured as different length of current drop in DRM graph.
The P4 of the analytical tool from Chapter 7 calculates the timing used by transition resistor to provide a path for current to flow when the OLTC switches from one tap to another. A wear of contacts is indicated as different value of deviations for each switching moment. Figure 8.14 shows the result of calculation using P4 parameter based on measurement using 1.5ADC test current. A high deviation is indicated on the first tap, which means that the contact is worn. The rest of contacts are relatively in the same condition, there is not much variation.
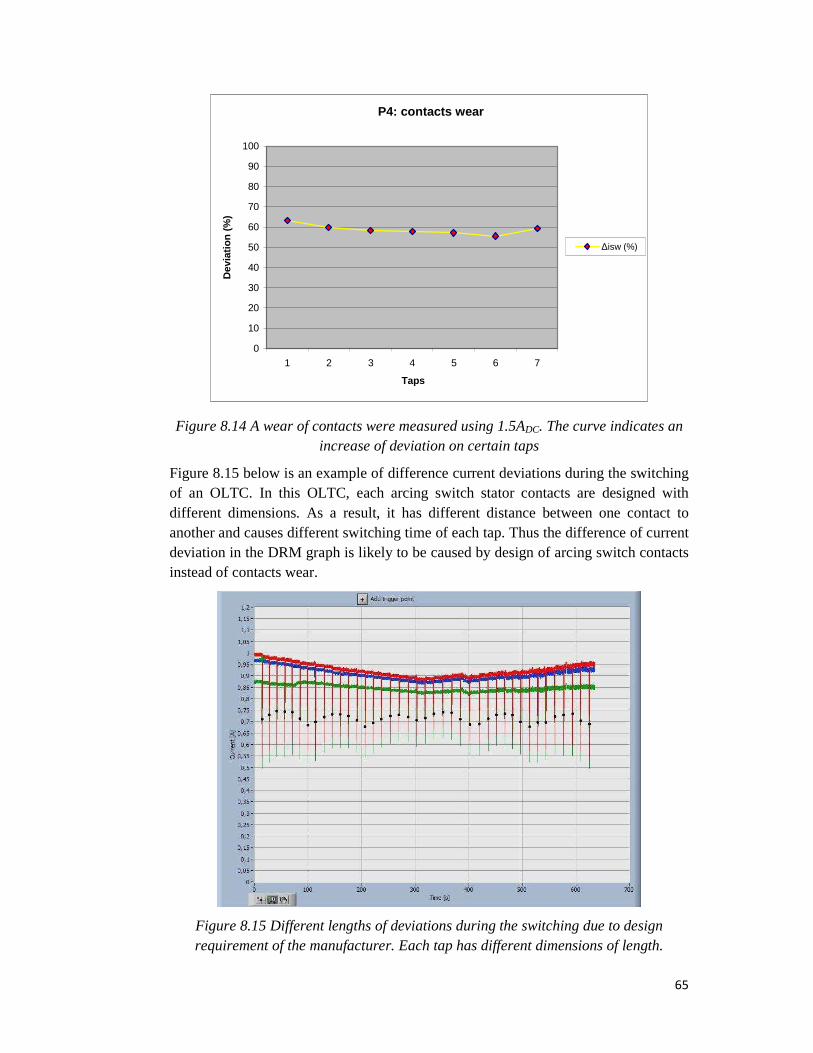
65
P4: contacts wear
0
10
20
30
40
50
60
70
80
90
100
1 2 3 4 5 6 7
Taps
Dev
iati
on
(%
)
∆isw (%)
Figure 8.14 A wear of contacts were measured using 1.5ADC. The curve indicates an increase of deviation on certain taps
Figure 8.15 below is an example of difference current deviations during the switching of an OLTC. In this OLTC, each arcing switch stator contacts are designed with different dimensions. As a result, it has different distance between one contact to another and causes different switching time of each tap. Thus the difference of current deviation in the DRM graph is likely to be caused by design of arcing switch contacts instead of contacts wear.
Figure 8.15 Different lengths of deviations during the switching due to design requirement of the manufacturer. Each tap has different dimensions of length.

66
There is a possibility that the same pattern occurs on OLTC with contacts wear. It indicates different sizes of arcing contacts due to erosion caused by switching arc. The result of calculation from Figure 8.15 can be seen in Figure 8.16. The curve shows higher deviations at tap 1 and 2. It show also similarity with the one depicted in Figure 8.14. A wear of contact is indicated by a high deviation, which is over than the others. A non uniform deviation value among the taps also indicates the same problem of contact wear.
different sizes of contacts
0
10
20
30
40
50
60
70
80
90
100
1 2 3 4 5 6 7
Taps
Dev
iati
on
(%
)
∆isw (%)
Figure 8.16 Calculation result of Figure 8.15. The plotted curve shows non uniform deviation among the taps due to different sizes of arcing contacts.
8.6 Analysis for Damaged Transition Resistors
A damaged of transition resistors could not provide a path for current to flow through during the switching from one tap to another. The current is interrupted and identified as maximum deviation in the DRM graph. Figure 4.10 in Chapter 4 shows a damaged of transition resistors in an OLTC. The current drops to zero during the switching period. Thus the calculation result will show a P4 curve which has 100% deviation due to current interruption, as shown in Figure 8.17.

67
Damaged transition resistor
0
10
20
30
40
50
60
70
80
90
100
1 2 3 4 5 6 7
Taps
Dev
iati
on (
%)
P4 (%)
Figure 8.17 Damaged of transition resistors has 100% deviation.
There is also a possibility of not totally damage of transition resistors. This may lead to current disruption which is more than the tolerable value of normal condition but less than 100% interruption. The tolerance limit is made based on nominal value of the resistors, which is dependent to the manufacturers.
8.7 Effect of Test Parameters to the Measurement Results
The influence of test parameters on the measurement results will be discussed in this section. Relationship of all analysis parameters (P1, P2, P3 and P4) and the test parameters (test current and circuit resistance) will show certain behaviours when they are plotted in the graph. Observation was made based on those behaviours.
8.7.1 Test Current
The sensitivity of measurement (P1) decreases when the test current is tuned to higher level. The graph in Figure 8.18 indicates that 1.5ADC, medium test level, has high amplitude of measurement on light aged OLTC. It means that the medium test level has not broken the thin oil film and the test current still able to measure it. The low test current may provide high sensitivity, but then it is too much sensitive. It is easily disrupted by resistive layer and leads to misinterpretation of aging phase. A thin oil film can be measured as thick resistive layer due to a result with high deviation value.
An influence of contact resistance to the measurement is identified in the graph.

68
Sensitivity - P1
0
10
20
30
40
50
60
70
80
90
100
0.2 0.5 1.5 5 20
Test current (A)
Am
plit
ud
e (%
) good
light
medium
advance
Figure 8.18 Relation between the test current and the sensitivity of the measurement
The wiping effects due to the regular movement of arcing switch rotor contacts prevent the resistive layer to grow further. Nevertheless, there is still a possibility for thin resistive layer to grow into thicker layer and causes severe damage. Therefore an identification of short term effect on arcing switch by P2 can give information about the condition of the aged contacts: whether still in early aging or already exposed to the advance aging.
The influence of test current to the short term (P2) can be seen in Figure 8.19. The measurements performed on four different OLTC aging phases resulted in a sequence of deviation levels. Good OLTC has the lowest deviation percentages, and it increases along with the increase of aging phase. Another effect of test current can be seen from the decrease of the deviation when the test current is increased. A large decrease of deviation is measured when the test current tuned to high level. Meanwhile a small decrease of deviation is measured when the test current was tuned from low (0.5ADC) to medium test level. A rather large difference of deviation between 0.2ADC and 0.5ADC is caused by the high sensitivity of 0.2ADC test current. It is more prone to disruption compared to 0.5ADC.
According to the figure, distinction between good, light, medium and advance aging can be made at 0.5ADC and 1.5ADC. Deviation value of P2 is increased as the OLTC ages further. It determines that measurements of all test levels have measured the raise of the aging phase properly in sequence. More advance aging is measured to have larger deviation. A measurement at high test current has low deviation value. The restored clean contacts were measured since they have broken the resistive layer.

69
Short term effect - P2
0
10
20
30
40
50
60
70
80
90
100
0.2 0.5 1.5 5 20
Test current (A)
Dev
iati
on
(%
) good
light
medium
advance
Figure 8.19 The influence of test current to the analysis of short term aging effect
Figure 8.20 shows that the influence of the test current to measurement results showing the long term effect of aging (represented by P3) is similar to the effect to measurement results of short term effect (P2). The increase of test level causes a decrease of the deviation. The same phenomenon is valid here where high level of test current breaks the resistive layer formed on change-over selector contacts. A non-expected result is measured in low test current of 0.2ADC, where the deviations value of medium and advance aging are crossed each other. The medium aged OLTC has higher deviation than the advanced one. A high sensitivity in responding the presence of resistance might be the cause. The measurement contains noises, which lead to misinterpretation of the response signal. The noise level is in line with the resistive level of the measurement. If the low test current measurement is performed on high resistive object (advance aging), the noise level is high.
The measurements performed on four different OLTC aging phases resulted in sequence of deviation level. Good OLTC has the lowest deviation percentages, and it increases along with the increase of aging. Together with calculation results on P2, this condition determines that the Analytical Tool gives the proper indication where better OLTC condition has lower deviation and worst condition has largest deviation. Worse condition means there is a heavy resistive layer presence on OLTC, which causes large disruption of current.
The measurement at 0.5ADC and 1.5ADC has a proper reading to the presence of long term effect. A distinction of good, light, medium and advance aging can be made throughout both test levels. Deviation level of P3 increases as the OLTC ages further. The similar condition as P2 occurs here where high test current measured P3 in low
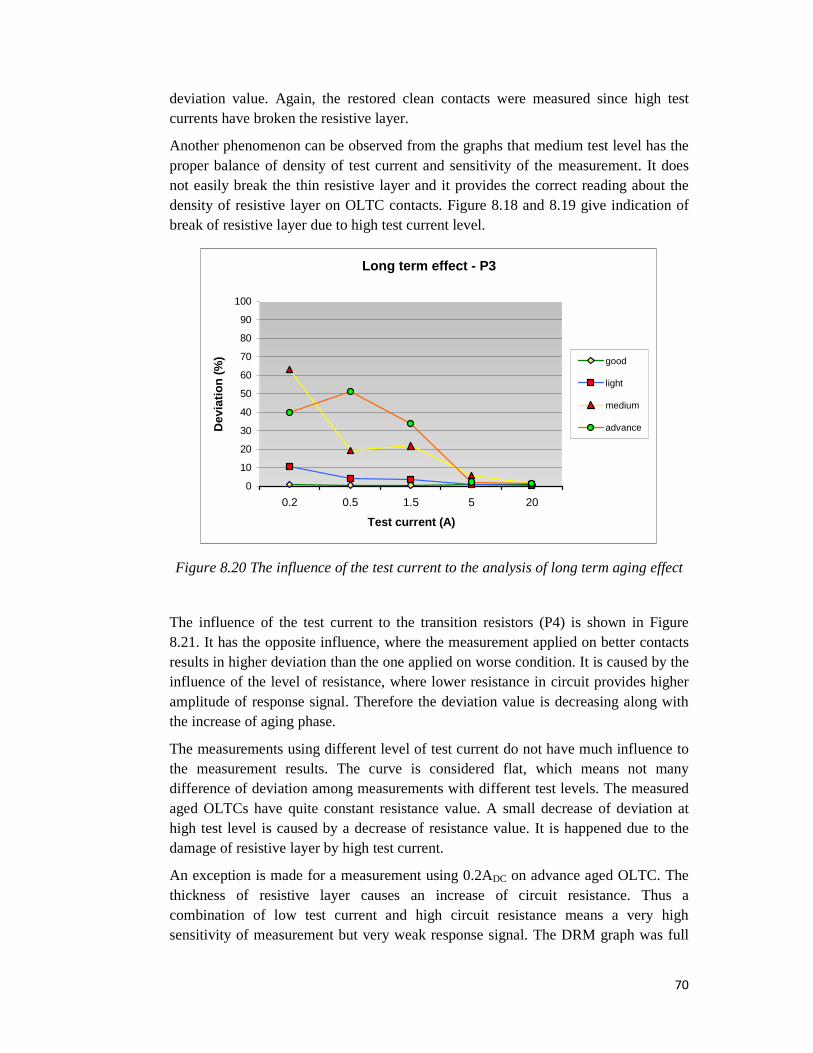
70
deviation value. Again, the restored clean contacts were measured since high test currents have broken the resistive layer.
Another phenomenon can be observed from the graphs that medium test level has the proper balance of density of test current and sensitivity of the measurement. It does not easily break the thin resistive layer and it provides the correct reading about the density of resistive layer on OLTC contacts. Figure 8.18 and 8.19 give indication of break of resistive layer due to high test current level.
Long term effect - P3
0
10
20
30
40
50
60
70
80
90
100
0.2 0.5 1.5 5 20
Test current (A)
Dev
iati
on
(%
) good
light
medium
advance
Figure 8.20 The influence of the test current to the analysis of long term aging effect
The influence of the test current to the transition resistors (P4) is shown in Figure 8.21. It has the opposite influence, where the measurement applied on better contacts results in higher deviation than the one applied on worse condition. It is caused by the influence of the level of resistance, where lower resistance in circuit provides higher amplitude of response signal. Therefore the deviation value is decreasing along with the increase of aging phase.
The measurements using different level of test current do not have much influence to the measurement results. The curve is considered flat, which means not many difference of deviation among measurements with different test levels. The measured aged OLTCs have quite constant resistance value. A small decrease of deviation at high test level is caused by a decrease of resistance value. It is happened due to the damage of resistive layer by high test current.
An exception is made for a measurement using 0.2ADC on advance aged OLTC. The thickness of resistive layer causes an increase of circuit resistance. Thus a combination of low test current and high circuit resistance means a very high sensitivity of measurement but very weak response signal. The DRM graph was full
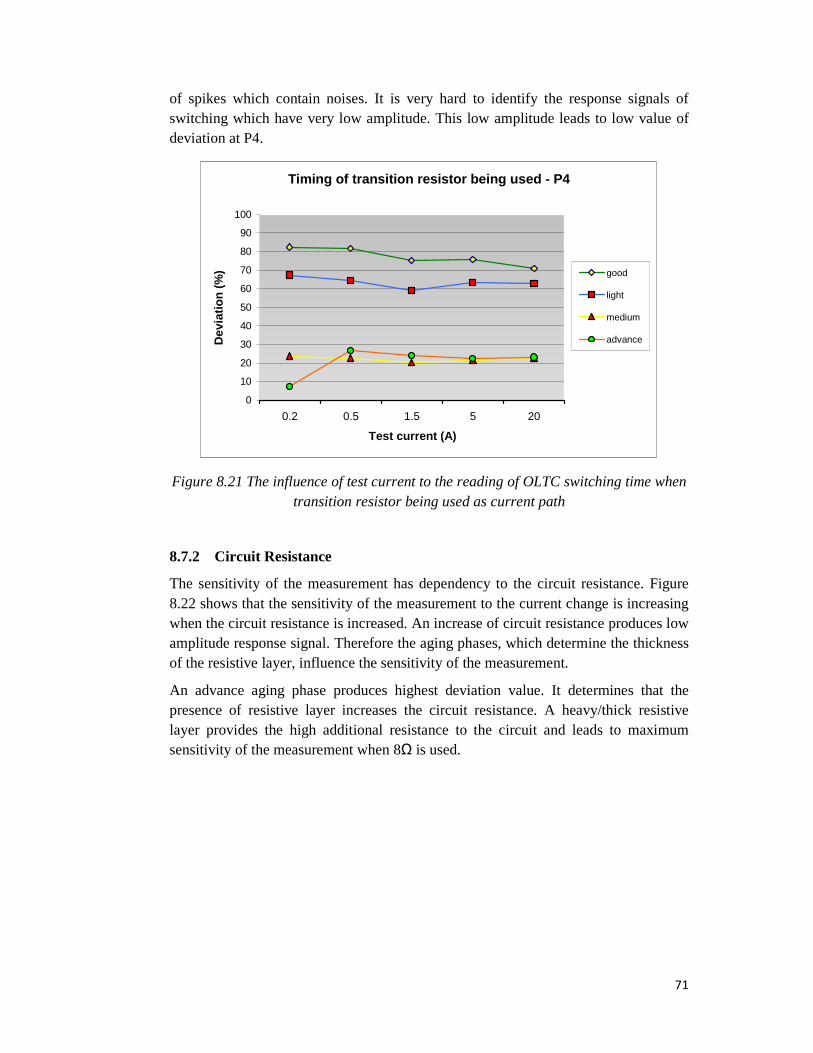
71
of spikes which contain noises. It is very hard to identify the response signals of switching which have very low amplitude. This low amplitude leads to low value of deviation at P4.
Timing of transition resistor being used - P4
0
10
20
30
40
50
60
70
80
90
100
0.2 0.5 1.5 5 20
Test current (A)
Dev
iati
on
(%
) good
light
medium
advance
Figure 8.21 The influence of test current to the reading of OLTC switching time when transition resistor being used as current path
8.7.2 Circuit Resistance
The sensitivity of the measurement has dependency to the circuit resistance. Figure 8.22 shows that the sensitivity of the measurement to the current change is increasing when the circuit resistance is increased. An increase of circuit resistance produces low amplitude response signal. Therefore the aging phases, which determine the thickness of the resistive layer, influence the sensitivity of the measurement.
An advance aging phase produces highest deviation value. It determines that the presence of resistive layer increases the circuit resistance. A heavy/thick resistive layer provides the high additional resistance to the circuit and leads to maximum sensitivity of the measurement when 8Ω is used.

72
Sensitivity - P1
0
5
10
15
20
25
30
35
40
45
50
0,2 1 2 4 8
Circuit Resistance (ohm)
Am
plit
ud
e (%
) good
light
medium
advance
Figure 8.22 Relation between the circuit resistance and the sensitivity of the measurement
Influence of circuit resistance to the measurement results of short term effects can be seen from Figure 8.23. The graph indicates that advance aging has higher deviation. It provides more additional resistance to the circuit from the high resistive value of (carbonized) oil film. Besides sensitivity, the increase of circuit resistance produce weaker, low amplitude response signal. Thus the deviation is low if the circuit resistance is high. It is not able to read the presence of very light resistive layer when the circuit resistance has reached 2Ω. When it reached high value of 4Ω, all measurements to aged OLTC (light up to advance phase) tend to have similar deviation value. It indicates that at high value it is almost impossible to distinguish the aging phases. When the resistance value is increased, very low signal is produced.
According to the figure, distinction between good, light, medium and advance aging can be made at measurement up to 2Ω. Deviation value of P2 is increased as the OLTC ages further. More advance aging is measured to have larger deviation. When the measurement reached high value (started from 4Ω), distinction for aged OLTC is not clear anymore. They tend to have equal deviation value.
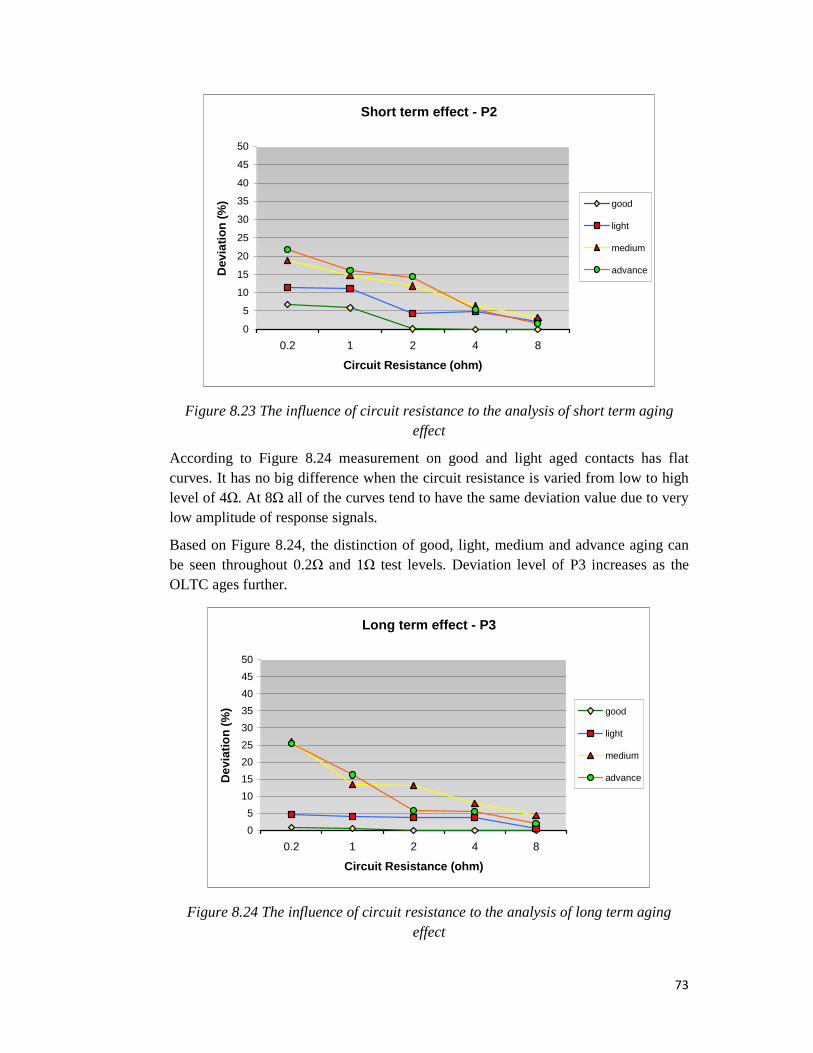
73
Short term effect - P2
0
5
10
15
20
25
30
35
40
45
50
0.2 1 2 4 8
Circuit Resistance (ohm)
Dev
iati
on
(%
) good
light
medium
advance
Figure 8.23 The influence of circuit resistance to the analysis of short term aging effect
According to Figure 8.24 measurement on good and light aged contacts has flat curves. It has no big difference when the circuit resistance is varied from low to high level of 4Ω. At 8Ω all of the curves tend to have the same deviation value due to very low amplitude of response signals.
Based on Figure 8.24, the distinction of good, light, medium and advance aging can be seen throughout 0.2Ω and 1Ω test levels. Deviation level of P3 increases as the OLTC ages further.
Long term effect - P3
0
5
10
15
20
25
30
35
40
45
50
0.2 1 2 4 8
Circuit Resistance (ohm)
Dev
iati
on
(%
) good
light
medium
advance
Figure 8.24 The influence of circuit resistance to the analysis of long term aging effect

74
The presence of resistive layer on OLTC contacts provides additional resistance to the circuit. It increases the sensitivity of the measurement but decreases the amplitude of response signal. More advance aging phases leads to more severe or thicker of resistive layer.
The influence of circuit resistance in measuring the effect of transition resistors can be seen in the Figure 8.25. Considerably linear curves were formed. It decreases linearly when the circuit resistance is tuned higher. A high circuit resistance measures any resistance change in smaller deviation value.
Timing of transition resistor being used - P4
0
10
20
30
40
50
60
70
80
90
100
0,2 1 2 4 8
Circuit Resistance (ohm)
Dev
iati
on
(%
) good
light
medium
advance
Figure 8.25 The influence of circuit resistance to the reading of OLTC switching time when transition resistor being used as current path
8.8 Conclusions
- It can be obviously seen from the conducted experiments that the dynamic resistance measurement using medium level of test current (1ADC up to 1.5ADC) and minimum circuit resistance provided a reliable result. It has a balance of sensitivity and amplitude of response signal to read the presence of resistive layer on OLTC contacts.
- Influence of test current parameter in the measurement result provides significant effect. A low test current (0.2ADC up to 0.5ADC) is easily disrupted by thin resistive layer. It is too sensitive in responding any change of contact resistance. The medium level of test current (1ADC up to 1.5ADC) has a good balance between the sensitivity and the amplitude of response signals. It produces a reliable reading of the defects. The high test current (5ADC and above) breaks the resistive layers which will not be detected.
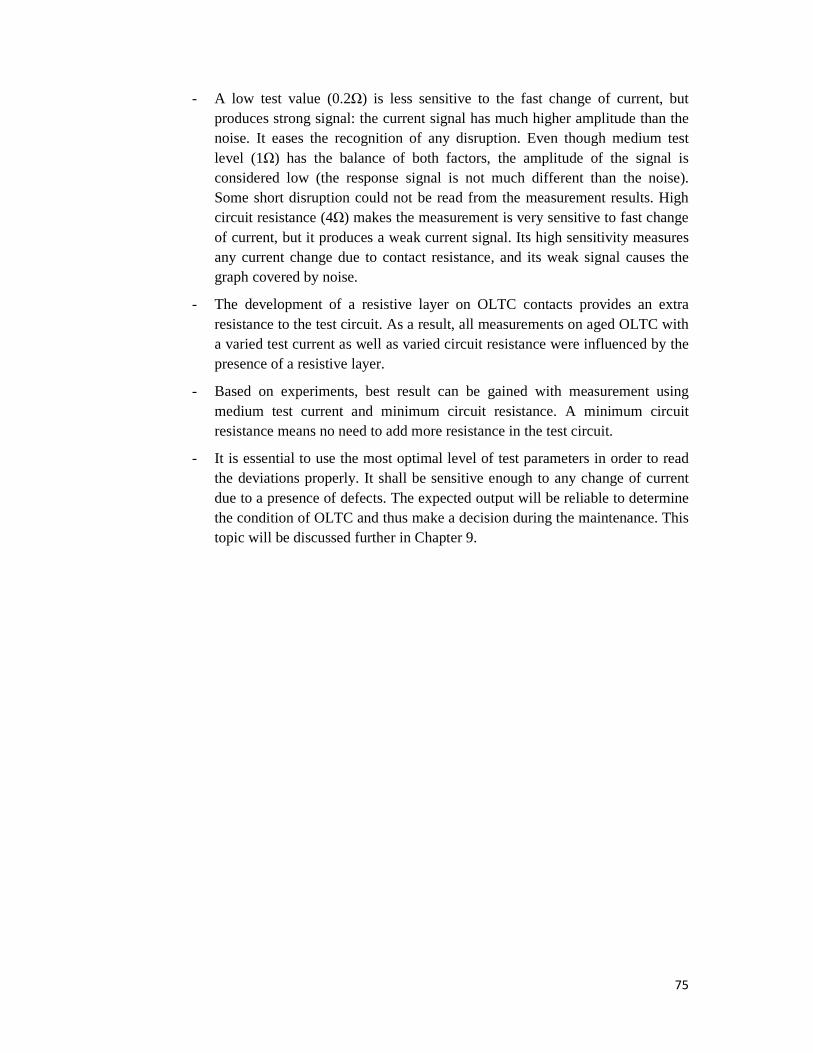
75
- A low test value (0.2Ω) is less sensitive to the fast change of current, but produces strong signal: the current signal has much higher amplitude than the noise. It eases the recognition of any disruption. Even though medium test level (1Ω) has the balance of both factors, the amplitude of the signal is considered low (the response signal is not much different than the noise). Some short disruption could not be read from the measurement results. High circuit resistance (4Ω) makes the measurement is very sensitive to fast change of current, but it produces a weak current signal. Its high sensitivity measures any current change due to contact resistance, and its weak signal causes the graph covered by noise.
- The development of a resistive layer on OLTC contacts provides an extra resistance to the test circuit. As a result, all measurements on aged OLTC with a varied test current as well as varied circuit resistance were influenced by the presence of a resistive layer.
- Based on experiments, best result can be gained with measurement using medium test current and minimum circuit resistance. A minimum circuit resistance means no need to add more resistance in the test circuit.
- It is essential to use the most optimal level of test parameters in order to read the deviations properly. It shall be sensitive enough to any change of current due to a presence of defects. The expected output will be reliable to determine the condition of OLTC and thus make a decision during the maintenance. This topic will be discussed further in Chapter 9.

76
Chapter 9
Application of the Analytical Tool during Regular Maintenance
9.1 Condition Assessment
OLTC is the main component of a power transformer to regulate the output voltage. It operates by selecting the tapped windings in order to gain higher or lower output voltage based on the network demand. Therefore the reliability of OLTC work is essential. In order to maintain the continuity, a condition assessment needs to be done to the OLTC. A dynamic resistance measurement can be carried out during a regular maintenance to gain condition data from the OLTC. The data, in a form of DRM graph, will be analyzed using analytical tool which has been introduced in Chapter 7. The deviation of DRM graph is calculated by certain parameters. Each parameter indicates how large the current is disrupted. A large disruption of current caused by resistance on OLTC gives indication of a bad condition. Finally, the combination of three parameters will determine the actual condition of the measured OLTC. This complete activity, started from performing the measurement up to interpreting the result of analysis, is a condition assessment of OLTC.
Condition assessment is a very important source of information. A reliable decision can be made based on the actual condition, whether the power transformer can be put back into service or it shall be taken out for more extensive revision. This maintenance plan and decision is essential in determining the most efficient of operation, either in cost as well as in time.
[4] has proposed procedure to interpret the deviations of DRM graph. It localizes the defect, finds the cause of the defect and determines the importance of the defect. The final step of DRM graph interpretation is condition indexing. Boundaries for condition indexing are selected based on field experience during the maintenance including the visual inspection during the overhaul, and also based on fingerprints of diagnostic data.
9.2 Selection of the Optimal Test Parameter
An optimal level of test parameters will be selected in this section. It shall have a balance between the sensitivity to the change of current due to defects and the strength of the measurement signal. The selection is important since a regular OLTC maintenance normally involves DRM at single test level. A single test level will save time of measurement and it has to provide a good result.
During the experimental field measurements, there are five test levels selected for each test parameters. The applied test currents were 0.2ADC, 0.5ADC, 1.5ADC, 5ADC,

77
and 20ADC; and for the circuit resistance they were 0.2Ω, 1Ω, 2Ω, 4Ω and 8Ω. Classification has been made and discussed in Chapter 5. There are low, medium and high test level categories of each test parameter.
It has been concluded in Chapter 6 and has been discussed in section 8.7.1 that medium level of test current (1ADC up to 1.5ADC) is the most appropriate level in reading the current change due to the presence of resistance on OLTC. Its rather high current rating produces reliable response from presence of resistance on OLTC contacts. The low level of test current (0.2ADC up to 0.5ADC) is very sensitive to the change of contacts resistance. In opposites to low test current, high test current (5ADC and above) is able to break the resistive layers on contacts. It measures a thick resistive layer in low deviation value. Thus a good linear DRM graph is restored, which can lead to misinterpretation reading.
The use of a medium test current level means there is no need for additional resistance in the test setup. The minimum circuit resistance (including the measurement resistance) already give a good sensitivity of the measurement. In addition, a medium test level comprises not only 1.5ADC but also the value started from 1ADC. Thus the selected optimal level of test parameter will comprise the common test value which has been used in service, 1ADC.
9.3 Concept of a Three Dimensional Classification Systems
It may take a lot of effort and time to identify the actual defect in an OLTC. Therefore, a concept has been built to simplify the condition assessment during the maintenance. A three dimensional classification system is introduced in Figure 9.1. Three analysis parameters; P2, P3 and P4; which have been used for OLTC defect analysis (see Chapter 7) are used as the axis. P1 is excluded since it is used to determine the sensitivity of the measurement setup to changes in resistance. There is no relation between P1 and analysis of the defects. The value of DRM graph deviation represented by the three parameters of analysis will be plotted in the 3D graph. The axis’ are in percentage value, where the maximum point of 100% is located at the end of each axis. Numerous measurement data from every aging phase can be used to form seven groups. These seven groups are classified as five condition blocks of aging phases and two measurement-related blocks in the 3D graph. To separate each block, the boundary need to be determined based on the distribution data of each population. Thus the condition blocks will never overlap one to another.
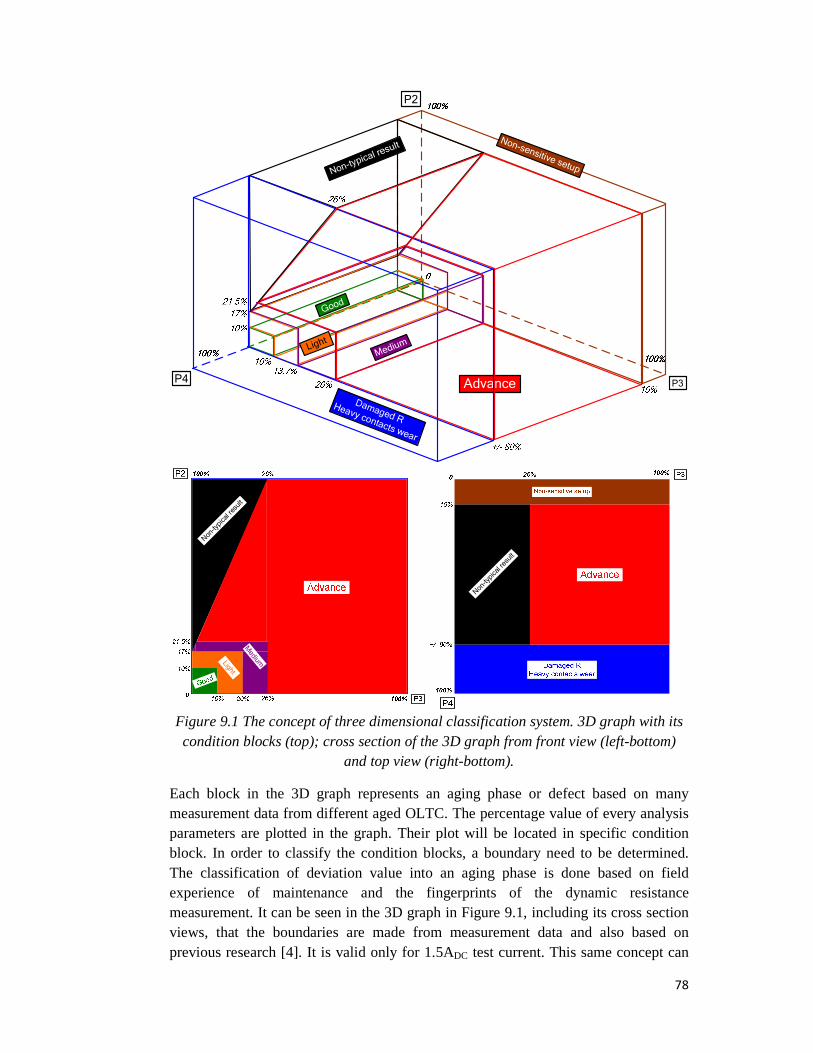
78
P2
P3P4
Good
Damaged R
Heavy contacts wear
Advance
Medium
Non-typ
ical res
ult
Light
Non-sensitive setup
Light
Medium
Non-typical result
Non-typical result
Figure 9.1 The concept of three dimensional classification system. 3D graph with its condition blocks (top); cross section of the 3D graph from front view (left-bottom)
and top view (right-bottom).
Each block in the 3D graph represents an aging phase or defect based on many measurement data from different aged OLTC. The percentage value of every analysis parameters are plotted in the graph. Their plot will be located in specific condition block. In order to classify the condition blocks, a boundary need to be determined. The classification of deviation value into an aging phase is done based on field experience of maintenance and the fingerprints of the dynamic resistance measurement. It can be seen in the 3D graph in Figure 9.1, including its cross section views, that the boundaries are made from measurement data and also based on previous research [4]. It is valid only for 1.5ADC test current. This same concept can
79
be used for population of OLTCs, only the values of the boundaries will be different. The boundaries shall be made from statistical measurement data from the population.
The 10% boundary for P2 is determined based on previous research. It is used to exclude the noise. The boundary for light and medium aging condition blocks is determined from the field experiment. Their values were taken from the middle point between both measurements. In this chapter, the 3D graph is made based on 1.5ADC test current. The statistical value which are used to determine the boundaries are taken from its measurement result analysis (Table 9.1). Thus the boundary values of 17% and 21.5% in P2 axis are the middle value between light – medium aging and between medium – advance aging (refer to P2 column in Table 9.1). The boundaries for P3 are determined based on [4], except the 13.7% and 26% value. Both are determined as the middle value between aging phases. The boundary between one aging phase to another is formed as the skin of the condition block. Every block in the graph is located at different location, side-by-side with the others.
Figure 9.1 (top) shows that its composition made from the condition blocks and two additional blocks. The ‘Good condition block’ is located in the bottom corner of the graph. It has low value of P2 and P3 ( ≤10%). The value of P4 is tolerable up to +/- 80%, and it is valid for the other aging phases. This boundary is made based on different value of transition resistors which are being used in OLTC from different manufacturers. Next to ‘Good condition block’ is ‘Light Aging block’. It has range of P2 above 10% up to 17% and P3 between 10% and 13.7%. ‘Medium Aging block’ is laid above. It has range of P2 above 17% until 21.5% and its shape is cut by block of ‘Non-typical results’ in its corner. The outer part of aging phases blocks is ‘Advance Aging block’. It has the next value of P2 and P3 until it reaches the maximum which is 100%. Its boundary on P2 axis is limited by the block of ‘Non-typical results’. There is another defect mentioned in the graph besides the aging phases. A heavy wear of contacts or damaged of transition resistor is indicated by a condition block located at the outer part of the P4 axis. It has high value of P4, more than +/- 80% value. It indicates a current interruption during the switching period.
The additional blocks in 3D graph are related to the test circuit. An error in the measurement may cause non-typical results or non-sensitive setup. The expected measurement results on aged OLTC shall have a correlation between aging phases. The degradation process is started from short-term aging and then develops into long-term aging process. When P2 is high, P3 is expected to be rising. But if P2 is high and P3 is zero, then it is non typical result. One experience from field measurement can be used as an example. The positive terminal of DC power source is short circuited to the negative terminal which is grounded. It provides path for current to flow to the ground. The result can be seen in the DRM graph in Figure 9.2. There are two times current interruption to current zero due to short circuit. The DRM graph shows a non-typical result where a current interruption occurred twice during the movement of arcing switch on one tap. An initial diagnosis through visual observation on DRM graph indicated that it was not a defect on OLTC since the calculation of other

80
parameters (P3 and P4) does not give any indication of bad condition while P2 is very bad. To verify the diagnosis, the measurement was repeated and shown no indication of current interruption. Therefore when an analysis of the measurement result plotted in ‘Non-typical results’ condition, the measurement is necessary to be repeated to see whether it gives the same result or not. If a same result is gained, then the OLTC is in critical condition due to serious defect.
The other block analyzes that the deviation during switching period (P4) is very low, below 10% of normal condition from a typical OLTC. This condition might be occurred due to incorrect test setup. A mistake of not short circuiting the secondary windings causes a slow response to current change. The result is the DRM can not measure a short and fast deviation, include the fast current change (deviated) during the switching period. Then it is measured only as a short drop of current.
1.2
0
0.2
0.4
0.6
0.8
1
Time [s]
3400 20 40 60 80 100 120 140 160 180 200 220 240 260 280 300 320
Figure 9.2 A DRM graph showing an error during the measurement: a short circuit to ground
To compare the measurement results, the data should be measured by the same parameter, e.g. 1.5ADC of test current with nominal circuit resistance (no additional resistance). Then the conclusion can be drawn based on the same level of one parameter.
9.4 The Application of Three Dimensional Classification Systems on a Measurement Result
The application of the concept shall be applied to the results from one test parameter. As an example, a series of DRM have been done on four different aged OLTC (A,B,C,D) using 1.5A test current. The measurement results as shown in Figure 9.3 were analyzed by the Analytical Tool and the deviation value were entered into Table 9.1. The condition of OLTCs has been identified based on field experience and visual check during the maintenance. It will be proved using the concept by plotting the analysis results from the table into the 3D graph.

81
2
0
0.25
0.5
0.75
1
1.25
1.5
1.75
Time [s]
1900 10 20 30 40 50 60 70 80 90 100 110 120 130 140 150 160 170 180
1.7
1
1.1
1.2
1.3
1.4
1.5
1.6
Time [s]
3600 20 40 60 80 100 120 140 160 180 200 220 240 260 280 300 320 340
1.9
1.2
1.3
1.4
1.5
1.6
1.7
1.8
Time [s]
4100 20 40 60 80 100 120 140 160 180 200 220 240 260 280 300 320 340 360 380 400
Good
OLTC
Light
Aged
Medium
Aged
1.7
0.7
0.8
0.9
1
1.1
1.2
1.3
1.4
1.5
1.6
Time [s]
3500 25 50 75 100 125 150 175 200 225 250 275 300 325
Advance
Aged
Figure 9.3 Measurement results of four different aging phases from different OLTCs
Table 9.1 Calculation results of four different aging phases OLTCs measured by 1.5ADC test current
Deviation of DRM graph 1.5 A test current OLTC Aging
phase P2 (%) P3 (%) P4 (%)
A good 3.91 0.61 75.34 B light 13.40 5.85 37.14 C medium 21.43 21.74 20.22 D advance 24.32 33.99 23.9
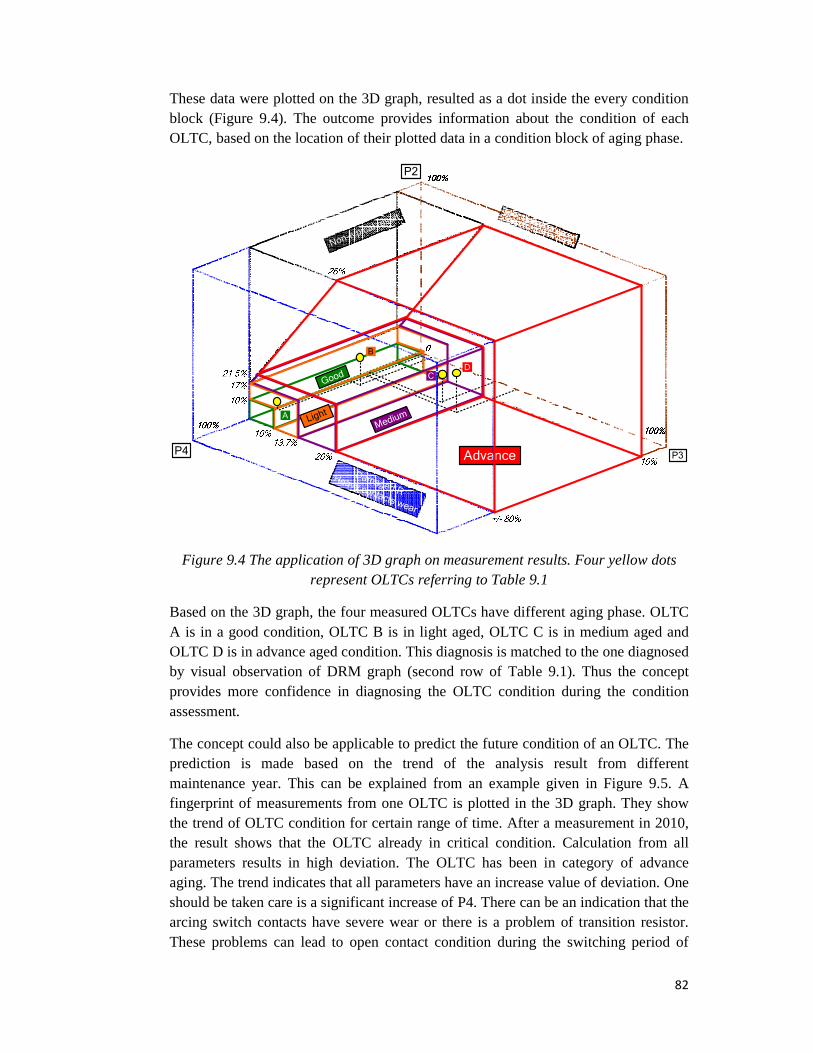
82
These data were plotted on the 3D graph, resulted as a dot inside the every condition block (Figure 9.4). The outcome provides information about the condition of each OLTC, based on the location of their plotted data in a condition block of aging phase.
A
P2
P3P4
Good
Damaged R
Heavy contacts wear
Advance
Medium
Non-typ
ical res
ult
Light
Non-sensitive setup
B
CD
Figure 9.4 The application of 3D graph on measurement results. Four yellow dots represent OLTCs referring to Table 9.1
Based on the 3D graph, the four measured OLTCs have different aging phase. OLTC A is in a good condition, OLTC B is in light aged, OLTC C is in medium aged and OLTC D is in advance aged condition. This diagnosis is matched to the one diagnosed by visual observation of DRM graph (second row of Table 9.1). Thus the concept provides more confidence in diagnosing the OLTC condition during the condition assessment.
The concept could also be applicable to predict the future condition of an OLTC. The prediction is made based on the trend of the analysis result from different maintenance year. This can be explained from an example given in Figure 9.5. A fingerprint of measurements from one OLTC is plotted in the 3D graph. They show the trend of OLTC condition for certain range of time. After a measurement in 2010, the result shows that the OLTC already in critical condition. Calculation from all parameters results in high deviation. The OLTC has been in category of advance aging. The trend indicates that all parameters have an increase value of deviation. One should be taken care is a significant increase of P4. There can be an indication that the arcing switch contacts have severe wear or there is a problem of transition resistor. These problems can lead to open contact condition during the switching period of

83
OLTC. To verify the problems, a visual check of the contacts and resistance measurement of transition resistor must be performed. Finally, based on the 3D graph including the verification of P4 problem, a decision can be made to take out the OLTC for overhaul. If a risk is taken to put back the OLTC on-line, there is a big possibility that a failure can be occurred before the next maintenance schedule in 2012.
P2
P3P4
2010
20042006
2008
Figure 9.5 The application of 3D graph for making a prediction of OLTC future condition
The proposed concept of 3D graph provides more confidence in determining the condition. Each condition blocks were made from combination of fingerprints data and field experience during the maintenance (proven by the visual check). Another function of the concept is to make prediction based on the trend of the analysis result.
9.5 Conclusions
- A concept has been developed in order to simplify the condition assessment of aged OLTCs. The results of calculation using the Analytical Tool from Chapter 7 are plotted in a 3D graph, based on the selected parameters: P2, P3 and P4. Then the outcome of the concept is information about the actual condition of the measured OLTC, whether it is in good condition, light aged, medium aged or advance aged category.
- The benefits of the concept are to simplify the assessment and to save the time. This concept is meant to complete the regular maintenance activity
84
where condition assessment is a part of it. It will provide the information of the OLTC’s actual condition. Hence a decision can be made based on the present condition.
- Besides contact deterioration, the deviation on DRM graph can be caused by measurement error or manufacturing error.
- Many measurement results from different aging phases are necessary to be analyzed to get reliable condition blocks and to determine a reliable boundaries between the blocks. Note should be taken that this concept applies only to one type of OLTC and one level of test current. Different type or series of OLTC and also different manufacturer may have different characteristic. For example: an OLTC is manufactured which has different arrangement of the stator arcing switch. They are located with different space in between, thus results in non-uniform timing of transition resistors being used to carry the load current during the switching.
- Another purpose of the concept is to make prediction of OLTC future condition based on the trend. The analysis is done using the same method, but it is applied to different measurement results from different year of an OLTC.

85
Chapter 10
Conclusions and Recommendations
This thesis discussed the influence of test parameters on dynamic resistance measurement (DRM) results from OLTC. It was expected that the measurement results are dependency to the test parameters. To gain the data for this research, DRM has been done on different aged OLTCs using an upgraded test setup. Two selected test parameters, which are test current and circuit resistance, were varied during the measurements. The measurement results from different levels of test parameters were quantified by a method that was discussed in this report, named analytical tool. It was introduced to calculate the deviations of the current in DRM graph. Then the influence of the test parameters was studied from the behaviour of the measurement results, using this analytical tool.
Besides quantifying the experimental measurement results, the analytical tool was used for interpreting results from aged OLTC into an actual condition of the OLTC. To do so, a three dimensional classification system has been developed. A three dimensional graph is used to plot the calculated quantities. The location of the results in 3D graph indicates the condition of OLTC, whether it is in good condition, or it has certain defects.
10.1 Conclusions
1. A lot of measurement data from different level of test parameters is needed to observe the influence of the test parameters. To do so, a flexible test setup has been used based on Dynamic Resistance Measurement’s principle. It allows performing measurement with different test parameters (test current and circuit resistance) without any change of the setup. Therefore the measurement can save time and it results can be compared with each other: only one parameter is changed every measurement.
2. The test levels for both test parameters (test current and circuit resistance) have been classified into three different levels: low, medium and high. These classes were determined based on the behaviour of the good OLTC measurement results for each test levels. Some test levels which have a similar behaviour were grouped into one class. Test current value of 0.2ADC up to 0.5ADC are classified as low test level, 1ADC up to 1.5ADC as medium test level, and started from 5ADC and above as high test level. Circuit resistance value of 0.2Ω is categorized as low test value, 1Ω as medium test level, and started from 4Ω and above as high test level.
3. Filtering the measurement results should be done carefully. The purpose of applying filters is to minimize the noise, but it shall be applied to the results
86
without filtering the exact behavior of current. Thus the real behavior of current can be seen in the DRM graph.
Less or even no filter was applied to the DRM graph when analyzing the switching behavior. It is intended to prevent the reduction of current slope when filtering. The similar approach is valid for high level of test current. There is no need to apply filter to the measurement results, since a clean DRM graph has been restored.
4. An analytical tool has been developed to calculate the deviation in DRM graph. It has four different parameters for analysis: P1 calculates the amplitude of DRM graph, based on the resistance of the transformer windings. Its purpose is to measure the sensitivity of the measurement to the contact resistance; P2 measures the short-term effect on the contact resistance; P3 determines the long-term effect on the contact resistance; and P4 calculates the timing of transition resistors being used during the switching of OLTC.
5. The different response of the test current due to the transition resistors can not be directly subjected to contacts wear. There are different kinds of OLTC stator design, which may have different sizes for each contact. It causes different switching time from one tap to another. Longer timing means larger deviation. The current were held by transition resistor(s) for a quite long time and thus disrupted more.
6. Influence of test parameter, test current and circuit resistance, in the measurement results is significant:
- A low test current is easily disrupted by a thin resistive layer and is very sensitive in responding to any changes of contact resistance. The medium test current (e.g. 1.5ADC) has a good balance between the sensitivity and the strength of signals due to noise. It produces a reliable reading of the defects. The high test current breaks the resistive layers. It is not sensitive in responding small resistance change.
Except P4, the three other analysis parameters show a reduced sensitivity when the test current is increased. The sensitivity of measurement (P1) to contact resistance is less for high current value: a high test current breaks the resistive layer and restores the contacts (reducing P2 and P3). Therefore a measurement with a high test current produces smaller current deviations than a measurement with a lower test current. P4 curve is slightly decreased at high test current. The effect of test current on P4 is less significant than the other parameters.
- The effect of circuit resistance shows similar in all analysis parameters: deviation reduces when the circuit resistance is increased. The time constant (L/R) will be small due to high circuit resistance. It makes the measurement is

87
sensitive in measuring fast change of current. The low amplitude of response signal is another effect of high circuit resistance. It causes P2, P3 and P4 have low deviation at higher circuit resistance.
7. Based on experiments and calculation using analytical tool, a reliable measurement result can be gained with measurement using medium test current and minimum circuit resistance. A minimum circuit resistance means no need to add more resistance from variable resistor.
8. A concept of a three dimensional classification systems (3D graph) is developed with the purpose to simplify the condition assessment of OLTCs. It interprets the calculated four parameters into the actual condition of an OLTC. Another use of 3D graph is to make prediction of OLTC future condition. The measurement result from different measurement years can be analyzed by the analytical tool to make prediction of OLTC condition. The analysis results will be plotted in the 3D graph and then can show the trend of an OLTC condition during its lifetime.
10.2 Recommendations
1. The analysis of the test parameters effect has been done based on measurement of one varied test parameter while the other test parameters were fixed. Further study can be carried out by performing measurement with combination of different value of test parameters. A medium test parameter in combination with high circuit resistance may have certain effect to the measurement.
2. To develop reliable condition boundaries of of three dimensional classification system (3D graph), many measurements data needs to be processed. All results can be plotted on the graph and thus the blocks can be formed based on a group of measurement results having the same condition, either aging phases, contacts wear or measurement error. This way a reliable assessment of the OLTC actual condition is provided.
3. The concept of three dimensional classification systems as described in this thesis can be developed further using software. It may simplify the process of determining condition boundaries.
4. Perform further research on noises which occurs during the dynamic resistance measurement. A new test setup can be built which can lower the noise.

88
References
[1] Smit Transformers, www.smitusa.com
[2] Cigré WG 12.05. “An international survey on failures in large power transformers in service” ELECTRA No. 88, pp. 21-48, 1983.
[3] J.J. Erbrink, E. Gulski, P.P. Seitz, R, Leich, “Advanced on-site diagnosis of transformer on-load tap changer”, IEEE International Symposium on Electrical Insulation, pp. 252-256, June 2008.
[4] J.J. Erbrink, E. Gulski, J.J. Smit, R. Leich, P.P. Seitz, B. Quak, “On-load Tap Changer Diagnosis: Interpretation of Dynamic Resistance Deviations”, 2010.
[5] ABB On-Load Tap Changers, www.abb.com
[6] H. James, (2006) “Electric Power Transformer Engineering. 2nd Ed.”, Boca Raton: CRC Press.
[7] H. F. A. Verhaart, "A diagnostic to determine the condition of the contacts of the tap changer in a power transformer," in. Proc. CIRED, vol. paper 1.13, 1995.
[8] J. J. Erbrink, E. Gulski, J. J. Smit, P. P. Seitz, B. Quak, R. Leich, and R. A. Malewski, "Power Transformer Diagnosis - An off-line solution for detecting degradation and defects - Part 1."
[9] J. J. Erbrink, E. Gulski, J. J. Smit, P. P. Seitz, and R. Leich, "Experimental model of aging mechanisms of on-load tap changer contacts," International conference on condition monitoring and diagnosis, Beijing, China, pp. 247-250, April 2008.
[10] Z. Wang, Y. Liu, and P. J. Griffin, "Artificial Intelligence in OLTC Fault Diagnosis Using Dissolved Gas-In-Oil Information," IEEE Power Engineering Society Summer Meeting, Seattle, USA, vol. 4, pp. 2422-2427, July 2000.
[11] H. U. Schellhase, R. G. Pollock, A. S. Rao, E. C. Korolenko, and B. Ward, "Load Tap Changers: Investigations of Contacts, Contact Wear and Contact Coking," Proceedings of the Forty-Eighth IEEE Holm Conference on Electrical Contacts, pp. 259-272, 2002.
[12] IEEE – C57.12.90 – 1987, “IEEE Standard Test Code for Liquid-Immersed Distribution, Power, and Regulating Transformers”.