Embed Size (px)
Citation preview

Infineon Technologies AG
Annual Report 2013
READY FOR TOMORROW

Page 38 Page 44
1 In alphabetical order. Infineon´s major distribution customers are Arrow, Avnet, Beijing Jingchuan, Tomen and WPG Holding.
2 All figures for 2012 calendar year.
Applications
> Powertrain
> Hybrid and electric vehicles
> Chassis and comfort electronics
> Safety
Product range
> Microcontroller (8-bit, 16-bit, 32-bit)
for automotive and industrial applications
> Software development platform DAVE™
> Discrete power semiconductors
> IGBT modules
> Voltage regulator
> Power ICs
> Bus interface devices (CAN, LIN, FlexRay)
> Magnetic sensors
> Pressure sensors
> Wireless transmit and receive ICs (RF, radar)
Key customers ¹
Autoliv / Bosch / Continental / Delphi / Denso / Hella /
Hyundai / Lear / Mando / Mitsubishi / TRW / Valeo
Market position ²
2With a market share of 9.1% Source: Strategy Analytics, April 2013
Applications
> Renewable energy generation
> Energy transmission and conversion
> Uninterruptable power supplies
> Industrial drives
> Industrial vehicles
> Traction
> Home appliances
Product range
> IGBT module solutions including IGBT stacks
> IGBT modules (high-power,
medium-power and low-power)
> Discrete IGBTs
> Bare die business
> Driver ICs
Key customers ¹
ABB / Alstom / Bombardier / Delta / Emerson /
Enercon / Goldwind / Rockwell / Schneider Electric /
Semikron / Siemens / SMA Solar Technology
Market position ²
1With a market share of 11.8 %
for discrete power semiconductors and modulesSource: IHS, September 2013
INFINEON AT A GLANCE
AUTOMOTIVEINDUSTRIAL POWER CONTROL

INFI
NE
ON
AT
A G
LAN
CE
Page 50 Page 56
Infineon Technologies AG, Neubiberg (Germany), offers semiconductor and system solutions addressing three
central challenges to modern society: energy efficiency, mobility, and security. In the 2013 fiscal year (ending
September 30), the Company reported revenues of 3.84 billion euros with approximately 26,700 employees
worldwide. Infineon is listed on the Frankfurt Stock Exchange (ticker symbol: IFX) and in the USA on the
over-the-counter market OTCQX Inter national Premier (ticker symbol: IFNNY).
Applications
> Power supplies
> Mobile devices
> Cellular network infrastructure
> Light management including LED lighting
> Inverters for photovoltaic rooftop systems (< 3 kW)
Product range
> Discrete high-voltage power transistors
> Discrete low-voltage power transistors
> Driver ICs
> Control ICs
> RF power transistors
> Small-signal components
> CMOS RF switches for antenna modules
> MEMS and ASICs for silicon microphones
> Customized chips (ASICs)
Key customers ¹
AAC / Dell / Delta / Emerson / Ericsson /
Hewlett-Packard / Huawei / LG Electronics /
Lite-On / Osram / Quanta / Samsung
Market position ²
2With a market share of 12.7 %
for standard MOSFET power transistorsSource: IHS, September 2013
Applications
> Mobile communication
> Payment systems
> Security for mobile communication devices
> Electronic passports, ID cards,
healthcare cards, driver’s licences
> Ticketing, access control
> Trusted computing
> Authentication
Product range
> contact-based security controllers
> contactless security controllers
> Dual-interface security controller
(contact-based and contactless)
Key customers ¹
Beijing Watch Data / Gemalto / Giesecke & Devrient /
Hewlett-Packard / Oberthur Technologies /
Safran Morpho / US Government Printing Office
Market position ²
1With a market share of 24.1 %
microcontroller-based chip card ICs Source: IHS, September 2013
POWER MANAGEMENT & MULTIMARKET
CHIP CARD & SECURITY
P An overview of our worldwide locations can be found on pages 112 and 113 in the chapter “Infineon worldwide”.

INFI
NE
ON
AT
A G
LAN
CE
Infineon key data
as and for the fiscal years ended September 30 (under IFRS) ¹
Fiscal year from October 1 to September 30 2013 2012 2013/2012
€ millions in % of
revenue€ millions in % of
revenueChange
in %
Revenue by region 3,843 3,904 (2)
Europe, Middle East, Africa 1,567 41 1,732 44 (10)
Therein: Germany 795 21 908 23 (12)
Asia-Pacific (w/o Japan) 1,560 40 1,470 38 6
Therein: China 710 18 637 16 11
Japan 227 6 252 6 (10)
Americas 489 13 450 12 9
Revenue by Segment 3,843 3,904 (2)
Automotive 1,714 44 1,660 43 3
Industrial Power Control 651 17 728 19 (11)
Power Management & Multimarket 987 26 929 24 6
Chip Card & Security 463 12 457 12 1
Other Operating Segments 26 1 125 3 (79)
Corporate and Eliminations 2 0 5 0 (60)
Gross profit/Gross margin 1,323 34.4 1,427 36.6 (7)
Research and development expenses (525) 13.7 (455) 11.7 15
Selling, general and administrative expenses (440) 11.4 (475) 12.2 (7)
Operating income 325 455 (29)
Income from continuing operations 283 432 (34)
Loss from discontinued operations, net of income taxes (11) (5) (120)
Net income 272 427 (36)
Segment Result/Segment Result Margin 377 9.8 527 13.5 (28)
Property, plant and equipment 1,600 1,731 (8)
Total assets 5,905 5,898 –
Total equity 3,776 3,575 6
Net cash provided by operating activities from continuing operations 610 667 (9)
Net cash used in investing activities from continuing operations (328) (1,013) 68
Net cash used in financing activities from continuing operations (165) (199) 17
Free cash flow ² 235 (219) 207
Depreciation and amortization 466 428 9
Capital expenditure 378 890 (58)
Gross cash position ³ 2,286 2,235 2
Net cash position ⁴ 1,983 1,940 2
Basic earnings per share in € 0.25 0.40 (38)
Diluted earnings per share in € 0.25 0.39 (36)
Dividend per share in € ⁵ 0.12 0.12 –
Equity ratio 63.9 % 60.6 % 5
Return on equity ⁶ 7.2 % 11.9 % (40)
Return on assets ⁷ 4.6 % 7.2 % (36)
Inventory intensity ⁸ 10.3 % 9.6 % 7
Debt-to-equity ratio ⁹ 8.0 % 8.3 % (3)
Debt-to-total-capital ratio ¹⁰ 5.1 % 5.0 % 3
Return on Capital Employed (RoCE) ¹¹ 14.1 % 22.3 % (37)
Employees Infineon as of September 30 26,725 26,658 –
1 Columns may not add due to rounding.
2 Free cash flow: for definition G see glossary, page 284.
3 Gross cash position: for definition G see glossary, page 284.
4 Net cash position: for definition G see glossary, page 284.
5 A dividend per share of €0,12 for the 2013 fiscal year will be
proposed to the Annual General Meeting on February 13, 2014.
6 Return on equity = net income divided by total equity.
7 Return on assets = net income divided by total assets.
8 Inventory intensity = inventories (net) divided by total assets.
9 Debt-to-equity ratio = long-term and short-term debt divided by total equity.
10 Debt-to-total-capital ratio = long-term and short-term debt divided by total assets.
11 Return on Capital Employed (RoCE): for definition G see glossary, page 284.

We have learnt from past market cycles. With refocused
business activities and improved cycle management,
we are laying the groundwork for solid profitability over
the entire cycle.
As market and technology leader, Infineon is a pioneer
in its field and the only company worldwide to operate
300-millimeter thin-wafer manufacturing for power
semiconductors. This innovation not only gives us advan-
tages in terms of productivity, but also the opportunity
to grow in the years ahead.
In addition to our technological strength, we intend to
enhance our understanding of the factors that make our
customers successful. We call this strategic evolution
“Product to System”.
Our business activities, operational excellence, highly
efficient 300-millimeter manufacturing and strategic focus
on “Product to System” make us:
READY FOR TOMORROW

Combined reporting
This combined report documents Infineon’s economic, ecological and social performance
during the 2013 fiscal year. With this report we want to demonstrate how sustainability
contributes to Infineon’s success and how our activities in this area create value for all of
our stakeholders.
Report boundaries
The reporting period covers the 2013 fiscal year – from October 1, 2012 to September 30,
2013. This report is published annually; the previous report was published in November 2012.
Unless otherwise stated, the information and key performance indicators contained in this
report relate to the 2013 fiscal year.
In order to help readers identify and interpret trends, the report includes data for at least
the last two years in the quantitative performance illustrations. Furthermore, the progression
graphs included in the chapter “Sustainability at Infineon” illustrate the last five fiscal
years’ performance.
G 01
Sustainability
Economy
Social Environment
Sustainability
P see page 80
ABOUT THIS REPORT
2 INFINEON TECHNOLOGIES ANNUAL REPORT 2013
ABOUT THIS REPORT

Reporting requirements
Infineon’s Group Management Report has been prepared in accordance with sections 315
and 315a of the German Commercial Code (“HGB”) and in accordance with German
Accounting Standards no. 8, 15 and 17.
The Consolidated Financial Statements are prepared in accordance with International
Financial Reporting Standards (“IFRS”). Infineon’s internal control system for financial
reporting ensures the reliability of the information provided in the notes to the Consoli-
dated Financial Statements.
The non-financial performance information provided in this combined report has been
reported on the basis of the G3.1 Guidelines of the Global Reporting Initiative (“GRI”). The
GRI has confirmed that this report fulfills the requirements of the Application Level B+.
The information contained in the Infineon Annual Report 2013 also serves as “Communi-
cation on Progress” for the United Nations Global Compact.
Infineon engages in continuous dialog with its stakeholders. We assess sustainability
topics on the basis of a materiality analysis, the results of which are used to identify and
prioritize topics for inclusion in this report. The topics resulting from the analysis can be
found in the chapter “Sustainability at Infineon”.
In addition to the statutory audit of the Group Management report, KPMG AG Wirtschafts-
prüfungsgesellschaft, Munich, has provided independent assurance (“limited assurance”)
on the sustainability performance information in the chapter “Sustainability at Infineon”
in accordance with the International Standard for Assurance Engagements (ISAE3000), the
pertinent standard for assuring sustainability information.
The Independent Assurance Report issued by KPMG AG Wirtschaftsprüfungsgesellschaft,
Munich, as well as the explanatory notes to the key performance indicators and information
provided in the chapter “Sustainability at Infineon” of the Annual Report 2013 can be
found on Infineon’s website.
P see page 296
P see page 80
@ www.infineon.com/CSR_Reporting
3INFINEON TECHNOLOGIES ANNUAL REPORT 2013
ABOUT THIS REPORT

6 MANAGEMENT BOARD AND SUPERVISORY BOARD
6 LETTER TO SHAREHOLDERS
10 THE MANAGEMENT BOARD
12 REPORT OF THE SUPERVISORY BOARD
TO THE ANNUAL GENERAL MEETING
20 THE INFINEON GROUP
22 FINANCES AND STRATEGY
23 2013 fi scal year exceeds expectations
26 Group strategy
36 THE SEGMENTS
38 Automotive
44 Industrial Power Control
50 Power Management & Multimarket
56 Chip Card & Security
62 RESEARCH & DEVELOPMENT
70 OPERATIONS
74 R&D AND MANUFACTURING SITES
76 INTERNAL MANAGEMENT SYSTEM
80 SUSTAINABILITY AT INFINEON
96 OUR EMPLOYEES
104 HIGHLIGHTS 2013
106 THE INFINEON SHARE
110 AWARDS
112 INFINEON WORLDWIDE
114 OUR 2013 FISCAL YEAR
116 DEVELOPMENTS IN THE GLOBAL ECONOMY AND WITHIN THE
SEMICONDUCTOR INDUSTRY IN THE 2013 FISCAL YEAR
118 GROUP PERFORMANCE
118 Review of results of operations
125 Review of fi nancial condition
127 Review of liquidity
131 REPORT ON EXPECTED DEVELOPMENTS, TOGETHER WITH
ASSOCIATED MATERIAL RISKS AND OPPORTUNITIES
131 Outlook
140 Risk and opportunity report
GROUP MANAGEMENT REPORT
4 INFINEON TECHNOLOGIES ANNUAL REPORT 2013
CONTENT

CONSOLIDATED FINANCIAL STATEMENTS
194 CONSOLIDATED STATEMENT OF OPERATIONS
195 CONSOLIDATED STATEMENT OF COMPREHENSIVE INCOME
196 CONSOLIDATED STATEMENT OF FINANCIAL POSITION
198 CONSOLIDATED STATEMENT OF CASH FLOWS
200 CONSOLIDATED STATEMENT OF CHANGES IN EQUITY
202 NOTES TO THE CONSOLIDATED FINANCIAL STATEMENTS
278 FURTHER INFORMATION
278 RESPONSIBILITY STATEMENT BY THE MANAGEMENT BOARD
279 AUDITOR’S REPORT
280 FINANCIAL DATA 2009 – 2013
282 LIST OF GRAPHICS
283 FINANCIAL GLOSSARY
285 TECHNOLOGY GLOSSARY
292 MEMBERSHIPS AND PARTNERSHIPS
293 GRI INDEX
296 GRI CERTIFICATE
297 FINANCIAL CALENDAR
297 IMPRINT
151 TREASURY AND CAPITAL REQUIREMENTS
155 OVERALL STATEMENT OF THE MANAGEMENT BOARD WITH RESPECT
TO INFINEON’S FINANCIAL CONDITION AS OF THE DATE OF THIS REPORT
156 INFINEON TECHNOLOGIES AG
158 EVENTS AFTER THE END OF THE REPORTING PERIOD
159 CORPORATE GOVERNANCE
159 Information pursuant to section 289, paragraph 4, and section 315,
paragraph 4, of the German Commercial Code (HGB)
168 Corporate Governance Report
177 Compensation Report
5INFINEON TECHNOLOGIES ANNUAL REPORT 2013
CONTENT

Together we can look back at a successful fiscal year. Personally, I am very pleased with
how things have progressed. One year ago, when I took over the role of CEO at Infineon
Technologies AG, we were faced with a great many challenges, which we have successfully
overcome. We also took some important decisions and are now – as stated in the title of
this Annual Report – “ready for tomorrow”.
A brief summary of the 2013 fiscal year
Even though global economic growth was modest and demand for capital goods weak, at
3.84 billion euros, Infineon managed to keep revenue for the 2013 fiscal year at a level
similar to the previous twelve-month period – and that despite having suffered a dramatic
13 percent quarter-on-quarter drop in revenue in the first three-month period. This first-
quarter slump was the main reason why the Segment Result dropped sequentially from
527 million euros in the 2012 fiscal year to 377 million euros in the fiscal year under
report. It is remarkable, however, that Infineon remained solidly profitable in each quarter
and, towards the end of the year under report, we were able to raise profitability sharply,
with the fourth quarter alone producing a Segment Result of 148 million euros. This positive
trend is reflected in the strong performance of the Infineon share price, also in relation to
the DAX, Germany’s principal stock market index. The Infineon share stood at 7.40 euros
at September 30, 2013, 50 percent higher than one year earlier. During the same period,
the DAX increased by 19 percent. In view of Infineon’s solid profitability, even during less
favorable times, and its good prospects for future growth, the Management Board and
Supervisory Board are again proposing to the Annual General Meeting a dividend payment
of 12 cents per share. Furthermore, an amount of up to 300 million euros has been set
aside to buy back shares or some of the subordinated convertible bonds due 2014 in the
period up to September 30, 2015.
Infineon today: Solid profitability
It is worth taking a closer look at Infineon’s performance over the 2013 fiscal year.
The semiconductor industry in which we operate is subject to cyclical fluctuations. As pointed
out above, due to weaker market conditions, we were facing a 13 percent quarter-on-quarter
revenue decrease in the first three months of the 2013 fiscal year. Compared to the most
recent revenue high, which was recorded in the third quarter of the 2011 fiscal year, the drop
was even higher, at 18 percent. In an industry like ours that is dominated by fixed costs, it
Neubiberg, November 2013
LETTER TO SHAREHOLDERS
INFINEON TECHNOLOGIES ANNUAL REPORT 2013
MANAGEMENT BOARD AND SUPERVISORY BOARD6

is almost inevitable that earnings will shrink if both revenue and capacity utilization fall on
this scale. Over the past years, however, we have focused our portfolio on activities that
generate good margins, which is helping us to remain profitable. We have also learnt from
past market cycles and turned the management of these cyclical fluctuations into one of
Infineon’s core competencies. This means being able to adjust costs quickly and through-
out the Company when markets weaken and rapidly ramp up production volumes when
markets return to strength, without losing sight of the long-term strategy.
The beginning of the 2013 fiscal year was one of those times when it became necessary to
boldly cut costs. In this situation, we mothballed unutilized capacities, halted or postponed
a number of projects and brought some previously outsourced services back in-house.
The flexible nature of working-time accounts also proved to be a major benefit. At one site,
we switched to short-time work and, to a limited degree, did not extend some temporary
contracts. All these measures taken together enabled us to achieve a Segment Result Margin
of 5.2 percent in the first quarter, despite the slump in revenue.
Demand gathered momentum over the course of the fiscal year and in the fourth quarter,
we recorded revenues of 1,053 million euros, almost 24 percent above the first quarter’s
figure of 851 million euros – all that in just nine months. Our ability to cope with this growth
in operational terms shows that we were well prepared and capable of making a quick turn-
around. In the fourth quarter, we achieved a Segment Result Margin of 14.1 percent.
Developments over the previous fiscal year prove that Infineon is a solidly profitable entity
even in tough circumstances. Conversely, they have demonstrated that the Company can
reliably handle significant increases in demand during cyclical upturns at expanding margins.
A healthy portfolio, operational improvements, a strong leadership team and committed
employees are the cornerstones of this versatility.
Dr. Reinhard Ploss
Chief Executive Officer
INFINEON TECHNOLOGIES ANNUAL REPORT 2013
LETTER TO SHAREHOLDERS7

Ready for tomorrow: “Product to System” and efficient manufacturing
on 300-millimeter thin wafers
Infineon is not only mastering the cycles of the semiconductor industry – we are going one
step further. We are now in the process of shifting the focus of our activities: away from
product-based thinking towards system understanding or in short: “Product to System”.
What does this mean? Our wealth of technical expertise has enabled us to develop many
leading technologies and innovative products over the years. In the future, however, not
only will we build on our outstanding technological strength, we will also endeavor to
increase our understanding of the factors that bring success to our customers. There are a
number of ways for us to approach this issue, ranging from providing support to our cus-
tomers in designing their products through to developing innovative concepts which will
enable customers to reduce costs and increase performance in their future systems. Our
system understanding and semiconductor competence will help us develop products that
are not just a bit better or a bit cheaper. Instead, they will be made to even better match
the customer’s needs, open up alternative solutions and produce clear benefits in the
functions they offer. This approach could well make our products slightly more expensive.
In return, however, the customer benefits from greater added value: savings can be made
with other components, thus reducing total cost; the value of the customer’s products
rises; and development times are shortened. By thinking in system terms, we are “ready
for tomorrow”.
In the long term, our organizational structure will also follow the “Product to System”
principle. Although Infineon is still organized in terms of product categories today, thinking
in many parts of the Company is already based on the quest for holistic solutions at an
application level.
This strategic shift in emphasis away from product thinking towards system understanding
is being accompanied by greater manufacturing efficiency. We are the first, and currently
only supplier worldwide with the capability to manufacture power semiconductors on par-
ticularly thin 300-millimeter silicon wafers. The transition from the 200-millimeter wafers
common today to this larger diameter is expected to reduce unit costs by 20 to 30 percent
once full capacity utilization has been reached.
Our current product portfolio and operational flexibility lay the groundwork for tomorrow’s
success, when the shift from a product to a system focus, combined with the use of our
300-millimeter technology, will sustainably ensure growth and higher margins. We are
sticking to our target: our aim is to achieve a Segment Result Margin of 15 percent on aver-
age through the cycle. We can be proud of our progress to date.
INFINEON TECHNOLOGIES ANNUAL REPORT 2013
MANAGEMENT BOARD AND SUPERVISORY BOARD8

Running the business on a sustainable basis
In addition to gaining a deeper understanding of our customers’ systems, optimizing our
products and solutions, and achieving adequate profitability in line with our targets, it
is also imperative that we run our business on a sustainable basis. We see sustainability
as leaving behind a world worth living in – for our children and our children’s children.
Sustainability – just as much as achieving economic targets – is always at the center of our
actions. As recognition of our achievements in this field, Infineon has been listed in the
Dow Jones Sustainability Index for four years in succession – another fact we can be proud of.
Our thanks to Infineon’s employees
Strong revenue fluctuations and continually increasing demands in terms of technology,
quality, speed and efficiency again presented us with some major challenges over the
course of the 2013 fiscal year. The enduring commitment and outstanding reliability of our
entire staff enabled us to master these challenges very successfully. For that, I would like
to express my wholehearted thanks to all Infineon staff, on behalf of both myself and my
Board colleagues.
What we expect from the 2014 fiscal year
What are the next steps? Our customers are looking to the 2014 fiscal year with greater
optimism and order levels are much higher than they were in the previous year. Having said
that, certain worldwide economic issues still need to be overcome and the global growth
rate remains moderate. We also need to consider the usual seasonal downturn at the
beginning of our fiscal year. Based on an assumed exchange rate of US$ 1.35 to the euro,
we expect revenue to grow by 7 to 11 percent in the 2014 fiscal year. The Segment Result
Margin in 2014 should be significantly higher than in the year under report and range from
11 to 14 percent. We look forward to being measured against these targets. Thank you for
your trust in us.
Dr. Reinhard Ploss
Chief Executive Officer
INFINEON TECHNOLOGIES ANNUAL REPORT 2013
LETTER TO SHAREHOLDERS9

Arunjai Mittal
Member of the Management Board, Regions, Sales,
Marketing, Strategy Development and M&A; Studies in
electrical engineering at Shivaji University, Kohlapur,
India (Dipl.-Ing.); Member of the Management Board
since January 2012
Dr. Reinhard Ploss
Chief Executive Officer (CEO), Labor Director; Doctorate
in chemical engineering (Dr.-Ing.); Member of the
Management Board since June 2007
Dominik Asam
Chief Financial Officer (CFO); Mechanical engineer
(Dipl.-Ing.), Master of Business Administration (MBA);
Member of the Management Board since January 2011
THE MANAGEMENT BOARD
Our innovation capability
combined with new
business models enables
us to generate value
for us and our customers
globally. «
Arunjai Mittal
»
INFINEON TECHNOLOGIES ANNUAL REPORT 2013
MANAGEMENT BOARD AND SUPERVISORY BOARD10

Our strategic shift from
product thinking to system
understanding lays the
cornerstone for future
success and makes Infi neon
‘ready for tomorrow’. «
Dr. Reinhard Ploss
» Energy effi ciency, mobility and
security are strong growth
drivers. Our future-oriented
semiconductor solutions
form the solid basis for
sustainable profi tability. «
Dominik Asam
»
INFINEON TECHNOLOGIES ANNUAL REPORT 2013
THE MANAGEMENT BOARD11

The 2013 fiscal year has clearly demonstrated that the Management and Supervisory Board’s
confidence in Infineon’s future has not been a matter of calculated optimism. Infineon
continued to report solid profits, even at the lowest point in the semiconductor cycle. We
owe this success primarily to the outstanding work of Infineon’s staff and management.
Also due to an intelligent steering of investment volumes, significant cuts in Research and
Development activities and a reduction of the size of the workforce could be avoided. In
these circumstances, we can confidently set about exploiting economic momentum and –
despite any uncertainties that may remain – look to the future with great optimism.
During the 2013 fiscal year, the Supervisory Board again conscientiously and diligently
performed all duties incumbent upon it in accordance with the law, the Company’s statutes
and the internal rules of procedure. It assisted the Management Board in an advisory
capacity and monitored its governance of the business. At the ordinary meetings of the
Supervisory Board, the Management Board reported in depth on Infineon’s financial condi-
tion and business performance. The Management Board discussed Infineon’s strategic
direction and any major specific measures with the Supervisory Board. The Supervisory
Board was always given sufficient time and opportunity to thoroughly examine any reports
and proposed resolutions drawn up by the Management Board. In this context, it under-
took measures to assure itself that the governance of Infineon’s affairs was lawful, compli-
ant and appropriate.
In addition to the information provided at regular meetings, the Supervisory Board was
kept informed by means of extensive quarterly reports in writing covering a wide range of
matters, including business performance in the previous quarter, financial data, risks and
opportunities, significant issues and major areas of litigation. Between quarterly reports,
the Management Board also informed the Supervisory Board of current developments by
means of monthly reports.
The Chairman of the Supervisory Board, the Chairman of the Investment, Finance and Audit
Committee and the Chairwoman of the Strategy and Technology Committee remained in
regular contact with the Management Board and deliberated on questions relating to strategy,
planning, business performance, risks, risk management and compliance. In addition, the
Chairman of the Supervisory Board was informed by the Chief Executive Officer without
delay of any important events essential for an accurate assessment of Infineon’s situation
and performance as well as for the governance of Infineon’s affairs.
REPORT OF THESUPERVISORY BOARD TO THEANNUAL GENERAL MEETING
INFINEON TECHNOLOGIES ANNUAL REPORT 2013
MANAGEMENT BOARD AND SUPERVISORY BOARD12

Main activities of the Supervisory Board
The full Supervisory Board held four ordinary meetings and one extraordinary meeting
during the 2013 fiscal year. The ordinary meetings were attended by all Supervisory Board
members. One shareholder representative was unable to participate in the extraordinary
meeting on July 11, 2013, which was held in the form of a telephone conference, and was
excused accordingly. Attendance at the meetings of the full Supervisory Board was there-
fore at a level of 98.6 percent.
Current situation, business performance and strategy
The Management Board reported regularly to the Supervisory Board on Infineon’s current
situation, particularly the market situation, significant transactions and key financial
performance indicators. It also provided in-depth assessments of Infineon’s business
performance and strategy. The Supervisory Board was also kept up to date regarding
production capacity utilization issues as well as current and planned investments. In
addition, the committee chairpersons reported to the full Supervisory Board on the work
of the respective committees.
It remains a matter of great importance for the Supervisory Board to be involved in the
strategic aspects of the business. In this context, a one-day strategy meeting was again
held in August 2013. Items on the agenda included Infineon’s long-term objectives and its
positioning in respect to the competition as well as current market trends and their impact
on Infineon. In this context, the Supervisory Board also addressed the extent to which
organic growth is either possible or meaningful, and whether and in which circumstances
it may be appropriate to implement Infineon’s strategy through the acquisition of or
participation in other business entities.
Wolfgang Mayrhuber
Chairman of the Supervisory Board
INFINEON TECHNOLOGIES ANNUAL REPORT 2013
REPORT OF THE SUPERVISORY BOARD TO THE ANNUAL GENERAL MEETING13

Transactions and measures requiring approval
The rules of procedure governing the actions of the Supervisory Board and Management Board
stipulate that certain transactions and measures require the approval of the Supervisory
Board. In accordance with the stipulated procedures, Infineon’s financial and investment
budget (including the overall investment budget) for the 2013 fiscal year, as presented by
the Management Board, was approved at the Supervisory Board meeting held on Novem-
ber 21, 2012 and a borrowing limit was set.
Composition of the Management Board
At its meeting on February 28, 2013, the Supervisory Board decided to extend Mr. Asam’s
first term of office by five years, and hence through to December 31, 2018, and to extend
his employment contract on the same terms and conditions. This decision was taken in
consideration of Mr. Asam’s excellent work to date as member of the Management Board.
Management Board compensation
The Supervisory Board had already decided in the 2012 fiscal year on the key points of a
new share-based Long Term Incentive (LTI), rather than the previously option-based LTI, as
a long-term, variable compensation component for the Management Board. During the year
under report, the Supervisory Board agreed on the details of this so-called “Performance
Share Plan” and its inclusion in the Management Board compensation system. Approval
was also granted by the shareholders at the Annual General Meeting on February 28, 2013.
The Supervisory Board also performed a thorough analysis of the changes to the German
Corporate Governance Code (Deutscher Corporate Governance Kodex) which came into
force in the 2013 fiscal year, and which, once again, pertained to management compen-
sation. Three points were of prime relevance for the activities of the Supervisory Board:
First, the latest version of the Code requires all variable compensation components to
be subject to upper limits. Infineon already complied with this requirement prior to the
change to the Code, in that the principal variable compensation components – STI (Short
Term Incentive), MTI (Mid Term Incentive) and LTI (Long Term Incentive) – all incorporate
fixed upper limits. Only the additional bonus, which the Supervisory Board (in a number of
narrowly defined exceptional cases) can award, amongst others for special achievements
of the Management Board, was not explicitly subject to an upper limit. Due to an amend-
ment made to the employment contracts in the 2013 fiscal year, this bonus is now capped
at a maximum value of 30 percent of the fixed compensation of each member of the
Management Board.
INFINEON TECHNOLOGIES ANNUAL REPORT 2013
MANAGEMENT BOARD AND SUPERVISORY BOARD14

The current version of the Code also requires that the Supervisory Board in conjunction with
its assessment of the appropriateness of Management Board compensation additionally
considers the relation between their compensation and that of senior management and staff
in general. A vertical comparison of this sort was in fact already part of the procedures
applied by the Supervisory Board. However, in light of the new version of the Code, the
Supervisory Board decided to take a closer look at the requirements involved, and concluded
that Management Board compensation at Infineon is appropriate and commensurate
with market conditions in this respect as well. Regardless of the aforementioned, the
Supervisory Board will conduct its scheduled thorough examination of Management Board
compensation in the 2014 fiscal year.
The new version of the Code stipulates that the Supervisory Board should establish the
level of pension provision aimed at for each member of the Management Board – including
consideration of each member’s length of service on the board – and take into account
the resulting annual and long-term expense for the entity. With this in mind, the Supervisory
Board looked again at pension benefits for the present members of the Management Board
and concluded there is currently no cause for change.
Litigation
The Supervisory Board was kept well informed of the progress of major legal disputes during
the 2013 fiscal year, consulting with the Management Board and deliberating internally
about subsequent strategy. The principal matters to be dealt with were disputes with the
insolvency administrator managing the assets of Qimonda AG and antitrust proceedings
instigated by the EU Commission against Infineon and other chip card manufacturers.
Corporate governance
The Supervisory Board continues to follow closely the development of corporate governance
standards within Infineon, focusing in particular on the implementation of the recommen-
dations of the German Corporate Governance Code. During the year under report, the
Supervisory Board looked in depth at the changes made to the Code on May 13, 2013 by
the Government Commission of the German Corporate Governance Code. Points relevant
for the Infineon Supervisory Board have been discussed above.
Declaration of Compliance 2013
The Supervisory Board and the Management Board decided to issue the 2013 Declaration
of Compliance – as in the previous year – with a deviation from the Code’s recommendation
with respect to Supervisory Board compensation. The two boards continue to consider that
the compensation regulation resolved at the Annual General Meeting in 2011 adequately
takes account of Infineon’s long-term success. With the exception of the recommendation
with respect to Supervisory Board compensation, Infineon complies with all recommenda-
tions contained in the Code. The most recent Declaration of Compliance was published on
the Company’s website in November 2013.
INFINEON TECHNOLOGIES ANNUAL REPORT 2013
REPORT OF THE SUPERVISORY BOARD TO THE ANNUAL GENERAL MEETING15

Efficiency review for Supervisory Board activities
The Supervisory Board reviews the efficiency of its work once a year, including the efficiency
of its interaction with the Management Board. The efficiency review took place in summer
2013. The members of the Supervisory Board were requested to complete a questionnaire
about their work and the level of cooperation between the two boards. The results of this
survey were subsequently discussed at the meeting of the Supervisory Board on August 6,
2013. No significant shortcomings were identified.
Potential conflicts of interest
No conflicts of interest were reported in the 2013 fiscal year by members of either the
Management Board or Supervisory Board.
The German Corporate Governance Code requires prior approval to be given by the Super-
visory Board before members of the Management Board take on mandates on external
supervisory boards. In the year under report, the Supervisory Board gave its approval to
Mr. Asam’s mandate on the supervisory board of EPCOS AG.
Other comments relating to corporate governance at Infineon can be found in the Corporate
Governance Report issued jointly by the two boards.
Report on the work of the Supervisory Board’s Committees
As in the previous fiscal year, the Supervisory Board has five committees. The first two of
these are the Nomination Committee and the Mediation Committee pursuant to section 27,
paragraph 3 of the German Co-Determination Act. The remaining committees are the
Executive Committee; the Investment, Finance and Audit Committee; and the Strategy and
Technology Committee. The committees draw up resolutions or prepare topics that are
required to be dealt with by the full Supervisory Board. Certain decision-making powers
have been delegated to committees to the extent permitted under German law. The chair-
persons of each committee routinely report on committee meetings at the next relevant
full Supervisory Board meeting.
All Supervisory Board committees have an equal number of employee representatives
and shareholder representatives, with the exception of the Nomination Committee, which
consists exclusively of shareholder representatives. Mr. Mayrhuber remains Chairman
of the Nomination Committee, the Mediation Committee and the Executive Committee,
and Dr. Sünner Chairman of the Investment, Finance and Audit Committee. Prof. Dr.
Schmitt-Landsiedel continues to serve as Chairwoman of the Strategy and Technology
Committee.
INFINEON TECHNOLOGIES ANNUAL REPORT 2013
MANAGEMENT BOARD AND SUPERVISORY BOARD16

Executive Committee
The Executive Committee convened for one ordinary and two extraordinary meetings
during the year under report, with both of the extraordinary meetings taking place in the
form of telephone conferences.
The focus of meetings was on preparing the resolutions relating to Management Board
compensation – in particular the detailed structure of the new Long Term Incentive in the
form of the Performance Share Plan – as well as changes to the German Corporate Gover-
nance Code with respect to Management Board compensation.
The committee also drew up resolutions for the full Supervisory Board with respect to mea-
suring the variable compensation to be given to the members of the Management Board.
Important aspects of this work were to determine the degree to which targets for the 2012
fiscal year were achieved, to set new target levels for the 2013 fiscal year and to grant
stock options – for the last time – to members of the Management Board.
Investment, Finance and Audit Committee
The Investment, Finance and Audit Committee convened four times during the year
under review.
Its activities centered on monitoring the financial reporting process, reviewing the quarterly
financial statements, conducting the preliminary audit of the separate financial statements,
consolidated financial statements and Management Report of Infineon Technologies AG
and of the Infineon Group, and discussing the audit report with the auditor. Another
important task was to examine and discuss Infineon’s financial and investment plans and
to set a borrowing limit for the 2013 fiscal year. The committee also considered the effec-
tiveness of the internal control system, internal audit system and risk management system.
The Compliance Officer reported regularly to committee members about compliance issues
within the Infineon Group. The committee was also kept informed about significant litiga-
tion matters, in particular with regard to the disputes with the insolvency administrator
managing the assets of Qimonda AG, and antitrust proceedings instigated by the EU Com-
mission against Infineon and other chip card manufacturers.
Other duties performed by the committee included specifying key areas to be examined in
audit activities in the 2013 fiscal year and monitoring the auditor’s independence as well
as the additional services performed by the auditor. It prepared the Supervisory Board’s
proposal to the Annual General Meeting regarding the selection of the auditor to audit the
separate and consolidated financial statements and to review the half-year financial state-
ments, and engaged the auditor in this regard, additionally also to review the quarterly
financial statements. The relevant fee arrangements were also considered.
The auditor attended all of the meetings of the Investment, Finance and Audit Committee
and reported in detail on its audit activities.
INFINEON TECHNOLOGIES ANNUAL REPORT 2013
REPORT OF THE SUPERVISORY BOARD TO THE ANNUAL GENERAL MEETING17

Strategy and Technology Committee
The Strategy and Technology Committee convened three times during the period under report.
The committee looked in depth at new strategies for business decided on by the Manage-
ment Board and expressed its categorical support. Another area of focus for the committee
was to reflect on how Infineon could strengthen its competitiveness by means of business
acquisitions and/or participations and how this might help to achieve sustainable, profit-
able growth. The committee also considered a host of other issues, such as production
automation and knowledge management at Infineon.
Nomination and Mediation Committee
The Nomination Committee did not convene during the period under report, since no
Supervisory Board elections needed to be planned. Similarly, the Mediation Committee
did not need to convene during the 2013 fiscal year.
Company and Consolidated Financial Statements
KPMG AG Wirtschaftsprüfungsgesellschaft, Munich, audited the separate financial state-
ments of Infineon Technologies AG and the consolidated financial statements as of
September 30, 2013 as well as the Management Report of Infineon Technologies AG and
that of the Infineon Group and issued unqualified audit opinions. The half-yearly and
quarterly financial reports were subjected to a review by KPMG.
The separate financial statements, the consolidated financial statements prepared in accor-
dance with IFRS, the Management Report and the Management Board’s proposal for the
appropriation of unappropriated profit – all prepared by the Management Board – and the
long-form reports prepared by KPMG pertaining to the audits of the separate financial state-
ments, the consolidated financial statements and the Management Report, were discussed
thoroughly with KPMG at the meeting of the Investment, Finance and Audit Committee held
on November 11, 2013. At the meeting, the aforementioned committee resolved to propose
approving the two sets of financial statements by the Supervisory Board.
The Chairman of the Investment, Finance and Audit Committee reported on the committee’s
recommendations at the meeting of the Supervisory Board held on November 19, 2013.
At this meeting, the financial statements were also examined thoroughly in the presence of
the auditor and scrutinized by the Supervisory Board to ensure, in particular, that they
were lawful, compliant and adequate.
INFINEON TECHNOLOGIES ANNUAL REPORT 2013
MANAGEMENT BOARD AND SUPERVISORY BOARD18

At the aforementioned Supervisory Board meeting, the scope, key areas and cost of the
audit were also reported on, and the risk management system was explained. The Manage-
ment Report of Infineon Technologies AG as well as that of the Infineon Group were also
examined and found, in the opinion of the Supervisory Board, to be consistent with legal
requirements. The Supervisory Board concurs with the statements on Infineon’s future
development. The Supervisory Board has examined and endorses the Management
Board’s proposal to the Annual General Meeting for the appropriation of unappropriated
profit, which provides for a dividend of 0.12 euros per qualifying share.
Following the final result of the examination by the Supervisory Board, the Supervisory Board
has no objections to the financial statements and the audit performed by the auditor. The
Supervisory Board concurred with the results of the audit on November 19, 2013 and
approved the separate and consolidated financial statements of Infineon Technologies AG
as well as those of the Infineon Group. The separate financial statements have thus been
adopted.
The Supervisory Board would like to express its thanks to the Management Board, to the
entire staff for their great commitment and outstanding achievements in the 2013 fiscal
year, and to the employee representatives for their continued cooperation.
Neubiberg, November 2013
On behalf of the Supervisory Board
Wolfgang Mayrhuber
Chairman of the Supervisory Board
INFINEON TECHNOLOGIES ANNUAL REPORT 2013
REPORT OF THE SUPERVISORY BOARD TO THE ANNUAL GENERAL MEETING19

This report combines the Group Management Report of the Infineon Group (“Infineon” or “Group”), comprising
Infineon Technologies AG (or “the Company”) and its consolidated subsidiaries, and the Management Report of Infineon
Technologies AG. It should be read in conjunction with the audited Consolidated Financial Statements, including the
information provided in the Notes to the Consolidated Financial Statements, which appear elsewhere in this Annual
Report. The Consolidated Financial Statements have been prepared on the basis of a number of accounting policies and
assumptions more fully explained in note 1 (Basis of Preparation) and note 2 (Summary of Significant Accounting
Policies) to the Consolidated Financial Statements.
The Group Management Report contains forward-looking statements about the business, financial performance and
earnings performance of the Infineon Group. These statements are based on assumptions and projections which reflect
currently available information and present estimates. They are subject to a wide range of uncertainties and risks. Actual
business developments may therefore differ materially from what has been expected. Beyond disclosure requirements
stipulated by law, Infineon does not undertake any obligation to update forward-looking statements.
GROUP MANAGEMENT REPORT
INFINEON TECHNOLOGIES ANNUAL REPORT 2013
GROUP MANAGEMENT REPORT – THE INFINEON GROUP20

22 FINANCES AND STRATEGY
23 2013 fi scal year exceeds expectations
26 Group strategy
36 THE SEGMENTS
38 Automotive
44 Industrial Power Control
50 Power Management & Multimarket
56 Chip Card & Security
62 RESEARCH & DEVELOPMENT
70 OPERATIONS
74 R&D AND MANUFACTURING SITES
76 INTERNAL MANAGEMENT SYSTEM
80 SUSTAINABILITY AT INFINEON
96 OUR EMPLOYEES
104 HIGHLIGHTS 2013
106 THE INFINEON SHARE
110 AWARDS
112 INFINEON WORLDWIDE
THE INFINEON GROUP
GROUP MANAGEMENT REPORT
OUR 2013 FISCAL YEAR
CONSOLIDATED
FINANCIAL STATEMENTS
GROUP MANAGEMENT REPORT
THE INFINEON GROUP
21INFINEON TECHNOLOGIES ANNUAL REPORT 2013
GROUP MANAGEMENT REPORT – THE INFINEON GROUP

44%AUTOMOTIVE
€1,714 million
FINANCES AND STRATEGY
12%
CHIP CARD & SECURITY
€463 million
1%
OTHER OPERATING SEGMENTS/
CORPORATE AND ELIMINATIONS
€28 million
17%
INDUSTRIAL
POWER CONTROL
€651 million
26%
POWER MANAGEMENT
& MULTIMARKET
€987 million
Thanks to improved cycle management, we were able to remain solidly profitable in the 2013
fiscal year, even during a difficult phase of the economic cycle.
In order to secure Infineon’s profitability in the future, we will continue to develop our strategy:
“Product to System”. Furthermore, we have started with the production of semiconductors on
300-millimeter thin wafers in order to improve our cost position even further.
REVENUE BY SEGMENT IN THE 2013 FISCAL YEAR
INFINEON TECHNOLOGIES ANNUAL REPORT 2013
GROUP MANAGEMENT REPORT – THE INFINEON GROUP22

2013 FISCAL YEAR EXCEEDS EXPECTATIONS
Development of revenue and earnings
better than forecast.
Cycle management improved: solid profitability
during difficult phases of economic cycle;
successful response to upturn in demand.
Capital returns and dividend: €167 million
disbursed to capital market in 2013 fiscal year.
Revenue only slightly down on previous year; revenue performance
therefore better than expected at beginning of fiscal year
At the beginning of the 2013 fiscal year Infineon was expecting a mid to high single-
digit percentage decrease in revenue compared to the previous fiscal year, based
on an assumed exchange rate of US$ 1.25 to the euro. Over the course of the year,
however, we benefited from a strong seasonal and economic recovery, enabling us
to more than offset the impact of the weaker-than-forecast euro/US dollar exchange
rate. Overall, revenue decreased by only close to 2 percent to €3,843 million
compared to €3,904 million one year earlier.
Revenue performance varied considerably from segment to segment. The two
largest segments, Automotive and Power Management & Multimarket, achieved
revenue growth of 3 percent and 6 percent respectively, whereas the Industrial
Power Control segment suffered an 11 percent drop due to weak demand for capital
goods. Revenue of the Chip Card & Security segment edged up by 1 percent.
Revenue recorded by Other Operating Segments – mostly relating to product sales
to Lantiq and Intel Mobile Communications – decreased in the 2013 fiscal year
in line with budget by €99 million to €26 million due to expiring supply contracts.
During this period, Group revenue decreased overall by only €61 million. In other
words, revenue from Infineon’s core businesses – i.e. excluding Other Operating
Segments and Corporate and Eliminations (revenue decrease from €5 million
to €2 million) – were, in fact, up slightly by €41 million compared to the previous
fiscal year.
ATV ¹
1 Automotive
2 Industrial Power Control
3 Power Management & Multimarket
4 Chip Card & Security
IPC ²
PMM ³
CCS ⁴
3 %
(11%)
6 %
1%
G 02
Revenue development of Infineon and the individual segments in the 2013 fiscal year compared to the previous year
Revenue development of Infineon
compared to the previous year (2 %)
23INFINEON TECHNOLOGIES ANNUAL REPORT 2013
FINANCES AND STRATEGY
2013 FISCAL YEAR EXCEEDS EXPECTATIONS

Cycle management: costs reduced markedly during downturn,
quick response to upturn in demand
The Segment Result for the 2013 fiscal year totaled €377 million, down approximately
28 percent on the previous year’s figure of €527 million. The Segment Result Margin was
9.8 percent, compared with 13.5 percent one year earlier. At the beginning of the 2013
fiscal year, a Segment Result Margin in the mid to high single-digit percentage range had
been expected. Here too, the actual outcome exceeded expectations, and that despite the
weaker-than-forecast euro/US dollar exchange rate. The main reason for this is a signifi-
cant decrease in the costs of unutilized manufacturing capacity in the second half of the
fiscal year.
Looking at the past year in a more differentiated way, it becomes clear that Infineon is now
in a position to remain solidly profitable even in a downturn and, as soon as demand picks
up, can raise its output and margin. The first quarter of the fiscal year was the most chal-
lenging. Revenue totaled €851 million, some 18 percent down on the most recent revenue
peak recorded in the third quarter of the 2011 fiscal year (€1,043 million) and 13 percent
down on the preceding quarter. The first quarter’s Segment Result nevertheless came in at
€44 million, corresponding to a Segment Result Margin of 5.2 percent. This was possible
thanks to the improvements made in the area of cycle management. We have redesigned
our structures such that we can react flexibly to downturns in demand. In manufacturing
operations, for instance, contracts with temporary staff were not extended and idle manu-
facturing equipment temporarily mothballed. In the area of Research and Development, a
number of less critical projects were stopped or postponed. Other savings were made by
bringing some outsourced services back in-house. Yet, even during the difficult quarters
from the end of the 2012 fiscal year through to the middle of the 2013 fiscal year, we did
not have to cut down on or halt any major research projects, thus enabling us to keep up
our high level of innovation. However, it is not just that we have learned how to handle a
cyclical downturn; we also coped well with the operational aspects of the ensuing upturn
in demand and succeeded in sharply increasing profitability. After the first quarter’s low,
Infineon was able – within a space of nine months – to raise quarterly revenue by almost
24 percent to €1,053 million in the fourth quarter and to achieve a Segment Result Margin
of 14.1 percent.
These results demonstrate that Infineon, in its current form, is able to remain solidly profit-
able even in difficult phases of the economic cycle and also service upturns in demand
reliably and with improving margins.
1 Figures do not add due to rounding
922994 1,043 1,038
946 986 990 982
851918
1,022 1,053
177 202 212 195144141 126 116
44 68 117 148
G 03
Revenue, Segment Result and Segment Result Margin of the last twelve quarters
€ in millions in percent
1,200
1,000
800
600
400
200
0
30
25
20
15
10
5
0
Q1 2012 Q2 2012 Q3 2012 Q4 2012 Q1 2013 ¹ Q2 2013 ¹ Q3 2013 ¹ Q4 2013 ¹Q1 2011 Q2 2011 Q3 2011 Q4 2011
Revenue Segment Result Segment Result Margin
INFINEON TECHNOLOGIES ANNUAL REPORT 2013
GROUP MANAGEMENT REPORT – THE INFINEON GROUP24

Net income, free cash flow, return on capital employed and cash position
As a result of the lower Segment Result, net income also decreased, falling by approxi-
mately 36 percent from €427 million in the previous fiscal year to €272 million in the
2013 fiscal year.
Earnings per share both basic and diluted for the 2013 fiscal year amounted to €0.25,
a deterioration of 38 percent and 36 percent respectively compared to the previous year’s
figures of €0.40 (basic) and €0.39 (diluted).
Free cash flow from continuing operations (for definition: see chapter “Internal Manage-
ment System”) amounted to €235 million in the 2013 fiscal year, compared with a
negative figure of €219 million one year earlier. The sharp improvement was attributable,
among other things, to the fact that investments totaling €378 million were significantly
lower than in the previous fiscal year (€890 million). These investments could be funded
by the €610 million of cash inflows from operating activities of continuing operations.
The return on capital employed (RoCE) dropped from 22.3 percent to 14.1 percent, reflect-
ing the combined effect of the increased level of capital employed and lower income from
continuing operations. For a definition of, and details relating to, the calculation of RoCE,
see chapters “Internal Management System” and “Review of financial condition”.
The gross cash position (for definition: see chapter “Internal Management System”) totaled
€2,286 million as of September 30, 2013, approximately 2 percent up on the previous
year’s reported figure of €2,235 million. The principal items affecting this change were the
positive free cash flow from continuing operations on the one hand and cash outflows for
the dividend and capital returns program on the other.
The net cash position (for definition: see chapter “Internal Management System”)
increased by just over 2 percent to stand at €1,983 million at the end of the reporting
period (September 30, 2012: €1,940 million).
Dividend payment unchanged from previous year; previous capital returns
program ended and new program agreed by Supervisory Board
In accordance with our sustainable dividend policy, the dividend declared for the 2012 fiscal
year was kept at a constant level of €0.12 per share, despite the negative free cash flow in
that year. Accordingly, on March 1, 2013, one day after the Annual General Meeting, a total
amount of €129 million was distributed as a dividend.
A proposal shall be made to the shareholders at the Annual General Meeting on February 13,
2014 that a dividend of €0.12 per share should be paid for the 2013 fiscal year, unchanged
from the previous fiscal year.
The capital returns program, which had started on May 9, 2011, expired on March 31, 2013.
Over the course of this program, Infineon spent €212 million to repurchase own shares as
well as some of the subordinated convertible bonds due May 2014. The average price paid
per Infineon share (less premiums received) was €5.93, compared with the volume-weighted
average price in the XETRA trading system during the same period of €6.51. During the
2013 fiscal year, €38 million was used to repurchase own shares via put options. On
November 19, 2013, the Supervisory Board approved a new capital returns program of up
to €300 million. This can be used until September 30, 2015, in order to acquire shares or
repurchase outstanding convertible bonds due 2014. For details see chapter “Events after
the end of the reporting period”.
P see page 77
P see page 78 and 125
P see page 79
P see page 79
P see page 158
25INFINEON TECHNOLOGIES ANNUAL REPORT 2013
FINANCES AND STRATEGY
2013 FISCAL YEAR EXCEEDS EXPECTATIONS

GROUP STRATEGY
Three key decisions were taken in the 2013 fiscal year which will have a significant impact
on Infineon’s performance in the coming years. First, we will continue to focus on our target
markets (see following section), even though some submarkets did not, in all cases, show
the desired rate of growth. Second, we set the course for Infineon’s development strategy
and manufacturing infrastructure. And third, we decided on a new strategic direction:
“Product to System” (see later in this chapter).
Target markets
Infineon operates in four target markets, namely automotive electronics, industrial elec-
tronics, information and communications technology, and security. We address these four
target markets with our four core segments. The Automotive segment supplies semicon-
ductors for automotive applications. Demand for industrial electronics is primarily handled
by the Industrial Power Control segment. The Power Management & Multimarket segment
supplies products used in the information and communications technology sector. And the
Chip Card & Security segment ensures data security and user authentication via chip cards
and a host of new applications.
Our performance in these target markets is influenced first and foremost by prevailing
macroeconomic conditions. At the same time, each target market has many different facets
in its own right. It is therefore important to be well-positioned in each relevant submarket.
Even stagnating markets can generate above-average growth rates in some fields. The
following section discusses the principal factors that influence growth in each of our target
markets and highlights the areas and applications that are important for Infineon.
Automotive electronics
Worldwide demand for automotive-related semiconductors depends to a large extent on two
factors: vehicle production and the semiconductor content per vehicle. Global automobile
production remains a growth market, albeit subject to some regional shifts: manufacturing
volumes in the USA are recovering to their previous high levels; manufacturing in Europe
has been contracting for several years now, and should bottom out in 2013; China continues
to post the world’s fastest vehicle manufacturing growth rate; only Japan is likely to see
a slight drop in the number of vehicles produced, now that the distortions caused by the
natural disaster in Japan and the subsequent catch-up effect are no longer prevalent.
Adopting a more local approach is seen as the key to future success. The challenge here will
be to develop tailored product concepts at a local level, in particular for customers in emerg-
ing economies. Our aim is to participate in the rapid growth currently being enjoyed by
mid-price segments in these regions. In order to achieve the optimal cost level, a market
player needs both knowledge of proper system partitioning on the one hand and the
appropriate manufacturing technology on the other.
P see page 32
91.886.783.481.5
76.9
CAGR ¹ (2011 – 2015):
+ 4.5 %
20.519.719.119.320.2
17.516.816.215.413.1
24.522.320.518.617.6
14.213.1
12.612.811.5
8.0
7.1
8.2
6.6
9.0
6.0
9.4
6.0
7.9
6.6
G 04
Expected worldwide car production by region
in millions of units
Europe
North America
China
Asia excluding China
Japan
Other countries
2015 e2014 e2013 e20122011
1 CAGR = Compound Annual Growth Rate
Source: IHS, “Annual Light Vehicle Production
2007 – 2018”, updated October 2013
INFINEON TECHNOLOGIES ANNUAL REPORT 2013
GROUP MANAGEMENT REPORT – THE INFINEON GROUP26

The semiconductor value per vehicle will rise in the future: a.) in order to be able to comply
with increasingly strict CO₂ emission requirements; b.) as a result of more active and
passive safety features; and c.) on the back of the rising need for IT security solutions to
prevent manipulation and to ensure the secure transmission of data, both within the
vehicle and from/to the vehicle. We can offer system solutions to our customers to address
these new trends with Infineon’s complementary range of microcontrollers, sensors and
power components.
To date, sales of electric vehicles have fallen short of expectations. We have no doubt,
however, about the long-term success of electromobility, or more specifically, electric and
hybrid vehicles. The ever stricter CO₂ targets that are being set in all regions of the world
cannot be achieved without emission-free or low emission vehicles. For many automobile
manufacturers, other improvements to combustion engines will not be sufficient to achieve
the fleet averages for CO₂ emissions that are being prescribed by governments for 2020
and which in some cases will be less than 100 gram per kilometer. Infineon will benefit
from the rising value of semiconductors needed to control electric engines, irrespective
of whether the electric engine used in the alternative drive concept derives its power from
a battery or from a fuel cell.
Industrial electronics
Energy requirements, particularly electricity consumption, are bound to increase in the
future. Worldwide consumption of electric energy will almost double from 20.2 trillion
kilowatt hours in 2010 to 39.0 trillion kilowatt hours in 2040, corresponding to an average
annual increase of 2.2 percent, according to the U.S. Energy Information Administration.
The reasons are well-known: a growing world population, better standards of living, rising
levels of automation and the electrification of previously mechanical or hydraulic equip-
ment. Applications powered by electricity such as electric motors, consumer electronics,
home appliances or lighting need semiconductors to control the precise amount of electric
power consumed. Our products address many of these applications.
Approximately two thirds of industry’s worldwide electricity consumption is attributable to
electric motors, making them a major factor in terms of global electricity consumption as a
whole. Automation, including for example the use of electric motors in industrial equipment
such as drives or compressors, is increasing for a variety of reasons. This trend is partly
being driven by the higher wages now being paid in what had once been low-cost regions
(such as China’s coastal region). Where previously it would have been normal to use cheap
labor to move goods and carry out work, these tasks are now increasingly being performed
by robots and machines. In addition, new factories are being set up in regions where labor
costs are still low (such as in Western China).
We remain committed to the future of renewable energy. We forecast that this sector will
continue to expand, albeit at a slower rate than in the past, when growth rates in some
years were in excess of 20 percent. There are a number of reasons for this development.
Firstly, the times of high feed-in tariffs for solar power in many European countries are
over. Secondly, the proportion of power generated by wind and photovoltaic has already
reached an appreciable proportion of total electricity generation in many countries. The
next stages of expansion are expected to be not as dynamic as those of the early years.
Source: The International Council for Clean Trans-
portation. www.theicct.org
G 05
Emission targets of different regions
in gram CO₂ per kilometer
2010 2015 2020
200
180
160
140
120
100
80
2010 2015 2020
North America 190 160 121
China 180 167 117
Europe 140 130 95
Japan 128 125 105
27INFINEON TECHNOLOGIES ANNUAL REPORT 2013
FINANCES AND STRATEGY
GROUP STRATEGY

We nevertheless expect to see further growth with photovoltaic systems. Large open-space
plants in countries such as the USA, China, India, Japan, but also in the Middle East, are
creating new opportunities for the solar sector. The construction of new plants will, however,
result in an increase of average system size, away from the typically European phenomenon
of rooftop installations operating in the kilowatt range, to the large-scale ground-mounted
plants typical for the USA, China and India operating in the megawatt range. Our position
in China is a highly promising one. We work together with many leading Chinese inverter
manufacturers and during the past year, have expanded the scope of collaboration with the
Chinese market leader, Sungrow (see “Infineon and Sungrow expand cooperation in the
field of renewable energy” in the chapter “Research & Development”).
The market for wind turbines in the USA – which in 2012 accounted for almost one third of
the global market for newly installed wind turbines – will contract significantly in 2013,
partly reflecting the fact that government-funded stimulus programs are coming to an end
there too and also due to the fact that those measures had caused strong pull-in effects
in 2012. In the medium and long term, however, we forecast that the construction of wind
power capacities in the USA will return to growth. Similarly, the Chinese wind power market
is beginning to pick up after years of stagnation. We are now seeing the benefits of our many
years of collaboration with local wind turbine manufacturers, such as Goldwind. Moreover,
Europe as one of the largest markets should remain stable thanks to the replacement of older,
smaller wind power turbines with modern, more powerful systems at wind-intensive sites.
In the case of traction systems, another field of application of the Industrial Power Control
segment, the main focus of public interest is on high-speed trains. However, metro, regional
train and tram systems account for more than three quarters of all semiconductors used by
traction systems. Sustainable mobility between and within densely populated urban areas
is the driving force behind the expansion of public transportation systems. And last but not
least, for long-distance travel, high-speed trains fuel growth. China, as an example, contin-
ues to expand its infrastructure for high-speed trains.
Information and communications technology
Every electronic device needs a power supply. AC power from wall sockets is converted
into DC power, usually with lower voltages, depending on the specifications of the electronic
components used in the respective device. Specifications may differ significantly with
respect to power class, application profile, efficiency, available space and cost. Power
supply architectures, along with the semiconductor components we offer, are accordingly
highly diverse.
Regulatory standards stipulate increasingly high levels of efficiency for power supplies.
In other words, there is a relentless need to reduce power losses. Achieving these new
standards only by deploying more efficient components is unrealistic. Instead, new con-
cepts, such as digital control loops, provide maximum efficiency in all load ranges: full
load, partial load and stand-by. Infineon can master all major phases of the digital control
loop: control ICs (integrated circuits) with their optimized control algorithms, driver ICs
and power switches. The greater level of efficiency now required for power supplies can
only be achieved with the aid of higher-value power semiconductors.
In computers, digital control loops are used for AC/DC conversion in the power supply unit
as well as for DC/DC voltage control on the motherboard. Infineon offers solutions for both
types of conversion.
P see page 68
G 06
New installations 2012 of wind converters by region
39 %
28 %
28 %
5 %
EMEA
Americas
China
Asia-Pacific
excluding China
Source: IHS, “The World Market for
Wind Converters – 2013 Edition”, July 2013
INFINEON TECHNOLOGIES ANNUAL REPORT 2013
GROUP MANAGEMENT REPORT – THE INFINEON GROUP28

Supplying components for servers remains a growth market for us, both in terms of units
sold and the value of semiconductors per server. In other computer segments, market shifts
are taking place. With PCs and notebooks losing momentum, we intend to profit from the
booming market for mobile devices, that is, smartphones and tablets. We are currently
making inroads into the market for chargers and fast chargers in the 10 to 50 watt class
with a range of new products and solutions.
With growth rates of up to 35 percent per annum, mobile devices like tablets constitute
a highly interesting market segment. Market researchers forecast that 932 million smart-
phones and 184 million tablets will be sold in 2013. This would mean that tablet sales
would overtake PC sales for the first time. Especially in emerging economies, the first
“computer” for many people is an inexpensive tablet.
In addition to supplying components for chargers, we also supply components used inside
mobile devices. In this area, we focus primarily on radio-frequency (RF) components such
as CMOS-RF-switches and GPS signal amplifiers as well as chips for silicon microphones,
making full use of our RF design know-how and specialized frontend and backend manu-
facturing technologies.
Security
Classic chip card applications still offer promising opportunities for growth. In the field
of mobile communication, we are focused on SIM cards with larger memory sizes. We also
see potential for growth with new applications such as machine-to-machine communica-
tion and SIM cards with NFC (Near Field Communication) capabilities. In the area of
payment cards, we are benefitting from the transition from magnetic stripe cards to chip-
based cards. Whereas demand for purely contact-based, chip-based payment cards is
hardly showing any increase, the market for contactless cards (i.e. cards which transfer
data to and from the card reader by radio signal) and for dual interface cards – with both
contact-based and contactless interface – is growing rapidly. An average annual growth
rate of 50 percent is predicted for the years 2012 to 2016 by market research firm IHS.
Our business with governmental ID documents – comprising mainly electronic passports,
identity cards, driving licenses and health insurance cards – continues to benefit from
the transition to chip-based cards. Highly populous countries such as Brazil, India, Japan,
Russia and Turkey are progressively introducing electronic identification documents.
Multi-application cards (that is government identification documents with additional uses
for applications such as payment or local public transport ticketing) are becoming increas-
ingly popular.
New application fields offer further potential. In all of these cases, the traditional format of
the plastic card is being replaced by the common chip packages. Examples of new applica-
tions are security elements in smartphones, trusted platform module chips in laptops and
PCs, digital tachographs (in collaboration with the automotive supplier Continental) and
authentication of consumer electronics accessories and of original spare parts such as
printer cartridges or rechargeable batteries for digital cameras.
In a connected world, security stands to become more and more important. It is essential
that confidential data held in data centers and applications (such as cloud computing) and
critical infrastructure systems (such as smart grid) cannot be manipulated or stolen. We are
also experiencing a rising demand for security functions in microcontrollers, both in auto-
motive and industrial applications. More and more customers are looking for ways to protect
their intellectual property. This includes their software as well as the parameters stored,
for instance in engine control systems. The security functions built into our products help
prevent protected data from being read or altered, thus avoiding the risk of manipulation.
G 07
Expected growth of tablets
in millions of units
1 CAGR = Compound Annual Growth Rate
Source: Gartner, “Forecast: Desk-based PCs,
Notebooks, Ultramobiles, and Tablets,
Worldwide, 2011 – 2017”, 3Q13 update,
September 2013
The bar chart aggregates the data contained in
the above source for the tablet sub-segments
“Utility Tablets”, “Basic Tablets” and “Premium
Tablets” as defined by Gartner.
398
2016 e
331
2015 e
263
2014 e
184
2013 e
120
2012
CAGR ¹ (2012 – 2016):
+ 35.0 %
G 08
Expected growth of payment and banking cards
in millions of units
Contactless and dual interface
Contact-based
2016 e2015 e2014 e2013 e2012
CAGR ¹ (2012 – 2016):
+ 50.5 %
1 CAGR = Compound Annual Growth Rate
Source: IHS, “The World Market for Payment and
Banking Cards – World – 2013”, August 2013
2,434
475
29INFINEON TECHNOLOGIES ANNUAL REPORT 2013
FINANCES AND STRATEGY
GROUP STRATEGY

Manufacturing strategy
The challenges involved in the development and manufacturing of semiconductors have
increased significantly in recent years. New approaches are needed to achieve further
advances in product performance on the one hand and to improve productivity on the other.
These challenges stem not only from the rising complexity of the technologies and manu-
facturing processes involved, but also the ever-increasing cost of personnel, materials and
energy. The pace of development is tailing off, and the measures previously deployed to
increase productivity will no longer be sufficient to compensate for cost increases.
We will tackle this challenge by shifting away from local optimization to optimization based
on a holistic approach. In the future the process of optimization will be engineered across
all relevant business functions within the entity – product definition, product development
as well as in-house and outsourced manufacturing. With this new approach, we see oppor-
tunities to improve productivity, accelerate the development process and, last but not least,
increase the proportion of development projects completed successfully.
This concept requires a new type of collaboration across the various functions within the
organization, thus raising the bar in terms of how efficiently we work together. We are now
seeing the first positive results and are confident that this expertise in the management
of complex processes will constitute another area of differentiation for us in the long run.
In-house manufacturing and differentiation from competition
Infineon’s manufacturing strategy is based on the principle that in-house manufacturing
must always make a difference in terms of costs and/or performance. Otherwise we would
rather outsource. This principle is applied equally to frontend and backend manufacturing.
In the case of frontend manufacturing, the result of this principle is that it is generally
considered preferable to produce power semiconductors and sensors in-house. The same
conclusion is reached for a whole host of products, which combine analog and digital
switching components on a single chip (so-called “Analog/Mixed-Signal” components);
this applies even more so if the analog switching elements are required to control high
voltages and currents. One good example where in-house manufacturing makes a genuine
difference is the manufacturing of thin wafers involving technologies as well as epitaxy
and metallization, which are primarily used in the manufacturing of power semiconduc-
tors. Our know-how in these areas allows Infineon to use innovative technologies with an
excellent cost/benefit ratio.
By contrast, we work together with external partners where manufacturing is based on
CMOS manufacturing technologies. This relates to the vast majority of our products based
on 90-nanometer technology, and to all components based on 65-nanometer technology
and on 40-nanometer technology (see “Development and manufacturing cooperation for
40-nanometer manufacturing technology signed” in the chapter “Operations”).
In the case of packaging and chip testing (so called backend manufacturing), we collabo-
rate with a number of market leading partners, depending on package type, in order
to ensure access to additional capacities, and hence win the flexibility to better handle
phases of fluctuating demand.
G see glossary, page 286
P see page 73
INFINEON TECHNOLOGIES ANNUAL REPORT 2013
GROUP MANAGEMENT REPORT – THE INFINEON GROUP30

300-millimeter thin-wafer manufacturing technology: the right decision
As a renowned market and technology leader, Infineon is currently playing a pioneering role
in the field of power semiconductors. To date, Infineon is the only company in the world to
produce power semiconductors on 300-millimeter thin wafers. This manufacturing technol-
ogy is available at our sites in Villach (Austria) and Dresden (Germany) (see “Volume produc-
tion based on 300-millimeter thin-wafer technology commenced” in the chapter “Research
& Development”). In our implementation of 300-millimeter thin-wafer manufacturing for
power semiconductors, we are guided by three strategic objectives:
> Laying the foundation for long-term growth.
Investment in 300-millimeter thin-wafer manufacturing directly increases manufacturing
capacities for our power semiconductors. Indirectly, however, investment in 300-millimeter
thin-wafer manufacturing also creates additional capacities for other products. This is
because transferring manufacturing of high-volume components from 200-millimeter lines
to the 300-millimeter lines frees up capacities for other components at Infineon’s exist-
ing 200-millimeter power semiconductor frontend sites in Villach (Austria) and Kulim
(Malaysia).
> Reducing the amount of capital employed per chip.
Manufacturing capacities can be expanded with lower investment volumes using
300-millimeter technology. Experience shows that it takes 30 percent less capital on
average to build up additional manufacturing capacity to a desired level on a 300-milli-
meter manufacturing line than it does on a 200-millimeter manufacturing line. There
is also the advantage that less cleanroom space is needed due to the smaller number
of manufacturing machines required.
> Increasing productivity.
More specifically, we expect to achieve a 20 to 30 percent reduction in frontend unit
costs once the relevant frontend manufacturing facilities are ramped into volume
production, thus ensuring our competitiveness in the future.
Technological change on this magnitude – in this case the move to larger wafer diameters,
particularly for power semiconductors – only takes place once every 10 to 15 years in the
semiconductor industry. Only the largest manufacturers will be able to achieve the high
volumes required to operate such frontend manufacturing facilities at the scale and utiliza-
tion levels necessary to secure unit cost advantages. As the undisputed market leader in
the field of power semiconductors, Infineon is optimally positioned in this respect.
However, during the years taken to develop 300-millimeter thin-wafer manufacturing
technology, and now during the ramp-up phase, volumes have not been, and are still not,
sufficient to cover the high level of R&D expense and investment in factory buildings/
equipment required. A few years are likely to pass before the productivity improvements
discussed above can be realized. Currently, at the beginning of the ramp-up phase, our
investment in 300-millimeter thin-wafer manufacturing technology, and the resulting
depreciation expense, is costing us up to nearly 1.5 percentage points in gross margin.
In the 2012 and 2013 fiscal years, the corresponding expense was approximately €20 mil-
lion and in excess of €50 million respectively, on revenues totaling €3.90 billion and
€3.84 billion respectively. The gross margin will, however, rise continually as capacity
utilization of our 300-millimeter manufacturing equipment increases. We expect to achieve
a gross margin of over 40 percent based at full capacity utilization levels at all sites,
including the 300-millimeter manufacturing site in Dresden (Germany).
P see page 64
31INFINEON TECHNOLOGIES ANNUAL REPORT 2013
FINANCES AND STRATEGY
GROUP STRATEGY

Optimize development processes; reduce manufacturing complexity
Reacting swiftly to changing market needs is particularly important in our sector. We
therefore intend to improve in terms of Research and Development turnaround times, by
developing products in a goal-oriented manner before handing them over to stable manu-
facturing processes. Our target is to be one of the first to be able to service the market.
The following measures will help us achieve this target:
> We aim to reduce manufacturing complexity. Many individual measures taken to optimize
technologies and products have resulted in a multitude of processes, which do not
always foster an efficient manufacturing landscape. This process diversity makes it
difficult to raise productivity. We are now launching a program to reduce complexity by
harmonizing processes as far as possible with a view to improving the productivity of
our machines and to achieving further improvements.
> We intend to optimize the development process along the entire value-added chain.
Technologies are becoming more complex and the interaction between frontend and
backend manufacturing processes, that is silicon chip and packaging technology, is
increasing. Not long ago, these different aspects could mostly be developed separately.
In future, it will be necessary to apply a holistic approach right from the beginning, includ-
ing technological and product definition as well as all aspects of future manufacturing.
In this way, we will be able to create a more efficient manufacturing landscape for today’s
products and achieve the right balance between technology, manufacturing and pace of
development.
New strategic direction: “Product to System”
Infineon is not only successfully mastering the cycles of the semiconductor industry – we
are also going one step further and are shifting the focus of our activities: away from a
product-centric, towards a system-centric approach. What does this mean? We have devel-
oped many leading technologies and products with our wealth of technical expertise. In
future, we will not only build on this technological expertise, we will also endeavor to
increase our understanding of the success factors for our customers. What is the rationale
for this change?
We are finding that development costs for certain products are rising disproportionately
fast. In other words, the additional customer benefit generated by any given amount used
to further develop semiconductor products is decreasing. Some products are reaching the
stage where the same measurable improvement in characteristic properties can only be
achieved by a significantly higher level of Research and Development expense (see green
line in the graph).
It was recognized at an earlier stage that the customer not only benefits from improvements
to individual semiconductor components, but also from the carefully arranged combination
of a number of components. Examples of such combinations are a power transistor and
its specifically optimized driver IC, mounting various components in a single package
(System-in-Package) or monolithic integration of various functions in one IC (System-on-
Chip) (see blue line in the graph).
see graphic G 09, page 33
see graphic G 09, page 33
INFINEON TECHNOLOGIES ANNUAL REPORT 2013
GROUP MANAGEMENT REPORT – THE INFINEON GROUP32

Both of these trends – the further development of individual components on the one hand,
and of combinations of individual components on the other – will continue to be pursued
by Infineon as they still offer plenty of opportunities which, as a market participant with
leading manufacturing technologies, we will exploit. We must now take the next important
step, but what will this involve?
The new approach: “Product to System”
We want the customer’s system to take center stage. We believe that we will only enjoy
success in the long-term if the customer is successful, either with us or because of us. Gain-
ing an understanding of systems is key to understanding the products that our customers
are likely to develop going forward. In the future, we will not only develop and improve
future generations of our products from our own perspective, but also we will endeavor to
see things from the customer’s perspective based on an understanding of their systems and
our wealth of know-how about semiconductors, constantly seeking to find better solutions
to meet customer needs (see red line in the graph).
It will no longer be the semiconductor component as such that is in focus, but rather the
customer’s application, which we will endeavor to improve by deploying our expertise in
the development and manufacturing of semiconductors. We are therefore opening a new
chapter in Infineon’s history, entitled “Product to System”.
“Product to System” – or put another way: “From product thinking to system understand-
ing” – means developing a good understanding of a system in order to know the right
products and offer the right level of service. We will keep finding new answers to the
following questions:
> Do our products create a competitive advantage for our customer? Do they generate
greater success in the market? Do they include flexibility in all aspects such as time-to-
market and product and performance costs depending on how highly the customer
values these factors?
> Can we, in the long-term, offer solutions which the customer has not yet contemplated?
Can we take potential solutions to a new level by applying our semiconductor know-how?
> How can we provide customer support on-site – from selecting the right semiconductor
components through to developing the customer’s application?
> Is it easy for the customer to use our products?
see graphic G 09, page 33
G 09
Single semiconductor components are reaching a high level of maturity. A further appreciable source of benefits for the customer is now coming from system-centric solutions
Time
Benefit for the customer
Efficiency
System improvement
Component
System-in-Package
or System-on-Chip
Application-centric
System-centric
Component-centric
System
33INFINEON TECHNOLOGIES ANNUAL REPORT 2013
FINANCES AND STRATEGY
GROUP STRATEGY

It is not only about offering our products at the most attractive price but creating heightened
value for our customer. Our products might end up being more expensive, but the customer
will then realize savings with a whole range of other components or in operating costs,
because we would have helped them to optimize the overall system or performance or both.
The two prerequisites are: a deep understanding of systems and outstanding know-how
of semiconductor technologies. Armed with these two skills, it is much easier to achieve
greater integration of functionalities. At the end of the day, this is the vital factor for deliver-
ing value for money and is usually the decisive criterion for selecting a supplier.
The degree of competition among our customers – in other words all industries that are
behind the semiconductor industry in the added-value chain – is rising. Customers’ prod-
ucts need something that differentiates them from the rest. For example: time-to-market,
more efficient use of energy, lower manufacturing costs, more compact design, lower
weight, longer service life and greater reliability.
Why is Infineon in a pole position to adopt this approach? Infineon’s product portfolio
consists primarily (more than 80 percent of revenue) of sensors, microcontrollers and
power semiconductors. This covers the three elements of the closed loop system: measur-
ing, controlling, actuating – “measuring” with sensors, “controlling” with microcontrollers
and “actuating” with power semiconductors. Closed loop systems are key to complex
systems. With its product portfolio, Infineon is well positioned to think at a system level.
Our product portfolio and wealth of experience with the markets we target provide the
ideal starting point for our new approach.
Where are we today?
Adopting the “system concept” may involve different measures or a different pace of
transition for each of our four segments – depending on market, customer, application and
prevailing conditions. Below we show examples of different aspects of the tasks we may
encounter on the way from “Product to System”: product development, collaboration with
business partners and knowledge transfer between our employees.
> We have developed a highly integrated chip for the Asian automobile market for engine
management used primarily to drive the motorcycles and three-wheelers that are so pop-
ular in Asia. The chip integrates voltage regulation, interface functionality which enables
communication with a microcontroller and drivers for power transistors, all on a single
piece of silicon. The success of these components depended on having an overall under-
standing of the target application, so that we could decide which functions could be
integrated on the chip, which manufacturing technology should be used and what the
cost would be. It was crucial in this case to get the partitioning right. The outcome was a
“System-on-Chip”, which allows our customers to build a compact engine control unit
with just a few components.
INFINEON TECHNOLOGIES ANNUAL REPORT 2013
GROUP MANAGEMENT REPORT – THE INFINEON GROUP34

> Thanks to our many years of experience with power supplies on motherboards, we
understood what matters from the outset: small structures, keeping the number of passive
components (including resistors, capacitors and inductors) to a minimum, highly dynamic
switching concepts and a centralized control system, i.e. the ability to communicate with
the system as a whole. In the end, we developed a set of digital control ICs which can
work extremely efficiently with our power components. The power stages constitute small
multi-chip modules, assembled using a brand new technique, thus maximizing the
efficiency of the power semiconductor technologies employed. After providing compre-
hensive design support at the customer’s laboratories, it was possible to realize the
potential of these products in a short space of time (see “Blade: innovative, chip-
embedded packaging technology for DC/DC conversion“ in the chapter “Research and
Development”).
> Ensuring the appropriate supply of power also includes AC/DC conversion within the
power supply unit. Every application has different specifications and requires specialist
knowledge of the application’s structure and load profile. In order to develop highly
efficient power supplies for telecommunications and computing infrastructures, we are
collaborating with Huawei Technologies Co. Ltd., with whom we have opened a joint
research and development laboratory in China. Working in partnership with our customers
in jointly-used development facilities is also part of our “Product to System” strategy.
> The group-wide learning platform “PMM Power & RF Academy” was launched in October
2012 to ensure that the required knowledge is disseminated throughout Infineon. This
Intranet-based platform enables all employees worldwide – in particular those working
in sales, marketing and application development within the Power Management &
Multimarket segment – to expand their technical competence. The new approach of
thinking in terms of applications rather than products requires employees to build up
and share knowledge with colleagues. We will therefore step up our efforts to encourage
knowledge transfer among employees.
To summarize: With our “Product to System” strategy, we are adding a new, third pillar
alongside our development competence and manufacturing technology competence:
system competence. This new approach, which will enhance the way we differentiate
ourselves from the competition, will take our company to a new level, thus ensuring
Infineon’s long-term competitiveness and profitability.
P see page 66
G 10
Infineon’s competitiveness and profitability ensured by the addition of a third pillar: System competence
Development
competence
Manu-
facturing
technology
competence
System
competence
35INFINEON TECHNOLOGIES ANNUAL REPORT 2013
FINANCES AND STRATEGY
GROUP STRATEGY

THE SEGMENTS
INFINEON TECHNOLOGIES ANNUAL REPORT 2013
GROUP MANAGEMENT REPORT – THE INFINEON GROUP36

Energy efficiency
Energy efficiency plays a key role in today’s society. The global hunger for energy
is constantly growing with the size of the world’s population and electricity is
becoming the most important source of this energy in the 21st century. Electricity
is becoming increasingly important, as it can be cheaply and quickly transported
and has the ability to power a wide variety of devices, from high-speed trains to
cell phones.
The supply of fossil fuels traditionally utilized to meet our energy and electricity
requirements is set to decline in the foreseeable future, which means that alter-
native, renewable sources of energy definitely need to be tapped. At the same
time it is absolutely essential to reduce or at least restrict the increase of carbon
dioxide emissions. Improving the efficiency of electrical devices is one of the
best ways of achieving this aim.
The semiconductors developed and manufactured by Infineon make it possible
to generate electricity from renewable sources of energy. Moreover, they help
boost efficiency at every link in the supply chain of the energy industry: not only
at the generation and transmission stages, but also where electric power is
used. They form the basis for the intelligent, optimal use of energy in industrial
applications, in power supplies for computers and consumer electronics and
also in the cars we drive.
Mobility
Human mobility requirements are another major challenge modern society is
currently facing. This is true for both individual mobility and mass transit systems.
Carbon dioxide emissions also need to be limited at the same time.
Infineon supplies semiconductor solutions for the automotive industry and for
a broad range of traction (rail) systems, ensuring low-emission mobility for the
general public, both within metropolitan areas and between cities. We strive to
develop increasingly compact solutions for high-speed and metropolitan trains,
electric and hybrid vehicles, vehicles with combustion engines, and even electri-
cally powered two-wheelers, enabling us to offer our customers greater function-
ality in an ever-shrinking footprint.
Security
Data security has become an essential requirement in today’s society – and
crucial for sustained consumer confidence and economic success due to the
widespread use of electronic devices that are connected with information networks.
The trend towards stricter security initially emerged in the areas of financial
transactions, government-issued identity documents, telecommunications, and
trusted computing. The fields of industrial and automotive application systems
now also perceive a growing need to protect themselves from threats that can
endanger personal safety, the ability of companies to function efficiently or even
national security interests.
Infineon focuses on three major challenges modern
society is facing: energy efficiency, mobility and security.
All three hold the promise of healthy growth for Infineon
in the long term.
37INFINEON TECHNOLOGIES ANNUAL REPORT 2013
THE SEGMENTS

Electromobility
Striving to create optimal system solutions, Infineon collaborates with vehicle
manufacturers and partners from the automotive supply industry.
The BMW i3 (see picture) generates a peak output of 125 kilowatts, controlled by our
HybridPACK™ 2 IGBT module and our 32-bit TriCore™ microcontroller architecture.
Active safety systems
Advanced driver assistance systems use sensors to monitor the vehicle’s surroundings.
They assist the driver in various situations and contribute towards greater safety.
For example, distance warning systems developed by Bosch work with our 77-gigahertz
radar transceiver module in order to measure the distance to other vehicles.
INFINEON TECHNOLOGIES ANNUAL REPORT 2013
GROUP MANAGEMENT REPORT – THE INFINEON GROUP38

Revenue €1,714 million,Segment Result €167 million.
CO₂ targets for 2020 only feasible with greater electrification.
Increasing connectedness of vehicles demands stricter information security.
The Automotive segment in the 2013 fiscal year
Revenue
Infineon recorded revenue of €1,714 million for the Automotive segment in the 2013 fiscal
year, a moderate improvement of 3 percent over the previous year’s figure of €1,660 mil-
lion. The segment generated 44 percent of Infineon’s revenue.
Over the course of the fiscal year, it was the high volume of vehicles sold in China and
North America in particular that compensated for the continuing weakness of markets in
Europe, a phenomenon that originally started in Southern Europe and has meanwhile
spread to other countries in the region.
In the first quarter, the generally cautious market assessment of the car industry, coupled
with inventory adjustments in the automotive supply chain, led to a decline in revenue. How-
ever, these inventory adjustments were partially compensated for during the March quarter.
The third quarter saw business gain a certain degree of momentum. Production figures
grew worldwide and the German car industry – particularly the premium car manufacturers
– began reporting good sales figures on the back of stable demand from overseas markets.
Past experience shows that business tends to be somewhat slower in the September
quarter, due to lower production levels caused by factory shutdowns in summer. This year,
however, their impact was somewhat weaker, as some of the German and American
carmakers shortened their summer breaks in order to keep pace with growing demand.
Segment Result
The Segment Result amounted to €167 million, 24 percent down on the Segment Result of
€219 million posted one year earlier. The Segment Result for the first half of the 2013 fiscal
year was impacted negatively by the higher cost attributable to manufacturing capacities
not being fully utilized. The situation was exacerbated by generally rising manufacturing
costs, including higher amortization and depreciation and increased operating expenses
(particularly in the field of Research and Development). In the second half of the year, how-
ever, improved revenue enabled a Segment Result Margin to be achieved that was at the
same level as that recorded in the corresponding period one year earlier.
Regional revenue split
There were no significant changes in the regional revenue split compared to the previous
year. The share attributable to Europe fell by 1 percentage point. The share of the Asia-
Pacific (including Japan) region increased by 1 percentage point. 27 percent of revenue
was attributable to distribution customers (2012 fiscal year: 29 percent).
G 11
Revenue and Segment Result of the Automotive segment
€ in millions
Revenue Segment Result
1,660
219
1,714
167
2012 2013
G 12
Automotive segment revenue by region
25 %
23 %17 %
35 %
Germany
Europe (excluding
Germany),
Middle East, Africa
Americas
Asia-Pacific,
Japan
AUTOMOTIVE
39INFINEON TECHNOLOGIES ANNUAL REPORT 2013
THE SEGMENTS
AUTOMOTIVE

Product range, applications
Infineon is one of the few semiconductor manufacturers for automotive applications that
covers the most important applications in vehicles, with a broad product portfolio of micro-
controllers, intelligent sensors, transmit and receive ICs for radio-frequency applications
and radar as well as both discrete and integrated power semiconductors: powertrain,
chassis and comfort electronics as well as driving safety applications. Coupled with a high
level of quality, this comprehensive range of products has made us a preferred partner
for our customers for over 40 years.
Our development strategy focuses on the integration of functionality and thus on semicon-
ductor solutions with an excellent price-performance ratio. We see the main focus of
our activities in improving energy efficiency, providing greater driving safety and in the
fast-growing low-cost car segment.
We generate more than one third of our segment revenue with semiconductor components
for powertrain applications. For vehicles powered by combustion engines, these include
the engine and transmission controls, alternator and start-stop system as well as fuel and
water pumps. In the field of electric and hybrid vehicles we are involved in producing control
systems for electric motors with microcontrollers, power semiconductors and sensors.
A further one third of revenue is attributable to vehicle chassis and comfort electronics,
including controls for the blower, fan, suspension, air conditioning, sunroof, electric
windows, windshield wipers and central locking system as well as lighting controls for low
beam, high beam, rear light, indicator and interior lighting.
Safety applications for passengers and other road users make up around one quarter of
our revenue. The main focus of our products is on airbags, electronic power steering (EPS),
ABS/electronic stability control (ESC), electronically controlled suspension systems, tire
pressure monitoring and advanced driver assistance systems for regulating both distance
and speed.
Markets and trends
In the world of vehicle electronics we see three major trends emerging over the next few
years: Firstly, worldwide efforts to meet the carbon dioxide emission targets set for the
year 2020; secondly, the increasing market penetration of advanced driver assistance
systems as well as active safety systems and thirdly, the increasing connectedness of the
vehicle. When tackling these complex developments, which involve the entire vehicle,
we can make successful use of our existing system know-how.
Worldwide carbon dioxide targets only feasible with electrification
Carbon dioxide emissions caused by road traffic are supposed to be reduced by some
30 percent in many regions of the world by 2020 – down to levels of around 100 grams of
CO₂ per kilometer. Presumably, these targets cannot be met solely by improving the effi-
ciency of the combustion engine. On the one hand it is necessary to increase the electrical
control of formerly hydraulic or mechanical units, as these can then be more precisely
adjusted to demand, and on the other hand it is crucial to increase the number of electric
and hybrid vehicles on the road, in order to lower the fleet average of many carmakers to
meet required target levels.
> Product range
Bus interface devices
(CAN, LIN, FlexRay)
Discrete power semiconductors
IGBT modules
Magnetic sensors
Microcontrollers (8-bit, 16-bit,
32-bit) for automotive and
industrial applications
Power ICs
Pressure sensors
Software development
platform DAVE™
Voltage regulators
Wireless transmit and
receive ICs (RF, radar)
> Applications
Powertrain
Alternator
Engine control
Start-stop system
Transmission control
Electric and hybrid vehicles
Battery management
Charger
Motor control
Chassis and comfort electronics
Air conditioning
Door electronics
Electrical seat adjustment
Electronic control units
Lighting
Power windows
Steering
Sunroof
Suspension
Windshield wipers
Safety
ABS
Advanced driver
assistance systems
Airbag
Electronic power steering
Electronically controlled
chassis suspension
ESC (electronic stability control)
TPMS
(tire pressure monitoring system)
INFINEON TECHNOLOGIES ANNUAL REPORT 2013
GROUP MANAGEMENT REPORT – THE INFINEON GROUP40

Examples for the electrification of combustion engine-powered vehicles are electronic power
steering and the replacement of hydraulic pumps with electric pumps. Fans driven by the
fanbelt will soon be electronically controlled and unregulated blowers will be engine speed-
controlled. These enhancements of the mechanical, hydraulic and electronic functions
will boost vehicle efficiency and will therefore reduce CO₂ emissions. From Infineon’s point
of view this trend will both increase demand for power electronics and also for microcon-
trollers and sensors.
Conventional 12-volt electrical systems are not capable of handling the additional electrical
output required by the electrification of former hydraulic power units. With the help of
components developed by Infineon, it has been possible to improve the efficiency of 12-volt
alternators over the last few years. However, conventional systems reach their limits at an
output of 3 kilowatts. A new 48-volt system could well be the answer. The 48-volt alternator
is capable of providing up to 10 kilowatts of output, which would also enable cars in the
low- and medium-cost price segments to be developed to include hybrid functionality, in
turn creating potential to reduce carbon dioxide emissions further. The market launch is
scheduled for 2016. Infineon provides the power transistors suitable for developing these
systems. Further components required for 48-volt electrical systems, such as power ICs,
DC/DC converters and driver ICs, are currently being developed.
In the fields of powertrain and vehicle safety – two applications in which electrification plays
a major role – Infineon was awarded a major new business during the 2013 fiscal year
with a volume totaling several hundred million euros over the lifetime of the project, start-
ing in 2015. A number of globally leading manufacturers of safety electronics for airbags,
brakes and electronic power steering systems opted for our new AURIX™ 32-bit multicore
microcontroller family, for power supply components and bridge drivers for controlling
electric motors.
Infineon introduces radar-based distance measurement to the mass market
One particularly pleasing trend is noticeable across nearly all regions of the world: the number
of road fatalities has been steadily decreasing for a number of years, which is very much
due to the increased use of safety systems. However, passive safety systems are gradually
reaching the limits of their effectiveness. Firstly, their technical potential is practically
exhausted and passenger protection has meanwhile achieved a very high standard. Sec-
ondly, passive safety systems have already reached quite a high degree of market penetra-
tion even in compact cars.
The next major growth market is that of active safety systems, which are mostly to be found
in premium vehicles at present, but also increasingly in medium-sized cars. Examples of
active safety systems are autonomous emergency braking systems for pedestrian protection
and automatic distance and speed control.
At the beginning of 2014, autonomous emergency braking systems will be listed in the highly
regarded Euro NCAP (New Car Assessment Program) requirements catalog. Active pedes-
trian protection systems are set to follow in 2016. Without these safety systems it will be
practically impossible to achieve the coveted 5-star assessment. Carmakers – particularly
in the medium-sized car segment – attempt to get one step ahead of competition by
achieving a high NCAP assessment.
Active safety functions are considerably more complex than their passive counterparts and
the verifiability of functional safety of both components and systems in accordance with
the specially created ISO 26262 standards is becoming increasingly important. System
knowledge is a core element in developing new semiconductors for vehicle safety appli-
cations. Infineon has various microcontrollers, sensors and power semiconductors in its
portfolio, which our customers use to develop ISO 26262-qualified systems for these
sophisticated applications.
G see glossary, page 288
41INFINEON TECHNOLOGIES ANNUAL REPORT 2013
THE SEGMENTS
AUTOMOTIVE

Infineon supplies a 77-gigahertz radar transmit-and-receive component (see picture) for
distance measurement systems. Its manufacture in silicon-germanium technology and the
subsequent implementation in a highly compact radar-capable package has reduced system
costs and thereby has brought radar-based distance measurement to the mass market.
Numerous major suppliers from Europe and Asia have already decided to install this radar
component and a further component for 26-gigahertz applications (such as for blind spot
detection) in radar-based advanced driver assistance systems. Moreover, our AURIX™
family of 32-bit multicore microcontrollers was selected for use in these customers’ systems.
Information security indispensable in vehicles of the future
Vehicles are beginning to get connected. Whether for Internet services, navigation, traffic
reports, the automatic recording of toll fees or when updating software at your service
station – communication always takes place between the vehicle and a communications
network (car-to-infrastructure). The opening of the vehicle towards the outside world is
being done with increasing frequency via radio functions, FM services and applications.
In future, for example with (partially) autonomous driving, car-to-car communication will
become increasingly widespread.
This involves risks, as it offers hackers the opportunity to influence vehicle data traffic and
thus tamper with certain functions. The communication between the control units, includ-
ing functions critical for safety such as brakes and steering systems, needs to be safe
and secure. The safety of the vehicle and its passengers on the one hand, and information
security on the other, cannot be viewed as separate issues. The vehicle is becoming a
“connected computer on four wheels”.
A further safety aspect is protection against tampering (e.g. tuning protection). Fraud
(speedometer manipulation, engine manipulation) and theft (central locking system,
immobilizers) need to be prevented. Furthermore, an increasing number of automotive
suppliers require authentication of original spare parts and software developers are
calling for protection of their intellectual property from illegal copying.
This means we can expect the demand for information security to grow. We predict that by
the end of this decade every new car produced will be equipped with information security
features. Infineon sees itself as ideally positioned for this development, as we have a
wealth of experience, both in developing microcontrollers for automotive applications and
in the field of IT security due to the security expertise gained in the Chip Card & Security
segment. Our portfolio of microcontrollers and scalable security functions enables us to
develop a tailored solution in line with the customer’s security and cost requirements.
For example, we are integrating a hardware security module in our AURIX™ 32-bit multicore
microcontroller family. Microcontrollers equipped in this way can be used for passenger
safety, convenience and powertrain applications. Moreover, in addition to microcontrollers,
we see growing demand for discrete security controllers in the fields of infotainment,
emergency call systems and car-to-car communication.
Discrete security controllers made by Infineon are already being used in various car mod-
els. The SIM cards currently installed in cellular telecommunications modules in cars are
qualified in accordance with the AEC (Automotive Electronics Council) Q100 standard and
therefore fulfill the strict product quality requirements of the automotive industry. Addi-
tionally, security-certified security controllers are already being installed in tachographs.
> Silicon-germanium-based 77-gigahertz radar transmit-and-receive component for distance measurement
INFINEON TECHNOLOGIES ANNUAL REPORT 2013
GROUP MANAGEMENT REPORT – THE INFINEON GROUP42

Market position
The world market for automotive semiconductors grew moderately in the 2012 calendar
year. According to analyses by market research institute Strategy Analytics, the market
reached a size of US$23.9 billion; a growth of 2 percent compared with the previous year’s
figure of US$23.4 billion. Infineon remained ranked number two worldwide, however with
only 9.1 percent market share after registering 9.7 percent in the previous year. The five
largest competitors held 44 percent of the market.
The following events impacted the automotive semiconductor market in the 2012
calendar year:
> The continued weak level of car production in Europe had a negative effect on local
semiconductor manufacturers. At US$8.04 billion, the largest regional market in the
world contracted by 2.2 percent. Infineon generated around 50 percent of its revenue
for the Automotive segment in Europe and was therefore impacted by the drop in
demand. With 13 percent market share, Infineon is market leader in Europe.
> Apart from the weaker home market in Europe, currency effects between the US dollar
and the euro negatively affected our revenue performance.
> The catch-up effect in the wake of the Fukushima disaster in 2011 led to very high car
production figures in Japan. The Japanese automotive semiconductor market’s growth
of 9.4 percent in 2012 was the strongest of all regions, reaching an overall size of
US$5.7 billion. With 3.7 percent market share, Infineon remains the largest foreign
semiconductor supplier for the automotive industry in Japan.
> Infineon affirmed its number 2 position on the North American market. At 8.4 percent,
our market share remained virtually unchanged.
> For the first time, Infineon was number one in the extended Asia-Pacific region, including
further countries (for definition and market shares see graph). In this enlarged region,
Infineon’s market share improved from 9.0 percent to 9.4 percent. This placement is
largely due to our outstanding position on the Korean market. In Korea, we are by far the
number one supplier, with a market share of 13.7 percent. Our many years of coopera-
tion with Hyundai and Kia in this market are paying off.
If we segment the automotive semiconductor market by product group, the following facts
can be determined: with a 24.5 percent market share, Infineon remains market leader for
power semiconductors. In the field of sensors, Infineon has a 15.4 percent market share
and remains in second place. For microcontrollers, Infineon’s position at third place
remains unchanged, with an 8.1 percent market share.
G 14
World automotive semiconductor market share
Renesas
Infineon
STMicro-
electronics
Freescale
NXP
14 %
9 %
8 %
7 %
6 %
Source: Strategy Analytics, “Automotive Semi-
conductor Vendor Market Shares”, April 2013
G 16
S. Korea automotive semiconductor market share
Infineon
STMicro-
electronics
Freescale
NXP
Bosch
14 %
7 %
7 %
6 %
4 %
Source: Strategy Analytics, “Automotive Semi-
conductor Vendor Market Shares”, April 2013
Source: Strategy Analytics, “Automotive Semi-
conductor Vendor Market Shares”, April 2013
G 13
World automotive semiconductor sales 2012 by region
US$ in billions
8.0
5.7
4.5
2.8
1.81.1
Europe
Japan
North America
China
Korea
Other countries
G 15
Asia-Pacific (including other countries ¹) automotive semiconductor market share
Infineon
STMicro-
electronics
Renesas
NXP
Freescale
9 %
9 %
9 %
8 %
7 %
1 According to Strategy Analytics, this ranking also
includes the South American region, as well as the
countries of Russia, India and Australia and others
Source: Strategy Analytics, “Automotive Semi-
conductor Vendor Market Shares”, April 2013
> Key customers ¹
Autoliv
Bosch
Continental
Delphi
Denso
Hella
Hyundai
Lear
Mando
Mitsubishi
TRW
Valeo
1 Direct customers excluding distribution customers.
Distribution customers: see “Infineon at a glance” on the inside front cover.
43INFINEON TECHNOLOGIES ANNUAL REPORT 2013
THE SEGMENTS
AUTOMOTIVE

Traction
High-speed trains, regional trains, suburban trains, metro trains and trams –
electrically powered rail vehicles enable emission-free mobility.
IGBT modules made by Infineon power, for example, the electric motors of the
“Talent 2 (model 442)” electric railcar from Bombardier Transportation (see picture).
Drives and automation
In production lines, such as a packaging machine (see picture), liquids, gases
and above all conveyor belts need to be moved.
Our power semiconductors are integral parts of the control systems of these
individually electronically controlled electric motors.
INFINEON TECHNOLOGIES ANNUAL REPORT 2013
GROUP MANAGEMENT REPORT – THE INFINEON GROUP44

Revenue €651 million,Segment Result €38 million.
Differentiation sought through development of application-specific products.
New heat dissipation material simplifies mounting and assembly process of IGBT modules and boosts system performance.
The Industrial Power Control segment
in the 2013 fiscal year
Revenue
Infineon recorded revenue of €651 million in the Industrial Power Control segment in the
2013 fiscal year, 11 percent down on the previous year’s figure, which totaled €728 mil-
lion. The segment generated 17 percent of Infineon’s revenue.
The market climate was on the weak side in the first half of the year, particularly in the
area of capital goods. Demand for industrial drives was especially low under these circum-
stances. Revenue generated by products for solar power-related applications also fell
sharply, primarily due to the reduced scale of government subsidies in a number of coun-
tries that took effect at the beginning of January 2013. Inventory destocking by major
direct customers in Europe and by Asian distribution customers also contributed to the
revenue decrease.
The second half of the year saw a noticeable recovery in practically all of the segment’s
business lines. Demand from the infrastructure and home appliance sectors picked up,
with washing machines and air conditioning equipment selling particularly well in Asia.
The wind power sector also saw a revival in business, boosted among other things by the
fact that more new wind turbines were again installed in China. The climate in the capital
goods sector also improved compared to the first half of the year, albeit at a significantly
lower pace.
Segment Result
The Segment Result for the full year amounted to €38 million, a decrease of 68 percent
compared to the previous year’s €118 million.
In the first half of the fiscal year, the Segment Result was negatively impacted by increased
costs for under-utilized manufacturing capacities. Further factors affecting the Segment
Result were a general increase of manufacturing cost (including higher depreciation and
amortization), higher operating expenses (mostly for Research and Development activities)
as well as investments in conjunction with quality initiatives in manufacturing. However,
the considerable increase in revenue in the second half of the fiscal year enabled the
Segment Result Margin to improve significantly.
G 17
Revenue and Segment Result of the Industrial Power Control segment
€ in millions
Revenue Segment Result
728
118
651
38
2012 2013
INDUSTRIAL POWER CONTROL
45INFINEON TECHNOLOGIES ANNUAL REPORT 2013
THE SEGMENTS
INDUSTRIAL POWER CONTROL

Regional revenue split, distribution
There were slight shifts in the regional revenue split compared to the previous year.
Asia-Pacific (including Japan) now accounts for 44 percent (2012 fiscal year: 40 percent),
on par with Europe (2012 fiscal year: 48 percent). The Americas region was unchanged
at 12 percent.
34 percent of revenue was attributable to distributors (2012 fiscal year: 36 percent).
Product range, applications
Industrial Power Control products are crucial for generating and transmitting electric power,
as well as for improving efficiency in its consumption. Our leading market position is based
on technological leadership and on being an innovative, reliable partner for our customers.
Power semiconductors are often the determining factor, not only in terms of function,
but also when it comes to the efficiency, size, weight and cost of our customers’ products
and systems. Our many years of industrial experience and innovative strength help us
develop the right components for the relevant applications. We aspire and strive to remain
innovation leader in the field of power semiconductors.
Our product portfolio comprises IGBT modules, IGBT stacks, discrete IGBTs, the so-called
“bare die” business – which is the sale of IGBT silicon dies without packaging for sub-
sequent mounting in IGBT modules by the customer – and also driver ICs and driver boards
for controlling IGBT modules.
The most important application is the field of electrical industrial drives. Around 40 percent
of segment revenue is attributable to this area, which covers motors, pumps, fans and
compressors for drive technology, automation technology, conveyor technology, air condi-
tioning, elevators and escalators.
Around one fifth of our revenue is attributable to the generation of renewable energy, which
includes both onshore and offshore wind farms. Moreover, we supply components for a
broad range of photovoltaic systems, such as freestanding photovoltaic installations,
carport systems, rooftop solutions for industrial and commercial sites and rooftop systems
for residential complexes with an output greater than three kilowatts.
The market for rail vehicles accounts for around 10 percent of our revenue and includes
high-speed trains, metro and regional trains as well as trams.
Other important applications for Infineon are uninterruptible power supplies, which
are used in data centers for bridging power supply voltage drops or power outages. In
addition, we address the field of home appliances such as washing machines and air
conditioners, which are increasingly equipped with state-of-the-art variable speed drives
as well as induction-cookers and -stoves that work with strong electro-magnetic fields.
Apart from energy generation, we also supply energy transmission applications, such as
those needed for connecting offshore wind farms to the onshore power grid and facilities
for improving the efficiency and stability of power grids.
Business fields which are still small but becoming increasingly important due to their
potential to save fossil fuels are hybrid-powered buses and electrically-powered industrial
vehicles such as trucks (i.e. forklifts), construction machinery, mining and agricultural
vehicles.
G 18
Industrial Power Control segment revenue by region
44 %
12 %
44 %
Europe, Middle East, Africa
Americas
Asia-Pacific, Japan
> Product range
Bare die business
Discrete IGBTs
Driver ICs
IGBT module solutions
including IGBT stacks
IGBT modules:
– high-power modules
– medium-power modules
– low-power modules
> Applications
Renewable energy generation
Photovoltaic systems
Wind turbines
Energy transmission
and conversion
Offshore windpark HVDC lines
FACTS (flexible AC transmission
systems)
Uninterruptable power supplies
Industrial drives
Industrial vehicles
Agricultural vehicles
Heavy construction vehicles
Hybrid buses
Mining vehicles
Traction
High-speed trains
Locomotives
Metro trains
Trams
Home appliances
Air conditioning
Induction cooking
Induction rice cooker
Washing machines
INFINEON TECHNOLOGIES ANNUAL REPORT 2013
GROUP MANAGEMENT REPORT – THE INFINEON GROUP46

Markets and trends
Over the last few decades, Infineon has come to occupy a leading position in the field of
IGBT-based power semiconductors by being a technology leader which provides its customers
with leading-edge products. Based on the “Product to System” strategy, in the future we
will be looking to collaborate with our customers and partners in order to achieve greater
differentiation from our competitors. The inclusion of customer- and application-specific
requirements in the development of our products will additionally increase their value.
Two innovations that we have introduced to the market during the 2013 fiscal year and
which are examples of the successful implementation of system requirements, are
the EconoDUAL™ 3 IGBT module for commercial and construction vehicles and the TIM
(Thermal Interface Material) heat dissipation material.
Great savings potential in the field of electric drives with variable speed drive
Every improvement in efficiency achieved through power semiconductors, whether in
transistor architecture, packages or heat dissipation, creates great leverage. 42 percent
of power consumed worldwide is attributable to industry, 66 percent of which is used to
power electric motors. Drives are designed for use at maximum power. By adjusting the
speed to suit varying requirements, a considerable amount of energy can be saved, which
indirectly impacts the volume of carbon dioxide emitted. Currently, only 10 percent of this
potential is being exploited. According to industry experts, around 30 to 50 percent of
the remaining motors would benefit from an electronic control unit. In other words, around
10 percent of the electricity consumed worldwide could be saved if the motors in question
were electronically controlled.
Our contribution is to develop increasingly efficient, more compact power semiconductor
components. For example, over the last 20 years we have almost tripled the power density
measured in kilowatts per square centimeter of silicon, which has led to a reduction in
the weight and size of electronic controls, quite apart from the costs saved in the process.
The continuous improvement in price-performance ratio at the system level means that the
payback period for an electronic control gets ever shorter.
Strong presence on the booming Chinese solar market
The solar market is undergoing continual change. The lower tariffs for electricity fed into
the grid in Germany and Italy, the two most important countries with regard to photovoltaic
installations, caused the solar market in Europe to lose importance while China became
the most important single solar market in the world. As part of its twelfth five-year plan,
the Chinese government has made it a major goal to promote renewable energy. Market
observers predict a doubling of the newly installed capacity in China from four gigawatts
to eight gigawatts in 2013.
100
80
60
40
20
0
G 19
Approximately 10 percent of worldwide electricity consumption could be saved by electronically controlled electric motors
worldwide
electricity demand
thereof
energy needs
of industry
thereof
energy needs
of electric motors
thereof
energy needs
of uncontrolled
motors
thereof
savings potential
100 %
42 %
66 % 90 %
30 – 50 %
Source: ABB
100 %
As a percentage of worldwide electricity consumption
42 % 28 % 25 % ~ 10 %
Source: Infineon
G 20
Improvement of power density in the last 20 years
in kilowatt per square centimeter
0.89
0.46
1.161.31
1995
IGBT2
2001
IGBT3
2007
IGBT4
In the future
IGBT5
47INFINEON TECHNOLOGIES ANNUAL REPORT 2013
THE SEGMENTS
INDUSTRIAL POWER CONTROL

Infineon has been cooperating with leading Chinese manufacturers of photovoltaic inverters
for a number of years. In particular, Infineon has increased its level of cooperation with
market leader Sungrow in the course of 2013 (see “Infineon and Sungrow expand coopera-
tion in the field of renewable energy” in the chapter “Research & Development”). The first
customer orders for PrimePACK™ and EconoPACK™ modules have already been fulfilled.
Both IGBT modules are designed for central inverters with outputs of more than 250 kilowatts.
Clear trend towards stronger generators for wind turbines
In the wind turbine sector we do not expect to see a lot of growth over the next few years,
rather it is very likely to stabilize. The important factor, particularly in Europe, is far more
likely to be the repowering, i.e. the replacement of some of the older wind turbines with
larger wind energy systems that have higher towers, longer rotor blades and stronger gen-
erators. The potential for repowering is likely to grow, particularly starting from 2017.
In first-time installations too, increasingly large generators are being installed, which means
a greater number of semiconductors are required per wind turbine. This development is
particularly evident in China, where we have been collaborating with the Chinese wind
turbine manufacturer Goldwind since 2011. Whereas most turbines used to be installed
with a maximum output of 1.5 megawatts, an increasing number of new systems are being
set up with a generator output of two to three megawatts.
There is hardly a market that requires greater durability, longer service life and higher
reliability from its supplier industry than the market for wind turbines. The failure of defec-
tive components causes expensive downtimes. For this reason, power semiconductors
of outstanding quality and reliability are needed. We supply the wind turbine market with
our EconoDUAL™ 3, EconoPACK™+ and PrimePACK™ IGBT module families.
World’s largest rail vehicle manufacturers as customers
China has meanwhile become one of the largest rail vehicle markets in the world. Delays in
the expansion of the country’s railway infrastructure, such as those seen in 2012, are bound
to have a negative impact on suppliers. Since 2013, however, China has again begun to
invest more heavily in its infrastructure in terms of high-speed trains, intercity trains and
suburban trains. We also see an upswing in the market for train systems in the rest of Asia,
where there is currently a far greater demand for metro and regional trains than for high-
speed trains.
Russia, India, South Africa, South America and the Middle East are additional growth markets.
We supply the rail market with our 1.7-, 3.3-, and 6.5-kilovolt IGBT modules. We are also
targeting one further market to round off our portfolio of high-voltage semiconductors with
the launching of 4.5-kilovolt IGBT modules. With customers such as Bombardier Transpor-
tation, CNR (China North Locomotive and Rolling Stock Corporation Ltd.), CSR (China South
Locomotive and Rolling Stock Corporation Ltd.) and Siemens, we supply most of the large
rolling stock manufacturers in the world.
IGBT module for commercial and construction vehicles qualified
to meet automotive industry standards
Infineon has presented a new family of EconoDUAL™ 3 IGBT modules that are qualified in
accordance with the particularly rigorous automotive standards. The new modules have been
specially designed for applications in commercial, construction and agricultural vehicles, for
which outstanding reliability is key. An increasing number of functions in these three types
of vehicle are becoming electrified, which simplifies the design, lowers fuel consumption
and increases reliability. In such vehicles, the diesel engine generates the electricity by
which the electric motor on the drive axle or in the wheel hub is driven.
Infineon’s EconoDUAL™ 3 IGBT modules control these extremely powerful electric motors.
The new components have been specially developed for use in rugged environments and
improved to withstand both shock and thermal fluctuations. This development means that
highly expensive maintenance and downtimes as well as the fuel consumption of these
vehicles can be reduced.
P see page 68
> The EconoDUAL™ 3 IGBT module for commercial, construction and agricultural vehicles
INFINEON TECHNOLOGIES ANNUAL REPORT 2013
GROUP MANAGEMENT REPORT – THE INFINEON GROUP48

New TIM heat dissipation material simplifies assembly for customers
Controls of electric drives are becoming increasingly compact. However, with growing power
density, i.e. the electrical output converted in a certain volume, the need for adequate heat
dissipation rises accordingly. When developing the new TIM (Thermal Interface Material)
we thought about how we could best help our customers solve the question of adequate
heat dissipation.
TIM significantly reduces contact resistance between the IGBT module and the heat sink
and thereby helps optimize heat dissipation from the IGBT module. TIM has been especially
developed for Infineon in collaboration with a chemical company. The Thermal Interface
Material is already applied during the backend manufacturing process in line with the
respective product application. With these processing stages, which are performed at
Infineon, we also simplify the customer’s mounting and assembly processes when com-
pared to the traditional application of heat dissipation material. Overall, the use of TIM
achieves far better power density, greater reliability and longer service life.
TIM has been very well received by our customers. The EconoPACK™+ IGBT modules are
already available with the new Thermal Interface Material, which means electric drive and
renewable energy applications can be addressed. Further families of IGBT modules are
being prepared.
Market position
World market for discrete power semiconductors and modules
The world market for power semiconductors – including discrete power semiconductors
and modules, but excluding power ICs – contracted by 16 percent to US$15.0 billion
in the 2012 calendar year (source: IHS). Infineon’s revenue performance was in line with
the market as a whole and hence its market share of 11.8 percent remained basically
unchanged from the previous year’s level (2011: 12.0 percent). Infineon has thus been
market leader in the field of power semiconductors for a total of ten years in a row.
Toshiba and Mitsubishi swapped places and Fairchild ousted International Rectifier from
fifth place. The five largest competitors held 38 percent of the market.
World market for IGBT Modules
In the 2012 calendar year, the submarket for IGBT modules reached a size of US$3.0 billion,
26 percent down on the US$4.1 billion recorded in the previous year (source: IHS).
With revenue down by 22 percent, Infineon performed slightly better than the market
as a whole, and was therefore improving its market share by 1.1 percentage points
to 20.3 percent.
The five largest competitors held 73 percent of the market.
> An IGBT module heat sink. The upper surface has been coated with TIM (Thermal Interface Material)
G 21
World discrete power semiconductors and modules market share
Infineon
Toshiba
Mitsubishi
STMicro-
electronics
Fairchild
12 %
7 %
7 %
6 %
6 %
Source: IHS, “The World Market for Power Semi-
conductor Discretes & Modules – Edition 2013”,
September 2013
G 22
World IGBT modules market share
Mitsubishi
Infineon
Fuji Electric
Semikron
Hitachi
28 %
20 %
12 %
8 %
5 %
Source: IHS, “The World Market for Power Semi-
conductor Discretes & Modules – Edition 2013”,
September 2013
> Key customers ¹
ABB
Alstom
Bombardier
Delta
Emerson
Enercon
Goldwind
Rockwell
Schneider Electric
Semikron
Siemens
SMA Solar Technology
1 Direct customers excluding distribution customers.
Distribution customers: see “Infineon at a glance” on the inside front cover.
49INFINEON TECHNOLOGIES ANNUAL REPORT 2013
THE SEGMENTS
INDUSTRIAL POWER CONTROL

Power supplies
Power supplies cover a wide area: chargers and power supplies for smartphones,
tablets, notebooks, PCs, servers, flat screens, and communication infrastructure.
Infineon delivers highly efficient power semiconductors – power transistors, driver ICs
and control ICs – thus enabling compact designs with a high degree of efficiency.
Mobile devices
Infineon is benefiting from the boom in mobile devices such as smartphones and
tablets, both with power devices in chargers and internal components.
Within the device, our main focus is on radio-frequency components for wireless
data transmission as well as on chips for silicon microphones.
INFINEON TECHNOLOGIES ANNUAL REPORT 2013
GROUP MANAGEMENT REPORT – THE INFINEON GROUP50

Revenue €987 million,Segment Result €144 million.
Product portfolio for digitally controlled power supply expanded.
Success story with chips for silicon microphones continues.
The Power Management & Multimarket segment
in the 2013 fiscal year
Revenue
The Power Management & Multimarket segment generated revenue totaling €987 million
in the 2013 fiscal year, 6 percent up on the previous year, generating 26 percent of
Group revenue.
After a subdued performance in the first six months, the segment enjoyed revenue growth
in all product areas and across all regions in the second half of the fiscal year. Particularly
noteworthy was the growth in components for mobile devices compared to the previous year.
The boom in sales of smartphones and tablets had a positive effect for us in two ways:
firstly in terms of the power semiconductors (low-voltage and high-voltage power transistors)
built into chargers and secondly in terms of radio-frequency components (system-in-pack-
age antennae modules and low noise amplifiers for satellite navigation) and chips for
silicon microphones used in mobile devices.
Segment Result
The Segment Result for the 2013 fiscal year amounted to €144 million, an increase of
1 percent compared to the previous year’s €142 million.
In the first half of the fiscal year, the Segment Result was negatively impacted by increased
costs for under-utilized manufacturing capacities. The improved Segment Result Margin in
the second half of the year was primarily due to increased revenue and better manufacturing
capacity utilization, and was achieved despite higher operating expenses (mostly for
Research and Development activities).
Regional revenue split, distribution
There were no significant changes in the regional revenue split compared to the previous
year. The high share attributable to Asia-Pacific (including Japan) results from the fact
that most contract manufacturers of electronic devices are based and manufacture in this
region. However, very often decisions on design-wins and customer orders are made in
Europe or in the USA.
49 percent of segment revenue was attributable to distribution customers (2012 fiscal year:
45 percent).
G 23
Revenue and Segment Result of the Power Management & Multimarket segment
€ in millions
Revenue Segment Result
929
142
987
144
2012 2013
G 24
Power Management & Multimarket segment revenue by region
19 %
7 %
74 %
Europe, Middle East, Africa
Americas
Asia-Pacific, Japan
POWER MANAGEMENT & MULTIMARKET
51INFINEON TECHNOLOGIES ANNUAL REPORT 2013
THE SEGMENTS
POWER MANAGEMENT & MULTIMARKET

Product range, applications
The number of electronic devices we use in our everyday lives is constantly growing. The
significance of the power supply for these devices is not always obvious, yet it is crucial for
their reliability, power consumption and size.
Computers and consumer electronics need to operate with increasing efficiency. The power
supply needs to be highly efficient at varying loads (from stand-by through to full load).
Smartphones and tablets are being equipped with increasingly powerful batteries in order
to extend their operating times. At the same time, however, the charging time also needs
to be reduced. This means that the chargers need to be designed for higher output without
becoming noticeably larger. Power supplies for flat screens, which are set to become
increasingly thinner in the future, need to remain integrated in the TV screens and not be
visible as a separate power supply. These customer requirements place new demands
on the efficiency and size of our power supply solutions. The power density thus becomes
a decisive factor. Our concepts for “Digital Power Management” – the transition from ana-
log to digital control of the power supply – address this trend directly.
With our radio-frequency (RF) know-how, comprehensive understanding of the system
and our packaging technology, which is oriented towards miniaturization, we profit from
the fast-growing market for mobile devices. In order for our components to comply with
the increasing demands made on functionality, degree of integration, durability and signal
quality, we continually research and develop new architectures, materials and manufactur-
ing technologies.
In terms of applications, around one third of the segment revenue is achieved with power
supplies for mobile devices, information and telecommunications equipment, television
sets and, above all, for various types of computers. We address all performance categories
of chargers for smartphones, tablets and notebooks through to power supplies for PCs
and servers. The power range extends from 10 watts for a smartphone charger through to
3,000 watts for the power supply of a server. Our components – discrete low-voltage and
high-voltage power transistors, driver ICs and control ICs – are found in both the power
supply and the DC/DC conversion on the motherboard.
Around one quarter of the segment revenue is generated by special components designed
for mobile devices such as smartphones and tablets. These include CMOS RF switches, LNA
(low noise amplifier) for satellite navigation, chips for silicon microphones and small-signal
components such as TVS (transient voltage suppressor) diodes.
Further applications include: a.) cellular network infrastructure, base stations for 3G, 4G
and micro and pico cells, b.) lighting management including LED lighting, c.) photovoltaic
rooftop systems for low output up to 3 kW; and d.) customized ICs for consumer and
industrial applications.
Markets and trends
In line with the “Product to System” strategy, the Power Management & Multimarket segment
is undergoing a process of transformation. Two things are required to establish better system
knowledge: a learning organization, which systematically acquires new knowledge, and a
corresponding organizational set-up in which the existing knowledge is put to optimal use.
The Power Management & Multimarket segment has already introduced a number of relevant
changes. With this move, we see ourselves as being well equipped to develop solutions
for the parts of the power supply – AC/DC and DC/DC conversion – which are strongly
influenced by a system understanding, thus helping us grow profitably in the international
market place.
> Product range
CMOS RF switches for
antenna modules
Control ICs
Customized chips (ASICs)
Discrete high-voltage
power transistors
Discrete low-voltage
power transistors
Driver ICs
MEMS and ASICs for
silicon microphones
RF power transistors
Small-signal components:
– TVS (transient voltage
suppressor) diodes
– LNA (low noise amplifier)
for satellite navigation
> Applications
Cellular network infrastructure
Inverter for photovoltaic
rooftop systems (< 3 kW)
Light management including
LED lighting
Mobile devices (smartphones,
tablets, navigation devices)
Power supplies for:
– IT and telecom
– server
– PC
– notebook
– tablet
– smartphones
– consumer electronics
INFINEON TECHNOLOGIES ANNUAL REPORT 2013
GROUP MANAGEMENT REPORT – THE INFINEON GROUP52

Power supply requirements growing
The requirements for the power supply of consumer, computer and telecommunication
applications are constantly growing. For these applications our focus is on servers, PCs,
notebooks, tablets, smartphones and flat-screen televisions. Firstly, because an ever
greater degree of efficiency is required and secondly because the load profiles are becom-
ing increasingly complex. So, for example, not only is an outstanding level of efficiency
required for the power supply at average load (usually 50 percent) – it is also needed at
loads of 20 percent and 100 percent (full load). The highest efficiency class of the 80 PLUS
initiative (“Titanium”) additionally specifies efficiency of 90 percent at a load of only
10 percent. The Ecodesign Directive of the European Union goes one step further, demand-
ing a reduction of power consumption in stand-by mode, i.e. at a load of zero percent.
Two development trends for power supplies are currently observable:
> In the past, power supplies were optimized for a certain load factor. An improvement
in efficiency was achieved by using more efficient individual components. Today, a high
degree of efficiency across the entire load range (from stand-by through full load) is
required. The optimization of individual components is hardly likely to result in a further
significant efficiency increase. New, digitally controlled power supply architectures are
able to help. These are considerably more flexible, partially achieving a degree of effi-
ciency far above 90 percent across most of the load range.
> Earlier, in addition to an increase in efficiency, the main focus was on the size of the
power supplies. Notebook adapters and chargers for mobile devices had to be made
more compact and lighter. This has now been achieved to the satisfaction of most
customers. Chargers for tablets and smartphones are already integrated in the plug.
Over the next few years, the emphasis will be on the charging times of notebooks and,
above all, tablets and smartphones. These devices have increasingly larger batteries,
enabling longer operating times. However, today’s chargers have comparatively long
charging times. Shorter charging times are a customer benefit, and therefore an important
differentiation factor for the device manufacturer. However, considerably more output
is required for shorter charging times whilst potentially maintaining the size of the power
supplies and adapters. Hence, the power density increases. Experts speak of “high
power density chargers” and “ultra-high power density chargers” with the objective being
to halve the current charging time.
We will play a key role in these two development trends – higher power density and effi-
ciency across a broad load range thanks to digital control. Infineon offers ICs and discrete
power components for power supplies with digital control concepts for both the power
supply (AC/DC conversion) and DC/DC conversion.
Advantages of a digitally controlled power supply
Developers of power supplies appreciate digital control, as it enables the implementation
of functions that would be technically complex to realize using analog modules. Software
modifications make it possible to adapt the function. The success factors for our customers
are shorter development times, a high degree of flexibility and less fragmentation in tech-
nical solutions.
Digital power supplies also enable several useful additional functions, such as a.) continuous
recording of relevant operating data (“electronic logbook”); b.) adaptive or predictive control,
and c.) optimal system customization and an outstanding degree of efficiency by adapting
the relevant parameters.
By realizing these functions in a digital solution, the space required by the electronic
circuit is also reduced when compared with a corresponding analog solution. Hence, the
power density increases and system costs are reduced.
Titanium (2011)
Platinum (2009)
Gold (2008)
Silver (2008)
Bronze (2008)
Minimum
requirement
(2007)
1 Data points represent actual efficiency require-
ments as defined by the 80 PLUS program.
Curves are for illustrative purposes only.
Source: 80 PLUS program
www.plugloadsolutions.com
G 25
80 PLUS performance specification ¹
Efficiency
Loading
10 % 50 %20 % 100 %
98 %
94 %
90 %
86 %
82 %
78 %
53INFINEON TECHNOLOGIES ANNUAL REPORT 2013
THE SEGMENTS
POWER MANAGEMENT & MULTIMARKET

Digital solutions for AC/DC and DC/DC conversion
Our digital solution for AC/DC conversion is known as “digital platform”, or in short “.dp”.
It contains one digital signal processor, program memories and drivers for the external power
high-voltage transistors. The driver ICs are optimized for our high-voltage CoolMOS™
power transistors. This makes the CoolMOS™ transistors a part of an efficient AC/DC con-
version system. The product-specific properties of the power supply are set in the memory
via firmware and application-specific system parameters.
With the products that make up today’s “.dp” family, we cover the power range between
30 watts and 300 watts and thereby target tablets, notebooks, PCs, flat screens and
LED applications.
For DC/DC conversion, the “intelligent local power supply” is becoming increasingly the
solution of choice, such as on the motherboard, which means a controller-managed power
supply with a very short connection to the point of load. Such loads are, for instance, micro-
processors in server or graphics processors with power consumption in excess of 100 watts.
Here too, we provide solutions for the digital control loop: the controller is being devel-
oped by the team at Primarion, which we acquired in April 2008. The power stage consists
of an extremely compact package, which contains the driver IC and the power transistors
(see also “Blade: innovative chip-embedded packaging technology for DC/DC conversion”
in the chapter “Research & Development”).
Mobile devices
Mobile devices, i.e. smartphones and the still relatively new tablet class of devices, are
currently experiencing very high growth rates. When it comes to smartphones and tablets,
in addition to the chargers, we are successfully positioned in the field of components for
certain functions within the devices themselves.
One of our main focuses is in the field of radio-frequency (RF) components for wireless data
transmission between the cellular or satellite network and the mobile device. RF circuits in
CMOS technology and LNA for satellite navigation with high signal sensitivity are two exam-
ples of our RF competence in these applications. Another focus element is chips for silicon
microphones. These MEMS-based (micro-electro-mechanical system) microphones are
increasingly replacing the traditional, usually so-called “electret” condenser microphones.
In the two cases above, the product portfolio is continuously being adapted in line with
market requirements. The next significant step to be taken in the field of CMOS circuits is
the integration of all relevant functions in one module (system-in-package) or, as far as
possible, monolithically on one chip (system-on-chip). This is only feasible with a profound
understanding of the RF system.
Chips for silicon microphones, driven by a stream of new generations of devices and the
resulting changes to the requirements profile, are also continually being developed.
We provide two core components for silicon microphones: the MEMS chip (micro-electro-
mechanical system) with the microphone membrane and the application-specific IC for
signal conversion. The membrane needs to be manufactured in a way to increase sensitivity
and at the same time improve resilience to falls and shock, as well as to reduce noise.
G see glossary, page 287
P see page 66
G see glossary, page 289
> Silicon microphone. On the right we see the MEMS chip with the round membrane and to the left, the IC for signal conversion
4.72 mm
INFINEON TECHNOLOGIES ANNUAL REPORT 2013
GROUP MANAGEMENT REPORT – THE INFINEON GROUP54

The IC converts the sensor signal into an analog or digital signal, which is then processed in
the audio processor. These days, many of the implemented functions are based on analog
design concepts. The transition to digital signal processing makes it possible to implement
changes during the design phase more quickly: “product diversification through digitali-
zation”. This is important, as the number of models produced by smartphone and tablet
customers is growing, and their development cycles are becoming shorter. Additionally,
the latest generation of mobile devices requires several and sometimes various types of
microphones, which are adapted to different applications such as the suppression of back-
ground noise or speech control.
Market position
Standard MOSFET power transistors
In the 2012 calendar year, the world market for standard MOSFET power transistors
(low-voltage and high-voltage MOSFETs) amounted to US$5.1 billion, a drop of 12 percent
compared to the previous year’s figure of US$5.8 billion (source: IHS). Infineon’s revenue
fell by 9.1 percent in the same period, which means it performed better than the market as
a whole. Furthermore, with 0.4 percentage points, Infineon recorded the largest gain in
market share among the five major competitors and, at currently 12.7 percent, its highest
market share to date. The gap between Infineon and the market leader was only 0.1 per-
centage points (previous year: 0.5 percentage points). Overall, the five biggest competitors
held a 55 percent share of the market.
Chips for silicon microphones
There were no changes to the rapid growth in the market for chips for silicon microphones
in the 2012 calendar year. According to estimates by IHS, 2.048 billion units were sold,
as compared to 1.303 billion in the previous year, a growth rate of 57 percent. Infineon
succeeded in increasing its sales volume at an above-average rate from 259 million units
to 636 million units, an increase of 146 percent. This has again significantly increased our
market share from 20 percent in the 2011 calendar year to 31 percent in 2012. The accu-
mulated market share of the three following companies (ADI, Bosch and Omron) increased
from 6 percent in 2011 to 9 percent in 2012. Together, the five largest competitors held
98 percent of the market.
Around two thirds of all chips for silicon microphones are used in cell phones. Headsets
for cell phones and notebooks both account for just over 10 percent of the market, tablets
for around 7 percent. Market penetration of silicon microphones as compared to “older”
microphone technology in cell phones amounts to around 70 percent, and 90 percent for
tablets. Despite high market penetration for tablets, there is further growth potential in the
next few years as the trend goes towards two silicon microphones per tablet instead of
one, as is already the case in smartphones.
G 26
World standard power MOSFET market share
International Rectifier
Infineon
Toshiba
Fairchild
STMicro-electronics
13 %
13 %
11%
10 %
9 %
Source: IHS, “The World Market for Power Semi-
conductor Discretes & Modules – Edition 2013”,
September 2013
G 27
World silicon MEMS microphones market share
Knowles
Infineon
ADI
Omron
Bosch
58 %
31%
5 %
3 %
1%
Source: IHS, “MEMS Microphones H2 Special
Report”, January 2013
> Key customers ¹
AAC
Dell
Delta
Emerson
Ericsson
Hewlett-Packard
Huawei
LG Electronics
Lite-on
Osram
Quanta
Samsung
1 Direct customers excluding distribution customers.
Distribution customers: see “Infineon at a glance” on the inside front cover.
55INFINEON TECHNOLOGIES ANNUAL REPORT 2013
THE SEGMENTS
POWER MANAGEMENT & MULTIMARKET

Security in connected systems
The increasing connectedness of electronic devices and systems as well as the rising
spread of mobile devices require a higher degree of data security and integrity.
Infineon supplies TPM (Trusted Platform Module) security chips for devices running
Microsoft Windows® 8 and Google’s Chrome OS cloud operating system (see picture).
Multi-application card
Electronic ID cards are among the fastest-growing fields of application for security chips
with high standards in terms of security and longevity.
We deliver security controllers with the Integrity Guard digital security technology for
the electronic ID card in Malaysia, a multi-application card (see picture).
INFINEON TECHNOLOGIES ANNUAL REPORT 2013
GROUP MANAGEMENT REPORT – THE INFINEON GROUP56

The Chip Card & Security segment
in the 2013 fiscal year
Revenue
The Chip Card & Security segment generated revenue totaling €463 million in the 2013 fiscal
year, slightly higher than the previous year’s figure of €457 million. The segment gener-
ated 12 percent of Group revenue.
Compared to the previous year, there were some small changes in the composition of reve-
nue. Business in integrated safety components for mobile phones and in security chips for
pay TV was weaker due to project-related factors, while business in solutions for governmental
identification applications grew continually. Countries introducing electronic documents
included Turkey, Kosovo, South Africa, Ecuador, Taiwan and Thailand. Revenue generated
with electronic payment cards also rose, as a result of the successful launch of the 16-bit
SLE 77 and SLE 78 product families in the new 90-nanometer technology. Following on
from security chips for SIM cards, delivery of 90-nanometer products for payment cards
and governmental ID applications has now commenced.
The segment’s traditional business in SIM cards and authentication chips progressed as
planned, with the usual, project-related and seasonal fluctuations from quarter to quarter.
Segment Result
The Segment Result amounted to €39 million, a decrease of 30 percent compared to the
previous year’s €56 million.
The decrease in Segment Result was mostly due to the slightly lower gross margin resulting
from a change in product mix. Technology projects and productivity improvement programs,
including activities relating to the transition to 65-nanometer manufacturing technology
also resulted in higher Research and Development cost compared to the previous year, while
selling and administrative cost were virtually unchanged.
G 28
Revenue and Segment Result of the Chip Card & Security segment
€ in millions
Revenue Segment Result
457
56
463
39
2012 2013
CHIP CARD & SECURITY
Revenue €463 million,Segment Result €39 million.
Successful launch of product families in 90-nanometer manufacturing technology.
Innovative SOLID FLASH™ Technology for payment cards well received by customers.
57INFINEON TECHNOLOGIES ANNUAL REPORT 2013
THE SEGMENTS
CHIP CARD & SECURITY

Regional revenue split
European customers – mostly in France and Germany – account for 50 percent of segment
revenue (2012 fiscal year: 55 percent). We supply our products for security projects in
almost every country of the world via these customers and their regional subsidiaries. The
higher proportion related to the Asia-Pacific region (including Japan) is attributable to
new projects in populous countries (accounting for 41 percent of revenue; 2012 fiscal year:
39 percent). The largest project in the Americas region (accounting for 9 percent of revenue;
2012 fiscal year: 6 percent) is the electronic passport in the USA.
As in the previous fiscal year, a small percentage of revenue was attributable to distribu-
tion customers.
Product range, applications
Based on its core competencies in the fields of security, contactless communication and
embedded microcontroller solutions (embedded control), Infineon offers a broad portfolio
of semiconductor-based security products for a wide range of chip card and security appli-
cations. We have created innovations for each of these three core competencies, some
of which have received numerous awards: Integrity Guard for security, Coil on Module for
contactless communication (see “New Coil on Module interconnection simplifies the
manufacturing process of security cards” in this chapter) and SOLID FLASH™ for integrated
security controller solutions (see “Infineon achieves worldwide success with its new
SOLID FLASH™ security controllers” in this chapter).
With this expertise, Infineon ensures greater security in an increasingly connected world,
such as for mobile payments, secure cloud computing and secure electronic government
documents. We consider ourselves world market leader in technology for security ICs.
Infineon’s worldwide leading security expertise is the result of more than 25 years of expe-
rience in the largest, most sophisticated security projects.
Chip card and security applications are addressed either by contact-based or contactless
security controllers. As one of the few manufacturers worldwide, we offer security control-
lers with dual interface, i.e. with both a contact-based and a contactless interface.
With its security products, the Chip Card & Security segment also contributes significantly
to the value added of the applications of the other segments. Therefore, requirements with
regard to safe data transmission, software protection and authentication for original parts,
set by for instance carmakers, industry, and the entertainment sector, can be fulfilled.
The largest applications comprise mobile communications (SIM cards) and debit and credit
cards for payment systems, which make up around half of the segment’s revenue.
Due to the above-average growth seen in recent years, government identification documents
already account for around one quarter of the segment’s revenue. These include passports
equipped with a security chip, ID cards, healthcare cards and driver’s licenses.
Further applications are ticketing for public transportation, access control, NFC (Near Field
Communication) and security controller solutions integrated in automotive and industrial
applications. Furthermore, embedded security applications increasingly develop into
important target markets including safety elements for mobile devices (smartphones, note-
books, tablets), authentication – such as for gaming consoles, accessories, spare parts,
machine-to-machine communication and Trusted Platform Modules (TPM).
G see glossary, page 288
P see page 59
P see page 59
> Product range
Contact-based security controller
Contactless security controller
Dual-interface security controller
(contact-based and contactless)
> Applications
Authentication (e.g. for games
consoles, accessories and
spare parts)
Electronic passports, ID cards,
healthcare cards, driver’s licenses
Mobile communication
Payment systems
Security for mobile
communication devices
Ticketing, access control
Trusted computing
G 29
Chip Card & Security segment revenue by region
50 %
9 %
41%
Europe, Middle East, Africa
Americas
Asia-Pacific, Japan
INFINEON TECHNOLOGIES ANNUAL REPORT 2013
GROUP MANAGEMENT REPORT – THE INFINEON GROUP58

Markets and trends
With SOLID FLASH™, Integrity Guard and Coil on Module, Infineon has launched ground-
breaking innovations onto the market. SOLID FLASH™ and Integrity Guard based products
are available in 90-nanometer manufacturing technology, with volume production in
65-nanometer technology set to follow in the 2014 fiscal year. The latest innovation, Coil
on Module, takes the interconnection of the chip and antenna in the chipcard to a new level.
New Coil on Module interconnection simplifies the manufacturing
process of security cards
With Coil on Module, Infineon presents an innovative chip package for dual interface cards.
An antenna is integrated in the Coil on Module chip module. To date, the mechanical-elec-
trical connection between the card antenna and the module has been made either via a
soldered connection or a conductive paste. This process is very cumbersome and always
requires the individual adaptation of the antenna design to the particular chip module.
With Coil on Module, however, the signal is exchanged wirelessly between the chip and the
antenna, analogous to the card and the reader. This makes the chipcard considerably more
durable, simplifies its design and manufacturing process, and makes it more efficient. The
production time is significantly shortened when compared to conventional technologies.
Dual interface cards are gaining in popularity throughout the world, since they can be used
not only for conventional contact-based, but also for contactless applications. Coil on
Module is initially being offered for bank and credit cards. However, it is also suitable for
further applications such as electronic access controls, ticketing systems and electronic ID
documents. With Coil on Module Infineon has been selected as the preferred supplier of
security chips for applications such as the new VISA debit and credit cards issued in Latin
America and the Caribbean.
The Coil on Module technology underscores Infineon’s leadership in the innovation of
modules. It is the result of extensive expertise in the field of semiconductors and modules,
as well as of a deep understanding of the systems and requirements of customers.
Infineon achieves worldwide success with its new SOLID FLASH™
security controllers
The SOLID FLASH™ technology developed by Infineon has been established on the market
within a short time, being used in both payment cards and government applications.
SOLID FLASH™ offers significant advantages for the entire value-added chain.
Our customers, the card manufacturers, benefit in many ways from the high degree of
flexibility that SOLID FLASH™ technology offers, especially in terms of time-to-market and
supply chain logistics. For example, this technology enables the time from the determination
G 30
Schematic representation of the layering of a card using Coil on Module technology
Overlay
Printing layer
Chip module with antenna at the rear-side of the module
Compensation layer
Chip card antenna
Compensation layer
Printing layer
Overlay
59INFINEON TECHNOLOGIES ANNUAL REPORT 2013
THE SEGMENTS
CHIP CARD & SECURITY

of variants to delivery to be halved. Further savings in time and costs result from fast
learning cycles in software development. Programming is not performed prior to the chip
manufacturing process as was formerly the case, but thereafter. This enables customers
to manage their supply chains in a considerably more demand driven way, while main-
taining an outstanding level of certified security. This reduces planning expense, inventory
costs and market risks.
Infineon offers Flash-based security controllers with dual interfaces, i.e. for both contact-
based and contactless methods of payment. For contactless applications, transaction
times are over 40 percent faster when compared to conventional products. The reliable,
high processing speed improves user-friendliness for the consumer and thus increases the
consumer’s level of acceptance for the contactless use of a bankcard or multi-functional
smart card.
The superiority of the SOLID FLASH™-based security controllers is underscored by the high
level of acceptance for payment applications in worldwide key projects, as bank cards from
Deutscher Sparkassenverlag, Schweizer Maestro debit cards and Carte Bancaire cards in
France are all equipped with SOLID FLASH™ security controllers made by Infineon. Numerous
projects in other European countries as well as in North and South America, Africa and Asia
(Japan, China, South Korea, Indonesia) are also being supplied with SOLID FLASH™ in the
course of further rollout in the market.
Second generation of Integrity Guard on 90-nanometer manufacturing
technology available
Following the successful market launch of our security chips for SIM cards based on the
90-nanometer manufacturing technology, 90-nanometer security chips for payment cards
and government applications are now also being supplied. Over 1.2 billion 90-nanometer
security chips have been supplied to customers by the end of the 2013 fiscal year, of
which more than 200 million chips are destined for use in payment cards and government
applications.
The basic prerequisite for the expansion of the portfolio to include applications with higher
security requirements was the availability of SOLID FLASH™ and the Integrity Guard security
technology in 90-nanometer manufacturing technology. Furthermore, during the fiscal year,
a second product generation of Integrity Guard was launched onto the market, also based
on 90-nanometer manufacturing technology and certified at Common Criteria with the
highest international security standard “EAL6+ (high)”.
The majority of security chips manufactured using 90-nanometer manufacturing is pro-
duced at our 200-millimeter frontend location in Dresden (Germany), with the rest being
manufactured by our foundry partner TSMC. As the first manufacturer of security chips
worldwide, Infineon began delivering products based on 65-nanometer technology during
the September 2013 quarter.
MyKad – an example of a multi-application card
MyKad is a multi-application card issued by the Malaysian government. In addition to its
function as an electronic ID card, additional applications can be implemented on the card,
such as a driver’s license, healthcare card, government services, electronic signature, a bank
card for withdrawing money from ATMs or as an electronic wallet for paying small amounts.
Security and durability are of key importance when it comes to government applications,
as the card is designed for many years of use. During this time, it has to withstand a great
deal of wear and tear, and its intensive use places high demands on the mechanical
stability and protection against electrostatic discharges.
For the latest version of this multi-application card, Infineon supplies the SLE 78 security
chip with the Integrity Guard digital security technology and SOLID FLASH™, which
has already been tried and tested in a great many projects. The Malaysian government
has already been issuing the MyKad cards at an annual rate of around two million cards
in recent years.
G see glossary, page 286
P see page 56
INFINEON TECHNOLOGIES ANNUAL REPORT 2013
GROUP MANAGEMENT REPORT – THE INFINEON GROUP60

Trusted Platform Module: the security chip for mobile devices
Infineon has been in the market with Trusted Platform Module (TPM) security chips for over
10 years. Basically, certified TPM security chips are designed to protect innovative computer
systems against tampering and unauthorized access. The TPM security chip safeguards and
protects security-critical information and serves as an “anchor of confidence” for security
applications. It is not possible to achieve a comparable level of security with purely soft-
ware-based solutions.
Infineon’s hardware-based TPM technology is a cost-efficient, highly reliable, certified
security solution. Computer systems with integrated, trustworthy hardware and the corre-
sponding applications help companies better protect their business data, for instance
via hard disk encryption. They enable reliable authentication of device and user identities,
thereby improving secure communication in computer networks. The TPM security chip
has become increasingly important for the operating system since the introduction of the
Microsoft Windows® 8 operating system, which requires TPM functionality.
More and more computers with the integrated TPM security chip have been sold in recent
years. The Trusted Computing Group (TCG) estimates that over 600 million PCs with the
TPM security chip have been sold.
In the 2013 fiscal year, Infineon introduced a new generation of TPM security chips: the
OPTIGA™ TPM family. It is the first hardware-based security solution to comply with
the TPM 2.0 specification. The OPTIGA™ TPM family addresses a broad range of industrial
computer systems, mobile devices, conventional PCs and other processor-controlled
applications.
The new TPM security chips are 16-bit microcontrollers based on Infineon’s SOLID FLASH™
technology. They comply with the requirements for the hardware certification of Microsoft
Windows®, are recommended by Google for Chrome OS systems, and are supported by the
major open-source operating systems such as Linux, etc.
Infineon supports its customers in system development, thereby speeding up the market
launch of their products. In addition to the security chip with full TPM functionality,
Infineon supplies firmware as well as management software for the terminal device.
Market position
According to the latest study by market research company IHS, in the 2012 calendar year
Infineon held a 24.1 percent share of the world market for microcontroller-based chip card
ICs. This market grew by 7.7 percent from US$2.08 billion in 2011 to US$2.24 billion in
2012. In the 2012 calendar year, Infineon generated US$540 million revenue, US$7 million
more than the second-largest competitor. In 2012, the market comprised 7.48 billion
contact-based and contactless microcontroller-based card ICs for applications in SIM
cards, payment cards, access control, transportation and government documents.
The five largest market participants held 93 percent of the market in 2012.
The market for security applications is dynamic. Recent years have seen the addition of
new applications, allowing us to extend our security expertise. Some of these applications
are not yet being tracked by market researchers. These include, for instance, the licensing
of security functions in microcontrollers for automotive and industrial applications and
also Embedded Security applications. They also include authentication – such as for
gaming consoles, accessories and spare parts –, machine-to-machine communication
and also Trusted Platform Modules (TPM).
G see glossary, page 287
> Key customers ¹
Beijing Watch
Data
Gemalto
Giesecke &
Devrient
Hewlett-Packard
Oberthur
Technologies
Safran Morpho
US Government
Printing Office
1 Direct customers excluding
distribution customers.
Distribution customers see “Infineon
at a glance” on the inside front cover.
G 31
World microcontroller-based chip card ICs market share
Infineon
NXP
Samsung
STMicro-electronics
SHHIC
24 %
24 %
22 %
17 %
6 %
Source: IHS, “Smart Cards and Smart Card ICs –
World – 2013”, September 2013
61INFINEON TECHNOLOGIES ANNUAL REPORT 2013
THE SEGMENTS
CHIP CARD & SECURITY

RESEARCH & DEVELOPMENT
150-MILLIMETER GALLIUM NITRIDE WAFERS
In Villach (Austria), we have already built up
the first complete frontend pilot line for processing
150-millimeter gallium nitride wafers.
150-MILLIMETER SILICON CARBIDE WAFERS
In May 2013, Infineon presented the first fully
processed silicon carbide wafer with a diameter
of 150 millimeters.
300-MILLIMETER THIN WAFERS
During the 2013 fiscal year, Infineon became the
first semiconductor manufacturer worldwide to begin
volume production of power semiconductors on
300-millimeter thin wafers.
INFINEON TECHNOLOGIES ANNUAL REPORT 2013
GROUP MANAGEMENT REPORT – THE INFINEON GROUP62

Research and Development expenses increased
to €525 million in the 2013 fiscal year.
300-millimeter thin-wafer manufacturing lines
in Villach and Dresden qualified by customers
and volume production commenced.
First fully processed 150-millimeter
silicon carbide wafer presented.
In order to safeguard and retain its position as a world-leading semiconductor
manufacturer, state-of-the-art technology is key to Infineon’s success. Research
and Development plays an important role at Infineon as the key to tapping
growth potential and ensuring competitiveness. Our Research and Development
activities are focused primarily on the following:
> outstandingly efficient power semiconductor products,
> analog and mixed-signal ICs,
> radio-frequency components with the best signal properties,
> MEMS (micro-electromechanical systems) and sensors,
> embedded controls,
> frontend and backend manufacturing technologies.
Research and Development expenses in the 2013 fiscal year totaled €525 million,
up 15 percent compared with the previous year’s figure of €455 million. In rela-
tion to revenue, we spent 13.7 percent of revenue on Research and Development
during the 2013 fiscal year, compared with 11.6 percent one year earlier.
In line with the focal points outlined above – and despite the relatively weak
market at the beginning of the 2013 fiscal year and the sharp drop in revenue for
the first half of the year – we raised Research and Development expenses in
every single quarter in comparison with the equivalent three-month period of the
preceding year. We are convinced that this long-term Research and Development
strategy of pushing ahead with long-term development, even in economically
less favorable phases of the market, will help us maintain and even improve our
ability to innovate. By following this approach we can also ensure that we remain
a reliable partner for our customers. This fact is evidenced by the recognition
awarded to us by our customers for innovations and product developments listed
in the “Awards” chapter.
At the end of the 2013 fiscal year we employed 4,472 people at 21 sites in
11 countries in our research and innovation network worldwide, which accounts
for 17 percent of the total workforce (see map in chapter “Infineon worldwide”).
At the end of the previous fiscal year, the comparable number was 4,289 people
(16 percent of the total workforce).
Capitalized development costs were €51 million in the 2013 fiscal year after
€57 million in the preceding fiscal year. Amortization of capitalized development
costs totaled €19 million (2012 fiscal year: €12 million). Subsidies and grants
for Research and Development decreased by €1 million to €52 million in the
2013 fiscal year compared with €53 million in the preceding twelve-month period.
P see page 110
P see page 112
63INFINEON TECHNOLOGIES ANNUAL REPORT 2013
RESEARCH & DEVELOPMENT

Patents
Innovative strength and long-term competitiveness are also apparent in both the quantity
and the quality of our patents. Worldwide, we applied for around 1,700 patents over the
course of the 2013 fiscal year, compared with some 1,300 patent applications in the previous
year. The Infineon patent portfolio comprised approximately 18,650 patents and patent
applications at the end of the 2013 fiscal year, up from around 17,250 patents and appli-
cations at the end of the 2012 fiscal year.
Principal in-house Research and Development activities
Volume production based on 300-millimeter thin-wafer technology commenced
In the 2013 fiscal year Infineon began volume production of the CoolMOS™ family of
high-voltage power transistors utilizing 300-millimeter thin-wafer manufacturing technology.
Both sites involved in the 300-millimeter frontend manufacturing network, in Villach
(Austria) and Dresden (Germany), have attained the required customer approvals. Further
technology transfers from 200- to 300-millimeter wafers are now scheduled to follow: the
SFET technology, the base technology for low-voltage power transistors in our OptiMOS™
family, and also the IGBT base technologies IGBT3 and IGBT4. With SMART7, a manufactur-
ing technology designed for power ICs in automotive applications, we are starting the first
development projects directly on 300-millimeter thin-wafer technology.
Infineon is the first and only semiconductor manufacturer worldwide to produce power
semiconductors on 300-millimeter thin wafers. In comparison with the more common
200-millimeter wafers, the larger diameter of the 300-millimeter wafers enables almost
two-and-a-half times as many chips to be produced per wafer. Although they are hardly
thicker than a sheet of paper, the chips are equipped with electrically active structures on
both front and backside. This is very different from normal semiconductor wafers, which
are typically only processed on one side.
Thin-wafer technology offers considerable advantages: Unlike conventional ICs, the current
in most power semiconductors flows from the front to the back of the chip. The more energy-
efficient chips manufactured on thin wafers not only help reduce losses, they also have
a greater ability to dissipate the resulting heat. Moreover, thin-wafer chips fit into increas-
ingly compact packages.
New materials for power semiconductors
The ideal power transistor needs to be small in size, robust in terms of its ability to withstand
high temperatures and transient voltage, and show very little electrical resistance when
switched on. It should also be capable of high switching frequencies, as this means the
passive components used in the circuit (such as resistors, capacitors and inductors) can
be made smaller. These factors not only reduce system costs for the customer, but also the
size of the application.
In the continuous search for increasingly efficient power semiconductors with ever higher
power densities, semiconductors with wide band gaps have come to be the best solution.
These new semiconductor materials are capable of switching high voltages, despite their
compactness compared with silicon-based components. Particularly silicon carbide (SiC,
a combination of silicon and carbon) and gallium nitride (GaN, a combination of gallium
and nitrogen) are the materials of choice.
The fields of application suitable for SiC and GaN components are largely determined by
their voltage classes. Whereas there is a recognizable trend towards the use of SiC technology
in applications over 1,000 volts, GaN technology is better suited for use at 650 volts and
lower. When introduced to the market, GaN power transistors in the 650-volt class will be
key components in terms of outstanding efficiency and power density, such as in power
supplies for servers and telecommunications systems. With increasing technological matu-
rity, however, we also see GaN technology establishing itself in the medium (400 volts)
and lower voltage ranges (200 volts).
G see glossary, page 285
INFINEON TECHNOLOGIES ANNUAL REPORT 2013
GROUP MANAGEMENT REPORT – THE INFINEON GROUP64

Silicon carbide strategy strongly oriented towards system analysis
As the market participant with the most comprehensive range of power semiconductors,
Infineon sees the thorough analysis of the customer application as a crucial factor when it
comes to providing the best value solution to the customer. Apart from our range of SiC
diodes, which has become increasingly broad over the last few years, our SiC Easy modules
are also finding ever greater acceptance on the market. In these SiC Easy modules, along-
side SiC diodes, we also combine standard silicon diodes and high-voltage power transis-
tors from our CoolMOS™ family as well as IGBTs. Using this approach we are able to meet
the cost target for the customer application and provide optimal efficiency at the same
time. Our SiC strategy is therefore not purely a component strategy, but a solution strategy
adapted to match our other power semiconductors and packaging technologies.
The main fields of application for SiC components at the present time are photovoltaic
inverters, switch mode power supplies for servers and uninterruptible power supplies,
where the degree of efficiency plays a decisive role. In the future, we also see controls for
motor drives (so-called inverters) and for railway vehicles as potential fields of application
for SiC components in the long run. Here the most crucial factor is power density. Last
but not least, electrically powered vehicles are also a possible field of application for SiC
components, where they are most likely to be used in battery charging equipment but also,
in the future and under certain conditions, in control systems for electric motors.
In May 2013, we presented the first fully processed SiC wafer with a diameter of 150 milli-
meters, underlining Infineon’s leading role in the field of SiC manufacturing technology.
In conjunction with the reduction in cost per chip achievable by moving from today’s
100-millimeter SiC wafers to 150-millimeter SiC wafers, we will be able to address new
fields of applications, including the above-mentioned and potentially largest and most
stable market for inverter-controlled drive motors.
Gallium nitride enables new power supply topologies
The volume production of gallium nitride (GaN)-based components still lies somewhat
further in the future. GaN technology, however, also offers completely new properties that
are of interest to developers of power supplies and adapters. We believe that GaN will
lead to greater efficiency in the field of power conversion. However, this does not mean
that an existing power transistor will simply be replaced by a GaN power transistor. Instead,
the far higher switching frequencies of GaN transistors enable completely new power
supply topologies. Maximum efficiency can be achieved if the entire system design is
adapted to the characteristic properties of a GaN-based power transistor.
In Villach (Austria), where our competence center for power electronics responsible for
developing GaN technology is located, we have already implemented the first complete
frontend pilot line for processing 150-millimeter GaN wafers.
New 32-bit microcontroller family for industrial applications: XMC1000
In spring 2012 Infineon presented the XMC4000 family of microcontrollers and in February
2013 it followed that up with the XMC1000 microcontroller family. Both families are based on
an ARM® 32-bit processor core. The main focus for both families was their simple scalabil-
ity. Whereas the XMC4000 family is designed to target industrial applications with complex
control algorithms and stringent requirements in terms of computing power, the XMC1000
family offers 32-bit microcontroller performance at the price level of 8-bit microcontrollers.
That makes Infineon the first semiconductor provider worldwide to achieve this without the
loss of efficient peripherals (i.e. functions in the chip for communicating with the outside
world or real-time controls). This is made possible by the combination of the ARM® 32-bit
core with our comprehensive peripheral functions as well as the consistent focus of the
XMC1000 family on its target applications.
> Easy module with silicon carbide components and other power semiconductors
> The first fully processed 150-millimeter silicon carbide wafer
65INFINEON TECHNOLOGIES ANNUAL REPORT 2013
RESEARCH & DEVELOPMENT

Particularly when it comes to these types of applications, developers expect a high degree
of scalability in microcontroller families due to cost pressure. For this reason, Infineon
offered the XMC1000 family in three different series right from the start: the XMC1100
(entry-level series for sensor applications), the XMC1200 (feature series for LED lighting
and man-machine interfaces) and the XMC1300 (control series for digital power conversion
and simple electric motor controls). The main differences between the three series are
memory size and peripheral equipment. Thus the XMC1000 family embodies a deep under-
standing of the system requirements for simple 8-bit industrial applications.
Time-to-market is a key factor for our customers. We support them with the easy-to-operate
DAVE™ (Digital Application Virtual Engineer) development environment. DAVE™ apps
provide developers with a complete range of easy-to-combine, application-oriented software
components, which greatly simplify software development for microcontrollers and there-
fore enables our customers to get their product to market more quickly with XMC1000
microcontrollers. The wide variety of application-optimized peripheral functions, combined
with the support of our customers in developing software, is our unique selling point in
this product segment.
High development flexibility with TRENCHSTOP™ 5 IGBT technology
For physical reasons, when designing power transistors, not all properties can be optimized
independently from one another. Particularly in the field of IGBT technology, it is not possible
to minimize losses caused during switching independently from losses when switched on.
With the new TRENCHSTOP™ 5 IGBT technology, however, we have managed to reduce
both switching and on-state power losses quite considerably. Furthermore, the technology
is available in two different versions: one for the direct replacement of previous IGBTs,
and a second version optimized for very fast switching. This enables the developer to
select the most suitable module and minimize losses, depending on his system design
considerations.
TRENCHSTOP™ 5 has been specially developed for typical 650-volt applications, such
as photovoltaic inverters, uninterruptible power supplies and electronically controlled
welding equipment. The higher switching frequencies mean that firstly, smaller passive
components can be used, and that secondly electromagnetic compatibility can be improved.
These factors reduce system costs for the customer, boost efficiency, and improve reli-
ability. Higher switching frequencies mean that the auditory threshold of 20 kilohertz can
be exceeded, which helps avoid the humming or whistling noises that can sometimes be
heard in power supplies and control cabinets.
Blade: innovative, chip-embedded packaging technology for DC/DC conversion
Halfway through the year, Infineon brought a new packaging technology onto the market,
named Blade. This is used for DC/DC conversion, necessary for processors in computer
and telecommunications systems, including servers, PCs, laptops and gaming consoles.
The new technology makes it possible to integrate several power semiconductor compo-
nents in an extremely small form factor with excellent electrical properties, thereby ideally
fulfilling the growing requirements in terms of power density and compactness.
The first product in the Blade family, known as DrBlade, integrates two low-voltage
MOSFET power transistors of the OptiMOS™ family and a driver IC. For these components,
Infineon has already won customer orders for server platforms from worldwide leading
server manufacturers.
> Blade packaging seen from below
INFINEON TECHNOLOGIES ANNUAL REPORT 2013
GROUP MANAGEMENT REPORT – THE INFINEON GROUP66

The innovative Blade technology, which has been developed at our backend site in
Regensburg (Germany), is based on the concept of embedded chip technology. The chip
is embedded in a multilayer sandwich consisting of epoxy layers which provide both
stability and insulation, and metal layers for wiring and connecting. This packaging tech-
nology has a number of advantages. Chips of varying sizes can be processed very easily
and connected with one another electrically. Compared with conventional packaging
solutions, the short connections enable high switching frequencies and less packaging-
related resistance. Moreover, the concept enables heat to dissipate more easily, which
in turn means additional increases in the efficiency of server systems across the entire
load range.
Infineon committed to new security standard CIPURSE™
CIPURSE™ is a newly defined, open standard for the secure processing of access controls
and electronic ticketing systems, such as for public transportation systems. Infineon was
a driving force in the definition of this international standard. The standard was defined
by the OSPT Alliance (Open Standard for Public Transportation), which is supported by
leading technology enterprises such as Giesecke & Devrient, Infineon, INSIDE Secure,
Oberthur Technologies and Samsung.
The CIPURSE™ standard has already been implemented in many security products made
by Infineon. In November 2012, one of our products, the SLS 32TLC security controller, was
awarded the “Sesames 2012” by the chip card industry for most innovative product in the
“Transport” category (see the “Awards” chapter).
The SOLID FLASH™-based SLS 32TLC security controller is the first solution worldwide to
support both the CIPURSE™ standard with its higher security requirements and conven-
tional systems used in public transportation systems. The security controller is thus ideally
suited for upgrading existing transport solutions on the basis of the Mifare technology,
which was already introduced a number of years ago, in accordance with the more advanced
and secure CIPURSE™ standard that features state-of-the-art encryption processes. Infineon
will offer CIPURSE™-based products for an entire range of contactless applications, such
as temporarily valid tickets, multifunctional cards and NFC-based mobile payment.
Major Research and Development cooperations
Cooperation with industrial partners, universities and non-university research institutions
plays a considerable role in boosting the innovative strength of Infineon. The primary aims
of these cooperations are:
> to develop and expand the network of industry, science and universities and also to
increase the level of communication between Infineon and these organizations,
> to gain a better understanding of the requirements of end-customer products and thus
greater system knowledge in as many of our target markets as possible,
> to enhance the attractiveness of Infineon as an employer for highly qualified engineers.
Moreover, Infineon participates in publicly funded research programs.
> 3D computer tomography of Blade package technology
P see page 110
67INFINEON TECHNOLOGIES ANNUAL REPORT 2013
RESEARCH & DEVELOPMENT

New 3D image sensor chips from Infineon enable contactless gesture
control for computers and electronic devices
In May 2013, Infineon announced the introduction of a family of 3D image sensor chips
designed for contactless gesture recognition. The chips were developed in cooperation
with pmdtechnologies GmbH, a company based in Siegen (Germany), the world’s leading
provider of technologies for 3D image sensors which measure distances using the time-
of-flight method. Our 3D image sensor chips are the first worldwide to contain a field of
pixels for 3D image recognition together with analog-digital converters, lighting control
and digital output. The integration of these elementary components makes it possible to
manufacture extremely compact, high-precision 3D camera systems.
Infineon 3D image sensor chips both simplify and improve interaction between man and
machine. They make it possible to quickly and reliably detect finger movements and
hand gestures and thereby supplement interfaces to computers and entertainment devices
familiar to the user, such as mouse, stylus or touch screen. Furthermore, we see other
application options for our 3D image sensors in the field of automotive engineering, such
as the operating of radios, telephones, navigation systems or air conditioning by means
of gesture control as an alternative to buttons or touch screen solutions.
The centerpiece of a 3D camera is the sensor, which separately measures the transit time
of light to an object and back for each pixel. The image sensor is similar to other chips for
digital cameras, except that a pixel not only captures direct light, but also measures transit
time. Due to their complex structure, the pixels are large in comparison with those of digital
cameras, and the resolution is lower. However, at 352 x 288 pixels, the Infineon sensor
provides one of the highest resolutions on the market in the field of 3D image sensors.
3D cameras made by pmdtechnologies with 3D image sensor chips made by Infineon
provide a degree of miniaturization not achieved before. The high level of integration
of various functionalities makes it possible to reduce not only the cost, but also the
size of the entire camera module. Thus the reference design created with the Infineon
chip is the smallest 3D camera with gesture recognition currently on the market.
Infineon and Sungrow expand cooperation in the field of renewable energy
From our customers we can learn how to enhance our understanding of their applications
and markets. In order to gain a better insight into the requirements of the Chinese market
in the field of photovoltaic inverters, in March 2013 Infineon expanded its cooperation
with Sungrow, the Chinese market leader for photovoltaic inverters (see also the chapter
“Highlights 2013”)
Sungrow is a specialist in the field of power supplies and power grid input for renewable
energy, particularly in the fields of photovoltaics and wind power. The cooperation with
Sungrow began back in 1997, as Sungrow built its first photovoltaic inverters with IGBTs
made by Infineon. Now, mainly cooperation at a technical level is being extended.
China is gradually developing into the largest photovoltaic inverter market in the world.
The inverters, which are developed and manufactured in China, not only fulfill the require-
ments of the Chinese market, but are also becoming increasingly important in other
countries and regions. Cooperation with Sungrow provides Infineon with growth opportu-
nities both on the Chinese market and in other regions where Sungrow is active, such
as Europe, North America and Australia.
> The “CamBoard pico-s” made by pmdtechnologies is the smallest 3D camera with gesture recognition capability on the market
> 3D sensor chip with 101,376 pixels
P see page 104
INFINEON TECHNOLOGIES ANNUAL REPORT 2013
GROUP MANAGEMENT REPORT – THE INFINEON GROUP68

Key project “Enhanced Power Pilot Line” started under the leadership of Infineon
Europe is a leading region in the manufacturing of power semiconductors and it aims
to further consolidate this top position with the two research projects “Enabling Power
Technologies on 300-mm Wafers” (EPT300) and “Enhanced Power Pilot Line” (EPPL). The
EPT300 and EPPL projects are jointly financed by the European Commission as part of
ENIAC, the participating countries Austria, Germany, France, the Netherlands, Portugal
and Italy as well as consortium partners.
EPT300 is a European research project comprising 22 partners from four different countries
and was started in April 2012 under the leadership of Infineon. The aim of the project is
to research the basics of the manufacturing of power semiconductors on 300-millimeter
wafers along the entire value-added chain of manufacturing, including material research
into silicon, semiconductor development including 3D integration (stacked power semi-
conductors) and the further development of logistics and automation technologies.
The kick-off event for EPPL, which is to become one of the largest European research
projects over the coming years, was held in April 2013. The main focus of this research is
the further development of power semiconductor technologies and their manufacturing
methods. Overall, 32 partners from the fields of business and science from six European
states are working together with the one common aim of setting up a cross-location pilot
line (in Villach and Dresden) for producing the next generation of power technologies.
The project also includes new volume production processes as well as the improvement
of 300-millimeter thin-wafer manufacturing technologies. The aim by the end of the project
in 2016 is to create qualified 300-millimeter pilot lines and four demonstration applica-
tions for MOSFET power transistors, IGBTs and smart power technologies.
The EPT300 and EPPL projects are part of the expansion of Europe as a key manufacturing
location.
“SeManTiK” subsidized project researches latest chip integration technologies
for contactless identity documents
What are the design requirements for contactless electronic identity documents, such as
ID cards, passports and drivers’ licenses, in order to ensure reliability throughout their
many years of validity? This question is currently being addressed by Germany’s Federal
Printing Office (Bundesdruckerei), Infineon and the Fraunhofer IZM (Institute for Reliability
and Microintegration) as part of a subsidized project known as SeManTiK (secure and
long-life eID applications for human-technology cooperation).
The project partners are investigating new, reliable integration technologies and realistic
models for testing and predicting the lifespan of identity documents. Identity documents
are valid for a number of years and frequently subject to harsh treatment during this time.
For this reason they need to be extremely durable, but also secure and reliable at the same
time. The aim is to develop multifunctional, long-lasting, fault-free technologies for identity
documents. In order to realistically test the reliability of these technologies, there is a need
for new, standardized testing procedures and simulation models, which will be investigated
in the course of this project.
SeManTiK opens up new approaches to the qualitative assessment and selection of exist-
ing, long-life electronic high-security documents. The research project is a major step
towards achieving the goal of being able to reliably predict the required durability of these
documents in the laboratory.
G see glossary, page 290
69INFINEON TECHNOLOGIES ANNUAL REPORT 2013
RESEARCH & DEVELOPMENT

OPERATIONS
RAISING THE DEGREE OF
AUTOMATION IN DRESDEN
In the 2013 fiscal year the second of three
automation expansion stages has been
completed in the 200-millimeter frontend
site Dresden (Germany). After completion
of the third expansion stage, our frontend
location in Dresden will be internationally
leading in terms of automation. The robot
shown in this picture serves to provide fully
automated wafer loading and unloading
of cleanroom equipment. Gripping the black
carriers safely is particularly challenging.
INFINEON TECHNOLOGIES ANNUAL REPORT 2013
GROUP MANAGEMENT REPORT – THE INFINEON GROUP7070

Investments in 2013 fiscal year reduced
sharply to €378 million.
Expanded manufacturing capacities swiftly
utilized in second half of year.
Newly introduced production planning tool
enables flexible reaction to fluctuating demand.
Performance in the 2013 fiscal year
Investments during the 2013 fiscal year totaled €378 million, down sharply on
the €890 million spent in the previous year. In view of the slight dip in revenue
recorded in the 2013 fiscal year and the availability of existing capacities, the
significant year-on-year decrease in investment volume was possible and made
sense financially.
Apart from the expansion of volume production on 300-millimeter thin wafers,
which is strategically important for Infineon, a comparatively small sum was
invested in additional manufacturing capacity. The slightly lower level of revenue
meant that investments expressed as a percentage of revenue were reduced
significantly from 22.8 percent in the 2012 fiscal year to 9.8 percent in the 2013
fiscal year. €63 million of expenditure-related investments for intangible assets,
including capitalized Research and Development costs (2012: €58 million).
Almost two thirds of property, plant and equipment additions totaling €315 mil-
lion were invested in our frontend sites and the remainder in the backend.
Most of the amount spent on property, plant and equipment in frontend and
backend sites were attributable to the following:
> adaptation and re-equipping of manufacturing lines due to changes in
the product portfolio, i.e. the commencement of volume production for new
technologies and products,
> an increase in the level of automation,
> the addition of inspection machinery designed to improve the stability and
quality of both individual processes and entire manufacturing lines.
The measures taken in the wake of the economic crisis in 2009 to underpin our
ability to react quickly to changing demand cycles have borne fruit. Towards the
end of the 2012 fiscal year, we reacted without delay to the renewed downturn
and shut down manufacturing capacities to reduce costs. In order to benefit from
the strong growth in revenue in the second half of the 2013 fiscal year, it became
necessary to swiftly reactivate our manufacturing capacities without impairing
product quality. Within nine months we were able to boost our revenue by 24 per-
cent from the low of €851 million recorded in the quarter to December 2012 to
€1,053 million in the quarter to September 2013. As a result, capacity utilization
at our various sites rose and the cost of under-utilized capacity, which totaled
€64 million in the first quarter of the 2013 fiscal year, dropped to €20 million in
the final quarter.
We operate a total of twelve manufacturing sites in eight countries: Dresden,
Regensburg and Warstein (all in Germany), Villach (Austria), Cegléd (Hungary),
Morgan Hill (USA), Beijing and Wuxi (both in China), Singapore, Malacca and
Kulim (both in Malaysia) as well as Batam (Indonesia). As of 30 September 2013,
our manufacturing sites employed a workforce of 19,458 people (30 September
2012: 19,274 people).
22.8 %
9.8 %
G 32
Investments ¹
€ in millions
Investments Percentage of revenue
890
378
2012 2013
1 without financial investments
71INFINEON TECHNOLOGIES ANNUAL REPORT 2013
OPERATIONS

The main areas of investment in the 2013 fiscal year
Adjacent to the existing “Kulim 1” manufacturing building at our 200-millimeter frontend
site in Kulim (Malaysia), we have now erected the shell of a second manufacturing build-
ing: “Kulim 2”. In the course of the 2013 fiscal year, freight elevators and electricity and
water supply systems were installed. The air conditioning system was the final part of the
infrastructure to be installed, which was completed in July. It not only keeps the interior at
a basically cool temperature, but also dehumidifies the ambient air. This is essential in
a region where relative humidity is high, in order to prevent corrosion. The utilities were all
made operational during the first quarter of the fiscal year. The plant is now in a so-called
“weatherproof” condition and therefore prepared for fast completion of interior facilities
as well as the equipping of the cleanroom with cleanroom tools as soon as demand begins
to grow.
With a view to maintaining their competitiveness in the long term, we have also invested
in our European sites. In order to secure the future of the 200-millimeter frontend site in
Dresden (“Dresden 200”) we have continued our program of raising the level of automation
and completed the second of three automation stages in the 2013 fiscal year. We expect
“Dresden 200” to have a degree of automation similar to that of 300-millimeter plants by
the time the third stage of automation is completed. “Dresden 200” will then be one of the
internationally leading 200-millimeter manufacturing sites in terms of automation.
Furthermore, in “Dresden 200” we have continued to expand manufacturing capacities
for copper-based technologies and will achieve target capacity once the third and final
stage of expansion has been completed in the 2014 fiscal year. That will then complete the
conversion of the manufacturing line for components with aluminum-based metal layers
on components with copper-based metal layers.
As part of the technology transfer from 200- to 300-millimeter wafers and for new develop-
ments, for our 300-millimeter thin-wafer pilot line in Villach (“Villach 300”), a broad range
of new manufacturing processes will be developed and qualified for volume production:
the next technologies to move to 300-millimeter technology are OptiMOS™, IGBTs and
analog/mixed-signal components. In addition, manufacturing capacity for our CoolMOS™
family of high-voltage power transistors has been expanded.
At the 300-millimeter plant in Dresden (“Dresden 300”), we initiated preparations for
manufacturing. We are also in the process of developing the required manufacturing tech-
nology for volume production. With this aim in mind we have invested in cleanroom tools
for CoolMOS™ power transistors as well as in the surrounding infrastructure. Hence volume
production on 300-millimeter manufacturing technology for power semiconductors was
commenced at both the Villach (Austria) and the Dresden (Germany) sites in the course of
the 2013 fiscal year.
As a leading manufacturer of semiconductors with a high degree of in-house manufacturing,
Infineon sees innovations in packaging, assembly and bonding technologies as just as
important as progress in the field of wafer processing. The same is true for power semi-
conductors in the high-voltage category (such as IGBT modules), those in the low-voltage
category (such as MOSFETs) and also radio-frequency components (such as low noise
amplifiers for GPS navigation). We expect that in a few years the majority of innovations
will be made in the field of packaging technology. For this reason, our backend compe-
tence centers in Regensburg and Warstein (both Germany) play a crucial role in our
long-term strategy.
In Regensburg (Germany), we have developed an extremely flat packaging technology named
Blade over the last few years, which is now ready for volume production (see also “Blade:
innovative chip-embedded packaging technology for DC/DC conversion” in the chapter
“Research & Development”). During the 2013 fiscal year we set up the first manufacturing
line for this innovative package.
> “Kulim 2” – the second 200-milli-meter manufacturing building at our frontend site in Kulim (Malaysia)
> A part of the building for the 300-millimeter pilot line in Villach (Austria)
P see page 66
INFINEON TECHNOLOGIES ANNUAL REPORT 2013
GROUP MANAGEMENT REPORT – THE INFINEON GROUP72

Warstein (Germany) is our competence center for package and connection technology for
IGBT modules, where a new multistory building has been completed. The highly automated
cleanroom tools take up two of the floors. Among other products, the HybridPack™ modules
for hybrid and electric vehicles and the technologically similar IGBT modules for industrial
applications are scheduled to be manufactured there in the future. We have also continued
to expand Warstein as a center of innovation for IGBT connection technology by establish-
ing laboratories and development areas on two additional floors.
In Cegléd (Hungary) a manufacturing line for coating IGBT modules with the new TIM
(Thermal Interface Material) was put into operation in November 2012. One of the high-
lights of the fully automated line is the optical inspection system, which checks the
quality of the coating at high speed and with extraordinary precision.
Further information on our manufacturing strategy is available under “Manufacturing
strategy” in the chapter “Finances and Strategy”.
Development and manufacturing cooperation for 40-nanometer
manufacturing technology signed
In the field of power semiconductors and sensors, Infineon continues to rely on its own
manufacturing competence and thus on in-house manufacturing of these components. We
have expanded our partner network for CMOS technologies and entered into development
and manufacturing cooperation for the 40-nanometer embedded Flash process technology
with Globalfoundries Inc., headquartered in Silicon Valley. The agreement covers the joint
development of the manufacturing technology on the basis of Infineon’s embedded Flash
cell and the manufacturing of microcontrollers with 40-nanometer feature size for auto-
motive, chip card and security applications.
Initially, Globalfoundries Inc. will manufacture our products on the basis of 40-nanometer
manufacturing technology at its Singapore site and later at its site in Dresden (Germany).
The partnership with Globalfoundries is in keeping with our strategy of developing our
CMOS-based process technologies with feature sizes of 65 nanometers and smaller,
together with partners and to have these products manufactured by them. We continue
to be in partnership with TSMC for 65-nanometer embedded Flash process technology.
New “LeanPlanning” production planning tool introduced
The manufacturing of semiconductors takes an average of 8 to 16 weeks and, for industry-
specific reasons, a capacity adjustment between 3 and 18 months. The semiconductor
industry is known for its high capital intensity, long manufacturing lead times and strong
fluctuations in demand. It is a great challenge to optimally adapt manufacturing capacities
to meet demand in every market phase and to coordinate operational measures accordingly.
In the 2013 fiscal year we deployed a new planning instrument known as “LeanPlanning”
across the entire organization. “LeanPlanning” enables us to quickly and flexibly react to
changing market conditions. This tool makes it possible to view, aggregate or adjust in detail
all the currently available data in the system, such as order planning figures and manufac-
turing capacities. The recalculation of inventory levels and capacity utilization is performed
across all dimensions of the network in real-time, which means that orders can be pro-
cessed very quickly, in most cases automatically. The entire planning process accesses a
worldwide uniform information platform that shows the latest planning status: all of the
departments involved worldwide, from sales to marketing and from order planning to
manufacturing control and logistics, use one common database – a level of sophistication
that cannot always be taken for granted in today’s semiconductor industry.
P see page 30
73INFINEON TECHNOLOGIES ANNUAL REPORT 2013
OPERATIONS

Morgan Hill
Torrance
Manufacturing sites
Dresden, Germany
CMOS, analog/mixed-signal technologies, embedded flash
Regensburg, Germany
Analog/mixed-signal, power semicon -ductors, center of com-petence for sensors and metallization
Chip cards, power semi-conductors, discrete semiconductors, sensors, wafer-level packaging, center of competence for package development
Warstein, Germany
High-power semiconductor modules, R&D for modules
Cegléd, Hungary
High-power semiconductor modules
Villach, Austria
Power semicon-ductors, center of competence for thin wafer technology
Morgan Hill, USA
Center of competence for radio-frequency power transistors
Bucharest
Cegléd Bristol
Villach
Warstein
Padua
Munich, Neubiberg
Dresden
Duisburg
Augsburg
Regensburg
Linz
Graz
INFINEON TECHNOLOGIES ANNUAL REPORT 2013
GROUP MANAGEMENT REPORT – THE INFINEON GROUP74

Research & Development
Frontend manufacturing
Backend manufacturing
Batam, Indonesia
Power semiconductors
Kulim, Malaysia
Power semiconductors
Malacca, Malaysia
Power semicon-ductors, discrete semiconductors, sensors, ICs, package development
Singapore
Center of competence for chip and wafer testing
Wuxi, China
Chip cards, discrete semiconductors
Beijing, China
IGBT stack assembly
R&D AND MANUFACTURING SITES
Bangalore
Shanghai
Seoul
Wuxi
Beijing
Batam
Singapore
Malacca
Kulim
Research and Development sites
Site Application/function
Augsburg, Germany
Software for chip card applications
Bangalore, India Software and system development for automotive, industrial and chip card applications; design flow and library development
Beijing, China Application development
Bristol, UK Microprocessor systems for automotive applications
Bucharest, Romania
Power semiconductors for mixed-signal applications; chip card ICs
Dresden, Germany Technology development
Duisburg, Germany
ASIC and technology development
Graz, Austria Chip card applications and contactless systems; power semiconductors for automotive; sensor products
Kulim, Malaysia Technology development
Linz, Austria Radio-frequency ICs and software development for sensor products
Malacca, Malaysia Package technology
Morgan Hill, USA Radio-frequency amplifier components for base stations
Munich, Neubiberg, Germany
Technology integration; design flow devel-opment environment; library development; IC, software and system development for microcontrollers, ASICs, chip card ICs and power elec tronics for auto motive and industrial applications; development of manufacturing processes
Padua, Italy Power semiconductors for mixed-signal applications
Regensburg, Germany
Competence centers for technology, preassembly and package development; manufacturing innovation
Seoul, Korea Automotive electronic system solutions
Shanghai, China Application development
Singapore IC, software and system develop ment for automotive and industrial applications; package technology development; development of test concepts
Torrance, USA Digital power ICs
Villach, Austria Power semiconductors, mixed-signal ICs for automotive and industrial applications; development center for thin wafer technologies
Warstein, Germany
Product development Power Modules, package assembly technology and package technology for IGBT modules and IGBT stacks
75INFINEON TECHNOLOGIES ANNUAL REPORT 2013
R&D AND MANUFACTURING SITES

Achieving an excess return over the cost of capital is a key element of the financial objectives
of Infineon, aimed at increasing the value of the business on a sustainable basis. Infineon
endeavors to achieve this objective by employing capital efficiently to optimize revenue and
earnings in line with prevailing economic conditions. The planning and management system
comprises a variety of tools that enable us to assess current performance as the basis for
strategy and investment decisions. Our aim is to make the best possible use of our business
and entrepreneurial potential at all times.
As a high-technology company, Infineon operates within a cyclical and fast-moving economic
environment. Continual innovation in products and technologies is essential for maintain-
ing a leading market position. Manufacturing technologies are an important differentiating
factor for our business in many market sectors. In this situation, it is crucial for Infineon to
generate sufficient funds to be able to finance high levels of research and development
expenses and invest in manufacturing capabilities. Additional production capacity is added
to take advantage of growth potential, but always after giving full consideration to using
existing capacities as efficiently as possible in order to minimize the cost of under-utilized
production capacities.
Profitability is the key factor in financing operations internally and requires, of course, the
efficient use of financial resources.
We prioritize the following three success factors:
> profitability of the business portfolio,
> focus on cash flow generation,
> efficient use of capital.
Infineon uses a comprehensive controlling system to manage its business on the basis of
these three success factors. The system involves the use of financial and operating key
performance indicators. Information for controlling purposes is derived from the annual
long-term forecast, quarterly forecasting, orders received per week and actual monthly
financial results, allowing management to base its decisions on sound information with
respect to the current situation and future expected financial and operational developments.
Performance indicators
Key performance indicators and figures
In order to measure the effects of these selected parameters on the key success factors,
Infineon uses the following three metrics for corporate management:
> Segment Result to measure the operating profitability of the different businesses and
of the portfolio as a whole,
> free cash flow to measure the amount of cash generated or used excluding financing
activities, and
> return on capital employed (RoCE) to measure capital efficiency.
INTERNAL MANAGEMENT SYSTEM
INFINEON TECHNOLOGIES ANNUAL REPORT 2013
GROUP MANAGEMENT REPORT – THE INFINEON GROUP76

Segment Result is the key figure for measuring operating performance. Expressed as a
percentage of revenue (Segment Result Margin), it also measures the quality of revenue
performance and shows how well operations are being run. The operating performance
of Infineon’s segments is managed on the basis of Segment Result. Segment management
is directly responsible for optimizing the Segment Result.
Free cash flow enables us to measure how well operating profitability is being converted
into cash inflows. This key figure also provides information about the efficient use of
working capital and fixed assets.
Infineon also compares the actual/planned return on capital employed (RoCE) against
the cost of capital, in order to achieve its primary financial target of creating economic
value added.
The three performance indicators described above are also the cornerstones of the system
for variable compensation within Infineon. Most of the variable salary components for
employees and management are directly linked to these performance indicators.
Segment Result
Segment Result is defined as operating income (loss) excluding the following: asset impair-
ments (net of reversals); the earnings impact of restructuring charges and other related
closure costs; share-based compensation expense; acquisition-related amortization and
gains (losses); gains (losses) on sales of assets, businesses, or interests in subsidiaries,
and other income (expense), including litigation settlement costs (see note 40 to the
Consolidated Financial Statements for a computation of the relevant figures). This is the
measure that Infineon uses to evaluate the operating performance of its segments (for
an analysis of Group and individual segment performance, see chapters “2013 Fiscal year
exceeds expectations” and “The segments”).
Infineon continuously implements measures in all segments in order to improve Segment
Result, particularly by focusing on productivity and quality standard improvements at
manufacturing level, optimizing the product mix and variabilizing the cost base in the area
of cost of goods sold.
Stringent control of operating expenses also plays a key role. Therefore we pay particular
attention to research and development expenses, selling expenses as well as general and
administrative expenses. The aim is to optimize these costs in relation to revenue. This is
achieved by keeping business processes streamlined and implementing efficiency initiatives.
When necessary, these measures are supplemented in the form of short-term initiatives
such as projects aimed at optimizing general and administrative expenses.
Free cash flow
An important key performance indicator for Infineon is free cash flow, defined as net cash
provided by/used in operating activities and net cash used in/provided by investing activi-
ties, after adjusting for cash flows related to the purchase and sale of financial investments.
Free cash flow measures the ability to generate sufficient cash inflows to finance day-to-
day operations and fund required investments out of the ongoing business. It is Infineon’s
stated target to sustainably generate positive free cash flow (see chapter “Review of financial
condition” for an analysis of free cash flow in the 2013 fiscal year).
The main levers for generating free cash flow are profitability, the ability to manage working
capital efficiently and the level of investments.
P see page 267
P see page 23
P see page 36
P see page 129
77INFINEON TECHNOLOGIES ANNUAL REPORT 2013
INTERNAL MANAGEMENT SYSTEM

Infineon manages working capital levels stringently by focusing relentlessly on optimizing
levels of inventories, trade receivables and trade payables.
Since Infineon’s business is very capital-intensive, effective investment management plays
a key role in optimizing free cash flow. Free cash flow is considered by Infineon only at
Group level and not on a segment level.
Investments are managed using a combined top-down/bottom-up approach. Investment
focus is set in conjunction with the Annual Long-Term Plan, at which stage a capital invest-
ment budget is formulated for the Group. The operating units then agree on their investment
projects based on the pre-defined focus points and the approved budget. The budget
and the projects contained therein are regularly monitored and adjusted on the basis of
scenario forecasts as and when the need arises. Infineon takes a flexible approach to
investment that enables it to match planned investments to new requirements and chang-
ing market conditions. However, there are limits to flexibility set by long lead times involved
in setting up production capacities, commissioning, and obtaining the necessary customer
qualifications. Individual investment projects are continuously monitored for compliance
with timetables and budgets.
Return on Capital Employed (RoCE)
RoCE measures the ability of capital to provide a return and is defined as the operating
result after tax from continuing operations divided by capital employed. Capital employed
consists of fixed assets and net current assets. RoCE shows the ratio of profitability versus
the capital resources required to run the business.
RoCE =Operating result after tax from continuing operations
Capital employed
This key performance indicator describes how efficiently a company manages its resources.
RoCE is only analyzed by Infineon at Group level and not at segment level. A comparison
of a company’s RoCE and its weighted cost of capital provides information on the extent to
which shareholders’ and debt holders’ expectations regarding returns have been met.
Thus RoCE serves as a tool for value-based management.
Apart from profitability, RoCE is also influenced by asset intensity, of both fixed assets and
net working capital. Asset intensity describes the amount of assets necessary to generate
a level of revenue. For an analysis of the derivation of and change in RoCE in the 2013 fiscal
year, see the chapter “Review of financial condition”.
Other performance indicators
The principal performance indicators described above are supplemented by others that
provide information about growth potential, cost effectiveness by functional area, and
liquidity.
Growth and profitability performance indicators
Revenue and the rate of revenue growth are used to assess growth potential. As part of the
process of analyzing operating profitability in detail, Infineon considers earnings and costs
above the Segment Result line. This involves a review of gross profit, research and devel-
opment expenses, selling and general administrative expenses as well as the ratio of these
items to revenue. These performance indicators are used to manage the business both at
Group and at segment level. For an analysis of changes in the previous fiscal year, see the
chapter “Review of results of operations”.
P see page 125
P see page 118
INFINEON TECHNOLOGIES ANNUAL REPORT 2013
GROUP MANAGEMENT REPORT – THE INFINEON GROUP78

Liquidity performance indicators
A rolling cash flow forecast helps to ensure that Infineon has appropriate levels of liquidity
and an optimal capital structure. Liquidity is managed at Group level (and not at segment
level) using the following key performance indicators:
> Gross cash position: cash and cash equivalents plus financial investments.
> Net cash position: gross cash position less short-term and long-term debt.
> Net working capital: Current assets less cash and cash equivalents, less financial
investments, less assets classified held for sale, less current liabilities excluding short-
term debt, and current maturities of long-term debt, excluding liabilities classified as
held for sale.
> Investments: The total amount invested in property, plant and equipment, intangible
assets and other similar items, including capitalized research and development costs.
For an analysis of changes in these key performance indicators during the previous fiscal
year, see the chapter “Review of financial condition”.
Moreover, in order to avoid costs of overcapacity and/or capacity bottlenecks, the key
operational figures for capacity utilization and forecast capacity requirements are analyzed.
The results of this analysis are used in determining investment requirements.
Operational early indicators
The analysis of current and future performance is rounded off by using the following
operational early indicators:
> Orders received: the aggregate of all orders received by the Group from customers during
the relevant reporting period.
> Orders received as a percentage of revenue: the ratio of orders booked and revenue
recognized during the relevant accounting period (so called Book-to-Bill ratio).
The Book-to-Bill ratio gives a good indication of future trends in demand. If orders received
are greater than revenue recognized in a period, it is seen as an indication of future
revenue growth. In this case the Book-to-Bill ratio will be greater than one. A rate of less
than one indicates that future revenue is likely to decline. However, due to the specific
nature of Infineon’s business (e.g. consignment inventory arrangements for major custom-
ers), orders received is not used to a significant extent to manage the business and is not
used to evaluate performance.
For an analysis of orders received and the Book-to-Bill ratio in the 2013 fiscal year, see
the chapter “Review of results of operations”.
Actual and target values for performance indicators
Chapter “Report on expected developments, together with associated material risks and
opportunities” contains a table shows actual values achieved in the 2013 fiscal year for
the key performance indicators described above, along with expectations for the 2013 and
2014 fiscal year.
P see page 125
P see page 118
79INFINEON TECHNOLOGIES ANNUAL REPORT 2013
INTERNAL MANAGEMENT SYSTEM

In addition to the statutory audit of the Group Management report, KPMG AG Wirtschafts-
prüfungsgesellschaft, Munich, has provided independent assurance (“limited assurance”)
on the sustainability performance information in this chapter in accordance with the
International Standard for Assurance Engagements (ISAE3000), the pertinent standard
for assuring sustainability information. Further information, including the independent
assurance report issued, can be found in the Corporate Social Responsibility section of
Infineon website.
Corporate Social Responsibility (CSR) at Infineon is based on the principles of the UN Global
Compact, which we signed up for in 2004. We understand sustainability as the symbiosis
between economy, ecology and social engagement. The bases for our approach are current
legal requirements and the 10 Principles of the UN Global Compact. Furthermore, internal
rules and requirements, voluntary self-commitments, as well as our customers’ require-
ments, form an additional framework for our approach. This results in the following areas
of activity:
We are committed to continuously engage in all these areas of activity.
In 2013, Infineon was listed for the fourth time in succession in the Dow Jones Sustainability
Index, which assesses the sustainability performance of companies worldwide against
specific criteria. Furthermore, Infineon received the Sustainability Award in the “Runners- up”
category from the international investment firm RobecoSAM. The award is presented to
companies listed among the 15 percent most sustainable companies worldwide and which
have,within this group, achieved the greatest improvements. For more information please
see chapter “Awards”.
SUSTAINABILITY AT INFINEON
@ www.infineon.com/CSR_Reporting
Corporate Social Responsibility
at Infineon
G 33
Corporate Social Responsibility
Business Ethics
Environmental SustainabilityHuman Resources
Management, Human Rights
CSR Supply Chain
Management
Corporate Citizenship
Activities
Occupational Health
and Safety
P see page 110
INFINEON TECHNOLOGIES ANNUAL REPORT 2013
GROUP MANAGEMENT REPORT – THE INFINEON GROUP80

Materiality analysis and inclusion of stakeholders
According to the definition of the Global Reporting Initiative (GRI), a “materiality analysis”
means the gathering of the expectations that the various stakeholder groups have towards
an entity’s Corporate Social Responsibility approach. The necessary information can be
ascertained either by direct interviews or via other methods.
This analysis helps the entity identifying the Corporate Social Responsibility topics which
should be addressed. We conducted our first materiality analysis in 2012. For this purpose,
we evaluated international sustainability guidelines and directives, such as the OECD Guide-
lines for Multinational Enterprises, and applied a number of methodological approaches,
such as the EFQM (European Foundation for Quality Management) Model for Excellence and
the UN Global Compact Blueprint. We supplemented these approaches by dialogues with
our employees, customers, investors, non-governmental organizations (NGOs), sector
organizations and political decision makers.
Key topics identified included our environmental protection and health & safety policy, energy
efficiency, transparent reporting of non-financial performance indicators, sustainable
supply chain management as well as natural resources management.
Graphic 34 shows Infineon’s stakeholder groups and the channels used to engage with them:
Indicator
Listing in leading
sustainability indices
Summary of results in the
2013 fiscal year
Renewed inclusion in the Dow Jones
Sustainability Index and FTSE4Good
Index Series.
Infineon received the RobecoSAM
Sustainability Award in the
“Runners-up” category.
Target for the 2014 fiscal year
Listing among the top 15 percent
most sustainable semiconductor
companies worldwide according to
the Sustainability Yearbook.
Stakeholders
G 34
Stakeholders
Employees
– Quarterly “All Hands Meetings”
– Daily internal news
– “Great Place to Work” survey
– Compliance hotline 24/7
– Diversity projects
Politics
– Political dialogs
– Employees involved in
industry associations
– Workshops
Society and NGOs
– China Local Citizenship Project
– Citizenship activities
– Conferences and workshops
Customers
– Audits
– Services provided by experts
– Roadshows
– Infineon Service Center 24/7
Suppliers
– Principles of Purchasing
– Supplier assessments
– Workshops and trainings
Investors
– Annual Report
– Annual General Meeting
– Quarterly presentation
of segments
– Roadshows and conferences
– Quarterly reporting
81INFINEON TECHNOLOGIES ANNUAL REPORT 2013
SUSTAINABILITY AT INFINEON

The following measures relating to our stakeholders were implemented in the 2013 fiscal year:
The following pages contain further information on the various areas of activity with regard
to sustainability.
Continued development of sustainability reporting
In order to comply with increasingly demanding sustainability reporting requirements, we
have implemented a new sustainability reporting concept based on GRI 3.1.
Responsibility for our employees
The safety and health of our employees is of highest priority. Through comprehensive
preventive measures, we ensure a safe and healthy working environment which minimizes
the number of work-related accidents.
The Occupational Safety and Health Management System is certified in accordance with the
OHSAS 18001 standard at Infineon’s largest production sites and corporate headquarters.
Our experts implement concepts for workplace safety, which are designed to minimize risks
to our employees in the work environment. Our employees are regularly informed about
general or workplace-specific topics as well as topics based on operational circumstances.
In the 2013 fiscal year, around 32,460 hours of occupational safety education and training
of occupational safety and fire prevention experts were organized worldwide.
Customers
Employees
Suppliers
Politics
Investors
Society & NGOs
G 35
Projects in the 2013 fiscal year
Focus Highlights from projects in the 2013 fiscal year Influence on
CSR strategy – Implementation of a CSR policy– CSR chapter in Annual Report received independent limited
assurance verification – New worldwide reporting platform implemented for
non-financial performance information
CSR in the supply chain – Principles of Purchasing were updated– Conflict minerals’ supply chain analysis was updated
Corporate Citizenship – Voluntary activities
Customer information – Helpdesk for materials declarations– CSR inquires and questionnaires were answered
Management system and policy
– Implementation of a new energy management system and integration thereof into IMPRES (Infineon Integrated Manage-ment Program for Environment, Energy, Safety and Health)
– All European frontend sites as well as our corporate head-quarters were certified according to the ISO 50001 standard
– Methodology for determining our carbon footprint was improved
Indicator
Audit and verification of
CSR-related information
Publication of
CSR-related information
Summary of results in the
2013 fiscal year
Independent “limited assurance”
audit by external audit firm.
Worldwide implementation of a new,
GRI-certified reporting platform for
CSR-related information.
Target for the 2014 fiscal year
Independent “limited assurance”
audit by external audit firm and
reporting based on the require-
ments of the GRI Guidelines.
Review of the Infineon reporting
protocols included in the
CSR reporting tool in terms of
applicability of GRI 4.0.
INFINEON TECHNOLOGIES ANNUAL REPORT 2013
GROUP MANAGEMENT REPORT – THE INFINEON GROUP82

Since the 2013 fiscal year the collection and analysis of work-related accidents and injuries
information as part of our general data collection have been changed to meet the new
reporting approach as stated in the GRI requirements: the Injury Rate (IR) and the Lost Day
Rate (LDR). All accidents and injuries during working hours which result in an employee
being absent for at least one day are reported.
Infineon endeavors to prevent accidents through a combination of occupational safety
programs, training and other measures. The low Injury Rate of 0.32 in the 2013 fiscal year
and the low Lost Day Rate of 4.25 are illustrated in graphics 36 and 37:
Environmental sustainability in our manufacturing
Infineon has implemented IMPRES (Infineon Integrated Management Program for Environ-
ment, Energy, Safety, and Health) to control and monitor processes and activities in the
fields of environment (including energy management) on the one hand and occupational
safety and health on the other.
IMPRES is implemented at all significant production sites and since 2005 has been certified
according to ISO 14001 and OHSAS 18001 standards. At the end of 2012, our largest
European production sites, including the Campeon corporate headquarters, were certified
according to the new energy management system standard ISO 50001.
Indicator
Occupational safety
Summary of results in the
2013 fiscal year
We spent 32,460 hours in safety
education and training of occu-
pational safety and fire prevention
experts.
Full harmonization of reporting
process.
Target for the 2014 fiscal year
Accident reporting of the Injury
Rate in accordance with the Global
Reporting Initiative definition.
G 36
Injury Rate (IR) ¹
0.5
0.4
0.3
0.2
0.1
0
20132009 2010 2011 2012
1 Holidays and public holidays are included in the working hours.
The Injury Rate is calculated as follows: total number of injuries/total hours worked x 200,000.
G 37
Lost Day Rate (LDR) ¹
10
8
6
4
2
0
20132009 2010 2011 2012
1 Holidays and public holidays are included in the working hours.
The Lost Day Rate is calculated as follows: total number of lost days/total hours worked x 200,000.
83INFINEON TECHNOLOGIES ANNUAL REPORT 2013
SUSTAINABILITY AT INFINEON

Sustainable use of resources
Efficient use of natural resources is an increasingly important aspect of securing the
future, and makes a valuable contribution to sustainability within a frame of ecological and
economic targets. Optimizing the efficient use of resources has long been at the core of
Infineon’s sustainability strategy.
Water management
Efficient water management is an important element in the sustainable use of resources.
We have made considerable efforts to reduce water consumption at our production sites.
In accordance with the FAO definition (Food and Agriculture Organization of the United
Nations), water shortage exists in areas with less than 1,700 cubic meters of water per year
per capita. Infineon’s two Malaysian production plants are located in areas with such a
water shortage.
At both sites, water is obtained from local suppliers and, after use, discharged to municipal
wastewater treatment plants. Infineon will continue implementing different measures to
reduce water consumption at both sites.
In the 2013 fiscal year, total water consumption by our frontend and backend production sites,
including our Campeon corporate headquarters, totaled 19,270,342.9 cubic meters (m³).
Our water sources are diverse, as reflected in graphic 38:
Water consumption in liters per square centimeter manufactured wafer is an internation-
ally recognized parameter for water management at our frontend sites. In 2012, Infineon’s
frontend sites worldwide consumed approximately 33 percent less water to manufacture
one square centimeter of wafer than the global average reported in a survey conducted by
the World Semiconductor Council (WSC).
The following table shows a summary of results in the 2013 fiscal year and the targets for
the forthcoming fiscal year.
G 38
Water consumption
in cubic meters
25,000,000
20,000,000
15,000,000
10,000,000
5,000,000
0
20132009 2010 2011 2012
Groundwater Drinking water Non-drinking water
G 39
Standardized water consumption
per square centimeter manufactured wafer
Infineon ¹
WSC
67%
100 %
1 Frontend sites worldwide
Indicator
Water consumption
Summary of results in the
2013 fiscal year
In 2012, according to the WSC,
Infineon consumed 33 percent
less water to manufacture one
square centimeter wafer than the
global average of semiconductor
manufacturers.
10 percent of ultrapure water used
in production is recycled or reused in
other processes.
Target for the 2014 fiscal year
Our aim is to keep our water con-
sumption per square centimeter
manufactured wafer far below the
WSC average, irrespective of the
increase in product complexity.
INFINEON TECHNOLOGIES ANNUAL REPORT 2013
GROUP MANAGEMENT REPORT – THE INFINEON GROUP84

The comparatively low specific water consumption is the result of our water management
activities worldwide, as illustrated simplified in diagram 40.
Infineon sources water either from local suppliers as drinking or non-drinking or as ground-
water through its own water supply facilities.
At the sites in Regensburg (Germany) and Villach (Austria), water is withdrawn from Infineon’s
own wells and, after treatment, is used to cool production machinery. This approach also
helps reduce energy consumption. Furthermore, part of the water, after being used as cool-
ing water, is reused as ultrapure water for production.
After ultra-pure water has been used in production, it becomes wastewater and can be
discharged directly or indirectly, depending on its quality. Water that complies with the
relevant stringent official regulations can be discharged directly into rivers. Wastewater is
collected in substreams according to the level of contamination and then processed sepa-
rately using suitable wastewater treatment methods. For example, at our site in Regensburg
(Germany), the rinsing water fractions from its frontend activities are treated in a neutral-
ization plant, whereas the more heavily contaminated wastewater from its backend
electroplating activities is channeled to a water plant where heavy metals can be removed.
After completion of the treatment process, the water can be discharged into the public
sewage system.
Diagram 41 shows a breakdown of the water discharged.
Where technically feasible, part of the wastewater is redirected into our water reclaim system
and can then be reused in production. During the 2013 fiscal year, 572,767 cubic meters
(10 percent) of ultrapure water from production was reused.
G 40
Water management
Water withdrawal,
19,270,343 m³
Groundwater,
12,969,372 m³
Drinking water,
3,779,529 m³
Non-drinking
water,
2,521,442 m³
Water
treatmentProduction
Cooling
water,
10,332,741 m³
Ultrapure
water,
5,894,263 m³
Water discharges after production, 18,380,154 m³
Wastewater, 8,967,454 m³
Fulfi llment of water
quality requirements
Discharge to river,
4,296,946 m³
Wastewater
treatment plant,
4,670,508 m³
Indirect discharge Direct discharge
Wastewater
treatment
Fulfi llment of water
quality requirements
Discharge to river,
9,412,700 m³
G 41
Water discharges 2013
Wastewater – direct discharge
Wastewater – indirect discharge
Other water discharges
(excluding wastewater)
23.4 %
25.4 %
51.2 %
85INFINEON TECHNOLOGIES ANNUAL REPORT 2013
SUSTAINABILITY AT INFINEON

Energy, climate protection and carbon footprint
Energy efficiency at our production sites
Most of the energy used to produce semiconductors is electricity. This energy is required
on the one hand to provide a stable production environment with defined ambient con-
ditions in cleanrooms, and on the other hand to run the production sites. The main part of
our energy consumption is therefore attributable to frontend processes. A small proportion
of the energy is needed in our backend production sites and the smallest proportion is
consumed by our offices and laboratories.
Our main direct energy sources in the 2013 fiscal year are the one described in the table
“Direct Energy Sources”.
Worldwide indirect energy consumption at Infineon’s production sites and the Campeon
corporate headquarters amounted to approximately 1,188.8 gigawatt hours (GWh) in the
2013 fiscal year and consisted of electricity (94 percent) and heating (6 percent), our two
primary indirect energy sources.
Improving energy efficiency means reducing electricity consumption per production unit. For
frontends, according to an international comparison made by the semiconductor industry,
the production unit is defined as the manufactured silicon wafers in square centimeters.
This specific measure of energy consumption is more appropriate to assess energy efficiency
than absolute consumption. Infineon has measured itself against this international com-
parison, within the framework of the World Semiconductor Council (WSC), for many years.
In the 2012 calendar year, Infineon used 42 percent less electricity to manufacture one
square centimeter silicon wafer at its frontend sites than the worldwide average reported
by WSC.
By integrating the requirements of ISO 50001, Infineon has established in its major pro-
duction sites the necessary structures to enable systematical identification of optimization
potentials and, where appropriate, their implementation.
G 42
Energy consumption
in gigawatt hours
Direct energy consumption Indirect energy consumption
20132012201120102009
1,500
1,250
1,000
750
500
250
0
Direct Energy Sources GWh
Natural gas 107.61
Other 1.46
G 43
Standardized electricity consumption
per square centimeter manufactured wafer
Infineon ¹
WSC
58 %
100 %
1 Frontend sites worldwide
Indicator
Energy efficiency
Summary of results in the
2013 fiscal year
Implementation of an energy
management system and integration
into IMPRES.
Certification of the European
frontend sites including the
Campeon corporate headquarters
according to ISO 50001 standard.
Infineon frontends used 42 percent
less electricity to manufacture one
square centimeter wafer than the
world average reported by the WSC.
Target for the 2014 fiscal year
Our aim is to expand the ISO 50001
certification to cover all European
production sites and to create
comparable conditions at our Asian
production sites.
INFINEON TECHNOLOGIES ANNUAL REPORT 2013
GROUP MANAGEMENT REPORT – THE INFINEON GROUP86

Climate protection – greenhouse gases
Certain greenhouse gases – the so-called “perflu orinated compounds” (PFC) – are required
for technical reasons in the production of semiconductors.
These PFCs are used in the etching processes needed to structure wafers and to clean
production equipment used in chemical vapor deposition processes.
As part of its integrated environmental and climate protection concept, Infineon has made
an early start in reducing the use of these substances to a minimum.
All voluntary targets have been achieved up to date. With the help of technologies which
increase the conversion factor of gases already in use and through the use of new alter-
native gases with lower greenhouse gas potential, we have been able to reduce emissions.
A further measure was the worldwide optimization of our waste air abatement concept.
Individually tailored solutions were implemented at all relevant sites.
The measures described were part of our voluntary self-commitment under the Kyoto Protocol
of 1998 to reduce the emission of PFC gases − calculated in CO₂ equivalents – by 2010
to 10 percent below their 1995 values. Infineon achieved the targets under this voluntary
self-commitment by 2007.
Infineon total PFC emissions in the 2013 fiscal year amounted to 145,260.3 tons of
CO₂ equivalents.
We have set ourselves the goal that our PFC emissions by 2015 will not exceed
200,000 tons CO₂ equivalents. This is a challenging objective given the ever greater
complexity of our products, which in principle calls for greater use of PFCs.
200,000
160,000
120,000
80,000
40,000
0
G 44
PFC emissions
in tons CO₂ equivalents
20132009 2010 2011 2012
G 45
PFC emissions’ target
in tons CO₂ equivalents
250,000
200,000
150,000
100,000
50,000
0
2013 Target 20152010 2011 2012
Estimated emissions
(annual volume growth of 7.5 %)
Worldwide real PFC emissions
Target (maximal PFC emissions in 2015)
87INFINEON TECHNOLOGIES ANNUAL REPORT 2013
SUSTAINABILITY AT INFINEON

Infineon will continue to report its PFC emissions on a voluntary basis at both German
and European levels.
Carbon footprint
Complex processes and a large number of influencing factors have to be considered
when drawing up an entity’s carbon footprint (CO₂ balance). Infineon has developed its
own approach for this purpose which was further refined during the 2013 fiscal year.
The calculation of CO₂ emissions is based on the ISO 14000 standard, which is aligned
with the PAS (Publicly Available Specification) 2050 guideline issued by the BSI (British
Standards Institution) for determining the product-specific ecological impact of different
products. The first three of the five steps described in the PAS 2050 guideline are taken
into account here. They embrace the provision of the raw materials and supplies, and the
processing through to distribution to the customer. Further steps, namely the use phase
of the products by customers and their disposal cannot be calculated automatically, due
to the varying applications and fields of use Infineon products are subject to.
The following emissions and immissions are considered for the calculation:
Indicator
PFCs emissions
Summary of results in the
2013 fiscal year
Our PFC emissions, calculated
in CO₂ equivalents, were 7 percent
below the previous year’s value.
Target for the 2014 fiscal year
Our target is to keep PFC emissions
in the 2014 fiscal year to the level
of the previous year, assuming
comparable volumes of production.
Silicon-
waferFrontend Transport
Packaging materials
Rejects
Materials
Direct emissions
Raw materials
and supplies
Wastewater/Waste
Energy
Water
Emissions from
goods transport
Emissions from
goods transport
Energy consumption
distribution center
Packaging materials
Backend SalesCustomer
Applications
Process steps
Emissions
Immissions
G 46
Emissions and immisions considered in the calculation of the CO₂ footprint
INFINEON TECHNOLOGIES ANNUAL REPORT 2013
GROUP MANAGEMENT REPORT – THE INFINEON GROUP88

We base the calculation of our carbon footprint on the classification of direct and indirect
emissions set out in the “Greenhouse Gas Protocol”. Accordingly, “Scope 1” includes our
PFC emissions and the emissions derived from our direct energy consumption, “Scope 2”
emissions derive from our electricity consumption and heating and “Scope 3” includes the
remaining emissions along the whole value-added chain.
Including the impact of all significant sources of emission which are relevant from our
perspective (including materials used and logistics) the carbon footprint of Infineon’s
production sites amounted to approximately 1.2 million tons of CO₂ equivalents p.a. This
figure comprises “Scope 1” emissions amounting to 187,211 tons of CO₂ equivalents,
“Scope 2” emissions amounting to 552,675 tons of CO₂ equivalents and “Scope 3” emis-
sions amounting to 497,889 tons of CO₂ equivalents.
Products manufactured by Infineon on the basis of this carbon footprint and which are
supplied to our customers, raise the ecological efficiency of end-products and help generate
savings in relevant applications, over their whole lifecycle, of approximately 15.8 million
tons of CO₂ equivalents.
Even while accepting that life cycle assessments can be subject to imprecision due to the
complex issues involved, Infineon, through its products and innovations in combination
with efficient manufacturing, achieves a positive net balance of over 14.6 million tons of
CO₂ equivalents over their lifecycle.
CO₂ burden ¹
CO₂ emissions reduction by more than 14.6 million tons
1.2 million
tons
More than
15.8 million
tons
Net ecological benefi t:
CO₂ savings ²
1 This figure considers manufacturing, transportation, materials, chemicals, water/waste water, direct emissions,
energy consumption, waste, etc. and is based on internally collected data and externally available conversion
factors. All data relates to the 2012 fiscal year.
2 This figure is based on internally established criteria, which are explained in the explanatory notes. The figure
relates to the 2012 fiscal year and considers the following fields of application: automotive; lamp ballast control;
PC power supply; renewable energy (wind, photovoltaic); and drives. CO₂ savings are calculated on the basis of
potential savings of technologies in which semiconductors are used. The CO₂ savings are allocated on the basis of
Infineon’s market share, semiconductor content and lifetime of the technologies concerned, based on internal and
external experts’ estimations. Despite CO₂ footprint calculations are subject to imprecision due to the complex
issues involved, the results are nevertheless clear.
G 47
Carbon footprint
Ratio 1 : 13
Indicator
Ecological net balance
Summary of results in the
2013 fiscal year
The methodology used to measure
our carbon footprint has been
updated and refined, and the scope
of products considered for these
purposes widened.
Target for the 2014 fiscal year
The CO₂ saving enabled through
Infineon products over their lifecycle
is at least ten times higher than the
CO₂ emissions arising during the
manufacture of the products.
89INFINEON TECHNOLOGIES ANNUAL REPORT 2013
SUSTAINABILITY AT INFINEON

Waste management
Infineon’s waste management system aims to reduce waste volumes to a minimum and to
recycle waste which is unavoidable or to dispose it properly.
In the 2013 fiscal year, the total volume of waste was 23,201.4 tons. Of this, 15,070.8 tons
were classified as non-hazardous and 8,130.6 tons as hazardous waste.
Based on the information provided by our waste management companies, our waste was
disposed in the 2013 fiscal year as illustrated in graphic 49:
Where economically and technically feasible, certain materials can be recovered, either
internally or externally, and can therefore be incorporated in the production cycle again.
In the 2013 fiscal year, 47 percent of non-hazardous and 52 percent of hazardous waste
were recycled.
Our waste management activities at our frontend production sites during 2012 enabled
us to generate approximately 50 percent less waste to manufacture one square centimeter
wafer, than the worldwide average reported by the WSC.
Where waste is unavoidable, we try to implement recovery procedures with higher added
value. For example, the electroplating sludge resulting from our production plant in
Regensburg (Germany) is no longer deposited as landfill, but subject to a recovery proce-
dure in which the precious metal palladium is extracted.
G 48
Waste generation
in tons
20,000
16,000
12,000
8,000
4,000
0
20132009 2010 2011 2012
Hazardous waste Non-hazardous waste
1 Frontend sites worldwide
G 50
Standardized waste generation
per square centimeter manufactured wafer
Infineon ¹
WSC
50 %
100 %
G 49
Waste by disposal method in the 2013 fiscal year
Recycling
Landfill
Incineration
Chemical
treatment
Composting
49.48 %
8.97 %
28.91%
8.18 %4.46 %
Indicator
Waste management
Summary of results in the
2013 fiscal year
Approximately 49 percent of the
waste generated was recycled.
Our frontend production sites
generated approximately 50 percent
less waste per square centimeter
manufactured wafer than the world-
wide average reported by the WSC.
Target for the 2014 fiscal year
Our aim in the future is to produce
significantly less waste per square
centimeter manufactured wafer than
the worldwide average reported by
the WSC.
INFINEON TECHNOLOGIES ANNUAL REPORT 2013
GROUP MANAGEMENT REPORT – THE INFINEON GROUP90

Chemical safety
A very wide variety of chemicals are used in a large number of different process steps in
the manufacture of semiconductors. Infineon implements the highest standards when
dealing with hazardous substances in order to protect people and the environment from
potential exposure. Of course, Infineon complies with existing legal requirements.
The European chemicals legislation REACH (Registration, Evaluation, Authorization and
Restriction of Chemicals, Regulation (EC) No 1907/2006) provides a key regulatory frame-
work for the procurement and use of chemicals. REACH replaces a large number of existing
provisions and regulates the registration, evaluation, authorization and restriction of
chemicals on the European market. To ensure that REACH requirements are fulfilled within
our supply chain, Infineon has implemented them in its purchase specifications.
Further requirements concerning chemicals are contained in European Regulation (EC)
No. 1272/2008. The so-called CLP Regulation deals with the classification, labeling and
packaging (CLP) of substances and mixtures and replaces the previous classification and
labeling system of the Directives 67/548/EEC and 1999/45/EC.
The CLP Regulation represents the European implementation of the model regulations of
the United Nations’ GHS (Globally Harmonized System of Classification, Labeling and
Packaging of Chemicals). These model regulations, as an international classification system
with standard texts and hazard pictograms, are designed to minimize the risks to human
health and the environment from the manufacture, transport and use of hazardous chemi-
cals worldwide.
For the implementation of the new CLP Regulation there are some transition periods in
place up to 2015. Independently of the specific changeover plans of our suppliers,
Infineon will employ both classification systems alongside each other up to the end of
the transition periods. This approach is implemented on a worldwide basis.
Product-related environmental sustainability
Infineon products make a key contribution in terms of sustainability and CO₂ savings
in applications and final products and, as already described, are subject to a lifecycle
analysis to optimize their carbon footprint. Please see “Carbon footprint” in this chapter.
Under the REACH Regulation, there are no registration requirements for the so-called
“articles”. Since all Infineon products fall within the definition of articles, there are there-
fore no registration requirements for the substances contained in Infineon products.
According to REACH, there are notification obligations for substances in articles if these
substances (chemicals) appear on the so-called REACH candidate list (list of substances
of very high concern that may be subject to authorization) and are present in the article
in a concentration of 0.1 percent by weight or more. Infineon complies with the obligation
to inform European recipients by including an appropriate passage in its dispatch notes
and in the form of a REACH Statement.
European Directives 2000/53/EC on end-of-life vehicles (ELV Directive) and 2011/65/EU
on the restriction of the use of certain hazardous substances in electrical and electronic
equipment (RoHS Directive) regulate the use of certain substances in final products.
Although Infineon products do not fall directly within the scope of these regulations, they
must meet the requirements in their applications. We are working continuously on the
development of technologies and solutions which enable certain substances, such as
lead, to be replaced. We also provide comprehensive information to our customers on the
materials contained in our products in accordance with international standards.
P see page 88
91INFINEON TECHNOLOGIES ANNUAL REPORT 2013
SUSTAINABILITY AT INFINEON

Business ethicsIntegrity guides our conduct in relation to our customers, shareholders, business partners, employees and the public and forms the basis of our Business Conduct Guidelines.
The table below provides a brief summary of the results in this field during the 2013 fiscal year and the objectives set for the 2014 fiscal year:
For more information, please see chapter “Corporate Governance”.
As a UN Global Compact participant, Infineon has made a commitment to abide by the stated principles and reports the following exemplary activities in its progress made towards implementing its CSR concept:
Human rights Implementation Level of implementation
Principle 1 Businesses should support and respect the protection of internationally proclaimed human rights.
Our Code of Conduct, the Infineon Business Conduct Guidelines, reflect our commitment to comply with internationally proclaimed human rights, including the protection of personal dignity and privacy of every individual. We shall not condone human rights abuses. The Business Conduct Guidelines shall apply to both internal cooperation and conduct towards external partners. We require our suppliers and service providers to comply with the requirements included in our Principles of Purchasing, and monitor their compliance with these principles. Infineon also requires suppliers and service providers to comply with all applicable laws, including those related to working practices and forced labor. Information concerning this issue is available on our corporate ethics website.
100 % The Business Conduct Guidelines are binding to all employees. Participation in training in this field is mandatory and is repeatedly carried out at regular intervals.
Our Principles of Purchasing were revised in the 2013 fiscal year and have been published on the Internet.
Principle 2 Businesses should make sure they are not complicit in human rights abuses.
Labor Implementation Level of implementation
Principle 3 Businesses should uphold the freedom of association and the effective recognition of the right to collective bargaining.
Our Business Conduct Guidelines acknowledge the right of employees to join associations and the right to collective bargaining to agree on working conditions. Infineon and the respective employee associations work together constructively and in good faith as well as with mutual respect.
80 % 80 percent of our employees are working on sites at which collective agreements have been concluded and where independent employee representatives are in place.
Even at sites where, due to local circumstances, there are no employee representatives, work is carried out on the basis of agreements with employee representatives from the region.
Indicator
Business ethics
Summary of results in the 2013 fiscal year
24,200 employees worldwide received training on the Business Conduct Guidelines (code of conduct) and other compliance topics, such as antitrust.
Targets for the 2014 fiscal year
To maintain a similar level of training intensity.
Worldwide introduction of specific training on the topic of “anti corruption” for a defined group of employees, as the third pillar of corporate ethics training in the field (alongside code of conduct and antitrust training).
P see page 168
INFINEON TECHNOLOGIES ANNUAL REPORT 2013GROUP MANAGEMENT REPORT – THE INFINEON GROUP
92

Principle 4 Businesses should
uphold the elimination
of all forms of forced
and compulsory labor.
Infineon Business Conduct Guidelines reflect Infineon’s commit-
ment to comply with international proclaimed human rights. We are
therefore against any form of forced labor.
100 % All our employees are
entitled to terminate contracts
of employment unilaterally.
Principle 5 Businesses should
uphold the effective
abolition of child labor.
Infineon Business Conduct Guidelines also address one of the main
tasks of the Global Compact: We do not permit work to be carried
out by persons under the age of 15. Exceptions apply to employment
relationships in developing countries under the International Labour
Organization Convention 138 (minimum lowered to 14) or to govern-
mentally authorized job training courses or apprenticeship programs
that clearly benefit the persons participating.
100 % All our employees are over
the age of 15.
Principle 6 Businesses should
uphold the elimination
of discrimination in
respect of employment
and occupation.
As reflected in the Business Conduct Guidelines, discrimination
shall not be tolerated. An Infineon employer or an external business
partner shall not be discriminated against, harassed or offended
on the basis of race, color, national origin, gender, religion, age,
disability, union or political affiliation, sexual orientation, marital or
family status. Any forms of sexual harassment, corporal punishment,
physical coercion and verbal abuse are prohibited, as well as any
intimidating hostile or offensive conduct.
100 % Every Infineon employee world-
wide can, in compliance with
the Business Conduct Guidelines,
where appropriate ask questions,
seek advice, report suspected
infringements and raise concerns
in relation to compliance with
these Guidelines. Reports and
complaints can be made openly
or anonymously; each report
will be processed. If necessary,
Infineon will take the appropriate
measures.
Environment Implementation Level of implementation
Principle 7 Businesses should
support a precautionary
approach to environ-
mental challenges.
Our IMPRES program, which is certified in accordance with ISO 14001
and OHSAS 18001, is a symbiosis between responsibility for humans
and environment and economic success and includes our commitment
to efficient resources management in the interests of environmental
protection and ecological innovation.
Efficient energy management is particularly important in the world’s
attempts to save energy and reduce greenhouse gas emissions. At the
end of 2012, we therefore integrated our energy management system
in our matrix and obtained certification for the main production sites
in Europe, including our Campeon corporate headquarters, according
to ISO 50001.
Developing energy-efficient products is another key element of our
desire to save energy and to contribute to climate protection.
100 % 100 percent of all internal and
external ISO 14001, OHSAS
18001 and ISO 50001 audits
were successful.
100 percent of our EU frontend
sites, including our corporate
headquarters, are ISO 50001
matrix-certified since the end
of 2012.
Principle 8 Businesses should
undertake initiatives to
promote greater environ-
mental responsibility.
Principle 9 Businesses should
encourage the develop-
ment and diffusion of
environmentally friendly
technologies.
Anti-corruption Implementation Level of implementation
Principle 10 Businesses should work
against corruption in
all its forms, including
extortion and bribery.
The Management Board and the Supervisory Board of Infineon
Technologies AG view corporate governance as a comprehensive
concept for responsible, transparent and value-added corporate
management. They obtain regular reports from the “Compliance
Officer“ on measures to combat corruption and any infringements
within the business.
Infineon Business Conduct Guidelines define the requirements
relating to treatment of business partners and third parties. This also
includes compliance with fair business practices. Our “Compliance
Officers“ are responsible for checking this.
100 % Training on the Business Conduct
Guidelines is mandatory for all
employees and is repeatedly
carried out at regular intervals.
The topic “Anti-corruption“ is
part of this training.
93INFINEON TECHNOLOGIES ANNUAL REPORT 2013
SUSTAINABILITY AT INFINEON

Our responsibility along the supply chain
At Infineon, we are constantly working on anchoring our own CSR standards based on the
10 principles of the UN Global Compact in our supply chain. The basis for this was achieved
by the creation of new Principles of Purchasing and the revision of the CSR contract clauses
in the 2013 fiscal year.
A concrete example in the field of supply chain management is the avoidance of conflict
minerals.
Pursuant to section 1502 (“Conflict Minerals Provision”) of the Dodd-Frank Wall Street
Reform and Consumer Protection Act, entities which are required to report to the US Securi-
ties and Exchange Commission (SEC) must declare whether any of the so-called conflict
materials or related derivatives (currently Gold, Tantalum, Tungsten and Tin) used to make
the reporting entity’s products are of relevance and whether they originate from the Demo-
cratic Republic of Congo or an adjoining country. Infineon itself is not subject to this SEC
reporting requirement.
Nevertheless, Infineon, as a voluntary commitment, started in 2009 a request to its sup-
pliers to provide information about the use of the above-mentioned minerals, which was
completed in 2010. This request for information was repeated in the past fiscal year. As a
result of our assessment, a “Conflict Minerals” statement could be drawn up, listing the
smelters identified in our supply chain. The analysis of these results by region shows that
these smelters are located in Europe (12 percent), Asia (74 percent) and America (14 per-
cent) (please see graph 51). Furthermore, none of the smelters are located in the Demo-
cratic Republic of Congo or an adjoining country.
Corporate Citizenship
As a socially committed company, we consider as a voluntary approach to make an ongoing
positive contribution to the development of the local communities in which we operate.
Corporate Citizenship, understood as our voluntary commitment to these communities, is
therefore a key component of our CSR concept.
Indicator
CSR supply chain
management
Summary of results in the
2013 fiscal year
New Principles of Purchasing have
been published on our website.
Revision of the CSR contractual
clauses.
Target for the 2014 fiscal year
Review of the CSR information
and evaluation of suppliers within
a new Supplier Management Tool.
G 51
Smelters by region
74 %
12 %
14 %
Asia Americas EuropeIndicator
Conflict minerals
Summary of results in the
2013 fiscal year
Infineon carried out an analysis of
its supply chain already in 2010.
Our supply chain was again assessed
in 2013 with regard to the non-use
of conflict minerals.
Target for the 2014 fiscal year
Publication of the “Conflict Minerals”
statement on the Infineon website
and updating of the Internet infor-
mation on this subject.
INFINEON TECHNOLOGIES ANNUAL REPORT 2013
GROUP MANAGEMENT REPORT – THE INFINEON GROUP94

Our social commitment is expressed in donations in kind, monetary donations or in the form of voluntary activities by our staff (volunteering).
We have defined the following strategic focus areas in the field of Corporate Citizenship: “Activities in the field of ecological sustainability”, “Addressing local social needs” and “Education for future generations”. These focus areas are supplemented by our commitment in the field of emergency assistance in the event of natural and humanitarian disasters.
Human resource management, human rightsInfineon respects internationally applicable human rights, labor standards and fair business practices and ensures their compliance. We do not tolerate any infringement of these standards as reflected in the Infineon Business Conduct Guidelines.
For more information, please see “Business Ethics“ in the chapter “Sustainability at Infineon”, chapter “Corporate Governance“ and chapter “Our Employees“.
Indicator
Corporate Citizenship
Summary of results in the 2013 fiscal year
Integration of citizenship and sponsoring information in our worldwide reporting tool.
Target for the 2014 fiscal year
Strengthening of the internal network for global exchange.
Waste exchange: at our Dresden site employees can collect certain materials from Waste Management, such as packaging or drums, for their own use. This helps to reduce the amount of material which would otherwise be classified as waste and must be disposed of. The employees are requested to make a small charitable donation which is then given to organizations such as those that helped the victims of the floods in Germany in the summer of 2013.
Infineon has been investing in the future of children for many years. Our aim is to provide socially deprived children with new prospects for the future and a better environment to live in.This year at our site in China, a project was organized through a voluntary activity of our employees, who held lessons for children at a primary school near Zhenglou. Many of the children attending this school live with their grandparents and without their parents, who need to work far away from home.
Our plant in Regensburg (Germany) supported the tenth European workshop on “Phosphorus Chemistry” held by the Institute for Inorganic Chemistry at the University of Regensburg.Our Villach (Austria) plant donated around €25,000 to promote competitions and workshops dedicated to topics such as “Internationality and Integration” or “Innovation and Performance”.Our plant in Malacca (Malaysia) donated the equiva-lent of €3,000 to the “Charity Run” that raises funds for the “Melaka Cancer Society”. The organization supports cancer patients whose treatment is not covered by their general health insurance.
In the summer of 2013, a number of German towns and cities were hit by catastrophic flooding. Many of these places had to be evacuated. In total, Infineon donated more than €36,000 to support the people affected in these regions.The flooding in northern India caused widespread damage and many people lost everything they had, including their houses. Infineon donated €3,900 in emergency aid to the Indian Red Cross.
Activities in the field of ecological sustainability
Education for future generations
Addressing local social needs
Emergency aid for the victims of natural and humanitarian disasters
G 52
Examples of corporate citizenship activities at Infineon during the 2013 fiscal year
P see page 92
P see page 168 and 96
95INFINEON TECHNOLOGIES ANNUAL REPORT 2013SUSTAINABILITY AT INFINEON

Infineon’s achievements are wholly attributable to its employees. Their ideas, know-how
and successful work are of crucial importance to Infineon’s progress. In this year, too, our
human resources-related endeavor concentrated on three pillars: “Leadership excellence”,
“Promoting talent” and “Organizational development and employee commitment”.
Leadership excellence
The culture of leadership
Our global management training program was launched worldwide back in 2011 under the
title “Leading People in a High Performance Company”. The principal aim of this program
is to develop leadership skills through which staff are successfully encouraged to achieve
Infineon’s ambitious goals and motivated to make their own personal contribution. Good
leadership enables employees to achieve peak performance and to be successful. The
training program conveys a deep understanding of the most important aims and techniques
of excellent leadership. Seeing a reflection of one’s own leadership style can help improve
leadership skills. By communicating a uniform understanding of leadership, the training
program makes a key contribution to Infineon’s strategic direction. More than 1,500 man-
agers from all levels worldwide have participated in this training program by the end of
the 2013 fiscal year.
The training program “Leadership & Health” is an integral part of occupational health
management. The focus is placed on two aspects: responsibility of managers for their own
health and for the well-being of employees through a considerate leadership style. The
“Leadership & Health” program, which was launched in Germany in January 2012, applies
both these concepts. It is designed exclusively for top managers, in their capacity as
role models. In one-day courses, they learn to identify stress factors at the workplace more
effectively and to mitigate them. By the end of the fiscal year, some 65 percent of top
managers in Germany have participated.
Open and honest feedback
Openness and constructive two-way feedback between managers and staff is important for
a learning organization with motivated employees. Our jointly defined values, epitomized
in the “High Performance Behavior Model”, form the basis for this. This model translates
the corporate strategy and values into concrete behavioral descriptions. Eight dimensions
describe in short, simple and clear words which types of behavior help us become a High
Performance Company.
In the 2011 fiscal year, a revised version of “STEPS”, the basis for the annual dialog with
employees, was rolled out worldwide. At German sites this was implemented initially only
for senior level managers. Since the beginning of 2013, STEPS has been rolled out for all
employees in Germany. A corresponding agreement was reached with the Central Works
Council. One of the main benefits of the revised version is that it improves the quality of
the dialog between managers and staff members. The manager provides feedback not only
on the results the employee has achieved, but also the behavior displayed, following the
structure of the High Performance Behavior Models.
OUR EMPLOYEES
INFINEON TECHNOLOGIES ANNUAL REPORT 2013
GROUP MANAGEMENT REPORT – THE INFINEON GROUP96

The feedback process now also focuses more strongly on employees’ development pros-
pects. The “Development Conferences” introduced in 2012 allow talent to be identified
and promoted systematically – beyond organizational boundaries. In this way, employees
are given the opportunity for further development across departments. Several of these
global “Development Conferences” were organized during the 2013 fiscal year, for example
in Production, Quality Management and Research & Development.
Managers are expected to obtain feedback from their staff via the leadership dialog.
This helps the manager to reflect on his/her own leadership style, identify strengths and
potential areas of improvement and hence increase cooperation within the team as a
whole. The leadership dialog is carried out every two years, thus ensuring regular exchange
between staff and management. In 2012, all members of top management gave their
commitment to perform leadership dialogs. A further extension of the dialogs is planned
by 2015. Participation will then become mandatory worldwide for all managers with staff
numbering more than five. In Germany, this is already the case: an agreement to this effect
was concluded with the Central Works Council. The procedure was agreed for senior level
managers with the Management Staff Representation Committee, which also supports
the process.
Promoting talent
Talent management
Infineon’s specialist career path “Technical Ladder” was introduced more than 10 years
ago. The Technical Ladder allows more technically-minded staff to develop their careers,
similar to a management career path, without assuming direct leadership responsibilities.
It builds on skills which are particularly important for Infineon and which have been
established as the basis for human resources planning. The concept was revised during
the 2013 fiscal year: in addition to new career levels, the existing areas of expertise were
extended to include “Innovation”. This acknowledges an expert’s contribution to Infineon’s
success made through new and creative ideas and their successful implementation.
In the Asia-Pacific region, talent is encouraged with the aid of our Talent Management
Programs “ENGINE” and “TechStar”. Managing talent is a crucial factor for success and
is therefore an important task for all managers – both inside and outside the region. Top
management has an essential role to play, firstly in the selection of talent and then in
development measures such as mentoring.
In order to give equal consideration to management and technical careers, we offer the
two above-mentioned programs, namely “ENGINE” since 2011 (for management careers)
and “TechStar” since 2012 (for technical careers). Both programs focus on the key areas
of education, interaction with management and the practical application of what has been
learnt in specific projects. 2013 saw the first successful completion of the ENGINE program.
25 percent of participants were promoted and 44 percent changed jobs in order to be able
to further deepen their newly acquired expertise.
Encouraging diversity
As an international organization, we thrive on the diversity of our staff. Our global diversity
management provides the framework for a corporate culture which values the individuality
of each staff member and promotes equal opportunities – irrespective of age, disability,
ethnic-cultural origin, gender, religion or belief, or sexual identity. The focuses selected
may vary from one location to another and are tailored to local needs.
97INFINEON TECHNOLOGIES ANNUAL REPORT 2013
OUR EMPLOYEES

Infineon employs staff with a total of 81 different nationalities. The six most prevalent
nationalities represent 87.5 percent of the workforce, including German and Malaysian
nationals who account for just over 30 percent each. Furthermore, 70 of the nationalities
have a share of the total workforce of less than one percent each.
Employees
TotalUnder 30 years ¹ 30 to 50 years ¹ Over 50 years ¹
Middle and senior level management 4,174 – 76.2 23.8
Entry level management 4,973 3.6 84.8 11.6
Non-management staff 17,578 35.8 54.6 9.6
Total 26,725 24.2 63.6 12.2
1 Figures expressed in percentages based on the workforce at September 30, 2013, in the respective comparison group.
Of 9,446 female employees, 34.4 percent are under 30 years of age, 56.0 percent fall in the
middle age group and 9.6 percent are over 50. Of 17,279 male employees, 18.6 percent
are under 30 years of age, 67.8 percent in the middle age group and 13.6 percent are over 50.
Employees
TotalFemale ¹ Male ¹
Middle and senior level management 4,174 12.1 87.9
Entry level management 4,973 23.6 76.4
Non-management staff 17,578 44.2 55.8
Total 26,725 35.3 64.7
1 Figures expressed in percentages based on the workforce at September 30, 2013, in the respective comparison group.
Increasing the number of women in management positions worldwide is an important
aspect of Infineon’s diversity management strategy. In the period from 2006 to 2013, we
have succeeded in raising the proportion of women in senior management from 9 percent
to over 12 percent. Our targets have become more ambitious: we want to see the propor-
tion rise to 15 percent by 2015 and to 20 percent by 2020. We are also adhering to this
in the long term, in spite of the stagnation recorded in the 2013 fiscal year. On the way to
achieving this goal, it is important to establish changes in the organization sustainably,
which support the successful career development of female managers.
The Gender Diversity Network was initiated in December 2011 in Germany and Austria.
The network currently comprises 29 managers (21 women and 8 men). The mission of the
network is clearly defined: to make equal opportunities a core issue at Infineon and to
ensure that attractive working conditions are available, both for women and men. It is also
thanks to the Network that gender diversity has in the meantime become part of the
annual dialog with employees and is integrated into all relevant management seminars.
G 53
Nationalities (Infineon worldwide 2013)
30.7 %
30.4 %
9.4 %
7.1%
6.9 %
12.5 %
3.0 %
Malaysia
Germany
Austria
Indonesia
China
Singapore
Other
nationalities (75)
25
20
15
10
5
0
G 54
Women in management positions (Infineon worldwide)
Target
2020
20112006 2012 2013 Target
2015
11.4 %9.0 %
12.3 % 12.1%
15.0 %
20.0 %
INFINEON TECHNOLOGIES ANNUAL REPORT 2013
GROUP MANAGEMENT REPORT – THE INFINEON GROUP98

Finding the right balance between career and private life – for both genders – has also been
on Infineon’s agenda for many years now. It is of crucial importance for both women and
men on the road to professional success to reconcile profession, family, children and
career. Since 2010, all sites in Germany have been awarded the “audit berufundfamilie”
certificate. The audit process spans several years. For initial certification, concrete objec-
tives and measures are drawn up to implement a family-conscious human resources
policy. The results obtained are reported each year. Three years after the certificate has
been issued, a further audit is carried out: the attainment of the objective is reviewed and
new objectives are set. The “return from parental leave” process received a particularly
positive assessment at Infineon. Consultations before and after the leave are a key compo-
nent of this process. Likewise, it is possible to keep in contact with Infineon through
Intranet access and parent-child meetings during the parental leave. In 2013, the audit
was carried out for the first time in Austria and the certificate was awarded in July 2013.
The regional Diversity Team in Asia-Pacific concentrates on the themes of ethnic-cultural
origin, religion and age in particular. For example, our Indian site has set itself the target of
university graduates accounting for around 30 percent of newly recruited employees. In
Singapore, Malaysia and Taiwan, a “Silver Workforce” agreement is in place which enables
older staff to continue working if they wish after the statutory retirement age.
Cooperation and research arrangements with universities
Infineon is promoting cooperation arrangements with universities in order to complement
teaching and research with hands-on experience in the fields relevant to Infineon. Personal
contact with students and lecturers is crucial here, as illustrated, for example, by Infineon’s
many years of cooperation with the European UNITECH network. This initiative links nine
leading European technical universities with some 20 companies. In 2013, Infineon’s CEO,
Dr. Reinhard Ploss, held discussions in Milan with students and high-level business and
science representatives on the subject of “Engineering the Future of Europe”. A high level
of enthusiasm for technology and management was clearly perceptible among the students
during the many personal discussions.
The Infineon site in Warstein (Germany) was the host in 2013 to a three-day VDE (German
Electrotechnology Association) technical symposium on the subject of power electronics.
More than 50 university lecturers had the opportunity to exchange views with practitioners.
Infineon has now successfully organized this event for a third time, following those in
Dresden and Neubiberg (both Germany).
Each year, we organize a worldwide “University Event” for our doctoral students as part
of our Innovation Week. They make poster presentations of their latest research results
and discuss them with our experts.
Strategic cooperation arrangements with universities are of great importance especially
in the Asia-Pacific region. For example, in China a campus competition is an integral part
of our university program. This involves students of different universities completing a
specific technical task using our products. Prizes are then awarded for the best solutions.
Qualifications and training
Training expenses fell during the period under report to €7.3 million (2012: €7.6 million).
Our focus in this area was on developing the know-how and innovative skills of our work-
force, project management training and offers concentrating on improving the leadership
and feedback culture within the organization. In addition, strong growth was recorded in
free training measures, which take place at all of Infineon’s main sites worldwide, such
as web-based training sessions, a range of in-house training opportunities, mentoring
programs, innovation events and technical symposia.
G 55
Training expenses
€ in millions
5.8
7.6 7.3
2011 2012 2013 ¹
1 Including training expenses of the so-called
“Academies” in the different functional areas
99INFINEON TECHNOLOGIES ANNUAL REPORT 2013
OUR EMPLOYEES

Organizational change and employee commitment
Dialog with employees
The series of events “My Infineon. My Opportunities.” was continued in the 2013 fiscal
year. Its objective is to showcase the variety of opportunities offered by our Human
Resources function and to invite participants to engage in dialog. For example, in the 2012
and 2013 fiscal years, employees were invited to participate in events in Neubiberg,
Regensburg (both Germany) and Singapore on the subjects of “Young Talents”, “Diversity”
and “Learning & Development”. Similar events were also held at other sites, such as,
for example, Beijing, Shanghai, Shenzhen, Wuxi (all China), Kulim (Malaysia) and Warstein
(Germany).
With a view in particular to maintaining and promoting the mental health of staff, the
project “well-being@work” was launched at our site in Neubiberg (Germany). The project is
run jointly with employee representatives. On the basis of a staff questionnaire the factors
which contribute to psychological stresses in the workplace and which preventive measures
can be taken to counter them are identified. The following individual aspects are consid-
ered in the analysis: work tasks, work organization, social conditions at the workplace and
also workplace design. The first results were presented to the workforce in July 2013.
Further evaluation of the results and the definition of corresponding measures will take
place during the 2014 fiscal year.
Competence development
Our competence management identifies the skill sets and expertise we will need in the
future and demonstrates structured development paths for our employees.
Infineon’s largest manufacturing site in Malacca (Malaysia) launched a program in 2011
for structured competence development. The goal of this initiative is further developing
of key areas of expertise. The success of this initiative has also inspired other sites and
segments to boost knowledge management. Various functional academies have been
created to support this theme.
In October 2012, for example, the global “PMM Power & RF Academy” was set up. Its aim
is to construct a global learning platform especially for the areas of sales, marketing and
application development of the Power Management & Multimarket segment. It enables
staff to consolidate and build on their technical expertise and to plan their development
on an individual basis. Further academies exist, for example, in the fields of purchasing,
manufacturing, quality management and logistics.
This establishment and expansion of our learning landscape is promoted by the “Academy
Connect” initiative. Solutions across departments are devised in regular exchanges and
the academies are being developed further.
Fringe benefits
Fringe benefits are a longstanding tradition at Infineon and are also offered in various
forms on a voluntary basis. No distinction is made in this respect between full-time and
part-time staff. All benefits form an integral part of the overall remuneration concept
and reflect Infineon’s responsibility to its staff. The nature and scale of the benefits are
defined according to the respective regional statutory and standard market requirements.
In Germany and the Asia-Pacific region, for example, in addition to employer and employee-
financed pension plans, benefits granted include the items listed below. The precise
structure is specific to the location in each case.
INFINEON TECHNOLOGIES ANNUAL REPORT 2013
GROUP MANAGEMENT REPORT – THE INFINEON GROUP100

Industrial accident insurance Company car for work or as additional benefit
Paid sick leave beyond the statutory minimum Company car in exchange for salary waiver
Continued wage payment to surviving dependants in the event of death
Long-service awards
Sabbatical Preventive health program
Flexible transition to retirement pension Family-friendly services, such as for example in-house kindergartens or working together with local organizations offering day-care facilities for children, vacation activities for children
In the Asia-Pacific region, in addition to these benefits, life and hospital group insurance
policies, for example, are also offered, which extend beyond the statutory provisions.
Infineon also offers alternatives for flexible working hours, depending on individual
circumstances, in the form of trust-based flexi-time, part-time work or teleworking arrange-
ments. For example, in the Asia-Pacific region, 90 percent of all sites already offer flexi-time
and 60 percent of all sites allow teleworking.
Compensation
Infineon wishes to attract the best possible staff for the Company. To achieve this, there is
a need for attractive, market-compatible remuneration and for the workforce to participate
appropriately in the Company’s success.
On the other hand, sufficient account has to be taken of Infineon’s economic situation.
Due to the muted business outlook in the first quarters of the 2013 fiscal year and the
growing pressure on costs, it was therefore decided to defer pay increases worldwide by
six months. This measure represented a significant contribution to further cost savings
throughout the Group. All salary increases worldwide were affected – with the exception
of those required by law or under collective agreements.
The performance bonus for the employees covered by the Bavarian collective agreement
was developed according to plan, as provided for in the collective tariff agreement in
place with IG Metall Bavaria. We therefore increased the variable part of the bonus for the
employees covered by this agreement. This affords greater cost flexibility in economically
challenging periods and enables staff to benefit from Infineon’s success in periods of
economic prosperity.
For top management, a new long-term incentive (LTI) plan is being introduced in the 2014
fiscal year. Rather than issuing stock options as in past years, “performance shares” will
be granted. Essentially, the conditions of this plan are identical to those of the LTI plan for
the Management Board, which also takes effect in the 2014 fiscal year (see “Components
of the Management Board compensation system” in chapter “Compensation Report”). The
long-term incentive plan is designed to align the interests of our managers, our investors
and our company as a whole.
Outlook
Our human resources related work continues successful initiatives and programs. The
long-term human resources strategy contributes to Infineon’s further development as a
high-performance company: our aim is for our staff to be deployed competently and correctly
and to be motivated through personal success to contribute to Infineon’s overall success.
“Leadership excellence”, “Promoting talent” and “Organizational development and
employee commitment” will remain the vital pillars of our human resources work.
P see page 177
101INFINEON TECHNOLOGIES ANNUAL REPORT 2013
OUR EMPLOYEES

Our workforce
Number of employees
Further key indicators have been included in the 2013 fiscal year, for example the female/
male employee ratio. The reporting was adapted in accordance with the requirements of
the Global Reporting Initiative (GRI).
Employees and personnel expense
As of September 30, 2013 Infineon had a worldwide workforce of 26,725 employees, com-
pared to 26,658 employees one year earlier. In addition, at September 30, 2013, Infineon
employed a total of 262 apprentices and dual students, 113 interns and 448 work students
in Germany and Austria. 77 new apprentices and dual students were hired in the 2013 fiscal
year in Germany and Austria.
Employees by geographical region 2013 2012
Total Female Male Total Female Male
Europe 12,587 2,971 9,616 12,427 2,964 9,463
Therein: Germany 8,520 2,159 6,361 8,408 2,164 6,244
Asia-Pacific 13,517 6,299 7,218 13,624 6,502 7,122
Therein: China 1,615 700 915 1,443 623 820
Japan 122 20 102 116 18 98
Americas 499 156 343 491 155 336
Total 26,725 9,446 17,279 26,658 9,639 17,019
The regional distribution of employees has remained stable compared to the 2012 fiscal year.
Just under half of the entire workforce was employed in Europe (12,587), with the majority
working in Germany (8,520). Just over half of the entire workforce was employed in the
Asia-Pacific region (13,517).
In the workforce as a whole, at September 30, 2013, 777 female employees and 1,057 male
employees had fixed-term contracts and 8,669 female employees and 16,222 male employ-
ees had permanent contracts. A total of 839 employees were working part-time at that date.
2013 2012
Total Full-Time Part-Time Total Full-Time Part-Time
Employees on permanent contracts
Male 16,222 16,056 166 15,630 15,483 147
Female 8,669 8,006 663 8,409 7,745 664
Employees on fixed-term contracts
Male 1,057 1,054 3 1,389 1,387 2
Female 777 770 7 1,230 1,221 9
Total 26,725 25,886 839 26,658 25,836 822
Employees, who were, for example, on parental leave or in the non-working phase of
early-retirement part-time working arrangements are not active employees and therefore
not included in the figures above. Also not included are temporary employees. At Septem-
ber 30, 2013, 3,151 temporary employees were working for Infineon, of whom 1,644 were
women and 1,507 men. This ensures flexibility especially of the manufacturing capacity,
where about 84 percent of the external workers were employed.
The worldwide personnel cost for current, internal Infineon employees in the 2013 fiscal
year was €1,367 million (2012 fiscal year: €1,276 million). This amount includes wages
and salaries, including overtime and allowances, as well as social costs (pension and
similar social costs).
INFINEON TECHNOLOGIES ANNUAL REPORT 2013
GROUP MANAGEMENT REPORT – THE INFINEON GROUP102

Employee recruitment and turnover
In total 2,221 new employees were hired worldwide during the 2013 fiscal year, of
whom 876 were women and 1,345 men. 1,559 employees were under 30 years of age,
621 belonged to the 30-50 year age group and 41 were over 50 years of age.
Total EuropeTherein:
GermanyAsia-
PacificTherein:
China Japan Americas
Newly hired employees 2,221 414 251 1,763 379 11 33
Rate of newly hired employees ¹ 8.3 3.3 2.9 13.0 23.5 9.0 6.6
Staff departures 2,290 338 176 1,920 207 4 28
Rate of staff departures ² 8.7 2.7 2.1 14.2 12.8 3.3 5.6
1 Figures expressed in percentages based on the workforce at September 30, 2013, in the respective region.
2 Figures in percent, calculated on the basis of the monthly workforce in the 2013 fiscal year.
There were 2,290 staff departures worldwide. Of these, the majority (1,920 departures)
were in the Asia-Pacific region, where the majority of new recruitments also occurred
(1,763 employees).
Of the departures, 1,102 were women and 1,188 men. 1,280 employees were in the
under 30 years age group, 820 in the middle age group (30-50 years) and 190 in the over
50 years age group. The worldwide employee turnover rate during the 2013 fiscal year
was 8.7 percent, an increase of 0.4 percentage points compared to the previous year
(2012 fiscal year: 8.3 percent). In Germany, the employee turnover rate was 2.1 percent
(previous year: 2.5 percent). The percentage figure includes voluntary terminations and
other reasons for leaving.
Age structure and length of service
The average age of employees is 37.7 years, marginally higher than one year earlier
(2012 fiscal year: 37.1 years). The proportion of employees below 30 years of age
decreased from 25.9 percent to 24.2 percent. The proportion of the middle age group
(2013 fiscal year: 63.6 percent, previous year: 63.0 percent), as well as the group over
50 years of age, on the other hand, rose (2013 fiscal year: 12.2 percent, 2012 fiscal year:
11.1 percent). The structure of the age group has been adapted to the GRI standard and
therefore slightly differs compared to last year.
These changes in the age structure and the rise in the average age of employees were
accompanied by a small increase in the average length of service of Infineon employees
worldwide, which rose from 9.4 years in the previous year to 9.9 years in the 2013 fiscal
year. The length of service of employees within Germany also rose to 14.3 years,
compared to 13.7 years in the previous year.
G 56
Female/male employees(New Entries worldwide 2013)
39.4 %
60.6 %
Female Male
G 57
Age structure (New Entries worldwide 2013)
Under 30 years
30 to 50 years
Over 50 years
70.2 %
28.0 %
1.8 %
G 58
Age structure (Infineon worldwide 2013)
Under 30 years
30 to 50 years
Over 50 years
24.2 %
63.6 %
12.2 %
103INFINEON TECHNOLOGIES ANNUAL REPORT 2013
OUR EMPLOYEES

10 | 2012
The German Federal Office for Information Security (BSI) awards the highest security certifi-
cate (Common Criteria EAL 6+ (high)) for Infineon’s flash-based security controllers, making
them the world’s first flash-based security controllers to fulfill these currently highest security
standards. The new SOLID FLASH™ security chips with “Integrity Guard” are intended for
use in contactless and contact-based applications demanding highest security levels, such
as Government IDs, contactless payment transactions or embedded systems.
11 | 2012
Infineon presents the new 600-Volt CoolMOS™ P6 product family, designed to enable
higher system efficiency while being easy to use. The new transistor family closes the gap
between technologies that focus on delivering ultimate performance (CoolMOS™ CP),
and those that concentrate more on ease of use (e.g. CoolMOS™ C6 or E6). The transistors
are particularly suitable for use in servers, telecommunications equipment, PC power
supplies and gaming consoles.
Infineon launches the next generation of IGBTs with the introduction of TRENCHSTOP™ 5
with significantly lower conduction and switching losses compared to previously available
IGBT solutions. The new transistors also feature an increased breakthrough voltage of
650 volt. Target applications are photovoltaic inverters, uninterruptible power supplies
and welding machines.
Infineon delivers its one hundred millionth TriCore™-based microcontroller, making it one
of the most successful microcontrollers used in automotive electronics. TriCore™-based
microcontrollers from Infineon are assembled in over 50 automobile brands worldwide,
helping to keep fuel consumption and exhaustion emissions as low as possible.
01 | 2013
Infineon presents the new 32-bit XMC1000 microcontroller family. With the XMC1000,
Infineon is able to offer 32-bit microcontrollers at 8-bit prices. Infineon is the first semicon-
ductor manufacturer to achieve this without having to forgo advanced peripheral support.
8-bit microcontrollers are manufactured using 130-nanometer or larger production tech-
nologies and on 200-millimeter wafers, making it uneconomical to transfer to smaller
production structures. Infineon’s XMC1000 family, by contrast, is based on the significantly
more cost-efficient combination of 65-nanometer production technology on 300-millimeter
wafers. Target applications include 8-bit industrial applications using sensor and actuator
technology, LED lighting, digital power conversion in uninterruptible power supplies and
simple motor control systems, such as those used in household appliances, pumps, fans
and e-bikes.
02 | 2013
Further progress was made in the manufacturing of semiconductors on 300-millimeter
thin wafers. In February, Infineon received the first customer go-aheads for products of the
CoolMOS™ family manufactured on the 300-millimeter line at the Villach (Austria) site
and in June, the go-ahead was given for 300-millimeter products manufactured at the site
in Dresden (Germany). Infineon is the first and only company worldwide to produce power
semiconductors on 300-millimeter thin wafers.
HIGHLIGHTS 2013
First quarter
Second quarter
INFINEON TECHNOLOGIES ANNUAL REPORT 2013
GROUP MANAGEMENT REPORT – THE INFINEON GROUP104

03 | 2013
Infineon and the German Federal Printing Office (Bundesdruckerei) present a jointly devel-
oped security chip card with LED display and “One-Time Password” features at CeBIT. The
basis for the new technology is a security chip within the card, which, in addition to the
existing static password, also generates a one-time password (such as a series of digits) for
each transaction. This password is shown on the integrated LED display and cannot be
read by malicious software.
04 | 2013
Infineon and Globalfoundries announce joint development and production collaboration
for 40-nanometer embedded flash process technology. The collaboration with Global-
foundries is part of Infineon’s strategy of co-developing CMOS-based process technologies
based on 65-nanometer and lower process structures together with contract manufacturers
and having these products manufactured by them.
05 | 2013
Infineon expands its product portfolio with the CoolMOS™ C7 power transistor, thereby
introducing a new generation of products involving 650V superjunction MOSFET technology,
aimed at achieving maximum power. The new transistor, which works with a very high
degree of efficiency, is intended for use in applications such as servers, solar inverters,
telecommunications equipment and uninterruptible power supplies, at the high end of the
range of products with highest efficiency. Our customers have used this transistor to pro-
duce a power supply for servers which works at the highest level of efficiency (“Titanium”)
in accordance with the 80 PLUS initiative.
Detailed information on efficiency classification see “Markets and trends” in “Power
Management & Multimarket” in the chapter “The Segments”.
Infineon presents EconoDUAL™ 3-power modules at the PCIM in Nuremberg, the world’s
largest trade fair for power semiconductors. These modules, which comply with applicable
automotive standards, are significantly more robust against thermal cycle and shock loads
and offer high electromagnetic immunity. The new configuration of modules is aimed at
applications in commercial, construction or agricultural vehicles, in which extended reli-
ability under rugged conditions is an important criterion.
08 | 2013
Infineon presents a new 4.5-kilovolt IGBT module, which is available in the same housing
as the 6.5-kilovolt module, thus allowing use in demanding environments at temperatures
ranging from -50°C to +125°C thanks to greater creepage and clearance distance. Other
properties are reliability and robustness achieved with lower conduction, and switching
losses at the highest power density. The module fills the gap between the 3.3-kilovolt and
6.5 kilovolt modules.
09 | 2013
Infineon introduces the OPTIGA™ Trusted Platform Module (TPM) chip. TPMs are applica-
tion-specific microcontrollers that defend computers and computing systems against
unauthorized access and attacks. The new chip supports the TPM 2.0 specification stipu-
lated by the standardization body, Trusted Computing Group (TCG).
Third quarter
P see page 52
Fourth quarter
105INFINEON TECHNOLOGIES ANNUAL REPORT 2013
HIGHLIGHTS 2013

Share information
Share types Ordinary registered shares in the form of shares or American Depositary Shares (ADS) with a notional value of €2 each (ADS: shares = 1:1)
Share capital €2,162 million (as of September 30, 2013)
Shares outstanding 1,081 million (as of September 30, 2013)
Own shares 6 million (as of September 30, 2013)
Listings Shares: Frankfurt Stock Exchange (FSE) ADS: over-the-counter (OTC) market (OTCQX)
Option trading Options issued by third parties: inter alia Eurex
Ticker symbol IFX, IFNNY
ISIN Code DE0006231004
German Security Identifi-cation Number (WKN) 623100
CUSIP 45662N103
Bloomberg IFX GY (Xetra trading system), IFNNY US
Reuters IFXGn.DE
Index membership (selected)
DAX 30Dow Jones STOXX Europe 600Dow Jones Euro STOXX TMI Technology Hardware & EquipmentDow Jones Germany Titans 30MSCI GermanyS&P-Europe-350Dow Jones Sustainability™ Europe Index
Infineon Technologies AG share capital, shares outstanding and market capitalization
As of September 30, 2013
September 30, 2012
Change
Share capital in € millions 2,162 2,160 + 0.1 %
Shares outstanding in millions 1,081 1,080 + 0.1 %
Market capitalization ¹ in € millions 7,995 5,335 + 49.9%
Market capitalization ¹ in US$ millions 10,789 6,957 + 55.1 %
1 The calculation is based on unrounded figures.
Infineon share statistics
Fiscal year ending September 30 2013 2012 2011
Germany: Xetra closing in €
Fiscal year closing (end September) 7.40 4.94 5.59
Year high 7.61 7.88 8.28
Year low 4.96 4.94 5.00
Daily average shares traded on regulated German stock exchanges 8,134,049 9,925,683 14,965,342
Thereof Xetra trading in % 94 94 90
USA: OTCQX closing in US$
Fiscal year closing (end September) 9.98 6.44 7.39
Year high 10.35 10.49 11.87
Year low 6.47 6.17 6.81
Daily average ADS traded 80,678 101,319 82,120
THE INFINEON SHARE
@ A full overview of other major indices,
in which the Infineon share is repre-
sented, can be found on Infineon’s
website at www.infineon.com/cms/
en/corporate/investor/
INFINEON TECHNOLOGIES ANNUAL REPORT 2013
GROUP MANAGEMENT REPORT – THE INFINEON GROUP106

Shareholder structure ¹
Dodge & Cox Investment Managers 9.95 % (as per August 5, 2009)
Thereof: Dodge & Cox International Stock Fund 9.88 % (as per August 5, 2009)
The Capital Group Companies, Inc. 8.02 % (as per September 1, 2012)
Thereof: Capital and Research Management Company 5.06 % (as per July 28, 2011)
Thereof: EuroPacific Growth Fund 5.04 % (as per September 13, 2012)
BlackRock, Inc. 5.08 % (as per April 26, 2011)
Thereof:
BlackRock HoldCo 2, Inc. 5.003 % (as per July 22, 2011)
BlackRock Financial Management, Inc. 5.003 % (as per July 22, 2011)
BlackRock Advisors Holdings, Inc. 4.77 % (as per June 19, 2012)
BlackRock International Holdings, Inc. 3.01 % (as per August 18, 2011)
BR Jersey International Holdings, L.P. 3.01 % (as per August 18, 2011)
BlackRock Group Limited 3.11 % (as per May 27, 2013)
UBS AG 3.28 % (as per May 8, 2013)
1 The number of shares held by, or attributable to, the investors listed above has been taken from the most recent
mandatory notification received by Infineon Technologies AG from each of the relevant entities in accordance with
sections 21 and 22 WpHG. The percentage disclosures are based on the share capital or number of shares at the
date of receipt of each notification. Details of voting rights notified to the Company in accordance with sections 25
and 25a WpHG which, in addition to shares actually held and to attributable shares, also take account of financial or
other instruments which give an entitlement to acquire further shares, are published regularly on Infineon’s website.
Performance of the Infineon share and worldwide indices
through September 30, 2013 since:
September 30,
2012September 30,
2011September 30,
2010
Infineon (Xetra) + 49.8 % + 32.3 % + 45.5 %
DAX + 19.1 % + 56.2 % + 38.0 %
Philadelphia Semiconductor Index (SOX) + 28.4 % + 44.9 % + 40.5 %
Dow Jones US Semiconductor Index + 20.8 % + 27.1 % + 29.3 %
Infineon share price rises steeply amid high volatility
The Infineon share performed well during the 2013 fiscal year, rising by 50 percent from
€4.94 at the end of September 2012 to €7.40 at September 30, 2013. After starting the
fiscal year at prices just below €5.00, the Infineon share moved up steadily until the begin-
ning of February to a level of €6.89. A sharp price adjustment subsequently took the
price back down to €5.43 by mid-April 2013, only then to surge upwards again to reach
its previous level of around €6.50 by the beginning of May. From then through to the end
of the fiscal year, the Infineon share price rose steadily, amid high volatility. The year’s
high of €7.61 was recorded on September 23, 2013.
The relevant comparable indices also climbed over the course of the 2013 fiscal year, albeit
at a significantly lower pace. The Philadelphia Semiconductor Index (SOX) recorded a
28 percent increase in value. The Dow Jones US Semiconductor Index rose by 21 percent
and the DAX by 19 percent.
@ www.infineon.com/cms/en/corporate/
investor/infineon-share/shareholder-
structure.html
107INFINEON TECHNOLOGIES ANNUAL REPORT 2013
THE INFINEON SHARE

Trading volumes and inclusion in indices
The average volume of Infineon shares traded per day, measured in units, in the Xetra
system, on the Frankfurt trading floor and on German regional stock exchanges, declined
from 9.9 million shares in the previous fiscal year to 8.1 million shares in the 2013 fiscal
year. The average daily monetary volume traded was also down, dropping from €62.6 mil-
lion per day in the 2012 fiscal year to €51.3 million per day in the 2013 fiscal year.
The Infineon share is traded in the USA in the form of American Depositary Shares (“ADS”)
on the OTCQX International over-the-counter market under the ticker symbol “IFNNY”. With
an average trading volume of 81 thousand ADS per day, the number of ADS traded was
down on the previous fiscal year’s figure of 101 thousand per day. By contrast, the number
of ADS outstanding rose sharply to a total of 15.0 million at September 30, 2013, compared
to the 9.2 million ADS in circulation at the end of the previous fiscal year.
The two criteria applied for testing inclusion in the DAX are the euro values for average
market capitalization and trading volume.
For this purpose, market capitalization is calculated on the basis of the number of shares
outstanding where only the number of free float shares is considered. As a result of the
exercise of employee options, the number of shares in issuance increased during the 2013
fiscal year by 776,702 shares to stand at 1,081,083,034 shares at September 30, 2013.
The corresponding number at the end of the previous fiscal year was 1,080,306,332 shares.
With the exception of 6 million own shares, all shares are deemed to be free float and
hence taken into account in the calculation of the average market capitalization, which
rose from €5.9 billion at the end of the previous fiscal year to €8.0 billion at the end of
September 2013. This sharp rise in market capitalization took Infineon’s ranking in the
DAX up by four places from 28th to 24th place.
The second relevant criterion is the euro volume of shares traded during the past twelve
months in the Xetra system and on the Frankfurt trading floor. The total trading volume of
the Infineon share dropped from €15.2 billion in the 2012 fiscal year to €12.3 billion in
the 2013 fiscal year. Based on this measure, Infineon’s ranking in the DAX was unchanged
at 21st place.
G 59
Development of the Infineon Technologies AG share compared to Germany’s DAX Index and Philadelphia Semiconductor Index (SOX) and the Dow Jones US Semiconductor Index from the beginning of the 2013 fiscal year (daily closing prices)
Infineon share price in € September 30, 2012 = 100
Infineon DAX SOX Dow Jones US Semiconductor Index
7.90 160
09 | 201304 | 2013 06 | 201302 | 201311 | 2012 07 | 2013 08 | 201303 | 201312 | 2012 05 | 201301 | 201310 | 2012
7.40 150
6.91 140
6.42 130
5.92 120
5.43 110
4.94 100
4.44 90
708090
100110120130140150160170
INFINEON TECHNOLOGIES ANNUAL REPORT 2013
GROUP MANAGEMENT REPORT – THE INFINEON GROUP108

The Infineon share was included in the Dow Jones Sustainability™ Europe Index for the
first time in September 2010. Each company undergoes an annual test to confirm that
the criteria for remaining in the index have been met. Infineon’s compliance with these
criteria was confirmed in September 2013 for the fourth year in succession. This index
currently comprises the shares of 177 companies, including 22 from Germany, in addition
to Infineon. For further information related to the issue of sustainability see the chapter
“Sustainability at Infineon”.
Dividend and capital returns
At the Annual General Meeting held in Munich on February 28, 2013 the shareholders
approved the dividend proposal jointly put forward by Infineon’s Management Board and
Supervisory Board. As a consequence, a dividend of €0.12 per share, unchanged from the
previous year, was paid on March 1, 2013, resulting in a total disbursement of €129 million.
It shall be proposed to the forthcoming Annual General Meeting that the dividend remains
unchanged compared to 2012 at €0.12. Infineon’s strategy is to pursue a dividend policy
that enables shareholders to participate appropriately in growing earnings or, in times
of flat or declining earnings and/or with negative free cash flows, to keep the dividend at
a constant level.
Infineon’s capital returns program, which had started on May 9, 2011, expired on March 31,
2013. Under this program, holders of put options on Infineon shares exercised their options
during the first half of the 2013 fiscal year, as a result of which 6 million shares were repur-
chased by Infineon at a total cost of €38 million. In total, 13 million Infineon shares were
acquired in conjunction with the program at a total cost of €84 million. Premiums received
during the 2011 and 2012 fiscal years for the issue of put options totaled €16 million.
Infineon also repurchased a nominal amount of €47 million of the convertible bond due
May 2014 for €128 million in conjunction with the capital returns program. Separately
from this program, during the period from October 2010 to March 2011, Infineon had
repurchased a nominal amount of €36 million of the convertible bond for €107 million.
Including dividend payments, Infineon has returned a total of €686 million¹ to the capital
markets over the last three years, thereof €167 million during the 2013 fiscal year.
On November 19, 2013, the Supervisory Board approved a new capital returns program
of up to €300 million. This can be used until September 30, 2015, in order to acquire
shares or repurchase outstanding convertible bonds due 2014. For details see chapter
„Events after the end of the reporting period”.
Communication with capital markets
The prime objective of our communications with the capital market is to provide regular
and detailed information to current and future shareholders, investors and analysts about
Infineon’s economic and technological situation.
The Annual Report, Quarterly Reports and telephone conferences held in conjunction
with the release of financial data, plus a whole range of detailed information, figures and
tables made available on the Infineon website, form the basis for our communication
with capital market participants.
A further component of our investor relations activities is the communication with analysts
and investors at conferences and road shows. During the previous fiscal year, the three
Management Board members as well as the segment Heads, supported by the Investor
Relations team, were involved in capital market communication activities. We participated
in ten investor conferences in Europe and the USA and organized seven road shows. In
collaboration with the Heads of the Automotive, Industrial Power Control und Chip Card &
Security segments, we offered information via one webcast and two telephone conferences.
Presentations and webcasts can be viewed and downloaded from the Investor Relations
section of the Infineon website via the “Download Center (Archive)”. In addition to the
events described above, a whole host of discussions were held with analysts and investors,
either at group meetings or on a one-on-one basis. More than 30 analysts continuously
monitor Infineon’s business performance and publish analyses on a regular basis.
P see page 80
1 This figure corresponds to the gross
amount returned and does not take
account of premiums received by
Infineon upon issuance of put options.
P see page 158
@ Please refer to our Financial Calendar
for upcoming reports and events such
as investor conferences: www.infineon.
com/cms/en/corporate/investor/
events/index.html
I Private shareholders can reach
us via e-mail or telephone hotline
with their questions:
Phone: +49 89 234 26655
Fax: +49 89 234 955 2987
E-Mail: [email protected]
@ Interested parties are able to participate
in telephone conferences via a webcast
in the Investor Relations section of the
Infineon website: www.infineon.com/
cms/en/corporate/investor/events/
index.html
Fiscal year Dividend per share
2010 €0.10
2011 €0.12
2012 €0.12
Proposal 2013 €0.12
109INFINEON TECHNOLOGIES ANNUAL REPORT 2013
THE INFINEON SHARE

Being at the forefront of technology, Infineon is the recipient of numerous
awards and prizes – in the fields of research and development, production
and quality on the one hand, as well for accomplishments in organization
and processes on the other. The following overview shows a selection of
the awards Infineon received in the course of the 2013 fiscal year.
European Semi Award 2012
At the SEMICON Europa 2012 in Dresden (Germany), Infineon received the European
SEMI Award 2012 for the CoolMOS™ technology developed in 1997 and 1998. This award
is presented to honor individuals and teams for their outstanding contributions to the
development of the European semiconductor industry.
Austrian State Award for Quality 2012
The Austrian Ministry of Economy named Infineon as winner of the Austrian State Award
for Quality 2012. The national award, which was bestowed for the 16th time in 2012, is
presented to honor consistently good results achieved through excellent operational and
strategic work and the consistent further development of a company.
Sesames Award 2012 and German Prize for IT Security by the Horst Görtz Foundation
In November 2012, Infineon received the Sesames Award, the most prestigious award in
the smart card industry. Infineon was selected for its SOLID FLASH™-based SLS 32TLC
security controller as the most innovative product in the Transport category. The controller
is the first solution worldwide to support both conventional systems used in public trans-
portation networks and the CIPURSE™ standard. CIPURSE™ is a newly defined open
standard for the transportation sector. In addition, Infineon was awarded the German Prize
for IT Security by the Horst Görtz Foundation for developing the innovative encryption
process used in CIPURSE™.
Huawei Annual Core Supplier Medal 2012
Infineon received the Annual Core Supplier Medal 2012 from Huawei in November 2012.
Last year, only three percent of companies supplying Huawei were awarded this medal for
outstanding service and product quality.
Singapore HEALTH Gold Award
This award was presented for Infineon’s efforts and activities in creating an environment
for its employees in which there is a balance between “work, life and health”.
Excellent Supplier Award from BYD
The Chinese electronics and automotive manufacturer BYD, which is based in Shenzhen
(China), presented Infineon with the Excellent Supplier Award for its IGBT chips and modules.
Best Supplier Award from Sungrow
Sungrow Power Supply Co. Ltd, our Chinese cooperation partner in the field of solar inverters,
honored Infineon with the Best Supplier Award 2012 for its PrimePACK™ IGBT module.
AWARDS
10 | 2012
11 | 2012
12 | 2012
01 | 2013
INFINEON TECHNOLOGIES ANNUAL REPORT 2013
GROUP MANAGEMENT REPORT – THE INFINEON GROUP110

Austrian State Prize for Innovation 2013
In Austria, Infineon was awarded the Austrian State Prize for Innovation 2013 for its
innovative Power 300 project. The project led to the world’s first production of power
semiconductors on the basis of 300-millimeter thin-wafer technology. The prize was
awarded in Vienna by Reinhold Mitterlehner, Austria’s Minister for Economy.
Business Recycler of the Year
The recycling company Recology South Valley from Morgan Hill (USA) honored Infineon
with the Business Recycler of the Year Award. This award is given to companies with the
highest reuse rate in Recology’s service area. Infineon also plays an exemplary role when
it comes to economizing its use of water and energy.
Infineon receives RobecoSAM Sustainability Award
For its progress in the field of sustainability management, Infineon received the Sustain-
ability Award in the runners-up category. The international investment company RobecoSAM
gives this award to companies listed among the top 15 percent most sustainable in the
world and which have made the greatest improvements in this field.
EMAS Environment Award
At the EMAS (Eco Management and Audit Scheme) conference, the Austrian Ministry of
Life presented Infineon Austria with the EMAS Environment Award for good environmental
management.
Innovation Award from Continental
Every year, the Continental Automotive Group awards the best of its 900 strategic suppliers
with the Supplier of the Year Award. This year, Infineon won Continental’s special Innovation
Award for its 3D image sensor chip. This particular award was bestowed for the first time
this year. The new chip measures distances by means of a ray of light, using the time of flight
method. The innovation enables radios, telephones, navigation systems and air condition-
ing equipment to be operated by means of gesture control.
DeutscherIdeenPreis 2013 – third place for YIP
The German Institute for Business Management presented its awards for the Deutscher-
IdeenPreis in Frankfurt in 2013. Infineon was among the winners for the third consecutive
time with its YIP (Your Idea Pays) suggestion scheme, winning the third prize in the
electronics industry section. During the 2013 fiscal year, Infineon implemented a total
of 2,607 suggestions through its YIP scheme, saving over €22 million in the process.
Sustainability Award from Bombardier Transportation
The railway technology provider Bombardier Transportation selected Infineon as winner
of its Supplier Sustainability Award 2013 in the category of companies with over 500 employ-
ees. The award was presented in Berlin during the Bombardier Suppliers Days 2013.
Infineon was chosen for its particularly high degree of product responsibility and its posi -
tive contribution to sustainable mobility.
Dow Jones Sustainability Index
Infineon was listed in the Dow Jones Sustainability Index of Europe for the fourth consecu-
tive time. In the 2013/2014 listing, the DJSI Europe comprises 177 European companies,
only 22 of which are German.
Pinnacle Award from Delphi
The US automotive supplier Delphi honored Infineon with the Pinnacle Award in the
Technology category. Delphi presents this award in recognition of outstanding products,
services and innovation of its suppliers.
03 | 2013
05 | 2013
06 | 2013
07 | 2013
09 | 2013
111INFINEON TECHNOLOGIES ANNUAL REPORT 2013
AWARDS

Infineon sites
Headquarters
Regional headquarters
Dc Distribution center
M Manufacturing
R&D Research & Development
Sa Sales
Sf Service function
São Paulo Sa
Milpitas Sa
Morgan Hill M R&D
Livonia Sa
Lebanon Sa
Kokomo Sa
Torrance R&D Durham Sa
Hayward Dc
INFINEON WORLDWIDE
INFINEON TECHNOLOGIES ANNUAL REPORT 2013
GROUP MANAGEMENT REPORT – THE INFINEON GROUP112

Nagoya Sa
Shanghai R&D Sa
Taipei Sa
Hong Kong Sa
Tokyo Sa
Osaka Sa
Beijing M R&D Sa
Shenzhen Sa
Wuxi M Sa
Melbourne Sa
Kulim M R&D
Malacca M R&D
Singapore Dc M R&D Sa
Batam M
Bangalore R&D Sa
Warstein M R&D Sa
Villach M R&D Sa
Klagenfurt Sf
Linz, DICE R&D
Graz R&D
Vienna Sa
Cegléd M R&D Sa
Kista Sa
Espoo Sa
Porto Sf
Madrid Sa
Barcelona Sa
Padua R&D
Milan Sa
Zurich Sa
Stuttgart SaKarlsruhe, Hitex Development Tools M R&D Sa
Bristol R&D Sa
Dublin SaRotterdam Sa
Hanover Sa
Duisburg R&D Sa
Augsburg R&D Sa
Munich, Neubiberg R&D Sa
Dresden M R&D
Erlangen Sa
Grossostheim Dc
Regensburg M R&D
Moscow Sa
Saint-Denis Sa
Bucharest R&D
Seoul R&D Sa
113

GROUP MANAGEMENT REPORT
INFINEON TECHNOLOGIES ANNUAL REPORT 2013
GROUP MANAGEMENT REPORT – OUR 2013 FISCAL YEAR 114

GROUP MANAGEMENT REPORT
THE INFINEON GROUP
CONSOLIDATED
FINANCIAL STATEMENTS
GROUP MANAGEMENT REPORT
OUR 2013 FISCAL YEAR
116 DEVELOPMENTS IN THE GLOBAL ECONOMY AND WITHIN THE
SEMI CONDUCTOR INDUSTRY IN THE 2013 FISCAL YEAR
118 GROUP PERFORMANCE
118 Review of results of operations
125 Review of fi nancial condition
127 Review of liquidity
131 REPORT ON EXPECTED DEVELOPMENTS, TOGETHER WITH
ASSOCIATED MATERIAL RISKS AND OPPORTUNITIES
131 Outlook
140 Risk and opportunity report
151 TREASURY AND CAPITAL REQUIREMENTS
155 OVERALL STATEMENT OF THE MANAGEMENT BOARD
WITH RESPECT TO INFINEON’S FINANCIAL CONDITION
AS OF THE DATE OF THIS REPORT
156 INFINEON TECHNOLOGIES AG
158 EVENTS AFTER THE END OF THE REPORTING PERIOD
159 CORPORATE GOVERNANCE
159 Information pursuant to section 289, paragraph 4, and section 315,
paragraph 4, of the German Commercial Code (HGB)
168 Corporate Governance Report
177 Compensation Report
OUR 2013 FISCAL YEAR
115INFINEON TECHNOLOGIES ANNUAL REPORT 2013
GROUP MANAGEMENT REPORT – OUR 2013 FISCAL YEAR

DEVELOPMENTS IN THE GLOBAL ECONOMY AND WITHIN THE SEMI CONDUCTOR INDUSTRY IN THE 2013 FISCAL YEAR
World economic growth has again fallen short of expectations in the 2013 calendar year.
The International Monetary Fund (IMF) is currently only predicting a growth rate of 2.3 per-
cent for the full year (IMF, October 2013). The outlook for the 2013 calendar year presented
in fall 2012 was already on the restrained side, but was at least at that stage still at a level
of 2.9 percent (IMF, October 2012). Economic prospects have nevertheless brightened for
the world’s major advanced economies over the course of the calendar year, a trend that
is also being confirmed by current data. The rapid pace of growth seen previously in some
Asian countries, however, does appear to have lost some of its momentum. Economic
growth has weakened particularly in Asia’s two most populous countries, China and India.
However, low debt levels in comparison to the world’s established economies, relatively
low unemployment and a steady increase in average per capita income are reasons to be
confident about the future. Even though the Chinese economy will not, in all probability,
return to the double-digit growth rates recorded in the past, it will nevertheless remain an
engine for growth as well as the world’s most important semiconductor market, and thus
extend its economic lead.
In light of these developments, the semiconductor market relevant for Infineon (excluding
memory products and microprocessors) based on US dollar is expected to grow by approxi-
mately 2 percent in the 2013 calendar year. According to the market research company IHS,
the Asia-Pacific market should, despite a slight slowdown, still see above-average growth in
2013, and finish the year with a growth rate in the region of 4 percent. IHS forecasts that
the Chinese market will grow by as much as 11 percent in the 2013 calendar year. Also in the
2013 fiscal year, the semiconductor market relevant for Infineon will have grown by approxi-
mately 2 percent (IHS, September 2013). Latest market data published by WSTS (World
Semiconductor Trade Statistics) confirms this moderate increase (WSTS, October 2013).
Source: International Monetary Fund, World Economic Outlook, October 2013
G 60
World economic growth
in percent
6.0
4.0
2.0
0
(2.0)
(4.0)
2014 e Calendar year2010 2011 2012 2013 e200920082007
(2.1)
1.5
3.9 4.1
2.9 2.6 2.33.0
INFINEON TECHNOLOGIES ANNUAL REPORT 2013
GROUP MANAGEMENT REPORT – OUR 2013 FISCAL YEAR 116

Semiconductors are one of today’s key enabling technologies and have meanwhile become
indispensable in all spheres of life. Global semiconductor revenue per capita has increased
from US$3 in 1980 to approximately US$42 in the 2013 calendar year. One of the conse-
quences of this trend is that the semiconductor industry cannot fully detach itself from
macroeconomic developments worldwide. Demand for semiconductor products may be
influenced by technological advances, but it is also dependent on the state of the world
economy. There are some trends, however, such as digitalization, urbanization, greater
mobility, the efficient use and conservation of resources and the reduction of environ-
mental pollution that are fundamental for society and so drive demand, both at present
and in the future. Analysts from Strategy Analytics predict for instance, that the value of
semiconductor content in cars will increase year-on-year by close to 3 percent in the 2013
calendar year (Strategy Analytics, October 2013). Moreover, the proportion of power gener-
ated by wind and solar plants will rise continuously. Other market drivers include tablets
and smartphones, whereas demand for PCs is likely to be lower in the 2013 calendar year
compared to the previous year. The market research company Gartner forecasts that PC unit
shipments will drop by 8 percent in the 2013 calendar year, whereas tablets will see a rise
of 53 percent (Gartner, September 2013). Strategy Analytics forecasts growth of 43 percent
for smartphone unit sales in the 2013 calendar year, with a rising trend thereafter (Strategy
Analytics, September 2013).
Further information with respect to expectations for the global economy and the semicon-
ductor market is provided in the chapter “Report on expected developments, together with
associated material risks and opportunities”.
1 Semiconductor market excluding memory products and microprocessors
Source: IHS, “Application Market Forecast Tool Q3 2013, Regional Shipments”, September 2013
G 61
Development of the semiconductor market ¹
US$ in billions
250
200
150
100
50
0
2014 e Calendar year2010 2011 2012 2013 e200920082007
156181184
201 207 207 211225
P see page 133
117INFINEON TECHNOLOGIES ANNUAL REPORT 2013
DEVELOPMENTS IN THE GLOBAL ECONOMY AND WITHIN THE SEMI CONDUCTOR INDUSTRY IN THE 2013 FISCAL YEAR

GROUP PERFORMANCE
REVIEW OF RESULTS OF OPERATIONS
The consolidated statement of operations
€ in millions, except earnings per share 2013 2012
Revenue 3,843 3,904
Gross profit 1,323 1,427
Research and development expenses (525) (455)
Selling, general and administrative expenses (440) (475)
Other operating income and expense, net (33) (42)
Operating income 325 455
Net financial result (financial income and expense, net) (21) (23)
Income (loss) from investments accounted for using the equity method 2 (1)
Income tax (23) 1
Income from continuing operations 283 432
Loss from discontinued operations, net of income taxes (11) (5)
Net income 272 427
Basic earnings per share (in euro) 0.25 0.40
Diluted earnings per share (in euro) 0.25 0.39
Significantly lower net income due to drop in revenue in first half of year
Net income fell from €427 million in the previous fiscal year to €272 million in the 2013
fiscal year, a decrease of approximately 36 percent.
The first half of the year was characterized by a difficult market environment and subdued
economic growth. In this environment, revenue fell sharply by 8 percent compared to the
same period of the previous year. Under -utilization of capacities with high fixed costs on the
one hand and cost increases on the other resulted in a marked reduction in gross margin.
The magnitude of the decrease was held in check by a range of measures aimed at reducing
costs on the one hand and increasing their variable proportion on the other. Thanks to these
measures, Infineon remained solidly profitable even during the first two quarters. With the
economic situation improving during the second half of the year, the ensuing decrease in
under utilization allowed the gross margin – and hence net income – to recover significantly.
Revenue slightly down overall; revenue from core business slightly up
Revenue was nearly 2 percent down on the previous fiscal year. In addition to relatively
minor adverse currency factors, the main reason for this development was the lower
revenue recorded by Infineon’s Other Operating Segments, which includes revenue from
business with Lantiq and Intel Mobile Communications (“IMC”), the volume of which
continued to decrease as scheduled. By contrast, revenue generated from the four core
operating segments increased by 1 percent.
118 INFINEON TECHNOLOGIES ANNUAL REPORT 2013
GROUP MANAGEMENT REPORT – OUR 2013 FISCAL YEAR

Revenue developed differently from one segment to the other. Revenue growth in the
Power Management & Multimarket, Automotive and Chip Card & Security segments stood
in contrast to a sharp drop in the Industrial Power Control segment (see detailed comments
in the respective chapters to the individual segments).
€ in millions 2013 2012
Revenue:
Automotive 1,714 1,660
Industrial Power Control 651 728
Power Management & Multimarket 987 929
Chip Card & Security 463 457
Other Operating Segments 26 125
Corporate and Eliminations 2 5
Total 3,843 3,904
Minor currency impact on revenue in 2013 fiscal year
Almost 50 percent of revenue was generated in foreign currencies in the 2013 fiscal year,
of which the US dollar accounted for the largest proportion.
The euro/US dollar exchange rate was volatile during the 2013 fiscal year. The average
exchange rate for the year, however, changed very little. Starting the year at 1.28, the euro/
US dollar exchange rate recorded its low (1.27) for the 2013 fiscal year in the middle of
November 2012 and its high (1.36) at the beginning of February 2013. The closing rate
at the end of the reporting period was 1.35. The average exchange rate was 1.31 over the
2013 fiscal year. This compares with a high and low in the 2012 fiscal year of 1.42 and
1.21, respectively, and an average rate of 1.30.
Thus, despite the high volumes involved, the impact of fluctuations in the US dollar
exchange rate on revenue was comparatively low. The weakness of the Japanese yen also
had a negative impact on revenue. Across all currencies and over the full year, revenue was
negatively impacted by approximately €28 million due to exchange rate effects (measured
by applying the previous fiscal year’s average exchange rates to 2013 fiscal year revenue).
€ in millions, except percentages 2013 2012
Revenue 3,843 3,904
Changes year-on-year (2 %) (2 %)
Exchange rate impact compared to previous fiscal year (28) 135
Percentage of revenue (1 %) 3 %
Decrease in revenue not influenced by acquisition or sale of businesses
Revenue reported for the 2013 and 2012 fiscal years was not influenced by business
acqui sitions and/or disposals.
P See page 36
G 62
Revenue by segment
2013 2012
Automotive
Industrial Power Control
Power Management & Multimarket
Chip Card & Security
Other Operating Segments
Corporate and Eliminations
1,7141,660
651728
987929
457
125
5
463
26
2
€ in millions
44 %
17 %
26 %
12 %1 %
2013
Automotive
Industrial Power Control
Power Management & Multimarket
Chip Card & Security
Other Operating Segments
119INFINEON TECHNOLOGIES ANNUAL REPORT 2013
GROUP PERFORMANCE
REVIEW OF RESULTS OF OPERATIONS
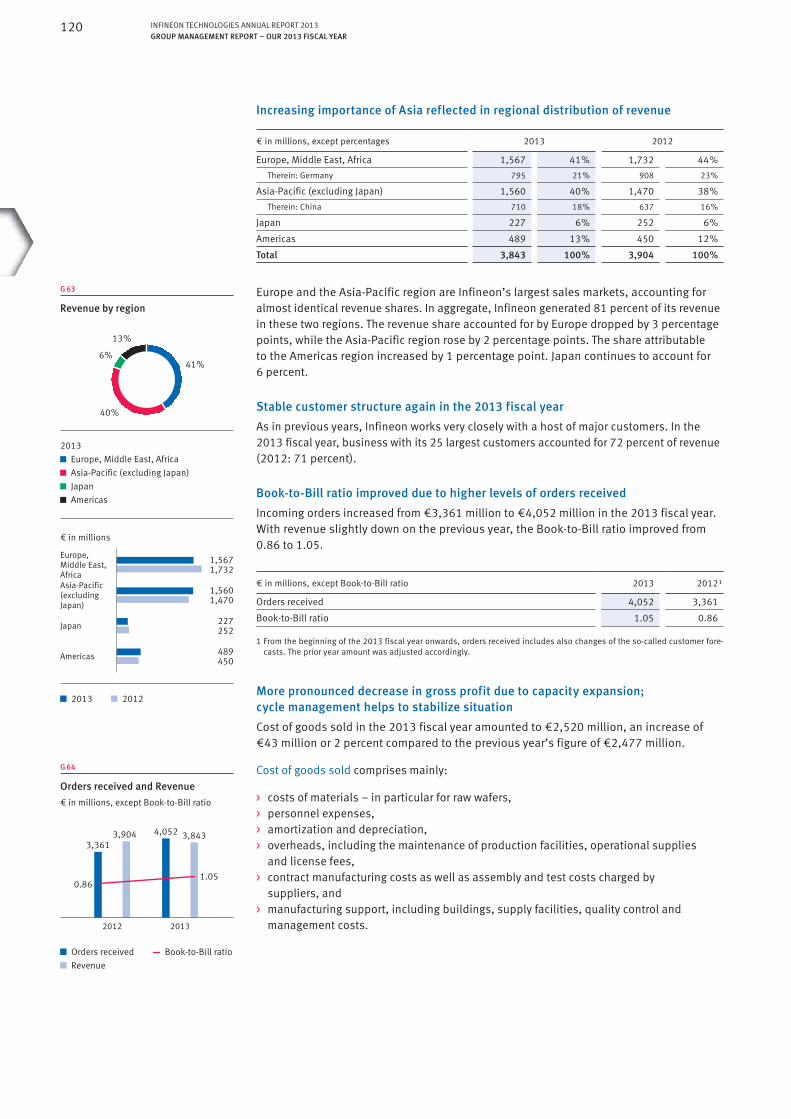
Increasing importance of Asia reflected in regional distribution of revenue
€ in millions, except percentages 2013 2012
Europe, Middle East, Africa 1,567 41 % 1,732 44 %
Therein: Germany 795 21 % 908 23 %
Asia-Pacific (excluding Japan) 1,560 40 % 1,470 38 %
Therein: China 710 18 % 637 16 %
Japan 227 6 % 252 6 %
Americas 489 13 % 450 12 %
Total 3,843 100 % 3,904 100 %
Europe and the Asia-Pacific region are Infineon’s largest sales markets, accounting for
almost identical revenue shares. In aggregate, Infineon generated 81 percent of its revenue
in these two regions. The revenue share accounted for by Europe dropped by 3 percentage
points, while the Asia-Pacific region rose by 2 percentage points. The share attributable
to the Americas region increased by 1 percentage point. Japan continues to account for
6 percent.
Stable customer structure again in the 2013 fiscal year
As in previous years, Infineon works very closely with a host of major customers. In the
2013 fiscal year, business with its 25 largest customers accounted for 72 percent of revenue
(2012: 71 percent).
Book-to-Bill ratio improved due to higher levels of orders received
Incoming orders increased from €3,361 million to €4,052 million in the 2013 fiscal year.
With revenue slightly down on the previous year, the Book-to-Bill ratio improved from
0.86 to 1.05.
€ in millions, except Book-to-Bill ratio 2013 2012 ¹
Orders received 4,052 3,361
Book-to-Bill ratio 1.05 0.86
1 From the beginning of the 2013 fiscal year onwards, orders received includes also changes of the so-called customer fore-
casts. The prior year amount was adjusted accordingly.
More pronounced decrease in gross profit due to capacity expansion;
cycle management helps to stabilize situation
Cost of goods sold in the 2013 fiscal year amounted to €2,520 million, an increase of
€43 million or 2 percent compared to the previous year’s figure of €2,477 million.
Cost of goods sold comprises mainly:
> costs of materials – in particular for raw wafers,
> personnel expenses,
> amortization and depreciation,
> overheads, including the maintenance of production facilities, operational supplies
and license fees,
> contract manufacturing costs as well as assembly and test costs charged by
suppliers, and
> manufacturing support, including buildings, supply facilities, quality control and
management costs.
G 63
Revenue by region
2013 2012
Europe, Middle East, Africa
Asia-Pacific (excluding Japan)
Japan
Americas
1,5671,732
1,5601,470
227252
450489
€ in millions
41 %
40 %
6 %
13 %
2013
Europe, Middle East, Africa
Asia-Pacific (excluding Japan)
Japan
Americas
G 64
Orders received and Revenue
€ in millions, except Book-to-Bill ratio
Orders received
Revenue
Book-to-Bill ratio
3,3613,904 4,052 3,843
2012 2013
0.861.05
120 INFINEON TECHNOLOGIES ANNUAL REPORT 2013
GROUP MANAGEMENT REPORT – OUR 2013 FISCAL YEAR

In addition to volume-related factors, the cost of goods sold is also influenced by
the following:
> capacity utilization level of production facilities and related idle costs,
> amortization of purchased and internally generated intangible assets,
> product warranty costs,
> inventory risks and
> government grants received that are spread over the useful lives of production plant.
Gross profit (revenue less cost of goods sold) amounted to €1,323 million in the 2013 fiscal
year (2012: €1,427 million). The combined effect of higher amortization and depreciation
on fixed assets, expenses relating to capacities not fully utilized during the year under
report, higher personnel costs and slightly lower revenue resulted in a deterioration in gross
margin from 36.6 percent in the 2012 fiscal year to 34.4 percent in the year under report.
€ in millions, except percentages 2013 2012
Cost of goods sold 2,520 2,477
Changes year-on-year 2 % 6 %
Percentage of revenue 65.6 % 63.4 %
Gross profit 1,323 1,427
Percentage of revenue (gross margin) 34.4 % 36.6 %
The process of building up production capacities for semiconductor products generally
involves long lead times due to demanding technological requirements. In the short term,
the extent to which existing capacities can be kept in line with fluctuations in demand is
limited. The sharp decline in revenue at the beginning of the 2013 fiscal year, combined
with the build-up of capacities in previous years, resulted in increasing levels of underutili-
zation and was ultimately responsible for a gross margin of only 32.0 percent in the first
quarter of the 2013 fiscal year. Infineon reacted by mothballing some production facilities
temporarily and implementing a range of other measures aimed at avoiding further addi-
tional costs. As business picked up sharply in the second half of the 2013 fiscal year,
these facilities were reactivated, thus enabling Infineon to cope with a revenue increase
from €851 million in the first quarter to €1,053 million in the fourth. With revenue higher
and capacity utilization levels improving, the gross margin also moved upward, reaching
37.6 percent in the fourth quarter.
Increase in research and development expenses as part of strategy to secure
future growth; decrease in selling, general and administrative expenses
Research and development expenses
R&D expenses consist primarily of personnel expenses, cost of materials, depreciation and
amortization and the cost of maintaining laboratory facilities required for R&D activities.
R&D projects include technology and product development projects. R&D expenses also
cover third-party costs related to technology and product development, as well as the cost
of joint product and technology development arrangements with partners. R&D expenses
do not include any capitalized development costs. Grants received for R&D projects reduce
the reported expense.
36.6 % 34.4 %
G 65
Gross profit and gross margin
€ in millions
Gross profit
Percentage of revenue (gross margin)
1,4271,323
2012 2013
121INFINEON TECHNOLOGIES ANNUAL REPORT 2013
GROUP PERFORMANCE
REVIEW OF RESULTS OF OPERATIONS

€ in millions, except percentages 2013 2012
Research and development expenses 525 455
Changes year-on-year 15 % 4 %
Percentage of revenue 13.7 % 11.7 %
Grants received 52 53
Percentage of revenue 1.4 % 1.4 %
Capitalized development costs 51 57
Percentage of research and development expenses 9.7 % 12.5 %
R&D expenses in the 2013 fiscal year increased by €70 million or 15 percent compared
to the previous year, mainly due to higher personnel costs (increased workforce and pay
rises) as well as to higher non-personnel costs for R&D activities. R&D activities were
increased in particular for the Automotive and Power Management & Multimarket segments,
with a view to satisfying current and future market requirements through further product
innovations, hence promoting future growth. The principal R&D activities undertaken during
the 2013 fiscal year are described in more detail in the chapter “Research & Development”.
Due to the decrease in revenue on the one hand and the increase in R&D expenses on the
other, R&D expenses as a percentage of revenue rose from 11.7 percent in the previous
year to 13.7 percent in the 2013 fiscal year.
Capitalized development expenses amounted to €51 million in the 2013 fiscal year,
compared to €57 million in the previous year. Grants received for R&D activities totaled
€52 million, almost unchanged from the previous year’s figure of €53 million.
Selling, general and administrative expenses
Selling expenses primarily comprise personnel and non-personnel expenses related to
sales activities as well as the cost of marketing, customer samples, marketing incentives
and other marketing activities.
General and administrative expenses primarily consist of personnel costs for administrative
personnel, non-manufacturing-related overhead costs, and consultancy, legal and other
fees for professional services.
€ in millions, except percentages 2013 2012
Selling, general and administrative expenses 440 475
Changes year-on-year (7 %) 6 %
Percentage of revenue 11.4 % 12.2 %
Selling, general and administrative expenses as a percentage of revenue decreased from
12.2 percent in the previous year to 11.4 percent in the 2013 fiscal year, helped in part
by the implementation of cost reduction measures.
We incurred only minor marketing expenses for advertising and trade fairs due to our sales
and customer structure: in the 2013 fiscal year they accounted for less than 1 percent of
selling, general and administrative expenses.
11.7 %13.7 %
G 66
R&D expenses
€ in millions
R&D expenses
Percentage of revenue
455525
2012 2013
12.2 % 11.4 %
G 67
Selling, general and administrative expenses
€ in millions
Selling, general and
administrative expenses
Percentage of revenue
475440
2012 2013
122 INFINEON TECHNOLOGIES ANNUAL REPORT 2013
GROUP MANAGEMENT REPORT – OUR 2013 FISCAL YEAR

Net amount of other operating income and expenses lower at negative €33 million
Net other operating income and expenses gave rise to a net expense of €33 million for the
2013 fiscal year, compared to a net expense of €42 million one year earlier. The overall
improvement was primarily attributable to lower litigation expenses and lower impairment
losses. Restructuring expenses countered this effect.
Further details relating to other operating income and expenses are provided in note 8 to
the Consolidated Financial Statements.
Net financial result almost unchanged
€ in millions 2013 2012
Financial income 30 38
Financial expense (51) (61)
Net financial result (21) (23)
Net financial result (financial income less financial expense) improved marginally in
the 2013 fiscal year by €2 million to a net expense of €21 million. In the previous year
repurchases of subordinated convertible bonds due 2014 executed in conjunction with the
capital returns program had given rise to losses of €6 million. No further repurchases were
made during the year under report and hence no losses are included in financial expenses.
However, financial income decreased as a result of lower interest rates and the reduced
average gross cash position over the year.
Effective tax rate of 8 percent in the 2013 fiscal year
The income tax expense, comprising current and deferred taxes, totaled €23 million in
the 2013 fiscal year.
In Germany, Infineon’s current tax expense is based on the applicable “minimum taxation”
rules, under which only 40 percent of taxable profits arising in Germany are subject to
current tax as a result of the utilization of tax loss carry-forwards. The current tax expense
outside Germany benefited from lower statutory tax rates and tax credits.
Deferred tax assets, which in Infineon’s case relate primarily to tax loss carry-forwards and
unused tax credits, are assessed at the end of each reporting period in order to determine
whether future utilization is probable. The reassessment of the valuation allowance on
deferred tax assets resulted in a deferred tax benefit in the 2013 fiscal year which partially
offset the current tax expense.
In the previous year, the tax benefit from the reassessment of deferred tax assets had
exceeded current tax and resulted in an overall tax benefit of €1 million.
P See page 223
123INFINEON TECHNOLOGIES ANNUAL REPORT 2013
GROUP PERFORMANCE
REVIEW OF RESULTS OF OPERATIONS

Income from continuing operations before income taxes and the income tax expense/
benefit were as follows:
€ in millions, except percentages 2013 2012
Germany 101 199
Foreign 205 232
Income from continuing operations before income taxes 306 431
Current tax expense:
Germany (9) (11)
Foreign (30) (36)
(39) (47)
Deferred tax benefit (expense):
Germany 21 40
Foreign (5) 8
16 48
Income tax (23) 1
Effective tax rate 8 % 0 %
Further details with respect to income tax are provided in note 11 to the Consolidated
Financial Statements.
Expenses in connection with Qimonda’s insolvency give rise to loss
from discontinued operations
The result from discontinued operations, net of income taxes, for the 2013 and 2012
fiscal years comprised the following:
€ in millions 2013 2012
Qimonda (15) (10)
Wireless mobile phone business 4 5
Result from discontinued operations, net of income taxes (11) (5)
The result from discontinued operations, net of income taxes, amounted to a negative
amount of €11 million in the 2013 fiscal year, compared to a negative amount of €5 million
in the previous year. This includes post-tax expenses of €15 million incurred in connection
with the Qimonda insolvency and a net income of €4 million in connection with the
Wireless mobile phone business (see note 5 to the Consolidated Financial Statements).
Earnings per share down
As described above, net income of €272 million (2012: €427 million) for the 2013
fiscal year was significantly lower than in the previous fiscal year.
This, in turn, resulted in a similarly sharp drop in earnings per share. Basic and diluted
earnings per share for the 2013 fiscal year amounted to €0.25 in both cases, compared to
basic and diluted earnings per share for the 2012 fiscal year of €0.40 and €0.39 respectively.
P See page 224
P See page 221
124 INFINEON TECHNOLOGIES ANNUAL REPORT 2013
GROUP MANAGEMENT REPORT – OUR 2013 FISCAL YEAR

REVIEW OF FINANCIAL CONDITION
€ in millions, except percentages 2013 2012 Changeyear-on-year
Current assets 3,623 3,510 3 %
Non-current assets 2,282 2,388 (4 %)
Total assets 5,905 5,898 0 %
Current liabilities 1,594 1,678 (5 %)
Non-current liabilities 535 645 (17 %)
Total liabilities 2,129 2,323 (8 %)
Total equity 3,776 3,575 6 %
Statement of Financial Position Ratios:
Return on assets ¹ 4.6 % 7.2 %
Equity ratio ² 63.9 % 60.6 %
Return on equity ³ 7.2 % 11.9 %
Debt-to-equity ratio ⁴ 8.0 % 8.3 %
Inventory intensity ⁵ 10.3 % 9.6 %
RoCE ⁶ 14.1 % 22.3 %
1 Return on assets = Net income/Total assets
2 Equity ratio = Total equity/Total assets
3 Return on equity = Net income/Total equity
4 Debt-to-equity ratio = (long-term and short-term debt)/Total equity
5 Inventory intensity = Inventories (net)/Total assets
6 Calculation see “Decrease in earnings gives rise to lower RoCE” in this chapter ( P see page 126)
Total assets almost unchanged
Compared to September 30, 2012, total assets changed by just €7 million from
€5,898 million to €5,905 million, with current assets up by €113 million and non-current
assets down by €106 million. On the equity and liabilities side, liabilities decreased by
€194 million, while equity increased in total by €201 million.
The lower net income reported for the 2013 fiscal year generally resulted in deteriorating
key performance indicators. The return on equity for the 2013 fiscal year was 7.2 percent
(2012: 11.9 percent) and the total return on assets dropped to 4.6 percent (2012:
7.2 percent).
Increases in gross cash position, trade receivables and inventories result
in higher level of current assets
Current assets went up by 3 percent to €3,623 million as of September 30, 2013 compared
to €3,510 million one year earlier. The main reason for the rise was the €51 million increase
in the gross cash position (sum total of cash and cash equivalents and financial invest-
ments), which resulted primarily from the surplus of free cash flow over disbursements for
the dividend and the repurchase of shares. In addition, trade receivables and inventories
were €44 million and €42 million respectively, higher than their levels as of Septem-
ber 30, 2012, while other current receivables and assets decreased overall by €24 million.
Decrease in non-current assets due to lower investments in property,
plant and equipment
Non-current assets decreased by €106 million (4 percent) from €2,388 million as of Sep-
tember 30, 2012 to €2,282 million as of September 30, 2013. The amount invested in
property, plant and equipment (€315 million) was lower than depreciation (€442 million).
Intangible assets increased overall by €24 million over the course of the 2013 fiscal year,
mainly related to capitalized development costs.
G 68
Assets
38 %39 %
9 %10 %
10 %10 %
32 %30 %
5 %5 %6 %6 %
5,905 5,898
2013 2012
€ in millions 2013 2012
Gross cash position 2,286 2,235
Trade and other receivables 571 539
Inventories 609 567
Property, plant and equipment and intangible assets 1,770 1,877
Deferred tax assets 325 315
Other assets 344 365
5,905 5,898
G 69
Liabilities and equity
10 % 10 %
5 % 5 %
12 % 13 %
11 % 9 %
64 % 61 %
5,905 5,898
2013 2012
€ in millions 2013 2012
Trade and other payables 574 622
Debt 303 295
Provisions 721 740
Other liabilities 531 666
Equity attributable to shareholders of Infi neon Technologies AG 3,776 3,575
5,905 5,898
125INFINEON TECHNOLOGIES ANNUAL REPORT 2013
GROUP PERFORMANCE
REVIEW OF FINANCIAL CONDITION

Decrease in liabilities due to the derecognition of obligations for put options
and lower pension obligations
Current liabilities stood at €1,594 million at the end of the reporting period, €84 million
(5 percent) lower than at September 30, 2012 (€1,678 million), mostly due to the derecog-
nition of obligations for put options. In the 2013 fiscal year, up to the expiry of the capital
returns program, put options with a value of €38 million were exercised, while put options
with a value of €51 million expired and were not replaced. These developments caused
other current financial liabilities to decrease from €100 million as of September 30, 2012
to €12 million at the end of the reporting period. The €79 million increase in current finan-
cial liabilities, mainly due to the reclassification of the convertible bond due May 2014
(carrying amount as of September 30, 2013: €108 million) from long-term debt, was offset
by reductions in trade and other payables and current provisions.
Compared to September 30, 2012 (€645 million), non-current liabilities decreased by
€110 million or 17 percent to stand at €535 million as of September 30, 2013. The main
reason for this – in addition to the reclassification of the convertible bond due May 2014 –
was a €47 million decrease in provisions for pension plans and similar commitments, caused
by contributions to plan assets (net amount of €35 million) and higher discount rates.
Equity up due to net income for the year
Equity increased overall by €201 million (6 percent) to stand at €3,776 million at the end
of the reporting period (September 30, 2012: €3,575 million). The main reasons for the
increase in equity were the net income for the 2013 fiscal year (€272 million) and the posi-
tive impact (€51 million) of derecognizing put options. By contrast, equity was reduced
by the payment of the dividend for the 2012 fiscal year (€129 million).
The equity ratio improved to 63.9 percent as of the end of the reporting period (Septem-
ber 30, 2012: 60.6 percent).
Decrease in earnings gives rise to lower RoCE
As a consequence of the decrease in operating profit from €455 million to €325 million,
the return on capital employed (RoCE) fell from 22.3 percent in the 2012 fiscal year to
14.1 percent in the 2013 fiscal year. In addition to the effect of the decrease in earnings,
RoCE was also negatively impacted by the increase in capital employed, which went up
from €2,035 million to €2,159 million during the period under report. Overall, however,
Infineon once again earned its cost of capital in the 2013 fiscal year.
The reported RoCE was calculated using actual capital employed, without adjustment for
exceptional factors such as provisions recorded in connection with the Qimonda insolvency
and, in the previous year, current financial liabilities arising from the issue of put options
on own shares in conjunction with Infineon’s capital returns program, both of which had the
effect of reducing capital employed.
22.3 %
14.1 %
G 70
RoCE
€ in millions
Capital employed RoCE
2,0352,159
2012 2013
126 INFINEON TECHNOLOGIES ANNUAL REPORT 2013
GROUP MANAGEMENT REPORT – OUR 2013 FISCAL YEAR

RoCE for the 2013 and 2012 fiscal years is calculated as follows:
€ in millions 2013 2012
Operating income 325 455
Plus:
Financial income excluding interest income ¹ – –
Gain (loss) from investments accounted for using the equity method 2 (1)
Less:
Income tax (23) 1
Financial expense excluding interest expense ² – (1)
Operating income from continuing operations after tax 304 454
Assets 5,905 5,898
Less:
Cash and cash equivalents (527) (425)
Financial investments (1,759) (1,810)
Assets classified as held for sale – (5)
Total current liabilities (1,594) (1,678)
Plus:
Short-term debt and current maturities of long-term debt 134 55
Liabilities classified as held for sale – –
Capital employed 2,159 2,035
RoCE 14.1 % 22.3 %
1 Financial income in the 2013 and 2012 fiscal years amounted to €30 million and €38 million, respectively, including only
interest income (see note 9 to the Consolidated Financial Statements).
2 Financial expense in the 2013 fiscal year amounted to €51 million, of which €51 million related to interest expense.
The corresponding figures in the previous fiscal year were €61 million and €60 million, respectively (see note 10 to the
Consolidated Financial Statements).
REVIEW OF LIQUIDITY
Cash flow
€ in millions 2013 2012
Net cash provided by operating activities from continuing operations 610 667
Net cash used in investing activities from continuing operations (328) (1,013)
Net cash used in financing activities from continuing operations (165) (199)
Net decrease in cash and cash equivalents from discontinued operations (10) (40)
Net increase (decrease) in cash and cash equivalents 107 (585)
Effect of foreign exchange rate changes on cash and cash equivalents (5) 3
Change in cash and cash equivalents 102 (582)
Lower income from continuing operations causes decrease in net cash
provided by continuing operations
Net cash provided by operating activities from continuing operations in the 2013 fiscal
year amounted to €610 million and was thus €57 million lower than one year earlier (2012:
€667 million). Taking income from continuing operations before depreciation, amortization
and impairment losses, interest and income taxes as the starting point (€812 million), the
principal items reducing net cash provided by continuing operations during the fiscal year
under report were the decrease in trade and other payables, the increases in inventories,
trade and other receivables and changes in other assets and liabilities (in aggregate
amounting to €160 million) and income taxes paid (€53 million).
P See page 224
P See page 224
127INFINEON TECHNOLOGIES ANNUAL REPORT 2013
GROUP PERFORMANCE
REVIEW OF LIQUIDITY

In the 2012 fiscal year, taking income from continuing operations before depreciation,
amortization and impairment losses, interest and income taxes as the starting point
(€909 million), the principal items reducing net cash provided by continuing operations
were decreases in trade and other payables and provisions (in aggregate amounting to
€174 million) and a €62 million increase in inventories.
Net cash used in investing activities from continuing operations reflects lower level
of investments in property, plant and equipment
Net cash used in investing activities from continuing operations in the 2013 fiscal year
totaled €328 million, of which €315 million related to investments in property, plant and
equipment, with the primary focus on expanding frontend capacities in Kulim (Malaysia),
Villach (Austria) and Dresden (Germany). In addition to expanding frontend capacities, back-
end manufacturing capacities were expanded in Malacca (Malaysia), Warstein (Germany),
Singapore and Regensburg (Germany). A total of €63 million was invested in intangible
assets, primarily relating to in-house product and technology developments (€51 million).
The net cash inflow from the sale of financial investments (mostly money deposits with
a maximum term of three to six months) amounted to €47 million.
In the previous fiscal year, net cash used in investing activities from continuing operations
amounted to €1,013 million, of which €832 million related to investments in property,
plant and equipment and €58 million to investments in intangible assets. Net purchases
of financial investments amounted to €127 million.
Dividend payment and repurchases of shares via put options result in net cash
used in financing activities from continuing operations
Net cash used in financing activities from continuing operations totaled €165 million
in the 2013 fiscal year, of which €129 million was used to pay the dividend for the 2012
fiscal year. The repurchase of 6 million of Infineon’s own shares via put options accounted
for a cash outflow of €38 million.
In the previous fiscal year, net cash used in financing activities from continuing operations
amounted to €199 million, of which €130 million was used to pay the dividend for the
2011 fiscal year, €62 million was used to repurchase subordinated convertible bonds due
2014 in conjunction with the capital returns program and €20 million was used for put
options exercised by investors on Infineon’s own shares. Option premiums received for
new put options issued on own shares amounted to €8 million.
G 71
Cash flow
€ in millions
667
(328)(199)
(40)
(585)
610
(1,013)
(165)(10)
107
1,000
500
0
(500)
(1,000)
(1,500)
Net increase (decrease)
in cash and cash equivalents ¹
Net cash used from
discontinued operations
Net cash used in financing
activities from continuing
operations
Net cash used in investing
activities from continuing
operations
Net cash provided by
operating activities from
continuing operations
2013 2012
1 Before effect of foreign exchange rate changes on cash and cash equivalents of negative €5 million and €3 million for the 2013 and 2012 fiscal year, respectively.
128 INFINEON TECHNOLOGIES ANNUAL REPORT 2013
GROUP MANAGEMENT REPORT – OUR 2013 FISCAL YEAR

Free cash flow
Infineon reports the free cash flow figure (defined as net cash provided by/used in operating
activities and net cash used in/provided by investing activities) after adjusting for cash
flows related to the purchase and sale of financial investments. Free cash flow serves as
an additional performance indicator, since Infineon holds part of its liquidity in the form
of financial investments. This does not mean that the free cash flow calculated in this
way is available to cover other disbursements since dividend, debt-servicing obligations
and other fixed disbursements are not deducted. Free cash flow should not be seen as a
replacement or superior performance indicator, but rather as an additional useful piece of
information over and above the disclosure of the cash flow reported in the Consolidated
Statement of Cash Flows, and as a supplementary disclosure to other liquidity performance
indicators and other performance indicators derived from the IFRS figures. Free cash flow
includes only amounts from continuing operations, and is derived as follows from the
Consolidated Statement of Cash Flows:
€ in millions 2013 2012
Net cash provided by operating activities from continuing operations 610 667
Net cash used in investing activities from continuing operations (328) (1,013)
Purchase of (proceeds from sales of) financial investments, net (47) 127
Free cash flow 235 (219)
Positive free cash flow due to lower investments
Free cash flow for the 2013 fiscal year was a positive amount of €235 million compared
to a negative amount of €219 million in the previous fiscal year. The substantially lower
amount of investments in organic growth in the 2013 fiscal year was fully covered by cash
provided by operating activities from continuing operations amounting to €610 million.
In the previous year, free cash flow had been a negative amount of €219 million. Net cash
provided by operating activities had only covered 75 percent of additions to property, plant
and equipment and intangible assets totaling €890 million.
G 72
Free cash flow
€ in millions
2012 2013
Net cash provided by operating activities
from continuing operations
Net cash used in investing activities
from continuing operations
Purchase of and proceeds from sales
of financial investments, net
Free cash flow
(328)610
(47)235
(1,013)667
127
(219)
129INFINEON TECHNOLOGIES ANNUAL REPORT 2013
GROUP PERFORMANCE
REVIEW OF LIQUIDITY

Gross cash position and net cash position
The following table reconciles the gross cash position and net cash position (i.e. after
deduction of debt). Since some liquid funds are held in the form of financial investments,
which for IFRS purposes are not considered to be “cash and cash equivalents”, Infineon
reports on its gross and net cash position in order to provide investors with a better under-
standing of its overall liquidity. The gross and net cash position is determined as follows
from the Consolidated Statement of Financial Position:
€ in millions September 30, 2013
September 30, 2012
Cash and cash equivalents 527 425
Financial investments 1,759 1,810
Gross cash position 2,286 2,235
Less:
Short-term debt and current maturities of long-term debt 134 55
Long-term debt 169 240
Total debt 303 295
Net cash position 1,983 1,940
The gross cash position at September 30, 2013 amounted to €2,286 million, up by
€51 million on the €2,235 million reported at September 30, 2012. The increase in the
gross cash position mainly reflects positive free cash flow, which counteracted against
disbursements in conjunction with the capital returns program and the dividend payment.
The net cash position, which is defined as the gross cash position less short-term and
long-term debt, increased accordingly by €43 million from €1,940 million as of Septem-
ber 30, 2012 to €1,983 million as of September 30, 2013.
G 73
Liquidity position as of September 30, 2013 and 2012 by comparison
€ in millions
2012 2013
Gross cash position Net cash position Debt
2,2861,983
303
2,2351,940
295
130 INFINEON TECHNOLOGIES ANNUAL REPORT 2013
GROUP MANAGEMENT REPORT – OUR 2013 FISCAL YEAR

REPORT ON EXPECTED DEVELOPMENTS, TOGETHER WITH ASSOCIATED MATERIAL RISKS AND OPPORTUNITIES
OUTLOOK
Infineon’s target operating model
Infineon’s potential for growth is rooted in three fundamental challenges facing today’s
society, namely energy efficiency, mobility and security. A more detailed description of
these topics is provided in the chapter “The Segments”. The demand triggered by these
underlying trends drives growth in the following four target markets: automotive elec-
tronics, industrial electronics, information and communications electronics and security.
A description of these markets is included in the chapter “Finances and Strategy” in
“Group strategy”. Infineon addresses the four target markets via its four segments, Auto-
motive, Industrial Power Control, Power Management & Multimarket and Chip Card & Secu-
rity. Infineon has a leading market position in all four segments. We aim to maintain and
improve on these market positions by means of organic growth. Based on the growth rates
achieved by Infineon in the past, the growth of the markets concerned and, last but not
least, our intention to either maintain or increase market share, Infineon expects to achieve
an annual average revenue growth rate of between 7 and 8 percent over the economic cycle.
The introduction of a steady stream of new, innovative products is paramount to our
endeavor to match the growth rates generated in the markets we address. Examples of
new products have been highlighted throughout this Annual Report. Infineon’s XMC1000
and XMC4000 microcontrollers, the innovative “Blade” packaging technology and an
infrared-based 3D imaging sensor are described in the chapter “Research & Development”.
The new thermal interface material (TIM) for IGBT modules is explained in the chapter
“The Segments” in “Industrial Power Control”.
Infineon remains committed to achieving a Segment Result Margin of approximately
15 percent and a gross margin of 40 percent over the economic cycle. Expense ratios
at a low to mid-teen percentage for R&D and a low teen percentage for selling and adminis-
trative expenses are being targeted. Thanks to Infineon’s high gross cash position and
low level of gross debt, net financial result is likely to be only marginally negative. Due to
the existence of tax loss carry-forwards, Infineon expects a cash effective tax rate of
approximately 15 percent until the tax loss carry-forwards have been utilized.
Due to the prevailing adverse economic and financial conditions, Infineon reduced invest-
ments to a minimum in the 2009 and 2010 fiscal years. The investments postponed at that
stage were undertaken during the 2011 and 2012 fiscal years. Infineon has also invested
heavily in innovative and cost-efficient 300-millimeter thin-wafer manufacturing technology
and in creating additional capacity at a new second plant in Kulim (Malaysia). The ratio of
investments to revenue was therefore in excess of 20 percent in both the 2011 and 2012
fiscal years. Owing to subdued demand in the 2013 fiscal year, investment levels were
reduced compared to the original budget. As a consequence, the ratio of investments to
revenue in the 2013 fiscal year was closer to 10 percent. Looking at the 2014 fiscal year
and beyond, investments are forecast at approximately 15 percent of revenue. The pre-
requisite is a commensurate rate of global economic growth with its corresponding positive
impact on demand and revenue at Infineon.
P See page 26
P See page 66 and 68
P See page 49
131INFINEON TECHNOLOGIES ANNUAL REPORT 2013
REPORT ON EXPECTED DEVELOPMENTS, TOGETHER WITH ASSOCIATED MATERIAL RISKS AND OPPORTUNITIES
OUTLOOK

Infineon believes that the business model described above and its current corporate struc-
ture puts it in a strong position. Having said this, the first steps towards implementing our
new “Product to System” strategy were taken in the 2013 fiscal year. The new approach
puts a fresh perspective on the development of new products by placing greater emphasis
on understanding the customer’s product and the overall system in which it is integrated.
A detailed description of the new strategy is provided in the chapter “Group strategy” in
“New strategic direction: Product to System”.
Actual and target values for performance indicators
The following table compares the actual values of Infineon’s key performance indicators
with the original forecasts for the 2013 fiscal year (FY) and shows the outlook for the 2014
fiscal year:
€ in millions,
except percentages
Actuals Original Outlook Actuals Outlook
FY 2012 FY 2013 FY 2013 FY 2014
Principal performance indicators
Segment Result Margin 13.5 % Mid to high single-digit percentage of revenue
9.8 % Between 11 % and 14 % of revenue
Free cash flow (219)Positive
235 Equal to or exceeding the level of FY 2013
RoCE 22.3 %–
14.1 % Increase compared with FY 2013
Supplementary performance indicators
Growth and profitability perfor-mance indicators
Change in revenue compared to previous year
(2 %) Mid to high single-digit percentage decrease compared to FY 2012
(2 %) Increase between 7 % and 11 %
Gross margin 36.6 % Between 32 % and 34 % of revenue
34.4 % Between 35 % and 38 % of revenue
Research and Development expenses
455 Rise by around 10 % compared to FY 2012
52515 %
Increase at a rate below change in revenue
Selling, general and administrative expenses
475 Slight rise compared to FY 2012
440(7 %)
Increase at a rate similar to or slightly above change in revenue
Liquidity performance indicators
Gross cash position 2,23557.2 %
Higher than actual target of 30 – 40 % of revenue
2,28659.5 %
Higher than actual target of 30 – 40 % of revenue
Net cash position 1,940
Net cash position(gross cash position
higher than debt)
1,983
Net cash position (gross cash position
higher than debt)
Working capital (353)
Increase compared to September 30, 2012
(123)
Slight increase compared to September 30, 2013
Investments 890
Approximately €400 million
378
About €650 million
Infineon either achieved or surpassed its forecasts for the two principal performance
indicators, Segment Result Margin and free cash flow. At 9.8 percent, Segment Result
Margin was at the upper end of a mid-to-high single-digit percentage range. Free cash
flow turned around from a negative amount in the 2012 fiscal year to a clearly positive
amount of €235 million in the year under report. No explicit forecast was given for RoCE.
At 14.1 percent, however, the level achieved exceeded Infineon’s cost of capital.
P See page 32
132 INFINEON TECHNOLOGIES ANNUAL REPORT 2013
GROUP MANAGEMENT REPORT – OUR 2013 FISCAL YEAR

Regarding supplementary performance indicators, the picture was mixed. The 2 percent
decrease in revenue was a better outcome than the forecasted mid- to high-single-digit
percentage decrease, reflecting the fact that the global economy actually performed better
than had been assumed at the time the forecast was established (fall 2012). Therefore the
actual gross margin of 34.4 percent was slightly higher than the target corridor of between
32 percent and 34 percent.
The 15 percent increase in R&D expenses was significantly higher than the predicted increase
of 10 percent, with the recruitment of staff in this area implemented slightly faster than
expected and variable compensation up due to higher-than-forecast corporate earnings.
The sum of these two factors resulted in higher personnel expenses. The slightly lower-than-
forecast level of grants and subsidies received also had the effect of increasing expenses.
Selling, general and administrative expenses decreased by 7 percent, rather than going up
slightly as predicted. Cost-reduction measures decided upon and implemented in fall
2012 had the greatest impact in the area of administrative expenses. The measures
continued to have a positive effect in the second half of the year, even as revenue levels
increased sharply.
Overall, Infineon performed better in the 2013 fiscal year than originally expected.
Infineon’s forecast of key performance indicators for the 2014 fiscal year is summarized
in the table above and discussed in detail below.
Assumed euro/US dollar exchange rate
As a globally operating organization, Infineon generates revenue not only in euros, but
also in foreign currencies, predominantly in US dollars. Similarly, it also incurs costs in
US dollars and in currencies correlated to the US dollar. The impact of non-euro denomi-
nated revenue and costs does not always balance out. For this reason, fluctuations in
exchange rates, particularly between the euro and the US dollar, influence the amounts
reported for revenue and earnings. Excluding the effect of currency hedging instruments,
the impact of a deviation of one cent in the actual exchange rate of the US dollar against
the euro compared to the forecast rate would be a change in Segment Result of approxi-
mately €1 million per quarter or approximately €4 million per fiscal year compared to the
forecast value. The currency impact is even more pronounced for revenue: a deviation
of one cent in the actual exchange rate of the US dollar against the euro compared to the
forecast rate would have an impact on revenue of between €3 million and €4 million per
quarter or between €12 million and €16 million per fiscal year. Planning for the 2014
fiscal year is based on an assumed average exchange rate for the US dollar against the
euro of 1.35.
Growth prospects for the global economy and the semiconductor market
After dipping to an anticipated 2.3 percent in the 2013 calendar year compared to the previ-
ous year’s 2.6 percent growth rate, economic experts from the International Monetary Fund
(IMF) are forecasting an acceleration in growth to 3.0 percent for the 2014 calendar year.
This prediction is based on the assumption that the situation with respect to the European
debt crisis will continue to stabilize and that the signs of revival in the eurozone will be
confirmed. The US economy is recovering well and is expected to continue improving in
2014. A further aspect to consider is that since the new government in China came into
power in March 2013, it has decided on a series of measures aimed at stabilizing and/or
boosting economic growth.
133INFINEON TECHNOLOGIES ANNUAL REPORT 2013
REPORT ON EXPECTED DEVELOPMENTS, TOGETHER WITH ASSOCIATED MATERIAL RISKS AND OPPORTUNITIES
OUTLOOK

Even small changes in global economic growth rates generally have a pronounced impact
on the semiconductor market. The IMF forecasts that the global economic growth will
increase by approximately 0.7 percentage points in the 2014 calendar year. Based on
these macroeconomic conditions, for the 2014 calendar year the market research company
IHS forecasts 7 percent growth (based on the US dollar) in the semiconductor market
(excluding microprocessors and memory chips) addressed by Infineon. After remaining at
a level of US$ 207 billion in the 2012 calendar year and growing by only an estimated rate
of 2 percent in the 2013 calendar year, the growth prospects for the market segment in
which Infineon operates now look significantly brighter for the 2014 calendar year.
Over the period 2013 to 2017, IHS expects the global semiconductor market (excluding
microprocessors and memory chips) to grow at an average rate of 4 percent per annum.
The automotive sector is expected to grow at an average rate of 8 percent per annum during
the same period. At 5 percent respectively, the annual average growth rates predicted for
the industrial sector and for chip cards are somewhat lower. ¹
Revenue increase between 7 and 11 percent expected in the 2014 fiscal year
In view of the economic situation described above, Infineon expects Group revenue in
the 2014 fiscal year to increase by between 7 and 11 percent. The rise in revenue in the
Industrial Power Control segment should be well above the average for the Group as a
whole. The growth rates forecast for the Power Management & Multimarket and the Chip
Card & Security segments correspond roughly to the expected Group average. The Auto-
motive segment is likely to grow at a rate slightly lower than the Group average. Revenue
generated by Other Operating Segments has decreased sharply in each of the last two
fiscal years and in the 2013 fiscal year totaled €26 million. Revenue in the 2014 and sub-
sequent fiscal years is forecast to be at a similar or slightly lower level, reflecting further
successive decreases in business volumes with Lantiq and IMC.
Based on the assumption that global economic conditions will remain stable, Infineon
forecasts continued revenue growth in the 2015 fiscal year.
Gross margin expected to improve slightly in the 2014 fiscal year
to between 35 and 38 percent
Increased revenue in the 2014 fiscal year should also result in an improved gross margin.
Due to higher capacity utilization rates, expenses for under-utilized manufacturing capacities
will also be lower. In contrast, the usual annual round of price reductions for customers,
higher depreciation and amortization and increasing costs for the ramp-up of 300-millimeter
thin wafer into volume production will have a negative impact. The combined effect of these
various factors is that the improvement in gross margin will be relatively small. Depending
on the actual amount of revenue growth, Infineon expects the gross margin to rise from
34.4 percent to within a range between 35 and 38 percent in the current fiscal year.
With revenue growth expected to continue in the 2015 fiscal year, the gross margin should
then improve further.
1 The lower average of 4 percent for the semiconductor market (excluding microprocessors and memory chips) results from
the low expectations of growth for the data processing and general consumer electronics submarkets. The growth rates
predicted for these submarkets for the period 2013 to 2017 are very low or even negative.
134 INFINEON TECHNOLOGIES ANNUAL REPORT 2013
GROUP MANAGEMENT REPORT – OUR 2013 FISCAL YEAR

Operating expenses expected to increase
R&D expenses as percent of revenue and SG&A expenses as a percentage of revenue were
13.7 percent and 11.4 percent respectively in the 2013 fiscal year. Most of the increase in
the size of the workforce in the 2013 fiscal year took place towards the end of the period
under report, which meant that the workforce was significantly larger at the end of the report-
ing period than on average over the 2013 fiscal year. The full cost impact of the increase
will now apply throughout the whole of the 2014 fiscal year. Costs will also be pushed up
by the combined effect of a further slight rise in employee numbers and the usual pay
increases. Both R&D expenses and SG&A expenses will therefore increase in absolute terms.
The percentage increase in R&D expenses should be slightly lower than that of revenue.
SG&A expenses are expected to increase at a similar or slightly higher pace than revenue.
Due to the high percentage of products that Infineon manufactures in-house, a considerable
proportion of R&D expenses goes into developing new manufacturing process technolo-
gies. Some of the developments scheduled for the 2014 fiscal year are described below.
IGBT power transistors and low-voltage transistors belonging to the OptiMOS™ family will
be transferred to and qualified for 300-millimeter thin-wafer manufacturing technology.
Work will be performed on manufacturing processes for silicon carbide (SiC) and gallium
nitride components for power semiconductors with wide bandgaps. In collaboration with
Globalfoundries, 40-nanometer embedded Flash process technology will be developed
in the field of microcontroller products for automotive, industrial, chip card and security
applications. The development of 65-nanometer embedded Flash process technology was
completed in the course of the 2013 fiscal year, together with our manufacturing partner
Taiwan Semiconductor Manufacturing Company (TSMC), and the first product developments
for the Automotive and Chip Card & Security segments have already been initiated.
In addition to creating new manufacturing processes, the development of semiconductor
products is another key item for R&D expenses. In the Automotive segment, one of the
areas of focus will be on expanding the product portfolio for industrial microcontrollers.
The product and technology portfolio for vehicle lighting applications will be strengthened.
Furthermore, our range of power modules for electric vehicle drive systems and sensors
will be enlarged. In the Industrial Power Control segment, additional diodes and transistors
will be developed on the basis of SiC technology. Additions will also be made to the family
of IGBT-driver ICs. New product versions capable of handling higher temperatures and power
densities will be designed for the .XT connection technology. In the field of power supplies,
the Power Management & Multimarket segment is working on the so-called C8 product
family, which constitutes the eighth generation of the CoolMOS™ family of high-voltage
power transistors. Furthermore, the product portfolio of digital controllers for AC/DC con-
version and DC/DC conversion will be expanded. The Blade chip-embedded package tech-
nology will feature versions with smaller packaging. In the Chip Card & Security segment,
the focus in general will be on continued development of the segment’s three core com-
petencies – security, contactless communication and embedded control – as well as the
corresponding products. Moreover, we will continue to invest in basic research on security
technology for future generations of security products.
Selling expenses are expected to rise at a more pronounced rate than revenue growth. The
major expansion of sales resources undertaken in the 2013 fiscal year will now have an
impact on costs for the first time for a full fiscal year. Annual pay rises and a further slight
increase in sales resources will also increase selling expenses in the 2014 fiscal year.
135INFINEON TECHNOLOGIES ANNUAL REPORT 2013
REPORT ON EXPECTED DEVELOPMENTS, TOGETHER WITH ASSOCIATED MATERIAL RISKS AND OPPORTUNITIES
OUTLOOK

One of the main areas for expanding resources will be in the Power Management & Multi-
market segment, where the new strategy of moving from “Product to System” will not only
require greater expertise throughout the sales organization, but also an increase in the
workforce. With these resources, we will be able to provide more intensive and targeted
support to existing customers as well as to acquire new customers. The Automotive
segment and the Chip Card & Security segment are also investing in expanding sales and
marketing resources.
The number of people employed in administration should remain more or less unchanged.
The absolute expense will, however, be affected by annual pay increases and other
general cost increases. Overall, administrative expenses are expected to rise roughly in
line with revenue.
Operational costs are also likely to rise in the fiscal years following the 2014 fiscal year as
a result of the continued expansion of business volumes and the annual pay increases.
Rises in R&D expenses and selling expenses are quite likely to be in line with revenue growth.
In contrast, the increase in administrative expenses should be lower than revenue growth.
Segment Result Margin of between 11 and 14 percent expected
Taking into account the various forecasts of revenue and expense developments described
above, the Segment Result Margin is likely to improve significantly in the current fiscal
year. Infineon forecasts a rise from 9.8 percent in the 2013 fiscal year to between 11 and
14 percent in the 2014 fiscal year.
Should economic developments subsequent to the 2014 fiscal year generate continued
revenue growth, the Segment Result Margin is likely to rise further in comparison to the
2014 fiscal year. Infineon’s long-term goal remains unchanged: to achieve an average
Segment Result Margin of 15 percent over the economic cycle.
Non-operating segment result
Infineon expects the non-operating segment result to total approximately negative
€50 million in the 2014 fiscal year, more or less unchanged from the 2013 fiscal year’s
non-operating segment result of negative €52 million.
Financial result
The convertible bond issued by Infineon in 2009 will be due for repayment or conversion
into shares in May 2014. For this reason, the interest expense for the 2014 fiscal year will
be lower than in the year just ended. With respect to interest income in the current fiscal
year, Infineon has made its forecast on the basis of an unchanged interest rate scenario.
Overall, therefore, the net financial result is forecast to show a slight improvement over
the 2013 fiscal year’s figure of negative €19 million. This forecast of the 2014 fiscal year
financial result does not take into account losses arising from the repurchase of part of the
convertible bonds due 2014. These may occur if Infineon should make use of the capital
returns program approved by the Supervisory Board on November 19, 2013, and buy back
some of the convertible bonds.
With the convertible bond maturing in the 2014 fiscal year, there will be no interest
expense for this liability in the 2015 fiscal year, which should lead to a further improve-
ment in the net financial result.
136 INFINEON TECHNOLOGIES ANNUAL REPORT 2013
GROUP MANAGEMENT REPORT – OUR 2013 FISCAL YEAR

Income taxes
The cash effective tax rate for the Infineon Group in the 2014 fiscal year is forecast at
approximately 15 percent. This rate comprises foreign tax rates (in some cases higher than
the expected average level) as well as cash-flow-relevant taxes in Germany. The minimum
taxation rules applicable in Germany and the existence of tax loss carry-forwards mean
that only 40 percent of Infineon’s German profits will be subject to current tax, giving rise
to a cash effective tax rate of approximately 12 percent in Germany. Infineon expects the
rate to remain at this level until the tax loss carry-forwards are utilized. As of September
30, 2013 corporation tax losses and municipal trade tax losses available for carry-forward
in Germany amounted to €2.9 billion and €4.0 billion, respectively. Changes in the valua-
tion of deferred tax assets may have an additional impact, but are not relevant for cash
flow purposes.
Beyond the 2014 fiscal year, a cash effective tax rate of 15 percent remains the target.
Slight increase in working capital expected
As of September 30, 2013, the Infineon Group’s working capital stood at an amount of
negative €130 million, which was an increase of €223 million over the amount reported
at the end of the 2012 fiscal year. This increase in net working capital is also expected
to continue in the 2014 fiscal year, with the forecast increase in revenue resulting in higher
levels of trade receivables and inventories, a development that will only partially be offset
by increased trade payables.
Net working capital is forecast to increase again in the 2015 fiscal year as revenue contin-
ues to rise.
Investments, manufacturing capacities and depreciation and amortization
After a period of subdued revenue performance in the 2012 and 2013 fiscal years, demand
for our products – and hence the rates at which our manufacturing facilities are utilized –
increased significantly towards the end of the 2013 fiscal year. In this situation, it is neces-
sary to raise the level of investments compared to the previous fiscal year. For the 2014
fiscal year it is planned to spend €650 million for investments. In the 2013 fiscal year we
invested €378 million.
One of the most important investments in the 2014 fiscal year will be in the further
development of the 200-millimeter technology. The introduction of new products makes it
continually necessary to adjust manufacturing lines. Further investments are being made
to ensure and improve quality, for innovations in manufacturing processes and the con-
version of the manufacturing line for components with aluminum-based metal layers to
components with copper-based metal layers. The lower resistivity of copper as compared
with aluminum reduces the power loss per chip, thereby boosting energy efficiency.
Apart from investment in 200-millimeter manufacturing equipment, we will also push
ahead with the expansion of 300-millimeter thin wafer capacities. Volume production has
already begun at both 300-millimeter thin-wafer manufacturing sites in Villach (Austria)
and Dresden (Germany). Further 300-millimeter products are scheduled for customer
qualification and subsequent volume production in the course of the 2014 fiscal year.
Investments in backend manufacturing are also planned. However, the amount set aside
for this purpose is significantly lower than that earmarked for frontend manufacturing.
The investments mainly relate to adjustments required to machinery for the launch of new
products, innovations and the expansion of backend capacities.
137INFINEON TECHNOLOGIES ANNUAL REPORT 2013
REPORT ON EXPECTED DEVELOPMENTS, TOGETHER WITH ASSOCIATED MATERIAL RISKS AND OPPORTUNITIES
OUTLOOK

Beyond the 2014 fiscal year, investments will average approximately 15 percent of revenue.
The focus of our investments in the 2013 fiscal year, as well as the resulting manufacturing
capacities that are now available for the 2014 fiscal year, are described in detail in the
chapter “Operations”.
Based on total budgeted investments of approximately €650 million in the current year,
depreciation and amortization will continue to rise and is expected to reach an amount
of €500 million or slightly higher in the 2014 fiscal year. In view of the target of keeping
investments at approximately 15 percent of revenue, depreciation and amortization is
likely to increase further in the 2015 fiscal year.
Free cash flow
The forecast improvement in earnings, coupled with higher depreciation and amortization,
is expected to generate a sharp increase in cash provided by operating activities from
continuing operations in the current fiscal year. For this reason, Infineon forecasts that free
cash flow will equal or exceed the previous year’s level, despite the significant rise in
investments planned for the 2014 fiscal year.
Beyond the 2014 fiscal year, the aim is a return to Infineon’s strategic targets of revenue
growth at a high single-digit percentage and an average Segment Result Margin of 15 percent
over the economic cycle. Based on investments equivalent to approximately 15 percent
of revenue, a corresponding expense for depreciation and amortization and a further small
increase in working capital, free cash flows should be clearly positive.
Cash flow from financing activities
It shall be proposed to the forthcoming Annual General Meeting that the dividend remains
unchanged compared to 2012 at €0.12. Assuming the Annual General Meeting approves
this proposal, the total dividend will amount to approximately €129 million.
The dividend is paid out of the unappropriated profit of Infineon Technologies AG, which is
determined on the basis of the regulations contained in the German Commercial Code (HGB).
By contrast, the Consolidated Financial Statements for the Group are drawn up in accor-
dance with IFRS requirements. Significant differences can therefore arise in determining net
income in the financial statements of Infineon Technologies AG and the Infineon Group.
Infineon’s business is capital intensive and calls for substantial investments in new manu-
facturing capacities. The size of these investments may vary significantly from year to year
and be particularly high in certain years. Thus, irrespective of fluctuations in earnings,
significant differences between Group net income and free cash flow can arise in fiscal
years with very high investments. Infineon intends to maintain the dividend at least at
a constant level, even in years when free cash flow is negative.
Infineon’s dividend policy is therefore not based on changes in net income, and for this
reason the ratio of distribution to net income is not reported. Rather, it is Infineon’s goal to
enable shareholders to participate appropriately in growing earnings via the dividend or,
in times of flat or declining earnings and/or negative free cash flow, to keep the dividend
at a constant level.
P See page 70
138 INFINEON TECHNOLOGIES ANNUAL REPORT 2013
GROUP MANAGEMENT REPORT – OUR 2013 FISCAL YEAR

Fiscal year Dividend per share
2010 €0.10
2011 €0.12
2012 €0.12
Proposal 2013 €0.12
The previous capital returns program expired on March 31, 2013. In view of the comfort-
able liquidity position, low levels of debt and a significantly positive free cash flow, the
Company has issued a new capital returns program. Through this program an amount of up
to €300 million may be used to acquire either convertible bonds or own shares, either
directly through the stock exchange or indirectly through put options, during the period
from November 19, 2013, to September 30, 2015. The cash outflows in the 2014 fiscal
year associated with the new capital returns program will depend on the actual levels of
repurchases during the 2014 fiscal year.
Infineon’s convertible bond falls due for repayment or conversion on May 26, 2014.
As of September 30, 2013 the outstanding nominal amount of the convertible bond was
€113 million. Based on the current stock exchange price of the Infineon share and the
conversion price of €2.22, it can be assumed that the full amount of the bond will be con-
verted into approximately 51 million shares. It is therefore unlikely that the maturity of the
convertible bond will involve any cash outflow, assuming that Infineon does not repurchase
any bonds before their conversion.
Infineon is pursuing the long-term strategy of maintaining a gross cash position of between
30 and 40 percent of revenue. Further targets are to maintain a net cash position and to
keep gross debt to a maximum level of two times EBITDA. Infineon’s forecast indicates that
these targets will be surpassed in the 2014 fiscal year and that free cash flow is likely to be
higher than the envisaged dividend. Consequently, Infineon is not planning any significant
financing transactions.
Overall statement on the expected development of the Infineon Group
Based on the positive forecasts regarding global economic development in the 2014
calendar year, Infineon predicts year-on-year revenue growth of between 7 and 11 percent,
a gross margin of between 35 and 38 percent and a Segment Result Margin of between
11 and 14 percent.
Overview in table form of the described revenue and earnings forecasts
2013 2014 2015
Change in revenue compared to the previous year
(2 %) Increase between 7 % and 11 %
Continued revenue growth
Gross margin 34.4 % of revenue Between 35 % and 38 % of revenue
Further improvement
Segment Result Margin
9.8 % of revenue Between 11 % and 14 %of revenue
Further improvement
Investments will be increased significantly over the 2014 fiscal year and total approxi-
mately €650 million. Depreciation and amortization will also rise and reach an amount of
€500 million or slightly higher. Free cash flow is expected to be at the previous year’s level
or slightly higher. The return on capital employed (RoCE) should also show an improvement
compared with the 2013 fiscal year.
139INFINEON TECHNOLOGIES ANNUAL REPORT 2013
REPORT ON EXPECTED DEVELOPMENTS, TOGETHER WITH ASSOCIATED MATERIAL RISKS AND OPPORTUNITIES
OUTLOOK

Infineon has leading market positions in all four of its segments. Energy efficiency, mobility
and security are the drivers that will bring growth to Infineon. Infineon has excellent prod-
ucts and technologies and long-standing relationships with customers, who are themselves
leaders in their sectors. The aim now is to consolidate and build on the market positions
already attained. There are no plans to sell any significant parts of the business. Based on
this strategy, the Management Board considers that Infineon is well positioned to achieve
further profitable revenue growth beyond the 2014 fiscal year.
RI SK AND OPPORTUNITY REPORT
Risk policy: Underlying principles of our risk and opportunity management
Effective risk and opportunity management is a key component in all of our business
activities and supports us in our goal of achieving sustainable, profitable growth. The
semiconductor business is characterized to a very high degree by periods of rapid growth
followed by periods of significant market decline. Our risks and opportunities are affected
by the need for capital investment in order to achieve and sustain our market position as
well as the sector’s extraordinarily rapid pace of technological change. Gaining a leading
edge through technological innovation also has a legal dimension. In view of the special
characteristics of the semiconductor industry, Infineon’s risk policy is aimed at taking
advantage of identified opportunities as quickly as possible in the way most appropriate to
grow the value of the business. At the same time, existing risks and those associated with
opportunities should be actively managed, particularly if they could pose a threat to the
going-concern status of any of the Group’s entities. In order to achieve this objective, risk
management at Infineon is closely linked to business forecasting and the achievement
of business strategies. Ultimate responsibility for risk management lies with the Infineon
Management Board.
Various coordinated risk management and control system elements are in place that
enable us to pursue our stated risk policy in practice. Alongside the “Risk and Opportunity
Management System” and the “Internal Control System with respect to Financial Reporting
Processes” described below, it also includes our group-wide forecasting, management
and internal reporting processes on the one hand and the Compliance Management System
on the other.
Risk and Opportunity Management System
Infineon’s centralized risk management system is based on a group-wide and management-
oriented Enterprise Risk Management (ERM) approach, which aims to cover all relevant
risks and opportunities. This approach is based on the “Enterprise Risk Management –
Integrated Framework” developed by the Committee of Sponsoring Organizations of the
Treadway Commission (COSO). The objective of the system is the early identification,
assessment and management of risks that could have a significant influence on Infineon’s
ability to achieve its strategic, operational, financial and compliance-related targets. We
therefore define risk/opportunity as the occurrence of future uncertainties that could result
in a negative or positive variance from forecast. We incorporate all relevant organizational
units within the Group in this analysis, thus covering all segments, significant centralized
functions and regions.
Responsibility for processes and systems relating to Risk and Opportunity Management rests
with the Risk Management and Internal Control System (ICS) function within the central
finance department and with designated Risk Officers working at segment, corporate func-
tion and regional levels. Responsibility for the identification, measurement, management
and reporting of risks and opportunities lies with the management of the organizational
unit concerned.
140 INFINEON TECHNOLOGIES ANNUAL REPORT 2013
GROUP MANAGEMENT REPORT – OUR 2013 FISCAL YEAR

In organizational terms, the Risk and Opportunity Management System is structured in a
closed-loop, multiple-stage process, which stipulates the manner and criteria to be applied
to identify, measure, manage and report on risks and opportunities and defines how the
system is to be monitored as a whole. Major components of the system are a quarterly
analysis of risks and opportunities, reporting by all consolidated entities, an analysis of the
overall situation at segment, regional and Group level, and reporting to the Management
Board on the risks and opportunities situation and major management measures undertaken.
The Management Board, in turn, reports regularly to the Supervisory Board’s Investment,
Finance and Audit Committee. Where necessary, standard processes are supplemented by
the ad-hoc reporting of any major risks identified between regular reporting dates.
Risks and opportunities are measured on a net basis, i.e. after factoring in any risk mitigation
or hedging measures, but without offsetting any provisions recognized. The time periods
and the measurement categories used are closely linked to our short- and medium-term
business forecasts and corporate objectives.
All relevant risks and opportunities are assessed uniformly across the Group in quantitative
and/or qualitative terms based on the variables degree of impact on operations, financial
condition, earnings, cash flow and reputation on the one hand, and likelihood of occurrence
on the other.
The scales used to measure these two factors (degree of impact and likelihood of occurrence)
and the resulting risk assessment matrix is depicted in the following table.
B ased on the degree of impact on operations, financial condition, earnings, cash flow
and reputation and the estimated probability of occurrence, a risk is classified as “high”,
“medium” or “low”.
All reported risks and opportunities in their entirety are reviewed for the Infineon Group
for possible correlation and overlap factors and are analyzed using an Infineon specific
categorization model. Regular risks and opportunities analysis and new developments in
risk management culture are supplemented by annual, interdisciplinary workshops held
at segment, corporate and regional levels. Important information relevant for Infineon’s
Risk and Opportunity Management System is available to all employees via our intranet,
including access to ERM tools and ERM guidelines, containing job descriptions for all func-
tions involved in the process as well as all information necessary for reporting purposes.
Likelihood of Occurrence
1 Unlikely
2 Possible
3 Likely
4 Probable
5 Certain
Degree of Impact
1 Marginal
2 Minor
3 Moderate
4 Significant
5 Major
G 74
Risk assessment matrix
5
Degree of Impact
1 2 3 4 5 Likelihood of Occurrence
4
3
2
1
Low Risk Medium Risk High Risk
141INFINEON TECHNOLOGIES ANNUAL REPORT 2013
REPORT ON EXPECTED DEVELOPMENTS, TOGETHER WITH ASSOCIATED MATERIAL RISKS AND OPPORTUNITIES
RISK AND OPPORTUNITY REPORT

Risk and Opportunity Managers are designated at appropriate hierarchical levels to manage
and monitor identified risks and opportunities, and are responsible for formally determining
a set of appropriate strategies (avoidance, mitigation, transfer to other parties, acceptance).
Working closely with corporate functions and individual managers, the Risk and Opportunity
Manager is also responsible for defining and monitoring appropriate measures aimed at
implementing the adopted management strategy. For our system to be successful, it is
essential that risks and opportunities are managed and monitored pro-actively and with
a great deal of commitment.
Compliance with the ERM approach is monitored by the corporate Risk Management and
Internal Control System (ICS) departments using procedures incorporated in business
processes. Group Internal Audit also employs specific procedures to test compliance with
legal requirements and Infineon guidelines and, where appropriate, rules relating to Risk
and Opportunity management and initiates corrective measures. The Supervisory Board’s
Investment, Finance and Audit Committee oversees the effectiveness of the Risk Manage-
ment System. As part of the year-end audit, the external Group auditor also examines our
early warning system pursuant to section 91, paragraph 2, of the German Stock Corporation
Act to ascertain its suitability to detect risks that could pose a threat to Infineon’s going-
concern status and reports thereon annually to the Chief Financial Officer (CFO) and the
Investment, Finance and Audit Committee of the Supervisory Board.
Internal Control System with respect to financial reporting process
The principal focus of the ICS is on the financial reporting process with the aim of monitoring
the proper maintenance and effectiveness of accounting systems and financial reporting.
The primary objective of the ICS is to minimize the risk of misstatement in Infineon’s internal
and external reporting and to ensure that there is reasonable assurance that the Consoli-
dated Financial Statements comply with all relevant regulations. Appropriate controls must
therefore be in place throughout the organization to ensure such compliance. Clear lines
of responsibility are assigned to each of the processes.
The Internal Control System at Infineon ensures the required degree of effectiveness
stipulated by German law (BilMoG) and is an integral part of the accounting process in all
relevant legal entities and corporate functions. The system monitors compliance with
stated principles and stipulated procedures based on preventive and detective controls.
Among other things, we regularly check that:
> the Group’s uniform financial reporting, measurement and accounting entry guidelines
are continually updated and adhered to;
> intragroup transactions are fully accounted for and properly eliminated;
> issues relevant for financial reporting and disclosures in connection with agreements
entered into are recognized and appropriately presented;
> explicit processes and controls exist to guarantee the completeness and correctness
of the year-end financial statements and financial reporting;
> processes exist for the segregation of duties and for the dual control principle in the
context of preparing financial statements, as well as for authorization and access rules
for relevant IT accounting systems.
We systematically assess the effectiveness of the ICS with regard to the corporate accounting
process. An annual risk analysis is initially performed and the defined controls are revised
as and when required. This involves identifying and updating significant risks relating to
accounting and financial reporting in the relevant legal entities and corporate functions.
The controls defined for the identification of risks are documented in accordance
142 INFINEON TECHNOLOGIES ANNUAL REPORT 2013
GROUP MANAGEMENT REPORT – OUR 2013 FISCAL YEAR

with group-wide guidelines. Regular random tests are performed to assess the effectiveness
of the controls. These tests constitute the basis for the self-assessment of the appropriate
extent and effectiveness of the controls. The results of this self-assessment are documented
and reported in a global IT system. Any deficiencies identified are remedied with due con-
sideration given to their potential impact.
In addition, all legal entities, segments and relevant corporate functions confirm with their
Representation Letter that all business transactions are accounted for and all assets and
liabilities have been reflected in the Statement of Financial Condition.
Assessment of effectiveness
At the end of the annual cycle, the material legal entities review and confirm the effective-
ness of the ICS with regard to the accounting and the financial reporting process. The
Management Board and the Investment, Finance and Audit Committee of the Supervisory
Board are regularly informed about any noticed significant control deficiencies and the
effectiveness of the internal controls.
The Risk Management and ICS are continuously reviewed to comply with internal and
external requirements – for example those defined by BilMoG. The improvement of the sys-
tem supports the continuous monitoring of the relevant risk areas within the responsible
organizational units.
Significant risks
In the following section, we describe risks that could have a significant or materially adverse
impact on Infineon’s operations, financial condition, earnings, cash flows and reputation.
Depending on the potential degree of impact and the estimated probability of occurrence,
the risk class is shown in parentheses for each risk (e.g. “RC: high”).
Strategic risks
Unsettled political and economic climate (RC: high)
As a globally operating company, our business is highly dependent on global economic
developments. A worldwide economic downturn – particularly in the markets we serve –
may result in lower revenues than originally expected. Risks can also arise due to political
and social changes in countries in which we manufacture and/or sell our products.
We continue to observe the European debt crisis, where, under the pressure of high levels
of public sector debt, governments are implementing a wide range of measures to consoli-
date budgetary shortfalls and cut investment expenditure. As a consequence of these
developments, the level of trust of consumers and companies is characterized by uncer-
tainty, and high levels of unemployment are being experienced. Additional macroeconomic
risks also arise in conjunction with a possible exit of individual countries from the eurozone
and from the threat of rising inflation. The recovery in the USA is only proceeding slowly
and, the government finds itself back in political deadlock in its endeavors to legislate the
federal budget. China’s industrial sector has is facing weaker foreign demand and lower
investment levels. Regardless of our assessment of potential scenarios and outcomes
within this complex field of risks, these developments could possibly have an adverse
impact on Infineon’s operations, financial condition, cash flows and earnings.
143INFINEON TECHNOLOGIES ANNUAL REPORT 2013
REPORT ON EXPECTED DEVELOPMENTS, TOGETHER WITH ASSOCIATED MATERIAL RISKS AND OPPORTUNITIES
RISK AND OPPORTUNITY REPORT

Cyclical market and sector development (RC: high)
The worldwide semiconductor market is highly cyclical. Therefore, we face risks with
respect to rapid market change in our target markets. As a result, our own forecasts of
future business developments are subject to a high degree of uncertainty. In the past,
the cyclical pattern was regularly repeated, at the end of which Infineon was able to partici-
pate in the upturn after a period of market weakness. It is, however, possible that future
market downturns will follow another pattern, for example an L shape. In the event that
we are unprepared for market fluctuations, or our response to such fluctuations turns out
to be inappropriate, this could have a sustained materially adverse impact on Infineon’s
operations, financial condition, cash flows and earnings.
Increased market competition and commoditization of products (RC: high)
The rapid pace of technological change in the market also results in the greater inter-
changeability of products. This can result in aggressive pricing tactics on the market that
sometimes mean that our long-term strategic targets with respect to market share gains
and maintenance, product pricing and/or profitability cannot be achieved. This situation
could have a materially adverse impact on Infineon’s revenues and earnings.
Operational risks
Product quality trends (RC: high)
Product quality assurance is a key success factor for the business. Potential quality risks –
for example due to high capacity utilization levels – can affect yield fluctuations and hence
our ability to deliver. The smallest shortfalls in product quality can lead to product recalls
and potential costs related to liability claims. In addition, quality risks could also damage
Infineon’s reputation and thus have a negative impact on future revenues and earnings.
Increasingly dynamic markets (RC: medium)
The accelerating pace of events in the markets in which we operate and increased demands
for flexibility by our customers, coupled with short-term changes in order volumes, could
result in rising costs as a consequence of under-utilization of production capacities, higher
inventory levels and unfulfilled supplier contracts.
Thus, despite the fact that production processes and sites have become even more flexible,
fluctuations in capacity utilization levels and purchase commitments, coupled with idle
costs at production sites, nevertheless pose cost risks.
This situation is exacerbated by the fact that our products are highly dependent on the
degree of success enjoyed by individual customers in their own markets. Furthermore,
there is a risk of losing future business and design wins if we are unable to deliver volumes
over and above our contractual obligations if called upon by the customer to do so. We
therefore face the challenge, in the case of unexpectedly high demand, of having to deliver
increased volumes that require an appropriate level of upfront investment. All these factors
could have an adverse impact on our revenues, earnings and cash flows.
Product development delays (RC: medium)
The ever-increasing complexity of technologies and products, shorter development cycles
and greater customer expectations can cause a great deal of tension in the field of product
development. Buffer times built into processes to compensate for potential delays are reduced
accordingly. In the event of being unable to execute our development plans at the desired
quality levels, the outcome could be development delays and increased development costs
which could have an adverse impact on our financial condition, cash flows, and earnings.
Data and IT systems security (RC: medium)
The reliability and security of Infineon’s information technology systems is of crucial impor-
tance. At the same time, the world has seen a general rise in the level of threats to data
security. This applies in increasing levels both for the application of IT systems to support
business processes on the one hand, and internal and external communications on the
other hand. Despite the array of precautionary measures put in place, any major disruption
144 INFINEON TECHNOLOGIES ANNUAL REPORT 2013
GROUP MANAGEMENT REPORT – OUR 2013 FISCAL YEAR

to these systems could result in risks relating to the confidentiality, availability and reli-
ability of data and systems used in development, production, selling or administration
functions, which, in turn, could have an adverse impact on our reputation, competitiveness
and operations.
Potential virus attacks, in particular on IT systems used in production processes, present
additional risks that could result in loss of production or supply bottlenecks.
Production cost trends – raw material prices, cost of materials
and process costs (RC: medium)
Our medium- and long-term forecasts are based upon expected production cost trends.
In this context, planned measures to optimize production costs for raw materials and
supplies, energy, labor and automation, as well as for bought-in services from external
business partners may not be feasible to the extent envisaged.
Moreover, our dependence on various raw materials (such as gold and copper) used in
production and our energy requirements expose us to substantial price risks. We are also
dependent on supplies of rare earths required for selected production processes. At the
time of writing, financial instruments are in place to hedge our price risk exposure to gold
wire during the 2014 fiscal year, based on planned volume requirements. The prices of raw
materials and energy have recently been subject to significant fluctuation, and there is
no reason to assume the situation will change in the near future. If we are unable to offset
cost rises or to pass them on to customers, it could have an adverse impact on earnings.
Determining and adjusting production volumes (RC: medium)
Frontend and backend production need to be optimally synchronized to enable Infineon
to develop competitive and high-quality products designed to provide customized tech-
nological solutions. In view of the rapid pace of technological change and increasingly
stringent customer requirements, coordination processes have to become increasingly
sophisticated. Failure in continuing to make progress in this area could result in quality
problems, product development or market maturity delays as well as higher R&D expenses
and hence adversely impact revenue and earnings performance.
One risk that semiconductor companies operating in-house production facilities typically
face is that of delays in the ramping-up of production volumes at new production sites,
coupled with the required transfer of technology. One good example of this arises in the
Automotive segment, where customers’ product approval and testing processes can take
place over an extended period of time, thus influencing our global production strategy as
well as short- and medium-term capacity utilization. Failure to anticipate necessary pro-
duction changes in good time could result in capacity shortages and hence lower revenue
on the one hand and costs caused by under-utilization on the other.
Dependence on individual production sites (RC: medium)
Our South East Asian manufacturing sites are of critical importance for our production.
If, for example, political upheavals or natural disasters in the region were to impede our
ability to manufacture at these sites on the planned scale or to export products manufac-
tured at those sites, it would have a negative impact on our financial condition, cash flows,
and earnings. Our current production capacities in this region are to a large extent not
insured against political risks such as expropriation of assets. The transfer of manufacturing
capacities from these sites would therefore not only involve a great deal of time and tech-
nical effort, but Infineon would also be required to bear the necessary cost of investment.
145INFINEON TECHNOLOGIES ANNUAL REPORT 2013
REPORT ON EXPECTED DEVELOPMENTS, TOGETHER WITH ASSOCIATED MATERIAL RISKS AND OPPORTUNITIES
RISK AND OPPORTUNITY REPORT

Dependence on individual suppliers (RC: medium)
We cooperate with a number of different suppliers who provide us with materials and ser-
vices, or who take over parts of our supply chain. We do not always have alternative sources
for some of these suppliers and therefore depend on their ability to deliver products of
the required quality. Failure of one or more of these suppliers to meet their obligations to
Infineon could have an adverse impact on our revenue and earnings performance.
Need for qualified staff (RC: medium)
One of our key success factors is the availability of the required number of qualified
employees at all times. There is, however, a general risk of losing qualified staff or not
being able to recruit, train and retain sufficiently qualified staff within the business.
A lack of technical or management staff could, among other things, restrict future growth
and hence adversely impact our earnings performance.
Financial risks
Risk of default by banking partners (RC: medium)
The relatively high level of our liquid financial assets exposes us to the potential risk of a
default by one of our banking partners. We counter this risk – which could still arise despite
various state-insured deposit protection mechanisms – by a combination of risk avoidance
analyses and risk spreading measures. If these measures were to be ineffective, there could
be a materially adverse impact on Infineon’s financial condition and cash flows.
Currency risks (RC: medium)
Our involvement and participation in various regional markets around the world creates
cash flows in a number of currencies other than the euro – primarily in US dollars. A signifi-
cant share of revenue on the one hand and operating costs and investments on the other is
denominated in US dollars and correlated currencies. For the most part, Infineon generates
a US dollar surplus from these transactions.
Specified currencies are hedged group-wide by means of derivative financial instruments.
Depending on how exchange rates develop, these hedging contracts could have a signifi-
cant influence on cash flows. In these circumstances, exchange rate fluctuations could
also have an impact on earnings.
Further information regarding the management of financial risks is provided in note 37 to
the Consolidated Financial Statements.
Legal and compliance risks
Qimonda insolvency (RC: high)
Due to the insolvency proceedings relating to Qimonda and claims brought against Infineon,
we are exposed to a substantial amount of potential liabilities, which are described in
detail in note 38 to the Consolidated Financial Statements.
As of September 30, 2013 we recorded provisions in connection with these matters. The
provisions reflect the amount of those liabilities that management believes are probable
and can be estimated with reasonable accuracy at that time. There can be no assurance
that such provisions recorded will be sufficient to cover all liabilities that may ultimately be
incurred in relation to these matters.
Intellectual property rights and patents (RC: medium)
As with many other companies in the semiconductor industry, claims are made against us
from time to time that we have infringed other parties’ protected rights. Regardless of the
prospects of the success of such claims, substantial legal defense costs can arise.
P See page 256
P See page 259
146 INFINEON TECHNOLOGIES ANNUAL REPORT 2013
GROUP MANAGEMENT REPORT – OUR 2013 FISCAL YEAR

Whilst we often benefit from cross-licensing arrangements with major competitors and are
keen to broaden the protection offered in this area by entering into new agreements, no
such opportunities exist to safeguard against risks of this nature in the case of companies
specializing in the exploitation of patent rights.
We cannot rule out that patent infringement claims will stand in court, thus resulting
in significant claims for damages or restrictions in selling the products concerned.
Any such outcome could in turn have an adverse impact on our earnings performance.
Further information is provided in note 38 to the Consolidated Financial Statements.
Impact of our global operations (RC: medium)
Our global business strategy envisages that we maintain R&D locations and manufacturing
sites across the globe. The location of such facilities is determined by market entry hurdles,
technology and cost factors. Risks could therefore arise based upon adverse economic
and geo-political developments in our regional markets, changes in legislation and policies
affecting trade and investment aimed at limiting free trade and varying practices of the
regulatory, tax, judicial and administrative bodies in the jurisdictions where we operate.
These risks could restrict our business activities in those countries. We could also be
exposed to fines, sanctions and damage to reputation.
Asian markets are particularly important to our long-term growth strategy. Our operations
in China are impacted by the fact that the legal system there is still going through a phase
of development and change. One example of this is the fact that local regulations could
make it mandatory to enter into partnerships with local companies. These circumstances
could lead to Infineon’s intellectual property no longer being sufficiently protected and that
intellectual property developed in China could not be freely transferred to other countries
and locations, thus impairing revenue and profitability.
Acquisitions and cooperation arrangements (RC: medium)
In order to develop or expand our business, we may seek to acquire other businesses or
enter into various forms of cooperation arrangements. In the case of acquisitions, there is
a risk that these activities prove to be unsuccessful, particularly regarding the integration
of people and products in existing business structures. These issues could adversely
impact our financial condition and earnings performance.
In the case of smaller acquisitions or portfolio decisions, there is always a risk of non-com-
pliance with anti-trust regulations due to lack of knowledge or failure to make the people
involved in such deals adequately aware of the issues. This can result in high levels of cost
for work performed in-house (e.g. time spent by management) and/or by external service
providers (e.g. attorneys) and in settling fines. Infineon’s reputation may also suffer damage
under these circumstances.
Tax, fair trade and capital market regulations can all entail additional risks. In order to
mitigate these risks we rely upon the advice of both in-house and external experts.
Measures to implement our risk management strategy
At a strategic risk level, we endeavor to mitigate the typical risks that arise in the semicon-
ductor sector from economic and demand fluctuations and the risks related to Infineon’s
operations, financial condition and earnings by closely monitoring changes in early warn-
ing indicators and by developing specific response strategies appropriate to the current
position within the economic cycle. This can be done, for instance, by systematically
adjusting capacities and inventory levels at an early stage, initiating cost saving measures
and making flexible use of external production capacities.
P See page 259
147INFINEON TECHNOLOGIES ANNUAL REPORT 2013
REPORT ON EXPECTED DEVELOPMENTS, TOGETHER WITH ASSOCIATED MATERIAL RISKS AND OPPORTUNITIES
RISK AND OPPORTUNITY REPORT

At an operational level, we have adopted various quality management strategies aimed at
avoiding quality risks (such as “Zero Defect” and “Six Sigma”), to prevent or solve problems
and to improve all of our business processes. Our company-wide quality management
system has been certified on a worldwide basis in accordance with ISO 9001 and ISO/TS
16949 for a number of years and encompasses supplier development as well. Our pro-
cesses and initiatives to improve quality incorporate procedures to identify and eliminate
any quality-related problems at an early stage.
For our often customer-specific projects, a structured project management system, among
other things, is in place to handle development projects. Clear project milestones and
verification procedures required to be carried out during a project as well as clearly defined
limits of authority help us identify potential project risks at an early stage and counter
these risks with specific measures.
We seek to minimize procurement-related risks through appropriate purchasing strategies
and techniques, including constant product and cost analysis (“Best Cost Country Sourc-
ing” and “Focus-on-Value”). These programs consist of cross-functional expert teams
responsible for the standardization of purchasing processes with respect to material and
technical equipment.
In response to the general increase in threats to data security and the high degree of
professionalism applied these days in the area of cybercrime, we have initiated a data
security program to provide the greatest possible protection against hacking attacks and
related risks to our IT systems, networks, products, solutions and services. After measures
have been defined, they are implemented successively.
In view of past and likely future energy price rises, we are pro-actively reviewing the issue
of energy efficiency and climate change, particularly with our energy-intensive frontend
production in mind. Regulations and requirements pertaining to greenhouse gas emissions
are becoming more and more stringent across the world. In future companies will even be
required by law to disclose and to report regularly on greenhouse gas emissions. Infineon
keeps abreast of planned legislative changes and participates in various associations on
this matter. More detailed information is also provided under “Climate protection – green-
house gases” in the chapter “Sustainability at Infineon” in the Group Management Report.
We minimize legal risks relating to intellectual property rights and patents by pursuing
a well-defined patent strategy, including thorough patent research, targeted development
and registration of own patents as well as precautionary protective measures in the form
of agreements with major competitors. We aim to increase the number and scope of such
cross-license agreements with leading competitors in order to reduce patent-related risks.
However, no such opportunities exist to safeguard against risks of this nature in the case
of companies specializing in exploiting patent rights.
We have established a group-wide compliance management system, the objective of which
is to manage compliance-related risks on a systematic, comprehensive and sustainable
basis. Under this system, major preventive procedures are further developed, other ele-
ments of the system revamped or strengthened and appropriate responses worked out for
possible or actual incidences of non-compliance with internal or external regulations.
Insurance policies have been taken out as protection against potential claims and liability
risks in order to avoid or minimize any adverse impact on our financial condition and
earnings performance.
P See page 87
148 INFINEON TECHNOLOGIES ANNUAL REPORT 2013
GROUP MANAGEMENT REPORT – OUR 2013 FISCAL YEAR

Overall statement by Group Management on risk situation
The overall risk assessment is based on a consolidated view of all significant individual
risks. At the date of this report we are not aware of any substantial risks which jeopardize
Infineon’s going-concern status.
Opportunities
Our principal opportunities are described in the following section. The list is not exhaustive
and represents only a cross-section of opportunities available. Our assessment of these
opportunities is subject to continuous change, reflecting the fact that our business, our
markets and the technologies we use are continuously subject to new developments,
bringing with them new opportunities, causing others to become less relevant or otherwise
changing the significance of an opportunity for us. Depending on the potential degree of
impact and the estimated probability of occurrence, each of these opportunities is classified
to an “opportunities class” in the same way that risks are allocated to a risk class. This
classification is shown in parentheses (e.g. “OC: medium”).
Support for change in energy policies and consideration of climate change issues
(OC: medium)
The shortage of fossil fuels and greater awareness of environmental issues are changing
people’s assessment of the importance of renewable sources of energy. Rising emissions
represent a threat to the environment and have become one of the foremost priority topics
on the global political and economic agenda.
One third of energy consumed worldwide is for electric power – with the trend rising. The
best way to save electric power in the future will be through energy efficiency. Electric power
can be optimally used with the aid of intelligent semiconductor technology: innovative
chip solutions help to reduce the amount of power consumed by cars, industrial plants,
consumer electronics and home appliances.
Ability to supply due to available capacities (OC: medium)
Our own in-house frontend and backend capacities, the availability of external production
capacities and the options available to expand production capacities at our sites in Dresden
(Germany) and Kulim (Malaysia) puts us in a flexible position to cover required production
volumes. The availability of additional capacities, combined with the pro-active strategic
and operational planning of internal and external resources, enables us to cover rising
demand from existing and new customers in the event of a market upturn. This, in turn,
could have a positive impact on Infineon’s future market share and earnings performance.
Market access and activities in China (OC: medium)
Our activities in China – considered by us to be a highly significant market for the future –
are currently on a scale that still leaves potential for expansion. This relates to the
following markets:
Vehicle production in China is still expanding at the fastest growth rate in the world.
China is also pressing ahead with expansion of its high-speed railway infrastructure and is,
meanwhile, one of the world’s largest markets for rail vehicles.
New wind turbines are being built with increasingly powerful generators, resulting in greater
semiconductor content per turbine.
Our starting position with photovoltaic systems in China is a highly promising one: We
collaborate with several leading Chinese inverter manufacturers and, this year in particular,
have expanded the scope of collaboration with the Chinese market leader. We also have
a strong presence in China in the field of solar energy systems. This market has, in the
meantime, become the single most important market in the world.
If we succeed in positioning ourselves in China as part of Chinese industry (and hence
Chinese society), that could open up a multitude of new opportunities that would have
a positive impact on our business.
149INFINEON TECHNOLOGIES ANNUAL REPORT 2013
REPORT ON EXPECTED DEVELOPMENTS, TOGETHER WITH ASSOCIATED MATERIAL RISKS AND OPPORTUNITIES
RISK AND OPPORTUNITY REPORT

Increased demand for automotive semiconductors (OC: medium)
We expect the semiconductor value per vehicle to increase further. The primary driving
force for this expected trend is the rising demand for active safety features and for driver
assistance systems.
We are also convinced that the currently valid CO₂ targets cannot be achieved without
further electrification. In this context, electrification not only relates to hybrid and electric
drives, but also to items such as electric power steering and electric power brakes.
IT security within the vehicle is also gaining in significance. Thanks to our expertise in
the field of security controllers, Infineon is extremely well positioned for opportunities
in this area.
Growth from mobile applications (OC: medium)
The ongoing trend towards mobility is also reflected in the boom in sales of smartphones
and tablets. We are benefitting from this trend in two ways: firstly, through the components
we supply for mobile devices (silicon-MEMS microphones, TVS diodes, GPS amplifiers,
CMOS-RF switches), and secondly, through power semiconductors, which form the key
components for energy-efficient chargers (high-voltage and low-voltage power transistors,
driver ICs and control ICs).
Security applications (OC: medium)
The trend towards electronic identity documents is having a positive impact on Chip Card
& Security segment revenue. Paper-based documents are increasingly being replaced by
chip-based documents thanks to the security offered by the latter. The story is similar with
credit cards: chip-based credit cards are replacing magnetic stripe cards. The migration
to chip-based passports, electronic identity documents and credit cards will continue over
the coming years and will take place in various regions.
New technologies and materials (OC: medium)
We are constantly striving to develop new technologies, products and solutions and to im-
prove existing ones, both on our own and in collaboration with our customers. We therefore
continue to invest in R&D activities relating to the use of new technologies and materials.
It is possible that technologies and materials in current use lose their predominance in the
foreseeable future, such as silicon, which could reach its physical limit in some areas of
application.
We therefore see numerous opportunities for using new materials such as those
asso ciated with gallium nitride or silicon carbide, to develop new and more powerful
lower-cost products.
Liquidity position (OC: medium)
Our current liquidity position, which we describe in chapter “Review of liquidity”, enables
us to obtain favorable refinancing conditions, despite the uncertainty currently prevailing
on the capital markets. This fact gives Infineon above-average financial headroom and
entrepreneurial flexibility to implement its business strategies and initiatives.
P See page 127
INFINEON TECHNOLOGIES ANNUAL REPORT 2013
GROUP MANAGEMENT REPORT – OUR 2013 FISCAL YEAR 150

TREASURY AND CAPITAL REQUIREMENTS
Structure and principles of Infineon’s treasury
Our principal objective for group-wide treasury activities at Infineon is to ensure financial
flexibility on the basis of a solid capital structure. It is of prime importance for all com-
panies in the semiconductor industry that sufficient cash funds are available to finance
operating activities and planned investments throughout all phases of the business cycle.
Furthermore, debt should only constitute a modest proportion of the financing mix. Based
on these principles, Infineon has defined the following three key objectives for capital
management:
> Gross cash position of between 30 and 40 percent of revenue
> Positive net cash position
> Gross debt at 2 x EBITDA at most (earnings from continuing operations before interest
and tax plus scheduled depreciation and amortization)
We are not subject to any statutory or legal capital requirements, nor are any defined in
the Articles of Association.
Treasury principles and responsibilities
Group-wide treasury principles are in place regarding all issues relating to liquidity and
financing, such as banking policies and strategies, execution of financing agreements,
liquidity and investment management worldwide, currency and interest rate risk manage-
ment and the handling of external and intragroup cash flows. Treasury principles, which
apply throughout Infineon, are set out in the corresponding “Treasury Policy” and are
regularly reviewed and updated. Three levels of responsibility play a key role for treasury
principles:
> The CFO is responsible for setting treasury principles and after consultation with the
CEO, for approving the treasury policy. The Treasury Committee, consisting of the CFO
and selected members of senior management, decides on treasury-related matters,
including exchange rates for planning purposes and currency hedging strategies, and
issues the appropriate guidelines to ensure that these strategies are implemented.
> The Group Finance and Treasury department is responsible for specific corporate
treasury transactions and for ensuring that Infineon’s treasury principles are imple-
mented worldwide.
> At subsidiary company level, responsibility for treasury matters lies with local commercial
managing directors and heads of finance, or, in the case of larger entities, with dedicated
treasurers. Controlling functions at Group level ensure that transactions undertaken by
individual business entities are in line with treasury principles.
151INFINEON TECHNOLOGIES ANNUAL REPORT 2013
TREASURY AND CAPITAL REQUIREMENTS

Corporate treasury function
Treasury at Infineon is based on a highly centralized approach in which the Group Finance
and Treasury department is responsible for all significant tasks and processes worldwide
relating to financing and treasury matters. Starting point is the creation of a multi-year
business plan with various scenarios for free cash flow. For the purposes of short-term
liquidity management at operational level, all consolidated subsidiaries are included in
a monthly rolling cash flow forecast. Simultaneously, a cash flow forecast is drawn up
using a bottom-up approach based on the operating segments’ forecasts. At the end of
each quarter, the two forecasts are compared by a “Working Capital Committee” and
checked for plausibility and possible deviations.
Cash pooling structures are in place for liquidity management purposes. To the extent per-
mitted by law and economically feasible, subsidiaries are required to transfer all surplus
cash to corporate bank accounts in order to ensure the best possible allocation of liquidity
within the Group and to cover financing requirements of other Group companies. In this
way we are able to minimize external financing requirements and maintain an optimal
capital structure with a correspondingly positive impact on financing costs. Settling intra-
group transactions via internal bank accounts set up in accordance with our in-house
banking approach, we are also able to reduce the volume of external banking transactions
and hence bank fees.
Liquidity accumulated at Group level is managed centrally by the Group Finance and Trea-
sury department and invested in accordance with asset management principles, based on
a conservative approach to investments, in which security takes precedence over rates
of return. The Group Finance and Treasury department is also responsible for the manage-
ment of currency and interest rate risks. These risks are determined on the basis of con-
solidated cash flow forecasts, since only cash flows not offset within the Group are hedged
externally (for further information see note 37 to the Consolidated Financial Statements).
Furthermore, to the extent permitted by law, all financing activities and credit lines world-
wide are arranged, structured and managed either directly or indirectly by the Group Finance
and Treasury department in accordance with stipulated treasury principles. Debt is normally
unsecured and based on customary market terms and conditions.
A crucial factor for the reliable implementation of treasury responsibilities is the use of
capable and financially sound financial institutions. The selection of partner banks world-
wide is based on the Finance and Treasury department’s banking principles. Infineon
maintains business relationships with various international and local commercial and
investment banks and avoids becoming dependent on individual banks. Partner banks
must demonstrate a high level of creditworthiness. Infineon assesses the creditworthiness
of banks using a methodology that calculates investment thresholds for individual banks
each day, based on current ratings (Standard & Poor’s, Moody’s or Fitch) and credit default
swap premiums. Any excess of stipulated thresholds must be reported and risk exposures
reduced. Infineon has spread its liquidity investments over more than ten banks. At Sep-
tember 30, 2013 no financial institution was responsible for more than 12 percent of
Infineon’s liquidity investments.
P See page 256
INFINEON TECHNOLOGIES ANNUAL REPORT 2013
GROUP MANAGEMENT REPORT – OUR 2013 FISCAL YEAR 152

Capital requirements for the 2014 fiscal year
We require capital for the 2014 fiscal year amongst others to:
> finance our operations,
> finance planned investments,
> make scheduled debt and interest payments,
> make payments for provisions and contingent liabilities as they fall due or arise and
> pay the proposed dividend.
Additionally, further amounts may be paid out for the repurchase of shares or convertible
bonds as part of the capital returns program approved by the Supervisory Board on
November 19, 2013. The program has a total volume of up to €300 million.
We expect to meet these requirements through:
> cash flows generated from operations and
> available cash funds and our cash reserves in the form of financial investments.
Financing our operations
Based on our forecast for the 2014 fiscal year, we anticipate being able to finance operating
activities out of cash flows provided by operating activities. Further information regarding
fixed contractual obligations as of September 30, 2013 (such as leasing arrangements,
fixed service and supply agreements for commodities, input materials, electricity, gas and
other similar items) is provided in note 39 to the Consolidated Financial Statements.
Investments
Semiconductor production is very capital-intensive. Infineon increased investment levels
significantly in the 2011 and 2012 fiscal years, after years of investing with restraint,
whereas investments were reduced in the 2013 fiscal year due to market developments.
Depending on the business situation, we are currently planning investments of approximately
€650 million for the 2014 fiscal year (see chapter “Report on expected developments,
together with associated material risks and opportunities”). Firm investment commitments
totaled €152 million at September 30, 2013.
Debt repayment and interest payments
As of September 30, 2013 Infineon’s debt totaled €303 million, of which an amount of
€134 million falls due for repayment in the 2014 fiscal year. Of this amount, €108 million
relate to the subordinated convertible bonds due in May 2014. Based on the current market
price of the Infineon share, however, it is to be expected that bondholders will exercise their
conversion rights. Payments connected with the convertible bonds will, in all likelihood,
only arise if Infineon repurchases a portion of these bonds before they become due as part
of the capital returns program approved by the Supervisory Board on November 19, 2013.
An additional cash requirement of €11 million arises for interest payments in the 2014
fiscal year.
P See page 265
P See page 131
153INFINEON TECHNOLOGIES ANNUAL REPORT 2013
TREASURY AND CAPITAL REQUIREMENTS

Proposed dividend
Infineon proposes to pay a dividend of €0.12 per share for the 2013 fiscal year. Subject
to shareholder approval, this would result in a distribution of approximately €129 million
(for the previous fiscal year: €129 million). For further information, see note 30 to the
Consolidated Financial Statements.
Provisions and contingent liabilities
Infineon issues guarantees in the normal course of business, primarily for the payment
of import duties, the rental of buildings and contingent obligations related to government
grants received. As of September 30, 2013, the undiscounted amount of potential future
payments for guarantees was €111 million, of which up to a maximum of €10 million could
have a cash flow impact in the 2014 fiscal year.
In addition, provisions and contingent liabilities exist for various risks – particularly risks
related to Qimonda’s insolvency – which are described in detail in note 38 to the Con-
solidated Financial Statements, and which could result in a further cash outflow if the risks
materialize.
Coverage of capital requirements
Our gross cash position as of September 30, 2013 amounted to €2,286 million. We also
have access to various stand-alone short- and long-term credit facilities from various
financial institutions totaling €89 million.
Free cash flow from continuing operations for the 2014 fiscal year is likely to be at or exceed
the previous year’s level, since net cash provided by operations is expected to exceed
planned investments.
We have also applied for government grants in connection with specified investment
projects. There is no assurance, however, that these funds will be approved, either on time
or at all. Further information regarding grants received is provided in note 6 to the Consoli-
dated Financial Statements.
Taking into account the financial resources available to Infineon – including internal
liquidity on hand, net cash that can be generated and available credit facilities – we are
confident that we will be able to cover our planned capital requirements for the 2014 fiscal
year. Currently Infineon is not planning any significant financing measures in the coming
2014 fiscal year and has therefore not taken steps to obtain an official rating from any of
the leading rating agencies.
Derivative financial instruments
Infineon employs derivative financial instruments such as interest rate swap arrangements,
forward currency contracts and option contracts. The purpose of these transactions is to
reduce the impact of interest rate and exchange rate fluctuations on foreign-currency-
denominated net future cash flows. In addition, commodity swaps are employed to reduce
the purchase price risk on anticipated purchases of gold. Derivative financial instruments
are not used for trading or speculative purposes. Further information about derivative
financial instruments and the management of financial risks is provided in notes 36 and
37 to the Consolidated Financial Statements.
P See page 240
P See page 259
P See page 222
P See page 252 and 256
INFINEON TECHNOLOGIES ANNUAL REPORT 2013
GROUP MANAGEMENT REPORT – OUR 2013 FISCAL YEAR 154

OVERALL STATEMENT OF THE MANAGEMENT BOARD WITH RESPECT TO INFINEON’S FINANCIAL CONDITION AS OF THE DATE OF THIS REPORT
Despite a difficult market environment with subdued global economic growth and weak
demand for capital goods, Infineon succeeded in maintaining revenue at practically the
same level and remained solidly profitable. Group revenue in the first half of the 2013
fiscal year was 8 percent lower than in the same period one year earlier. Given the high
level of fixed costs in the semiconductor sector, a deterioration of earnings could not be
avoided. Earnings were also negatively impacted by higher amortization and depreciation
attributable to significant investments made in previous years. It was imperative to reduce
costs at the beginning of the 2013 fiscal year. Thanks to the decisive measures taken,
despite the decline in revenue we achieved a Segment Result Margin of 6.3 percent in the
first half of the year. Demand gathered momentum in the second half of the fiscal year and
in the fourth quarter we recorded revenue of €1,053 million, approximately 24 percent up
on the first quarter’s figure of €851 million. Our ability to cope with this increase in opera-
tional terms shows that we were well prepared and capable of making a quick turnaround.
Our focus on business with good margins in recent years, our ability to achieve rapid and
thorough cost adjustments when the market weakens and ramp up production volumes
at short notice when markets begin to gain momentum helped us remain solidly profitable
in every quarter of the 2013 fiscal year. Over the fiscal year as a whole, we achieved a Seg-
ment Result Margin of 9.8 percent, free cash flow of €235 million and a return on capital
employed of 14.1 percent.
Our product portfolio in its current structure as well as our operational flexibility are helping
us lay the groundwork for the profitability of tomorrow, when the shift from a product to
a system focus, combined with the use of our 300-millimeter technology, will ensure both
sustainable growth and higher margins. Our continued aim is to achieve a Segment Result
Margin of 15 percent through the cycle.
The 2013 fiscal year was a challenging one for Infineon, but nevertheless a successful one.
Infineon asserted its strong competitive position on the markets it addresses. Coupled
with our very solid balance sheet structure – as of September 30, 2013 we report a gross
cash position of €2.3 billion and an equity ratio of 64 percent – we consider ourselves well
positioned for the future. Over the previous fiscal year we have proved that we can adjust
quickly and flexibly to new market circumstances. The overriding objective throughout is to
add value for shareholders by securing long-term, sustainable success for Infineon.
Application of accounting options and discretionary planning opportunities
The description and assessment of Infineon’s performance, financial condition and results
of operations as presented in the Group Management Report are dependent on the under-
lying recognition and measurement methods applied and the assumptions and estimates
used. These are described in detail in notes 2 and 3 to the Consolidated Financial State-
ments and are, in all material respects, unchanged from the previous year.
Off-balance-sheet financing arrangements such as the sale of receivables, sale-and-lease-
back transactions or non-consolidated special-purpose entities were not undertaken
during the 2013 and 2012 fiscal years.
P See page 204 and 219
155INFINEON TECHNOLOGIES ANNUAL REPORT 2013
OVERALL STATEMENT OF THE MANAGEMENT BOARD WITH RESPECT TO INFINEON’S FINANCIAL CONDITION AS OF THE DATE OF THIS REPORT

INFINEON TECHNOLOGIES AG
Infi neon Technologies AG is the parent company of the Infineon Group and performs the
Group’s management and corporate functions. It takes on major group-wide responsibil-
ities such as Finance and Accounting, Human Resources, strategic and product-oriented
R&D activities and also worldwide Corporate and Marketing Communication. Furthermore,
it manages logistical processes throughout the Group. Infineon Technologies AG has its
own production facilities, located in Regensburg and Warstein (both Germany). Since most
of the transactions within the Infineon Group involving derivative financial instruments
are handled by Infineon Technologies AG, the same terms and conditions for derivative
financial instruments and covered risks are valid both for Infineon Technologies AG and for
the Infineon Group.
To a large extent, the risks and opportunities as well as the future developments of
Infineon Technologies AG are identical to those defined for the Infineon Group, as further
described in the chapter “Report on expected developments, together with associated
material risks and opportunities”.
Infineon Technologies AG prepares its individual financial statements in accordance
with the requirements of the German Commercial Code (“HGB”). The complete financial
statements are published separately.
Statement of operations ¹ (condensed)
€ in millions 2013 2012
Revenue 4,070 4,070
Cost of goods sold (3,260) (3,197)
Gross profit 810 873
Operating expenses (797) (735)
Result from investments, net 433 458
Other income (expense), net (12) (57)
Income before taxes 434 539
Income tax (15) (4)
Net income 419 535
Cancellation of own shares according to section 237 paragraph 3 number 2 AktG – (14)
Transfers to retained earnings according to section 58 paragraph 2 and 2a AktG (289) (391)
Income from capital reduction according to section 240 sentence 1 AktG – 14
Transfer to additional paid in capital according to section 237 paragraph 5 AktG – (14)
Unappropriated profit at the end of year 130 130
1 Prepared in accordance with the German Commercial Code (HGB).
Infineon Technologies AG reports a net income of €419 million for the 2013 fiscal year.
After transferring €289 million to retained earnings, the unappropriated profit amounted
to €130 million.
Infineon Technologies AG’s net income for the 2013 fiscal year was again positively impacted
by income from the reversal of an impairment previously recorded on its investment in
Infineon Technologies Holding B.V. The carrying amount of the investment was increased
by €289 million (2012: €342 million). Infineon Technologies AG’s revenue in the 2013
fiscal year was unchanged compared to the previous year, whereas costs of goods sold
were slightly higher (2 percent). As a consequence, gross profit fell by 7 percent.
P See page 131
INFINEON TECHNOLOGIES ANNUAL REPORT 2013
GROUP MANAGEMENT REPORT – OUR 2013 FISCAL YEAR 156

Statement of financial position ¹ (condensed)
€ in millions 2013 2012
Tangible and intangible fixed assets 463 464
Investments 3,175 2,888
Non-current assets 3,638 3,352
Inventories 294 280
Receivables and other assets 618 564
Cash and marketable securities 2,240 2,145
Current assets ² 3,152 2,989
Total assets 6,790 6,341
Shareholders’ equity 4,782 4,521
Provisions 1,024 1,012
Payables and other liabilities 984 808
Total liabilities and shareholders’ equity 6,790 6,341
1 Prepared in accordance with the German Commercial Code (HGB).
2 Includes deferred expense and the excess of plan assets over pension liability.
The principal factors influencing the Company’s financial condition are described below:
Within assets, cash and marketable securities increased slightly (€95 million) and the
carrying amount of investments rose as a result of the reversal of an impairment previously
recognized on the investment in Infineon Technologies Holding B.V. (€289 million). On the
equity and liabilities side, payables and other liabilities went up by €176 million and equity
by €261 million. The 2013 fiscal year net income of €419 million, the exercise of stock
options by employees and the pro rata costs for stock-based compensation recognized
directly in equity (in total €6 million), all have a positive impact on the increase in equity
(€261 million), while the payment of the dividend for the 2012 fiscal year (€129 million)
and the purchase of own shares (€35 million) reduced equity.
Provisions were increased mainly by additions to provisions in conjunction with the
insolvency of Qimonda AG and Qimonda Dresden GmbH & Co. OHG (€30 million), while
sundry other provisions decreased by €15 million.
The balance sheet line item “Payables and other liabilities” went up by €176 million
during the fiscal year under report, mainly owing to a €167 million increase in payables
to affiliated companies.
The equity ratio at the end of the reporting period was 70.4 percent (September 30, 2012:
71.3 percent).
Dividends
Under the German Stock Corporation Act (Aktiengesetz), the amount of dividends available
for distribution to shareholders is based on the level of unappropriated profit (Bilanzgewinn)
recorded by the ultimate parent, as determined in accordance with HGB.
Infineon Technologies AG reports unappropriated profit of €130 million in its financial
statements for the fiscal year ended September 30, 2013. A cash dividend of €0.12
per share for the 2013 fiscal year shall be proposed at the Annual General Meeting. The
proposed dividend is subject to approval by shareholders.
The Company paid a dividend of €0.12 per share for the 2012 fiscal year, resulting in a total
distribution of €129 million.
157INFINEON TECHNOLOGIES ANNUAL REPORT 2013
INFINEON TECHNOLOGIES AG

EVENTS AFTER THE END OF THE REPORTING PERIOD
Issue of performance shares
On October 1, 2013, 114,046 (virtual) Performance Shares were issued to the Management
Board and 1,326,718 to employees. The allocation of Performance Shares does not have
a material effect on the net assets, financial position and results of operations.
New capital returns program
The Company has resolved a new capital returns program and intends to make available up
to €300 million until September 30, 2015 for this purpose. The capital return makes use
of the authorization given at the Annual General Meeting on February 28, 2013, according
to which shares may be bought back either through the use of put options, or the direct
purchase of own shares through Xetra trading on the Frankfurt Stock Exchange. Furthermore
the Company may buy back an additional part of the outstanding convertible bond due
2014. The share buyback exclusively serves the purposes of cancelling shares to reduce the
company’s share capital, settling convertible bond obligations in shares as well as allotting
shares to employees, board members of affiliated companies and members of the Manage-
ment Board. Incidentally, it will be carried out in accordance with section 14, paragraph 2,
and section 20a, paragraph 3, of the German Securities Trading Act in connection with the
provisions of Commission Regulation (EC) No. 2273/2003 of December 22, 2003.
The capital returns program can be suspended and resumed at any time within the timeframe
defined in the resolution of the Annual General Meeting and taking into consideration
other legal requirements.
Further details including the current status of the capital returns program are regularly
published in the Internet under www.infineon.com/cms/en/corporate/investor/
@ www.infineon.com/cms/en/
corporate/investor/
158 INFINEON TECHNOLOGIES ANNUAL REPORT 2013
GROUP MANAGEMENT REPORT – OUR 2013 FISCAL YEAR

CORPORATE GOVERNANCE
INFORMATION PURSUANT TO SECTION 289, PARAGRAPH 4,
AND SECTION 315, PARAGRAPH 4,
OF THE GERMAN COMMERCIAL CODE (HGB)
Structure of the subscribed capital
The share capital of Infineon Technologies AG increased by €1,553,404 in the 2013 fiscal
year as the result of the exercise of 776,702 stock options. The Company’s share capital
stood at €2,162,166,068 as of September 30, 2013. This sum is divided into 1,081,083,034
non-par registered shares, each of which represents a notional portion of the share capital
of €2. Each share carries one vote and gives an equal right to the profit of the Company
based on the profit appropriation resolved by shareholders at the Annual General Meeting.
Own shares held by the Company on the date of the Annual General Meeting do not carry
a vote and are not entitled to participate in profit. At the end of the reporting period, the
Company held 6 million own shares (September 30, 2012: none).
Shares of Infineon Technologies AG are listed on the Frankfurt Stock Exchange (FSE) under
the symbol “IFX” and are also traded in the form of American Depositary Shares (“ADS”)
on the OTCQX International over-the-counter market under the ticker symbol “IFNNY”, with
each Infineon ADS representing one Infineon ordinary share.
Restrictions on voting rights or the transfer of shares
Restrictions on the voting rights of shares may, in particular, arise as the result of the
regulations of the German Stock Corporation Act (Aktiengesetz– “AktG”). Shareholders
are prohibited from voting under certain circumstances pursuant to section 136 AktG,
for example, and Infineon Technologies AG has no voting rights from its own shares
according to section 71b AktG. Non-compliance with the notification requirements pursuant
to section 21, paragraph 1 or 1a, of the German Securities Trading Act (Wertpapierhandels-
gesetz – “WpHG”) can, according to section 28 WpHG, have the effect that certain rights
– including the right to vote – may, temporarily at least, not exist. We are not aware of any
contractual restrictions on voting rights or the transfer of shares.
Pursuant to section 67, paragraph 2, AktG, only those persons recorded in the share register
of Infineon Technologies AG are recognized as shareholders of the Company. In order to
be recorded in the share register of Infineon Technologies AG, shareholders are required
to submit to the Company the number of shares held by them and their name or company
name, their address and, where applicable, their registered office and their date of birth.
Pursuant to section 67, paragraph 4, AktG, Infineon Technologies AG is entitled to request
information from any party registered in the share register regarding the extent to which
shares, to which the entry in the share register relates, are actually owned by the registered
party and, if it does not own the shares, to receive the information necessary for the main-
tenance of the share register in relation to the party for whom the party concerned holds
the shares. Section 67, paragraph 2, AktG stipulates that the shares concerned do not
confer voting rights until such time as the information requested has been supplied in the
appropriate manner.
Shareholdings exceeding 10 percent of the voting rights
Section 21, paragraph 1, WpHG requires each shareholder whose voting rights reach, exceed
or, after exceeding, fall below 3, 5, 10, 15, 20, 25, 30, 50 or 75 percent of the voting rights
of a listed corporation to notify such corporation and the German Federal Financial Super-
visory Authority (Bundesanstalt für Finanzdienstleistungsaufsicht – “BaFin”) immediately.
159INFINEON TECHNOLOGIES ANNUAL REPORT 2013
CORPORATE GOVERNANCE
INFORMATION PURSUANT TO SECTION 289, PARAGRAPH 4, AND SECTION 315, PARAGRAPH 4, OF THE GERMAN COMMERCIAL CODE (HGB)

As of September 30, 2013, we have not been notified of any direct or indirect shareholdings
reaching or exceeding 10 percent of the voting rights. The shareholdings notified to us as of
that date are presented in the Notes to the Financial Statements of Infineon Technologies AG
under the information pursuant to section 160, paragraph 1, No. 8 AktG.
Shares with special control rights
No shares conferring special control rights have been issued.
System of control over voting rights when employees’ own shares and
their control rights are not exercised directly
Employees who hold shares in Infineon Technologies AG exercise their control rights
directly in accordance with the applicable laws and the Articles of Association in the same
way as other shareholders.
Rules governing the appointment and dismissal of members of the Management Board
Section 5, paragraph 1, of the Articles of Association stipulates that the Management Board
of Infineon Technologies AG shall consist of at least two members. Following Peter Bauer’s
departure from office on September 30, 2012 and with effect from October 1, 2012, the
Management Board comprises three members. The Supervisory Board decides on the exact
number of members of the Management Board and on their appointment and dismissal in
accordance with section 5, paragraph 1, of the Articles of Association and section 84, para-
graph 1, AktG. As Infineon Technologies AG falls within the scope of the German Co-Deter-
mination Act (Mitbestimmungsgesetz – “MitbestG”), the appointment or dismissal of mem-
bers of the Management Board requires a two-thirds majority of the votes of the members
of the Supervisory Board (section 31, paragraph 2, MitbestG). If such a majority is not
achieved on the first ballot, the appointment may be approved on a recommendation of
the Mediation Committee on a second ballot by a simple majority of the votes of the mem-
bers of the Supervisory Board (section 31, paragraph 3, MitbestG). If the required majority
is still not achieved, a third ballot is held in which the Chairman of the Supervisory Board
has two votes (section 31, paragraph 4, MitbestG). If the Management Board does not
have the required number of members, in urgent cases, the local court (Amtsgericht) of
Munich makes the necessary appointment upon petition of a party concerned pursuant to
section 85, paragraph 1, AktG.
Pursuant to section 84, paragraph 1, sentence 1, AktG, the maximum term of appointment
for members of the Management Board is five years. Re-appointment or extension of the
term of office, in each case for a maximum of five years, is permitted (section 84, para-
graph 1, sentence 2, AktG). Section 5, paragraph 1, of the Articles of Association and sec-
tion 84, paragraph 2, AktG stipulate that the Supervisory Board may appoint a chairman
and a deputy chairman of the Management Board. The Supervisory Board may revoke the
appointment of a member of the Management Board and the Chairman of the Management
Board for good cause (section 84, paragraph 3, AktG).
Rules governing the amendment of the Articles of Association
Pursuant to section 179, paragraph 1, AktG, responsibility for amending the Articles of
Association rests with the Annual General Meeting. However section 10, paragraph 4, of the
Articles of Association gives the Supervisory Board the authority to amend the Articles of
Association insofar as such amendments relate merely to the wording, such as changes in
the share capital amount resulting from a capital increase out of conditional or authorized
capital or a capital decrease by means of cancellation of own shares. Unless the Articles
of Association provide for another majority, section 179, paragraph 2, AktG stipulates that
resolutions of the Annual General Meeting on the amendment of the Articles of Association
require a majority of at least three quarters of the share capital represented. Section 17,
paragraph 1, of the Articles of Association of Infineon Technologies AG provides in principle
for resolutions to be passed with a simple majority of the votes cast and, when a capital
majority is required, with a simple majority of the capital unless a higher majority is required
by law or in accordance with other stipulations contained in the Articles of Association.
160 INFINEON TECHNOLOGIES ANNUAL REPORT 2013
GROUP MANAGEMENT REPORT – OUR 2013 FISCAL YEAR

Powers of the Management Board to issue shares
Authorized Capital
Authorized Capital 2010/I
Section 4, paragraph 8, of the Articles of Association provides that the Management Board
is authorized, with the approval of the Supervisory Board, to increase the share capital
in the period through February 10, 2015 once or in partial amounts by a total of up to
€648,000,000 by issuing up to 324,000,000 new no par value registered shares, carrying
a dividend right as of the beginning of the fiscal year in which they are issued, against con-
tributions in cash or in kind (Authorized Capital 2010/I). Shareholders have subscription
rights in principle in the event of capital increases against contributions in cash. However
the Management Board is authorized, with the approval of the Supervisory Board, to
exclude the subscription rights of the shareholders
(a) in order to exclude fractional amounts from the subscription right,
(b) insofar as such action is necessary in order to grant holders of option or conversion
rights attached to options or convertible bonds that have already been or will in future
be issued by the Company or its subordinated group companies, subscription rights
to new shares to the extent to which they would be entitled after exercise of the option
or conversion rights or after fulfillment of any conversion obligations,
(c) if the issue price of the new shares is not substantially lower than the price on the
stock exchange and the shares issued with the subscription rights of the shareholders
excluded pursuant to section 186, paragraph 3, sentence 4, AktG, in aggregate do not
exceed 10 percent of the share capital either at the time of this authorization becoming
effective or at the time of its exercise.
The Management Board is additionally authorized, with the approval of the Supervisory
Board, to exclude the subscription rights of shareholders in relation to capital increases
against contributions in kind. However, in order to protect the shareholders against the
dilution of their holdings, the Management Board of Infineon Technologies AG has under-
taken to make use of this authorization to exclude the subscription rights of the share-
holders in the case of capital increases against contributions in cash or in kind out of the
Authorized Capital 2010/I only up to an amount equivalent to 10 percent of the share capital
at the time the authorization comes into force or – if the latter value should be lower – the
share capital existing at the time the authorization is exercised. Any capital increase utilizing
the Authorized Capital 2010/I with the subscription rights of the shareholders excluded is
thus currently limited to a maximum of 108,108,303 no par value shares or €216,216,606
at September 30, 2013 (that is to say 10 percent of the share capital in place at that time).
The Management Board determines the further content of the rights attached to the shares
and the terms of the share issue with the approval of the Supervisory Board.
Authorized Capital 2010/II
Section 4, paragraph 9, of the Articles of Association additionally authorizes the Manage-
ment Board, with the approval of the Supervisory Board, to increase the share capital in the
period through February 10, 2015, once or in partial amounts, by a total of up to €40,000,000
by issuing up to 20,000,000 new no par value registered shares against contributions in cash
for the purpose of issuance to employees of the Company or its group companies (Autho-
rized Capital 2010/II). The subscription rights of the shareholders are excluded in relation to
these shares. The Management Board determines the further content of the rights attached
to the shares and the terms of the share issue with the approval of the Supervisory Board.
The aforementioned authorizations of the Management Board to issue new shares out of
Authorized Capital 2010/I are intended to enable the Management Board to raise capital
flexibly and on economically advantageous terms, taking advantage of attractive financing
opportunities for Infineon, even at short notice, whenever they may arise in the market.
Accordingly, Authorized Capital 2010/II will be used to service share-based employee
participation programs.
No shares were issued during the 2013 fiscal year out of the various authorized capital
amounts described above.
161INFINEON TECHNOLOGIES ANNUAL REPORT 2013
CORPORATE GOVERNANCE
INFORMATION PURSUANT TO SECTION 289, PARAGRAPH 4, AND SECTION 315, PARAGRAPH 4, OF THE GERMAN COMMERCIAL CODE (HGB)

Conditional Capital
Conditional Capital I
Section 4, paragraph 4, of the Articles of Association provides for the share capital of
Infineon Technologies AG to be conditionally increased by up to a nominal amount of
€34,628,048 (Conditional Capital I, registered in the Commercial Register as “Condi-
tional Capital 1999/I”). The conditional capital increase is to be effected by issuing up to
17,314,024 new no par value registered shares, carrying a dividend right as of the begin-
ning of the fiscal year in which they are issued, but only to the extent that the holders
of subscription rights granted under the “Infineon Technologies AG 2001 International
Long Term Incentive Plan”, on the basis of the authorization granted on April 6, 2001,
choose to exercise their subscription rights.
Conditional Capital III
At the end of the 2013 fiscal year, section 4, paragraph 5, of the Articles of Association
provided for the share capital of Infineon Technologies AG to be conditionally increased
by up to a nominal amount of €27,879,006 (Conditional Capital III, registered in the
Commercial Register as “Conditional Capital 2001/I”). The conditional capital increase is
to be effected by issuing up to 13,939,503 new no par value registered shares, carrying
a dividend right as of the beginning of the fiscal year in which they are issued, but only
to the extent that the holders of subscription rights granted under the “Infineon Technolo-
gies AG 2001 International Long Term Incentive Plan”, on the basis of the authorization
issued on April 6, 2001, or the holders of subscription rights granted under the “Infineon
Technologies AG Stock Option Plan 2006”, on the basis of the authorization issued on
February 16, 2006, choose to exercise their subscription rights. During the 2013 fiscal
year, a total of 776,702 new non-par shares corresponding to a proportionate amount of
€2 per share were issued out of Conditional Capital III as a result of the exercise of share
options in conjunction with the “Infineon Technologies AG Stock Option Plan 2006”. Con-
ditional Capital III decreased accordingly by €1,553,404 to €26,325,602. The correspond-
ing change to the Articles of Association was submitted immediately after the end of the
reporting period and entered into the Commercial Register as requested.
Conditional Capital 2009/I
Section 4, paragraph 7, of the Articles of Association provides for the share capital of
Infineon Technologies AG to be conditionally increased by up to €149,900,000 by issuing
up to 74,950,000 new no par value registered shares carrying a dividend right as of the
beginning of the fiscal year in which they are issued (Conditional Capital 2009/I). The con-
ditional capital increase serves the purpose of granting shares to the holders of the con-
vertible bond issued in May 2009 by Infineon Technologies Holding B.V., which is guaran-
teed by Infineon Technologies AG. The conditional capital increase is affected only insofar
as conversion rights from the convertible bond are exercised or conversion obligations
under these notes are fulfilled and insofar that no cash settlement is made or own shares
are used to service the obligations.
Conditional Capital 2010/I
Section 4, paragraph 10, of the Articles of Association provides for the Company’s share
capital to be conditionally increased by up to a nominal amount of €24,000,000 by issuing
up to 12,000,000 new no par value registered shares (Conditional Capital 2010/I). The
conditional increase in capital is effected only insofar as the holders of subscription rights
issued in the period through September 30, 2013 under the “Infineon Technologies AG
Stock Option Plan 2010” choose to exercise their subscription rights to Company shares
and the Company does not provide a cash settlement or own shares to satisfy these sub-
scription rights. The new shares have dividend rights from the start of the fiscal year of
their issue.
162 INFINEON TECHNOLOGIES ANNUAL REPORT 2013
GROUP MANAGEMENT REPORT – OUR 2013 FISCAL YEAR

Conditional Capital 2010/II
Section 4, paragraph 11, of the Articles of Association provides for the share capital also
to be conditionally increased by up to €260,000,000 by issuing up to 130,000,000 new
no par value registered shares carrying a dividend right from the start of the fiscal year of
their issue (Conditional Capital 2010/II). The conditional capital increase serves the pur-
pose of granting shares to the holders of bonds with warrants and/or convertible bonds
issued by the Company or a subordinated group company against payment in cash on the
basis of the authorization of the Annual General Meeting of February 11, 2010. The condi-
tional capital increase is affected only insofar as option or conversion rights attached to
the bonds are exercised or conversion obligations under the bonds are fulfilled and insofar
that no cash settlement is made or own shares are used to service the obligations. The
Management Board is authorized to determine the further details of implementation of the
conditional capital increase.
The issue of stock options backed by conditional capital is a practical and common option
that has been used for many years in German companies in the compensation of board
members and executives. Infineon has also used this instrument on several occasions. To
the extent that Infineon will deploy other compensation components of a long-term nature,
the existing amounts of conditional capital are used – during the remaining term of the
option programs – to service subscription rights arising from share options already issued.
Other conditional capital amounts cover the conversion rights of holders of the convertible
bond issued by Infineon Technologies Holding B.V. To the extent that conditional capital
amounts are no longer required for this purpose (for instance where bonds have been
repurchased and invalidated), the Management Board and Supervisory Board will normally
propose at the Annual General Meeting to cancel the respective conditional capital amounts.
With the exception of Conditional Capital III (see relevant section), no shares were issued
during the 2013 fiscal year out of the conditional capital amounts described above. Further
details of the various stock option plans are described in note 32 to the Consolidated
Financial Statements. Further details of the convertible bond issued by Infineon Technolo-
gies Holding B.V. are provided in note 27 to the Consolidated Financial Statements.
Authorization to issue bonds with warrants and/or convertible bonds
The Annual General Meeting on February 11, 2010 authorized the Management Board,
in the period through February 10, 2015, once or in partial amounts, to issue bonds with
warrants and/or convertible bonds (referred to collectively as “bonds”) in an aggregate
nominal amount of up to €2,000,000,000, to guarantee such bonds issued by subordi-
nated group companies of the Company and to grant holders of bond options or conversion
rights to up to 130,000,000 no par value registered Company shares, representing a notional
portion of the share capital of up to €260,000,000, in accordance with the relevant terms
of the bonds. The Management Board is authorized, with the approval of the Supervisory
Board, to exclude the subscription rights of the shareholders to the bonds
> if the issue price is not substantially lower than the theoretical market value of the
bonds, as determined in accordance with accepted methods of financial mathematics;
however this only applies insofar as the shares to be issued to service the option and/
or conversion rights established on this basis in aggregate do not exceed 10 percent
of the share capital either at the time of this authorization becoming effective or at the
time of its exercise;
> in order to exclude fractional amounts resulting from a given subscription ratio from the
subscription rights of the shareholders to the bonds or insofar as such action is neces-
sary in order to grant holders of option or conversion rights from bonds that have already
been or will in future be issued by the Company or its subordinated group companies
subscription rights to that extent to which they would be entitled after exercise of their
rights or after fulfillment of any conversion obligations.
P See page 244
P See page 238
163INFINEON TECHNOLOGIES ANNUAL REPORT 2013
CORPORATE GOVERNANCE
INFORMATION PURSUANT TO SECTION 289, PARAGRAPH 4, AND SECTION 315, PARAGRAPH 4, OF THE GERMAN COMMERCIAL CODE (HGB)

Even if the dilution protection regulations are applied, the option or conversion price must
equal at least 90 percent of the average stock exchange price of the Company’s shares
in the Xetra closing auction on the Frankfurt Stock Exchange (or a comparable successor
system) during the ten exchange trading days prior to the date of adoption of the resolu-
tion by the Management Board to issue the bonds or, insofar as the shareholders have
subscription rights for the bonds, during the days on which subscription rights for the
bonds are traded on the Frankfurt Stock Exchange, but excluding the last two exchange
trading days for such subscription rights. Without prejudice to section 9, paragraph 1, AktG,
the option or conversion price may be reduced pursuant to a dilution protection clause
in accordance with the terms of the bonds if the Company increases its share capital
before the end of the option or conversion period, honoring the subscription rights of the
shareholders, or issues or guarantees further bonds and the holders of option rights or of
convertible bonds are not granted subscription rights in this regard. The terms may also
provide for a value-preserving adjustment of the option or conversion price or of the option
or conversion rate in the event of other measures potentially leading to a dilution of the
commercial value of the option or conversion rights. In any event, the notional portion
of the share capital attributable to the shares underlying each convertible bond may not
exceed the nominal value of the bond.
The Management Board is authorized, subject to the requirements resolved by the Annual
General Meeting, to determine the further details of the issue and features of the bonds
and their terms.
The aforementioned authorizations of the Management Board to issue bonds with warrants
or convertible bonds are intended to enable the Management Board to raise capital flexibly
and on economically advantageous terms to cover capital requirements as they arise,
taking advantage of attractive financing opportunities, even at short notice, whenever they
present themselves in the market.
Purchase of own shares
A resolution passed by the Annual General Meeting on February 28, 2013 authorizes
Infineon Technologies AG, in the period through February 27, 2018, to acquire its own
shares, within the statutory boundaries, in an aggregate amount not exceeding 10 percent
of the share capital at the time the resolution was passed or – if the latter amount is lower
– of the share capital in existence at the time the authorization is exercised. The Company
may not use the authorization for the purpose of trading in its own shares. The Company
may exercise the authorization once or a number of times for one or a number of purposes.
The authorization may also be used by dependent companies or companies in which the
Company has a majority holding or by third parties acting for the Company or for dependent
companies or companies in which the Company has a majority holding. The Management
Board decides whether own shares are acquired through the stock exchange, by means
of a public offer to purchase addressed to all shareholders or a public invitation to submit
offers for sale (referred to jointly as a “public purchase offer”) or via a bank or other entity
that meets the requirements of section 186, paragraph 5, sentence 1 AktG (referred to jointly
as “bank”) that is engaged to complete the acquisition as part of a defined repurchase
program.
(a) If shares are acquired through the stock exchange, the purchase price per share
(excluding incidental costs) paid by the Company may not be more than 10 percent
above or below the price established in the Xetra (or comparable successor system)
opening auction on the trading day.
164 INFINEON TECHNOLOGIES ANNUAL REPORT 2013
GROUP MANAGEMENT REPORT – OUR 2013 FISCAL YEAR

(b) If shares are acquired by means of a public purchase offer, a fixed purchase price or
purchase price range may be specified. The purchase price per share (excluding inci-
dental costs) paid by the Company in this case may be no more than 10 percent above
and no more than 20 percent below the arithmetic mean of the closing prices of the
share in Xetra trading (or a comparable successor system) on the last three exchange
trading days prior to the day of publication of the public purchase offer (“effective date”).
If significant price changes occur after the effective date, the purchase price may be
adjusted accordingly; in this case, the relevant time frame is the three exchange trading
days prior to the public announcement of any such adjustment. The volume of the pur-
chase may be limited. If the total subscription for the public purchase offer exceeds
this volume, the Company will adopt a quota-based purchase approach. Provision may
be made for a preferred acceptance of smaller quantities (up to 100 offered shares per
shareholder). The public purchase offer may also provide for further terms and condi-
tions.
(c) A bank can be engaged as part of a defined repurchase program to acquire either an
agreed number of shares or shares for a previously defined total purchase price, on
a previously defined minimum number of trading days in Xetra trading (or a comparable
successor system) and in any case by no later than the end of a previously agreed
period, and to transfer them to the Company. In such cases, (i) the bank must acquire
the shares through the stock exchange and (ii) the purchase price per share to be paid
by the bank (excluding incidental costs) must not be more than 10 percent above or
below the price established in the Xetra (or comparable successor system) opening
auction on the trading day and (iii) the purchase price per share to be paid by the Com-
pany must include a discount with respect to the arithmetic mean of the volume-weighted
average price (“VWAP”) of the Infineon share in Xetra trading (or a comparable succes-
sor system) over the actual period in which shares are repurchased. Notwithstanding
the above stipulations and subject to any further instructions issued by the Company,
the bank may implement the repurchase program at its own discretion.
The Company is authorized – on its own, through dependent companies or companies in
which it has a majority holding or through third parties acting for it or for dependent com-
panies or companies in which it has a majority holding – not only to sell Infineon shares
acquired on the basis of this or an earlier authorization via the stock exchange or by means
of a public offer, but also to utilize those shares for all legally admissible purposes,
specifically including the following:
(a) The shares may be cancelled without this cancellation or its implementation requiring
any further resolution of the Annual General Meeting. Cancellation results in a reduction
in share capital by the proportion attributable to the cancelled shares. The Manage-
ment Board may also decide in this connection that the share capital will not be affected
by the cancellation and that the proportion of non-cancelled shares in the share capital
will be increased accordingly. The Management Board is authorized in this case to
amend the number of shares indicated in the Articles of Association.
(b) The shares may be offered and transferred to third parties in connection with corporate
mergers or the acquisition of companies, parts of companies or participations in com-
panies and/or other assets that qualify for treatment as contributions in connection
with acquisition transactions of the above-mentioned nature.
(c) The shares may, subject to the consent of the Supervisory Board, be sold to third parties
for cash payment including by means other than through the stock exchange or through
an offer to all shareholders, provided that the price at which the shares are sold (ex-
cluding incidental costs) is not substantially lower than the share price established in
the Xetra (or comparable successor system) opening auction on the day of the sale.
165INFINEON TECHNOLOGIES ANNUAL REPORT 2013
CORPORATE GOVERNANCE
INFORMATION PURSUANT TO SECTION 289, PARAGRAPH 4, AND SECTION 315, PARAGRAPH 4, OF THE GERMAN COMMERCIAL CODE (HGB)

Furthermore, the total value of the shares sold in these cases may not exceed 10 percent
of the share capital as determined either at the time of this authorization becoming
effective or at the time of its exercise. The notional portion of the share capital that
relates to shares issued or used with the subscription rights of the shareholders exclud-
ed in direct or analogous application of section 186, paragraph 3, sentence 4, AktG is
to be included in this amount. Also to be included in this number are the shares that
have already been issued or can still be issued in future to service conversion or option
rights insofar as the underlying bonds were issued during the lifetime of this authoriza-
tion with the subscription rights of the shareholders excluded in analogous application
of section 186, paragraph 3, sentence 4, AktG.
(d) The shares may be used to meet the Company’s obligations under bonds with warrants
and convertible bonds issued or guaranteed by it in the past or in the future.
(e) The shares may be used directly or indirectly to meet obligations under the “Infineon
Technologies AG Stock Option Plan 2006” or the “Infineon Technologies AG Stock
Option Plan 2010”. If own shares are to be transferred to members of the Management
Board, this authorization applies to the Supervisory Board.
(f) The shares may be offered for sale to, or awarded as compensation to, members of
the Company’s Management Board, to members of the Management Board/Board
of Directors of affiliated companies and to employees of the Company or affiliated
companies; shares offered and awarded in this context may also be transferred to the
relevant persons after termination of membership to representative bodies and/or
employment contracts. The shares may also be transferred to a bank that has agreed
to use the shares exclusively for the purposes stipulated in sentence 1. If own shares
are to be offered for purchase or awarded/transferred to members of the Management
Board, this authorization applies to the Supervisory Board.
The shares acquired on the basis of this or an earlier authorization may also be used to
repay securities-backed loans taken out with a bank for one of the purposes stated in
clauses b) to f).
The authorizations may be used once or a number of times, individually or together, and
in their maximum value or in fractions of their maximum value. Subscription rights of the
shareholders with respect to the shares affected by these measures are excluded insofar
as the shares concerned are used in accordance with the aforementioned authorizations
with the exception of clause a). In addition, the subscription rights of shareholders are
excluded in respect of fractional amounts in instances in which the shares are sold through
a public offer addressed to all shareholders.
According to a resolution passed by the Annual General Meeting on February 28, 2013,
the acquisition of Infineon Technologies AG shares may also be effected using equity
derivatives. The Management Board is authorized (i) to sell options that when exercised
require the Company to acquire Company shares (put options) and (ii) to acquire options
that when exercised entitle the Company to acquire Company shares (call options). The
acquisition may furthermore be effected using a combination of put and call options (referred
to collectively as “derivatives”). Shares may also be acquired using derivatives via a bank
that is engaged – in conjunction with a defined repurchase program and on the conditions
determined by the Annual General Meeting – to acquire an agreed number of shares or
shares underlying derivatives for a pre-determined total acquisition price by no later than
the end of a previously agreed period and to transfer them to the Company.
166 INFINEON TECHNOLOGIES ANNUAL REPORT 2013
GROUP MANAGEMENT REPORT – OUR 2013 FISCAL YEAR

The total number of shares that can be acquired using derivatives may not exceed 5 per-
cent of the Company’s share capital, determined either at the time of this authorization
becoming effective or at the time of its exercise through the use of the derivatives. The
shares acquired through the exercise of this authorization are to be counted toward the
acquisition threshold for the shares acquired in accordance with the authorization to acquire
own shares directly described above. The term of the individual derivatives may in each
case be no longer than 18 months, must expire by no later than February 27, 2018 and
must be defined such that the acquisition of own shares either to exercise or to satisfy the
derivatives cannot be effected after February 27, 2018.
The derivative contracts must be concluded with a bank or via the stock exchange. It must
be ensured that obligations under the derivatives are met only using shares that have
been acquired previously, in compliance with the principle of equal treatment, via the
stock exchange at the current price of the share in Xetra trading (or a comparable successor
system) at the time of acquisition via the stock exchange. The price agreed in the derivative
(excluding incidental costs but taking into account the option premium paid or received)
for the acquisition of a share when options are exercised may be no more than 10 percent
above and no more than 30 percent below the price of the share calculated at the opening
auction in Xetra trading (or a comparable successor system) on the day the derivative
transaction is concluded.
The acquisition price paid by the Company for derivatives may not be substantially higher
than, and the sale price received by the Company for derivatives may not be substantially
lower than, the theoretical market value of the options concerned as determined in accor-
dance with accepted methods of financial mathematics, considering among other things
the agreed exercise price.
If own shares are acquired using derivatives in accordance with the foregoing rules, any
right of the shareholders to conclude such derivative transactions with the Company will
be excluded in analogous application of section 186, paragraph 3, sentence 4, AktG. The
shareholders similarly have no right to conclude derivative transactions with the Company
insofar as arrangements for the conclusion of derivative transactions include a preferred
offer for the conclusion of derivative transactions concerning small volumes of shares.
Shareholders have a right to sell their Infineon shares in this connection only insofar as
the Company is required to accept the shares under the derivative transactions. No other
right to sell shares will apply in this connection.
The rules laid out above relating to the authorization to acquire own shares directly apply
as appropriate to the use of own shares acquired using derivatives.
Significant agreements in the event of a change of control
as a result of a takeover bid
The convertible bond issued by Infineon Technologies AG on May 26, 2009 through Infineon
Technologies Holding B.V. that matures in 2014 (for further information see note 27 to the
Consolidated Financial Statements) contains a change of control clause granting holders an
early redemption option in the event of a change of control as defined in the clause.
Furthermore, certain patent cross-licensing agreements, development agreements, sub-
sidy agreements and approvals, joint venture agreements and license agreements contain
change of control clauses according to which a change in control of Infineon Technologies AG
triggers the right of the other party to terminate the agreement, to continue the agreement
at its discretion as well as other rights which may, under circumstances, be unfavorable
for Infineon.
P See page 238
167INFINEON TECHNOLOGIES ANNUAL REPORT 2013
CORPORATE GOVERNANCE
INFORMATION PURSUANT TO SECTION 289, PARAGRAPH 4, AND SECTION 315, PARAGRAPH 4, OF THE GERMAN COMMERCIAL CODE (HGB)

The aforementioned change of control clauses relating to the convertible bond reflect
standard market practice for financial instruments of this nature in the interests of creditor
protection. The change of control clauses negotiated with the contract partners of Infineon
Technologies AG as part of its general business activities are also in line with standard
market practice. The same applies for the subsidy agreements and approvals as well as the
joint venture agreements entered into by Infineon.
Agreements for compensation in the event of a takeover bid
If a member of the Management Board leaves his or her position in connection with a
change of control, that member is currently entitled to continued payment of the relevant
annual remuneration for the entire remaining contract term. In accordance with a special
contract termination right granted to members of the Management Board, the period of
continued payment is capped at a maximum of 36 months in the event the member resigns,
or at a minimum of 24 months and a maximum of 36 months in the event the member is
removed from office or dismissed by Infineon Technologies AG. Further details are contained
in the Compensation Report.
The change of control clauses agreed with the members of the Management Board cor-
respond to the recommendation made in section 4.2.3, paragraph 5, of the German Corpo-
rate Governance Code. Such clauses are intended to give members of the Management
Board security if a change of control situation occurs, and to preserve their independence
in the event of a takeover bid.
There are no comparable arrangements for employees.
CORPORATE GOVERNANCE REPORT
Corporate Governance practices
Corporate Governance – standards for effective and responsible
corporate management
The Management Board and the Supervisory Board of Infineon Technologies AG view cor-
porate governance as a comprehensive concept for responsible, transparent and value-led
corporate management. Good corporate governance fosters trust in our entity among
national and international investors, the financial markets, business partners, employees
and the public. The Management Board, the Supervisory Board and the management ensure
that corporate governance is actively implemented and continuously developed through-
out the entity. Corporate governance at Infineon encompasses not only the German Corpo-
rate Governance Code (Deutscher Corporate Governance Kodex – “DCGK”), but also the
standards of the internal control system, compliance – especially the Infineon Business
Conduct Guidelines – and regulations on organizational and supervisory duties within the
entity, which are available to all employees on the Infineon intranet.
Business Conduct Guidelines
We conduct our business responsibly and in compliance with legal requirements and
administrative regulations – and we have established several guidelines for this purpose.
Infineon Technologies AG’s “Business Conduct Guidelines” as the most important of these
are published on the Internet at www.infineon.com/conductguidelines and are mandatory
for the Management Board and all employees worldwide. The Business Conduct Guidelines
are regularly reviewed and updated. They include regulations on compliance with the law,
interaction with business partners and third parties, the avoidance of conflicts of interest,
interaction with Company institutions, data and information management and environ-
mental protection, health and safety. The guidelines also contain regulations concerning
the handling of complaints and reports of breaches of the guidelines.
168 INFINEON TECHNOLOGIES ANNUAL REPORT 2013
GROUP MANAGEMENT REPORT – OUR 2013 FISCAL YEAR

Corporate Compliance Officer and Compliance Panel
The independent Compliance Office set up on June 1, 2011, was allocated an increased
budget in the 2012 and 2013 fiscal years, and its staffing levels were increased. These
measures confirm Infineon’s clear commitment to absolute compliance with the law and to
maintaining ethical standards which protect the legitimate interests of employees, suppli-
ers, customers, and shareholders, safeguard Infineon’s reputation, and take account of
Infineon’s needs. In addition to meeting the traditional compliance objectives, such as risk
mitigation and increases in efficiency and effectiveness, compliance is promoted with
a view to strengthening Infineon’s image as a reliable and fair business partner and thus
contributing to its overall success.
The Infineon Technologies AG’s Corporate Compliance Officer reports directly to the
Infineon Chief Financial Officer (CFO). He or she is involved in setting guidelines, develops
the Infineon compliance program, initiates or takes part in compliance audits, advises
employees, receives complaints and tip-offs, including those made anonymously, and
coordinates investigations into compliance-related incidents. In addition, he or she carries
out regular compliance training measures for employees on topics such as anti-trust law and
anti-corruption. Extensive training measures were carried out during the 2013 fiscal year.
The Corporate Compliance Officer is supported by regional Compliance Officers. The Com-
pany has also established a Compliance Panel, composed of experienced managers from
the Legal, Human Resources, Internal Audit and Security departments and the Corporate
Compliance Officer. The members of the Compliance Panel meet regularly. The primary task
of the panel is to deliberate on the current status of compliance throughout Infineon and to
discuss issues and reach decisions aimed at improving the compliance system at Infineon.
Risk management
The Management Board considers the systematic and effective management of risks and
opportunities as part of good corporate governance and one of our key success factors.
It forms a part of our business operations and ensures that risks and opportunities are
detected early and exposure to risk is minimized. This transparency of the risk exposure
group-wide also makes a contribution to the systematic and continuous increase in the
value of the Company.
Our group-wide risk and opportunity management system, which is continuously adapted
to changes in circumstances, consists of four sub-processes: risk identification, risk
analysis, risk controlling, and risk monitoring. Its effectiveness is reviewed regularly by
the Supervisory Board’s Investment, Finance and Audit Committee.
Details of risk management at Infineon are presented in the Risk and Opportunity Report,
which provides an in-depth description of both risk and opportunity management and the
internal control system at Infineon.
Transparent management
We submit a regular quarterly report covering our business developments and Infineon’s
financial position and performance to our shareholders according to a defined financial
calendar. The members of the Management Board regularly inform shareholders, analysts,
media and general public about the quarterly and annual results. Our comprehensive
investor relations service features regular meetings and telephone conferences with analysts
and institutional investors. All notices and disclosures are usually available on our website
(www.infineon.com) in German and English.
Infineon Technologies AG also issues ad hoc announcements in addition to its regular
reporting to publicize information that is not in the public domain and the disclosure of
which is deemed to affect the value of the Infineon share significantly.
@ www.infineon.com
169INFINEON TECHNOLOGIES ANNUAL REPORT 2013
CORPORATE GOVERNANCE
CORPORATE GOVERNANCE REPORT

The Company has a Disclosure Committee comprising members from various specialist
departments to review and approve certain financial and other material information,
either published in the course of the regular financial reporting or ad hoc announcements.
German law requires the Management Board to render a responsibility statement. The
information required for this purpose is confirmed internally vis-à-vis the Management Board
by senior executives bearing management responsibility.
D&O insurance
The Company maintains a directors’ and officers’ group liability insurance (“D&O Insur-
ance”). The D&O Insurance policy covers personal liability in the event of claims made in
particular against members of the Management and Supervisory Board for indemnification
of losses incurred in the performance of their duties. A deductible of 10 percent of the loss
up to the amount of one and a half times the annual fixed compensation of the Manage-
ment or the Supervisory Board member concerned has been agreed in accordance with
the statutory regulation in section 93, paragraph 2, of the German Stock Corporation Act
(AktG) (for the Management Board) and the recommendation in section 3.8 of the DCGK
(for the Supervisory Board).
Financial reporting and auditing
Starting with the 2009 fiscal year, Infineon Technologies AG has prepared its Consoli-
dated Financial Statements exclusively in accordance with International Financial Reporting
Standards (IFRS) as applicable in the EU. The Separate Financial Statements of Infineon
Technologies AG continue to be prepared in accordance with the German Commercial Code
(HGB). The Separate and Consolidated Financial Statements of Infineon Technologies AG
and the combined Management Report (Lagebericht) are published within 90 days of the
end of the fiscal year after approval by the Supervisory Board.
Infineon’s financial reporting system for the 2013 fiscal year is audited by KPMG AG
Wirtschaftsprüfungsgesellschaft, Munich (KPMG). The Quarterly Reports were also sub-
jected to review by KPMG. The audit also considers the Company’s system for the early
identification of risks and the submission of the Declaration of Compliance in accordance
with section 161 AktG. The Investment, Finance and Audit Committee discusses the
quarterly reports and the half-yearly financial report with the Management Board prior to
publication. We have agreed with KPMG that the Chairman of the committee should be
informed immediately if any possible reasons for exclusion or bias occur during the audit,
unless they can be eliminated immediately. The auditors should also report immediately
on all findings and occurrences material to the Supervisory Board’s work that arise in the
course of the audit and review engagements.
Directors’ dealings
Members of the Management Board and the Supervisory Board and specified persons
bearing management responsibility with, among other things, regular access to inside
information, as well as parties related to them, are required pursuant to section 15a of
the German Securities Trading Act (Wertpapierhandelsgesetz) to notify the Company as
well as the Federal Financial Supervisory Authority (Bundesanstalt für Finanzdienstleistung-
saufsicht – BaFin) of own transactions involving Company shares. This only applies, how-
ever, if the total value of the transactions made by one of the above mentioned persons
amounts to €5,000 or more in one calendar year. The Company is obliged to publish the
notifications it receives and have them recorded in the Company Register. Such notices
are also reported to BaFin.
170 INFINEON TECHNOLOGIES ANNUAL REPORT 2013
GROUP MANAGEMENT REPORT – OUR 2013 FISCAL YEAR

The following securities transaction was notified to the Company during the 2013 fiscal year.
Date of transaction December 6, 2012
Last name, first name Mayrhuber, Wolfgang
Function Chairman of the Supervisory Board
Description Shares in Infineon Technologies AG
ISIN/WKN DE0006231004/623 100
Purchase/sale Purchase
Price (per unit) €5.75
Number of units 17,500
Total volume €100,625
Transaction location Frankfurt Stock Exchange (Xetra)
Compensation of the Management Board and the Supervisory Board
Details of Management Board and Supervisory Board compensation in the 2013 fiscal year
are presented in the comprehensive Compensation Report, which also forms part of the
Group Management Report of Infineon Technologies AG.
Shareholders and Annual General Meeting
Infineon shareholders take their decisions at the Annual General Meeting, which is held at
least once a year. Each share carries one vote. Shareholders can attend the Annual General
Meeting as long as they are registered in the share register and have duly registered for
the meeting. The Annual General Meeting decides on all issues assigned to it by law, most
notably on the formal approval of the conduct of business by the Management Board and
the Supervisory Board, the profit appropriation, the election of the auditors and amend-
ments to the Articles of Association. Shareholders are entitled to make counterproposals to
motions introduced by management and to speak and ask questions at the Annual General
Meeting. They also have the right, subject to certain conditions, to challenge resolutions
of the Annual General Meeting, to request an extraordinary judicial review and to claim
damages from corporate bodies of the Company on behalf of the Company when they
identify incidences of misconduct or serious deficiencies in the Company’s management
and control. We wish to support our shareholders as far as possible in the exercise of their
rights at the Annual General Meeting. Shareholders can register for our Annual General
Meeting electronically, participate in voting by postal voting or by sending online instruc-
tions e.g. to their proxies and they can follow the general debate via the Internet. All docu-
ments and information relating to the Annual General Meeting can be found on our website.
Our Investor Relations Department, moreover, can be contacted throughout the year both
by telephone and electronically to ensure the exchange of information between us and our
shareholders.
Infineon stock option plans
Infineon’s stock option plans are detailed in the notes to the Consolidated Financial
Statements note 32; the full text of the plans may be viewed at www.infineon.com
(▸ About Infineon/Investor/Corporate Governance/Stock Option Plan).
P See page 244
@ www.infineon.com (▸ About Infineon/
Investor/Corporate Governance/Stock
Option Plan)
171INFINEON TECHNOLOGIES ANNUAL REPORT 2013
CORPORATE GOVERNANCE
CORPORATE GOVERNANCE REPORT

Declaration concerning the management of the Company
(Part of the Group Management Report – unaudited)
Declaration of compliance with the German Corporate Governance Code issued for
the 2013 fiscal year by the Management Board and Supervisory Board of Infineon
Technologies AG in accordance with section 161 of the German Stock Corporation Act
The Management Board and Supervisory Board issued the following declaration pursuant
to § 161 AktG in November 2013:
1. “Since the submission of the last Declaration of Compliance in November 2012,
Infineon Technologies AG has, with one exception, complied with all recommendations
of the Government Commission of the German Corporate Governance Code (“Govern-
ment Commission”) in the version of May 15, 2012. The one exception, stated and
explained in the November 2012 declaration, relates to the following:
Section 5.4.6 of the Code includes the recommendation that performance-related
compensation of the members of the Supervisory Board “shall be oriented toward sus-
tainable growth of the enterprise”. The similarity in terminology to the requirements
contained in the German Stock Corporation Act with respect to compensation of Manage-
ment Board members seems to imply that performance-related compensation should
also be based on a “multi-year assessment” for Supervisory Board members.
Members of the Supervisory Board of Infineon Technologies AG receive both fixed and
performance-related compensation, the latter only being paid if earnings per share
exceed a pre-defined amount.
Both the Management Board and the Supervisory Board have investigated this topic
over the past year. They concluded that the compensation system currently in place for
the Supervisory Board is already oriented toward sustainable growth of the enterprise
even without a multi-year assessment, since the minimum amount required to trigger
the compensation payment increases year-on-year, thus setting an incentive for im-
proving earnings each year. As a consequence, neither of the boards saw any require-
ment to change the Supervisory Board compensation system recently approved with
a large majority at the Annual General Meeting.
2. The new version of the Code dated May 13, 2013 became effective on June 10, 2013.
Infineon Technologies AG has also complied, and will comply in the future, with the
recommendations contained in this version of the Code; this also applies for the
amended recommendations relating to Management Board compensation contained
in sections 4.2.2 and 4.2.3 of the Code, as discussed by the Supervisory Board at its
meeting on August 6, 2013.
The recommendation relating to Supervisory Board compensation contained in
section 5.4.6 of the Code is not complied with for the reason previously given.”
Relevant disclosures in respect of corporate governance practices
The Company complies with all legal requirements with respect to corporate governance.
With one exception stated in the Declaration of Compliance, Infineon complies with the
recommendations of the German Corporate Governance Code. Furthermore, corporate
governance practices in particular underpin the guidelines for corporate conduct (“Infineon
Business Conduct Guidelines”) as well as the regulations relating to organizational and
supervisory duties. Both of these sets of regulations are available to all employees world-
wide on the Infineon Intranet.
172 INFINEON TECHNOLOGIES ANNUAL REPORT 2013
GROUP MANAGEMENT REPORT – OUR 2013 FISCAL YEAR

Description of the mode of operation of the Management Board
and Supervisory Board and of the composition and mode of operation of the
Supervisory Board’s committees
Infineon Technologies AG is subject to German stock corporation law, which stipulates
a two-tier administrative system, with the Management Board responsible for management
and the Supervisory Board responsible for corporate oversight. We are convinced that this
separation of the two functions is an important precondition for good corporate governance.
The Management Board and the Supervisory Board cooperate closely in Infineon’s interest.
Management Board
Following Peter Bauer’s departure from office on September 30, 2012 and with effect from
October 1, 2012, the Management Board has comprised three members. In accordance
with the DCGK, the Supervisory Board has set an age limit for Management Board member-
ship under which members of the Management Board in general should be no more than
67 years old. In accordance with its rules of procedure, the Supervisory Board takes account
of diversity as well as technical and personal suitability in respect of the composition of
the Management Board and will in particular endeavor to ensure appropriate female repre-
sentation. The Management Board currently comprises only men (100 percent), of whom
two are in the middle age-group of between 30 and 50 years of age (66.7 percent) and one
(33.3 percent) is in the 50 + age-group.
The Management Board is the Company’s executive body. It is obliged to serve the Com-
pany’s interests and thereby pursue the goal of sustainably increasing the entity’s value
taking into account the interests of all stakeholders. It determines the entity’s commercial
objectives, strategic direction and corporate policy and defines how the Company is to
be organized.
According to German stock corporation law, the Management Board has overall responsi-
bility for the management of the Company. The Company’s Management Board has adopted
rules of procedure with the consent of the Supervisory Board. These rules stipulate that
the Company is managed jointly by all of the Management Board members, who should
work together in a cooperative manner to this end. Collaboration between the Management
Board and the Supervisory Board is coordinated by the Chief Executive Officer (CEO). The
CEO maintains regular contact with the Chairman of the Supervisory Board, with whom he
discusses the key aspects of Infineon’s strategy, planning, course of business and risk
management. At the ordinary meetings of the Supervisory Board, the Management Board
reports comprehensively and promptly on Infineon’s business performance, its economic
situation, the economic situation of the individual segments, as well as Infineon’s financial
and investment planning. The CEO notifies the Chairman of the Supervisory Board without
delay of any matters that are of material importance for assessing the position and devel-
opment of the Company or for its management.
Supervisory Board
Work of the Supervisory Board
The Supervisory Board advises and monitors the Management Board as it manages the
entity. The Supervisory Board is informed by the Management Board regularly, comprehen-
sively, and in a timely manner on all matters of relevance and agrees Infineon’s corporate
strategy and its implementation with the Management Board. The Supervisory Board
discusses the quarterly reports and reviews and approves both the Separate Financial
Statements and the Consolidated Financial Statements of Infineon Technologies AG. Major
decisions of the Management Board, such as group-wide financial and investment plan-
ning and major acquisitions and equity investments, divestitures, and financial measures,
are subject to its approval. Further details are stipulated in the rules of procedure of the
Management Board and the Supervisory Board. When Supervisory Board votes end in ties,
the Chairman of the Supervisory Board has two votes if voting is carried out a second time
and again results in a tie.
The duties of the Supervisory Board and its committees are regulated by law, by the Articles
of Association and by the rules of procedure of the Supervisory Board and its committees.
In addition, the DCGK contains recommendations about Supervisory Board work.
173INFINEON TECHNOLOGIES ANNUAL REPORT 2013
CORPORATE GOVERNANCE
CORPORATE GOVERNANCE REPORT

The Supervisory Board reviews the efficiency of its work, including its interaction with
the Management Board, once a year. The efficiency review is performed on the basis of
a questionnaire addressing different areas and criteria of the Supervisory Board’s work.
The results were subsequently discussed at a Supervisory Board meeting. In the 2010
fiscal year, an external independent consultant was engaged for the first time to conduct
a detailed survey of Supervisory Board activities. The most recent efficiency review took
place in summer 2013, again on the basis of a questionnaire. No significant deficits in
efficiency were identified.
Composition of the Supervisory Board
The Supervisory Board of Infineon Technologies AG has twelve members and comprises an
equal number of shareholder representatives and employee representatives as stipulated
in the German Co-Determination Act (Mitbestimmungsgesetz). The shareholder representa-
tives are elected by the Annual General Meeting, the employee representatives by employee
delegates at Infineon’s German facilities in accordance with the German Co-Determination
Act. The normal term of office of Supervisory Board members is approximately five years.
New elections were held in the 2010 fiscal year for both the shareholder representative
and the employee representative positions on the Supervisory Board. The Annual General
Meeting held on February 17, 2011 elected Mr. Wolfgang Mayrhuber as a member of the
Supervisory Board as successor to Prof. Dr. Klaus Wucherer. At its meeting held on the same
day, the Supervisory Board elected Mr. Mayrhuber as its Chairman. The terms of office of
all Supervisory Board members will expire at the end of the Annual General Meeting that
resolves on the approval of the actions of the members of the Supervisory Board for the
2014 fiscal year.
The overall composition of the Supervisory Board should comply with the principles of
diversity in the opinion of the Supervisory Board. This means firstly that the composition
of the Supervisory Board should take into account the diversity to be found in an open
and innovative global company like Infineon as far as possible and secondly that nobody
should be selected or dropped as a candidate for the Supervisory Board simply because
he or she possesses or lacks a certain diversity factor. “Diversity” as the term is used here
denotes international (in the sense of roots, upbringing, education or professional activity
rather than citizenship), gender and age diversity.
The Supervisory Board specified concrete objectives regarding its composition at its meet-
ing of November 22, 2010 in accordance with the recommendation in section 5.4.1 DCGK
(version: May 2010). With effect from the version dated May 15, 2012, the Code includes
the recommendation in section 5.4.1 that the Supervisory Board should also specify concrete
objectives regarding the appropriate number of independent Supervisory Board members.
The Supervisory Board’s objectives were therefore expanded in a resolution dated August 7,
2012 as follows:
“The Supervisory Board comprises an equal number of employee and shareholder and
representatives. The Supervisory Board cannot influence the selection of candidates for
the Supervisory Board by the employees; similarly, shareholder representatives on the
Supervisory Board are elected by the Company’s shareholders at the Annual General Meet-
ing and not by the Supervisory Board. Nevertheless it is a stated objective of the Super-
visory Board that the Supervisory Board should comprise
(i) at least nine “independent” representatives […] (including at least four shareholder
representatives),
(ii) at least two women and
(iii) at least four “international” representatives […].
The Supervisory Board already meets these minimum criteria and it is intended that it
continues to do so at all times in future.”
174 INFINEON TECHNOLOGIES ANNUAL REPORT 2013
GROUP MANAGEMENT REPORT – OUR 2013 FISCAL YEAR

The current composition of the Supervisory Board continues to meet these objectives.
Furthermore, the Supervisory Board complies with the age limit defined in its rules of pro-
cedure, which states that in general nobody older than the age of 69 should be proposed
for membership of the Supervisory Board. The Supervisory Board currently comprises
two women (16.7 percent) and ten men (83.3 percent), of whom one (8.3 percent) is in the
middle age-group of between 30 and 50 years of age and all others (91.7 percent) are in
the 50 + age-group.
The Supervisory Board will take this requirements profile and these objectives into account
in its future nominations to the Annual General Meeting. In doing so, the Supervisory Board
will also disclose any of the candidate’s business or other relationships with Infineon, the
Company’s representative bodies and/or a major shareholder in the Company, if it considers
that an impartial shareholder making an objective decision about the election would con-
sider such information to be of relevance. The same applies in respect of the Nomination
Committee insofar as it carries out the preparatory work for the Supervisory Board decision.
The Supervisory Board recommends that its members elected by the employees also do
what they can, within the scope of their influence, to have the requirements profile and
objectives taken into account in the election nominations made by the relevant bodies on
the employees’ side. The Supervisory Board also recommends that the objectives be taken
into account by any of its members making an application for the appointment of a Super-
visory Board member by the courts.
Supervisory Board committees
The Supervisory Board rules of procedure provide for the formation of three committees:
the Mediation Committee, the Executive Committee, and the Investment, Finance, and Audit
Committee. The Supervisory Board has also established both a Strategy and Technology
Committee and the Nomination Committee recommended in the DCGK. All Supervisory Board
committees have an equal number of employee representatives and shareholder represen-
tatives apart from the Nomination Committee, which consists exclusively of shareholder
representatives.
The Mediation Committee, which consists of the Chairman of the Supervisory Board, the
Vice-Chairman, one shareholder representative and one employee representative, submits
specific recommendations to the Supervisory Board concerning the appointment of mem-
bers of the Management Board if the first round of the election on the appointment does
not result in the required majority of two thirds of the members of the Supervisory Board.
The Executive Committee consists of the Chairman of the Supervisory Board, the Vice-Chair-
man, one shareholder representative and one employee representative. The duties of this
committee include preparing the appointment and dismissal of members of the Management
Board and drawing up the resolution (taken by the Supervisory Board) on Management
Board compensation. It is also responsible for concluding, amending and terminating con-
tracts with Management Board members except in matters involving earnings.
The Investment, Finance, and Audit Committee (“Audit Committee”) consists of the Chair-
man of the Supervisory Board, the Vice-Chairman and one further representative each
for shareholders and employees. The Chairman of the Investment, Finance, and Audit Com-
mittee, Dr. Eckart Sünner, has particular expertise in and extensive experience of financial
reporting on account of his many years of service as chairman of the audit committee of
another DAX-listed corporation and accordingly qualifies as an “independent financial
expert” pursuant to section 100, paragraph 5, of the German Stock Corporation Act.
The Audit Committee monitors the Company’s financial reporting process and discusses
and examines the Separate Financial Statements and Consolidated Financial Statements
prepared by the Management Board, the combined Management Report (Lagebericht) and
the quarterly and half-yearly financial reports. It gives recommendations with respect to
the approval of the Separate Financial Statements and Consolidated Financial Statements
175INFINEON TECHNOLOGIES ANNUAL REPORT 2013
CORPORATE GOVERNANCE
CORPORATE GOVERNANCE REPORT

by the Supervisory Board based on the independent auditors’ report, engages the inde-
pendent auditors selected by the Annual General Meeting to audit the Separate Financial
Statements and Consolidated Financial Statements and review the interim financial reports,
specifies the key areas to be examined in audit activities jointly with independent auditors
and is responsible for setting the independent auditors’ compensation.
Other matters addressed by the Audit Committee include the effectiveness of the internal
control system, internal audit system and risk management system. It has the authority in
this connection both to contact any employee of the entity directly and to seek external
assistance. Internal Audit reports annually to the Audit Committee, which can also specify
an audit plan and key areas to be considered in audits.
Furthermore, the Audit Committee is responsible for the discussion of compliance issues.
The Management Board and the Corporate Compliance Officer regularly report to the Audit
Committee on the structure and work of the compliance organization and on any particular
compliance issues.
The Strategy and Technology Committee, which consists of three shareholder representa-
tives and three employee representatives, concerns itself with Infineon’s business strategy
and key technology issues.
The Nomination Committee, which consists of the Chairman of the Supervisory Board
and two further shareholder representatives, proposes to the Supervisory Board suitable
candidates for recommendation to the Annual General Meeting.
All committees regularly submit detailed reports on their work to the Supervisory Board.
Further information about the work of the Supervisory Board and its committees can be
found, together with details of the people who serve on them, in note 42 to the Consoli-
dated Financial Statements and in the report of the Supervisory Board to the Annual
General Meeting.
Avoidance of conflicts of interest
The members of the Management Board and Supervisory Board disclose any conflicts of
interest to the Supervisory Board without delay. No conflicts of interest arose among the
members of the Management Board and Supervisory Board in the 2013 fiscal year. Accord-
ing to the German Corporate Governance Code, members of the Management Board require
the approval of the Supervisory Board before taking on Supervisory Board mandates out-
side the company. In the 2013 fiscal year the Supervisory Board approved the acceptance
of a Supervisory Board mandate at EPCOS AG by Mr. Asam.
Material transactions between the Company and members of the Management Board or
related parties require the approval of the Supervisory Board. This also applies to con-
sulting and other service or work contracts a Supervisory Board member enters into with
the Company. As a precaution, the Supervisory Board approved in November 2010
a contract between the Company and the Technische Universität München (Institute for
Technical Electronics headed by Prof. Dr. Schmitt-Landsiedel) for the performance of R&D
work on the topic of “Sensing for Automotive Applications”; this contract expired on
September 30, 2013. The Company and the Technische Universität München are currently
negotiating a renewal of the contract.
Shareholdings of Management and Supervisory Board members
As of September 30, 2013, the shares in Infineon Technologies AG held by all members
of the Management Board and Supervisory Board did not exceed 1 percent of the shares
issued by the Company.
Information about the composition of the Management Board, Supervisory Board and
the Supervisory Board’s committee can be found in note 42 to the Consolidated Financial
Statements.
P See page 271
P See page 271
176 INFINEON TECHNOLOGIES ANNUAL REPORT 2013
GROUP MANAGEMENT REPORT – OUR 2013 FISCAL YEAR

COMPENSATION REPORT
This Compensation Report, which forms an integral part of the Management Report,
explains the principles applied in determining compensation for the Management Board
and Supervisory Board of Infineon Technologies AG and the level of remuneration paid to
the individual members of the Management Board and Supervisory Board in accordance
with the applicable legal requirements and the recommendations of the German Corporate
Governance Code in the version of May 13, 2013 (Deutscher Corporate Governance Kodex
– “DCGK”). Infineon believes that transparent and understandable reporting of Manage-
ment Board and Supervisory Board compensation represents a fundamental element of
good corporate governance.
Management Board compensation
Compensation system
The Management Board compensation system – similarly to compensation paid to individual
members of the Management Board – is defined and regularly reviewed by the full Super-
visory Board on the basis of proposals from the Executive Committee. The compensation
paid to members of the Management Board is intended to reflect the typical level and
structure of Management Board compensation at comparable companies in Germany
and elsewhere, as well as Infineon’s economic position and future prospects. The duties,
responsibilities and performance of each Management Board member are also to be
considered, as is Infineon’s wider pay structure. This includes considering Management
Board compensation in relation to the compensation of senior management and of the
workforce as a whole, including changes in the level of compensation over time. The stated
objective is that the compensation structure should be designed in such a way that it
promotes sustainable business development. Infineon aims to set compensation at a
level that is competitive both nationally and internationally so as to inspire and reward
dedication and success in a dynamic environment.
The most recent review of the compensation system for the Management Board was carried
out in the 2012 fiscal year by an external independent compensation expert, who reached
the conclusion that the compensation system complied with applicable stock corporation
requirements and that compensation was commensurate with market conditions. In
addition, it was concluded that variable compensation, as required by the German Stock
Corporation Act, is oriented toward sustainable growth of the enterprise. The next review
of Management Board compensation is scheduled to take place in the 2014 fiscal year.
Components of the Management Board compensation system
The members of the Management Board receive as compensation for their service an
annual income which – based on a target achievement of 100 percent – comprises
approximately 45 percent fixed compensation and approximately 55 percent variable
compensation components:
> Fixed compensation: The fixed compensation comprises a contractual basic annual
salary that has no link to performance and is paid in twelve equal monthly installments.
> Variable (performance-related) compensation: The variable compensation comprises
three components: an annual bonus (short-term incentive), a multiple-year bonus (mid-
term incentive) and a long-term variable compensation component (long-term incentive).
The short-term incentive (STI) is intended to reward performance over the preceding fiscal
year in line with Infineon’s recent progress. Assuming a 100 percent target achievement,
the STI constitutes approximately 20 percent of target annual income. It is set by the
Supervisory Board in a two-phase process:
177INFINEON TECHNOLOGIES ANNUAL REPORT 2013
CORPORATE GOVERNANCE
COMPENSATION REPORT

(i) At the beginning of each fiscal year, the target functions with respect to the two per-
formance indicators “free cash flow” and “return on capital employed (RoCE)” are
defined uniformly for all Management Board members. Underpinning the consistent
approach taken to managing the business, the same target indicators – supplemented
by “segment result” – are used as the basis for determining the variable compensation
components (bonus payments) for Infineon employees. The two performance indicators,
which are described in more detail in the chapter “Internal Management System”, are
equally weighted for the purposes of measuring the STI.
(ii) At the end of the fiscal year, the actual levels of target achievement for free cash flow
and RoCE and, hence the amount of the STI, is determined by the Supervisory Board.
An STI is paid only if, on the basis of the approved financial statements, the level of target
achievement reaches at least the 50 percent threshold for both performance indicators
(free cash flow, RoCE). If one of the two target thresholds is not achieved, no annual bonus
is paid for the relevant fiscal year. If the threshold is achieved, the arithmetic mean of the
two target achievements is calculated, and used as the percentage rate to determine the
actual STI amount. A cap of 250 percent applies, meaning that the maximum amount that
can be paid is two and a half times the target STI (= 100 percent), regardless of the actual
achievement level. The Supervisory Board may, in addition, increase or reduce the amount
to be paid in each case by up to 50 percent, as it sees fit, based on the performance of the
Management Board as a whole, Infineon’s position and any exceptional factors. A lower
limit applies in this case such that the amount to be paid cannot be less than the amount
that would be due given 50 percent target achievement. The upper limit for an upwards
adjustment is the cap of 250 percent.
If the term of office on the Board begins or ends during the fiscal year, the entitlement
to STI is calculated on a pro-rata monthly basis (one twelfth for each month started).
Management Board members are not entitled to receive an STI bonus for the fiscal year in
which they resign from office or terminate their contract of their own will or if their contract
is terminated for good cause.
The mid-term incentive (MTI) is intended to reward sustained performance by the Manage-
ment Board in line with Infineon’s medium-term progress. In combination with the long-
term incentive, the MTI ensures compliance with the stock corporation law requirement
that the structure of compensation is to be “oriented toward sustainable growth of the
entity”. Assuming a 100 percent target achievement, the MTI constitutes approximately
20 percent of target annual income.
A new MTI tranche commences at the beginning of each fiscal year. Each tranche has a
term of three years and is paid in cash at the end of the term. The amount of the payment
is determined on the basis of actual RoCE and free cash flow figures during each three-
year period. For these purposes, the target values for RoCE and free cash flow for each
individual year of an MTI tranche correspond to the STI targets set each year in advance.
The level of target achievement for both the RoCE target and the free cash flow target must
reach a threshold of 50 percent in each year of the relevant three-year period, otherwise
the level of target achievement for the purposes of the MTI is set to zero for the year con-
cerned. If the threshold is exceeded, the level of target achievement determined for the
STI in the relevant year also applies for the purposes of the MTI. The MTI to be paid at the
end of the three-year period is determined by calculating the arithmetic mean of the three
annual target achievement levels. Unlike the STI, the MTI is paid as calculated even if the
mean level of target achievement for the three-year period is below the 50 percent threshold.
An upper cap of 200 percent applies, meaning that the maximum amount that can be paid
is two times the target MTI (= 100 percent), regardless of actual achievement level.
178 INFINEON TECHNOLOGIES ANNUAL REPORT 2013
GROUP MANAGEMENT REPORT – OUR 2013 FISCAL YEAR

The Supervisory Board may increase or reduce the amount to be paid under the MTI in
each case by up to 50 percent, as it sees fit, based on the performance of the Management
Board as a whole, Infineon’s position and any exceptional factors. When exercising its
judgment in this respect, the Supervisory Board also takes into account the level of achieve-
ment of the three-year target for revenue growth and segment result that is set each year
by the Supervisory Board exclusively for this purpose. Unlike the STI, there is no lower limit
for the amount by which the Supervisory Board can adjust the MTI; for the upper limit,
however, the cap applies (200 percent).
If the term of office commences during a fiscal year, the MTI tranche is determined on
a pro-rata basis (1/36 for each month of a full MTI tranche started). Upon leaving Infineon,
mechanisms are in place to ensure that a Management Board member can only receive a
MTI payment for the actual number of MTI tranches during his/her term of office. MTI tranches
already started are forfeited without compensation if the Management Board member’s
mandate or service contract is brought to an end before the due date, for instance in the
case of dismissal from office or termination of contract for good cause.
The long-term incentive (LTI) is intended to reward long-term – and like the MTI – sustained
performance on the part of members of the Management Board and to ensure that their
interests are aligned with the interest of the Company’s shareholders regarding a positive
share price development. Assuming a 100 percent target achievement, the LTI constitutes
approximately 15 percent of the target annual income of each individual member of the
Management Board.
The LTI maintained in recent years by the Company is a stock option plan (“Stock Option
Plan 2010”) resolved at the 2010 Annual General Meeting. Based on the terms of this plan,
the Supervisory Board has awarded members of the Management Board an annual tranche
of stock options – most recently in the 2013 fiscal year – corresponding in each case to
the portion of the target annual income accounted for by the LTI. Any stock options granted
are subject as a general rule to the plan conditions applicable to employees, including a
four-year vesting period and a three-year exercise period as well as a relative performance
target (outperformance of the relevant Philadelphia Semiconductor Index (SOX) over a
specified time period) and an absolute performance target (minimum increase in Infineon
share price of 20 percent). If the gain from exercised stock options amounts to more than
250 percent of the target annual income attributable to the LTI for the year concerned, a
number of options will expire such that the gain is reduced to the 250 percent mark (cap).
The Supervisory Board has decided upon a new LTI concept for fiscal years commencing
after September 30, 2013, which was approved by shareholders at the 2013 Annual General
Meeting as part of a resolution on the new Management Board compensation system.
The new LTI is a so-called “Performance Share” plan. The (virtual) performance shares are
allocated – initially on a provisional basis – on October 1 of each fiscal year for the fiscal
year beginning on that date. The performance shares are allocated on the basis of the con-
tractually agreed “LTI - allocation amount”. The prerequisite for the definitive allocation
of the (at that stage still virtual) performance shares is that the relevant Management Board
member invests 25 percent of his/her individual LTI allocation amount in Infineon shares
and that the holding period of four years applicable for the member’s own investment and
for the performance shares has come to an end. Moreover, 50 percent of the performance
shares are performance-related; they are only allocated definitively if the Infineon share
outperforms the SOX during the period between the date of the performance shares’ provi-
sional allocation and the end of the holding period. If the conditions for definitive allocation
of performance shares (either of all or of only those that are not performance-related) are met
at the end of the holding period, the Management Board member acquires a claim against
the Company for the transfer of the corresponding number of (real) Infineon shares; perfor-
mance shares which do not achieve the target are forfeited. For these purposes, the value
of the performance shares definitively awarded to the Management Board member per LTI
tranche may not exceed 250 percent of the relevant LTI allocation amount; all performance
shares above this amount are forfeited (cap). The value of the performance shares in con-
junction with the cap is calculated on the basis of the closing price of the Infineon share
in Xetra trading at the end of the holding period; the date on which the Infineon share are
transferred is irrelevant for these purposes.
179INFINEON TECHNOLOGIES ANNUAL REPORT 2013
CORPORATE GOVERNANCE
COMPENSATION REPORT

The shares are transferred to a securities account belonging to the Board member, after
which he/she can freely access them. The same also applies to Infineon shares acquired in
conjunction with the own-investment requirement at the end of the holding period.
The Supervisory Board has the right, at the end of the holding period, to make a cash settle-
ment to the Management Board member rather than actually transfer Infineon shares.
If the Management Board member leaves office during the first two years of the holding
period applicable to the performance shares of a particular LTI tranche, those performance
shares are forfeited, unless the reason for leaving office is that the Board member has reached
the contractually agreed age limit. The holding period for own-investment shares expires
when the Management Board member leaves office; at that stage the shares are freely
accessible to the Board member concerned. If the Management Board member leaves office
at a later date – except in the cases of resignation or contract termination for good cause –,
the LTI tranche (including own investment) remains in place unchanged. The Management
Board member is then treated in all respects as if he/she were still in office; there is no pro
rata reduction due to leaving office early.
Performance Shares based on the new LTI were awarded for the first time on October 1,
2013 for the fiscal year beginning on that date.
The Supervisory Board is required to define suitable alternative LTI instruments of com-
mensurate value if it is impossible or not desired by the Supervisory Board to offer an LTI on
the basis of the Performance Share Plan.
Last but not least, the Supervisory Board has the option to grant an additional bonus,
amongst others for special achievements of the Management Board. In accordance with
the corresponding amendments made to contracts in the 2013 fiscal year, the bonus
for each Management Board member is capped at a maximum value of 30 percent of fixed
compensation.
Management Board compensation in the 2013 fiscal year
Total cash compensation
The members of the Management Board active in the 2013 fiscal year received total
fixed non-performance-related compensation (basic annual salary plus benefits-in-kind)
of €2,364,040 for their service (the active members in the previous year had received
€3,105,029).
The members of the Management Board also received variable performance-related
compensation totaling €1,739,096 for their service during the 2013 fiscal year (2012:
€3,415,818), which consists of the short-term incentive (STI) totaling €895,104 (2012:
€1,366,560) and the mid-term incentive (MTI) tranches awarded for the 2013 fiscal year
totaling €843,992 (2012: € 2,049,258; this figure included a settlement payment to
Mr. Bauer and Dr. Ploss as replacement for MTI payments not yet matured totaling
€1,218,300). The first MTI tranche completely awarded and payable for the period 2011 –
2013 amounts to €807,576.
No additional bonus was granted by the Supervisory Board.
The amount of compensation awarded for the 2013 fiscal year paid in the 2013 fiscal year
or payable in subsequent years accordingly amounts to €4,103,136 (2012: €6,520,847).
180 INFINEON TECHNOLOGIES ANNUAL REPORT 2013
GROUP MANAGEMENT REPORT – OUR 2013 FISCAL YEAR

Share-based compensation
Stock options relating to the Stock Option Plan 2010 were issued to Management Board
members for the last time in (and for) the 2013 fiscal year; with effect from the 2014
fiscal year, Management Board members receive a long-term, share-based compensation
in the form of “performance shares” in conjunction with the contractually agreed LTI.
The number of options to be awarded was calculated on the basis of their fair market value.
The fair market value figure used to determine the number of stock options took no account
of the cap applicable to these options and was consequently equivalent to the fair market
value of the options granted by the Company to employees under the Infineon Stock
Option Plan 2010, without cap.
Under the terms of that plan, the exercise price for a new share amounts to 120 percent
of the average share price over the five trading days preceding the grant day of the option.
The options issued may only be exercised if the Infineon share price is equal to or exceeds
the exercise price during the term of the option (absolute performance target). In addition,
the share price must outperform the Philadelphia Semiconductor Index (SOX) (relative
performance target). The initial reference figures (100 percent) for this purpose are the
arithmetic mean of the Infineon share price and the daily closing price of the SOX over
a three-month period following the issue of the stock options. The Infineon share price must
then exceed the SOX (daily closing price), as measured using the respective reference
values, at least once on at least ten consecutive trading days in the period beginning one
year after the grant of the stock options and lasting until the end of their lifetime.
Further details of the Stock Option Plan 2010 are provided in note 32 to the Consolidated
Financial Statements.
Based on the Stock Option Plan 2010, Dr. Ploss received 187,500 stock options (in his capa-
city as Chief Executive Officer), Mr. Asam 130,952 stock options and Mr. Mittal 229,167
stock options in (and for) the 2013 fiscal year. Mr. Mittal was appointed as member of the
Management Board effective January 1, 2012. In accordance with the agreement reached
between Mr. Mittal and the Company, the stock options to which he was entitled as LTI pro
rata for the 2012 fiscal year, were awarded in the 2013 fiscal year. Accordingly, 98,215 of
the stock options granted to Mr. Mittal in total in the 2013 fiscal year relate to the 2012 LTI.
These stock options are subject to an exercise cap of 250 percent of their fair market value
at grant date. The exercise cap was calculated using the fair market value of an option
without any value-reducing limit (€1.68; 2012: €1.75).
No stock options were exercised or forfeited during the 2013 fiscal year; 180,000 (2012:
95,000) of the stock options granted to Mr. Bauer expired.
In the previous year 209,714, 220,000 and 125,714 stock options were granted to Mr. Bauer
(then CEO), Mr. Asam and Dr. Ploss respectively; the stock options due to Mr. Mittal for
the 2012 fiscal year as member of the Management Board were awarded together with the
2013 tranche. The stock options granted continue to be valid if the Board member con-
cerned leaves office. They expire without replacement if the Management Board member’s
mandate or service contract is brought to an end before the due date, for instance in the
case of dismissal from office or termination of contract for good cause. As a result of the
special contract termination right agreed with, and applied by, Mr. Bauer, the options
issued to him during his period of office remain in place, subject to their exercise.
P See page 244
181INFINEON TECHNOLOGIES ANNUAL REPORT 2013
CORPORATE GOVERNANCE
COMPENSATION REPORT

The members of the Management Board active in the 2013 fiscal year received the following
stock options during their service on the Management Board:
Share-based compensation
Options outstanding at the beginning of the fiscal year
Options granted in the fiscal year
Management Board member
Fiscalyear
Number Average exercise
price ¹in €
Number Average exercise
price ¹in €
Dr. Reinhard Ploss (CEO)
2013 245,714 7.81 187,500 7.00
2012 120,000 8.62 125,714 7.03
Dominik Asam
2013 220,000 7.03 130,952 7.00
2012 – – 220,000 7.03
Arunjai Mittal(since January 1, 2012)
2013 – – 229,167 7.00
2012 – – – –
Peter Bauer (until September 30, 2012)
2013 – – – –
2012 475,000 9.65 209,714 7.03
Total
2013 465,714 547,619
2012 595,000 555,428
1 Weighted average
2 Due to the early retirement of Mr. Bauer at September 30, 2012 the total expenses related to his share-based compensation
are recognized in fiscal year 2012.
Other awards and benefits
The Company entered into a restitution agreement in the 2009 fiscal year with each of
the members of the Management Board active at that time. Dr. Ploss is the only current
Management Board member affected by such an agreement. These agreements provide
for the Company to cover, to the extent permitted by law, all costs and expenses incurred
by Management Board members in the performance of their duties for the Company in
connection with legal, governmental, regulatory and parliamentary proceedings and inves-
tigations and with arbitration proceedings, in which the Management Board member is
involved in connection with his or her activities on behalf of the Company. However, the
agreements specifically exclude any restitution of costs insofar as the proceedings concern
an action or omission on the part of the Management Board member that constitutes a
culpable breach of the Management Board member’s duty of care pursuant to section 93,
paragraph 2, of the German Stock Corporation Act (“AktG”).
No payments were made by the Company during the 2013 fiscal year under these restitution
arrangements.
182 INFINEON TECHNOLOGIES ANNUAL REPORT 2013
GROUP MANAGEMENT REPORT – OUR 2013 FISCAL YEAR

Options outstanding at the end of the fiscal year
Options available for exercise at the end of the fiscal year
Total expense for
share-based compen sation ²
in €
Number Average exercise
price ¹in €
Range of exercise
pricesin €
Average remaining
term ¹in years
Number Average exercise
price ¹in €
433,214 7.46 7.00 – 8.62 5.37 – – 70,766
245,714 7.81 7.03 – 8.62 5.72 – – 43,944
350,952 7.02 7.00 – 7.03 5.58 – – 50,631
220,000 7.03 7.03 6.21 – – 27,614
229,167 7.00 7.00 6.21 – – 27,904
– – – – – – –
– – – – – – –
589,714 8.79 7.03 – 13.30 4.06 180,000 11.03 375,803
1,013,333 – 149,301
1,055,428 180,000 447,361
183INFINEON TECHNOLOGIES ANNUAL REPORT 2013
CORPORATE GOVERNANCE
COMPENSATION REPORT

Total compensation
Total compensation granted to the serving members of the Management Board for the 2013
fiscal year amounting to €4,530,974 (2012: €7,065,167) is broken down in the table
below (gross, excluding statutory deductions). The amount shown for LTI corresponds to
the “share-based compensation” described above:
Total compensation
in €
Non-performance-related compensation
Fiscal year Basic annual salary
Other ¹
Management Board member
Dr. Reinhard Ploss (CEO)
2013 945,000 14,192
2012 685,000 21,465
Dominik Asam
2013 685,000 22,624
2012 685,000 34,691
Arunjai Mittal(since January 1, 2012)
2013 685,000 12,224
2012 513,750 14,152
Peter Bauer (until September 30, 2012)
2013 – –
2012 1,100,000 50,971
Total
2013 2,315,000 49,040
2012 2,983,750 121,279
1 The compensation shown under “Other” comprises primarily the monetary value of the provision of a company car,
life-insurance and invalidity premiums on behalf of Management Board members and inventor’s fees.
2 The MTI was introduced as part of the new Management Board compensation system effective October 1, 2010.
The figures reported for the 2012 fiscal years relate to settlement amounts paid to Mr. Bauer and Dr. Ploss to compensate
them for a lack of a maturing MTI tranche.
3 The figures for the current Management Board members (Dr. Ploss, Asam and Mittal) are based on a fair market value per
option of € 0.95 (2012: €0.98), which was calculated on the basis of a Monte-Carlo simulation model taking account of
the value-reducing cap.
Members of the Management Board did not receive any loans from Infineon either in the
2013 or 2012 fiscal year.
Similarly, they did not receive any benefits from third parties in the 2013 and 2012 fiscal
years, whether promised or actually granted, for their board activities at Infineon.
Commitments to the Management Board upon termination of service
Allowances and pension entitlements in the 2013 fiscal year
The members of the Management Board who were in their position prior to the introduction
of the new compensation system in 2010 are contractually entitled to a defined benefit
pension payment. In the 2013 fiscal year, this now only relates to Dr. Ploss, who has an
entitlement to an annual retirement benefit, currently standing at €195,000 and which
increases by €5,000 for each additional full year of service on the board, up to a maximum
amount of €210,000. This entitlement is already vested both contractually and under the
applicable statutory provisions and is secured and financed by the Company in the form of
a pension reinsurance policy pledged to Dr. Ploss. The pension entitlement is required to
be reviewed every three years from the start of payment of the pension in accordance with
the German Company Pension Act (Betriebsrentengesetz) and increased by a percentage
equal to the percentage increase in the consumer price index for Germany as defined by
the German Federal Statistical Office. If Dr. Ploss’s mandate comes to an end, payment of
the pension entitlement begins at the earliest at the age of 60.
184 INFINEON TECHNOLOGIES ANNUAL REPORT 2013
GROUP MANAGEMENT REPORT – OUR 2013 FISCAL YEAR

In accordance with the recommendations incorporated into the new compensation system,
Mr. Asam and Mr. Mittal have both received a defined contribution pension commitment
essentially resembling the Infineon pension plan applicable to all employees (rather than
a defined benefit pension commitment based on years of service under the old system):
The Company has accordingly set up a personal pension account (basic account) for
Mr. Asam and Mr. Mittal and makes annual pension contributions to it. The Company pays
interest on the balance in the basic account annually until disbursement of the pension
begins and may also award surplus credits. The balance of the basic account when disburse-
ment of the pension begins (due to age, invalidity or death) – increased by an adjusting
amount in the event of invalidity or death – constitutes the retirement benefit entitlement
and is paid out to the Board member or his or her surviving dependents in twelve annual
installments, or, if so requested by the Board member, in eight annual installments, as a
lump sum or as life-long pension. Entitlements due to Mr. Asam and Mr. Mittal that have
already vested contractually or under the applicable statutory provisions are also secured
and financed by the Company in the form of pension reinsurance policies pledged to the
relevant Board members.
Performance-related compensation Total compensation
Short Term Incentive
Mid Term Incentive Long TermIncentive ³
Settlement ² For the 2011 – 2013
tranche
For the 2012 – 2014
tranche
For the 2013 – 2015
tranche
362,880 – 98,632 98,663 134,540 178,125 1,832,032
320,320 484,176 106,773 106,773 – 123,200 1,847,707
266,112 – 117,505 98,663 98,663 124,404 1,412,971
320,320 – 106,773 106,773 – 123,200 1,376,757
266,112 – – 98,663 98,663 125,309 1,285,971
240,240 – – 80,080 – 92,400 940,622
– – – – – – –
485,680 734,124 161,893 161,893 – 205,520 2,900,081
895,104 – 216,137 295,989 331,866 427,838 4,530,974
1,366,560 1,218,300 375,439 455,519 – 544,320 7,065,167
185INFINEON TECHNOLOGIES ANNUAL REPORT 2013
CORPORATE GOVERNANCE
COMPENSATION REPORT

The plan rules applicable for Mr. Asam and Mr. Mittal differ in terms of the initial defined
component, the annual transfer to the pension account and the vesting period:
In addition to a one-time, contractually vested initial component of €540,000 paid as
compensation for the loss of vested retirement pension entitlements in connection with
the termination agreement with his previous employer, Mr. Asam will receive from the Com-
pany for each fiscal year of his membership of the Management Board an annual pension
contribution amounting to between 25 and 40 percent, as determined by the Supervisory
Board, of the relevant agreed basic annual salary, i.e. fixed compensation. The pension
contribution for Mr. Asam for the 2013 fiscal year has, as in the previous year, been set at
30 percent of his basic annual salary which amounts to €205,500. Those pension entitle-
ments of Mr. Asam resulting from the defined contributions made become vested on
December 31, 2013, unless Mr. Asam leaves the Management Board before that date.
Mr. Mittal already has a pension entitlement from his previous employment with Infineon
that became vested under the applicable statutory provisions in September 2006. The con-
tract appointing him to the Board specifically states that the amounts made available to
cover his vested pension entitlements represent a continuation of this vested entitlement
(and are therefore not subject to any separate vesting arrangements). The Company makes
a fixed annual pension contribution on behalf of Mr. Mittal for each full fiscal year of service
on the Board, equivalent to 30 percent of the relevant agreed basic annual salary; the
Supervisory Board is not required to decide each time on the amount to be contributed.
The pension contribution for the 2013 fiscal year amounted to €205,500.
The amounts credited to the pension entitlement accounts of Mr. Asam and Mr. Mittal – in
line with the plan rules applied to Infineon employees – are paid out on or after reaching
the age of 67, provided the service contract has also ended, or, on request, at an earlier
point in time if the service contract ends on or after reaching the age of 60. If the bene-
ficiaries elect their pension to be paid out in monthly installments, the pension amount is
adjusted automatically each year in accordance with the Infineon pension plan.
A total of €524,632 (2012: €247,956) was expensed and added to the pension provision
in the 2013 fiscal year in accordance with IFRS for pension entitlements for the serving
members of the Management Board (excluding interest cost). In accordance with IFRS, the
pension-related personnel expense for the current fiscal year is determined at the beginning
of the fiscal year concerned. The increase in personnel expense in the 2013 fiscal year is
primarily attributable to the different interest rates used at the relevant measurement dates
(5.0 percent at September 30, 2011, compared to 3.5 percent at September 30, 2012) and
to the inclusion of the full-year effect of changes in Mr. Mittal’s pension entitlement following
his appointment to the board.
186 INFINEON TECHNOLOGIES ANNUAL REPORT 2013
GROUP MANAGEMENT REPORT – OUR 2013 FISCAL YEAR

The following overview shows the annual pension entitlements at the beginning of retirement
and corresponding pension contributions for the Management Board members serving in
the 2013 fiscal year on the basis of the entitlements already acquired:
Pension entitlement
in €
Management Board member
Fiscal Year Pension entitlements
(annual) as of beginning of
pension period
Agreed pension
contributions for the
respective fiscal year
Present value of pension
entitlement
Expenses in connection
with increase in pension
provision (excluding
interest expense)
Dr. Reinhard Ploss (CEO)
2013 195,000 – 4,037,092 148,302
2012 190,000 – 3,853,093 112,560
Dominik Asam ¹
2013 – 205,500 1,161,739 211,352
2012 – 205,500 979,836 111,491
Arunjai Mittal ¹ (since January 1, 2012)
2013 – 205,500 1,859,479 164,978
2012 – 154,125 1,753,419 23,905
Peter Bauer (until September 30, 2012)
2013 – – – –
2012 450,000 – 7,984,810 –
Total
2013 195,000 411,000 7,058,310 524,632
2012 640,000 359,625 14,571,158 247,956
1 Defined contribution pension commitment in accordance with the new compensation system approved in 2010.
With the exception of the contractually vested initial component, the pension entitlements of Mr. Asam become vested
after three years from the date on which he took up his position.
Early termination of service contract
The service contracts of members of the Management Board include a change-of-control
clause, which stipulates the terms that apply when the activities of a Board member
are terminated in the event of a significant change in Infineon’s ownership structure.
A change of control for the purposes of this clause occurs when a third party, individually
or together with another party, acquires at least 30 percent of the voting rights in Infineon
Technologies AG as defined in section 30 of the German Securities Acquisition and Take-
over Act (“Wertpapiererwerbs- und Übernahmegesetz”). Management Board members have
the right to resign and terminate their contracts within twelve months of the announce-
ment of such a change of control and any that choose to do so are entitled to continued
payment of their annual remuneration for the full remaining duration of their contract up to
a maximum of 36 months. If Infineon Technologies AG removes a member of the Manage-
ment Board or terminates his or her contract within twelve months of the announcement of
a change of control, the Management Board members concerned are entitled to continued
payment of the annual remuneration for the full remaining duration of the contract subject
to a minimum period of 24 months and a maximum period of 36 months.
The Management Board service contracts otherwise contain no promises of severance pay
for situations in which contracts are terminated early.
Payments to former members of the Management Board in the 2013 fiscal year
Former members of the Management Board received total payments of €1,097,095
(primarily pension payments) in the 2013 fiscal year (2012: €1,058,912). As of Septem-
ber 30, 2013, pension liabilities for former members of the Management Board amount
to €47,929,138 (2012: €42,192,107). The main reason for the increase is the inclusion
here of the pension liability to Mr. Bauer, which was reported in the 2012 fiscal year within
pension liabilities to active members of the Management Board.
In agreement with the Supervisory Board, Mr. Bauer continued to make use of the Com-
pany’s security services free of charge and at the previous level for a further year after
leaving office as CEO, i.e. until September 30, 2013. The income tax expense resulting from
this benefit was borne by Mr. Bauer.
187INFINEON TECHNOLOGIES ANNUAL REPORT 2013
CORPORATE GOVERNANCE
COMPENSATION REPORT

Mr. Bauer did not receive any service fees relating to the consultancy agreement concluded
on November 26, 2012, by him and the Company after prior approval by the Supervisory
Board. Costs arising in association with the consultancy services rendered were reimbursed
to Mr. Bauer.
Review of Management Board compensation; changes to Management Board
compensation system and individual service contracts
Review of Management Board compensation system and individual compensation
In accordance with section 4.2.2 DCGK, the Supervisory Board shall engage an external
independent compensation expert to review the appropriateness of the Management Board
compensation system. The most recent review of the system, which has been in place at
Infineon since October 1, 2010, was performed during the 2012 fiscal year. The next review
is scheduled to take place in the 2014 fiscal year, at which stage the target annual income
of each individual Management Board member will be subjected to detailed scrutiny.
Introduction of new long-term incentive (LTI);
changes to Management Board service contracts
At its meeting on August 7, 2012, the Supervisory Board decided on a new long-term
incentive (LTI) – the “Performance Share Plan” – that will come into force with effect from
the 2014 fiscal year. In agreement with Dr. Ploss, Mr. Asam and Mr. Mittal, the Board mem-
ber’s service contracts were amended accordingly in November 2012. In February 2013,
the Annual General Meeting in accordance with section 120, paragraph 4, AktG approved
the new Management Board compensation system (changed only with respect to the LTI)
with a large majority. As well as being relevant for Management Board members, the new
LTI will also apply with effect from the beginning of the 2014 fiscal year for Infineon senior
executives worldwide, thus aligning the interests of the Management Board and its manage-
ment team with respect to the long-term compensation component.
For details of the new Performance Share Plan, see “Components of the Management Board
compensation system” above.
Changes to the DCGK; further changes to Management Board service contracts
A number of changes made to the DCGK in May 2013 also relate to Management Board
compensation:
Firstly, the new version of the DCGK now requires all variable compensation components
as well as the total compensation to be subject to upper limits (caps). In this context, the
Supervisory Board resolved in August 2013 that any compensation component awarded to
a Management Board member by the Supervisory Board in a single fiscal year – hitherto the
last compensation component at Infineon not to have been subject to a cap – may not exceed
30 percent of the fixed basic annual salary of the relevant Management Board member;
this also applies in the case of a mutually agreed termination of a service contract. All Board
members agreed to corresponding changes in their service contracts.
Secondly, the new version of the DCGK requires an even more comprehensive and differen-
tiated “vertical comparison” of the compensation than is currently stipulated under German
stock corporation law. In deciding on the Management Board compensation, the Super-
visory Board is required to particularly consider the relationship between the compensation
of the Management Board and that of senior management and the staff overall, also in
terms of its development over time. The Supervisory Board deliberated on this matter at its
meeting in August 2013 and came to the conclusion that no changes were required to the
Management Board’s service contracts.
Thirdly, the DCGK now stipulates that the Supervisory Board should establish the level of
pension provision aimed at for each Management Board member – including consideration
of the length of service on the board – and take into account the resulting annual and
long-term expense for the entity. The Supervisory Board also concluded in August 2013
that existing pension arrangements conform to the DCGK; no changes were required to the
Management Board’s service contracts.
188 INFINEON TECHNOLOGIES ANNUAL REPORT 2013
GROUP MANAGEMENT REPORT – OUR 2013 FISCAL YEAR

Supervisory Board compensation
Compensation structure
The Supervisory Board compensation system was subject to a thorough review in the
2010 fiscal year and came into force with (retrospective) effect from October 1, 2010, in
line with a proposal put forward by the Management Board and Supervisory Board to the
Annual General Meeting on February 17, 2011. Compensation paid to the Supervisory
Board takes into account the responsibilities and scope of tasks of the members of the
Supervisory Board as well as Infineon’s economic position and performance. The compen-
sation due to the Supervisory Board in each fiscal year (total compensation) is governed
by section 11 of the Company’s Articles of Association and comprises three components:
> Fixed compensation (basic remuneration) of €50,000. This amount applies to each
Supervisory Board member and is payable within one month of the close of the fiscal year;
> A variable compensation component amounting to €1,500 for every €0.01 by which
earnings per share exceed a minimum threshold of €0.30, where this minimum threshold
is increased by €0.03 every year with the first increase taking effect for the fiscal year
beginning October 1, 2011; the minimum threshold therefore amounted to €0.36 for
the 2013 fiscal year. The variable compensation component is determined in each case
on the basis of the basic (undiluted) earnings per share from continuing operations
determined in accordance with the pertinent financial reporting regulations. The variable
compensation component is limited to €50,000 per fiscal year. It also applies to each
Supervisory Board member and falls due for payment once the Annual General Meeting
following the fiscal year to which the compensation relates has ended;
> An allowance recognizing the additional work involved in performing certain functions
within the Supervisory Board: The Chairman of the Supervisory Board receives an allow-
ance of €50,000, each Vice-Chairman receives an allowance of €37,500, the Chairman
of the Investment, Finance and Audit Committee and the Chairwoman of the Strategy
and Technology Committee each receive an allowance of €25,000 and each member of a
Supervisory Board committee – with the exception of the Nomination Committee and the
Mediation Committee – receives an allowance of €15,000. The additional allowance is
payable only if the body to which the Supervisory Board or committee member belongs has
convened or passed resolutions in the fiscal year concerned. A member of the Supervisory
Board performing more than one of the functions indicated receives only the highest
single additional allowance payable to a member performing the functions concerned.
The allowance is paid to the relevant holder of office within one month of the close of
the fiscal year.
In the event that a member, during a fiscal year, joins (or leaves) the Supervisory Board or
one of its committees or takes on a Supervisory Board function for which an allowance is
paid, the relevant compensation components are given on a pro-rata basis.
As part of the total compensation, the Company additionally grants each member of the
Supervisory Board a meeting attendance fee of €2,000 in respect of each meeting of the
Supervisory Board or one of its committees attended in person. The meeting attendance fee
is paid only once in cases in which more than one meeting is held on a given day.
Members of the Supervisory Board, moreover, are reimbursed for all expenses incurred in
connection with the performance of their Supervisory Board duties and for any value-added
tax to be charged to them in this connection. The Company also pays any value-added tax
incurred on their total compensation and meeting attendance fees for the members of the
Supervisory Board.
189INFINEON TECHNOLOGIES ANNUAL REPORT 2013
CORPORATE GOVERNANCE
COMPENSATION REPORT

Compensation of the Supervisory Board for the 2013 fiscal year
The total compensation (including meeting attendance fees) paid to the individual members
of the Supervisory Board on a pro-rata basis for their service on the Supervisory Board
and on a Supervisory Board committee for the 2013 fiscal year comprises the following
(these figures do not include value-added tax at 19 percent):
Compensation of the Supervisory Board
In €
Supervisory Board member
Fiscal year Fixed compen-
sation
Variable compen -
sation ¹
Allowance for specific
functions
Meeting attendance
fees
Total compen-
sation
Wigand Cramer 2013 50,000 – 15,000 24,000 89,000
2012 50,000 10,500 15,000 22,000 97,500
Alfred Eibl 2013 50,000 – 15,000 18,000 83,000
2012 50,000 10,500 15,000 18,000 93,500
Peter Gruber 2013 50,000 – 15,000 18,000 83,000
2012 50,000 10,500 15,000 18,000 93,500
Gerhard Hobbach 2013 50,000 – 15,000 16,000 81,000
2012 50,000 10,500 15,000 24,000 99,500
Hans-Ulrich Holdenried 2013 50,000 – 15,000 22,000 87,000
2012 50,000 10,500 15,000 26,000 101,500
Prof. Dr. Renate Köcher 2013 50,000 – – 12,000 62,000
2012 50,000 10,500 – 8,000 68,500
Wolfgang Mayrhuber 2013 50,000 – 50,000 28,000 128,000
2012 50,000 10,500 50,000 32,000 142,500
Manfred Puffer 2013 50,000 – – 16,000 66,000
2012 50,000 10,500 – 18,000 78,500
Gerd Schmidt 2013 50,000 – 37,500 24,000 111,500
2012 50,000 10,500 37,500 26,000 124,000
Prof. Dr. Doris Schmitt-Landsiedel
2013 50,000 – 25,000 18,000 93,000
2012 50,000 10,500 25,000 18,000 103,500
Jürgen Scholz 2013 50,000 – 15,000 16,000 81,000
2012 50,000 10,500 15,000 18,000 93,500
Dr. Eckart Sünner 2013 50,000 – 25,000 20,000 95,000
2012 50,000 10,500 25,000 20,000 105,500
Total 2013 600,000 – 227,500 232,000 1,059,500
2012 600,000 126,000 227,500 248,000 1,201,500
1 Based on earnings per share of €0.25 in 2013 and €0.40 in 2012.
Members of the Supervisory Board did not receive any loans from Infineon either in the
2013 or 2012 fiscal year.
190 INFINEON TECHNOLOGIES ANNUAL REPORT 2013
GROUP MANAGEMENT REPORT – OUR 2013 FISCAL YEAR

Other matters (2013 fiscal year)
As a precaution and in accordance with section 114 AktG, in November 2010 the Super-
visory Board approved a contract between the Company and the Technische Universität
München (Institute for Technical Electronics headed by Prof. Dr. Schmitt-Landsiedel) for the
performance of research and development work on the topic of “Sensing for Automotive
Applications”. The contract ran until September 30, 2013. In accordance with the terms
of the contract, an amount of €45,000 was paid by the Company to the TU München in the
2013 fiscal year. The Company and the Technische Universität München are currently in
negotiations concerning a renewal of the contract.
In May 2011 the Company concluded a contract with Prof. Dr. Wucherer, a former member
of the Supervisory Board which – unless terminated prematurely – runs to the beginning
of 2015. The subject of the contract is the rendering of general and project-related advisory
services to the Strategy and Technology Committee. The contract provides for an annual
flat-rate fee of €20,000, which was also incurred in the 2013 fiscal year for the services
provided by Prof. Dr. Wucherer during this time.
Neubiberg, November 2013
Management Board
Dr. Reinhard Ploss Dominik Asam Arunjai Mittal
191INFINEON TECHNOLOGIES ANNUAL REPORT 2013
CORPORATE GOVERNANCE
COMPENSATION REPORT

INFINEON TECHNOLOGIES ANNUAL REPORT 2013
CONSOLIDATED FINANCIAL STATEMENTS192
CONSOLIDATED FINANCIAL STATEMENTS

193
GROUP MANAGEMENT REPORT
OUR 2013 FISCAL YEAR
GROUP MANAGEMENT REPORT
THE INFINEON GROUP
CONSOLIDATED
FINANCIAL STATEMENTS
194 CONSOLIDATED STATEMENT OF OPERATIONS
195 CONSOLIDATED STATEMENT OF COMPREHENSIVE INCOME
196 CONSOLIDATED STATEMENT OF FINANCIAL POSITION
198 CONSOLIDATED STATEMENT OF CASH FLOWS
200 CONSOLIDATED STATEMENT OF CHANGES IN EQUITY
202 NOTES TO THE CONSOLIDATED FINANCIAL STATEMENTS
INFINEON TECHNOLOGIES ANNUAL REPORT 2013
CONSOLIDATED FINANCIAL STATEMENTS

INFINEON TECHNOLOGIES ANNUAL REPORT 2013
CONSOLIDATED FINANCIAL STATEMENTS194
€ in millions Notes 2013 2012
Revenue 3,843 3,904
Cost of goods sold (2,520) (2,477)
Gross profit 1,323 1,427
Research and development expenses (525) (455)
Selling, general and administrative expenses (440) (475)
Other operating income 8 19 25
Other operating expense 8 (52) (67)
Operating income 325 455
Financial income 9 30 38
Financial expense 10 (51) (61)
Gain (loss) from investments accounted for using the equity method 19 2 (1)
Income from continuing operations before income taxes 306 431
Income tax 11 (23) 1
Income from continuing operations 283 432
Loss from discontinued operations, net of income taxes 5 (11) (5)
Net income 272 427
Attributable to:
Non-controlling interests – –
Shareholders of Infineon Technologies AG 272 427
Basic earnings per share (in euro) attributable to shareholders of Infineon Technologies AG:
Basic earnings per share (in euro) from continuing operations 12 0.26 0.40
Basic earnings per share (in euro) from discontinued operations 12 (0.01) –
Basic earnings per share (in euro) 12 0.25 0.40
Diluted earnings per share (in euro) attributable to shareholders of Infineon Technologies AG:
Diluted earnings per share (in euro) from continuing operations 12 0.26 0.39
Diluted earnings per share (in euro) from discontinued operations 12 (0.01) –
Diluted earnings per share (in euro) 12 0.25 0.39
CONSOLIDATED STATEMENT OF OPERATIONS for the year ended September 30, 2013

195
€ in millions 2013 2012
Net income 272 427
Other comprehensive income
Items that may be reclassified subsequently to profit or loss:
Actuarial gains (losses) on pension plans and similar commitments 20 (112)
Currency translation effects (12) 10
Net change in fair value of hedging instruments (7) 8
Total items that may be reclassified subsequently to profit or loss 1 (94)
Other comprehensive income (loss) for the year, net of tax 1 (94)
Total comprehensive income for the year, net of tax 273 333
Attributable to:
Non-controlling interests – –
Shareholders of Infineon Technologies AG 273 333
CONSOLIDATED STATEMENT OF COMPREHENSIVE INCOME for the year ended September 30, 2013
INFINEON TECHNOLOGIES ANNUAL REPORT 2013
CONSOLIDATED STATEMENT OF COMPREHENSIVE INCOME

INFINEON TECHNOLOGIES ANNUAL REPORT 2013
CONSOLIDATED FINANCIAL STATEMENTS196
€ in millions Notes 2013 2012
ASSETS:
Current assets:
Cash and cash equivalents 527 425
Financial investments 13 1,759 1,810
Trade and other receivables 14 571 539
Inventories 15 609 567
Income tax receivable 12 6
Other current financial assets 16 9 9
Other current assets 17 136 149
Assets classified as held for sale 5 – 5
Total current assets 3,623 3,510
Property, plant and equipment 18 1,600 1,731
Goodwill and other intangible assets 22 170 146
Investments accounted for using the equity method 19 34 32
Deferred tax assets 11 325 315
Other financial assets 20 116 124
Other assets 21 37 40
Total non-current assets 2,282 2,388
Total assets 5,905 5,898
CONSOLIDATED STATEMENT OF FINANCIAL POSITION as of September 30, 2013

197INFINEON TECHNOLOGIES ANNUAL REPORT 2013
CONSOLIDATED STATEMENT OF FINANCIAL POSITION
€ in millions Notes 2013 2012
LIABILITIES AND EQUITY:
Current liabilities:
Short-term debt and current maturities of long-term debt 27 134 55
Trade and other payables 23 574 622
Current provisions 24 675 710
Income tax payable 62 69
Other current financial liabilities 25 12 100
Other current liabilities 26 137 122
Total current liabilities 1,594 1,678
Long-term debt 27 169 240
Pension plans and similar commitments 35 246 293
Deferred tax liabilities 11 4 4
Long-term provisions 24 46 30
Other financial liabilities 28 7 8
Other liabilities 29 63 70
Total non-current liabilities 535 645
Total liabilities 2,129 2,323
Shareholders’ equity: 30
Ordinary share capital 2,162 2,160
Additional paid-in capital 5,549 5,674
Accumulated deficit (3,907) (4,199)
Other reserves 9 28
Own shares (37) –
Put options on own shares – (88)
Equity attributable to shareholders of Infineon Technologies AG 3,776 3,575
Total liabilities and equity 5,905 5,898

INFINEON TECHNOLOGIES ANNUAL REPORT 2013
CONSOLIDATED FINANCIAL STATEMENTS198
€ in millions Note 2013 2012
33
Net income 272 427
Plus: net loss from discontinued operations, net of income taxes 11 5
Adjustments to reconcile net income to net cash provided by operating activities:
Depreciation and amortization 466 428
Income tax expenses (benefit) 23 (1)
Net interest result 21 22
Provision for doubtful accounts (8) 5
Losses (gains) on disposals of property, plant and equipment (1) 1
Loss (gain) from investments accounted for using the equity method (2) 1
Impairment charges 19 28
Share-based compensation 3 2
Change in trade and other receivables (34) 51
Change in inventories (44) (62)
Change in other current assets 21 (14)
Change in trade and other payables (45) (96)
Change in provisions (19) (78)
Change in other current liabilities 15 (20)
Change in other assets and liabilities (37) (34)
Interest received 14 36
Interest paid (12) (15)
Income tax paid (53) (19)
Net cash provided by operating activities from continuing operations 610 667
Net cash used in operating activities from discontinued operations (9) (28)
Net cash provided by operating activities 601 639
CONSOLIDATED STATEMENT OF CASH FLOWSfor the year ended September 30, 2013

199INFINEON TECHNOLOGIES ANNUAL REPORT 2013
CONSOLIDATED STATEMENT OF CASH FLOWS
€ in millions Note 2013 2012
Purchases of financial investments (1,340) (2,369)
Proceeds from sales of financial investments 1,387 2,242
Purchases of intangible assets and other assets (63) (58)
Purchases of property, plant and equipment (315) (832)
Proceeds from sales of property, plant and equipment and other assets 3 4
Net cash used in investing activities from continuing operations (328) (1,013)
Net cash used in investing activities from discontinued operations (1) (12)
Net cash used in investing activities (329) (1,025)
Net change in related party financial receivables and payables (1) –
Proceeds from issuance of long-term debt 52 70
Repayments of long-term debt (51) (67)
Repurchase of convertible subordinated bonds – (62)
Proceeds from issuance of ordinary shares 2 2
Purchases of own shares (38) (20)
Proceeds from the issuance of put options on own shares – 8
Dividend payments (129) (130)
Net cash used in financing activities from continuing operations (165) (199)
Net cash provided by financing activities from discontinued operations – –
Net cash used in financing activities (165) (199)
Net increase (decrease) in cash and cash equivalents 107 (585)
Effect of foreign exchange rate changes on cash and cash equivalents (5) 3
Cash and cash equivalents at beginning of period 425 1,007
Cash and cash equivalents at end of period 527 425

INFINEON TECHNOLOGIES ANNUAL REPORT 2013
CONSOLIDATED FINANCIAL STATEMENTS200
€ in millions, except for number of shares Note Ordinary shares issued Additional paid-in capital
Accumulated deficit
Shares
Amount
30
Balance as of October 1, 2011 1,086,745,835 2,173 5,854 (4,514)
Net income – – – 427
Other comprehensive income (loss) for the period, net of tax – – – (112)
Total comprehensive income (loss) for the period, net of tax – – – 315
Dividends – – (130) –
Issuance/cancellation of ordinary shares:
Exercise of stock options 560,497 1 1 –
Cancellation of own shares (7,000,000) (14) (32) –
Share-based compensation – – 2
Purchase of own shares – – – –
Put options on own shares – – 10 –
Other changes in equity – – (31) –
Balance as of September 30, 2012 1,080,306,332 2,160 5,674 (4,199)
Balance as of October 1, 2012 1,080,306,332 2,160 5,674 (4,199)
Net income – – – 272
Other comprehensive income (loss) for the period, net of tax – – – 20
Total comprehensive income (loss) for the period, net of tax – – – 292
Dividends – – (129) –
Issuance of ordinary shares:
Exercise of stock options 776,702 2 1 –
Share-based compensation – – 3 –
Purchase of own shares – – – –
Put options on own shares – – – –
Balance as of September 30, 2013 1,081,083,034 2,162 5,549 (3,907)
CONSOLIDATED STATEMENT OF CHANGES IN EQUITY for the year ended September 30, 2013

201INFINEON TECHNOLOGIES ANNUAL REPORT 2013
CONSOLIDATED STATEMENT OF CHANGES IN EQUITY
Other reserves Own shares
Put options on own shares
Total equity attributable to
shareholders of Infineon
Technologies AG
Non-controlling interests
Total equity
Foreign currency
translation adjustment
Unrealized gains (losses) on securities
Unrealized gains (losses)
on cash flow hedge
16 3 (9) (26) (142) 3,355 – 3,355
– – – – – 427 – 427
10 – 8 – – (94) – (94)
10 – 8 – – 333 – 333
– – – – – (130) – (130)
– – – – – 2 – 2
– – – 46 – – – –
– – – – – 2 – 2
– – – (20) – (20) – (20)
– – – – 54 64 – 64
– – – – – (31) – (31)
26 3 (1) – (88) 3,575 – 3,575
26 3 (1) – (88) 3,575 – 3,575
– – – – – 272 – 272
(12) – (7) – – 1 – 1
(12) – (7) – – 273 – 273
– – – – – (129) – (129)
– – – – – 3 – 3
– – – – – 3 – 3
– – – (37) – (37) – (37)
– – – – 88 88 – 88
14 3 (8) (37) – 3,776 – 3,776

InfIneon TechnologIes AnnuAl RepoRT 2013CONsOlidated fiNaNCial statemeNts
202
noTes To The consolIDATeD fInAncIAl sTATeMenTs
The Infineon group (“Infineon” or “the Infineon group”) comprising Infineon Technologies Ag (“the company”) and its subsidiaries design, develop, manufacture and market a broad range of semiconductors and systems solutions. The focus of activities is on automotive electronics, industrial electronics and chip-card based security. Infineon products are also used in a wide variety of microelectronic applications, for example in computer systems, telecommunications systems and consumer goods. The product range comprises standard components, customer-specific solutions for devices and systems, specific components for digital, analog, and mixed-signal applications as well as embedded, non-volatile memories. Most of Infineon’s revenue is generated by power semiconductors, the remainder by embedded control products (microcontroller designs adapted to the specific requirements of the application) and other product categories. Infineon’s operations, investments and customers are located mainly in europe, Asia and north America.
Infineon Technologies Ag is a listed company under german law and ultimate parent company of the Infineon group. The principal office of the company is Am campeon 1– 12, 85579 neubiberg (germany). The company is registered in the commercial Register of the District court of Munich under the number hRB 126492.
1 Basis of financial statements
The consolidated financial statements prepared by Infineon Technologies Ag as ultimate parent company for the year ended september 30, 2013, have been prepared in accordance with International financial Reporting standards (“IfRs”) and related Interpretations effective as of september 30, 2013 as issued by the International Accounting standards Board (“IAsB”) to the extent at which IfRs and Interpretations have been adopted by the european union (“eu”). The consolidated financial statements also comply with the supplementary require-ments set forth in section 315a paragraph 1 of the german commercial code (“handelsgesetzbuch” or “hgB”).
The fiscal year end for Infineon and the company is september 30.
The requirements of the standards applied have been complied with in full and convey a true and fair view of the net assets, financial position and results of operations of the Infineon group.
Infineon’s accounting policies are described in notes 2 and 3.
The consolidated financial statements comprise the consolidated statement of operations, consolidated statement of comprehensive Income, consolidated statement of financial position, consolidated statement of cash flows, consolidated statement of changes in equity and notes to the consolidated financial statements. The consolidated statement of operations is presented using the cost of sales method.
The accounting and valuation policies used, as well as the explanatory comments and disclosures made in the IfRs consolidated financial statements for the 2013 fiscal year are based, as a general rule, on those used in the consolidated financial statements for the year ended september 30, 2012.
certain prior year figures for items in the in the consolidated statement of operations and the consolidated statement of financial position have been adjusted in the notes to the consolidated financial statements to bring them in line with the presentation in the 2013 fiscal year. These have no effect on the disclosure of items in the consolidated statement of operations and the consolidated statement of financial position.
All amounts herein are shown in euro (or “€”) except where otherwise stated. Deviations between amounts presented are possible due to rounding. negative amounts are presented in parentheses.
The company’s Management Board approved the consolidated financial statements on november 19, 2013, for submission to the company’s supervisory Board.

203INFINEON TECHNOLOGIES ANNUAL REPORT 2013
NOTES TO THE CONSOLIDATED FINANCIAL STATEMENTS
Financial reporting rules applied for the first time
The IASB has issued the following Standards or amendments to Standards, which are required to be applied
in Consolidated Financial Statements for the year ended September 30, 2013 and which have an impact on
Infineon’s Consolidated Financial Statements:
> Amendment to IAS 1 “Presentation of Financial Statements – Presentation of Items of Other Comprehensive
Income” (effective date: July 1, 2012). The amendment requires that in future a distinction is made in the
Statement of Comprehensive Income between those items of Other Comprehensive Income which have been
or may be transferred to the Statement of Operations, and those that have not or will not be.
Financial reporting rules issued not yet adopted
The following new or amended Standards have been issued recently by the IASB and will be relevant to
Infineon from today’s perspective. They have not been applied in the Consolidated Financial Statements as of
September 30, 2013 since they are not yet mandatory or, alternatively, have not yet been endorsed by the EU.
The new or amended Standards are applicable for fiscal years beginning on or after their effective date. As a
general rule, they are not adopted before their effective date, even if this is permitted for certain Standards:
> “Improvements to IFRS (2011)” (effective date: January 1, 2013). The release brings together numerous
smaller changes to existing standards resulting from an annual program of improvements to IFRS. The appli-
cation of this change will have no significant impact on the Consolidated Financial Statements.
> IFRS 13 “Fair Value Measurement” (effective date: January 1, 2013). The Standard sets out in a single IFRS
a framework for measuring fair value, including a definition of the term and a description of the methods
that can be used to measure it. It also expands the disclosures about fair value measurement. The application
of this standard will have no significant impact on the Consolidated Financial Statements.
> Amendment to IAS 19 “Employee Benefits” (effective date: January 1, 2013). The changes relate to the
recognition and measurement of the cost of defined benefit pension plans and termination benefits. Among
other measures, the amendment affects the calculation of the expected return on plan assets, which in future
must be based on the discount rate. It also withdraws the option to recognize actuarial gains and losses over
time and requires that actuarial gains and losses are recognized immediately in other comprehensive income.
Since Infineon already recognizes actuarial gains and losses on defined benefit pension plans immediately
in other comprehensive income, this change will have no effect on the Consolidated Financial Statements.
As a result of the change of definition of termination benefits, agreed supplemental contributions paid within
the framework of the partial retirement program are disclosed as Other Long Term Employee Benefits from
now on. As a result, supplemental payments will no longer be recognised at the point at which the partial
retirement agreement is concluded, instead they will be recognised using the Block Model pro-rata over the
working phase. Neither the future calculation of the return on plan assets using the discount rate applicable
to the pension obligations at the beginning of the period, nor the changed accounting for termination benefits
will have a significant effect on the Consolidated Financial Statements.
> Amendment to IFRS 7 “Financial Instruments: Disclosures – Offsetting Financial Assets and Financial
Liabilities” (effective date: January 1, 2013). The amendment requires additional disclosures on offsetting
rights. In addition to extended disclosures on offsetting activities actually carried out pursuant to IAS 32,
in the future disclosure is required on existing rights to offset, regardless of whether the offsetting is
actually carried out. The application of this standard will have no significant impact on the Consolidated
Financial Statements.

INFINEON TECHNOLOGIES ANNUAL REPORT 2013
CONSOLIDATED FINANCIAL STATEMENTS204
> Amendment to IAS 32 “Financial Instruments: Presentation – Offsetting Financial Assets and Financial
Liabilities” (effective date: January 1, 2014). The standard reinforces the previously defined requirements
for offsetting financial assets and financial liabilities in the Statement of Financial Position, whilst retaining
the previous offsetting model in IAS 32. To meet the new offsetting requirements an entity’s right to offset
must not be contingent on a future event and must be currently enforceable. It is further clarified that a gross
settlement system also complies with the offsetting requirements according to IAS 32. The application of
this revised standard will have no significant impact on the Consolidated Financial Statements.
> IFRS 10 “Consolidated Financial Statements”, IFRS 11 “Joint Arrangements” and IFRS 12 “Disclosure of
Interests in Other Entities” (effective date: January 1, 2013; postponement of effective date for EU companies
to January 1, 2014). These new Standards introduce a uniform consolidation model which sets out the criterion
of control as the basis for the consolidation of any kind of entity. Additionally the bases for the financial
reporting for joint arrangements are set out, and the existing disclosure requirements for subsidiaries, joint
ventures, associated companies and non consolidated entities are summarised, expanded and replaced.
As a result of these new IFRS Standards, the IASB has re-worked and renamed IAS 27 “Separate Financial
Statements” and IAS 28 “Investments in Associates and Joint Ventures”. The application of these standards
will have no significant impact on the Consolidated Financial Statements.
> IFRS 9 “Financial Instruments” (effective date: January 1, 2015). This Standard implements the first phase
of a three-phase project to replace IAS 39 “Financial Instruments: Recognition and Measurement” and
governs the classification and measurement of financial assets and financial liabilities. In the future financial
assets are to be measured either at amortized cost or at fair value. The requirements for classification and
measurement of financial liabilities are carried forward unchanged from IAS 39 apart from modifications to
the requirements relating to the consideration of an entity’s own credit risk in connection with the exercise
of fair value options. The two further phases of the project concerning impairment and hedge accounting
are currently being revised by the IASB. Infineon is currently analysing the impact of this change on the
Consolidated Financial Statements.
A number of other Standards and Interpretations have been issued, which, from today’s perspective, are not
expected to have any impact on the Consolidated Financial Statements.
2 Summary of significant accounting policies
The Consolidated Financial Statements have been drawn up using the following consolidation, accounting
and valuation principles:
Basis of consolidation
The accompanying Consolidated Financial Statements include the financial statements of Infineon Technologies AG
and its direct and indirect subsidiaries on a consolidated basis. A subsidiary is defined as an entity which,
directly or indirectly, is controlled by Infineon Technologies AG. Control is the possibility to govern the financial
and operating policies of an entity so as to obtain benefits from its activities. An indication of this is the control
of the majority of voting rights; in this context, any potential voting rights must also be taken into account for
the purposes of assessing control.
An entity is included in the Consolidated Financial Statements from the date on which Infineon has the right
to control the entity concerned (acquisition date). Upon first-time consolidation of an entity, the acquired
assets and liabilities are measured on the basis of their fair value at the acquisition date. Any excess of cost of
acquisition over the share of the fair value of acquired assets, liabilities and contingent liabilities is recognized
as goodwill. Any excess of Infineon’s share of the fair value of items acquired over cost of acquisition is recog-
nized as a gain.

205INFINEON TECHNOLOGIES ANNUAL REPORT 2013
NOTES TO THE CONSOLIDATED FINANCIAL STATEMENTS
The financial statements of entities included in the Consolidated Financial Statements are prepared using
uniform valuation and accounting policies. The effect of intragroup transactions on assets and liabilities as well
as unrealized gains and losses arising from intragroup relationships are eliminated on consolidation.
Infineon deconsolidates a subsidiary when it loses control over the financial and operating policies of the
entity and no longer benefits from the entity’s activities. Examples of the loss of control are the full or partial
sale of shares in a subsidiary, the relinquishing of voting rights or the opening of insolvency proceedings
against the subsidiary.
A list of subsidiaries of Infineon Technologies AG is provided in note 42.
Investments accounted for using the equity method
Investments in associated companies and joint ventures (as defined below) are accounted for using the equity
method (combined: “Investments Accounted for Using the Equity Method”).
(a) Associated companies
An “associated company” is an entity in which Infineon has significant influence, but not a controlling interest,
over the operating and financial management policy decisions of the entity. Significant influence is generally
presumed when Infineon holds between 20 percent and 50 percent of the voting rights.
(b) Joint ventures
A “joint venture” is a contractual arrangement whereby two or more parties undertake an economic activity that
is subject to joint control.
Equity method
Under the equity method, the initial investment in an associated company or joint venture is recognized at cost
and this carrying amount is increased or decreased at each subsequent reporting date for the share of profits
or losses, dividends paid and other changes in equity of the associated company or joint venture, to the extent
that they relate to Infineon’s share of the investment.
Goodwill arising from the acquisition of an associated company or joint venture is included in the carrying
amount of the investment (net of accumulated impairment losses). Impairment losses in excess of Infineon’s
carrying amount of the investment in the entity are charged against other assets held by Infineon related to
the investment, such as intercompany loans or other receivables. If the carrying amount of the investment and
of other assets related to the investment are written down to zero, it must be determined whether there are
additional losses to be recognized, to the extent that Infineon has an obligation to fund such losses.
Gains and losses on transactions between Infineon and entities accounted for using the equity method are
eliminated to the extent of Infineon’s interest in the equity method investee.
When an equity method investee’s fiscal year end differs by no more than three months from the Company’s
fiscal year end, the Company’s share of the profit or loss of the respective company is recognized with a time lag.

INFINEON TECHNOLOGIES ANNUAL REPORT 2013
CONSOLIDATED FINANCIAL STATEMENTS206
Other equity investments
Other equity investments, where the Company has an ownership interest in the entity of less than 20 percent,
are recorded at cost less any necessary write-downs for impairment if a fair value cannot be reliably determined.
Reporting currency and foreign currency translation
The currency of the primary economic environment in which an entity operates and normally generates
and expends cash is considered to be the functional currency of that entity. The functional currency of
Infineon Technologies AG is the euro. The Consolidated Financial Statements have been prepared in euros.
As a rule the functional currency of foreign subsidiaries corresponds either to the local currency or the euro.
Foreign currency transactions are translated into the functional currency of the relevant entity using the exchange
rates prevailing at the transaction date. Monetary assets and liabilities which are not denominated in the
functional currency of the entity accounting for such items are translated at the closing exchange rate prevailing
at the end of the relevant reporting period. Exchange rate gains and losses from the currency translation are
recognized in the Consolidated Statement of Operations as part of the operating result.
The assets and liabilities of foreign subsidiaries with functional currencies other than the euro are translated
into euros using period-end exchange rates. Income and expenses of these entities are translated using the
average exchange rate for the period under report. Gains and losses arising from the difference between the
exchange rates used to translate assets and liabilities in the current and previous periods are recognized
directly in equity and reported as a component of “Other Reserves” within equity.
The exchange rates of the primary currencies (€1.00 quoted in currencies specified below) used in the
preparation of the accompanying Consolidated Financial Statements are as follows:
€1 in units of foreign currency Closing rate Annual average exchange rate
September 30, 2013 September 30, 2012 2013 2012
Japanese yen 133.4100 99.8200 121.0254 102.5161
Malaysian ringgit 4.3391 3.9611 4.1016 4.0449
Singapore dollar 1.6947 1.5844 1.6359 1.6413
US dollar 1.3499 1.2845 1.3119 1.3004

207INFINEON TECHNOLOGIES ANNUAL REPORT 2013
NOTES TO THE CONSOLIDATED FINANCIAL STATEMENTS
Recognition and measurement princIples
The following table summarizes the principal measurement bases used in the preparation of Infineon’s
Consolidated Financial Statements:
Statement of financial position item Measurement principle
Assets
Cash and cash equivalents Nominal amount
Financial investments Fair value/amortized cost
Trade and other receivables Amortized cost
Inventories Lower of cost and net realizable value
Assets classified as held for sale Lower of carrying amount and fair value less costs to sell
Property, plant and equipment Amortized cost
Goodwill Impairment-only approach
Intangible assets (except goodwill)
with finite useful life Amortized cost
with indefinite useful life Impairment-only approach
Other financial assets (current and non-current)
Loans and receivables Amortized cost
Available-for-sale Fair value directly through equity
Measured at fair value through profit or loss Fair value through profit or loss
Designated cash flow hedges Fair value directly through equity
Other assets (current and non-current) Amortized cost
Equity and liabilities
Trade and other payables Amortized cost
Debt Amortized cost
Provisions
Pensions Projected unit credit method
Other provisions Expected settlement amount
Other financial liabilities (current and non-current)
Measured at fair value through profit or loss Fair value through profit or loss
Designated hedging instruments Fair value directly through equity
Other financial liabilities Amortized cost
Other liabilities (current and non-current) Amortized cost
Put options on own shares Present value of nominal amount at date of issue
Own shares Cost
Cash and cash equivalents
Cash and cash equivalents represent cash, deposits and all short-term investments with a maturity at
acquisition date of three months or less and are measured on the basis of their nominal amount.
Financial instruments
A financial instrument is a contract that gives rise to a financial asset of one entity and a financial liability
or equity instrument of another entity. Financial instruments containing both equity and liability elements
(for example convertible bonds which give the holder the right to convert the bond into shares of the company),
are required to be evaluated in accordance with IAS 32, “Financial Instruments: Presentation” and, where
necessary, divided into their equity and liability components.

INFINEON TECHNOLOGIES ANNUAL REPORT 2013
CONSOLIDATED FINANCIAL STATEMENTS208
For Infineon, financial assets consist, in particular, of cash and cash equivalents, financial investments, trade
and other receivables as well as derivative financial instruments held for trading purposes with a positive
fair value at the end of the reporting period.
Infineon’s financial liabilities comprise primarily trade and other payables, debt and derivative financial
instruments with a negative fair value at the end of the reporting period.
Financial instruments are initially recognized at their fair value. Transaction costs directly attributable to
the acquisition or issuance of financial instruments are only included in the carrying amount if the financial
instruments are not measured at fair value through profit or loss.
Regular purchases and sales of financial assets are recognized on the basis of the settlement date. The settle-
ment date is the date, on which an asset is delivered to or by Infineon.
Financial assets are derecognized when the rights to receive cash flows from the investments have expired or
have been transferred and Infineon has transferred substantially all risks and rewards of ownership. Financial
liabilities are derecognized when they are extinguished, that is when the obligation specified in the respective
contract is discharged, cancelled or has expired.
Financial assets and financial liabilities
Infineon classifies financial assets into the following categories: “Loans and receivables”, “Available-for-sale
financial assets” and “Financial assets measured at fair value through profit and loss”. No financial assets
were classified to the other IAS 39 category “Assets held-to-maturity” in the fiscal years 2013 and 2012.
“Designated hedging instruments (cash flow hedges)” also belong to financial assets.
Infineon classifies financial liabilities into the following categories: “Financial liabilities measured at fair value
through profit and loss” and “Other financial liabilities”. Furthermore, “Designated hedging instruments
(cash flow hedges)” belong to financial liabilities.
The classification of a financial asset or financial liability to one of the categories stated above is determined
on initial recognition of the relevant item.
Loans and receivables
Loans and receivables are non-derivative financial assets with fixed or determinable payments that are not quoted
in an active market. They are included in current assets, unless their remaining term is more than 12 months
at the end of the relevant reporting period, in which case they are then reported as non-current assets. Loans
and receivables of Infineon include the balance sheet items “Cash and cash equivalents” as well as “Trade and
other receivables”. Fixed-term deposits and commercial paper reported as financial investments with an original
term of between 3 and 12 months from the date of acquisition are also classified as loans and receivables.
Loans and receivables are measured on initial recognition at their fair value plus incidental acquisition costs.
Subsequently, they are measured at amortized cost using the effective interest method. Loans and receivables
are tested for impairment. They are considered impaired when there is objective evidence that Infineon will
not be able to collect all amounts contractually due. Objective evidence that indicates impairment would
include, for example, known financial difficulties or the insolvency of a debtor, resulting in the recognition
of a corresponding allowance, which is recorded in an allowance account in profit or loss. When a payment
default becomes certain, for example in the case of insolvency proceedings or a voluntary settlement agree-
ment, such loans and receivables are reclassified as uncollectible and derecognized along with the previously
recognized allowance.

209INFINEON TECHNOLOGIES ANNUAL REPORT 2013
NOTES TO THE CONSOLIDATED FINANCIAL STATEMENTS
Available-for-sale financial assets
Available-for-sale financial assets are non-derivative financial instruments that are either designated in
this category or not allocated to any of the other categories. They comprise principally marketable securities
classified as current assets and reported as “Financial investments” (see note 13).
Upon acquisition, available-for-sale financial assets are measured at fair value taking into account transaction
costs. Subsequently they are measured at their fair value at the end of the relevant reporting period. Transaction
costs relating to the acquisition of available-for-sale financial assets with a finite term and fixed or determin-
able payments are capitalized and recognized in the Consolidated Statement of Operations using the effective
interest method. Changes in the fair value of available-for-sale financial assets are recognized directly in equity.
If the fair value is permanently or significantly lower than the amortized cost, an impairment loss is recognized
through profit or loss.
Infineon assesses declines in fair value at the end of each reporting period to determine whether a financial
asset or group of financial assets is impaired. In the case of available-for-sale financial assets, a significant
or prolonged decline in the fair value of the financial asset below its cost is considered as an indicator that
the assets are impaired. If any such evidence exists, the cumulative loss that had been recognized directly in
equity - measured as the difference between the acquisition cost and the current fair value, less any impair-
ment loss on that financial asset previously recognized in profit or loss - is removed from equity and recognized
in profit or loss.
When financial assets classified as available-for-sale are sold, the accumulated fair value adjustments previously
recognized in equity are reclassified to profit or loss.
Financial assets or liabilities measured at fair value through profit or loss
Financial assets or liabilities measured at fair value through profit or loss comprise at Infineon almost entirely
derivatives used to hedge currency or interest rate risks when hedge accounting is not being applied.
Derivative financial instruments are categorized as held for trading and measured at fair value through profit
or loss unless they are designated as hedging instruments with hedge accounting being applied. All fair value
gains and losses are recognized through profit or loss. Changes in the fair value of undesignated derivative
financial instruments that relate to operating activities are recorded as part of cost of goods sold, while those
of undesignated derivative financial instruments relating to financing activities are recorded in financial income
or financial expense.
All financial instruments in this category are measured on the basis of the value at the trading date. Derivative
financial instruments with a positive fair value at the end of the reporting period are reported as “Other current
financial assets” and those with a negative fair value at the end of the reporting period are reported as “Other
current financial liabilities”. Infineon had no derivative financial instruments with a remaining term of more
than 12 months in place as of September 30, 2013 and 2012.
Designated hedging instruments (cash flow hedges)
Certain derivative financial instruments are used to hedge expected highly probable foreign currency risks or risks
of commodity price changes (such as gold prices) in order to minimize the associated risk (cash flow hedges).
Derivative financial instruments are measured at their fair value and included in “Other current financial assets”
or “Other current financial liabilities”.

INFINEON TECHNOLOGIES ANNUAL REPORT 2013
CONSOLIDATED FINANCIAL STATEMENTS210
The effective portion of changes in the fair value of derivative financial instruments that are designated and
qualify as cash flow hedges is recognized directly in equity. “Effective” is the degree to which changes in
the fair value or cash flows of the hedged items that are attributable to a hedged risk are offset by changes in
the fair value or cash flows of the hedging instrument. The gain or loss relating to the ineffective portion is
recognized immediately in profit or loss. Amounts accumulated in equity are recycled in profit or loss in the
periods in which the underlying hedged item affects profit or loss.
When a hedging instrument expires or is sold, or when a hedging relationship no longer meets the criteria
for hedge accounting, any cumulative gain or loss existing at that time remains in equity until the underlying
transaction actually occurs. When a forecast transaction is no longer expected to occur, the cumulative gain
or loss that was reported in equity is immediately transferred to profit or loss.
Other financial liabilities
All other financial liabilities, including trade payables and debt instruments, are measured at amortized
cost using the effective interest method. This also applies to the debt component of compound financial
instruments such as the subordinated convertible bond issued by Infineon and obligations in conjunction with
the put options issued by the Company on own shares.
Compound financial instruments
Compound financial instruments issued by Infineon comprise convertible bonds, which give the holder the
right to exchange the bonds for shares in Infineon (see note 27). The number of underlying shares is fixed and
does not vary on the basis of the shares’ fair value.
The liability component of such a compound financial instrument is recognized as a liability measured at
the fair value of a comparable liability without conversion option. The conversion right component is classified
as an equity instrument. It is recognized within equity upon issuance of the compound financial instrument
measured at an amount corresponding to the difference between the fair value of the entire instrument and the
fair value of the debt component. On initial recognition of the instrument, directly attributable transaction costs
are allocated to the equity and debt components in proportion to their book values.
The liability component is measured at amortized cost using the effective interest method, whereas the equity
component remains unchanged during the term of the compound financial instrument.
In the event that the compound financial instrument is redeemed before its due date, the consideration paid is
allocated to the equity and debt components. The difference at redemption date between the carrying amount
of the liability component and the fair value of a comparable liability without conversion right is recognized as
interest expense or income. The difference between the consideration paid and the fair value of a comparable
liability without the conversion rights results in an increase or reduction in equity (additional paid-in capital).
Put options on own shares
Put options issued by the Company on its own shares are reported as “Obligation to acquire own shares” within
other current financial liabilities if the put option is required to be settled by delivery of a fixed number of shares
in return for a fixed amount specified in advance. The obligation is recognized at the date of issue of the put
option, measured at the present value of the amount expected to settle the option. A corresponding amount is
recognized to reduce equity, reported within equity as “Put options on own shares”. The option premium received
on the issue of the put options is recognized as additional paid-in capital. The liabilities are recognized on an
accruals basis, with the accrued interest recorded as an interest expense. The liability is extinguished when
the put options are exercised, at which point the corresponding amounts are reclassified within equity from
“Put options on own shares” to “Own shares”. If the put option lapses, the amounts previously recognized as
a reduction of equity and as a liability are derecognized.

211INFINEON TECHNOLOGIES ANNUAL REPORT 2013
NOTES TO THE CONSOLIDATED FINANCIAL STATEMENTS
Inventories
Inventories encompass assets to be consumed in the production process or in the rendering of services
(raw materials and supplies), in the process of production at the balance sheet date (work in progress), or held
for sale in the ordinary course of business (finished goods and goods purchased for resale).
Inventories are measured at the lower of acquisition or production cost – calculated using the weighted-
average method – and net realizable value. Production cost for these purposes is determined on the basis of
fully absorbed production costs. Net realizable value corresponds to realizable sale proceeds under normal
business conditions less estimated costs to complete and sell. Production cost comprises costs of material,
production wages and an appropriate portion of attributable overheads, including amortization and deprecia-
tion on tangible and intangible assets. Overhead mark-ups are determined on the basis of normal capacity
utilization levels.
Write-downs are recorded on inventories using a consistent approach throughout Infineon and are determined
at product level for obsolete and slow-moving inventories on the basis of the amount of revenues expected
to be generated by the relevant product. In the 2013 fiscal year Infineon analyzed and adjusted the allowances
for slow-moving inventories which resulted in a one-off positive effect of €16 million in the consolidated
Statement of Operations.
Current and deferred income taxes
The current income tax expense is calculated on the basis of the tax laws enacted by the end of the reporting
period in the countries in which the relevant entity of Infineon operates.
Deferred taxes are calculated on temporary differences between the tax base and the book value of assets and
liabilities, and on tax losses available for carry-forward. By contrast, no deferred tax is recognized on goodwill
arising in conjunction with business combinations. Similarly, deferred taxes are not recognized on the initial
recognition of an asset or liability in conjunction with a transaction that is not a business combination and which,
at the time of the transaction, affects neither the pre-tax income according to IFRS nor taxable profit.
Deferred tax assets in respect of deductible temporary differences and tax loss carry-forwards which exceed
deferred tax liabilities in respect of taxable temporary differences, are only recognized to the extent that it is
probable that the relevant group entity can generate sufficient taxable profit to realize the corresponding
benefit. Deferred tax assets and liabilities are measured using applicable tax rates and laws that have been
enacted by the end of the reporting period or are about to be enacted, when the related deferred tax asset is
realized or the deferred tax liability is settled.
Deferred tax assets and liabilities are netted to the extent they relate to the same tax authority and to the same
taxpayer or a group of taxpayers who are jointly assessed for income tax purposes.
Income taxes are recognized in the Consolidated Statement of Operations, with the exception of income taxes
relating to items recognized directly in equity or in Other Comprehensive Income.
Discontinued operations
Discontinued operations are reported when a component of an entity either is classified as held for sale or
has been already disposed of. A discontinued operation must be either (a) a separate major line of business
or geographical area of operations, (b) part of a single coordinated plan to dispose of a separate major line of
business or geographical area of operations or (c) a subsidiary acquired exclusively with view to resale.
Discontinued operations are presented as separate line items in the Consolidated Statement of Operations
and Consolidated Statement of Cash Flows. The line item “Income/loss from discontinued operations, net of
income taxes” includes the results of operating activities as well as gains and losses on the disposal of
discontinued operations.
Prior year figures in the Consolidated Statement of Operations and Consolidated Statement of Cash Flows
are restated so that they correspond to those that have been classified as discontinued operations as of the
reporting date.

INFINEON TECHNOLOGIES ANNUAL REPORT 2013
CONSOLIDATED FINANCIAL STATEMENTS212
Assets and liabilities held for sale
Items classified as “Assets held for sale” can relate to non-current assets or groups of assets (for example assets
of a subsidiary held for sale or assets related to discontinued operations), the carrying amounts of which will
be realized primarily by way of a highly probable divestment transaction within the next twelve months or an
already executed divestment transaction, and not through continued use. Assets held for sale are reported in
the Statement of Financial Position as a separate line item within current assets. Liabilities disposed of in a
transaction together with assets held for sale are reported separately on the liabilities and equity side of the
Statement of Financial Position, within current liabilities, as “Liabilities held for sale”.
Non-current assets classified as held for sale are no longer depreciated on a scheduled basis. Instead, they are
measured at the lower of carrying amount or fair value less costs to sell at the end of the reporting period.
Property, plant and equipment
Property, plant and equipment are measured at amortized acquisition or construction cost, and its value is
reduced by scheduled depreciation as well as, where necessary, impairments.
The cost of acquisition comprises the acquisition price plus ancillary and subsequent acquisition costs, less
any reduction received on the acquisition price. The cost of self-constructed equipment comprises direct costs
as well as appropriate allocations of material and manufacturing overheads.
Where an obligation exists to dismantle or remove an asset or restore a site to its former condition at the end of
its useful life, the present value of the related future payments is capitalized along with the cost of acquisition
or construction upon completion and the entire asset is depreciated over its estimated useful life. A liability is
recognized for the same amount, the carrying amount of which is increased in future periods by compounding
the interest component.
If the construction phase of property, plant or equipment extends over more than 12 months, the interest
incurred on related borrowed capital up to the date of completion is capitalized as part of the cost of acquisition
or construction in accordance with IAS 23 “Borrowing Costs”. No interest was capitalized in the fiscal years
ended September 30, 2013 and 2012.
Ongoing expenses for the maintenance and repair of property, plant and equipment are generally recognized
in profit or loss as they occur. These subsequent costs are capitalized if a measure (such as a complete overhaul
of technical equipment) will result in significant additional future economic benefits.
Property, plant and equipment is depreciated using the straight-line method. Land property rights and
construction in progress are not depreciated. Depreciation on property, plant and equipment is based on the
following useful lives, as applied consistently throughout Infineon:
Years
Buildings 10 – 25
Technical equipment and machinery 3 – 10
Other plant and office equipment 1 – 10
Impairment losses are recognized to take account of declines in value that go beyond regular depreciation and
are expected to be permanent. Corresponding reversals are made when the reasons for previous impairments
no longer exist, provided that the reversal does not cause the carrying amount to exceed amortized cost.

213INFINEON TECHNOLOGIES ANNUAL REPORT 2013
NOTES TO THE CONSOLIDATED FINANCIAL STATEMENTS
When assets are sold, decommissioned or scrapped, the difference between the net proceeds and the carrying
amount of the assets is recognized as a gain or loss in other operating income or expenses.
Infineon does not apply the revaluation model as described in IAS 16 “Property, Plant and Equipment”.
Investment properties
Infineon does not own any investment properties and therefore does not apply IAS 40 “Investment Properties”.
Leases
Infineon is a lessee of property, plant and equipment. In the case of operating lease contracts, the costs of
leasing an asset are spread on a straight-line basis over the term of the lease arrangement. All leases where
Infineon as lessee meets certain requirements, which indicate beneficial ownership, are accounted for as
finance leases pursuant to IAS 17 “Leases”. This is the case when substantially all of the risks and rewards
of ownership of the asset are transferred to Infineon.
Recoverability of intangible assets and other long-lived assets
Goodwill
Goodwill is an asset that represents the future economic benefits arising from assets acquired in a business
combination that are not individually identified and separately recognized. Goodwill is the excess of the
acquisition cost of a business over the net fair value of acquired, separately identifiable assets, liabilities and
contingent liabilities at the date of acquisition. Goodwill arising from acquisitions of businesses is reported
in the line item “Goodwill and other intangible assets” in the Consolidated Statement of Financial Position.
Separately identifiable intangible assets acquired in a business combination are recognized and reported
separately from goodwill.
Goodwill acquired in a business combination is allocated to the cash-generating units (CGUs) that will benefit
from the synergies generated by the business combination. This level is beneath the segment level and
represents the smallest group of assets that generate cash inflows from continuing activities that are largely
independent of the cash inflows of other assets or asset groups (see also note 22 regarding the allocation
of goodwill to CGUs).
Acquired goodwill is not amortized systematically. Instead, it is tested for impairment annually in the fourth
quarter of the fiscal year and, additionally, whenever there are events or changes in circumstances (triggering
events) that indicate that the carrying amount may not be recoverable. The impairment test for goodwill is per-
formed at the CGU level. The recoverable amount is the higher of the fair value less costs to sell and the value
in use. If the carrying value of the respective CGU including allocated goodwill exceeds the recoverable amount,
then the goodwill must be written down accordingly. Such impairments cannot be reversed in a subsequent
period. The determination of the recoverable amount requires a significant degree of management judgment.
Infineon determines the recoverable amount of a particular CGU on the basis of its value in use. Infineon
measures value in use by estimating the future cash flows that will be generated by the continuing operations
of the CGU and using an appropriate interest rate to discount these expected future cash flows.

INFINEON TECHNOLOGIES ANNUAL REPORT 2013
CONSOLIDATED FINANCIAL STATEMENTS214
Cash flows are projected based on past experience, current operating results and the five-year strategic business
plan approved in the fourth quarter of the fiscal year. Infineon’s annual forecasts are calculated bottom up
based on certain central assumptions applied consistently throughout Infineon. Certain cash flow assumptions
(for example depreciation/amortization, investments in fixed assets, change in working capital) are calculated
based on defined parameters. Cash flows for periods beyond the planning horizon are estimated using a terminal
value. In the 2013 fiscal year, a terminal growth rate of 1 percent was used (2012: 1 percent); this growth rate
is derived from publicly available market studies from market research institutes and does not exceed the
historical long-term average growth rate for the sector in which the relevant CGU operates.
The discount rate is based on Infineon’s weighted average cost of capital (WACC) after tax for the CGU in
question. The Capital Asset Pricing Model (CAPM) is used to calculate the cost of equity. The relevant pre-tax
WACC used to discount future pre-tax cash flows, is derived from estimated after-tax cash flows and the after-
tax WACC. The discount rate reflects the current market rate of return as well as the specific risks attached to
each CGU. In accordance with IAS 36, Infineon determines the appropriate WACC based on market information.
The risk-free interest rate is derived from yields on long-term government bonds, and the beta factor is derived
from a group of comparable companies that have a comparable risk structure to the CGU, taking into account
leverage. In order to determine the recoverable amount of the relevant CGU, a pre-tax WACC of 17.7 percent
equivalent to a WACC of 12.3 percent after tax was used in the 2013 fiscal year. In the 2012 fiscal year the
pre-tax WACC was 18.0 percent which corresponds to a WACC of 11.0 percent after tax. By applying different
parameters that Infineon considers to be possible but not probable, sensitivity analyses are performed on the
WACC and terminal value. In this way, Infineon takes account of the inherently uncertain nature of estimates
and carries out impairment tests on goodwill based on scenarios that are less favorable than those considered
most likely. The recoverability of goodwill was confirmed for each of these scenarios. An increase or decrease
of 1 percent in the WACC or the terminal growth rate has no effect on the value of goodwill. Until the approval
of the Consolidated Financial Statements, the validity of the results is continually monitored for triggering
events that potentially indicate that the recoverable amount has fallen below the book value.
Other intangible assets
Other intangible assets consist primarily of purchased intangible assets, such as licenses and technology,
which are measured initially at acquisition cost, as well as capitalized development costs. These intangible
assets have finite useful lives ranging from 3 to 10 years and are carried at amortized cost using the straight-
line method. For the criteria used to capitalize development costs see the “Research and Development Costs”
see page 218.
Infineon did not hold any other intangible assets with indefinite useful lives in either the 2013 or 2012
fiscal years.
Other long-lived assets
Infineon reviews all other long-lived assets, including property, plant and equipment, for possible impairment
whenever events or changes in circumstances indicate that the carrying amount of an asset may not be recover-
able. The recoverability of used assets is measured by comparing the carrying amount of the asset with its
recoverable amount. The recoverable amount of an asset is defined as the higher of its fair value less costs to
sell and its value in use. The value in use is generally calculated based on discounted future cash flows of the
CGU to which the asset is allocated. Considerable management judgment is necessary to estimate discounted
future cash flows.

215INFINEON TECHNOLOGIES ANNUAL REPORT 2013
NOTES TO THE CONSOLIDATED FINANCIAL STATEMENTS
If such assets are considered to be impaired, the impairment recognized is measured as the amount by which
the carrying value of the assets exceeds their recoverable amount. An impairment loss recognized in prior
periods for an asset other than goodwill is reversed insofar as a change in the assumptions underlying the last
impairment leads to a lower impairment requirement. The maximum possible reversal of an impairment loss
would lead to the carrying amount that would have been determined (net of amortization or depreciation) if no
impairment loss had been recognized for that asset in prior years.
Pensions and similar obligations
Infineon provides benefits to most of its employees for the period after they have retired, either directly or
as a result of payments to private and public institutions. The benefits provided differ according to the legal,
economic and tax circumstances prevailing in each country and are mostly dependent on the length of service
and the salary of the employee concerned. Infineon has both defined contribution and defined benefit plans.
In the case of defined contribution plans, Infineon pays amounts based on statutory or contractual regulations
to a separate entity (a fund) or to public or private pension insurance companies. Once the contributions are
paid, Infineon has no further obligation to pay benefits. The contributions are recognized as expense in the
year in which they fall due and are included in costs by function and hence as part of the operating result.
Infineon records a liability for amounts payable under the provisions of its various defined contribution plans.
Prepaid contributions are recognized as an asset to the extent that a cash refund or a reduction of future
payments is available.
All other plans that do not fall under the definition of a defined contribution plan are accounted for as defined
benefit plans. The latter relate to Infineon´s commitments to pay future vested and current benefits to present
and former employees and their dependants. These obligations relate to retirement pensions. The liability
recognized in respect of defined benefit pension plans is the present value of the defined benefit obligation
(DBO) at the end of the reporting period less the fair value of the plan assets, together with adjustments for
past service costs. The present value of the DBO and resulting pension cost are determined in accordance with
IAS 19 “Employee Benefits” annually for each separate plan by independent, qualified actuaries using the
projected-unit-credit method. In this context, actuarial procedures are applied for which it is necessary to make
specific assumptions. The most important of these are the discount rate, the expected return on plan assets,
future expected increases in salaries and pensions and mortality rates.
Discount rates are determined on the basis of market yields at the end of the reporting period on high-grade
corporate bonds from issuers carrying a very high credit rating that are denominated in the currency in which the
benefits will be paid and that have remaining maturities approximating the terms of the related pension liability.
All items of income and expense relating to defined benefit plans – with the exception of the interest component
of the pension cost and the expected income from plan assets – are recognized on a net basis within costs by
function and hence as part of the operating result. The interest component of the pension cost and the expected
income from plan assets are reported as financial expense or financial income as part of the financial result.
Actuarial gains and losses resulting from experience adjustments for pension obligations and plan assets and
from changes in actuarial assumptions are recognized directly in equity and presented in the Consolidated
Statement of Comprehensive Income in the period in which they arise. Infineon applies this accounting option
with regard to the recognition of actuarial gains and losses in order to avoid volatilities of reported earnings in
the Consolidated Statement of Operations. This accounting treatment of actuarial gains and losses complies
with the method stipulated in the amended IAS 19 “Employee Benefits” and which is a mandatory requirement
for Infineon in the fiscal year starting October 1, 2013.
Past-service costs are recognized immediately in profit or loss, unless the changes to the pension plan are
conditional on the employees remaining in service for a specified period of time (the vesting period). In this case,
the past-service costs are recorded on a straight-line basis over the vesting period.

INFINEON TECHNOLOGIES ANNUAL REPORT 2013
CONSOLIDATED FINANCIAL STATEMENTS216
Provisions
Provisions are recognized for present legal and constructive obligations arising from past events that are likely
to result in a future outflow of resources, the amount of which can be reliably estimated.
Provisions are measured at their expected settlement amount in accordance with IAS 37 “Provisions, Contin-
gent Liabilities and Contingent Assets” or, where applicable, in accordance with IAS 19 “Employee Benefits”.
The amount recognized for a provision is the best estimate of the expenditure required to settle the present
obligation. Estimates of outcomes and the financial effect of those outcomes are dependent upon the judgment
of Infineon’s management, supplemented by experience gained from similar transactions and, where appro-
priate, reports from independent experts (such as attorneys). The evidence considered includes any additional
evidence provided by events after the reporting period and up to the preparation of the Annual Report. If the
measurement of a provision involves assessment of a large number of factors, the obligation is estimated by
weighting all possible outcomes by their associated probabilities (expected value method). Where there is a
continuous range of possible outcomes and each point in that range is as likely as any other, the mid-point of
the range is used.
Where Infineon does not expect cash flows to arise within the next twelve months and the interest effect is
considered material, provisions are stated at the present value of expected cash outflows. For the purposes
of the present value calculation, Infineon uses a pre-tax interest rate that reflects current market assessments
of the time value of money and the risks specific to the liability. In estimating the future outflow of economic
benefits Infineon also includes inflation assumptions if applicable. Provisions for onerous contracts are
measured at the lower of the expected cost of fulfilling the contract and the expected cost of terminating the
contract. Additions to provisions are always recognized in profit or loss.
Claims for reimbursements from third parties are not offset against provisions, instead they are capitalized
separately if their realization is virtually certain.
If the projected obligation decreases as a result of a change in the estimate, the provision is reversed by the
corresponding amount and the resulting income recognized in the same line item of the consolidated Statement
of Operations in which the original charge was recognized.
Contingent liabilities
Contingent liabilities are possible obligations, whose actual existence is dependent on the occurrence of one or
more uncertain future events not wholly within the control of Infineon. They can also be present obligations that
will probably not result in the outflow of resources or whose outflow of resources cannot be quantified reliably.
Contingent liabilities are not recognized in the Statement of Financial Position, instead they are disclosed and
described in the Notes to the Consolidated Financial Statements.
Own shares
Own shares held by Infineon are measured at cost, including directly attributable transaction costs, and reported
as a reduction of equity. In the case of own shares acquired by way of issuing put options on own shares,
acquisition cost corresponds to the present value of the exercise value of the put options discounted back at
issuance date. When own shares are cancelled at a subsequent date, Infineon’s share capital is reduced by
the appropriate pro rata amount of the shares to total share capital. Additional paid-in capital is reduced by the
difference between acquisition cost and the amount deducted from share capital.
Segment reporting
The Management Board of Infineon Technologies AG, in its role as Infineon’s chief operating decision maker,
allocates resources and assesses the performance of the operating segments. Segments and regions are
identified and key performance figures selected on the basis of internal management and reporting systems
(management approach). Underlying data used in this context are derived from the Consolidated Financial
Statements drawn up in accordance with IFRS.
Infineon’s business is structured on the basis of four operating segments, namely Automotive, Industrial Power
Control, Power Management & Multimarket and Chip Card & Security.

217INFINEON TECHNOLOGIES ANNUAL REPORT 2013
NOTES TO THE CONSOLIDATED FINANCIAL STATEMENTS
The remaining activities of operations that have been sold are aggregated into “Other Operating Segments”.
Results and specific group functions not allocated to the operating segments are aggregated under “Corporate
and Eliminations”.
Revenue recognition
Infineon generates revenue from the sale of its semiconductor products and system solutions. Infineon’s
semiconductor products include a wide variety of chips and components used in electronic applications ranging
from automotive electronics and industrial applications, to chip cards. Infineon’s products are also used in a
wide variety of microelectronic applications, including computer systems, telecommunications systems and
consumer goods. Revenue is allocated to segments on the basis of differences in product type and applications.
In addition, Infineon generates a small portion of its revenue from licensing its intellectual property to
third parties, as well as development arrangements.
Revenue is measured on the basis of the fair value of the consideration received or receivable.
Revenue from products sold
Revenue from products sold is recognized in accordance with IAS 18 “Revenue” when the conditions for revenue
recognition are met. Revenue is recognized when the significant risks and rewards of ownership of the goods
are transferred to the buyer and it is probable that the economic benefits associated with the sale will flow to
Infineon. The amount of revenue recognized is based on the fair value of the consideration received or receivable
taking into account returns, settlement discounts and bonuses.
In principle Infineon recognizes revenue on sales to distributors by using the “sell in” method (i.e. when
a product is sold to the distributor). In accordance with established business practice in the semiconductor
industry, under certain circumstances distributors can apply for price protection. Price protection allows a
distributor to request a credit note for unsold products held in inventory if Infineon reduces the standard list
price of these products. In addition, a distributor can apply for a ship & debit credit. The authorization of these
credits remains fully within the control of Infineon. Infineon calculates the provision for price protection in
the same period the related revenue is recorded based on historical price trends and sales rebates, specific
information contained in the price protection agreement, and other factors known at the time. The historical
price trend is determined based on the difference between the contract price and the standard list price to the
distributor. The inventory turnover, the transparency of inventory pricing for standard products and the long
distributor pricing history enable Infineon to reliably estimate provisions for price protection and ship & debit
credit notes at the end of the reporting period.
In addition, distributors can, in certain cases, also apply for stock rotation and scrap allowances. Allowances
for stock rotation returns are accrued based on expected stock rotation as per the contractual agreement.
Distributor scrap allowances are accrued based on the contractual agreement and, upon authorization of the
claim, reimbursed up to a certain maximum based on turnover in a given period. Historically, actual returns
under such return provisions have been insignificant. Infineon monitors such product returns on an ongoing basis.
In some cases, rebate programs are offered to specific customers or distributors whereby the customer or
distributor is granted a rebate upon achievement of a defined sales volume. Customers or distributors are also
compensated for pre-agreed joint advertising activities on a case-by-case basis. Such rebates and refunds are
taken into account for revenue recognition purposes.
Other returns are permitted only for quality-related reasons in the normal course of business within the
applicable warranty period. Infineon records provisions for warranty costs as a charge to cost of goods sold
based on historical experience and other known warranty costs.

INFINEON TECHNOLOGIES ANNUAL REPORT 2013
CONSOLIDATED FINANCIAL STATEMENTS218
License income and income from development arrangements
License income and income from development arrangements is recognized when the related service has
been rendered, in any event not prior to the commencement of the license agreement. Payments received are
generally non-refundable. They are deferred where applicable and recognized over the period in which Infineon
is obliged to provide services (e.g. when customers make payments to Infineon for development activities).
Per-unit license fees are recognized as revenue when the license is used by the customer.
Research and development costs
Costs of research activities undertaken in order to gain new scientific or technical knowledge are expensed
as incurred.
Costs for development activities, the results of which are applied to a plan or design for the production of new
or substantially improved products and processes, are capitalized if the development costs can be measured
reliably, the product or process is technically and commercially feasible, future economic benefits are probable
and Infineon intends, and has sufficient resources, to complete development and use or sell the asset. The
costs capitalized include the cost of materials, direct labor and directly attributable general overhead expense
that serves to prepare the asset for use. Such capitalized costs are presented as internally generated intangible
assets within “Goodwill and other intangible assets” (see note 22). Development costs, which do not fulfill
the criteria for capitalization are expensed as incurred. Capitalized development costs are stated at cost less
accumulated amortization and, if applicable, impairment charges. After the completion of the development
phase and following the ramp-up of production, internally generated intangible assets are amortized as part
of cost of goods sold over a period of, as a rule, three to five years.
Capitalized development costs are reviewed for impairment annually as long as amortization over the expected
useful life has not begun and, additionally, when evidence for a potential impairment exists. In particular,
a decline in expected revenue or higher costs is evidence for a potential impairment.
Grants
Grants for investments include both tax-free government grants and taxable grants for investments in property,
plant and equipment. The recognition of the grant starts when it is reasonably assured that Infineon will comply
with the conditions attached to the grant, and it is reasonably assured that the grant will be received. Tax-free
government grants are deferred and recognized over the remaining useful life of the related asset. Taxable grants
are deducted from the cost of the related asset and thereby reduce depreciation expense in future periods.
Grants that are related to expenses included in profit or loss are presented as a reduction of the related
expense in the Consolidated Statement of Operations (see note 6).
Share-based compensation
Infineon has compensation plans in place in which equity-related instruments such as stock options or, from
the 2014 fiscal year so-called Performance Shares, are granted to members of the Management Board and to
selected senior managers. In accordance with IFRS 2 “Share-based Payment”, these compensation plans qualify
as equity-settled share-based compensation and are accounted for accordingly. The fair value of the equity-
related instruments granted is calculated at grant date using an option pricing valuation model and recognized
as expense on a straight-line basis over the vesting period during which Infineon receives consideration from
the employee in the form of work performed, and the achievement of the respective targets (outperformance of
the Philadelphia Semiconductor Index (SOX) over a predetermined period) is expected. The expense is charged
to costs by function as part of the operating result and credited directly to equity (additional paid-in capital).
The amount recognized as expense is adjusted in order to reflect the actual number of equity instruments that
can ultimately be exercised by employees.
The proceeds received net of any directly attributable transaction costs are credited to ordinary share capital
and additional paid-in capital when the stock options are exercised. Performance Shares do not result in any
cash inflows.

219INFINEON TECHNOLOGIES ANNUAL REPORT 2013
NOTES TO THE CONSOLIDATED FINANCIAL STATEMENTS
3 Management estimates and assumptions
The preparation of financial statements in accordance with IFRS requires management to make estimates and
assumptions which have an impact on amounts presented and on related disclosures.
Estimates and assumptions are subject to regular review and may need to be adjusted in subsequent accounting
periods. They can change from one period to the next and have a material impact on the financial condition,
liquidity position and results of operations. Critical accounting estimates could include estimates where manage-
ment could reasonably have used a different estimate in the current accounting period.
Estimates and assumptions are applied by management to the best of its knowledge based on current events
and circumstances. Nevertheless, actual events may result in deviations from these estimates.
Areas containing estimates and assumptions that could therefore most likely be affected if actual events deviate
from these estimates are:
> valuation of inventories,
> recoverability of trade and other receivables,
> recoverability of non-financial assets,
> recognition and recoverability of deferred tax assets,
> recognition and measurement of provisions and
> pension plan valuation.
All estimates and assumptions are based on conditions and assessments made at the end of the reporting
period and taking account of any new information coming to light prior to the authorization of the Management
Board to issue the Consolidated Financial Statements on November 19, 2013.
Valuation of inventories
Inventories with a book value of €609 million and €567 million at September 30, 2013 and 2012 respectively,
are valued at the lower of weighted average acquisition or production cost, or net realizable value. Infineon
reviews the recoverability of inventory based on regular monitoring of the size and composition of inventory
positions, current economic events and market conditions, projected future product demand, technological
developments and the pricing environment. This evaluation is inherently judgmental and requires a wide range
of estimates, including both the forecasted product demand and price development, both of which may be
susceptible to significant change.
Write-downs of inventory value could be necessary in future periods due to reduced product demand in
the industries that Infineon serves, technological obsolescence due to rapid developments of new products
and technological improvements, or changes in economic conditions that could impact the market price for
Infineon’s products. The resulting adjustment to the valuation of inventory due to these or other factors could
have a significant impact on the results of operations.
Recoverability of trade and other receivables
The allowance for doubtful accounts involves significant management judgment and review of individual
receivables based on individual customer creditworthiness, current economic developments and analysis of
historical bad debts. Insofar as the determination of the valuation allowance is derived from a portfolio-level
analysis of historical bad debts, a decline of receivables will result in a corresponding reduction of such provi-
sions and vice versa. At September 30, 2013 the allowance for doubtful accounts was €8 million (previous year
€16 million). The extent of actual unrecoverable debt could exceed the expected allowance if the customers’
financial position was to deteriorate.

INFINEON TECHNOLOGIES ANNUAL REPORT 2013
CONSOLIDATED FINANCIAL STATEMENTS220
Recoverability of non-financial assets
The review for impairment of long-lived assets including goodwill and internally generated intangible assets
with a book value of €157 million at September 30, 2013 (previous year: €140 million), requires material
estimates and assumptions. These include the weighted average cost of capital (“WACC”) and the parameters
used to determine the WACC, future cash flows derived from Infineon’s internal projections including underlying
planning assumptions and parameters, and the terminal growth rate.
Recognition and recoverability of deferred tax assets
Infineon tests deferred tax assets for impairment as of the end of each reporting period. The assessment
requires management to make assumptions about the amount of future taxable profits and other positive and
negative variables. The actual utilization of deferred tax assets depends on Infineon’s ability to generate the
corresponding taxable profits in the future so that potential tax loss carry-forwards or tax credits can be used
before they may expire.
On the basis of this assessment, the carrying amount of deferred tax assets stood at €325 million and €315 at
September 30, 2013 and 2012, respectively. Valuation allowances recognized on deferred tax assets amounted
to €1,176 million at September 30, 2013 and €1,254 million at September 30, 2012.
The total recognized amount of deferred tax assets may have to be reduced if future taxable profits are lower
than expected or if changes in tax law limit the time or amount of tax loss carry-forwards or tax credits available
for use, with a correspondingly adverse effect on the net assets, financial position and results of operations.
Conversely, the total recognized amount may have to be increased if future taxable profits are higher than
expected with a correspondingly positive effect on the net assets, financial position and results of operations.
Recognition and measurement of provisions
As described in note 38, Infineon is subject to various legal actions and claims, including intellectual property
matters as well as matters in connection with Qimonda’s insolvency that arise in and outside of the normal
course of business.
Infineon regularly assesses the likelihood of any adverse outcome or judgments related to these matters, and
estimates the range of possible payments. Infineon recognizes provisions and liabilities for obligations and
risks in conjunction with legal disputes, including provisions for significant legal costs which Infineon assesses
at the end of each reporting period are more likely than not to be incurred (that is where, from Infineon’s per-
spective at the end of each reporting period, the probability of having to settle an obligation or risk is greater
than the probability of not having to) and the obligation or risk can be estimated with reasonable accuracy at this
time. As additional information becomes available, any potential liability related to these actions is reassessed
and the estimations are revised if necessary. These provisions could be subject to change in the future based
on new developments in each matter, or changes in circumstances, which could have a material impact on
Infineon’s financial condition, liquidity position and results of operations. Although management makes esti-
mates and assumptions to the best of its knowledge based on current and foreseeable events and activities,
actual outcomes could differ from estimates.
In addition, considerable assumptions and estimates are also required to determine other provisions, for
example for warranty and license obligations. The estimates are primarily derived based on historical experience
and the judgment of knowledgeable personnel.
Provisions amount to €721 million and €740 million at September 30, 2013 and 2012 respectively.

221INFINEON TECHNOLOGIES ANNUAL REPORT 2013
NOTES TO THE CONSOLIDATED FINANCIAL STATEMENTS
Pension plan valuation
Infineon’s pension benefit costs are determined in accordance with actuarial computations using the projected-
unit-credit method, which relies on assumptions including discount rates and expected return on plan assets.
The book value of the pension liabilities net of plan assets amount to €246 million and €293 million at Sep-
tember 30, 2013 and 2012 respectively. Discount rates are established based on prevailing market rates for
high-grade corporate bonds from issuers carrying a very high credit rating. An increase in the discount rate
of 25 basis points would reduce the pension obligation by €28 million. Conversely a reduction in the discount
rate of 25 basis points would lead to an increase in the pension obligation of €30 million. The assumptions
regarding the expected return on plan assets consider long-term historical returns, investment strategy, and
estimates of future long-term investment returns. In line with the new IAS 19 “Employee Benefits”, the expected
return on plan assets will be calculated using the applicable discount rate from the 2014 fiscal year onwards.
Other key assumptions for pension liabilities and costs are based on current market conditions. A change in
one or more of these underlying assumptions could have a material effect on the measurement of the long-term
obligations. For further information see note 35.
4 Acquisitions
Infineon did not acquire any businesses in the fiscal years ended September 30, 2013 and 2012.
5 Disposals and discontinued operations
Qimonda — discontinued operations
On January 23, 2009, Qimonda AG (“Qimonda”), a majority-owned company filed an application at the Munich
Local Court to commence insolvency proceedings. On April 1, 2009, the insolvency proceedings were opened.
Insolvency proceedings were also opened for further domestic and foreign subsidiaries of Qimonda. Some of
these proceedings have already been completed. The results of these proceedings are reported as discontinued
operations in Infineon’s Consolidated Statement of Operations and Consolidated Statement of Cash Flows,
to the extent that the underlying events occurred before the commencement of insolvency proceedings. To the
extent that the events occurred after the commencement of insolvency proceedings, their results are reported
as part of continuing operations.
Certain provisions relating to Qimonda’s insolvency were required to be adjusted in the fiscal years 2013 and
2012 as a result of new developments.
A detailed description of the Qimonda-related risks is provided in note 38 (“Commitments and contingencies –
Proceedings in relation with Qimonda”).
Sale of the Wireless mobile phone business — discontinued operations
On August 30, 2010, Infineon entered into a contract for the sale of the mobile phone business of the Wire-
less Solutions segment (“Wireless mobile phone business”) for a consideration of US$1.4 billion with Intel
Corporation (“Intel”). Businesses with analog and digital TV tuners and satellite radio receivers and with radio
frequency power transistors for amplifiers in cellular base stations are the only areas of the Wireless Solutions
segment that remained with Infineon. The sale was completed on January 31, 2011. All assets, patents, other
intellectual property and selected liabilities allocated to the Wireless mobile phone business were separately
transferred. The Wireless mobile phone business is being continued by the purchaser under the name “Intel
Mobile Communications” (“IMC”).
During the 2013 fiscal year adjustments to the pre-tax gain on the sale due to the release of provisions along
with post-divestment income relating to the Wireless mobile phone business totaling €4 million were recorded
(previous year: €5 million).
Following the sale, Infineon continues to carry out activities contracted by IMC, which are reported as continuing
operations under “Other Operating Segments” for segment reporting purposes.

INFINEON TECHNOLOGIES ANNUAL REPORT 2013
CONSOLIDATED FINANCIAL STATEMENTS222
Loss/Income from discontinued operations, net of income taxes
The results of Qimonda and the Wireless mobile phone business presented in the Consolidated Statements of
Operations as “loss/income from discontinued operations, net of tax” for the years ended September 30, 2013
and 2012, consist of the following:
€ in millions 2013 2012
Qimonda’s share of discontinued operations, net of income taxes (15) (10)
Wireless mobile phone business’ share of discontinued operations, net of income taxes 4 5
Loss from discontinued operations, net of income taxes (11) (5)
Assets classified as held for sale
Assets reported as held for sale amounting to €5 million for September 30, 2012 relate to items of property,
plant and equipment acquired from Qimonda Dresden GmbH & Co. OHG (“Qimonda Dresden”) which Infineon
intended to sell. As of September 30, 2013 no assets were reported as held for sale.
In the 2013 and 2012 fiscal years, impairment losses of €4 million and €8 million, respectively, were recognized
on these assets classified as held for sale.
6 Grants and subsidies
Infineon has received economic development funding from various governmental institutions, including grants
for the construction of manufacturing facilities, as well as grants to subsidize research and development
activities and employee development. Grants and subsidies included in profit or loss in the Consolidated
Financial Statements during the fiscal years ended September 30, 2013 and 2012 are as follows:
€ in millions 2013 2012
Included in the Consolidated Statement of Operations in:
Cost of goods sold 27 24
Research and development expenses 52 53
Selling, general and administrative expenses 1 1
Total 80 78
In the 2013 and 2012 fiscal years, respectively, taxable investment grants amounting to €1 million and
€12 million were deducted from the acquisition or construction cost of fixed assets.
7 Cost of purchased services and materials as well as personnel expense
The Consolidated Statement of Operations (continuing and discontinued operations) includes the following
amounts of expense for purchased services, materials and personnel.
Expenses for purchased services and materials comprised the following in the fiscal years 2013 and 2012:
€ in millions 2013 2012
Raw materials, supplies and purchased goods 829 899
Cost of purchased services 779 833
Expenses for licenses 63 51
Total (continuing and discontinued operations) 1,671 1,783

223INFINEON TECHNOLOGIES ANNUAL REPORT 2013
NOTES TO THE CONSOLIDATED FINANCIAL STATEMENTS
Personnel expenses are as follows for the years ended September 30, 2013 and 2012:
€ in millions 2013 2012
Wages and salaries 1,154 1,090
Social insurance levies, pensions and similar obligations 213 186
Total (continuing and discontinued operations) 1,367 1,276
The average number of employees by geographic region is as follows for the fiscal years 2013 and 2012:
2013 2012
Europe 12,536 12,212
Therein: Germany 8,493 8,272
Asia-Pacific (without Japan) 13,219 13,532
Therein: China 1,457 1,349
Japan 121 113
Americas 499 485
Total 26,375 26,342
8 Other operating income and expense
Other operating income is as follows for the 2013 and 2012 fiscal years:
€ in millions 2013 2012
Rental income 12 13
Gains on disposals of assets 2 2
Other income from customers 2 5
Insurance claims 1 2
Income from other equity investments 1 2
Other 1 1
Total 19 25
Other operating expense is as follows for the 2013 and 2012 fiscal years:
€ in millions 2013 2012
Impairments and reversal of impairments of intangible assets, tangible assets and assets classified as held for sale 19 28
Expenses for restructuring and similar measures 18 –
Expenses in connection with rental income 9 7
Expenses in connection with legal disputes 5 28
Losses on disposals of assets 1 3
Other – 1
Total 52 67

INFINEON TECHNOLOGIES ANNUAL REPORT 2013
CONSOLIDATED FINANCIAL STATEMENTS224
9 Financial income
Financial income for the 2013 and 2012 fiscal years relates to interest income of €30 million and €38 million
respectively.
10 Financial expense
The amount of financial expense is as follows for the 2013 and 2012 fiscal years:
€ in millions 2013 2012
Interest expense 51 60
Valuation changes and losses on sales of financial investments – 1
Total 51 61
Interest expense for the 2012 fiscal year includes a pre-tax loss of €6 million arising on the repurchase of
convertible bonds due 2014 (see note 27).
11 Income tax
Income tax from continuing operations for the years ended September 30, 2013 and 2012, is as follows:
€ in millions 2013 2012
Current tax expense (39) (47)
Deferred tax benefit 16 48
Income tax (23) 1
The German combined statutory tax rate for Infineon Technologies AG is 29 percent for the 2013 and 2012
fiscal years. This comprised a corporate tax rate of 15 percent, plus a solidarity surcharge of 5.5 percent and
a municipal trade tax rate of 13 percent.
A reconciliation of income taxes from continuing operations for the fiscal years ended September 30, 2013
and 2012, determined using the German combined statutory tax rate of 29 percent for the 2013 and 2012
fiscal years is as follows:
€ in millions 2013 2012
Expected income tax expense (89) (125)
Increase in available tax credits 10 41
Tax rate differential 20 21
Non-deductible expenses and tax-exempt income, net (1) 10
Prior year taxes – (3)
Change in valuation allowance on deferred tax assets 38 57
Other (1) –
Actual income taxes (23) 1

225INFINEON TECHNOLOGIES ANNUAL REPORT 2013
NOTES TO THE CONSOLIDATED FINANCIAL STATEMENTS
Deferred tax assets and liabilities as of September 30, 2013 and 2012 are composed of the following:
€ in millions
September 30, 2013 September 30, 2012
Deferred tax assets
Deferred tax liabilities
Deferred tax assets
Deferred tax liabilities
Intangible assets 12 (29) 16 (24)
Property, plant and equipment 95 (6) 103 (7)
Provisions and pension obligations 122 (104) 137 (112)
Tax loss carry-forwards 1,004 – 1,036 –
Tax credit carry-forwards 263 – 290 –
Other 150 (10) 136 (10)
Total deferred taxes 1,646 (149) 1,718 (153)
Valuation allowance (1,176) – (1,254) –
Netting (145) 145 (149) 149
Total 325 (4) 315 (4)
In Germany Infineon Technologies AG had corporation tax loss carry-forwards of €2.9 billion and municipal trade
tax loss carry-forwards of €4.0 billion as of September 30, 2013. In other jurisdictions tax loss carry-forwards
amounted to €56 million and unused tax credit carry-forwards of €263 million. Such tax loss carry-forwards
and tax credit carry-forwards are generally limited to use by the particular entity that generated the loss or credit,
provided that they have not expired under current law. Of the tax loss carry-forwards in other jurisdictions,
€24 million expire within 7 years as a result of the respective legal requirements.
Infineon assessed its deferred tax assets and the need for a valuation allowance. The existence of tax loss
carry-forwards is generally strong evidence that the utilization of deferred tax assets is not probable. For the
assessment of deferred tax assets in Germany, Infineon therefore focused in particular on the historically profit-
able continuing operations.
Based on the results of this assessment of deferred tax assets, considering all positive and negative factors
and information relating to the foreseeable future, Infineon recognized deferred tax assets, after netting, of
€325 million and €315 million as of September 30, 2013 and 2012, respectively.
The change of the net amount of deferred tax assets and liabilities during the 2013 and 2012 fiscal years
can be broken down as follows:
€ in millions 2013 2012
Deferred taxes, net as of the beginning of the fiscal year 311 255
Deferred tax benefit attributable to continuing operations 16 48
Deferred taxes recognized in equity (2) 4
Foreign currency translation (4) 4
Deferred taxes, net as of the end of the fiscal year 321 311
Infineon did not provide for income taxes or foreign withholding taxes on cumulative earnings of foreign
subsidiaries as of September 30, 2013 and 2012, as these earnings are intended to be indefinitely reinvested
in those operations. It is not practicable to estimate the amount of unrecognized deferred tax liabilities for
these undistributed foreign earnings.

INFINEON TECHNOLOGIES ANNUAL REPORT 2013
CONSOLIDATED FINANCIAL STATEMENTS226
Including the items credited directly to equity and the expense/ benefit from continuing and discontinued
operations, the income tax expense/ benefit consisted of the following:
€ in millions 2013 2012
Income taxes from continuing operations (23) 1
Income taxes from discontinued operations (1) (8)
Income taxes recognized directly in equity (2) 7
Income taxes (26) –
12 Earnings per share
Basic earnings per share (“EPS”) are calculated by dividing group net income by the weighted average number
of ordinary shares outstanding during the reporting period. The number of shares outstanding is increased
when stock options are exercised and decreased by share repurchases and the acquisition of shares following
the exercise of put options on own shares.
Basic earnings per share are calculated as follows:
€ in millions (unless otherwise stated) 2013 2012
Earnings from continuing operations attributable to shareholders of Infineon Technologies AG 283 432
Loss from discontinued operations, net of income taxes attributable to shareholders of Infineon Technologies AG (11) (5)
Earnings attributable to shareholders of Infineon Technologies AG 272 427
Weighted-average number of shares outstanding (in millions):
– Ordinary share capital 1,080.7 1,086.6
– Adjustment for own shares (5.4) (6.3)
Weighted-average number of shares outstanding – basic 1,075.3 1,080.3
Basic earnings per share ¹ (in €):
Earnings from continuing operations attributable to shareholders of Infineon Technologies AG 0.26 0.40
Loss from discontinued operations, net of income taxes attributable to shareholders of Infineon Technologies AG (0.01) –
Earnings per share attributable to shareholders of Infineon Technologies AG – basic 0.25 0.40
1 The calculation for earnings per share is based on unrounded figures.
The weighted-average number of shares outstanding of the ordinary share capital increased pro rata during the
2013 fiscal year by the exercise of 776,702 stock options by employees. The pro rata effect of the acquisition
of 6 million own shares is shown as “Adjustment for own shares”.
The calculation of diluted EPS is based on the assumption that all potentially dilutive instruments are converted
into ordinary shares – with the consequence of a corresponding increase in the number of shares on the one
hand and a corresponding reduction in the charge on earnings for these instruments, such as interest expense,
on the other. The convertible bond due 2014 is a potentially dilutive instrument. This instrument is only included
in the calculation of diluted EPS if the effect of a potential conversion into ordinary shares is dilutive, i. e. reduces
EPS from continuing operations. Stock options and outstanding put options issued on own shares are also
potentially dilutive instruments if the exercise price is lower than the average share price for the period (for the
stock options) or higher than the average share price for the period (for the put options on own shares).

227INFINEON TECHNOLOGIES ANNUAL REPORT 2013
NOTES TO THE CONSOLIDATED FINANCIAL STATEMENTS
Diluted earnings per share are calculated as follows:
€ in millions (unless otherwise stated) 2013 2012
Earnings from continuing operations attributable to shareholders of Infineon Technologies AG 283 432
Adjustment for interest expense on convertible bond – 14
Earnings from continuing operations attributable to shareholders of Infineon Technologies AG – diluted 283 446
Loss from discontinued operations, net of income taxes attributable to shareholders of Infineon Technologies AG (11) (5)
Earnings attributable to shareholders of Infineon Technologies AG – diluted 272 441
Weighted-average number of shares outstanding – basic (in millions): 1,075.3 1,080.3
Adjustments for:
– Effect of potential conversion of convertible bond – 52.7
– Effect of stock options 0.7 1.2
– Effect of put options on own shares – 0.1
Weighted-average number of shares outstanding – diluted 1,076.0 1,134.3
Diluted earnings per share ¹ (in €):
Earnings from continuing operations attributable to shareholders of Infineon Technologies AG 0.26 0.39
Loss from discontinued operations, net of income taxes attributable to shareholders of Infineon Technologies AG (0.01) –
Earnings per share attributable to shareholders of Infineon Technologies AG – diluted 0.25 0.39
1 The calculation for earnings per share is based on unrounded figures.
The weighted-average number of potentially dilutive instruments that did not have a dilutive impact and were
hence not taken into account in the calculation of diluted earnings per share included:
> For the 2013 fiscal year 50.6 million shares which could be issued upon conversion of the convertible bond
were not taken into account, since they would have increased the earnings per share. In the 2012 fiscal year
these shares were taken into account since they reduced the diluted earnings per share.
> In the 2013 and 2012 fiscal years 12.0 million and 12.2 million, respectively, of stock options issued to
members of the Management Board and employees were not taken into account, since their exercise price
was higher than the average share price during the reporting period.
> In the 2013 and 2012 fiscal year 2.2 million and 6.2 million, respectively, put options written on own shares
were not taken into account since their exercise price was lower than the average share price during the
reporting period.
13 Financial investments
Financial investments comprise fixed-term deposits with banks and investments in securities. Fixed-term bank
deposits have an original term of up to six months. These items qualify as “loans and receivables” pursuant
to IAS 39 “Financial Instruments: Recognition and Measurement” and are measured at amortized cost. Financial
investments also include available-for-sale securities which are measured at their fair value at the end of the
relevant accounting period, with unrealized gains and losses that are not considered to be permanent impair-
ments recognized in equity. Upon disposal or permanent impairment the gains and losses from available-for-sale
securities are recognized through profit or loss.
Financial investments at September 30, 2013 and 2012 comprise the following (for further information see also
notes 36 and 37):
€ in millions 2013 2012
Fixed-term bank deposits 1,706 1,754
Securities 53 56
Financial investments 1,759 1,810

INFINEON TECHNOLOGIES ANNUAL REPORT 2013
CONSOLIDATED FINANCIAL STATEMENTS228
14 Trade and other receivables
Trade and other receivables due within one year at September 30, 2013 and 2012 consist of the following:
€ in millions 2013 2012
Third party – trade 522 485
Related parties – trade 4 5
Trade accounts receivable, gross 526 490
Allowance for doubtful accounts (8) (16)
Trade accounts receivable, net 518 474
Grants receivable (note 6) 39 53
Third party – financial and other receivables 13 11
Employee receivables 1 1
Total 571 539
Changes in the allowance for doubtful accounts on trade receivables for the years ended September 30, 2013
and 2012 were as follows:
€ in millions 2013 2012
Allowance for doubtful accounts at beginning of year 16 22
Usage of allowance, net (2) (6)
Current year’s allowance, net of reversals (6) –
Allowance for doubtful accounts at end of year 8 16
Allowances for financial and other third party receivables totaling €2 million were reversed in the 2013 fiscal year.
The following table provides separate disclosure on the age of third party trade accounts receivable that are
outstanding but not impaired at the reporting date:
€ in millions
Of which not impaired but past due as of reporting date
Carrying amount
Thereof neither
impaired nor past due
Past due 0 –
30 days
Past due 31 –
60 days
Past due 61 –
180 days
Past due 181 –
360 days
Past due > 360 days
Third party – trade, net of allowances as of September 30, 2013 514 496 12 1 1 – 4
Third party – trade, net of allowances as of September 30, 2012 469 455 8 – – 2 4
With respect to trade accounts receivable that are not due and not impaired at the end of the reporting period,
there are no indications that customers, based on their past credit history and current creditworthiness
assessments, are not able to meet their obligations.
Receivables with a maturity of more than one year are presented as other financial assets (see note 20).

229INFINEON TECHNOLOGIES ANNUAL REPORT 2013
NOTES TO THE CONSOLIDATED FINANCIAL STATEMENTS
15 Inventories
Inventories at September 30, 2013 and 2012 consist of the following:
€ in millions 2013 2012
Raw materials and supplies 92 77
Work in progress 350 309
Finished and purchased goods 167 181
Total 609 567
The amount of inventories recognized as expense in the 2013 and 2012 fiscal years corresponds approximately
to the cost of goods sold for each fiscal year.
Inventories at September 30, 2013 and 2012 are stated net of write-downs of €83 million and €85 million,
respectively.
16 Other current financial assets
€ in millions 2013 2012
Restricted cash 7 –
Derivative financial instruments 2 9
Total 9 9
The item “Restricted cash” includes at September 30, 2013 €7 million for interest payments in connection
with the subordinated convertible bonds due 2014 (see note 27), which were reported at September 30, 2012
under other financial assets (see note 20).
17 Other current assets
Other current assets at September 30, 2013 and 2012 consist of the following:
€ in millions 2013 2012
VAT and other receivables from tax authorities 66 64
Prepaid expenses 33 35
Other 37 50
Total 136 149

INFINEON TECHNOLOGIES ANNUAL REPORT 2013
CONSOLIDATED FINANCIAL STATEMENTS230
18 Property, plant and equipment
A summary of changes in property, plant and equipment for the years ended September 30, 2013 and 2012
is as follows:
Changes in property, plant and equipment 2013
€ in millions Cost
October 1, 2012
Additions Disposals Reclassi-fication
Transfers ¹ Foreign currency
effects
Sep tem-ber 30,
2013
Land and buildings 827 11 (2) 26 – (2) 860
Technical equipment and machinery 5,949 120 (80) 177 11 (8) 6,169
Other plant and office equipment 1,131 43 (55) 4 – (4) 1,119
Payments on account and construction in progress 278 142 – (207) – (1) 212
Total 8,185 316 (137) – 11 (15) 8,360
Changes in property, plant and equipment 2012
€ in millions Cost
October 1,2011²
Additions Disposals Reclassi-fication
Transfers ¹ Foreign currency
effects
Sep tem-ber 30,
2012²
Land and buildings 770 46 (3) 11 – 3 827
Technical equipment and machinery 5,313 456 (68) 233 – 15 5,949
Other plant and office equipment 1,121 73 (78) 12 – 3 1,131
Payments on account and construction in progress 296 247 (1) (256) (9) 1 278
Total 7,500 822 (150) – (9) 22 8,185
1 For the year ended September 30, 2013 and 2012, transfers relate primarily to assets that were classified as held for sale.
2 The opening balances of cost and accumulated depreciation and impairment for the fiscal year 2012 were adjusted in accordance with IAS 8 (41) ff.
As part of the reclassification of Altis from asset held for sale in the 2008 fiscal year, the cost as well as accumulated depreciation and impairment
were both understated by €1,05 billion. These adjustments have no effect on published net book values in the consolidated statements of
financial positions or any amounts in the consolidated statements of operations, the consolidated statements of comprehensive income or the
consolidated statements of cash flows. Also there was no impact on the performance, financial condition or results of operations of Infineon
resulting from this adjustment at any time.
Depreciation on property, plant and equipment is presented in the Consolidated Statement of Operations mainly
in cost of goods sold.
Impairments are recognized as other operating expense in the Consolidated Statement of Operations. No property,
plant and equipment was transferred to a third party as security or pledged as of September 30, 2013 and 2012.

231INFINEON TECHNOLOGIES ANNUAL REPORT 2013
NOTES TO THE CONSOLIDATED FINANCIAL STATEMENTS
Accumulated depreciation and impairment Carrying amount
October 1, 2012
Depre-ciation
Disposals Reclassi-fication
Transfers ¹ Impair-ments
Foreign currency
effects
Septem-ber 30,
2013
Septem-ber 30,
2013
Septem-ber 30,
2012
(596) (27) 2 – – – 1 (620) 240 231
(4,839) (349) 79 (9) (11) – 7 (5,122) 1,047 1,110
(1,019) (66) 55 9 – – 3 (1,018) 101 112
– – – – – – – – 212 278
(6,454) (442) 136 – (11) – 11 (6,760) 1,600 1,731
Accumulated depreciation and impairment Carrying amount
1. Oktober2011²
Depre-ciation
Disposals Reclassi-fication
Transfers ¹ Impair-ments
Foreign currency
effects
Septem-ber 30,
2012²
Septem-ber 30,
2012²
Septem-ber 30,
2011²
(567) (24) 3 – – (6) (2) (596) 231 203
(4,549) (329) 67 (5) – (9) (14) (4,839) 1,110 764
(1,041) (57) 77 5 – – (3) (1,019) 112 80
– – – – – – – – 278 296
(6,157) (410) 147 – – (15) (19) (6,454) 1,731 1,343

INFINEON TECHNOLOGIES ANNUAL REPORT 2013
CONSOLIDATED FINANCIAL STATEMENTS232
19 investments accounted for using the equity method
Infineon Technologies Bipolar GmbH & Co. KG
Effective September 30, 2007, and based on an agreement between the Company and Siemens AG (“Siemens”)
dated September 28, 2007, the Company contributed all assets and liabilities of its high power bipolar business
(including licenses, patents, and frontend and backend production assets) to a newly formed legal entity called
Infineon Technologies Bipolar GmbH & Co. KG (“Bipolar”) and Siemens subsequently acquired a 40 percent
interest in Bipolar. The transaction received regulatory approval and subsequently closed on November 30, 2007.
The joint venture agreement grants Siemens certain contractual participating rights, which inhibit Infineon
from exercising control over Bipolar. Accordingly, Infineon accounts for the interest in Bipolar under the equity
method. The fiscal year-end of Bipolar is September 30.
LS Power Semitech Co., Ltd.
In the 2009 fiscal year, the Company entered into a joint venture agreement with LS Industrial Systems Co., Ltd.
(“LSIS”), which closed on November 27, 2009, to establish the joint venture LS Power Semitech Co., Ltd. (“LS”).
LSIS holds 54 percent and the Company holds 46 percent of LS. LS develops, manufactures and sells molded
power modules for household appliances. The investment in the joint venture is accounted for using the equity
method. The fiscal year-end of LS is December 31, which is the fiscal year-end of LSIS. The Company’s share
in the results of LS is recognized based on interim financial statements with a three-month time lag with no
material impact.
Cryptomathic Holding ApS
The Company acquired its 25 percent share in Cryptomathic Holding ApS (“Cryptomathic”) in May 2002. Crypto-
mathic − through its subsidiary Cryptomathic A/S − develops and sells software and consultancy services in
the field of digital security. The fiscal year-end for Cryptomathic is December 31. As a consequence of a share
buy-back Infineon’s share increased to 34 percent. The investment is accounted for using the equity method.
The Company’s share in the results of Cryptomathic is recognized based on interim financial statements with
a three-month time lag with no material impact.
Summarized financial information
The summarized financial information for investments accounted for using the equity method (not adjusted for
the percentage ownership held by Infineon), for the years ended September 30, 2013 and 2012 is as follows:
€ in millions
2013
Current assets
Non-current assets
Current liabilities
Non-current liabilities
Equity Revenue Gross profit Net income (loss)
Bipolar 62 14 14 12 50 83 11 1
LS 9 19 13 8 7 22 1 (5)
Cryptomathic 7 1 4 – 4 10 7 4
Total 78 34 31 20 61 115 19 –
€ in millions
2012
Current assets
Non-current assets
Current liabilities
Non-current liabilities
Equity Revenue Gross profit Net income (loss)
Bipolar 62 15 16 11 50 95 8 1
LS 9 21 6 12 12 15 – (6)
Cryptomathic 5 1 2 – 4 7 4 1
Total 76 37 24 23 66 117 12 (4)
The net book value of LS was already written off in full owing to the share of losses already recognized in prior
years. The share of additional losses for the 2013 fiscal year of €2 million has not been recognized as the Com-
pany has no obligation to absorb such losses. Cumulative losses amount to €2 million as at September 30, 2013.

233INFINEON TECHNOLOGIES ANNUAL REPORT 2013
NOTES TO THE CONSOLIDATED FINANCIAL STATEMENTS
20 Other financial assets
Other non-current financial assets at September 30, 2013 and 2012 consist of the following:
€ in millions 2013 2012
Restricted cash 75 83
Securities 15 14
Investments in other equity investments 6 6
Long-term receivables 5 5
Grants receivable (note 6) 5 5
Other 10 11
Total 116 124
Restricted cash at September 30, 2013 and 2012, primarily consists of a rental deposit in escrow in connec-
tion with the Campeon head office of €75 million (see note 39). At September 30, 2012, €7 million was addi-
tionally recorded in connection with interest payments for Infineon’s subordinated convertible bonds due 2014
(see note 27), which is recorded as Other current financial assets as at September 30, 2013 (see note 16).
21 Other assets
Other non-current assets at September 30, 2013 and 2012 consist of the following:
€ in millions 2013 2012
Advance payments 7 13
Prepaid expenses 28 26
Assets arising from employee benefits (note 35) 2 –
Other – 1
Total 37 40

INFINEON TECHNOLOGIES ANNUAL REPORT 2013
CONSOLIDATED FINANCIAL STATEMENTS234
22 Goodwill and other intangible assets
The following table presents the composition of intangible assets for the years ended September 30, 2013 and 2012.
Amortization of intangible assets is mainly presented in cost of goods sold. Impairments of intangible assets are
presented as other operating expense.
Changes in goodwill and other intangible assets 2013
€ in millions Cost
October 1, 2012
Additions internally
developed
Additionspurchased
Disposals Foreign currency
effects
September 30, 2013
Goodwill acquired for consideration 21 – – – – 21
Internally developed intangible assets 194 51 – – – 245
Other intangible assets 141 – 12 (17) – 136
Total 356 51 12 (17) – 402
Changes in goodwill and other intangible assets 2012
€ in millions Cost
October 1, 2011
Additions internally
developed
Additionspurchased
Disposals Foreign currency
effects
September 30, 2012
Goodwill acquired for consideration 21 – – – – 21
Internally developed intangible assets 137 57 – – – 194
Other intangible assets 141 – 1 (1) – 141
Total 299 57 1 (1) – 356
€19 million of the €21 million goodwill is allocated to a CGU within the Power Management & Multimarket
segment. Reference is made to note 2, subsection “Recoverability of intangible assets and other long-lived assets”
with respect to the procedures and assumptions used for the annual impairment test for goodwill.
No intangible assets were transferred to a third party as security or pledged as of September 30, 2013 and 2012.

235INFINEON TECHNOLOGIES ANNUAL REPORT 2013
NOTES TO THE CONSOLIDATED FINANCIAL STATEMENTS
Accumulated amortization and impairment Carrying amounts
October 1, 2012
Amortization Disposals Impairment Foreign currency
effects
September 30, 2013
September 30, 2013
September 30, 2012
– – – – – – 21 21
(75) (19) – (15) – (109) 136 119
(135) (5) 17 – – (123) 13 6
(210) (24) 17 (15) – (232) 170 146
Accumulated amortization and impairment Carrying amounts
October 1, 2011
Amortization Disposals Impairment Foreign currency
effects
September 30, 2012
September 30, 2012
September 30, 2011
– – – – – – 21 21
(58) (12) – (5) – (75) 119 79
(130) (6) 1 – – (135) 6 11
(188) (18) 1 (5) – (210) 146 111

INFINEON TECHNOLOGIES ANNUAL REPORT 2013
CONSOLIDATED FINANCIAL STATEMENTS236
23 Trade and other payables
Trade and other payables at September 30, 2013 and 2012 consist of the following:
€ in millions 2013 2012
Third party – trade 557 603
Related parties – trade 12 12
Trade payables 569 615
Related parties – other payables 1 2
Other 4 5
Total 574 622
Trade payables have a maturity of less than one year. The reported carrying amount of trade payables
corresponds to their fair value.
Long-term trade payables with a maturity of more than one year are reported in other financial liabilities
(see note 28).
24 Provisions
Current and non-current provisions at September 30, 2013 and 2012 consist of the following:
€ in millions 2013 2012
Personnel costs 176 188
Warranties 114 109
Provisions related to Qimonda 356 326
Other 75 117
Total 721 740
Provisions for personnel costs include, among others, costs of variable compensation, severance payments,
service anniversary awards, other personnel costs and social security costs.
Provisions for warranties mainly represent the estimated future cost of fulfilling contractual requirements
associated with products sold.
Provisions relating to Qimonda are described in detail in note 38.
Other provisions comprise provisions for penalties for default or delay on contracts, asset retirement obligations,
litigations (other than provisions relating to Qimonda) and miscellaneous other liabilities.
Of the total provisions of €721 million and €740 million as of September 30, 2013 and 2012, respectively,
a cash outflow of €675 million and €710 million, respectively, is expected to occur within one year. For the
majority of the remaining €46 million and €30 million as of September 30, 2013 and 2012, respectively, the
cash outflow is expected within two to five years.

237INFINEON TECHNOLOGIES ANNUAL REPORT 2013
NOTES TO THE CONSOLIDATED FINANCIAL STATEMENTS
The change in provisions during the fiscal year ended September 30, 2013 is as follows:
€ in millions October 1, 2012
Additions
Usage
Reversals
Septem-ber 30,
2013
Personnel costs 188 129 (130) (11) 176
Warranties 109 48 (13) (30) 114
Provisions related to Qimonda 326 42 (9) (3) 356
Other 117 – (17) (25) 75
Total 740 219 (169) (69) 721
The total amounts of provisions are reflected in the Consolidated Statement of Financial Position as of Septem-
ber 30, 2013 and 2012, respectively, as follows:
€ in millions 2013 2012
Current 675 710
Non-current 46 30
Total 721 740
25 Other current financial liabilities
Other current financial liabilities at September 30, 2013 and 2012 consist of the following:
€ in millions 2013 2012
Accrued interest 8 8
Derivative financial instruments with negative fair values (note 36) 4 3
Obligation to acquire own shares (note 30) – 89
Total 12 100
The obligation to acquire own shares in connection with Infineon’s capital returns program is reported within
other current financial liabilities. The obligation amounted to €89 million as of September 30, 2012 and
corresponded to the discounted exercise value of outstanding put options on Infineon Technologies AG shares
as at issue date (see note 30), plus interest up to the end of the reporting period.
26 Other current liabilities
Other current liabilities at September 30, 2013 and 2012 consist of the following:
€ in millions 2013 2012
Payroll obligations to employees 66 58
Advance payments 24 31
Deferred government grants (note 6) 19 7
Deferred income 18 15
VAT and other taxes payable 8 9
Other 2 2
Total 137 122

INFINEON TECHNOLOGIES ANNUAL REPORT 2013
CONSOLIDATED FINANCIAL STATEMENTS238
27 Debt
Debt at September 30, 2013 and 2012 consists of the following:
€ in millions 2013 2012
Current maturities of long-term debt 26 55
Convertible subordinated bonds, 7.5%, due 2014 108 –
Short-term debt and current maturities of long-term debt 134 55
Convertible subordinated bonds, 7.5%, due 2014 – 100
Loans payable to banks:
Unsecured loans, weighted average interest rate 1.25% (2012: 1.40%), due 2014 – 2022 169 140
Long-term debt 169 240
Total 303 295
On May 26, 2009, the Company (as guarantor), through its subsidiary Infineon Technologies Holding B.V.
(as issuer), issued €196 million in new subordinated convertible bonds due 2014 at a discount of 7.2 percent
in an offering to institutional investors in Europe. The bonds can be converted at any time during the term into
a maximum, at the time of issue, of 74.9 million ordinary shares of the Company. After adjustments in connec-
tion with anti-dilution clauses at the time of the Company’s share capital increase in August 2009 as well as
for the dividend payments for the fiscal years 2010 to 2012, the conversion price currently stands at €2.22.
The bonds pay interest at 7.5 percent per year. The principal of the bonds is unsecured and ranks pari passu
with all present and future unsecured subordinated obligations of the issuer. The coupons on the bonds are
secured and unsubordinated. The bondholders benefit from a negative pledge relating to future capital market
indebtedness for the duration of the bonds, and have an early redemption option in the event of a change of
control of Infineon Technologies AG. Since December 16, 2011, Infineon Technologies AG can offer the bond-
holders early redemption of the outstanding bonds due 2014 at their nominal amount plus interest accrued up
to the repayment date, if the Company’s closing share price exceeds 150 percent of the conversion price on
15 out of 30 consecutive trading days. If following such offer the bondholders choose conversion of the con-
vertible bonds, they receive in addition to the underlying shares, the present value of the outstanding interest
payments until maturity. The bonds are listed on the Open Market (Freiverkehr) of the Frankfurt Stock Exchange.
€31 million attributable to the conversion right of the bondholders was recognized in additional paid-in capital
in the 2009 fiscal year when the subordinated convertible bonds due 2014 were issued. The debt component
of the convertible bonds is recorded at amortized cost using the effective interest method. The convertible
bonds are reported under current financial liabilities as of September 30, 2013.
In fiscal years 2011 and 2012 the Company repurchased and cancelled bonds with a nominal amount of
€83 million partly in conjunction with its capital returns program (see note 30). The remainder of the bonds
outstanding at the balance sheet date with a nominal value of €113 million can be converted into up to
51 million shares.
Loans payable to banks relate primarily to project financing at Infineon Technologies Austria AG.

239INFINEON TECHNOLOGIES ANNUAL REPORT 2013
NOTES TO THE CONSOLIDATED FINANCIAL STATEMENTS
Infineon has also established several additional independent financing arrangements, in the form of both
short- and long-term lines of credit. The total lines of credit as of September 30, 2013 are summarized in the
following table:
€ in millions
Term
As of September 30, 2013
Nature of financial institution commitment
Purpose/Intended use Aggregatefacility
Drawn Available
Short-term Firm commitment General corporate purposes, working capital, guarantees 62 – 62
Short-term No firm commitment Working capital, cash management 27 – 27
Long-term ¹ Firm commitment General corporate purposes 135 135 –
Long-term ¹ Firm commitment Project finance 60 60 –
Total 284 195 89
1 Including current maturities of long-term debt.
Interest expense incurred in connection with debt for the years ended September 30, 2013 and 2012, was
€19 million.
Aggregate amounts of debt maturing subsequent to September 30, 2013 are as follows:
Fiscal year ending September 30 (€ in millions) Amount
2014 134
2015 125
2016 13
2017 12
2018 and after 19
Total 303
Aggregate amounts of interest on debt payable subsequent to September 30, 2013 are as follows:
Fiscal year ending September 30 (€ in millions) Amount
2014 ¹ 11
2015 1
2016 1
2017 –
2018 and after –
Total 13
1 Includes the difference between the carrying and nominal value of the subordinated convertible bonds due 2014 (unwinding effects).
28 Other financial liabilities
Other non-current financial liabilities amounted to €7 million and €8 million as of September 30, 2013 and
2012, respectively.

INFINEON TECHNOLOGIES ANNUAL REPORT 2013
CONSOLIDATED FINANCIAL STATEMENTS240
29 Other liabilities
Other non-current liabilities as of September 30, 2013 and 2012 consist of the following:
€ in millions 2013 2012
Deferred income 32 39
Deferred personnel expenses 16 17
Deferred government grants (note 6) 12 11
Other 3 3
Total 63 70
30 Equity
Ordinary share capital
As a result of the exercise of 776,702 stock options by employees (compared to 560,497 exercised in the 2012
fiscal year), the ordinary share capital of Infineon Technologies AG increased during the 2013 fiscal year by
€1,553,404. As of September 30, 2013, the ordinary share capital stood at €2,162,166,068 and is sub-divided
into 1,081,083,034 no par value registered shares, each representing €2 of the Company’s ordinary share
capital. Each share grants the holder one vote and an equal portion of the profits in the form of a dividend as
resolved by the Annual General Meeting. Own shares held by the Company as at the date of the Annual General
Meeting carry no voting rights and are not entitled to dividend. As of September 30, 2013, the Company held
6 million own shares (2012: nil).
Additional paid-in capital
Additional paid-in capital reported in the Consolidated Statement of Financial Position decreased by
€125 million in the 2013 fiscal year, of which €129 million related to the dividend paid in February 2013.
The exercise of employee stock options increased additional paid-in capital by €1 million. Expenses amounting
to €3 million for share-based compensation were recorded, additional paid-in capital increased by the same
amount (see note 32).
Additional paid-in capital reported in the Consolidated Statement of Financial Position decreased by €180 mil-
lion in the 2012 fiscal year, of which €130 million related to the dividend paid in March 2012. The Company
repurchased subordinated convertible bonds due 2014 with an exercise value of €24 million for approximately
€62 million during the 2012 fiscal year. €31 million, net of tax, was recorded directly as a reduction of addi-
tional paid-in capital, reflecting the repurchase of conversion rights for 10.4 million shares associated with the
convertible bond repurchase, measured on the basis of the conversion ratio at the time of repurchase (see
note 27). Additional paid-in capital was increased by €8 million in the 2012 fiscal year as a result of option
premiums received in connection with put options on own shares (see below). As a consequence of the cancel-
lation of 7 million own shares and the related capital reduction, additional paid-in capital was, in return, reduced
by €32 million. The exercise of employee stock options increased additional paid-in capital by €1 million.
Expenses amounting to €2 million for share-based compensation were recorded, additional paid-in capital
increased by the same amount (see note 32).
Authorized share capital
As of September 30, 2013, the Company’s Articles of Association provide for two authorized capitals totaling
€688,000,000.
Section 4(8) of the Articles of Association provides that the Management Board is authorized, with the approval
of the Supervisory Board, to increase the share capital in the period until February 10, 2015 once or in partial
amounts by a total of up to €648,000,000 by issuing up to 324,000,000 new no par value registered shares,
carrying a dividend right as of the beginning of the fiscal year in which they are issued, against contributions in
cash or in kind (Authorized Capital 2010/I). The Management Board is authorized, with the approval of the
Supervisory Board, to exclude the subscription rights of the shareholders in certain cases.

241INFINEON TECHNOLOGIES ANNUAL REPORT 2013
NOTES TO THE CONSOLIDATED FINANCIAL STATEMENTS
However, in order to protect the shareholders against the dilution of their holdings, the Management Board of
Infineon Technologies AG has undertaken to make use of this authorization to exclude the subscription rights
of the shareholders in the case of capital increases against contributions in cash or in kind out of the Authorized
Capital 2010/I, only up to an amount equivalent to 10 percent of the share capital at the time the authority
comes into force or, if the latter value should be lower, the equity capital existing at the time the authority is
exercised. Any capital increase utilizing the Authorized Capital 2010/I with the subscription rights of the share-
holders excluded is thus limited to a maximum of 108,108,303 no par value shares or €216,216,606 as at
September 30, 2013.
Section 4(9) of the Articles of Association further provides that the Management Board is authorized, with the
approval of the Supervisory Board, to increase the share capital in the period until February 10, 2015 once or in
partial amounts by a total of up to €40,000,000 by issuing up to 20,000,000 new no par value registered shares
against contributions in cash for the purpose of increasing the number of shares issued to employees of the
Company or its group companies (Authorized Capital 2010/II). The subscription rights of the shareholders are
excluded in relation to these shares.
Conditional Capital
As of September 30, 2013, the Company’s conditional capital recorded in the Commercial Register amounts to
€496,407,054. It has been created through five conditional capital increases:
> Conditional Capital I (registered in the Commercial Register as “Conditional Capital 1999/I”) pursuant to sec-
tion 4(4) of the Articles of Association in an aggregate nominal amount of up to €34,628,048 that may be used
to issue up to 17,314,024 new registered shares in connection with the Company’s “Infineon Technologies AG
2001 International Long Term Incentive Plan” (“Long-Term Incentive Plan 2001”);
> Conditional Capital III (registered in the Commercial Register as “Conditional Capital 2001/I”) pursuant to
section 4(5) of the Articles of Association in an aggregate nominal amount of up to €27,879,006 that may be
used to issue up to 13,939,503 new registered shares in connection with the Company’s Long-Term Incentive
Plan 2001 and “Infineon Technologies AG Aktienoptionsplan 2006” (“Stock Option Plan 2006”) (see note 32);
> Conditional Capital 2009/I pursuant to section 4(7) of the Articles of Association in an aggregate nominal
amount of €149,900,000 that may be used to issue up to 74,950,000 new registered shares to the holders
of the convertible bonds issued in May 2009 upon conversion (see note 27);
> Conditional Capital 2010/I pursuant to section 4(10) of the Articles of Association in an aggregate nominal
amount of up to €24,000,000 that may be used to issue up to 12,000,000 new registered shares in connec-
tion with the Company’s “Infineon Technologies AG Aktienoptionsplan 2010” (“Stock Option Plan 2010”)
(see note 32);
> Conditional Capital 2010/II pursuant to section 4 (11) of the Articles of Association in an aggregate nominal
amount of €260,000,000 that may be used to issue up to 130,000,000 new registered shares to the holders
of warrants or convertible bonds, which the Company may issue at any time prior to February 10, 2015.
Other reserves
Other reserves changed as follows during the fiscal years ended September 30, 2013 and 2012:
€ in millions 2013 2012
Pretax Tax effect Net Pretax Tax effect Net
Unrealized gains (losses) on hedging instruments (7) – (7) 8 – 8
Foreign currency translation adjustment (12) – (12) 10 – 10
Total (19) – (19) 18 – 18

INFINEON TECHNOLOGIES ANNUAL REPORT 2013
CONSOLIDATED FINANCIAL STATEMENTS242
Accumulated deficit
The following table shows a reconciliation of accumulated deficit as of September 30, 2013 and 2012:
€ in millions
As of October 1, 2011 (4,514)
Net income attributable to shareholders of Infineon Technologies AG 427
Actuarial loss on post employment benefit obligations net of tax of €4 million (112)
As of September 30, 2012 (4,199)
Net income attributable to shareholders of Infineon Technologies AG 272
Actuarial gains on post employment benefit obligations net of tax of negative €2 million 20
As of September 30, 2013 (3,907)
Put options on own shares and own shares
On May 9, 2011 Infineon Technologies AG resolved to repurchase shares on the basis of the authorization
given by shareholders at the Annual General Meeting on February 17, 2011. From the original sum of up to
€300 million allocated to measures aimed at returning capital to shareholders, €212 million were spent by the
end of the program on March 31, 2013. The capital return has in particular been effected through writing put
options on Infineon shares, and additionally through repurchases of outstanding convertible bonds. The share
repurchase was carried out in accordance with sections 14 (2) and 20a (3) of the German Securities Trading Act
in connection with the provisions of Commission Regulation (EC) No. 2273/2003 of December 22, 2003.
During the course of the share repurchase program the Company issued put options on its own shares with a
maximum term of nine months for an exercise value of €302 million, thereby earning a premium of €16 million.
During the 2013 fiscal year up to the end of the program on March 31, 2013, put options for 6 million shares
were exercised for which the Company paid €38 million to the owners of the options, leaving a total of 6 million
own shares on hand as of September 30, 2013. In the 2011 and 2012 fiscal years, the Company repurchased
7 million shares for €46 million and cancelled all of them in 2012, reducing the ordinary share capital accord-
ingly. Since the completion of the program on March 31, 2013 no put options remain outstanding (as of Sep-
tember 30, 2012, put options with an exercise value of €89 million corresponding to a total of 16 million
shares were outstanding).
The obligation to acquire own shares recognized as of September 30, 2012, measured at the present value of
the amount expected to settle the outstanding put options, amounted to €88 million and resulted in a corre-
sponding reduction in equity which was reported within the equity line item “Put options on own shares”. The
obligation was recognized within “Other current financial liabilities”, and measured on an accrual basis with
interest unwound over the term of the instrument. The relevant liabilities were extinguished when the put
options were settled by payment. At that stage, the amount previously recorded within equity was reclassified
from “Put options on own shares” to “Own shares”. If the options were not exercised, the relevant liability was
derecognized and equity increased accordingly.

243INFINEON TECHNOLOGIES ANNUAL REPORT 2013
NOTES TO THE CONSOLIDATED FINANCIAL STATEMENTS
The following table contains the development of put options during the 2013 and 2012 fiscal year:
In each case stated in millions Exercise value
in €
Underlying number
of shares
Outstanding put options as of October 1, 2011 144 26
Put options issued in the 2012 fiscal year 120 22
Less: put options lapsed in the 2012 fiscal year (155) (29)
Less: put options exercised in the 2012 fiscal year (20) (3)
Outstanding put options as of September 30, 2012 89 16
Put options issued during the 2013 fiscal year – –
Less: put options lapsed in the 2013 fiscal year (51) (10)
Less: put options exercised in the 2013 fiscal year (38) (6)
Outstanding put options as of September 30, 2013 – –
On November 19, 2013, the Supervisory Board approved a new capital returns program of up to €300 million.
This can be used until September 30, 2015, in order to acquire shares or repurchase outstanding convertible
bonds due 2014. As before, put options may be used for the acquisition by the Company of its own shares.
For details see note 41.
Dividends
Under the German Stock Corporation Act (Aktiengesetz), the amount of dividends available for distribution to
shareholders is based on the level of unappropriated profit (Bilanzgewinn) of the ultimate parent, as determined
in accordance with the HGB. All dividend payments must be approved by the Company’s shareholders at the
Annual General Meeting.
For the 2012 fiscal year, a cash dividend of €0.12 per share (total amount: €129 million) was paid in accordance
with the resolution passed at the Annual General Meeting on February 28, 2013. In the 2012 fiscal year, a cash
dividend of €0.12 per share (total amount: €130 million) was paid for the 2011 fiscal year.
A dividend payment of €0.12 for each share entitled to a dividend shall be proposed to be paid from the distrib-
utable profits of Infineon Technologies AG for the 2013 fiscal year. Taking into account the fact that own shares
held by the Company at the time of the Annual General Meeting are not entitled to receive a dividend, this would
result in an expected distribution of approximately €129 million. Since payment of the dividend depends on
approval being given by the shareholders at the Annual General Meeting which is set to take place on February 13,
2014, a liability for the dividend has not been recognized in the Consolidated Financial Statements.
31 Capital management
Our principal objective for capital management at Infineon is to ensure financial flexibility on the basis of a
solid capital structure. As with comparable companies in the semiconductor industry, it is of prime importance
that sufficient cash funds are available to finance operating activities and planned investments throughout
all phases of the business cycle. On the other hand, debt should only constitute a modest proportion of the
financing mix. Based on these principles Infineon has defined the following three key objectives for capital
management:
> gross cash position of between 30 and 40 percent of revenue,
> positive net cash position,
> gross debt of 2x EBITDA (earnings from continuing operations before tax, depreciation and amortization)
at most.
Infineon is not subject to any statutory capital requirements, nor are any such defined in the Articles
of Association.

INFINEON TECHNOLOGIES ANNUAL REPORT 2013
CONSOLIDATED FINANCIAL STATEMENTS244
Capital management as well as Infineon’s objectives and definitions of ratios are based on IFRS figures.
Infineon defines its net cash position or net debt position, as the case may be, as gross cash less the total of
short-term and long-term debt (gross debt). Gross cash is defined as the total of cash, cash equivalents and
financial investments. Infineon defines EBIT as earnings (loss) from continuing operations before interest and
taxes and EBITDA as EBIT plus scheduled depreciation/amortization.
As of September 30, 2012, Infineon had a net cash position of €1,940 million which increased to €1,983 mil-
lion over the course of the 2013 fiscal year. This development was mainly driven by the recovery of market
demand for Infineon’s products from the second quarter onwards which was also the main driver for an
increase of the gross cash position from €2,235 million at end of the previous fiscal year to €2,286 million at
September 30, 2013. Based on revenue of €3,843 million, the ratio of gross cash to revenue was 59.5 percent
as of September 30, 2013 (57.2 percent in 2012) and thus above the targeted range. This continues to give
Infineon sufficient financial flexibility to ensure that, in addition to financing its planned investments it is also
able to pay regular dividends (see note 30) as well as realize planned measures for capital returns.
A gross debt to EBITDA ratio of 0.4 as of September 30, 2013 (0.3 in 2012) demonstrates Infineon’s financing
headroom according to its key objectives.
32 Share-based compensation
The Company has the following stock option plans: the Stock Option Plan 2006 and the Stock Option Plan 2010.
Stock Option Plan 2006
In 2006, the Company’s shareholders approved the Stock Option Plan 2006 which replaced the Long Term
Incentive Plan 2001. Under the terms of the Stock Option Plan 2006, the Company could grant up to 13 million
options over a three-year period. The exercise price of each option equals 120 percent of the average closing
price of the Company’s stock during the five trading days prior to the grant date. Granted options are only
exercisable if the Infineon share outperforms the Philadelphia Semiconductor Index (“SOX”) for at least three
consecutive days on at least one occasion during the term of the option. Granted options have a vesting period
of three years, subject to the Company’s stock reaching the exercise price on at least one trading day during
the term, and expire six years from the grant date.
Stock Option Plan 2010
In 2010, the Company’s shareholders approved the Stock Option Plan 2010 which replaced the Stock Option
Plan 2006. Under the terms of the Stock Option Plan 2010, the Company could grant up to 12 million options
over a three-year period. The exercise price of each option equals 120 percent of the average closing price
of the Company’s stock during the five trading days prior to the grant date.
The exercise of granted options is conditional on the Infineon share price having outperformed the benchmark
index SOX. Initially, the respective reference values (100 percent) for this purpose was determined as the
arithmetic means of the Infineon share prices and the closing prices of the SOX over the three-month period
following the grant of the stock options. The Infineon share price must then exceed the SOX (closing price),
as measured using the respective reference values, at least once per trading day on at least ten consecutive
trading days in the period beginning one year after the grant of the stock options and lasting until the end of
their term. The aforementioned comparison must be made for each grant of the stock options with the reference
values updated accordingly.
Several Conditional Capitals further described in the Group Management Report (chapter “Information Pursuant
to section 289, Paragraph 4, and section 315, Paragraph 4, of the German Commercial Code”) and in note 30
“Equity” ensure that the options issued under the Stock Option Plan 2006 and the Stock Option Plan 2010 can
be satisfied with new shares. However, at the discretion of the Company, the beneficiary may be offered the
choice of purchasing Infineon Technologies AG shares held by the Company or receiving a cash settlement in
place of the shares issued from the Conditional Capitals created for this purpose.

245INFINEON TECHNOLOGIES ANNUAL REPORT 2013
NOTES TO THE CONSOLIDATED FINANCIAL STATEMENTS
The development of the 2006 and 2010 stock option plans during the 2012 and 2013 fiscal years is
presented below:
Number of options
(in millions)
Weighted-average exercise
price (in €)
Options outstanding as of September 30, 2011 12.9 8.10
Granted 3.7 7.03
Exercised (0.6) 2.72
Forfeited and expired (2.9) 8.90
Options outstanding as of September 30, 2012 13.1 7.85
Exercisable at September 30, 2012 6.2 7.93
Options outstanding as of September 30, 2012 13.1 7.85
Granted 4.4 7.00
Exercised (0.8) 2.72
Forfeited and expired (4.9) 9.71
Options outstanding as of September 30, 2013 11.8 7.11
Exercisable at September 30, 2013 0.9 2.72
The following table summarizes information about stock options outstanding as of September 30, 2013 and 2012:
Range of exercise prices
September 30, 2013 September 30, 2012
Number of options
(in millions)
Weighted-average
remaining life (in years)
Number of options
(in millions)
Weighted-average
remaining life (in years)
Below €5 0.9 1.67 1.7 2.67
€5 – €10 10.9 5.32 9.9 4.06
€10 – €15 – – 1.5 0.35
Total 11.8 5.05 13.1 3.45
In total, 776,702 stock options were exercised during the 2013 fiscal year. The average share price at exercise
date was €6.48. In total, 560,497 stock options were exercised during the 2012 fiscal year. The average
share price at exercise date was €5.91.
The fair value of each option grant issued pursuant to the Stock Option Plan 2006 and Stock Option Plan 2010
was determined at grant date using a Monte Carlo simulation model. This model takes into account vesting
conditions relating to the performance of the SOX and its impact on the fair value of the stock options. Infineon
uses a combination of implied volatilities from traded options on the Company’s ordinary shares and historical
volatility when calculating the fair value of stock options granted. The expected life of options granted was also
estimated using the Monte Carlo simulation model.
The forfeiture of options is estimated based on historical experience and recorded at the date of the actual
forfeitures in order to determine the fair value. The risk-free interest rate is determined at grant date using the
yields on German federal treasury notes (Bundesanleihen) with a term comparable to that of the options.

INFINEON TECHNOLOGIES ANNUAL REPORT 2013
CONSOLIDATED FINANCIAL STATEMENTS246
On December 14, 2012, 547,619 stock options were issued to members of the Management Board and
3,848,140 to selected employees. The following assumptions were used in the fair value calculation of the
stock options issued in December 2012:
Employees Management Board
members
Risk-free interest rate 0.84 % 0.84 %
Expected volatility, underlying shares 41 % 41 %
Expected volatility, SOX index 32 % 32 %
Expected correlation of underlying shares and SOX index 46 % 46 %
Average share price at measurement date €5.82 €5.82
Exercise price €7.00 €7.00
Forfeiture rate, per year 3.40 % 3.40 %
Expected dividend yield 2.04 % 2.04 %
Expected life in years 6.66 6.37
Fair value per option at grant date €1.68 €0.95
On December 15, 2011, 555,428 stock options were issued to members of the Management Board and
3,120,000 to selected employees. The following assumptions were used in the fair value calculation of the
stock options issued in December 2011:
Employees Management Board
members
Risk-free interest rate 1.46 % 1.46 %
Expected volatility, underlying shares 43 % 43 %
Expected volatility, SOX index 32 % 32 %
Expected correlation of underlying shares and SOX index 36 % 36 %
Average share price at measurement date €5.86 €5.86
Exercise price €7.03 €7.03
Forfeiture rate, per year 3.40 % 3.40 %
Expected dividend yield 2.05 % 2.05 %
Expected life in years 6.65 6.37
Fair value per option at grant date €1.75 €0.98
The fair value per option for members of the Management Board differs from that for employees in that the
maximum gain that can arise from the exercise of stock options by members of the Management Board is
capped at 250 percent of the fair value of the options at grant date (without consideration of the cap); any
options above this cap expire. The cap therefore has the effect of reducing the value of the stock options.
Further information is provided in the Compensation Report.
Share-based compensation expense
Share-based compensation expense for the fiscal years ended September 30, 2013 and 2012 amounted
to €3 million and €2 million, respectively.
33 Supplemental cash flow information
There were no significant non-cash transactions from acquisition or financing activities during the 2013 and
2012 fiscal years.
Cash and cash equivalents reported as of September 30, 2013 and 2012 totaling €527 million and €425 mil-
lion, respectively, and include €33 million and €21 million, respectively, which were subject to legal transfer
restrictions and so were not available for general use by Infineon. This amount represents cash and cash equiv-
alents of consolidated companies located in countries where transfer of cash is legally restricted, for example
the People’s Republic of China.

247INFINEON TECHNOLOGIES ANNUAL REPORT 2013
NOTES TO THE CONSOLIDATED FINANCIAL STATEMENTS
34 Related parties
Infineon has transactions in the normal course of business with equity method investees and other related com-
panies (collectively, “related companies”). The related parties which are controlled or significantly influenced
by Infineon are disclosed in note 42. Related parties also include persons in key management positions (collec-
tively “related persons”), in particular Management and Supervisory Board members and their close relatives.
Related companies
Infineon purchases certain raw materials and services from, and sells certain products and services to related
companies. These purchases from and sales to related companies are generally effected at manufacturing
cost plus a mark-up.
Related party receivables consist exclusively of trade and other receivables, and totaled €3 million as of
September 30, 2013 and 2012 from companies accounted for using the equity method and €1 million and
€2 million as of September 30, 2013 and 2012, respectively, from other related companies.
Related party payables consist exclusively of trade and other payables, and totaled €10 million as of Septem-
ber 30, 2013 and 2012 to companies accounted for using the equity method and €3 million and €4 million as
of September 30, 2013 and 2012, respectively, to other related companies.
Sales and service charges to related companies consist exclusively of sales to companies accounted for using
the equity method of €22 million and €20 million in the 2013 and 2012 fiscal years, respectively, and to
other related companies of €2 million in the 2013 and 2012 fiscal years. Purchases from related companies
consist exclusively of purchases from companies accounted for using the equity method of €82 million and
€94 million in the 2013 and 2012 fiscal years, respectively, and from other related companies of €28 million
and €27 million in the 2013 and 2012 fiscal years, respectively.
Related persons
The active members of the Management Board in the 2013 fiscal year received total fixed non-performance-
related compensation for their services of €2.4 million (2012: €3.1 million). In addition, the members of the
Management Board received variable performance-related cash compensation for their services in the 2013
fiscal year totaling €1.7 million (2012: €3.4 million). This comprised a Short Term Incentive of €0.9 million
(2012: €1.4 million), and a Mid Term Incentive of €0.8 million (2012: €2.0 million). Furthermore, based on the
Stock Option Plan 2010, 547,619 stock options were issued in the 2013 fiscal year (2012: 555,428). The total
compensation received by active members of the Management Board amounted to €4.5 million in the 2013
fiscal year (2012: €7.1 million).
The total compensation of the members of the Supervisory Board of Infineon Technologies AG in the 2013
fiscal year, including attendance fees, amounted to €1.1 million (2012: €1.2 million). Employee representatives
in the Supervisory Board also receive a salary for their activities as employees.
Former members of the Management Board received total payments of €1.1 million (principally pension pay-
ments) in the 2013 fiscal year (2012: €1.1 million).
As of September 30, 2013, pension liabilities for former members of the Management Board amounted to
€47.9 million (2012: €42.2 million).
Neither Infineon Technologies AG nor any of its subsidiaries have granted loans to any member of the Super-
visory or Management Boards.
For the disclosure of the individual remuneration of the members of the Management Board and the Supervisory
Board as required by section 315a (1) in connection with section 314 (1) no. 6a, sentences 5 to 9 of the Ger-
man Commercial Code, see the Compensation Report which is part of the Group Management Report.

INFINEON TECHNOLOGIES ANNUAL REPORT 2013
CONSOLIDATED FINANCIAL STATEMENTS248
In the 2013 and 2012 fiscal years, respectively, there were no transactions between Infineon and members
of the Management Board and Supervisory Board which fall outside of the scope of the existing employment,
service or appointment terms, or of the contractual arrangements for their remuneration.
35 Pension plans
Defined benefit pension plans
Obligations at the end of the reporting period
Pension benefits provided by Infineon are currently organized primarily through defined benefit pension plans
which cover a significant portion of Infineon’s employees. Plan benefits are principally based upon years of
service and remuneration. Certain pension plans are based on the salary earned in the last month or year of
employment, while others depend on average salary during the period of employment. The measurement date
for Infineon’s pension plans is September 30.
Information with respect to Infineon’s pension plans for the years ended September 30, 2013 and 2012 is
presented for German (“Domestic”) plans and non-German (“Foreign”) plans:
€ in millions
2013 2012
Domestic plans
Foreign plans
Total Domestic plans
Foreign plans
Total
Change in defined benefit obligations:
Present value of defined benefit obligation at beginning of year (567) (109) (676) (422) (84) (506)
Current service cost (15) (3) (18) (10) (4) (14)
Past service cost 2 (6) (4) – – –
Interest cost (19) (4) (23) (20) (5) (25)
Actuarial gains (losses) 15 6 21 (126) (14) (140)
Benefits paid 11 3 14 11 3 14
Foreign currency effects – 5 5 – (5) (5)
Present value of defined benefit obligation at end of year (573) (108) (681) (567) (109) (676)
Change in fair value of plan assets:
Fair value at beginning of year 344 39 383 307 31 338
Expected return on plan assets 17 3 20 15 2 17
Actuarial gains (losses) 1 – 1 22 1 23
Contributions from Infineon 43 6 49 11 6 17
Benefits paid (11) (3) (14) (11) (4) (15)
Foreign currency effects – (2) (2) – 3 3
Fair value of plan assets at end of year 394 43 437 344 39 383

249INFINEON TECHNOLOGIES ANNUAL REPORT 2013
NOTES TO THE CONSOLIDATED FINANCIAL STATEMENTS
Reconciliation of the amounts recognized in the Consolidated Statement of Financial Position:
€ in millions
2013 2012
Domestic plans
Foreignplans
Total Domestic plans
Foreignplans
Total
Pension obligations, net (179) (65) (244) (223) (70) (293)
Thereof recognized in: Pension plans and similar commitments (181) (65) (246) (223) (70) (293)
Thereof recognized in: Other assets 2 – 2 – – –
Certain pension scheme liabilities with a value of €11 million are backed by reinsurance policy assets with
a fair value of €13 million. The net amount of these liabilities and their related insurance assets of €2 million
is disclosed as Assets Arising from Employee Benefits within “Other Assets” (see note 21).
The funding of the present value of the defined benefit obligations is as follows:
€ in millions
2013 2012
Domestic plans
Foreignlans
Total Domestic plans
Foreignplans
Total
Plans that are wholly unfunded 74 54 128 73 50 123
Plans that are wholly or partly funded 499 54 553 494 59 553
Total 573 108 681 567 109 676
The funded status has developed since the 2009 fiscal year as follows:
€ in millions
Present value of defined benefit
obligations
Fair value of plan assets
Funded status Funded status
in %
Domestic plans (573) 394 (179) 69
2013 Foreign plans (108) 43 (65) 40
Total (681) 437 (244) 64
Domestic plans (567) 344 (223) 61
2012 Foreign plans (109) 39 (70) 36
Total (676) 383 (293) 57
Domestic plans (422) 307 (115) 73
2011 Foreign plans (84) 31 (53) 37
Total (506) 338 (168) 67
Domestic plans (456) 317 (139) 70
2010 Foreign plans (83) 30 (53) 36
Total (539) 347 (192) 64
Domestic plans (360) 305 (55) 85
2009 Foreign plans (65) 25 (40) 38
Total (425) 330 (95) 78
The funded status of Infineon’s pension plans as at September 30, 2013 and 2012 is equal to the amounts
recognized in the Consolidated Statement of Financial Position because no asset ceiling limits apply.

INFINEON TECHNOLOGIES ANNUAL REPORT 2013
CONSOLIDATED FINANCIAL STATEMENTS250
Actuarial parameters
Differences between expected and actual developments in the present value of the obligations and the fair
value of plan assets are shown in the following table.These differences arise when the expected change in plan
assets and the present value of liabilities, measured on the basis of actuarial assumptions, differ from actual
changes in assets and liabilities, excluding the effect of changes in interest rates.
€ in millions
Differences between expected and actual developments:
of present value of defined benefit obligations
of fair value of plan assets
Domestic plans (2) 1
2013 Foreign plans 1 –
Total (1) 1
Domestic plans (4) 22
2012 Foreign plans (4) 1
Total (8) 23
Domestic plans (8) (26)
2011 Foreign plans (3) (1)
Total (11) (27)
Domestic plans (3) 3
2010 Foreign plans – 1
Total (3) 4
Domestic plans (1) (14)
2009 Foreign plans 3 (4)
Total 2 (18)
The weighted-average assumptions used in calculating the actuarial values for the pension plans are as follows:
in %
2013 2012
Domestic plans
Foreignplans
Domestic plans
Foreign plans
Discount rate at the end of the fiscal year 3.7 4.2 3.5 3.8
Rate of salary increase 2.0 2.4 2.0 2.2
Projected future pension increases 2.0 0.8 2.0 0.7
Expected return on plan assets at the beginning of the fiscal year 4.8 6.9 5.0 7.3
Discount rates are established based on prevailing market rates for high-grade corporate bonds from issuers
carrying a very high credit rating that, if the pension benefit obligation were settled at the measurement date,
would provide the necessary future cash flows to pay the benefit obligation when due.
Investment strategies
Infineon’s pension plans’ assets are invested with several investment managers. The plans employ a mix of
active and passive investment management programs. Having regard to the duration of the underlying liabilities,
a portfolio of investments of plan assets in equity securities, debt securities and other assets is targeted to
maximize the long-term return on assets for a given level of risk. Investment risk is monitored on an ongoing
basis through periodic portfolio reviews, coordination with investment managers and annual liability measure-
ments. Investment policies and strategies are periodically reviewed to ensure the objectives of the plans
are met, taking into account any changes in benefit plan design, market conditions or other material items.
Furthermore, Infineon periodically commissions detailed asset/liability studies to be performed by third-party
professional investment advisors and actuaries.

251INFINEON TECHNOLOGIES ANNUAL REPORT 2013
NOTES TO THE CONSOLIDATED FINANCIAL STATEMENTS
Expected long-term rate of return on plan assets
Establishing the expected rate of return on plan assets requires a number of assumptions. Infineon’s approach
in determining the return on plan assets is based upon long term historical financial market relationships,
the types of investment classes in which pension plan assets are invested, long-term investment strategies, as
well as the expected compounded return Infineon can reasonably expect the portfolio to earn over a particular
time period. Infineon reviews the expected long-term rate of return annually and revises it as appropriate.
Plan asset allocation
As of September 30, 2013 and 2012 the percentage of plan assets invested and the targeted allocation to
major asset categories are as follows:
in %
Targeted allocation 2013 2012
Domestic plans
Foreign plans
Domestic plans
Foreign plans
Domestic plans
Foreign plans
Equity securities 27 35 24 36 27 36
Debt securities 53 33 48 32 52 30
Other 20 32 28 32 21 34
Total 100 100 100 100 100 100
The position “Other” in the table above includes commodity funds, real-estate funds, liability insurances and
cash.
The allocation of plan assets to asset categories is based on the assessment of business and financial condi-
tions, demographic and actuarial data, funding opportunities, related business risk factors, market sensitivity
analysis and other relevant factors. The overall allocation should help protect the plans’ assets while generating
sufficiently stable real returns, for example after inflation effects, to meet current and future benefit payment
needs. Due to active portfolio management, the asset allocation may differ from the target allocation up to
certain limits for different classes.
As a matter of policy, Infineon’s pension plans do not invest in shares of Infineon.
The actual positive return on plan assets in the fiscal year ended September 30, 2013 was €20 million. In the
previous year, plan assets had yielded a positive return of €41 million.
Amounts recognized in profit or loss and in total comprehensive income
The expenses and income of defined benefit plans for the years ended September 30, 2013 and 2012 comprise
the following:
€ in millions
2013 2012
Domestic plans
Foreign plans
Total Domestic plans
Foreign plans
Total
Current service cost (15) (3) (18) (10) (4) (14)
Interest cost (19) (4) (23) (20) (5) (25)
Expected return on plan assets 17 3 20 15 2 17
Amortization of unrecognized past service (cost) benefit 2 (6) (4) – – –
Net periodic pension cost (15) (10) (25) (15) (7) (22)
Service costs are recorded within cost of goods sold to the extent that they relate to production employees,
otherwise they are recorded as research and development or selling, general and administrative expenses.
Interest costs are recorded as part of financial expense, and the expected return on plan assets is recorded as
part of financial income.

INFINEON TECHNOLOGIES ANNUAL REPORT 2013
CONSOLIDATED FINANCIAL STATEMENTS252
Actuarial gains of €22 million and losses of €117 million have been recognized outside of the Consolidated
Statement of Operations in Other Comprehensive Income for the years ended September 30, 2013 and 2012,
respectively. As of September 30, 2013 and 2012, cumulative actuarial losses amounted to €162 million
and €184 million, respectively. In addition, cumulative actuarial losses amounting to €5 million, resulting
from deferred compensation and retiree health care plans, are also recognized directly in Other Comprehen-
sive Income.
Disbursements totaling €19 million are projected to be made in the 2014 fiscal year in connection with defined
benefit plans.
Defined contribution plans
In connection with defined contribution plans Infineon makes fixed contributions to external insurance providers
or funds. Infineon has no further legal or constructive obligations with regard to these pension plans in excess
of the contributions paid. Infineon also pays contributions to government pension schemes. Infineon recog-
nized €109 million and €103 million as an expense for defined contribution plans in the financial years ended
September 30, 2013 and 2012.
36 Additional disclosures on financial instruments
The following table presents the carrying amounts and the fair values of financial instruments by their respective
classes, and a breakdown by category of financial instrument as defined by IAS 39.
€ in millions
Financial assets:
Categories of financial assets
Carrying amount
At fair value through
profit or loss
Available for sale
Loans and receivables
Designated cash flow
hedges
Fair value
Balance as of September 30, 2013
Current assets:
Cash and cash equivalents 527 – – 527 – 527
Financial investments 1,759 – 53 1,706 – 1,759
Trade and other receivables 571 – – 571 – 571
Other current financial assets 9 2 – 7 – 9
Non-current assets:
Other financial assets 116 – 20 96 – 116
Total 2,982 2 73 2,907 – 2,982
Balance as of September 30, 2012
Current assets:
Cash and cash equivalents 425 – – 425 – 425
Financial investments 1,810 – 56 1,754 – 1,810
Trade and other receivables 539 – – 539 – 539
Other current financial assets 9 3 – – 6 9
Non-current assets:
Other financial assets 124 – 20 104 – 124
Total 2,907 3 76 2,822 6 2,907

253INFINEON TECHNOLOGIES ANNUAL REPORT 2013
NOTES TO THE CONSOLIDATED FINANCIAL STATEMENTS
€ in millions
Financial liabilities:
Categories of financial liabilities
Carrying amount
At fair value through
profit or loss
Other financial
liabilities
Designated cash flow
hedges
Lease liabilities
Fair value
Balance as of September 30, 2013
Current liabilities:
Short-term debt and current maturities of long-term debt 134 – 134 – – 138
Trade and other payables 574 – 574 – – 574
Other current financial liabilities 12 1 8 3 – 12
Non-current liabilities:
Long-term debt 169 – 169 – – 169
Other financial liabilities 7 – 7 – – 7
Total 896 1 892 3 – 900
Balance as of September 30, 2012
Current liabilities:
Short-term debt and current maturities of long-term debt 55 – 55 – – 55
Trade and other payables 622 – 622 – – 622
Other current financial liabilities 100 3 97 – – 100
Non-current liabilities:
Long-term debt 240 – 240 – – 246
Other financial liabilities 8 – 8 – – 8
Total 1,025 3 1,022 – – 1,031
Fair values of derivative financial instruments are determined using quoted market prices or according to the
discounted cash flow method. As a result of the short-term nature of cash and cash equivalents, financial
investments, trade receivables and payables, other receivables from and payables to third parties and related
entities, and other current financial assets and liabilities, it is assumed that the fair values correspond to
their carrying amounts.
Non-current assets classified as “available-for sale” are measured at their fair values, based on market prices
quoted on an active market or calculated as the present value of future expected cash flows. Current assets
classified as “available-for sale” are measured by using valuation models whose input factors are based on
observable market data.
The fair value of Infineon’s unsecured term loans and interest-bearing notes payable approximate their carrying
amounts as their interest rates approximate current market rates. At September 30, 2013, the subordinated
convertible bonds, due 2014, were trading on the financial markets at a 236.0 percent (2012: 127.0 percent)
premium to par. The fair values of forward currency contracts and currency options are determined on the basis
of market conditions prevailing at the end of the reporting period. Recognized valuation models are used to
determine the fair value of currency options. The fair value of an option is impacted by the length of its remain-
ing term and by other factors such as the level and volatility of the underlying currency exchange rates.

INFINEON TECHNOLOGIES ANNUAL REPORT 2013
CONSOLIDATED FINANCIAL STATEMENTS254
Financial instruments measured at fair value are allocated to different measurement levels in accordance with
IFRS 7. This includes financial instruments that are
> valued according to quoted prices in an active market for identical financial instruments (Level 1),
> valued according to quoted prices in an active market for comparative financial instruments or using valuation
models whose main input factors are based on observable market data (Level 2), or
> valued using input factors that are not based on observable market data (Level 3).
The following table shows the amounts allocated to each measurement level as of September 30, 2013:
€ in millions
Fair value
Fair value by category
Level 1 Level 2 Level 3
2013 Fiscal year
Financial assets
Current assets:
Financial investments 53 – 53 –
Other current financial assets 2 – 2 –
Assets classified as held for sale – – – –
Non-current assets: – – – –
Other financial assets 20 15 – 5
Total 75 15 55 5
Financial liabilities
Current liabilities:
Other current financial liabilities 4 1 3 –
Total 4 1 3 –
2012 Fiscal year
Financial assets
Current assets:
Financial investments 56 – 56 –
Other current financial assets 9 – 9 –
Assets classified as held for sale – – – –
Non-current assets: – – – –
Other financial assets 20 14 – 6
Total 85 14 65 6
Financial liabilities
Current liabilities:
Other current financial liabilities 3 – 3 –
Total 3 – 3 –
As required to be disclosed by IFRS 7, the net gain or loss on financial instruments within continuing operations
in the Group statement of operations in fiscal years 2013 and 2012 amounted to the following:
€ in millions 2013 2012
Available-for-sale financial assets 1 (1)
Loan and receivables (3) 58
Designated as fair value through profit and loss – –
Held for trading (1) (5)
Other financial liabilities (3) (62)
Cash flow hedges (4) (2)
Total (10) (12)

255INFINEON TECHNOLOGIES ANNUAL REPORT 2013
NOTES TO THE CONSOLIDATED FINANCIAL STATEMENTS
Derivative financial instruments and hedging activities
Infineon periodically enters into derivative financial instruments such as interest swap arrangements, forward
exchange contracts as well as commodity swaps. The objective of these transactions is to reduce the impact
of interest rate, exchange rate and commodity price fluctuations on Infineon’s future net cash flows. Derivative
financial instruments are used by Infineon for hedging purposes, not for trading or speculative purposes.
The notional amounts and fair values of Infineon’s derivative instruments as of September 30, 2013 and 2012
are as follows:
€ in millions
2013 2012
Notional amount
Fair value Notional amount
Fair value
Forward exchange contracts sold
US dollar 131 2 144 1
Japanese yen 1 – – –
Singapore dollar – – – –
Great Britain pound – – 1 –
Forward exchange contracts purchased
US dollar 18 – 38 –
Japanese yen 12 – 10 –
Singapore dollar 20 – 21 –
Great Britain pound 8 – 7 –
Malaysian ringgit 35 – 46 (1)
Currency options sold
US dollar – – – –
Commodity swaps 41 (3) 52 6
Other – – – –
Fair value, net (1) 6
Foreign exchange derivatives are entered into by Infineon to offset the exchange risk from anticipated cash
receipts. Neither in 2013 nor in 2012 were any foreign exchange derivatives designated as cash flow hedges.
To offset price risks of highly probable future gold purchases, Infineon entered into commodity swaps which
are designated as cash flow hedges in the 2012 and 2013 fiscal years. The fair value of these commodity swaps
amounted to negative €3 million as of September 30, 2013 and €6 million as of September 30, 2012. The fair
value changes of these commodity swaps of negative €9 million in 2013 (2012: €6 million) are recorded in other
reserves. Infineon did not record any hedge ineffectiveness in the 2013 or 2012 fiscal years for these hedging
relationships. In the 2013 and 2012 fiscal years, no gains or losses were transferred from other reserves to
profit or loss as a result of cash flow hedges for future raw material purchases being cancelled following the
decision that the occurrence of the hedged transaction had become unlikely.

INFINEON TECHNOLOGIES ANNUAL REPORT 2013
CONSOLIDATED FINANCIAL STATEMENTS256
37 Financial risk management
Infineon’s activities expose it to a variety of financial risks: market risk (including foreign exchange risk, interest
rate risk and price risk), credit risk and liquidity risk. Infineon’s overall financial risk management program
seeks to minimize potential adverse effects on its profitability and liquidity. Infineon uses derivative financial
instruments to hedge certain risks to which it is exposed. Financial risk management is carried out by a central
Finance & Treasury (FT) department in accordance with policies approved by the Management Board. The FT
department identifies, evaluates and hedges financial risks in close co-operation with the operating units. The
FT department’s policy contains principles for overall risk management as well as documented policies covering
specific areas, such as foreign exchange risk, interest rate risk, credit risk, use of derivative and non-derivative
financial instruments, and the investment of excess liquidity.
Market risk
Market risk is defined as the risk of losses related to adverse changes in the market prices of financial instruments,
including those related to foreign exchange rates and interest rates.
Infineon is exposed to various market risks in the ordinary course of business, primarily resulting from changes
in foreign exchange rates and interest rates. Infineon enters into a range of derivative financial transactions
with various counterparties to limit such risks. Derivative instruments are used only for hedging purposes and
not for trading or speculative purposes.
Foreign exchange risk
Foreign exchange risk is the risk arising from changes to foreign exchange rates. According to IFRS, foreign
exchange risks are associated with monetary financial instruments which are denominated in a foreign currency
which does not correspond to the functional currency, and the non-functional currency represents the relevant
risk variable. Translation risks are not taken into consideration.
Although Infineon prepares the Consolidated Financial Statements in euros, a varying but significant portion
of its revenue as well as cost of goods sold, research and development and distribution costs are denominated
in currencies other than the euro, primarily the US dollar. Fluctuations in the exchange rates of these currencies
to the euro had an effect on the results of Infineon in the 2013 and 2012 fiscal years.
The Management Board has established policies which require Infineon’s individual legal entities to manage
the foreign exchange risk with respect to their functional currency. Group entities prepare a monthly rolling cash
flow forecast by currency in order to determine foreign exchange exposures. The net foreign exchange positions
determined in these forecasts are required to be hedged, usually by entering into internal hedging contracts.
Infineon’s policy with respect to limiting short-term foreign currency exposure is to hedge at least 75 percent
of its estimated net cash flow for the following two months, at least 50 percent of its estimated net cash flow
for the third month and, depending on the nature of the underlying transactions, a portion for the periods
thereafter. Part of the foreign currency exposure cannot be mitigated due to differences between actual and
forecasted amounts. Infineon calculates this remaining risk based on net cash flows considering items in the
Statement of Financial Position, actual orders received or made and all other planned income and expenditure.
For the 2013 and 2012 fiscal years, net losses related to foreign currency derivatives and foreign currency
transactions included within net income amounted to €3 million and €6 million, respectively.

257INFINEON TECHNOLOGIES ANNUAL REPORT 2013
NOTES TO THE CONSOLIDATED FINANCIAL STATEMENTS
The following table shows the effects on profit or loss and equity for continuing operations of a 10 percent shift
in the currency exchange rates for the major foreign currencies as of September 30, 2013 and 2012:
€ in millions
Profit or Loss Equity
+10 % (10 %) +10 % (10 %)
September 30, 2013
EUR/USD 9 (11) – –
EUR/MYR (2) 2 – –
EUR/YEN – – – –
EUR/SGD – – – –
September 30, 2012
EUR/USD 8 (10) – –
EUR/MYR (1) 2 – –
EUR/YEN 1 (1) – –
EUR/SGD – – – –
Interest rate risk
In accordance with IFRS 7 “Financial instruments: disclosures”, interest rate risk is defined as the risk that the
fair value or future cash flows of a financial instrument will fluctuate because of changes in market interest rates.
Infineon is exposed to interest rate risk through its financial assets and debt instruments resulting from bond
issuances and debt financing. Due to the cyclical nature of its core business and the need to maintain high
operational flexibility, Infineon holds a relatively high level of liquid financial assets that are invested in short-
term fixed-interest instruments. These investments generally have a contract duration of between one and
twelve months in order to achieve short term interest rate returns. The risk to these assets of changing interest
rates is partially offset by financial liabilities, some of which are based on variable interest rates.
To reduce the remaining risks caused by changes in market interest rates, Infineon is able to make use of interest
rate derivatives, such as interest swaps, in order to align the fixed interest periods of assets and liabilities.
IFRS 7 requires a sensitivity analysis showing the effect of possible changes in market interest rates on profit
or loss and equity. Infineon prepares this using the iteration method. Infineon does not hold any fixed-rate
financial assets or liabilities which are measured at fair value through profit or loss. Furthermore, Infineon did
not hold any fixed-rate available-for-sale financial assets either in 2013 or 2012.
Changes in market interest rates affect interest income and interest expense on variable rate financial instruments.
A change of 100 basis points in market interest rates at the reporting date would have increased or decreased
interest income or expenditure by €1 million in the 2013 and 2012 fiscal years respectively.
Other price risk
According to IFRS 7 “Financial instruments: disclosures”, other price risk is defined as the risk that the fair value
or future cash flows of a financial instrument will fluctuate because of changes in market prices (other than
those arising from interest rate risk or currency risk), whether those changes are caused by factors specific to
the individual financial instrument or its issuer, or factors affecting all similar financial instruments traded in
the market.
Infineon holds financial instruments that are exposed to market price risks. A change in the relevant market
prices of 5 percent would increase or decrease profit or loss by €0.1 million and €0.2 million for the 2013 and
2012 fiscal years, respectively.

INFINEON TECHNOLOGIES ANNUAL REPORT 2013
CONSOLIDATED FINANCIAL STATEMENTS258
Additionally, Infineon is exposed to price risks with respect to raw materials upon which it is dependent.
Infineon seeks to minimize these risks through its sourcing policies (including the use of multiple sources,
where possible) and its operating procedures. In line with these measures Infineon concluded additional
financial derivative contracts for certain commodity supplies (gold) for the following fiscal year in order to miti-
gate the remaining risk which arises from the fluctuation of commodity prices. A change in the relevant market
prices of 5 percent would have an equity effect of €0.2 million in the 2013 fiscal year (2012: €0.2 million).
Credit risk
Credit risk arises when a customer or other counterparty of a financial instrument fails to discharge its contrac-
tual obligations.
Infineon is exposed to this risk in conjunction with its ongoing operations, the investment of cash funds
and certain financing activities. Infineon’s credit risk arises primarily from trade receivables, cash and cash
equivalents, financial investments and derivative financial instruments. Excluding the impact of any collateral
received, the carrying amount of financial investments, cash and cash equivalents and trade receivables
corresponds to the maximum credit risk.
Credit risk with respect to trade receivables is limited by the large number and geographic diversity of the
customer base. Infineon controls credit risk through comprehensive credit evaluations for all major customers,
the use of credit limits and monitoring procedures. New customers are evaluated for creditworthiness in
accordance with Infineon guidelines. Credit limits are also in place for individual customers. Creditworthiness
and credit limits are constantly monitored. A further measure taken to reduce credit risk is the use of reservation
of title clauses. However, despite continuous monitoring, Infineon cannot fully exclude the possibility of a loss
arising from the default of one of its contract parties.
FT enters into foreign exchange and interest hedging contracts and invests cash funds in cash equivalents and
financial investments worldwide with major financial institutions that have high credit ratings. Infineon assesses
the creditworthiness of banks using a methodology that calculates investment thresholds for individual banks
each day, based on current ratings (Standard & Poor’s, Moody’s or Fitch) and credit default swap premiums,
and sets investment limits for individual credit institutions accordingly. Any possible breaches of stipulated
thresholds must be reported and risk exposures reduced.
Infineon has spread its liquidity investments over more than 10 banks. At September 30, 2013 no financial
institution was responsible for more than 12 percent (2012: 15 percent) of Infineon’s liquidity investments.
This gives rise to the maximum risk of €230 million (2012: €300 million) in the event of the default of a single
financial institution assuming no deposit insurance scheme is in place. Infineon also holds derivative financial
instruments with a positive fair value of €2 million (2012: €9 million).
Financing and liquidity risk
Financing and liquidity risk is the risk that an entity will encounter difficulties in meeting obligations associated
with financial liabilities.
Liquidity risk could arise from Infineon’s potential inability to meet maturing financial obligations. Infineon’s
liquidity risk management provides that sufficient levels of cash and other funds are available at short notice as
well ensuring the availability of funding through an adequate amount of committed credit facilities.
The following table discloses the maturity analysis for non-derivative financial liabilities and a cash flow
analysis for derivative financial instruments with negative fair values. The table shows the undiscounted
contractually agreed cash flows that result from the respective financial liability. Cash flows are recognized at
the date when Infineon becomes a contractual partner to the financial instrument. Amounts in foreign curren-
cies are translated using the closing rate at the reporting date. Financial instruments with variable interest
payments are determined using the interest rate from the last interest fixing date before September 30, 2013.
The cash outflows of financial liabilities that can be repaid at any time are assigned to the period where the
earliest redemption is possible.

259INFINEON TECHNOLOGIES ANNUAL REPORT 2013
NOTES TO THE CONSOLIDATED FINANCIAL STATEMENTS
€ in millions Contractual cash flows
2014
2015
2016
2017
2018
Thereafter
Non derivative financial liabilities 906 728 128 14 14 6 16
Derivative financial liabilities:
Cash outflow 65 65 – – – – –
Cash inflow ¹ (61) (61) – – – – –
Total 910 732 128 14 14 6 16
1 Cash inflows of derivates financial liabilities are also included when the instrument is gross settled in order to show all contractual cash flows.
38 Commitments and contingencies
Litigation and government inquiries
Antitrust litigation
In September 2004, the Company entered into a plea agreement with the Antitrust Division of the U.S.
Department of Justice in connection with its investigation into alleged antitrust violations in the DRAM industry.
A number of putative price fixing class action lawsuits have been filed in U.S. state and federal courts against
the Company, its U.S. subsidiary Infineon Technologies North America Corp. (“IF North America”) and other
DRAM suppliers by indirect purchasers, state attorneys general of various U.S. states and territories, California
school districts, political subdivisions and public agencies. The lawsuits allege, among other things, violations
of federal and state antitrust laws and violations of state unfair competition laws relating to the sale and pricing
of DRAM products during specified time periods commencing in or after 1998 through, at the latest, to June
2002. The lawsuits seek actual and treble damages in unspecified amounts, penalties, costs, attorneys’ fees,
and injunctive and other equitable relief.
The Company has executed a settlement agreement resolving these various lawsuits, subject to certain
conditions. As part of the settlement, the Company agreed to pay approximately US$29 million, which the Com-
pany has deposited into an escrow fund. After final court approval, the Company will be released from claims
by the state attorneys general and by any class members who do not elect to opt out of this settlement. Prior to
the time of final court approval of the settlement, there is a risk that class members may decide to opt out.
Between December 2004 and February 2005, two putative class proceedings were filed in the Canadian province
of Quebec, and one was filed in each of Ontario and British Columbia against the Company, IF North America
and other DRAM manufacturers on behalf of all direct and indirect purchasers resident in Canada who purchased
DRAM or products containing DRAM between July 1999 and June 2002, seeking damages, investigation and
administration costs, as well as interest and legal costs. Plaintiffs primarily allege conspiracy to unduly restrain
competition and to illegally fix the price of DRAM.
In October 2008 the European Commission (“EU Commission”) initiated an investigation into the Company
and other manufacturers of chips for smartcards for alleged violations of antitrust laws. In 2009, 2012 and
in the first quarter of the 2013 calendar year, the Company received and responded to written requests for
information from the EU Commission. On April 22, 2013 the Company received the Statement of Objections in
which it was, for the first time, informed of the basis of the European Commission’s antitrust allegations. It is
not possible to reliably estimate the future course of the proceedings. The Company will defend itself against
all allegations of anticompetitive conduct. For this purpose, the Company submitted its reply to the Statement
of Objections to the EU Commission on July 22, 2013.

INFINEON TECHNOLOGIES ANNUAL REPORT 2013
CONSOLIDATED FINANCIAL STATEMENTS260
In June 2010, the Brazilian Secretariat of Economic Law of the Ministry of Justice (“SDE”) announced that it had
initiated an investigation related to alleged anticompetitive activities within the DRAM industry. The SDE’s
Notice of Investigation names the Company, various DRAM manufacturers and certain executives as parties to
the proceedings, and focuses on the period from July 1998 to June 2002. The SDE’s Notice of Investigation is
based on the antitrust proceedings carried out in the United States and in Europe.
Insofar as there are liabilities and risks associated with the antitrust matters described herein that the Company
believes are likely to materialize and that can be estimated with reasonable accuracy at this time, provisions
have been recorded, including for legal expenses. Any disclosure of the Company’s estimate of potential out-
comes could seriously prejudice the position of the Company in these proceedings.
Patent litigation
In November 2008, Volterra Semiconductor Corporation (“Volterra”) filed suit against the Company, IF North
America, and Primarion, Inc., a former affiliate of the Company that is now part of IF North America, (jointly the
“Defendants”) in the United States District Court for the Northern District of California, alleging infringement of
five U.S. patents by certain products that were offered by Primarion and claimed relief for damages, enhanced
damages for willful infringement and injunctive relief. Volterra later withdrew one patent; four patents remain in
the case. In May 2011, the court decided that two of the patents were infringed. This decision was anticipated
by the Company. It has accordingly made preparations to appeal this outcome and recorded provisions for
legal expenses and those liabilities and risks that the Company believes are likely to materialize and that can
be estimated with reasonable accuracy at the present time. The case is now in the damages phase. However,
fact discovery showed that the damages theory originally set forth by Volterra of profits lost through price
erosion by the U.S. entity and owner of the patents-in-suit turned out to be legally flawed, as the entity that
made 99.99 percent of the sales used as a basis for this claim is its Asian subsidiary, and the profits do not
“inexorably” flow back to the U.S. entity. Volterra then provided a different damages theory, which alleged loss
of value of its subsidiary. However, the court has recently also rejected this later theory as legally barred and
the jury trial to determine damages has been vacated. Instead, briefing with respect to entry of a permanent
injunction as well as mediation have been ordered. If the mediation is unsuccessful, it is likely that the court will
also ask the parties for written submissions as to whether the case can go directly to appeal. The suit with respect
to the two remaining patents will not commence before the case with respect to the former two patents are
formally concluded in the first instance. In January 2010, the Company filed suit against Volterra in the United
States District Court for the District of Delaware for infringement of four U.S. patents. The case was initially stayed.
In December 2011, the stay was lifted and the case transferred to California, where it is in the discovery stage.
In August 2013, Infineon Technologies Austria AG, an affiliate of the Company, also filed suit against Volterra
as well as its Asian subsidiary in the United States District Court for the Eastern District of Texas for infringement
of four U.S. patents. Any disclosure of the Company’s estimate of potential outcomes could seriously prejudice
the position of the Company in these suits. There can be no assurance that the provisions recorded will be
sufficient to cover all of the liabilities that could ultimately be incurred in relation to this litigation.
In April 2011 the Company sued Atmel Corporation for infringement of eleven of its patents in the United States
District Court for the District of Delaware. Atmel then brought a countersuit alleging, among other things,
infringement of ten of its patents. In June 2013, the parties settled their dispute with a broad cross license
including payments to Infineon, the amount of which the parties have agreed shall remain confidential. The
lawsuit has been dismissed.

261INFINEON TECHNOLOGIES ANNUAL REPORT 2013
NOTES TO THE CONSOLIDATED FINANCIAL STATEMENTS
Proceedings in relation to Qimonda
All significant assets, liabilities and business activities attributable to the memory business (Memory Prod-
ucts) were carved out from Infineon and transferred to Qimonda in the form of a non-cash contribution with
economic effect from May 1, 2006. A number of different service agreements were concluded with Qimonda
in addition to the demerger and contribution agreement of April/May, 2006 as part of the establishment of
Qimonda as a separate legal entity. Qimonda filed an application at the Munich Local Court to commence
insolvency proceedings on January 23, 2009. On April 1, 2009, the insolvency proceedings formally opened.
Qimonda was joined in declaring insolvency by a number of German and international subsidiaries of Qimonda,
notably including Qimonda Dresden and Qimonda Flash GmbH (“Qimonda Flash”).
The insolvency of Qimonda, Qimonda Dresden and Qimonda Flash has given rise to various disputes between
the administrator of these companies and Infineon, some of which are already before the courts. Infineon
is continuing its discussions with the insolvency administrator in the joint effort to find an amicable solution
acceptable to both parties.
Legal disputes
Alleged activation of a shell company and liability for impairment of capital
The administrator filed a request for declaratory judgment in an unspecified amount against Infineon Technolo-
gies AG and, by way of third party notice, Infineon Technologies Holding B.V. and Infineon Technologies Invest-
ment B.V., at Regional Court Munich I in November 2010. This requested that Infineon be deemed liable to
make good the deficit balance of Qimonda as it stood when the insolvency proceedings in respect of the assets
of Qimonda began, i.e. to refund to Qimonda the difference between the latter’s actual business assets when
the insolvency proceedings began and its share capital (in German: “Unterbilanzhaftung”). The administrator
contended that the commencement of operating activities by Qimonda amounted to what is considered in case
law to be the activation of a shell company (in German: “Wirtschaftliche Neugründung”), and that this activation
of a shell company was not disclosed in the correct manner. On March 6, 2012, with respect to another matter,
the German Federal High Court issued a ruling on principle that any liability resulting from the activation of a
shell company only depends on the situation at the date of the activation of a shell company and not, as asserted
by the administrator, on the situation at the date on which insolvency proceedings are opened.
In addition to the request for declaratory judgment against Infineon in an unspecified amount, on February 14,
2012 the administrator also lodged a request for payment based on an alternative claim (in German: “Hilfs-
antrag”), as well as making other additional claims. In conjunction with this alternative claim, the administrator
has requested the payment of at least €1.71 billion plus interest in connection with the alleged activation of a
shell company. On June 15, 2012 the insolvency administrator increased his request for payment of February 14,
2012 on the grounds of activation of a shell company to at least approximately €3.35 billion plus interest.
Furthermore, the insolvency administrator continues to base a substantial part of his alleged payment claims,
as already asserted out of court against Infineon in August 2011 for an unspecified amount, on so-called
liability for impairment of capital (in German “Differenzhaftung”). This claim is based on the allegation that,
from the very beginning, the carved-out memory products business had a negative billion euro value. The
administrator therefore asserts that Infineon is obliged to make good the difference between this negative
value and the lowest issue price (in German: “geringster Ausgabebetrag”) of the subscribed stock.
This allegation runs contrary to two valuations prepared as part of the preparatory documentation for the
capital increase by independent auditing companies, one of which had been engaged by Infineon and the other
of which was acting in the capacity of a court-appointed auditor of non-cash contributions and post-formation
acquisitions. The auditing company engaged by Infineon concluded in its valuation that the business area
contributed had a value of several times the lowest issue price of the shares issued, while the court-appointed
auditor of non-cash contributions and post-formation acquisitions confirmed to the court that the lowest issue
price of the shares issued was covered – as legally required – by the value of the non-cash contributions.
The parties have exchanged comprehensive written submissions as well as expert reports. A first oral hearing
took place on January 19, 2012, a second was held on November 15, 2012. On August 29, 2013 the court
nominated an independent expert in order to clarify specifically the valuation issues raised by the administrator.

INFINEON TECHNOLOGIES ANNUAL REPORT 2013
CONSOLIDATED FINANCIAL STATEMENTS262
Continuation of the rights of use of Infineon and its licensees in respect of Qimonda patents
Infineon transferred numerous patents to Qimonda in the course of its contribution of the memory business.
It retained rights of use in respect of these patents in the contribution agreement, which also contains provi-
sions concerning cross licensing. The administrator has declared non-performance of this agreement. If the
administrator’s decision were found to be legal, the Company and its subsidiaries would no longer be licensed
to use patents transferred by it to Qimonda in the form of contributions, or patents applied for by Qimonda
itself subsequent to the carve-out. Moreover, this could leave the Company unable to sublicense such patents
in full to third parties. This could also affect contract partners of the Company with which the Company has
concluded cross patent license agreements, possibly leading to compensation claims against the Company.
The Company filed an action for declaratory judgment against the administrator regarding this matter with
Regional Court Munich I in January 2011. This action was intended to produce a decision by the court confirming
that the rights of use of Infineon and its licensees with respect to the aforementioned intellectual property of
the Qimonda Group still exist. On February 9, 2012 the Regional Court Munich I upheld Infineon’s action almost
completely, only dismissing the action with respect to the patents transferred to third parties or expired prior to
the opening of insolvency proceedings on the one hand and with respect to rights to receive information on the
other. The administrator’s counteraction was dismissed. Both parties lodged appeals with the Munich Regional
Appeal Court. Confirming the Company’s legal opinion, in its ruling of July 25, 2013, the court upheld the first
instance judgment, apart from a small number of restrictions. The administrator and the Company both lodged
appeals with the German Federal High Court.
The administrator applied to the US Bankruptcy Court for the Eastern District of Virginia in October 2009
for an order stating that rights of use under Qimonda’s US patents do not fall under a protective provision
of US insolvency law, according to which such rights of use continue to exist despite the insolvency of the
licensor. The administrator bases its argument here on the view that the legal protection afforded to licenses in
insolvency pursuant to section 365(n) of the US Bankruptcy Code applies only to US insolvency proceedings
and not to insolvency proceedings in other countries (in this case Germany). Infineon and other semiconductor
manufacturers have filed objections to this application.
After the US Bankruptcy Court upheld the administrator’s claim in November 2009, the US District Court for the
Eastern District of Virginia then sent the case back to the US Bankruptcy Court in July 2010 instructing that the
legitimate interests of the licensees and the creditors in the insolvency should be carefully weighed up against
the background of the purpose of the statutory regulation. In October 2011, the US Bankruptcy Court decided,
after having diligently balanced the interests of the parties, that the legal protection offered by section 365(n)
of the US Bankruptcy Code applies with respect to Qimonda’s US patents, thus the patents’ rights of use
remain valid. The administrator appealed against the decision of the U.S. Bankruptcy Court directly to the Court
of Appeals for the Fourth Circuit. An oral hearing by the Court of Appeals for the Fourth Circuit took place on
September 17, 2013. The Court of Appeals has not yet rendered a decision.
Contestation of intercompany payments under insolvency law
On March 22, 2013, the administrator filed suit against Infineon at Regional Court Munich I that was served on
April 17, 2013. In this suit, the administrator asserts insolvency law related claims amounting to €105.9 million
and US$28 million plus interest of 5 percentage points over the base rate of the German Federal Bank for the
period since the opening of the insolvency proceedings. The appeal relates to intercompany payments from
Qimonda to Infineon (“IC-Payments”) since April 2008 as well as a payment made directly to the US Depart-
ment of Justice (“DoJ Payment”) in October 2008. Some of these IC-Payments had already been contested in
writing by the administrator on September 2, 2011.

263INFINEON TECHNOLOGIES ANNUAL REPORT 2013
NOTES TO THE CONSOLIDATED FINANCIAL STATEMENTS
The suit is mainly based on insolvency law and partly supplemented by an alleged breach of the prohibition
of return of contributions under stock corporation law. The administrator asserts in particular that payments
were postponed by Infineon, that Infineon was already aware Qimonda was insolvent at the time of the payment
or that there was a disparity between service and payment. Furthermore, the administrator asserts that certain
legal transactions between Qimonda and Infineon would have breached provisions under stock corporation law
banning the return of contributions on the grounds that the transactions concerned were of an unconventional
nature and disadvantageous for Qimonda. The Company filed its response to the suit with the court on July 31,
2013. On October 31, 2013, the administrator filed his reply with the court.
Extrajudical claims
Inotera
Qimonda sold a stake in the joint venture Inotera Memories, Inc. (“Inotera”) to Micron Technology, Inc. (“Micron”)
for US$400 million in October 2008. The administrator subsequently challenged Micron over the sale under
insolvency law and filed suit against Micron with Regional Court Munich I. The administrator suggested in short
letters sent in April and August 2010 that he may also pursue corporate liability claims against Infineon in
connection with the sale of the Inotera stake. The administrator has yet to substantiate the claims against
Infineon purported in these letters.
Other claims made by the administrator
The administrator brought forward further written claims against the Company in the final quarter of the 2011
fiscal year. The administrator asserts some of these claims judicially in the suit filed at Regional Court Munich I
on March 22, 2013 (see “Contestation of intercompany payments under insolvency law” above).
The other claims brought forward by the administrator have not been asserted judicially so far. He asserts
that certain further legal transactions between Qimonda and Infineon would breach provisions under stock
corporation law banning the return of contributions on the grounds that the transactions concerned were of an
unconventional nature and disadvantageous for Qimonda. He also asserts that Infineon, in its capacity as the
controlling company, caused Qimonda to enter into disadvantageous legal transactions without compensating
it accordingly.
Further, the administrator asserts that the provisions of stock corporation law pertaining to post-formation
acquisitions were breached in connection with numerous contracts concluded between Qimonda and Infineon
at the same time as the memory business was being contributed to Qimonda.
Finally, the administrator also asserts that it is entitled to claim against Infineon because the latter did not
provide Qimonda with a financing structure and liquidity resources adequate to enable its survival.
Assessment of these claims by Infineon
The claims purported in writing by the administrator in 2011 omit in most cases to mention any specific figures
and often amount to no more than general assertions without any supporting detail. The Company has rejected
in writing these claims made to date on the basis of its understanding of the matters involved. The Company
has good arguments with which to mount a successful defense against a large number of these purported
claims should they come before the court. Risks and uncertainties of a not inconsiderable magnitude remain,
however, not least because several of the combinations of factors involved are not covered by case law from
the highest instance.
Claims asserted orally by the administrator
Infineon and Qimonda concluded contracts concerning the separation of IT systems as part of the carve-out of
the memory business. The administrator asserted in a meeting held in the 2011 fiscal year that the provisions
of stock corporation law pertaining to post-formation acquisitions were breached in the conclusion of these
contracts and that the contracts were of an unconventional nature. The administrator also maintained that it
was entitled to claim against Infineon in relation to the (sub)letting agreements concluded between Qimonda
and Infineon in connection with the carve-out of the memory business. Most of these claims have now also
been asserted judicially in the suit filed on March 22, 2013.

INFINEON TECHNOLOGIES ANNUAL REPORT 2013
CONSOLIDATED FINANCIAL STATEMENTS264
Insolvency of Qimonda Dresden
Infineon was a shareholder with personal liability in Qimonda Dresden until the carve-out of the memory busi-
ness, as a result certain long-standing creditors have residual liability claims against Infineon. These claims,
which include the potential repayment of public subsidies, trade tax demands, receivables of service providers
and suppliers and employee-related claims such as salaries and social security contributions, can only be
exercised by the administrator acting in the name of the creditors concerned. Infineon and the administrator
concluded a framework agreement covering the orderly resolution of residual liability issues on July 7, 2011.
Infineon and the administrator also agreed in this connection that Infineon may recover 70 percent of the residual
liability payments from the insolvent assets as an ordinary rather than a secondary creditor. Settlements have
subsequently been concluded with some of the residual liability creditors.
Other claims
Infineon may still be exposed to other claims arising in connection with contracts, offers, uncompleted trans-
actions, continuing obligations, liabilities, risks and other obligations transferred to Qimonda in connection
with the carve-out of the memory business.
Provisions relating to Qimonda
Infineon recognizes provisions and liabilities for such obligations and risks which it assesses at the end of each
reporting period are more likely than not to be incurred (that is where, from Infineon’s perspective at the end
of each reporting period, the probability of having to settle an obligation or risk is greater than the probability
of not having to) and the obligation or risk can be estimated with reasonable accuracy at this time.
As described above, Infineon faces certain risks in connection with the insolvency proceedings relating to the
assets of Qimonda and that entity’s subsidiaries. Certain of these matters led Infineon to record provisions of
€356 million and €326 million as of September 30, 2013 and September 30, 2012, respectively. Presenting
details of the actual amounts included in provisions for specific liabilities and risks associated with the insolvency
of Qimonda could seriously prejudice Infineon’s legal or negotiating position, so no such disclosures are made.
There can be no certainty that the provisions recorded will be sufficient to cover all of the liabilities that could
ultimately be incurred in relation to the insolvency of Qimonda and, in particular, the matters discussed above.
In addition, it is possible that liabilities and risks materialize that are currently considered to be unlikely to do
so, and accordingly such matters are not included in provisions.
Infineon evaluates the merits of the various claims in each of these matters continuously, defends itself vigor-
ously and seeks to find alternative solutions in the best interest of Infineon as it deems appropriate. Should
the alleged claims prove to be valid, substantial financial obligations could arise for Infineon which could have
a material adverse effect on its business and its financial condition, liquidity position and results of operations.
Other
Infineon is also involved in various other legal disputes and proceedings in connection with its existing or
previous business activities. These can relate to products, services, patents, environmental protection issues
and other matters. Based on its current knowledge, Infineon does not believe that the ultimate resolution of
these other pending legal disputes and proceedings will have a material adverse effect on Infineon’s financial
condition, liquidity position and results of operations. It remains entirely possible, however, that this assess-
ment may have to be revised in future and that any re-assessments of the miscellaneous legal disputes and
proceedings could have a material adverse effect on financial condition, liquidity position and results of opera-
tions, particularly in the period in which re-assessment is made. Furthermore, in conjunction with its existing
or previous business operations, Infineon is also exposed to numerous legal risks which have until now not
resulted in legal disputes. These include risks related to product liability, environment, capital market, anti-
corruption, competition and antitrust legislation as well as other compliance regulations. Claims could also be
made against Infineon in the event of breaches of law committed by individual employees or third parties.

265INFINEON TECHNOLOGIES ANNUAL REPORT 2013
NOTES TO THE CONSOLIDATED FINANCIAL STATEMENTS
Provisions for legal proceedings and other uncertain legal issues
Provisions relating to legal proceedings and other uncertain legal issues are recorded when it is probable that a
liability has been incurred and the associated amount can be reasonably estimated. If the estimated amount of
the liabilities is within a range of amounts and all amounts within the range are equally probable, the provision
recorded is equal to the mid-point of the range.
Any potential liability is reviewed again as soon as additional information becomes available and the estimates
are revised if necessary. Provisions with respect to these matters are subject to future developments or changes
in circumstances in each of the matters, which could have a material adverse effect on Infineon’s financial con-
dition, liquidity position and results of operations.
An adverse final resolution of any of the matters described above could result in significant financial liabilities
for Infineon and other adverse effects and these in turn could have a material adverse effect on its business
and financial condition, liquidity position and results of operations. Infineon evaluates the merits of the various
claims in each of these matters continuously, defends itself vigorously and seeks to find alternative solutions
in the best interest of Infineon as it deems appropriate. Irrespective of the validity of the allegations and the
success of the aforementioned claims and other matters described above, Infineon could incur significant costs
defending against or settling such allegations and this too could have a material adverse effect on its financial
condition, liquidity position and results of operations.
39 Contingent liabilities and other financial commitments
Contingent liabilities
Contingent liabilities relate to possible future events, the occurrence of which would result in an obligation
for Infineon. The incurrence of such an obligation is considered to be unlikely at the reporting date, but cannot
be ruled out entirely.
The following table summarizes Infineon’s contingent liabilities with respect to external parties, excluding
possible liabilities arising from litigation, as of September 30, 2013:
Payments due in (€ in millions)
Total Less than 1 year
1 – 2 years 2 – 3 years 3 – 4 years 4 – 5 years After 5 years
Guarantees 111 10 5 14 7 45 30
In total, Infineon has guarantees outstanding to external parties as of September 30, 2013 amounting to
€111 million. Guarantees are mainly issued for the payment of import duties, rentals of buildings, and contingent
obligations related to government grants received.
Other financial commitments and other risks
In addition to provisions, liabilities and contingent liabilities, Infineon also has other financial obligations,
relating in particular to lease and long-term rental arrangements, and unconditional purchase commitments.
These are explained in more detail below.
Undiscounted future minimum operating lease and rental payments amounted to €574 million (September 30,
2012: €555 million). The corresponding payment obligations fall due as follows:
Payments due in (€ in millions)
Total Less than 1 year
1 – 2 years 2 – 3 years 3 – 4 years 4 – 5 years After 5 years
Payments arising from lease contracts 574 74 55 63 50 47 285
Future cash receipts from sub-leases are expected to amount to €46 million; these amounts were considered
in the above minimum lease and rental payments.

INFINEON TECHNOLOGIES ANNUAL REPORT 2013
CONSOLIDATED FINANCIAL STATEMENTS266
Total rental expenses under operating leases amounted to €66 million and €71 million for the years ended
September 30, 2013 and 2012, respectively.
Contracts already entered into for commenced or planned property, plant and equipment investments (purchase
commitments) at September 30, 2013 amounted to €150 million (September 30, 2012: €145 million).
Purchase commitments for planned investments in intangible assets at September 30, 2013 amounted to
€2 million (September 30, 2012: €22 million).
In connection with the current raw material supply, long-term purchase commitments are in place in particular
for wafers, strategic raw materials, semiconductor intermediate products, electricity and gas. Overall, these
minimum purchase commitments give rise to other financial obligations amounting to approximately €553 mil-
lion as at the reporting date (September 30, 2012: €533 million). These contracts have terms of between one
and five years. Purchases under these agreements are recorded as incurred in the normal course of business.
Infineon assesses its anticipated purchase requirements on a regular basis in order to meet customer demand
for its products. An assessment of losses under these purchase contracts is made on a regular basis for example
in the event that expected purchase quantities fall below the minimum contractual quantities.
In conjunction with its investing activities, Infineon receives government grants and subsidies related to the
construction and financing of certain of its production facilities. Grants are also received for selected research
and development projects. These amounts are recognized upon the achievement of specified criteria. Certain
of these grants have been received contingent upon Infineon complying with certain project-related require-
ments, such as creating a specified number of jobs over a defined period of time. Infineon is committed to
maintaining these requirements, and from today’s perspective Infineon expects to be able to do so. Never-
theless, should such requirements not be met, as of September 30, 2013, a maximum of €60 million of these
subsidies could be refundable. Such amount does not include any potential liabilities for Qimonda-related
subsidies (see note 38).
Infineon, through certain of its sales and other agreements may, in the normal course of business, be obligated
to indemnify its counterparties under certain conditions for warranties, patent infringement or other matters.
The maximum amount of potential future payments under these types of agreements is not predictable with
any degree of certainty, since the potential obligation is contingent on conditions that may or may not occur in
future, and depends on specific facts and circumstances related to each agreement. Historically, payments
made by Infineon under these types of agreements have not had a material adverse effect on Infineon’s financial
condition, liquidity position and results of operations.
On December 23, 2003, the Company entered into a long-term operating lease agreement with MoTo Objekt
Campeon GmbH & Co. KG (“MoTo”) to lease Campeon, an office complex constructed by MoTo south of Munich.
MoTo was responsible for the construction, which was completed in the second half of 2005. Infineon has no
obligations with respect to financing MoTo and has provided no guarantees related to the construction. The
Company occupied Campeon under an operating lease arrangement in October 2005 and completed the move
of its employees to this new location in the 2006 fiscal year. The complex was leased for a period of 20 years.
After year 15, the Company has a non-bargain purchase option to acquire the complex or otherwise continue
the lease for the remaining period of five years. Pursuant to the agreement, the Company placed a rental deposit
of €75 million in escrow, which was included in restricted cash as part of other financial assets in the Consoli-
dated Statement of Financial Position as of September 30, 2013. Lease payments are subject to limited adjust-
ment based on specified financial ratios related to Infineon. The agreement was classified as an operating lease,
in accordance with IAS 17, with monthly lease payments expensed on a straight-line basis over the lease term.

267INFINEON TECHNOLOGIES ANNUAL REPORT 2013
NOTES TO THE CONSOLIDATED FINANCIAL STATEMENTS
40 Segment reporting
Identification of Segments
Infineon identifies reportable segments on the basis of the differences between products sold and their
applications.
During the 2013 fiscal year, Infineon’s business was structured on the basis of four operating segments,
namely Automotive, Industrial Power Control, Power Management & Multimarket and Chip Card & Security.
Additionally Infineon differentiates between “Other Operating Segments” and “Corporate & Eliminations”.
Automotive
The Automotive segment designs, develops, manufactures and markets semiconductors for use in automotive
applications.
Industrial Power Control
The Industrial Power Control segment designs, develops, manufactures and markets semiconductors for the
generation, transmission and economy in the use of electrical energy.
Power Management & Multimarket
The Power Management & Multimarket segment designs, develops, manufactures and markets semiconductors
for energy-efficient power supplies as well as for mobile devices and mobile phone network infrastructures.
Chip Card & Security
The Chip Card & Security segment designs, develops, manufactures and markets semiconductor-based security
products for mobile payment applications and networked systems.
Other Operating Segments
Other Operating Segments comprises the remaining activities for product lines that have been disposed of
and other business activities. Since the closing of the sale of the Wireline Communications business and the
Wireless mobile phone business, sales to Lantiq and Intel Mobile Communications under the corresponding
production agreements, other than those assigned to discontinued operations, are included in this segment.
Corporate and Eliminations
Corporate and Eliminations reflects the elimination of intragroup revenue and profits/losses to the extent that
these arise between the segments.
Similarly, certain items are included in Corporate and Eliminations which are not allocated to the other segments.
This includes certain corporate headquarter costs and specific strategic technology initiatives, such as the
300-millimeter thin-wafer technology, which are not allocated to the segments since they arise from corporate
decisions not within the direct control of segment management.
Furthermore, raw materials and work in progress of the common production frontend facilities, and raw materials
of the common backend facilities, are not under the control or responsibility of the operating segment managers
and are therefore allocated to corporate functions. Only work in progress of backend facilities and finished
goods are allocated to the operating segments.

INFINEON TECHNOLOGIES ANNUAL REPORT 2013
CONSOLIDATED FINANCIAL STATEMENTS268
Chief operating decision maker, definition of segment result and allocation of
assets and liabilities to the individual segments
The Management Board, as the Chief Operating Decision Maker, decides how resources are allocated to
the segments.
Based on revenue and segment result, the Management Board assesses performance and formulates operating
targets and budgets for the segments.
Infineon defines Segment Result as operating income (loss) excluding: asset impairments (net of reversals);
the net impact on earnings of restructuring measures and closures; share-based compensation expense;
acquisition-related depreciation/amortization and (gains) losses; gains (losses) on sales of assets, businesses,
or interests in subsidiaries as well as other income (expense), including litigation settlement costs.
Decisions relating to financing and the investment of cash funds are taken at a Group level and not at a segment
level. For this reason, financial income and financial expense (including interest income and expense) are not
allocated to the segments.
Neither assets nor liabilities are allocated to the segments, nor is segment performance assessed on this basis.
Similarly, cash flows are not determined on a segment basis.
The exception to this approach is inventory information which is regularly analyzed at a segment level. Infineon
also allocates depreciation and amortization expense to the operating segments based on production volume
and product mix using standard costs.
Segment information
The following tables present selected segment data:
€ in millions 2013 2012
Revenue:
Automotive 1,714 1,660
Industrial Power Control 651 728
Power Management & Multimarket 987 929
Chip Card & Security 463 457
Other Operating Segments 26 125
Corporate and Eliminations 2 5
Total 3,843 3,904
The operating segments do not currently have any trading relationships with one another. Accordingly, there
was no intersegment revenue during the 2013 and 2012 fiscal years. Costs are recharged if applicable without
impact on profit or loss.
€ in millions 2013 2012
Segment Result:
Automotive 167 219
Industrial Power Control 38 118
Power Management & Multimarket 144 142
Chip Card & Security 39 56
Other Operating Segments (9) 5
Corporate and Eliminations (2) (13)
Total 377 527

269INFINEON TECHNOLOGIES ANNUAL REPORT 2013
NOTES TO THE CONSOLIDATED FINANCIAL STATEMENTS
The following table provides the reconciliation of Segment Result to Infineon’s income from continuing operations
before income taxes:
€ in millions 2013 2012
Segment Result 377 527
Plus/minus:
Impairment on assets including assets classified as held for sale, net of reversals (19) (28)
Impact on earnings of restructuring measures and closures, net (18) (1)
Share-based compensation expense (3) (2)
Acquisition-related depreciation/amortization and losses (2) (3)
Gains (losses) on sales of assets, businesses, or interests in subsidiaries, net 1 (1)
Other expenses (11) (37)
Operating income 325 455
Financial income 30 38
Financial expense (51) (61)
Gain (loss) Income from investments accounted for using the equity method, net 2 (1)
Income from continuing operations before income taxes 306 431
€ in millions 2013 2012
Depreciation and amortization:
Automotive ¹ 204 179
Industrial Power Control ¹ 82 81
Power Management & Multimarket ¹, ² 109 102
Chip Card & Security ¹ 66 51
Other Operating Segments ¹ 5 15
Corporate and Eliminations – –
Total 466 428
1 In the 2013 fiscal year €5 million of depreciation and amortization which are not included in Segment Result are included here for the Segments.
2 Includes in the 2013 and 2012 fiscal year €2 million and €3 million of acquisition-related depreciation and amortization which are
not included in Segment Result.
Income from associated companies and joint ventures accounted for using the equity method totaled €2 million
and negative €1 million in the 2013 and 2012 fiscal years, respectively. Half of this income was recognized
in the Industrial Power Control segment and half in the Other Operating Segments in the 2013 fiscal year, and
fully in the Industrial Power Control segment in the 2012 fiscal year. This allocated income is however not
included in the Segment Result.
€ in millions 2013 2012
Inventories:
Automotive 176 171
Industrial Power Control 66 85
Power Management & Multimarket 96 97
Chip Card & Security 33 28
Other Operating Segments 1 1
Corporate and Eliminations 237 185
Total 609 567

INFINEON TECHNOLOGIES ANNUAL REPORT 2013
CONSOLIDATED FINANCIAL STATEMENTS270
Entity-wide disclosures in accordance with IFRS 8
The following is a summary of revenue and of non-current assets by geographic area for the years ended
September 30, 2013 and 2012:
€ in millions 2013 2012
Revenue:
Europe, Middle East, Africa 1,567 1,732
Therein: Germany 795 908
Asia-Pacific (without Japan) 1,560 1,470
Therein: China 710 637
Japan 227 252
Americas 489 450
Total 3,843 3,904
€ in millions 2013 2012
Property, plant and equipment; goodwill and other intangible assets:
Europe 1,191 1,233
Therein: Germany 723 709
Asia-Pacific (w/o Japan) 567 633
Therein: China 18 18
Japan 1 1
Americas 11 10
Total 1,770 1,877
Revenues from external customers are based on the customers’ billing location. Regional employment data is
provided in note 7.
For the 2013 fiscal year revenue with one single customer amounted to €395 million. This revenue is allocated
to all four operating segments of Infineon. For the 2012 fiscal year revenue with one single customer amounted
to €399 million.
41 Significant events after the end of the reporting period
Issue of Performance Shares
On October 1, 2013, 114,046 (virtual) Performance Shares were issued to the Management Board and
1,326,718 to employees. The allocation of Performance Shares does not have a material effect on the net
assets, financial position and results of operations.
New capital returns program
The Company has resolved a new capital returns program and intends to make available up to €300 million
until September 30, 2015 for this purpose. The capital return makes use of the authorization given at the
Annual General Meeting on February 28, 2013, according to which shares may be bought back either through
the use of put options, or the direct purchase of own shares through Xetra trading on the Frankfurt Stock
Exchange. Furthermore the Company may buy back an additional part of the outstanding convertible bond
due 2014. The share buyback exclusively serves the purposes of cancelling shares to reduce the company’s
share capital, settling convertible bond obligations in shares as well as allotting shares to employees, board
members of affiliated companies and members of the Management Board. Incidentally, it will be carried out in
accordance with section 14, paragraph 2, and section 20a, paragraph 3, of the German Securities Trading Act
in connection with the provisions of Commission Regulation (EC) No. 2273/2003 of December 22, 2003.
The capital returns program can be suspended and resumed at any time within the timeframe defined in the
resolution of the Annual General Meeting and taking into consideration other legal requirements.
Further details including the current status of the capital returns program are regularly published in the Internet
under www.infineon.com/cms/en/corporate/investor/

271INFINEON TECHNOLOGIES ANNUAL REPORT 2013
NOTES TO THE CONSOLIDATED FINANCIAL STATEMENTS
42 Additional information in accordance with HGB
Application of exemption regulations
The entities stated below have entered into control and profit and loss transfer agreements with Infineon
Technologies AG and intend to apply the exemption rules contained in section 264 paragraph 3 HGB pertaining
to the preparation, audit and publication of annual financial statements for incorporated companies:
> Hitex Development Tools GmbH, Karlsruhe,
> Infineon Technologies Finance GmbH, Neubiberg,
> Infineon Technologies Mantel 19 GmbH, Neubiberg,
> Infineon Technologies Mantel 21 GmbH, Neubiberg and
> Infineon Technologies Mantel 25 GmbH, Neubiberg,
make use of the exemption from the requirements of section 325 HGB governing the publication of annual
financial statements.
Infineon Technologies Dresden GmbH makes use of the exemption from the obligation to prepare a manage-
ment report, and the exemption from the requirements of section 325 HGB governing the publication of annual
financial statements.
Due to the insolvency of Qimonda AG, Munich, Qimonda AG and its subsidiaries are not included in Infineon’s
Consolidated Financial Statements. Infineon has no information as to whether Qimonda AG draws up Consoli-
dated Financial Statements or intends to utilize any exemptions with respect to the preparation of Consolidated
Financial Statements.
Information pursuant to section 161 Stock Corporation Act (AktG)
The Declaration of Compliance prescribed by section 161 AktG was drawn up by the Management Board
and the Supervisory Board and made permanently available by publication on Infineon’s website at
www.infineon.com (“About Infineon/Investor/Corporate Governance/Declaration of Compliance”).
Accounting fees pursuant to section 314 paragraph 1 No. 9 HGB
Year-end Audit fees
At the Annual General Meeting held on February 28, 2013, the shareholders elected KPMG AG Wirtschafts-
prüfungsgesellschaft Munich, (“KPMG”), as Company and group auditor for the 2013 fiscal year. The audit fees
charged by KPMG in the 2013 fiscal year amounted to €0.8 million for the audit of the Consolidated Financial
Statements and various separate financial statements.
Fees for other advisory services
In addition to the amounts described above, KPMG charged an aggregate of €0.3 million in the 2013 fiscal year
for other audit services. These services consisted primarily of services rendered in connection with the review
of quarterly financial statements.
Fees for tax advisory services
In addition to the amounts described above, KPMG charged the Company an aggregate of €10.5 thousand in
the 2013 fiscal year for professional services relating to tax.
Other fees
Fees of €33.0 thousand were charged by KPMG in the 2013 fiscal year for other services.
Management Board and Supervisory Board
Management compensation in 2013 fiscal year
The remuneration of the individual members of the Management Board and the Supervisory Board, as required
by section 314 (1) no. 6a, sentences 5 to 9 HGB, is disclosed in the Compensation Report which is part of the
Group Management Report.

INFINEON TECHNOLOGIES ANNUAL REPORT 2013
CONSOLIDATED FINANCIAL STATEMENTS272
Management Board
The members of the Management Board during the 2013 fiscal year were as follows:
Name Age Term expires Position Membership of Supervisory Boards and governing bodies of domestic and foreign companies
Dr. Reinhard Ploss 57 September 30, 2015 Chairmen of the Management Board, Chief Executive Officer, Labor Director
Member of the Supervisory Board> Infineon Technologies Austria AG, Villach, Austria (Chairman)
Member of the Board of Directors> Infineon Technologies (Kulim) Sdn. Bhd., Kulim, Malaysia (Chairman)
Dominik Asam 44 December 31, 2018 Member of the Management Board, Executive Vice President, Chief Financial Officer
Member of the Supervisory Board> EPCOS AG, Munich (since January 29, 2013)> Infineon Technologies Austria AG, Villach, Austria
Member of the Board of Directors > Infineon Technologies Asia Pacific Pte., Ltd., Singapore> Infineon Technologies China Co., Ltd., Shanghai, People’s Republic of China> Infineon Technologies North America Corp., Wilmington, Delaware, USA
Arunjai Mittal 42 December 31, 2014 Member of the Management Board, Executive Vice President
Member of the Supervisory Board> Infineon Technologies Austria AG, Villach, Austria (until June 27, 2013)
Member of the Board of Directors> Infineon Technologies Asia Pacific Pte., Ltd., Singapore (Chairman)> Infineon Technologies India, Pvt. Ltd., Bangalore, India> Infineon Technologies Industrial Power, Inc., Wilmington, Delaware, USA (Chairman) (until January 1, 2013)> Infineon Technologies North America Corp., Wilmington, Delaware, USA (Chairman)> Infineon Technologies Japan K.K., Tokyo, Japan (since October 1, 2012)

273INFINEON TECHNOLOGIES ANNUAL REPORT 2013
NOTES TO THE CONSOLIDATED FINANCIAL STATEMENTS
The Supervisory Board
The members of the Supervisory Board during the 2013 fiscal year, the Supervisory Board position held by
them, their occupation, their membership of other governing bodies and their ages are as follows (as at:
September 30, 2013):
Name Age Term expires Position Membership of Supervisory Boards and comparable governing bodies of domestic and foreign companies
Wolfgang MayrhuberChairman
66 Annual General Meeting 2015
Management Consultant Member of the Supervisory Board> Deutsche Lufthansa AG, Köln (Chairman) (since May 7, 2013)> BMW AG, Munich> Münchener Rückversicherungs- Gesellschaft AG, Munich> Lufthansa Technik AG, Hamburg (until May 7, 2013)> Austrian Airlines AG, Vienna, Austria (until May 7, 2013)
Member of the Board of Directors> Heico Corporation, Hollywood, Florida, USA
Member of the Administrative Board> UBS AG, Zurich, Switzerland (until May 2, 2013)
Gerd Schmidt ¹ Deputy Chairman
59 Annual General Meeting 2015
Chairman of the Infineon Works Council, Regensburg, Infineon Technologies AG
Wigand Cramer ¹ 60 Annual General Meeting 2015
Labor union secretary IG Metall, Berlin
Alfred Eibl ¹ 64 March 2014 Chairman of the Central Works Council Infineon Technologies AG
Peter Gruber ¹Representative of Senior Management
52 Annual General Meeting 2015
Senior Vice President Operations Finance Infineon Technologies AG
Member of the Supervisory Board > Infineon Technologies Dresden GmbH, Dresden
Member of the Board of Directors > Infineon Technologies (Kulim) Sdn. Bhd., Kulim, Malaysia
Gerhard Hobbach ¹ 51 Annual General Meeting 2015
Member of the Infineon Works Council, Munich-Campeon, Infineon Technologies AG
Hans-Ulrich Holdenried 62 Annual General Meeting 2015
Management Consultant Member of the Supervisory Board> Integrata AG, Stuttgart> Wincor Nixdorf AG, Paderborn
Prof. Dr. Renate Köcher 61 Annual General Meeting 2015
Managing Director Institut für Demoskopie Allensbach GmbH, Allensbach
Member of the Supervisory Board> Allianz SE, Munich> BMW AG, Munich> Robert Bosch GmbH, Gerlingen > Nestlé Deutschland AG, Frankfurt am Main
Dr. Manfred Puffer 50 Annual General Meeting 2015
Management Consultant Member of the Board of Directors> Athene Holding Ltd., Pembroke, Bermuda> Athene Life Re Ltd., Pembroke, Bermuda
Prof. Dr. Doris Schmitt-Landsiedel
60 Annual General Meeting 2015
Professor, Munich Technical University
Jürgen Scholz ¹ 52 Annual General Meeting 2015
First authorized agent of IG Metall, Regensburg
Member of the Supervisory Board> Krones AG, Neutraubling
Member of the Administrative Board> BMW BKK AG, Dingolfing
Dr. Eckart Sünner 69 Annual General Meeting 2015
Of CounselAllen & Overy, Mannheim
Member of the Supervisory Board> K+S AG, Kassel
1 Employee representative
INFINEON TECHNOLOGIES ANNUAL REPORT 2013
CONSOLIDATED FINANCIAL STATEMENTS274
The Supervisory Board maintains the following principal committees
Mediation Committee
Wolfgang Mayrhuber (Chairman)
Alfred Eibl
Hans-Ulrich Holdenried
Gerd Schmidt
Executive Committee
Wolfgang Mayrhuber (Chairman)
Gerhard Hobbach
Hans-Ulrich Holdenried
Gerd Schmidt
Investment, Finance and Audit Committee
Dr. Eckart Sünner (Chairman)
Wigand Cramer
Wolfgang Mayrhuber
Gerd Schmidt
Strategy and Technology Committee
Prof. Dr. Doris Schmitt-Landsiedel (Chairwoman)
Alfred Eibl
Peter Gruber
Hans-Ulrich Holdenried
Wolfgang Mayrhuber
Jürgen Scholz
Nomination Committee
Wolfgang Mayrhuber (Chairman)
Prof. Dr. Renate Köcher
Dr. Manfred Puffer
The members of the Company’s Supervisory Board, individually or in aggregate, do not own, directly or indirectly,
more than 1 percent of Infineon Technologies AG’s outstanding share capital as of September 30, 2013.
The business address of each Supervisory Board is: Infineon Technologies AG, Am Campeon 1 – 12, D-85579
Neubiberg (Germany).

275INFINEON TECHNOLOGIES ANNUAL REPORT 2013
NOTES TO THE CONSOLIDATED FINANCIAL STATEMENTS
Subsidiaries, joint ventures and associated companies as of September 30, 2013
Name of company Registered Office Sharehold-ingsin %
Equity
(€ in millions)
Net Result
(€ in millions)
Foot-note
Fully consolidated subsidiaries:
Hitex Development Tools GmbH Karlsruhe, Germany 100 2.16 – ³
Infineon Integrated Circuit (Beijing) Co., Ltd. Beijing, People’s Republic of China 100 12.55 0.88 ⁶
Infineon Technologies (Advanced Logic) Sdn. Bhd. Malacca, Malaysia 100 24.34 1.40 ³
Infineon Technologies (Kulim) Sdn. Bhd. Kulim, Malaysia 100 142.83 25.45 ³
Infineon Technologies (Malaysia) Sdn. Bhd. Malacca, Malaysia 100 149.42 28.12 ³
Infineon Technologies (Wuxi) Co., Ltd. Wuxi, People’s Republic of China 100 104.94 10.24 ⁶
Infineon Technologies (Xi’an) Co., Ltd. Xi’an, People’s Republic of China 100 7.75 0.58 ⁶
Infineon Technologies Asia Pacific Pte. Ltd. Singapore, Singapore 100 153.49 33.21 ³
Infineon Technologies Australia Pty. Ltd. Bayswater, Australia 100 1.06 0.06 ³
Infineon Technologies Austria AG Villach, Austria 100 401.84 85.88 ³
Infineon Technologies Batam PT Batam, Indonesia 100 12.38 1.32 ³
Infineon Technologies Cegléd Kft. Cegléd, Hungary 100 16.26 1.54 ³
Infineon Technologies Center of Competence (Shanghai) Co., Ltd.
Shanghai, People’s Republic of China 100 2.63 0.09 ⁶
Infineon Technologies China Co., Ltd. Shanghai, People’s Republic of China 100 96.05 12.02 ⁶
Infineon Technologies Dresden GmbH Dresden, Germany 100 224.27 – ³
Infineon Technologies Finance GmbH Neubiberg, Germany 100 369.89 – ³
Infineon Technologies France S.A.S. St. Denis, France 100 12.90 1.77 ³
Infineon Technologies Holding B.V. Rotterdam, The Netherlands 100 2,102.71 188.22 ³
Infineon Technologies Hong Kong, Ltd. Hong Kong, People’s Republic of China 100 1.46 0.29 ³
Infineon Technologies India, Pvt. Ltd. Bangalore, India 100 16.70 1.31 ⁴
Infineon Technologies Industrial Power, Inc. Wilmington, Delaware, USA 100 9.45 1.04 ³
Infineon Technologies Investment B.V. Rotterdam, The Netherlands 100 1.04 – ³
Infineon Technologies Italia s.r.l. Milan, Italy 100 0.81 0.39 ³
Infineon Technologies IT-Services GmbH Klagenfurt, Austria 100 6.03 3.39 ³
Infineon Technologies Japan K.K. Tokyo, Japan 100 5.31 0.97 ³
Infineon Technologies Korea Co., Ltd. Seoul, Republic of Korea 100 3.90 0.72 ³
Infineon Technologies Nordic AB Kista, Sweden 100 5.34 (0.60) ³
Infineon Technologies North America Corp. Wilmington, Delaware, USA 100 95.48 6.01 ³
Infineon Technologies Romania & Co. Societate in Comandita Bucharest, Romania 100 0.42 0.40 ⁷
Infineon Technologies Shared Service Center, Unipessoal Lda. Maia, Portugal 100 0.98 0.14 ³
Infineon Technologies Taiwan Co., Ltd. Taipei, Taiwan 100 2.35 0.75 ³
Infineon Technologies U.K. Ltd. Bristol, Great Britain 100 2.32 1.17 ³
Molstanda Vermietungsgesellschaft mbH Neubiberg, Germany 94 9.85 2.43 ⁶
Joint Ventures/Associated companies:
Cryptomathic A/S Arhus, Denmark 34 12.01 0.70 ⁶
Cryptomathic Holding ApS Arhus, Denmark 34 3.96 2.51 ⁶
Infineon Technologies Bipolar GmbH & Co. KG Warstein, Germany 60 68.21 (0.86) ³
Infineon Technologies Bipoláris Kft. Cegléd, Hungary 60 1.48 (0.05) ³
LS Power Semitech Co., Ltd. Cheonan, Republic of Korea 46 6.69 (9.78) ⁶

INFINEON TECHNOLOGIES ANNUAL REPORT 2013
CONSOLIDATED FINANCIAL STATEMENTS276
Name of company Registered Office Sharehold-ingsin %
Equity
(€ in millions)
Net Result
(€ in millions)
Foot-note
Immaterial subsidiaries: ¹
DICE Danube Integrated Circuit Engineering GmbH Linz, Austria 72 0.09 – ³
DICE Danube Integrated Circuit Engineering GmbH & Co. KG Linz, Austria 72 1.23 1.17 ³
EPOS embedded core & power systems GmbH & Co. KG Duisburg, Germany 100 0.47 0.22 ³
EPOS embedded core & power systems Verwaltungs GmbH Duisburg, Germany 100 0.04 – ³
eupec Thermal Management Inc. Wilmington, Delaware, USA 51 0.25 0.08 ³
Hitex (UK) Limited Coventry, Great Britain 88 1.53 0.29 ³
Infineon Technologies Austria Pensionskasse AG Villach, Austria 100 0.72 0.04 ⁶
Infineon Technologies Bipolar Verwaltungs GmbH Warstein, Germany 60 0.03 – ³
Infineon Technologies Canada, Inc. St. John, New Brunswick, Canada 100 0.00 – ³
Infineon Technologies Delta GmbH Neubiberg, Germany 100 0.02 – ³
Infineon Technologies Gamma GmbH Neubiberg, Germany 100 0.02 – ³
Infineon Technologies Iberia S.L.U. Madrid, Spain 100 0.14 0.03 ³
Infineon Technologies Ireland Ltd. Dublin, Ireland 100 0.47 0.08 ³
Infineon Technologies Mantel 19 GmbH Neubiberg, Germany 100 0.05 – ³
Infineon Technologies Mantel 21 GmbH Neubiberg, Germany 100 0.03 – ³
Infineon Technologies Mantel 24 GmbH Neubiberg, Germany 100 0.02 – ³
Infineon Technologies Mantel 25 GmbH Neubiberg, Germany 100 0.02 – ³
Infineon Technologies Mantel 26 AG Neubiberg, Germany 100 0.05 – ³
Infineon Technologies Pluto GmbH in liquidation Neubiberg, Germany 100 0.22 – ³
Infineon Technologies Romania s.r.l. Bucharest, Romania 100 0.04 0.01 ⁶
Infineon Technologies RUS LLC Moscow, Russian Federation 100 0.09 0.02 ⁶
Infineon Technologies Schweiz GmbH Zurich, Switzerland 100 0.21 0.04 ³
Infineon Technologies South America Ltda. São Paulo, Brazil 100 0.08 (0.02) ³
KAI Kompetenzzentrum Automobil- und Industrieelektronik GmbH Villach, Austria 60 0.10 – ⁶
KFE Kompetenzzentrum Fahrzeug Elektronik GmbH Lippstadt, Germany 24 0.96 (0.20) ⁶
Magellan Technology Pty. Ltd. Annandale, Australia 18 1.02 (1.19) ⁵
MicroLinks Technology Corp. Kaohsiung, Taiwan 1 0.98 (0.38) ⁶
OSPT IP Pool GmbH Neubiberg, Germany 100 0.02 – ³
Qimonda AG and its subsidiaries: ²
Celis Semiconductor Corp. Colorado Springs, Colorado, USA 17 – – ²
Itarion Solar Lda. Vila do Conde, Portugal 40 – – ²
Qimonda (Malaysia) Sdn. Bhd. in liquidation Malacca, Malaysia 77 – – ²
Qimonda AG in insolvency Munich, Germany 77 – – ²
Qimonda Asia Pacific Pte. Ltd. Singapore, Singapore 77 – – ²
Qimonda Belgium BVBA in insolvency Leuven, Belgium 77 – – ²
Qimonda Beteiligungs GmbH in insolvency Munich, Germany 77 – – ²
Qimonda Bratislava s.r.o. in liquidation Bratislava, Slovakia 77 – – ²
Qimonda Dresden GmbH & Co. OHG in insolvency Dresden, Germany 77 – – ²
Qimonda Dresden Verwaltungsgesellschaft mbH in insolvency Dresden, Germany 77 – – ²
Qimonda Europe GmbH in liquidation Munich, Germany 77 – – ²
Qimonda Finance LLC in insolvency Wilmington, Delaware, USA 77 – – ²
Qimonda Flash Geschäftsführungs GmbH in liquidation Dresden, Germany 77 – – ²
Qimonda Flash GmbH in insolvency Dresden, Germany 77 – – ²
Qimonda France SAS in liquidation St. Denis, France 77 – – ²
Qimonda Holding B.V. in insolvency Rotterdam, The Netherlands 77 – – ²

277INFINEON TECHNOLOGIES ANNUAL REPORT 2013
NOTES TO THE CONSOLIDATED FINANCIAL STATEMENTS
Name of company Registered Office Sharehold-ingsin %
Equity
(€ in millions)
Net Result
(€ in millions)
Foot-note
Qimonda International Trade (Shanghai) Co. Ltd. Shanghai, People’s Republic of China 77 – – ²
Qimonda Investment B.V. Rotterdam, The Netherlands 77 – – ²
Qimonda IT (Suzhou) Co., Ltd. in liquidation Suzhou, People’s Republic of China 77 – – ²
Qimonda Italy s.r.l. in liquidation Padua, Italy 77 – – ²
Qimonda Korea Co.Ltd. in liquidation Seoul, Republic of Korea 77 – – ²
Qimonda Licensing LLC Fort Lauderdale, Florida, USA 77 – – ²
Qimonda Memory Product Development Center (Suzhou) Co., in liquidation
Suzhou, People’s Republic of China 77 – – ²
Qimonda North America Corp. in insolvency Wilmington, Delaware, USA 77 – – ²
Qimonda Richmond LLC in insolvency Wilmington, Delaware, USA 77 – – ²
Qimonda Solar GmbH Dresden, Germany 77 – – ²
Qimonda Taiwan Co. Ltd. in liquidation Taipei, Taiwan 77 – – ²
Qimonda UK Ltd. in liquidation High Blantyre, Scotland 77 – – ²
1 Certain immaterial subsidiaries were not consolidated in the 2013 and 2012 fiscal years. Infineon evaluates the significance of these subsidiaries
once a year. Net income, external revenue and total assets of all subsidiaries deemed to be immaterial were less than 1 percent of Infineon’s
net income, external revenue and total assets, respectively.
2 On January 23, 2009 Qimonda AG applied to the Munich District Court insolvency proceedings to be opened. Insolvency proceedings were formally
opened on April 1, 2009. The equity and earnings of Qimonda AG and its subsidiaries are not disclosed due to the substantial and ongoing restriction
of Infineon’s rights as a result of Qimonda AG’s insolvency. In addition, the list of subsidiaries held by Qimonda AG was based on information from
September 30, 2010, since Infineon had not received any further information from the insolvency administrator of Qimonda AG with respect to the
insolvency or liquidation of Qimonda companies. Since all Qimonda-related investments were written down in full in previous years, this has no
effect on Infineon’s net assets, financial position and results of operations.
3 Equity and net result as of September 30, 2012
4 Equity and net result as of March 31, 2012
5 Equity and net result as of June 30, 2012
6 Equity and net result as of December 31, 2012
7 Equity and net result as of September 30, 2012 (short business year from January 1, 2012 to September 30, 2012)
The values in the above table represent financial statements prepared according to local requirements and are,
in some cases, provisional.
Neubiberg, November 19, 2013
Infineon Technologies AG
Management Board
Dr. Reinhard Ploss Dominik Asam Arunjai Mittal

INFINEON TECHNOLOGIES ANNUAL REPORT 2013
FURTHER INFORMATION278
RESPONSIBILITY STATEMENT BY THE MANAGEMENT BOARD
To the best of our knowledge, and in accordance with the applicable reporting principles, the Consolidated
Financial Statements give a true and fair view of the assets, liabilities, financial position and profit or loss
of the Infineon Group, and the Group Management Report includes a fair review of the development and
performance and position of the Group, together with a description of the principal opportunities and risks
associated with the expected development of the Group.
Neubiberg, November 19, 2013
Infineon Technologies AG
Dr. Reinhard Ploss Dominik Asam Arunjai Mittal

279
AUDITOR’S REPORT
We have audited the consolidated financial statements prepared by the Infineon Technologies AG, Neubiberg,
comprising the statements of financial statements, operations, comprehensive income, cash flows and
changes in equity, together with the management report of the Company and the Group for the business year
from October 1, 2012 to September 30, 2013. The preparation of the consolidated financial statements and
the group management report in accordance with IFRSs, as adopted by the EU, and the additional requirements
of German commercial law pursuant to § 315a Abs. 1 HGB [Handelsgesetzbuch “German Commercial Code”]
are the responsibility of the Managing Board of the Company. Our responsibility is to express an opinion on the
consolidated financial statements and on the group management report based on our audit.
We conducted our audit of the consolidated financial statements in accordance with § 317 HGB and German
generally accepted standards for the audit of financial statements promulgated by the Institut der Wirtschafts-
prüfer [Institute of Public Auditors in Germany] (IDW). Those standards require that we plan and perform the
audit such that misstatements materially affecting the presentation of the net assets, financial position and
results of operations in the consolidated financial statements in accordance with the applicable financial
reporting framework and in the group management report are detected with reasonable assurance. Knowledge
of the business activities and the economic and legal environment of the Group and expectations as to possible
misstatements are taken into account in the determination of audit procedures. The effectiveness of the
accounting-related internal control system and the evidence supporting the disclosures in the consolidated
financial statements and the group management report are examined primarily on a test basis within the frame-
work of the audit. The audit includes assessing the annual financial statements of those entities included in
consolidation, the determination of entities to be included in consolidation, the accounting and consolidation
principles used and significant estimates made by management, as well as evaluating the overall presentation
of the consolidated financial statements and group management report. We believe that our audit provides
a reasonable basis for our opinion.
Our audit has not led to any reservations.
In our opinion, based on the findings of our audit, the consolidated financial statements comply with IFRSs, as
adopted by the EU, the additional requirements of German commercial law pursuant to § 315a Abs. 1 HGB and
give a true and fair view of the net assets, financial position and results of operations of the Group in accordance
with these requirements. The group management report is consistent with the consolidated financial state-
ments and as a whole provides a suitable view of the Group’s position and suitably presents the opportunities
and risks of future development.
Munich, November 19, 2013
KPMG AG
Wirtschaftsprüfungsgesellschaft
Braun Wolper
Wirtschaftsprüfer Wirtschaftsprüfer
INFINEON TECHNOLOGIES ANNUAL REPORT 2013
AUDITOR’S REPORT

INFINEON TECHNOLOGIES ANNUAL REPORT 2013
FURTHER INFORMATION280
€ in millions, except otherwise stated 2013 2012 2011 2010 2009
CONSOLIDATED STATEMENTS OF OPERATIONS DATA
Revenue by region
Europe, Middle East, Africa 1,567 1,732 1,920 1,528 1,019
Therein: Germany 795 908 1,090 862 530
Asia-Pacific (w/o Japan) 1,560 1,470 1,450 1,202 768
Therein: China 710 637 663 595 359
Japan 227 252 202 184 116
Americas 489 450 425 381 281
Revenue by Segment
Automotive 1,714 1,660 1,552 1,268 839
Industrial & Multimarket ¹ – – – 1,429 948
Industrial Power Control 651 728 797 – –
Power Management & Multimarket 987 929 1,003 – –
Chip Card & Security 463 457 428 407 341
Other Operating Segments 26 125 216 194 48
Corporate and Eliminations 2 5 1 (3) 8
Total Revenue 3,843 3,904 3,997 3,295 2,184
Gross profit 1,323 1,427 1,654 1,237 497
Gross margin 34.4 % 36.6 % 41.4 % 37.5 % 22.8 %
Research and development expenses (525) (455) (439) (399) (319)
Selling, general and administrative expenses (440) (475) (449) (386) (332)
Other operating income and expense, net (33) (42) (30) (104) (29)
Operating income (loss) 325 455 736 348 (183)
Net financial result (21) (23) (26) (66) (53)
Income from investments accounted for using the equity method 2 (1) 4 8 7
Income tax (23) 1 30 22 (4)
Income (loss) from continuing operations 283 432 744 312 (233)
Income (loss) from discontinued operations, net of income taxes (11) (5) 375 348 (441)
Net income (loss) 272 427 1,119 660 (674)
Basic earnings (loss) per share attributable to shareholders of Infineon Technologies AG (in euro):
Basic earnings (loss) per share (in euro) from continuing operations 0.26 0.40 0.68 0.29 (0.27)
Basic earnings (loss) per share (in euro) from discontinued operations (0.01) – 0.35 0.32 (0.46)
Basic earnings (loss) per share (in euro) 0.25 0.40 1.03 0.61 (0.73)
Diluted earnings (loss) per share attributable to shareholders of Infineon Technologies AG (in euro):
Diluted earnings (loss) per share (in euro) from continuing operations 0.26 0.39 0.66 0.28 (0.27)
Diluted earnings (loss) per share (in euro) from discontinued operations (0.01) – 0.32 0.30 (0.46)
Diluted earnings (loss) per share (in euro) 0.25 0.39 0.98 0.58 (0.73)
Key Data for the Consolidated Statement of Operations
Return on sales ² 7.1 % 10.9 % 28.0 % 20.0 % (30.9 %)
EBIT ³ 327 453 740 363 (189)
EBIT margin ⁴ 8.5 % 11.6 % 18.5 % 11.0 % (8.7 %)
EBITDA ⁵ 793 881 1,104 699 264
Segment Result
Automotive 167 219 279 198 (117)
Industrial & Multimarket ¹ – – – 294 40
Industrial Power Control 38 118 202 – –
Power Management & Multimarket 144 142 242 – –
Chip Card & Security 39 56 54 22 (4)
Other Operating Segments (9) 5 14 (4) (9)
Corporate and Eliminations (2) (13) (5) (35) (50)
Segment Result: 377 527 786 475 (140)
Segment Result Margin 9.8 % 13.5 % 19.7 % 14.4 % (6.4 %)
FINANCIAL DATA 2009 – 2013

281INFINEON TECHNOLOGIES ANNUAL REPORT 2013
FINANCIAL DATA 2009 – 2013
€ in millions, except otherwise stated 2013 2012 2011 2010 2009
CONSOLIDATED STATEMENT OF FINANCIAL POSITION DATA
Total assets 5,905 5,898 5,873 4,993 4,366
Gross cash position 2,286 2,235 2,692 1,727 1,507
Net cash position 1,983 1,940 2,387 1,331 802
Inventories 609 567 507 514 460
Assets classified as held for sale – 5 5 495 112
Property, plant and equipment 1,600 1,731 1,343 838 928
Goodwill and other intangible assets 170 146 111 87 369
Debt 303 295 305 396 850
Provisions 721 740 836 608 525
Liabilities classified as held for sale – – – 177 9
Total liabilities 2,129 2,323 2,518 2,368 2,273
Total equity 3,776 3,575 3,355 2,625 2,093
Statement of Financial Position Ratios
Equity ratio 63.9 % 60.6 % 57.1 % 52.6 % 47.9 %
Return on equity 7.2 % 11.9 % 33.4 % 25.1 % (32.2 %)
Return on assets 4.6 % 7.2 % 19.1 % 13.2 % (15.4 %)
Return on Capital Employed (RoCE) 14.1 % 22.3 % 62.1 % 30.2 % (11.9 %)
CONSOLIDATED STATEMENTS OF CASH FLOWS DATA
Net cash provided by operating activities from continuing operations 610 667 983 958 282
Net cash provided by (used in) investing activities from continuing operations (328) (1,013) (2,499) (355) 25
Net cash provided by (used in) financing activities from continuing operations (165) (199) (352) (487) 391
Net increase in cash and cash equivalents from discontinued operations (10) (40) 1,206 136 (446)
Depreciation and amortization 466 428 364 336 453
Purchases of property, plant and equipment and intangible assets and other assets (378) (890) (887) (325) (115)
Cash flow 107 (585) (662) 252 252
Free cash flow 235 (219) 106 573 274
The IFX Share (as of September 30)
Dividend per share ⁷ in € 0.12 0.12 0.12 0.10 –
Dividend ⁷ in € million 129 129 130 109 –
Closing price Xetra Trading System in € 7.40 4.94 5.59 5.08 3.86
Closing price OTCQX in US dollar 9.98 6.44 7.39 6.93 5.60
Shares outstanding in million 1,081 1,080 1,087 1,087 1,087
Market capitalization in € million 7,995 5,335 6,073 5,521 4,189
Market capitalization in US dollar million 10,789 6,957 8,031 7,514 6,129
Infineon-Employees (as of September 30 in total figures) 26,725 26,658 25,720 26,654 26,464
1 The Industrial & Multimarket segment was split into two separate segments effective January 1, 2012, namely the Industrial Power Control segment
and the Power Management & Multimarket segment. Prior year figures have been adjusted accordingly.
2 Return on sales = Net income/loss divided by revenue.
3 EBIT = Earnings from continuing operations before interest and tax.
4 EBIT margin = EBIT divided by revenue.
5 EBITDA = EBIT plus scheduled depreciation and amortization.
6 Return on assets = Net income (loss) divided by total assets.
7 A cash dividend of €0.12 per share for the 2013 fiscal year will be proposed to the Annual General Meeting.
This would result in a distribution of approximately €129 million.

INFINEON TECHNOLOGIES ANNUAL REPORT 2013
FURTHER INFORMATION282
LIST OF GRAPHICS
Graphic Page
G 01 Sustainability 2
G 02 Revenue development of Infineon and the individual segments in the 2013 fiscal year compared to the previous year 23
G 03 Revenue, Segment Result and Segment Result Margin of the last twelve quarters 24
G 04 Expected worldwide car production by region 26
G 05 Emission targets of different regions 27
G 06 New installations 2012 of wind converters by region 28
G 07 Expected growth of tablets 29
G 08 Expected growth of payment and banking cards 29
G 09 “Product to System” 33
G 10 Infineon’s competitiveness and profitability ensured by the addition of a third pillar: System competence 35
G 11 Revenue and Segment Result of the Automotive segment 39
G 12 Automotive segment revenue by region 39
G 13 World automotive semiconductor sales 2012 by region 43
G 14 World automotive semiconductor market share 43
G 15 Asia-Pacific automotive semiconductor market share 43
G 16 S. Korea automotive semiconductor market share 43
G 17 Revenue and Segment Result of the Industrial Power Control segment 45
G 18 Industrial Power Control segment revenue by region 46
G 19 Approximately 10 percent of worldwide electricity consumption could be saved by electronically controlled electric motors 47
G 20 Improvement of power density in the last 20 years 47
G 21 World discrete power semiconductors and modules market share 49
G 22 World IGBT modules market share 49
G 23 Revenue and Segment Result of the Power Management & Multimarket segment 51
G 24 Power Management & Multimarket segment revenue by region 51
G 25 80 PLUS performance specification 53
G 26 World standard power MOSFET market share 55
G 27 World silicon MEMS microphones market share 55
G 28 Revenue and Segment Result of the Chip Card & Security segment 57
G 29 Chip Card & Security segment revenue by region 58
G 30 Schematic representation of the layering of a card using Coil on Module technology 59
Graphic Page
G 31 World microcontroller-based chip card ICs market share 61
G 32 Investments 71
G 33 Corporate Social Responsibility 80
G 34 Stakeholders 81
G 35 Projects in the 2013 fiscal year 82
G 36 Injury Rate (IR) 83
G 37 Lost Day Rate (LDR) 83
G 38 Water consumption 84
G 39 Standardized water consumption 84
G 40 Water management 85
G 41 Water discharges 2013 85
G 42 Energy consumption 86
G 43 Standardized electricity consumption 86
G 44 PFC emissions 87
G 45 PFC emissions’ target 87
G 46 Emissions and immisions considered in the calculation of the CO₂ footprint 88
G 47 Carbon footprint 89
G 48 Waste generation 90
G 49 Waste by disposal method in the 2013 fiscal year 90
G 50 Standardized waste generation 90
G 51 Smelters by region 94
G 52 Examples of corporate citizenship activities at Infineon during the 2013 fiscal year 95
G 53 Nationalities (Infineon worldwide 2013) 98
G 54 Women in management positions (Infineon worldwide) 98
G 55 Training expenses 99
G 56 Female/male employees(New Entries worldwide 2013) 103
G 57 Age structure (New Entries worldwide 2013) 103
G 58 Age structure (Infineon worldwide 2013) 103
G 59 Shareprice development 108
G 60 World economic growth 116
G 61 Development of the semiconductor market 117
G 62 Revenue by segment 119
G 63 Revenue by region 120
G 64 Orders received and Revenue 120
G 65 Gross profit and gross margin 121
G 66 R&D expenses 122
G 67 Selling, general and administrative expenses 122
G 68 Assets 125
G 69 Liabilities and equity 125
G 70 RoCE 126
G 71 Cash flow 128
G 72 Free cash flow 129
G 73 Liquidity position as of September 30, 2013 and 2012 by comparison 130
G 74 Risk assessment matrix 141

283
FINANCIAL GLOSSARY
ADS
American Depositary Shares – ADSs are U.S.-traded
securities represented by an American Depositary Receipt
for non-U.S. issuers. These securities simplify the access to
U.S. capital markets for non-U.S.-based companies, and in
turn provide U.S. investors with investment opportunities in
non-U.S. securities. Since the delisting from the New York
Stock Exchange (“NYSE”), the Infineon ADSs have been traded
over the counter on the OTCQX International Premier market
as a sponsored Level 1 program. After the deregistration the
ADSs continue being traded on the OTCQX market with the
ticker symbol IFNNY.
Associated Companies
An entity in which the Company has significant influence,
but not a controlling interest, over the financial and operating
management policy decisions of the entity. Significant
influence is generally presumed when the Company holds
between 20 percent and 50 percent of the voting rights.
Carve-Out
Legal separation of business operations (e.g. business units).
Cash flow
The cash-effective balance arising from inflows and outflows
of funds over the fiscal year. The Consolidated Statement of
Cash Flows is part of the Consolidated Financial Statements
and shows how the Company generated cash during a certain
period and where it spent cash, in terms of operating activities
(cash the Company made by purchasing/selling goods and
services), investing activities (cash the Company spent for
investment, or cash it raised from divestitures), and financing
activities (cash the Company raised by selling stocks, bonds
and loans or spent for the redemption of stocks or bonds or
for the repayment of loans).
Convertible bond
Convertible notes/bonds are interest-bearing securities
which normally - in addition to the right to receive interest
and repayment of the nominal amount - give the bearer a
conversion option. During the term of the option (conversion
period), the bearer can exchange the convertible bond/note
for a specified number of shares of the issuing entity. The
conversion ratio is stipulated and is typically adjusted for
transactions affecting the shareholders, such as dividend
payments. If the bondholder/noteholder does not convert
the bond/note into shares during the conversion period, the
issuer redeems the bond/note at the end of the term at its
nominal amount.
DAX
Deutscher Aktienindex – The German Stock Index tracking
the 30 major German companies traded on the Frankfurt
Stock Exchange, in terms of order volume or market capital-
ization.
Deferred tax
Since tax laws often differ from the recognition and mea-
surement requirements of financial accounting standards,
differences can arise between (a) the amount of taxable
income and pre-tax financial income for a year and (b) the
tax bases of assets or liabilities and their reported amounts
in financial statements. A deferred tax liability and corre-
sponding expense results from income that has already been
earned for accounting purposes but not for tax purposes.
Conversely, a deferred tax asset and corresponding benefit
results from amounts deductible in future years for tax pur-
poses but that have already been recognized for accounting
purposes.
Defined benefit obligations (DBO)
A measure of a pension plans’ liability at the calculation date
assuming that the plan is ongoing and will not terminate in
the foreseeable future.
Derivative
A financial instrument that derives its value from the price
or expected price of an underlying asset (e.g. a security,
currency or bond).
EPS
Earnings Per Share. Basic earnings per share are calculated by
dividing group net income by the weighted average number
of ordinary shares outstanding during the reporting period.
Diluted EPS is calculated by dividing group net income by
the sum of the weighted average number of ordinary shares
outstanding plus all additional ordinary shares that would
have been outstanding if potentially dilutive instruments
had been converted into ordinary shares.
Equity Method
Valuation method for interests in associated companies in
which the investor has the ability to exercise significant
influence over the investee’s financial and operating policies.
INFINEON TECHNOLOGIES ANNUAL REPORT 2013
FINANCIAL GLOSSARY

INFINEON TECHNOLOGIES ANNUAL REPORT 2013
FURTHER INFORMATION284
Free cash flow
Net cash provided by/used in operating and investing
activities from continuing operations excluding cash flows
related to the purchase or sale of financial investments.
Goodwill
An intangible asset of the Company that results from a busi-
ness acquisition, representing the excess of the purchase
price (cost) paid for the acquired business over the fair value
of the separately identifiable assets acquired and liabilities
and contingencies assumed. Under IFRS, goodwill is not
reduced through scheduled amortization, but rather written
down to its fair value if impaired. An impairment assessment
is performed at least once a year.
Gross cash position
Total of cash and cash equivalents plus financial investments.
Gross profit
Revenues less cost of goods sold.
IFRS
International Financial Reporting Standards; Infineon prepares
its Consolidated Financial Statements in accordance with
IFRS, as adopted by the European Union.
Joint Venture
A contractual arrangement whereby two or more parties
undertake an economic activity that is subject to joint control.
Net cash position
Gross cash position less short-term and long-term debt.
Profit or loss and capital-share attributable to
non-controlling interests
Proportional share in net income and equity attributable to
outside shareholders, and not to shareholders of the
Infineon Group’s parent company.
Put options
In the case of a put option, the buyer acquires a contractual
right to sell a stipulated quantity of an underlying asset
(e.g. a share) at a predetermined date (European option) at
a specified price (underlying price). In return, the issuer
receives an option premium from the buyer of the put option.
Registered shares
Shares registered in the name of a certain person. This
person’s details and number of shares are registered in the
Company’s share ledger in accordance with securities regu-
lations. Only individuals registered in the Company’s share
ledger are considered shareholders of the Company and are,
for example, able to exercise their rights at the Company’s
Annual General Meeting.
RoCE
Return on capital employed is defined as the operating
result after tax from continuing operations divided by capital
employed. RoCE shows the linkage between profitability
and capital resources required to run the business.
Segment Result
Infineon defines Segment Result as operating income (loss)
excluding: asset impairments (net of reversals); the net
impact on earnings of restructuring measures and closures;
share-based compensation expense; acquisition-related
depreciation/amortization and (gains) losses; gains (losses)
on sales of assets, businesses, or interests in subsidiaries
as well as other income (expense), including litigation
settlement costs. This is the measure that Infineon uses to
evaluate the operating performance of its segments.
Segment Result Margin
An indicator of operating performance, calculated as the
percentage of Segment Result in relation to revenue.
Working capital
Working capital consists of current assets less cash and
cash equivalents, financial investments and assets held
for sale less current liabilities excluding short-term debt
and current maturities of long-term debt excluding liabilities
classified as held for sale.

285
300-millimeter technology
Comprehensive term for the manufacture and processing
of wafers with a diameter of 300 millimeters.
40-/65-/90-nanometer technology
Manufacturing technology can be descibed by feature size,
such as 90, 65, or 40 nanometers. The smaller the struc-
tures, e.g. lines and pitches, the smaller the chip and the
cheaper its manufacturing. The 40 nanometer technology
succeeds the 65 nanometer technology, which followed the
90 nanometer technology.
ABS
The anti-lock braking system is an electronic vehicle
safety feature that prevents the wheels from locking during
heavy braking.
AC/DC conversion
Alternating Current/Direct Current conversion. This is a
generic term for power supplies in which alternating current
from the mains is converted to direct current, which often
then needs to be precisely converted to a lower current
(see also ‘DC/DC conversion’).
Analog/mixed-signal
“Mixed-signal” is a generic term for integrated circuits that
operate simultaneously with analog and digital signals.
Owing to similar requirements in terms of development
and manufacturing processes, they are generally grouped
together with integrated circuits operating exclusively
with analog signals, hence giving rise to the combination
“analog/mixed-signal”.
ASIC
Application Specific Integrated Circuit. Logic IC specially
constructed for a specific application and customer;
implemented on an integrated circuit.
ASSP
Application Specific Standard Product. Standard product
designed for a specific use that can be used by many
customers; implemented on an integrated circuit.
AURIX™
Infineon brand name for the 32-bit multicore automotive
microcontroller family.
Backend manufacturing
The part of the semiconductor manufacturing process that
happens after the wafer has left the cleanroom (frontend
manufacturing). This includes testing the chips at wafer
level, repairing the chips if necessary, dicing the wafers and
packaging the individual chips. There is a growing trend
among semiconductor manufacturers to outsource the
assembly, and sometimes even the testing, to independent
assembly companies. Much of the assembly capacity is
based in the Pacific Rim countries.
Band gap
The term band gap, also known as energy gap, has its ori-
gins in the quantum mechanical band model and describes
the energy difference between the valence band and the
conduction band of a solid. The unit of measurement is the
electron volt (eV). Conductors do not have band gaps,
whereas insulators have band gaps greater than 4 eV. Semi-
conductors have band gaps ranging from 0.1 eV to around
4 eV (Si: 1.12 eV; SiC: 2.36 to 3.03 eV; GaN: 3.37 eV).
Bare die
A bare die is a single, unpackaged chip. Bare die business
means the sale of fully processed, unpackaged chips. The
packaging and subsequent testing of the packaged chips
is performed by the customer. Bare die business is mostly
conducted with IGBT module manufacturers that produce
their own modules but not their own semiconductors.
BCD process
A special process for manufacturing high-voltage low
power ICs. The abbreviation BCD stands for “bipolar CMOS
with DMOS”.
Bipolar
A power bipolar transistor is a specialized version of a bipo-
lar transistor that is optimized for conducting and blocking
large electric currents (up to several hundred amperes) and
very high voltages (up to several 1,000 volts). In industry,
the power bipolar transistor – like the power MOSFET (see
MOSFET) often used as an alternative – constitutes an import-
ant industrial semiconductor component for influencing
electric current.
Bit
Information unit; can take one of two values “true”/“false”
or “0”/“1”.
TECHNOLOGY GLOSSARY
INFINEON TECHNOLOGIES ANNUAL REPORT 2013
TECHNOLOGY GLOSSARY

INFINEON TECHNOLOGIES ANNUAL REPORT 2013
FURTHER INFORMATION286
Breakthrough voltage
The breakthrough voltage for semiconductor components
is the voltage that, when exceeded, the current increases
sharply and can ultimately lead to the destruction of the
component. The breakthrough voltage can be determined by
the doping of the semiconductor layers.
Byte
Unit of information in data processing components. One byte
is equivalent to eight bits (see bit).
Cloud computing
Cloud computing is the provision of processing capacity,
data storage, network capacity and ready-to-use software
via a network with supply matched dynamically to demand.
The IT infrastructure functions accessed appear remote
and opaque from the user’s perspective, as if enveloped
in a cloud. The remote systems of the cloud are accessed
via a network, usually the Internet, using a terminal such as
a netbook or tablet (see tablet).
CMOS
Complementary Metal Oxide Substrate. Standard semicon-
ductor manufacturing technology used to manufacture micro-
chips with low power usage and a high level of integration.
Common Criteria
Common Criteria for Information Technology Security
Evaluation, generally known as Common Criteria for short,
constitute an international standard for evaluating and
certifying the security of computer systems with regard to
data security. The Common Criteria define seven levels of
reliability (Evaluation Assurance Level, EAL1 to EAL7, i.e.
the highest level), which describe the correctness of the
implementation and the depth of inspection of the system
being evaluated.
Converter
Control unit that can convert AC voltages of various rates and
frequencies. This is achieved by means of power electronics.
Converters are used in wind turbines, for example, in order
to feed fluctuating wind energy into the power network with
a voltage of constant frequency. In electric drive technology,
for example in engine controllers and trains, a converter is
used to generate an output voltage of variable, load-depen-
dent frequency from a mains supply of constant frequency.
CoolMOS™
High-voltage power transistor for voltages from 300 to 1,200 V.
DC/DC conversion
Direct Current/Direct Current conversion. A high DC input
voltage is converted to a mostly lower, highly precise DC
output voltage. The DC/DC conversion is usually positioned
on the motherboard in close proximity to the electrical
consumer. These consumers can be, for example, the micro-
processors of a PC or server, the graphics controller of a
graphics card or the network processor of a telecommuni-
cations facility.
Embedded flash
A nonvolatile memory that is integrated on a chip together
with a microcontroller processor core. The nonvolatile
memory contains the program code.
Epitaxy
From the Greek epi ‘upon’ and taxis ‘arrangement’ or ‘orien-
tation’. Epitaxy is a form of crystalline growth that occurs
both in nature (such as in minerals) and in the technical
world. In semiconductor technology, epitaxy is the artificial
growth of crystalline layers on a substrate, which is usually
a wafer. Epitaxy enables various doping profiles for tran-
sistors to be created, which are not feasible using other
methods such as diffusion or ion implantation.
EPS
Electric Power Steering is an electrically driven power
steering system, which is equipped with an electric motor
as opposed to hydraulically driven systems. The advantage
is that the power steering can be tailored to suit the current
requirement. In other words, it is only activated as needed
during steering operations, which leads to greater fuel
economy compared with hydraulic power steering systems.
ESC
Electronic Stability Control. A vehicular technology system
that uses sensors and computers to brake individual wheels
in order to prevent skidding.

287INFINEON TECHNOLOGIES ANNUAL REPORT 2013
TECHNOLOGY GLOSSARY
ESD
Electrostatic discharge. ESD is a spark or disruptive discharge
caused by a large potential difference in an electrically
isolating material that causes a very short, high electrical
current impulse capable of destroying electronic devices
such as mobile telephones. The cause of the potential differ-
ence is mostly a static electricity charge, which can happen,
for example, when walking over a carpet and can charge
a person with up to 30,000 volts.
Euro NCAP
European New Car Assessment Programme. The Euro NCAP
carries out crash tests and provides automobile buyers with
a realistic, independent assessment of the safety features
of many of the most sold vehicles in Europe. Euro NCAP was
founded in 1997 and is meanwhile supported by seven
European governments as well as automobile and consumer
organizations from all EU states.
Exa
A decimal prefix for usage in the international system of
units, Exa stands for 10 ¹⁸ = 1 quintillion, abbreviated “E”,
for example exabyte (EByte).
FACTS
Flexible AC Transmission System – control systems used in
electrical engineering. They are used in the field of electrical
power supply to specifically control power transmission
and distribution in AC networks, in which in principle com-
ponents of power electronics and therefore power semi-
conductors such as IGBT modules are used. The controlling
of power transfers can be implemented in alternating current
networks by changing the idle and active power by means
of capacitor batteries or compensation coils.
Firmware
Firmware is software that is embedded in electronic devices.
It is mostly embedded in the memory of a microcontroller
and cannot usually be replaced by the user. The terms derives
from the fact that firmware is functionally firmly connected
with the hardware, which means that neither one can func-
tion without the other. It occupies an intermediate position
between hardware and the application software.
Frontend manufacturing
Frontend process is the designation for all process steps in
cleanrooms that the entire wafer must complete. These are
lithography, diffusion, ion implantation and application of
circuitry levels. Some stations must be completed a number
of times. At the end of the frontend process, the wafer may
have been through as many as 500 individual process steps.
After the conclusion of the frontend manufacturing, the
processed wafers are transferred to backend manufacturing
for testing and packaging (see Backend manufacturing).
Gallium nitride
Gallium nitride (abbreviated to GaN) is a compound semi-
conductor material made from gallium (chemical symbol Ga)
and nitrogen (chemical symbol N). GaN is used for compo-
nents including radio-frequency power MOSFETs (see MOSFET)
on account of the material’s special properties (such as good
thermal conductivity and high electron mobility).
Giga
A decimal prefix for usage in the international system of
units, Giga stands for 10 ⁹ = 1 billion, abbreviated to “G”,
for example gigabyte (GByte).
GMR
Giant Magneto-Resistance. The GMR effect is utilized in
sensors for the purpose of measuring magnetic fields.
GMR sensors are employed in a range of applications, e.g.
as steering angle sensors in automobiles.
GPS
Global Positioning System. Satellite-based location identifi-
cation and positioning system based on the transit time
differences of received signals.
Hall sensor
A sensor based on the hall principle, used for measuring
magnetic fields, named after the US physicist Edwin Herbert
Hall (1855 – 1938). Hall sensors are used in automobiles,
for example, for detecting pedal positions or for measuring
the speed at which shafts rotate.
Hertz
Hertz (Hz) is the unit for frequency, and is named after
the German physicist Heinrich Rudolf Hertz (1857 – 1894).
The Hertz determines the number of oscillations per second,
or more generally speaking, the number of repetitive pro-
cesses per second. Frequently used units are kilohertz (one
thousand oscillations per second), megahertz (one million
oscillations per second) and gigahertz (one billion oscilla-
tions per second).

INFINEON TECHNOLOGIES ANNUAL REPORT 2013
FURTHER INFORMATION288
HEV/EV
Hybrid electric vehicle/electric vehicle: collective terms
for vehicles powered partly or entirely by an electric motor
(see hybrid car).
HVDC
High-voltage direct-current transmission. HVDC transmission
is a method of transmitting electrical energy at high direct-
current voltages of up to 800,000 volts over distances of
more than 1,000 kilometers. HVDC transmission is also used
for connecting offshore wind farms to the electricity grid on
the mainland.
Hybrid car
A hybrid car is usually understood to be a motor vehicle
that is driven by at least one electric motor, as well as a
combustion engine. The hybrid drive is used in standard car
construction to enhance efficiency, reduce consumption of
fossil fuels or increase performance at lower engine speeds.
In full hybrid cars the vehicle can be driven solely by the
electric motor. In mild hybrid cars, the electric motor is
simply used to support the combustion engine, for example
when accelerating.
Hybrid technology
The word “hybrid” comes from the Greek for “mixed” or
“originating from two different sources”. It has come to be
used to denote the heart of a new drive technology in the
automotive industry: hybrid vehicles operate with a combi-
nation of a diesel or gas engine and an electric motor.
IC
Integrated Circuit. Electronic Component parts composed of
semiconductor materials such as silicon; numerous compo-
nents, including transistors, resistors, capacitors and diodes
can be integrated into ICs and interconnected.
IGBT Module
Insulated Gate Bipolar Transistor Module. IGBTs are semi-
conductor components used increasingly in power electron-
ics due to their robustness, high blocking voltage, and their
ability to be triggered with negligible power. Modules are
formed using several IGBTs in parallel within a single casing.
These modules are used to drive electric motors both in
automotive and industrial applications. Motor speed and
torque can be regulated along a gradual scale. Trains such
as Germany’s ICE and France’s TGV use IGBT modules for an
efficient and rapid electrical drive control.
Integrity Guard
Integrity Guard (IG) is a revolutionary security technology
designed for chip cards and security applications, with which
Infineon is ringing in a new era in the field of hardware-based
security. IG was specially developed for sophisticated, long-
life applications such as payment cards and government
identification documents. IG enables a security controller
for the first time to provide complete error detection and
comprehensive encryption of all chip functions across the
entire data path within the chip. For this reason it is known
as ‘digital security’. IG is used in the security controllers
of the SLE 77 and 78 families and has won numerous inter-
national awards.
Inverter
An inverter, also called a DC/AC converter, is an electrical
device for converting DC voltage into AC voltage, or direct
current into alternating current. Inverters are used in solar
power plants, for example, for converting the DC voltage
generated in the solar modules into AC voltage, which is
then fed into the electricity network.
ISO 26262
ISO 26262 is an ISO standard for safety-related electrical
and electronic systems in various types of vehicle. ISO 26262
defines a procedure model together with required activities
and methods to be used in development and production.
The implementation of the standard is designed to guarantee
the functional safety of systems that include electrical and
electronic components in vehicles. The standard is used by
carmakers, automotive suppliers and testing institutions.
Kilo
A decimal prefix for usage in the international system of units,
kilo stands for 10 ³= 1,000, or abbreviated to “k”. In the
world of information technology, Kilo stands for 2 ¹⁰ = 1,024,
or “K” for short, e.g. kilobyte (KByte).
LDMOS
Laterally Diffused MOS transistor. The increasingly stringent
standards concerning the electrical properties of field-
effect transistors (MOSFETs) have led to the development
of variations of the planar MOSFET in recent decades. They
frequently differ in the design of their doping profile or
the selection of material. For instance, there is a difference
between lateral (i.e. those aligned parallel to the surface)
and vertical designs. Whereas lateral transistors (LDMOS)
are primarily used in radio-frequency applications for tele-
communications, the vertical design is mainly used in the
field of power electronics.

289INFINEON TECHNOLOGIES ANNUAL REPORT 2013
TECHNOLOGY GLOSSARY
Mega
Decimal prefix for usage in the international system of units.
Mega stands for 10 ⁶ = 1,000,000 = 1 million, or “M” for
short. In the world of information technology, Mega stands
for 2 ²⁰ = 1,048,576, e.g. megabyte (MByte).
MEMS
Micro-electro-mechanical system. A micro-electro-mechanical
system, or simply a microsystem, is a miniaturized device,
assembly or part that contains components of minute dimen-
sions (only measurable in micrometers) that work together
as a system. Usually a microsystem consists of one or more
sensors, actuators and control electronics on one chip.
Infineon manufactures microphones as MEMS. Due to their
diminutive size, low power consumption, good shielding
from interfering signals and low-cost production, these types
of microphone are being increasingly installed in mobile
devices such as smartphones, tablets, cameras, and acces-
sories such as headsets and hearing aids.
Microcontroller
A microprocessor integrated into a single IC combined with
memory and interfaces, which functions as an embedded
system. Logic circuits of the highest complexity can be
designed in a microcontroller and controlled by software.
Micron (Micrometer)
Metric linear measure, corresponding to the millionth part
of a meter (10 – ⁶). Symbol: μm. As an example, the diameter
of a single human hair is 0.1 millimeters, or 100 μm.
MOSFET
Metal-Oxide-Semiconductor Field-Effect Transistor. MOSFET
is currently the most widely used transistor architecture.
MOSFETs are used both in highly integrated circuits and in
power electronics as special power MOSFETs.
Nanometer
Metric unit of length. Corresponds to the billionth part of
a meter (10 – ⁹)); the symbol is nm. The diameter of deoxy-
ribonucleic acid (DNA) is roughly 2 nanometers. Fabrication
features in the semiconductor industry are now measured
in nanometers (see 65-nanometer technology).
NFC
Near field communication. An international communication
standard for contactless data exchange over short distances.
The initial drafts of the communication standard appeared
several years ago, but the technology did not break through
until 2011 when it was included in the first smartphones.
NFC can be used as an access key to content on terminals
and for services such as cashless payment and paperless
ticketing.
On-state resistance
The term used to describe the minimal resistance of a
field-effect transistor. The correct way to write it is RDS(on).
The R stands for the electrical resistance. The index DS stands
for the connections to the field-effect transistor, which are
known as Drain (D) and Source (S). “On” stands for the state
of the field-effect transistor.
OptiMOS™
Infineon’s brand name for low-voltage power transistors
for voltages between 20 and 300V.
Peta
Decimal prefix for usage in the international system of units.
Peta stands for 10 ¹⁵ = 1 quadrillion, abbreviated “P”, for
example petabyte (PByte).
Plug-in hybrid vehicle
A plug-in hybrid is a vehicle powered by a hybrid system,
which also includes a battery that can be charged using mains
electricity. A plug-in hybrid usually has a larger battery than
a conventional hybrid vehicle and thus constitutes a mixed
solution of the latter and an electrically powered car.
Power semiconductor
Over the last 30 years power semiconductors have mostly
replaced electromechanical solutions in the areas of drive
technology as well as power management and supply,
due to their ability to form high energy flows almost at will.
The advantage of these components is their ability to switch
extremely rapidly (typically within a fraction of a second)
between the “open” and the “closed” state. With the fast
sequences of on/off pulses, almost any form of energy flow
can be created, e.g. a sinus wave.

INFINEON TECHNOLOGIES ANNUAL REPORT 2013
FURTHER INFORMATION290
Power transistor
Power transistor is a term used in electronics to refer to a
transistor for switching or controlling large voltages, currents
and outputs. There is no standard method of differentiating
between transistors for signal processing and power tran-
sistors. Power transistors are mainly produced in packages
that enable installation on heat sinks, as it is otherwise
impossible to handle the dissipation loss of several kilo-
watts that occurs with some types and applications (see
power semiconductor).
Repowering
Repowering in a renewables context generally refers to
the replacement of old wind turbines with newer, more
powerful and more efficient models. This is done in order to
make better use of the available locations and increase
the installed capacity while simultaneously reducing the
number of turbines.
Schottky diode
A special diode that has a metal-semiconductor junction
rather than a semiconductor-semiconductor junction. The
most frequently used semiconductor material up to 250 Volts
is silicon. Silicon carbide (SiC) is used for voltages in excess
of 300 Volts. SiC Schottky diodes offer a number of advan-
tages over conventional diodes in power electronics. When
used together with IGBT transistors, it is possible to dramati-
cally reduce switching losses in the diode itself, as well as
in the transistor. The name derives from the German physicist
Walter Schottky (1886 – 1976) (see silicon carbide).
Semiconductor
Crystalline material. Its electrical conductivity can be
changed as desired by the application of doping materials
(most often boron or phosphorus). Semiconductors include
silicon or germanium. The term is also applied to ICs made
of these materials.
Shrink
A shrink in the context of semiconductor manufacturing is
the process of scaling manufacturing down from an existing
feature size to the next smaller feature size. The move to
smaller structures generally involves shrinking all semicon-
ductor circuit elements equally, although there are some
exceptions. Chip function is unchanged, but since the chips
are smaller, more can be squeezed onto each wafer and
manufacturing costs fall.
Silicon
A chemical element with semiconducting characteristics.
Silicon is the most important raw material in the semi-
conductor industry.
Silicon Carbide
Compound semiconductor made from silicon (chemical sym-
bol Si) and carbon (chemical symbol C). The abbreviation
is SiC. Because of its special material properties (e.g. good
thermal conductivity), SiC is used for Schottky diodes, as
well as elsewhere (see Schottky diode).
SIM cards
Subscriber Identity Module cards. Chip cards that are inserted
into mobile phones in order to identify the user within the
network. They are used by mobile phone networks to provide
connections to their customers.
Smartcard
Plastic card with built-in memory chip and/or microcontroller,
which can be combined with a Personal Identification
Number (PIN).
Smartphone
A smartphone is an Internet-ready mobile telephone that
provides more computer functionality and connectivity
than a modern conventional mobile telephone. Current
smartphones generally allow users to upgrade their device
with new functions by installing additional programs known
as apps.
Smart Power Technology
Apart from the generally improved robustness of power
semiconductor components with regard to high current and
voltage peaks and the reduction of on-state resistance, an
increasing number of functions are being integrated in the
component. These components are then commonly known
as Smart Power Devices and, apart from protective circuitries
(such as thermal and overcurrent protection), they also con-
tain more complex functions such as simple microcontrollers
or analog-digital converters. The special technology needed
to produce Smart Power Devices is known as Smart Power
Technology, such as SPT9 from Infineon.

291INFINEON TECHNOLOGIES ANNUAL REPORT 2013
TECHNOLOGY GLOSSARY
Switching power supply
A switching power supply is an electronic module that
transforms an AC voltage into a DC voltage. Switching power
supplies are more efficient than mains transformers and
can be more compact and lighter than conventional power
supplies containing a heavy transformer with a ferrous core.
Switching power supplies are mainly used in PCs, notebooks
and servers. However, they also achieve a very high level of
efficiency even at low power, so they are increasingly found
in plug-in power supply units, for example as chargers for
mobile phones.
Tablet
A portable computer that can be used in a number of ways
including as a note pad. The tablet is operated by applying
a stylus or, increasingly, finger contact directly onto a touch-
sensitive screen. Recently tablets have come to be used
primarily for Internet access and hence as a terminal for
cloud computing (see cloud computing).
Tera
Decimal prefix for usage in the international system of units.
Tera stands for 10 ¹² = 1 trillion, abbreviated “T”, for example
terabyte (TByte).
Thin wafer
A wafer (see Wafer) is typically around 350 microns (μm; see
Micron) thick when sawn into individual chips. A thin wafer
is one that has been polished down to less than 200 microns
thick (a human hair or a sheet of paper, by comparison, is
about 60 microns thick). Thin wafer technology offers bene-
fits: Thinner chips mean losses can be reduced and the
heat generated can be dissipated more effectively. Another
advantage is that electrically active patterns can be pro-
duced on the backside as well, enabling the chip to provide
completely new functions. Thin wafer chips also allow more
compact packages.
TPM
Trusted Platform Module. A chip that adds elementary
security functions such as license and data protection to
a computer or similar device. TPMs can be integrated into
tablet PCs, smartphones and consumer electronics as well
as PCs and notebooks. A trusted computing platform (see
Trusted Computing) can be created by combining a specially
configured operating system and appropriate software with
a device containing a TPM.
Transistor
A transistor is an electronic component for switching and
amplifying electrical signals. Transistors are used in fields
including telecommunications, computer systems and
power electronics both as discrete components and by the
million in integrated circuits.
Trusted Computing
Trusted Computing means that the hardware and software
used in PCs, as well as other computer-controlled systems,
such as mobile phones, can be controlled. This is achieved
by means of an additional chip, the Trusted Platform Module
(TPM), which can use cryptography to measure the integrity
of the hardware and of the software data structures, while
also saving these values in a verifiable way.
VSD
Variable Speed Drive. Electronic control units for controlling
the speed (revolutions per minute) of electric motors.
Wafer
Thin slice of semiconductor material from which the actual
chip is produced. Typical diameters for wafers currently are
200 millimeters and 300 millimeters.

INFINEON TECHNOLOGIES ANNUAL REPORT 2013
FURTHER INFORMATION292
MEMBERSHIPS AND PARTNERSHIPS
Infineon is engaged in numerous industry associations
and standardization organizations – some examples:
Industry Associations
> World Semiconductor Council (WSC; organization of regional semiconductor associations)
> European Semiconductor Industry Association (ESIA)
> Association representing the Smart Security Industry (EUROSMART)
> China Semiconductor Industry Association (CSIA)
> Semiconductor Industry Association (SIA)
> Federal Association for Information Technology, Telecommunications and New Media (BITKOM)
> German Electrical and Electronic Manufacturers’ Association (ZVEI)
Standardization Organisations
> International Electrotechnical Commission (IEC)
> International Organization for Standardization (ISO)
> International Technology Roadmap for Semiconductors (ITRS)
> JEDEC Solid State Technology Association (JEDEC)
> European Telecommunications Standards Institute (ETSI)
> Automotive Open System Architecture (AUTOSAR)
> German Institute for Standardization (DIN)
> German Commission for Electrical, Electronic & Information Technologies of DIN and VDE (DKE)

293
GRI INDEX
293
GRI Indicator Issue Page
1 STRATEGY AND ANALYSIS
1.1 Statement from the Management Board 6 – 9
1.2 Description of key impacts, risks and opportunities 140 – 150
2 ORGANIZATION PROFILE
2.1 Name of the organization Cover page
2.2 Primary brands, products and/or services Cover: “Infineon at a glance”
2.3 Structure of the organization 112 – 113, 275 – 277
2.4 Headquarters of the organization 112 – 113
2.5 Countries where the organization operates 112 – 113, Explanatory Notes(www.infineon.com/CSR_Reporting)
2.6 Nature of ownership and legal form 106 – 109
2.7 Markets served 40 – 42, 47 – 49, 52 – 55, 59 – 61
2.8 Scale of the organization Cover: “Infineon at a glance”
2.9 Significant changes during the year under report 104 – 105
2.10 Awards received in the year under report 110 – 111
3 REPORT PARAMETERS
3.1 – 3.3 Report’s profile 2 – 3
3.4 Contact point Back cover
3.5 Process for defining the content of the report 2 – 3
3.6 – 3.11 Boundary of the report; limitations on scope Explanatory Notes (www.infineon.com/CSR_Reporting)
3.12 GRI Content Index 293 – 295
3.13 External verification of this report 279, CSR website www.infineon.com/CSR_Reporting
4 GOVERNANCE, COMMITMENTS, AND ENGAGEMENT
4.1 – 4.2 Governance structure 172 – 176
4.3 Independent members of the highest governance body Not relevantInfineon has no unitary board structure
4.4 Mechanisms for shareholders and employees to providerecommendations to the highest governance body 81, 169, 171
4.5 Linkage between compensation for members of the highest governance body and the organization’s performance 177 – 191
4.6 Processes in place to ensure that conflicts of interest are avoided 176
4.7 Qualifications of the members of the highest governance body on sustainability topics 172
4.8 Mission or values, codes of conduct and principles 92 – 93, 168 – 170
4.9 Procedures of the highest governance body for overseeing the sustainability performance 92 – 93, 168 – 191, 147 – 150
4.10 Processes for evaluating the highest governance body’s own performance with respect to sustainability performance 172, 175 – 176
4.11 Consideration of the precautionary approach 22 – 25, 104 – 105
4.12 Externally developed charters, initiatives and principles subscribed to 2 – 3
4.13 Memberships 292
4.14 – 4.17 Engagement of stakeholders 81 – 82
INFINEON TECHNOLOGIES ANNUAL REPORT 2013
GRI INDEX

INFINEON TECHNOLOGIES ANNUAL REPORT 2013
FURTHER INFORMATION294
GRI Indicator Issue Page
ECONOMIC PERFORMANCE INDICATORS
Management Approach 6 – 19
EC1 Direct economic value generated and distributed Cover: “Infineon key data”
EC2 Financial implications due to climate change 149
EC3 Coverage of the benefit plans 248 – 252
EC4 Financial assistance received from government 218
EC8
Infrastructure investments and services provided primarily for public benefit 101
EC9 Significant indirect economic impacts 140 – 150
ENVIRONMENTAL PERFORMANCE INDICATORS
Management Approach 83
EN3 – 4
Direct and indirect energy consumption by primary energy source 86
EN6
Initiatives to provide energy-efficient or renewable energy-based products 37, 40 – 41, 46, 88 – 89
EN8 Total water withdrawal by source 84
EN10 Percentage of water recycled and reused 85
EN16
Total direct and indirect greenhouse gas emissions by weight 87 – 89
EN21 Total water discharge 85
EN22 Total weight of waste by type and disposal method 90
EN26 Initiatives to mitigate environmental impacts of products 91
EN29
Significant environmental impacts of transporting products and other goods and materials, and transporting members of the workforce 88 – 89
LABOR PRACTICES
Management Approach 96
LA1 Total workforce by employment type and region 98, 102
LA2 Employee turnover by age, gender and region 103
LA3 Benefits provided to full-time employees 100 – 101
LA4
Percentage of employees covered by collective bargaining agreements 92
LA7
Injuries, occupational diseases, lost days and work-related accidents 83
LA8 Education and training regarding serious diseases 82
LA13
Composition and breakdown of employees by category according to gender, age group, minority group membership 97 – 99

GRI Indicator Issue Page
HUMAN RIGHTS
Management Approach 92
HR3
Employee training on human rights Infineon carried out 14,578 training hours worldwide in the context of the Business Conduct Guidelines training which includes human rights information. 55% of our employees received such training
SOCIETY
Management Approach 94 – 95
SO1
Operations that are related to communities’ engagement; assessment of impacts as well as development programs 94 – 95
SO3 Percentage of employees trained in anti-corruption 92, 93
SO7 Legal actions for anti-competitive behavior 259 – 260
PRODUCT RESPONSIBILITY
Management Approach 91
PR1
Life-cycle stages in which health and safety impacts of products are assessed for improvement 91
295INFINEON TECHNOLOGIES ANNUAL REPORT 2013
GRI INDEX

296 INFINEON TECHNOLOGIES ANNUAL REPORT 2013
FURTHER INFORMATION
GRI CERTIFICATE

FINANCIAL CALENDAR
Thursday, January 30, 2014 ¹
Publication of first quarter 2014 results
Thursday, February 13, 2014
Annual General Meeting 2014
(Start 10:00 a.m. CET)
ICM – International Congress Center Munich
(Germany)
Tuesday, April 29, 2014 ¹
Publication of second quarter 2014 results
Wednesday, July 30, 2014 ¹
Publication of third quarter 2014 results
Tuesday, November 18, 2014 ¹
Publication of fourth quarter 2014
and fiscal year 2014 results
1 preliminary
Visit us on the web: www.infineon.com
IMPRINT
Published by: Infineon Technologies AG, Neubiberg (Germany)
Editors: Investor Relations, Consolidation and External Reporting
Copy deadline: November 29, 2013
Fiscal year: October 1 to September 30
Independent auditors: KPMG AG Wirtschaftsprüfungsgesellschaft, Berlin (Germany)
Designed by: HGB Hamburger Geschäftsberichte GmbH & Co. KG, Hamburg (Germany)
Photography: Werner Bartsch, Hamburg (Germany), Pages 7, 10 and 11
Rolf Bewersdorf, Frankfurt/Main (Germany), Page 13
BMW AG, Munich (Germany), page 38
Robert Bosch GmbH, Gerlingen-Schillerhöhe (Germany), page 38
Bombardier Transportation, Berlin (Germany), page 44
Bosch Rexroth AG, Lohr/Main (Germany), page 44
Google Germany, Hamburg (Germany), page 56
pmdtechnologies GmbH, Siegen (Germany), page 68
Fotostudio Reller GmbH, Munich (Germany), cover picture, page 62 and 65
Printing: G. Peschke Druckerei GmbH, Munich (Germany)
Note
The following were brand names of Infineon Technologies AG in the 2013 fiscal year: Infineon, the Infineon
logo, AURIX, CIPURSE, CoolMOS, DAVE, EconoDUAL, EconoPACK, HybridPACK, OPTIGA, OptiMOS, PrimePACK,
SOLID FLASH, TRENCHSTOP, TriCore.
Forward-looking statements
This Report contains forward-looking statements about the business, financial condition and earnings
performance of the Infineon Group.
These statements are based on assumptions and projections resting upon currently available information
and present estimates. They are subject to a multitude of uncertainties and risks. Actual business development
may therefore differ materially from what has been expected.
Beyond disclosure requirements stipulated by law, Infineon does not undertake any obligation to update
forward-looking statements.

INFINEON TECHNOLOGIES AG
Headquarters: Am Campeon 1– 12, D-85579 Neubiberg/Munich (Germany), Phone, + 49 89 234 - 0
Contact for Investors and Analysts: [email protected], Phone + 49 89 234 - 26655, Fax + 49 89 234 - 955 2987
Media Contact: [email protected], Phone + 49 89 234 - 28480, Fax + 49 89 234 - 955 4521
Visit us on the web: www.infineon.com