Embed Size (px)
Citation preview

INFECTIOUS DISEASE OUTBREAK SUMMARY
REPORT
2013
Arizona Department of Health Services Office of Infectious Disease Services

2013 Infectious Disease Outbreak Summary Report Arizona Department of Health Services Office of Infectious Disease Services
OVERVIEW Outbreak detection and response are key components of a state’s public health capacity and are essential for prevention and control of illness in a population. To monitor Arizona’s burden of infectious disease outbreaks and progress in detecting and responding to reported outbreaks, the Arizona Department of Health Services (ADHS) collects data on infectious disease outbreak investigations conducted throughout the state. Variables collected include date of outbreak report, number of ill cases, outbreak etiology, infectious disease category, outbreak location/setting, mode of transmission, and number of clinical specimens collected. This data is collected in order to provide a profile of the infectious disease outbreaks that occur in Arizona and of the timeliness and completeness of outbreak response, in order to better implement appropriate outbreak control measures to mitigate the spread of disease and prevent future outbreaks from occurring. In addition, ADHS utilizes a standardized outbreak summary form based on the Centers for Disease Control and Prevention (CDC) performance indicators. These indicators are meant to be used by state and local health agencies to evaluate the performance of their outbreak response and control programs and identify specific needs for improvement. The performance goals for outbreak tracking and response in Arizona are as follows: 1. ≥90% of reported outbreaks will have an investigation initiated within 24 hours of receipt of report. 2. ≥95% of outbreaks will be reported to ADHS by the local health department within 24 hours of receipt of report. 3. Summary reports of 100% of investigations will be submitted to ADHS within 30 days after completion of
investigation. In Arizona, healthcare providers (HCP), healthcare institutions, correctional facilities, and administrators of schools and shelters are required to report outbreaks of infectious diseases to their county health department under Arizona Administrative Code (A.A.C.) R9-6-202 and R9-6-203 and Arizona Revised Statutes (A.R.S.) Title 36. Hotels, motels, and resorts are also required to report contagious or epidemic diseases occurring in their establishments within 24 hours under A.R.S. 36-622. Outbreaks are reportable to ADHS within 24 hours after a county health department receives a report (A.A.C. R9-6-206F). The information provided at the time of report includes location/setting of outbreak, number of cases and suspect cases, the date reported, the disease suspected, and important contact information.
The descriptive epidemiology included in this report for 2013 is based on data from the state outbreak line list used to track and monitor outbreak reports and performance indicators. Outbreak data for 2013 was tracked in a Microsoft Access database and analyzed in Statistical Analysis System (SAS) 9.3. Graphs and figures presented in this report were created in Microsoft Excel.
1

RESULTS Figure 1 shows the total number of outbreaks reported in Arizona from 2009 through 2013. There was a peak in outbreaks reported in 2012, with a slight decrease in 2013. This may be due to increased surveillance and reporting of outbreaks in 2012, statistical variance, or an actual increase in outbreaks during this time period. In 2013, there were 180 infectious disease outbreaks in Arizona, excluding outbreaks involving other states (multi-state outbreaks).
0
50
100
150
200
250
2009 2010 2011 2012 2013
# of
Out
brea
ks
Figure 1: Number of Outbreaks Reported in Arizona 2009-2013
Excludes multi-state investigations
2

In 2013, 247 suspected communicable disease outbreaks were reported and investigated in Arizona (Figure 2). These 247 investigations included 37 multi-state cluster investigations where Arizona participated. This is a higher number of suspected outbreaks than we’ve seen in previous years, likely due to the fact that we began tracking more suspected outbreak investigations in 2013, rather than waiting until a cluster was confirmed as an outbreak (a rate of disease above what we would normally expect to see) before documenting it. In particular, we began tracking multi-state cluster investigations in our outbreak database, which we had not done in previous years. This way, we have a record of all of the investigation work conducted in Arizona for suspected outbreaks. Of the 247 investigations conducted, 55 were “ruled out” as outbreaks, and 193 were confirmed, communicable disease outbreaks (i.e. they were deemed to be true increases in the rates of disease over what we normally expect to see in our population). Outbreaks were reported predominately in Maricopa County (139, 72%), likely due to the larger population size and increased routine processes for outbreak reporting and detection (Figure 2). 180 of these outbreaks were local, Arizona outbreaks, and 13 outbreaks were multi-state outbreaks with at least one case from Arizona. There were no outbreaks reported in 2013 from Gila, Graham, Greenlee, La Paz, Navajo, or Santa Cruz Counties.
0
20
40
60
80
100
120
140
160
180
Num
ber o
f Out
brea
ks
Outbreak Exposure County
Figure 2: Outbreaks Reported in Arizona - 2013
Ruled Out Outbreaks
Confirmed Outbreaks
3

When taking population size into account for Arizona outbreaks, Coconino County had the greatest number of reported outbreaks per 100,000 population in 2013 (3.66/100,000, Figure 3), and Mohave County had the greatest number of outbreak cases reported per 100,000 population in 2013 (396.5/100,000, Figure 3).
0
0.5
1
1.5
2
2.5
3
3.5
4
0
50
100
150
200
250
300
350
400
450
Apache Cochise Coconino Maricopa Mohave Pima Pinal Yavapai Yuma
# O
utbr
eaks
/100
,000
Pop
ulat
ion
# O
utbr
eak
Case
s/10
0,00
0 Po
pula
tion
Outbreak Exposure County
Figure 3: Outbreaks by County Adjusted for Population Size - Arizona 2013
# Outbreak Cases/100,000Population# Outbreaks/100,000 population
Populations based on the US Census Bureau’s population estimates by county for 2013
4

The rest of the summary statistics described in the report exclude “ruled out” outbreaks and all multi-state outbreaks; they include data only for the 180 localized, confirmed Arizona outbreaks. A summary of the 13 multi-state outbreaks with Arizona participation in 2013 is included at the end of this report. More outbreaks were reported during the month of January than in any other month in 2013 (33, 18%) (Figure 4). Overall, a higher number of outbreaks were reported from January through May, and a lower number of outbreaks were reported from June through December. The median and mean number of outbreaks reported each month was 10 and 15, respectively.
0
5
10
15
20
25
30
35
# of
Out
brea
ks
Figure 4: Number of Outbreaks by Report Month - Arizona 2013
Report month calculated using local health department notification date
5

Reported outbreaks were further characterized by outbreak location, mode of transmission, size, and infectious disease category. In 2013, 94 (55%) of the outbreaks contained 10 or fewer cases of illness and 158 (92%) outbreaks contained 50 or fewer cases (Figure 5). Only 2 (1%) outbreaks had more than 100 cases of illness reported. One was a norovirus outbreak with 135 ill cases associated with visiting a ski resort, and one was a prolonged pertussis outbreak with 784 ill cases in a community with high rates of vaccine refusals.
<5 cases 30%
5-10 cases 25%
11-20 cases 18%
21-50 cases 19%
51-100 cases 7%
>100 cases 1%
Figure 5: Percentage of Reported Outbreaks by Outbreak Size - Arizona 2013
n = 171; 9 outbreaks with missing data on cases
6

Gastrointestinal illness (GI) outbreaks were reported most frequently (102, 57%). Other categories of reported outbreaks included: respiratory diseases (28, 16%), vaccine-preventable diseases (VPD) (28, 10%), and lice and mites (18, 10%), with 14 (8%) not fitting into those categories (Figure 6).
GI Illness 57%
Respiratory* 15%
Lice & Mites 10%
VPDs+ 10%
Other^ 8%
Figure 6: Outbreaks by Infectious Disease Category - Arizona 2013
^Other includes conjunctivitis, certain rash illnesses, MRSA, and agents/symptom presentations that do not fit in the other categories. *Respiratory includes upper and lower respiratory illness, influenza, and influenza-like illness unless classified elsewhere. +VPDs are vaccine-preventable diseases (including pertussis and varicella), excluding influenza
7

Smaller sized outbreaks were common for most types of outbreaks, with very few large outbreaks being reported in 2013 (Figure 7). Gastrointestinal illness outbreaks of many different sizes were reported, though most outbreaks had 50 or fewer cases (91, 89%).
0
5
10
15
20
25
30
GI Illness Lice & Mites Other Respiratory VPDs
# of
Out
brea
ks
Infectious Disease Category
Figure 7: Outbreaks by Size and Infectious Disease Category - Arizona 2013
<5
5-10
11-20
21-50
51-100
>100
8

One of the measured outcomes for outbreaks in Arizona is to determine if two or more clinical specimens were collected for laboratory testing to determine the outbreak etiology, particularly for GI illness outbreaks. At least one specimen was collected for 77 (75%) and two or more specimens were collected for 53 (52%) of GI illness outbreaks in 2013 (Figure 8). Etiology could not be determined for any of the outbreaks with zero specimens collected for testing. However, etiology was determined for 16 (64%) of GI outbreaks with one specimen collected and 48 (91%) of GI outbreaks with two or more specimens collected.
All local health departments have a written outbreak protocol that details the process by which they will collect, package and ship specimens in the event of an outbreak. Facilities reporting outbreaks are encouraged to collect and submit two or more specimens to the Arizona State Public Health Laboratory to increase the opportunity for accurate laboratory detection of the agent of infection.
25 (25%)
24 (24%)
53 (52%)
Figure 8: Clinical Specimens Collected for GI Outbreaks - Arizona 2013
Specimens NOT Collected
1 Specimen Collected
≥2 Specimens Collected
9

Outbreak investigators were able to determine a suspected or confirmed outbreak etiology for 157 (87%) of the 180 outbreaks reported in 2013. Norovirus was the confirmed causative agent for 52 (29%) outbreaks and the suspected causative agent for 23 (13%) outbreaks reported in Arizona in 2013. Other common etiologies of outbreaks reported in 2013 were pertussis (13, 7%) and scabies (11, 6%) (Figure 9). A more detailed description of infectious agents identified as causing outbreaks in 2013 is shown in Table 1.
Norovirus 29%
Suspected Norovirus 13%
Pertussis 7%
Scabies 6%
ILI 4% Varicella
4%
Lice 3%
Influenza 3%
Salmonella 3%
Shigella 3%
Unknown 8%
Other 17%
Figure 9: Outbreak Etiologies- Arizona 2013
10

Table 1: Infectious disease agents identified as causing an outbreak in Arizona (N, %), 2013.
Outbreak Agent Frequency (N) Percentage (%) Bed bugs 1 0.6% Cercarial dermatitis (swimmer’s itch) 1 0.6% Conjunctivitis 4 2.2% Croup 1 0.6% Enterohemorrhagic Escherichia coli 2 1.1% Fifth disease 3 1.7% Hepatitis A 1 0.6% Hand, foot, and mouth disease 3 1.7% Influenza 5 2.8% Influenza-like illness (ILI) 7 3.9% Lice 6 3.3% Mycobacterium chelonae 1 0.6% Mycoplasma pneumonia, suspected 1 0.6% Neisseria meningitidis 1 0.6% Norovirus, confirmed 52 31.1% Norovirus, suspected 23 10.6% Pertussis 13 7.2% Pinworm 1 0.6% Respiratory Syncytial Virus (RSV) 4 2.2% Salmonella 5 2.8% Scabies 11 6.1% Shigella 5 2.8% Streptococcus pyogenes 1 0.6% Streptococcus pharyngitis (strep throat) 3 1.7% Streptococcus pneumoniae 1 0.6% Toxin-mediated illness 1 0.6% Trichophyton erinacei 1 0.6% Unknown 2 1.1% Unknown gastrointestinal illness (GI) 13 7.2% Varicella 7 3.9% Total 180 100.0%
11

Person-to-person transmission was the most common mode of transmission identified for Arizona outbreaks in 2013 (146, 81%) (Figure 10). There were also 24 (13%) foodborne outbreaks and 10 (6%) outbreaks of other or unknown transmission reported in 2013.
Foodborne 13% Other/Unknown
6%
Person-to-Person 81%
Figure 10: Outbreaks by Mode of Transmission - Arizona 2013
12

Reported outbreaks were classified into five categories based on location: hospital or assisted living facility, prison or jail, restaurant, school or child care facility, and other. The most common outbreak location was a hospital or assisted living facility (72, 40%) (Figure 11), and within this category, the most common reported location was assisted living facility (53, 74%). Sixty-eight (38%) outbreaks were reported from a school or childcare facility, and within this category, the most common reported locations were elementary school (37, 54%) and daycare facility (15, 22%). Awareness of reporting requirements and the number of facilities in the state may heavily influence these numbers; increased reporting from schools or healthcare facilities is expected as healthcare professionals located on-site may assist in identification of such outbreaks, and outreach regarding reporting requirements is conducted by public health agencies, whereas reporting of restaurant outbreaks relies on individual illness complaints and outreach to the public may be less effective. Reported outbreaks in prisons or jails may be lower because there are fewer facilities in the state, they have fewer infectious disease outbreaks, and/or facilities are less aware of reporting requirements.
53
20
2
18
37
9
15
8
9
2 7
0
10
20
30
40
50
60
70
80
Hospital or AssistedLiving Facility
Other Prison/Jail Restaurant School or ChildcareFacility
# of
Out
brea
ks
Outbreak Location
Figure 11: Outbreaks by Outbreak Location - Arizona 2013
Assisted Living
Hospital
Long-Term Care Adult Daycare
Elementary School
Daycare
Middle School - College
Pre-school
13

Norovirus outbreaks (including confirmed and suspected norovirus outbreaks) were also classified by outbreak location (Figure 12). Most norovirus outbreaks in 2013 occurred in hospitals/assisted living facilities (50, 67%). Of these, most outbreaks occur in assisted living facilities (38, 76%).
38
7 1
11 3
6
2
5
1
1
0
5
10
15
20
25
30
35
40
45
50
Hospital or AssistedLiving Facility
Other Prison/Jail Restaurant School or ChildcareFacility
# of
Out
brea
ks
Outbreak Location
Figure 12: Norovirus Outbreaks by Outbreak Location - Arizona 2013
Assisted Living
Hospital
Long-Term Care
Adult Daycare
Daycare Elementary School Pre-school
Includes confirmed & suspected norovirus outbreaks (n = 75)
14

Figure 13 shows GI outbreaks reported in Arizona from 2009-2013. Approximately half of GI outbreaks from 2009-2013 were attributed to norovirus as a confirmed etiology. Many of the “other GI” outbreaks are outbreaks of an unknown GI etiology, most often due to a lack of availability of clinical specimens. Outbreaks where no clinical specimens are collected and submitted for testing leads to an incomplete understanding of the burden of infectious disease outbreaks in Arizona. Continued outreach and education to facilities commonly experiencing GI illness outbreaks on the importance of collecting specimens will allow us to better understand the types of etiologies causing outbreaks in Arizona and enable public health agencies to implement appropriate and effective control measures to minimize and prevent outbreaks in the future.
33 51 47
69 56
19 45
55 45
61
27
0
20
40
60
80
100
120
140
2009 2010 2011 2012 2013
# of
Out
brea
ks
Figure 13: Number of GI Outbreaks by Year - Arizona 2009-2013
Other GI Illness Outbreaks*
Suspected Norovirus Outbreaks
Norovirus Outbreaks
*Includes unknown GI outbreaks Suspected norovirus outbreaks from 2009-2012 were classified as other GI
15
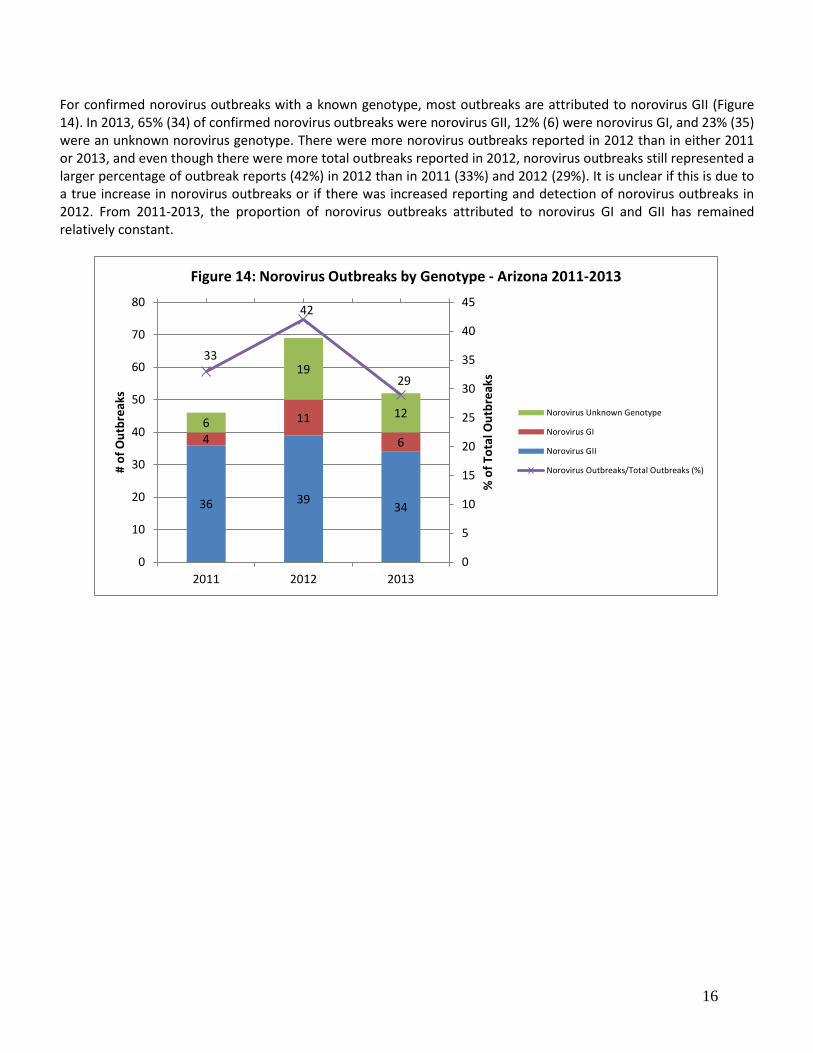
For confirmed norovirus outbreaks with a known genotype, most outbreaks are attributed to norovirus GII (Figure 14). In 2013, 65% (34) of confirmed norovirus outbreaks were norovirus GII, 12% (6) were norovirus GI, and 23% (35) were an unknown norovirus genotype. There were more norovirus outbreaks reported in 2012 than in either 2011 or 2013, and even though there were more total outbreaks reported in 2012, norovirus outbreaks still represented a larger percentage of outbreak reports (42%) in 2012 than in 2011 (33%) and 2012 (29%). It is unclear if this is due to a true increase in norovirus outbreaks or if there was increased reporting and detection of norovirus outbreaks in 2012. From 2011-2013, the proportion of norovirus outbreaks attributed to norovirus GI and GII has remained relatively constant.
36 39 34
4
11
6 6
19
12
33
42
29
0
5
10
15
20
25
30
35
40
45
0
10
20
30
40
50
60
70
80
2011 2012 2013
% o
f Tot
al O
utbr
eaks
# of
Out
brea
ks
Figure 14: Norovirus Outbreaks by Genotype - Arizona 2011-2013
Norovirus Unknown Genotype
Norovirus GI
Norovirus GII
Norovirus Outbreaks/Total Outbreaks (%)
16

Outbreak locations were further characterized by infectious disease category. Most of the outbreaks reported from healthcare facilities were due to gastrointestinal illnesses (76%), and all of the outbreaks reported from restaurants were due to gastrointestinal illnesses (Figure 15). Schools and child care facilities reported a mix of outbreak types.
0
10
20
30
40
50
60
Hospital orAssisted Living
Facility
Other Prison/Jail Restaurant School orChildcare Facility
# of
Out
brea
ks
Outbreak Location
Figure 15: Outbreaks by Infectious Disease Category & Location - Arizona 2013
GI Illness
Lice & Mites
Other
Respiratory
VPDs
17

Healthcare facilities experienced GI illness, lice & mites, and respiratory illness outbreaks in 2013. Healthcare facilities were further classified as adult daycares, assisted living facilities, hospitals, or long term care facilities (LTCF). GI illness outbreaks were most common among all types of facilities, but assisted living facilities reported the highest number of GI illness outbreaks (Figure 16).
0
5
10
15
20
25
30
35
40
45
Adult Daycare Assisted LivingFacility
Hospital LTCF
# of
Out
brea
ks
Type of Healthcare Facility
Figure 16: Healthcare Facility Outbreaks by Infectious Disease Category - Arizona 2013
GI Illness
Lice & Mites
Respiratory
18

Different outbreak disease profiles were seen in the different types of schools reporting outbreaks. Overall, more outbreaks were reported from facilities with younger age groups, such as daycares, preschools, and elementary schools (59, 87%) (Figure 17). Childcare facilities and pre-schools experienced mostly GI illness outbreaks, while elementary schools experienced a mixture of all types of outbreaks, with the highest number reported being due to vaccine-preventable disease (VPD) outbreaks. Fewer outbreaks were reported from schools with older aged students.
0
2
4
6
8
10
12
Daycare Preschool ElementarySchool
MiddleSchool
High School K-8 K-12 College
# of
Out
brea
ks
Type of School
Figure 17: Daycare/School Outbreaks by Infectious Disease Category - Arizona 2013
GI Illness
Lice & Mites
Other
Respiratory
VPDs
19

An analysis of infectious disease categories by month was conducted to look at trends of outbreak etiology types over seasons (Figure 18). As mentioned earlier, most outbreaks in 2013 were reported in January (33, 18%). Gastrointestinal illness outbreaks were most frequent from January through May (71, 70% of the GI outbreaks for 2013), but GI illness was the most common type of outbreak reported for all months in 2013. Respiratory outbreaks peaked in January (14, 50% of the respiratory outbreaks for 2013). Other types of outbreaks were reported at a relatively similar rate throughout the year.
0
2
4
6
8
10
12
14
16
18
20
# of
oO
utbr
eaks
Figure 18: Outbreaks by Month & Infectious DIsease Category - Arizona 2013
GI Illness
Lice & Mites
Other
Respiratory
VPDs
20

MULTI-STATE CLUSTERS INVESTIGATIONS: In 2013, Arizona participated in 37 multi-state cluster investigations; 13 of these investigations were confirmed as outbreaks. These multi-state investigations and outbreaks are not included in the above analyses. One outbreak was due to Escherichia coli O157:H7, one was due to hepatitis A, and the remaining 11 outbreaks were due to various Salmonella serotypes. The 24 ruled out multi-state clusters were all suspected Salmonella clusters. Most outbreaks did not uncover a highly suspected common exposure, but for those that did, outbreaks included:
• Hepatitis A genotype 1B outbreak linked to consumption of a frozen mixed berry blend • Salmonella Saintpaul outbreak linked to consumption of cucumbers • Salmonella I 4,[5],12:i:- outbreak associated with food consumed at a tapas restaurant • Salmonella Sandiego, Pomona, and Poona outbreaks linked to contact with small turtles • Salmonella Typhimurium outbreak linked to contact with live baby poultry • E. coli O157:H7 linked to consumption of ready-to-eat salads
46% of multi-state outbreaks in 2013 were due to foodborne transmission of disease, 38% were due to transmission from animal contact, and 15% were due to an unknown mode of transmission (Figure 19).
Most of these multi-state outbreaks included only small numbers of cases from Arizona, and none of these investigations were led by Arizona. However, Arizona supported other states and CDC in all multi-state cluster investigations where Arizona had at least one case involved. HEALTHCARE ASSOCIATED INFECTION (HAI) INVESTIGATIONS In 2013, Arizona participated in five HAI investigations involving potential exposures to various blood-borne pathogens, methicillin-resistant Staphylococcus aureus (MRSA), and an unknown contaminant. Exposures occurred at various healthcare facilities, including a dental office and a mobile dental provider. None of these investigations were confirmed as communicable disease outbreaks, so they are not included in the above analysis.
5 (38%)
6 (46%)
2 (15%)
Figure 19: Mode of Transmission for Multi-State Outbreaks - Arizona 2013
Animal contact
Foodborne
Unknown
21

OUTBREAK PERFORMANCE INDICATORS Outbreaks were reported by the county health departments to ADHS within 24 hours for 162 (90%) outbreaks. This did not meet our state performance goal of ≥95% of outbreaks reported to ADHS within 24 hours. Investigations were begun within 24 hours of receipt of report for 170 outbreaks (94%), which is above the performance indicator goal of ≥90%. Excluding outbreaks of lice and mites, strep throat, group A streptococcal Infections, influenza or ILI, conjunctivitis or hand foot and mouth disease, there were 133 outbreaks for which an outbreak summary form should have been submitted to ADHS. For 122 (92%) of these outbreaks of selected disease agents, county health departments submitted an outbreak report to ADHS within 30 days of investigation closure. This is also below our target of 100% and is one area for improvement. CONCLUSION During outbreak investigations, local and state health departments work with the reporting facility to identify the causative agent as well as make recommendations for control and prevention of future cases. In 2013, 247 suspect infectious disease outbreaks were reported and investigated by Arizona public health agencies. Of these, 193 were confirmed communicable disease outbreaks, including 13 multi-state outbreaks where Arizona had at least one case. Reported outbreaks were more likely to occur in Maricopa County (72%), in the month of January (18%), in a hospital or assisted living facility (40%), involve symptoms consistent with gastrointestinal illness (57%), be spread person-to-person (81%) and involve 50 or fewer people (92%). Norovirus was the most common (42%) suspected or confirmed causative agent identified in outbreaks in 2013. For 2013, 90% of outbreaks were reported to ADHS within 24 hours, which was below our target of ≥95%, and 92% of outbreak reports were submitted to ADHS within 30 days of investigation closure, which is also below our target of 100%. However, both of these performance measures have improved since 2012, when 88% of outbreaks were reported to ADHS within 24 hours and only 34% of outbreaks reports were submitted within 30 days. In addition, 94% of all outbreaks were investigated within 24 hours of receipt of report at the local health department, which is above our target of 90%. Continued outreach and education to county health departments will hopefully improve these performance indicators even more for 2014.
22