Embed Size (px)
Citation preview

IndustryARC http://www.marketresearch.com/IndustryARC‐v4001/
Publisher Sample
Phone: 800.298.5699 (US) or +1.240.747.3093 or +1.240.747.3093 (Int'l) Hours: Monday - Thursday: 5:30am - 6:30pm EST
Fridays: 5:30am - 5:30pm EST
Email: [email protected] MarketResearch.com
IndustryARC
Global Printed Circuit Board Market & Recyclable PCB
Market Analysis and Forecast (2011 – 2018)
By Segment (Recycling, Remanufacturing & Reconditioning); Components (Capacitors, Diodes, IC’s, Resistors & Others); Materials, Applications & Geography
IndustryARC | 1
TABLE OF CONTENTS
1. List of Tables
2. List of Figures
3. Global Printed Circuit Board – Market Overview
3.1. PCB Types
3.2. Waste Hierarchy
3.3. Evolution of PCBs Over the Years
4. Executive Summary
5. Global Printed Circuit Board – Market Landscape
5.1. Market Share Analysis
5.2. Comparative Analysis
5.2.1. Product Benchmarking
5.2.2. Top Companies Financials Analysis
6. Global Printed Circuit Board – Market Forces
6.1. Market Drivers
6.1.1. Consumer Electronics Demand to Continue with Increasing Sales in Emerging Nations
6.1.2. Penetration of Telecommunications Products across Verticals like Automotive and Medical
6.1.2.1. Medical/ Healthcare Sector
6.1.2.2. Automotive Sector
6.1.3. The Promise of Internet of Things and Connected World Push for PCB Market Growth
6.1.4. Government Laws And E-Waste Collection Goals will help in Growth of Recycled PCB Market
6.1.5. Demand for Precious Metals and Rare Earth Metals
IndustryARC | 2
6.2. Market Constraints
6.2.1. Efficiency inn Collection of E-Waste Process is Low Globally
6.2.2. Steady Decline in PCB Manufacturers in North America And Europe
6.3. Market Challenges
6.3.1. Issues with Data Destruction in Hard Drives, Memory Cards Preventing Companies from Actively Joining E-Waste Recycling
6.3.2. Higher Manufacturing Standards Needed to Avoid Product Recalls
6.4. Attractiveness of the PCB Industry
6.4.1. Power of Suppliers
6.4.2. Power of Customers
6.4.3. Threat of New entrants
6.4.4. Threat of Substitution
6.4.5. Degree of Competition
7. Global Printed Circuit Board Market – Strategic Analysis
7.1. Value Chain Analysis
7.2. Legislation and Policy Analysis
7.2.1. Africa
7.2.1.1. South Africa
7.2.1.2. Kenya
7.2.2. South America
7.2.2.1. Brazil
7.2.3. North America
7.2.3.1. Canada
7.2.3.2. USA
7.2.4. Asia Pacific
7.2.4.1. China
IndustryARC | 3
7.2.4.2. India
7.2.4.3. Indonesia
7.2.4.4. Taiwan
7.2.4.5. Japan
7.2.5. EUROPE
7.2.5.1. European Union
7.2.5.2. UK
7.2.5.3. Germany
7.2.5.4. France
7.3. Pricing Analysis
7.4. Product/Market Life Cycle Analysis
8. Global Printed Circuit Board Market – Analysis and Forecast (2013 – 2018)
8.1. Market Overview
8.2. Market Analysis by PCB Board Type
8.3. Market Analysis by PCB Board Components
8.4. Market Analysis by PCB Board Materials Used
9. Global PCB Remanufacturing Market – Analysis and Forecast
9.1. Market Overview
9.1.1. Market Analysis by Value
9.1.2. Market Analysis by Volume
9.2. Market Analysis by Geography
10. Global PCB Recycling & Reconditioning Market – Analysis and Forecast
10.1. PCB Recycling Market
10.1.1. Market Analysis by Value
10.1.2. Market Analysis by Volume
IndustryARC | 4
10.1.3. Market Analysis by Geographic Region
10.2. PCB Reconditioning Market
10.2.1. Market Analysis by Value
10.2.2. Market Analysis by Volume
10.2.3. Market Analysis by Geography
11. Global PCB End Use Market Analysis and Forecast
11.1. Healthcare and Pharmaceutical
11.2. Automotive
11.3. Industrial Electronics
11.4. Aerospace and Defense
11.5. Consumer Electronics
11.6. Maritime Transport
11.7. Market Analysis by Geography
12. Global PCB Production/Demand Analysis and Forecast – by Geographical Regions
12.1. Americas
12.2. Europe
12.3. Asia Pacific
12.4. Middle East
12.5. ROW
13. Market Entropy
13.1. M&As, Collaborations, JVs and Partnerships
IndustryARC | 5

14. Company Profiles (Overview, Financials, SWOT Analysis- Top 5 companies, Developments, Product Portfolio)
14.1. Amitron CORP.
14.2. CMK Corporation
14.3. Daeduck Group
14.4. Gold Circuit
14.5. Hannstar Board
14.6. Ibiden
14.7. Nippon Mektron
14.8. KB PCB Group
14.9. Kinsus
14.10. Kingboard PCB Group
14.11. Meiko Electronics
14.12. Mflex
14.13. Multek
14.14. Nanya PCB
14.15. Samsung EM
14.16. SEMCO
14.17. Shinko Denki Ind
14.18. Sumitomo Denko PC
14.19. Tripod
14.20. TTM Technologies
14.21. Unimicron
14.22. Viasystems Group Inc
14.23. Young Poong Group
14.24. Zhen Ding
IndustryARC | 6

15. Appendix
15.1. Abbreviations
15.2. Sources
15.3. Research Methodology
15.4. Expert Insights
16. Disclaimer
IndustryARC | 7
LIST OF TABLES
TABLE 1 KEY COMPANY PRODUCTS, PCB MARKET
TABLE 2 UNIMICRON TECHNOLOGY CORP FINANCIALS, 2010 – 2012
TABLE 3 NIPPON MEKTRON LTD FINANCIALS, 2010 – 2012
TABLE 4 TRIPOD TECHNOLOGY CORP FINANCIALS, 2010 – 2012
TABLE 5 IBIDEN CO LTD FINANCIALS, 2010 – 2012
TABLE 6 ZHENG DING TECHNOLOGY HOLDING LTD FINANCIALS, 2010 –2012
TABLE 7 HANNSTAR BOARD CORP FINANCIALS, 2010 – 2012
TABLE 8 NUMBER OF PCB MAKERS IN NORTH AMERICA, 2004 – 2012
TABLE 9 NUMBER OF PCB MAKERS IN EUROPE, 2004 – 2012
TABLE 10 AVERAGE SELLING PRICE OF MASS PRODUCED PCB IN CHINA
TABLE 11 KEY PCB COMPONENTS MARKET PRICES, $/KG, 2013
TABLE 12 TYPICAL MARKET PRICES FOR DIFFERENT TYPES OF E-WASTE AND PCB BOARDS, 2013 ($/LB)
TABLE 13 ESTIMATED WEIGHT AND LIFESPAN OF EEE, 2013
TABLE 14 GLOBAL PCB MARKET, BY VALUE ($M) AND VOLUME (MILLION UNITS), 2012 - 2018
TABLE 15 GLOBAL PCB MARKET, BY WEIGHT, 2012 - 2018 (MILLION MT)
TABLE 16 GLOBAL PCB MARKET, BY PCB BOARD TYPE, 2012 - 2018 ($MILLION)
TABLE 17 GLOBAL PCB MARKET, BY COMPONENTS, 2012 - 2018 (KILO MT)
TABLE 18 GLOBAL PCB MARKET, BY MATERIALS USED, 2012 - 2018 (KILO MT)
TABLE 19 GLOBAL PCB MARKET, BY MATERIALS USED, 2012 - 2018 ($MILLION)
TABLE 20 GLOBAL PCB MARKET, COMPOSITION ANALYSIS BY WEIGHT (%)
TABLE 21 GLOBAL PCB MARKET, COMPONENTS MARKET RATES ($/KG)
TABLE 22 GLOBAL PCB WASTE PRODUCED, 2011 - 2018 (MILLION MT)
TABLE 23 GLOBAL PCB WASTE RECLAIMED, BY VOLUME (MILLION MT) AND VALUE ($MILLION), 2011 - 2018
TABLE 24 GLOBAL PCB REMANUFACTURING MARKET, BY VALUE ($MILLION), 2011 – 2018
TABLE 25 GLOBAL PCB REMANUFACTURING MARKET, BY VOLUME (MILLION MT), 2011 – 2018
TABLE 26 GLOBAL PCB REMANUFACTURING MARKET, BY GEOGRAPHY, 2011 - 2018 ($MILLION)
TABLE 27 GLOBAL PCB REMANUFACTURING MARKET, BY GEOGRAPHY, 2011 - 2018 (KILO TONS)
TABLE 28 GLOBAL PCB RECYCLING MARKET, BY VALUE ($MILLION), 2011 – 2018
IndustryARC | 8
TABLE 29 GLOBAL PCB RECYCLING MARKET, BY VOLUME (MILLION MT), 2011 – 2018
TABLE 30 GLOBAL PCB RECYCLING PROCESS ANALYSIS – KEY COUNTRIES
TABLE 31 GLOBAL PCB RECYCLING MARKET, BY GEOGRAPHY, 2011 - 2018 (KILO TONS)
TABLE 32 GLOBAL PCB RECYCLING MARKET, BY GEOGRAPHY, 2011 - 2018 ($MILLIONS)
TABLE 33 GLOBAL PCB RECONDITIONING MARKET, BY VALUE ($MILLION), 2011 – 2018
TABLE 34 GLOBAL PCB RECONDITIONING MARKET, BY VOLUME (KILO TONS), 2011 – 2018
TABLE 35 GLOBAL PCB RECONDITIONING MARKET, BY GEOGRAPHY, 2011 – 2018 (KILO TONS)
TABLE 36 GLOBAL PCB RECONDITIONING MARKET, BY GEOGRAPHY, 2011 – 2018 ($MILLION)
TABLE 37 GLOBAL PCB MARKET, END USE APPLICATIONS, 2012 – 2018 ($MILLION)
TABLE 38 GLOBAL PCB MARKET, HEALTHCARE APPLICATIONS, 2012 – 2018 ($MILLION)
TABLE 39 GLOBAL PCB MARKET, HEALTHCARE APPLICATIONS, 2012 – 2018 (MILLION UNITS)
TABLE 40 GLOBAL PCB MARKET, HEALTHCARE APPLICATIONS, 2012 – 2018 (KILO TONS)
TABLE 41 GLOBAL PCB MARKET, AUTOMOTIVE APPLICATION, 2012 – 2018 ($MILLION)
TABLE 42 GLOBAL PCB MARKET, AUTOMOTIVE APPLICATION, 2012 – 2018 (MILLION UNITS)
TABLE 43 GLOBAL PCB MARKET, AUTOMOTIVE APPLICATION, 2012 – 2018 (KILO TONS)
TABLE 44 GLOBAL PCB MARKET, INDUSTRIAL ELECTRONICS APPLICATION, 2012 – 2018 ($MILLION)
TABLE 45 GLOBAL PCB MARKET, INDUSTRIAL ELECTRONICS APPLICATION, 2012 – 2018 (MILLION UNITS)
TABLE 46 GLOBAL PCB MARKET, INDUSTRIAL ELECTRONICS APPLICATION, 2012 – 2018 (KILO TONS)
TABLE 47 GLOBAL PCB MARKET, AEROSPACE AND DEFENSE APPLICATIONS, 2012 – 2018 ($MILLION)
TABLE 48 GLOBAL PCB MARKET, AEROSPACE AND DEFENSE APPLICATIONS, 2012 – 2018 (MILLION UNITS)
TABLE 49 GLOBAL PCB MARKET, AEROSPACE AND DEFENSE APPLICATIONS, 2012 – 2018 (KILO TONS)
IndustryARC | 9
TABLE 50 GLOBAL PCB MARKET, CONSUMER ELECTRONICS APPLICATION, 2012 – 2018 ($MILLION)
TABLE 51 GLOBAL PCB MARKET, CONSUMER ELECTRONICS APPLICATION, 2012 – 2018 (MILLION UNITS)
TABLE 52 GLOBAL PCB MARKET, CONSUMER ELECTRONICS APPLICATION, 2012 – 2018 (KILO TONS)
TABLE 53 GLOBAL PCB MARKET, MARITIME TRANSPORT APPLICATION, 2012 – 2018 ($MILLION)
TABLE 54 GLOBAL PCB MARKET, MARITIME TRANSPORT APPLICATION, 2012 – 2018 (MILLION UNITS)
TABLE 55 GLOBAL PCB MARKET, MARITIME TRANSPORT APPLICATION, 2012 – 2018 (KILO TONS)
TABLE 56 INDUSTRIAL ELECTRONICS PCB DEMAND, BY GEOGRAPHIC REGION, 2012 – 2018 ($MILLION)
TABLE 57 AEROSPACE AND DEFENSE PCB DEMAND, BY GEOGRAPHIC REGION, 2012 – 2018 ($MILLION)
TABLE 58 CONSUMER ELECTRONICS PCB DEMAND, BY GEOGRAPHIC REGION, 2012 – 2018 ($MILLION)
TABLE 59 MARITIME TRANSPORT PCB DEMAND, BY GEOGRAPHIC REGION, 2012 – 2018 ($MILLION)
TABLE 60 HEALTHCARE PCB DEMAND, BY GEOGRAPHIC REGION, 2012 – 2018 ($MILLION)
TABLE 61 AUTOMOTIVE ELECTRONICS PCB DEMAND, BY GEOGRAPHIC REGION, 2012 – 2018 ($MILLION)
TABLE 62 GLOBAL PCB MARKET, BY GEOGRAPHIC REGION, 2012 – 2018 ($MILLION)
TABLE 63 AMERICAS PCB MARKET, BY COUNTRY, 2012 - 2018 ($MILLION)
TABLE 64 EUROPE PCB MARKET, BY KEY COUNTRIES, 2012 - 2018 ($MILLION)
TABLE 65 ASIA PACIFIC PCB MARKET, BY COUNTRY, 2012 - 2018 ($MILLION)
IndustryARC | 10
LIST OF FIGURES
FIGURE 1 EVOLUTION OF PCBS (1900-2013)
FIGURE 2 GLOBAL OWNERSHIP IN CONSUMER ELECTRONICS-BY PRODUCTS, 2013
FIGURE 3 PCB WASTE DISPOSAL-BY METHODS, 2013
FIGURE 4 PCB RECYCLING MARKET, VALUE CHAIN ANALYSIS
FIGURE 5 METALS EXTRACTION PROCESS FROM PCB THROUGH SMELTING
FIGURE 6 GLOBAL PCB MARKET BY END USE INDUSTRIES, MARKET SHARE, 2012 (%)
FIGURE 7 GLOBAL PCB MARKET SHARE BY GEOGRAPHIC REGION, 2013 (%)
IndustryARC | 11
DEFINITIONS & ASSUMPTIONS
1. Remanufacturing: The process of producing a like-new or better performing PCB from an end-of-life PCB while preserving its form.
2. Recycling: The process of reducing the PCBs to its component materials that are then used to produce various new forms.
3. Reconditioning/Repair: The process of servicing defunct PCBs, involving the replacement or repair of faulty parts. This is an unorganized sector with the manufacturers as well as a host of other third-party players offering these services.
4. We assume that the recycling process might result in a host of new products that could include PCBs. The remanufacturing and reconditioning processes, on the other hand, yield only fully-functioning PCBs.
IndustryARC | 12
3. GLOBAL PRINTED CIRCUIT BOARD – MARKET OVERVIEW
3.1 PCB TYPES
Printed circuit boards are virtually present in almost all the electronics devices we use currently on a daily basis. They are present in TVs, computers, smartphones, mobile phones, washing machines, coffee makers, ovens and refrigerators etc. They are generally made of metal circuits, chips, ICs, components, cables and sockets on plastic laminates. There are many types of PCBs and the following are the most common types used: FR-2 Phenolic This type of PCB is manufactured using a synthetic resin bonded paper. It is a composite material made by combining paper with plasticized phenol formaldehyde resin. It is primarily used in manufacturing low-end consumer electronic devices.
FR-4 Epoxy
These circuit boards are made from woven fiberglass cloth combined with an epoxy resin binder. The material as such is flame retarding, has zero water absorption and high mechanical strength. The FR-4 boards need to meet high flammability requirements like the UL 94 V-1 and are characterized by their electrical insulating quality, in dry or humid conditions. Brominated epoxies dominate the majority of the FR-4 boards manufactured.
FR-4 High and ultra-high performance
These boards are made of polytetrafluoroethylene (PTFE) with different resins used which include bromine or phosphorus based flame retardants. FR-4 high performance boards are used in high end applications like servers, military and aerospace applications primarily. These environments need boards with high electrical properties like dielectric permittivity (Dk), loss tangent (DF) etc. for reliability purposes.
3.2 WASTE HIERARCHY
The global waste management practices generally speak about the 3R Principle – Reduce, Reuse, and Recycle. Each of these terms has a meaning and explains the effect it has on waste management.
IndustryARC | 13
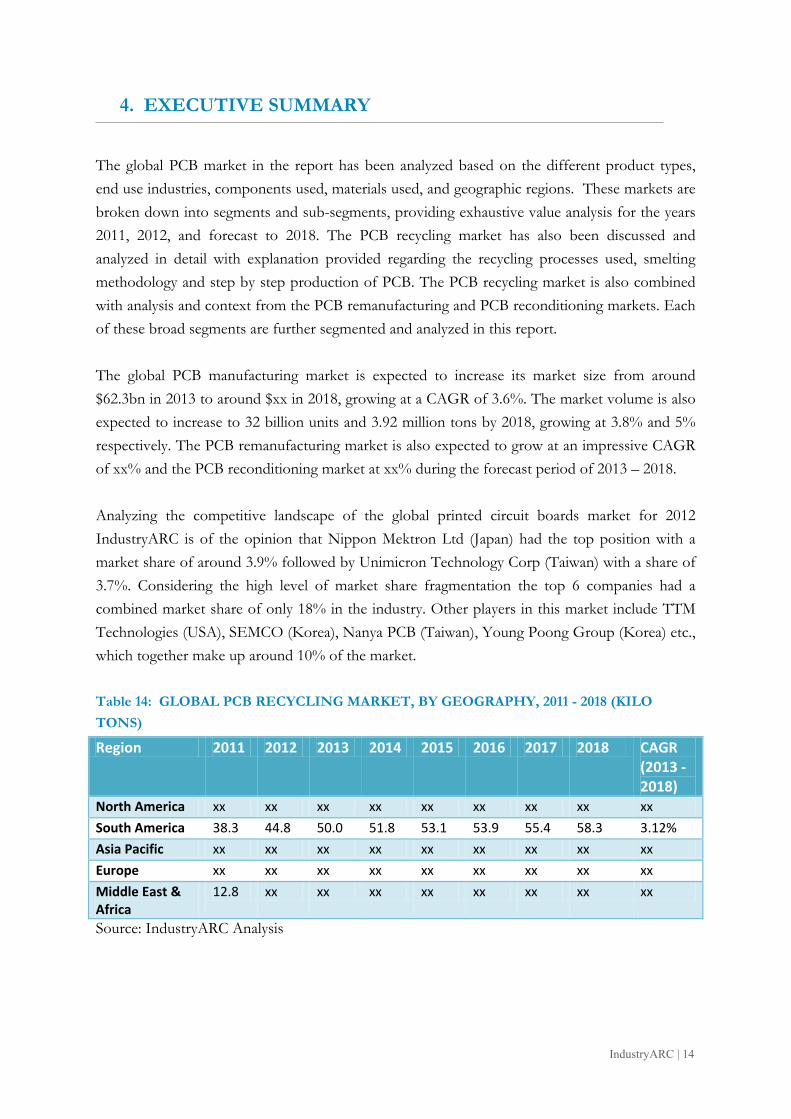
4. EXECUTIVE SUMMARY
The global PCB market in the report has been analyzed based on the different product types, end use industries, components used, materials used, and geographic regions. These markets are broken down into segments and sub-segments, providing exhaustive value analysis for the years 2011, 2012, and forecast to 2018. The PCB recycling market has also been discussed and analyzed in detail with explanation provided regarding the recycling processes used, smelting methodology and step by step production of PCB. The PCB recycling market is also combined with analysis and context from the PCB remanufacturing and PCB reconditioning markets. Each of these broad segments are further segmented and analyzed in this report. The global PCB manufacturing market is expected to increase its market size from around $62.3bn in 2013 to around $xx in 2018, growing at a CAGR of 3.6%. The market volume is also expected to increase to 32 billion units and 3.92 million tons by 2018, growing at 3.8% and 5% respectively. The PCB remanufacturing market is also expected to grow at an impressive CAGR of xx% and the PCB reconditioning market at xx% during the forecast period of 2013 – 2018. Analyzing the competitive landscape of the global printed circuit boards market for 2012 IndustryARC is of the opinion that Nippon Mektron Ltd (Japan) had the top position with a market share of around 3.9% followed by Unimicron Technology Corp (Taiwan) with a share of 3.7%. Considering the high level of market share fragmentation the top 6 companies had a combined market share of only 18% in the industry. Other players in this market include TTM Technologies (USA), SEMCO (Korea), Nanya PCB (Taiwan), Young Poong Group (Korea) etc., which together make up around 10% of the market. Table 14: GLOBAL PCB RECYCLING MARKET, BY GEOGRAPHY, 2011 - 2018 (KILO TONS)
Region 2011 2012 2013 2014 2015 2016 2017 2018 CAGR (2013 - 2018)
North America xx xx xx xx xx xx xx xx xx South America 38.3 44.8 50.0 51.8 53.1 53.9 55.4 58.3 3.12% Asia Pacific xx xx xx xx xx xx xx xx xx Europe xx xx xx xx xx xx xx xx xx Middle East & Africa
12.8 xx xx xx xx xx xx xx xx
Source: IndustryARC Analysis
IndustryARC | 14
5. GLOBAL PRINTED CIRCUIT BOARD – MARKET LANDSCAPE
5.1 MARKET SHARE ANALYSIS
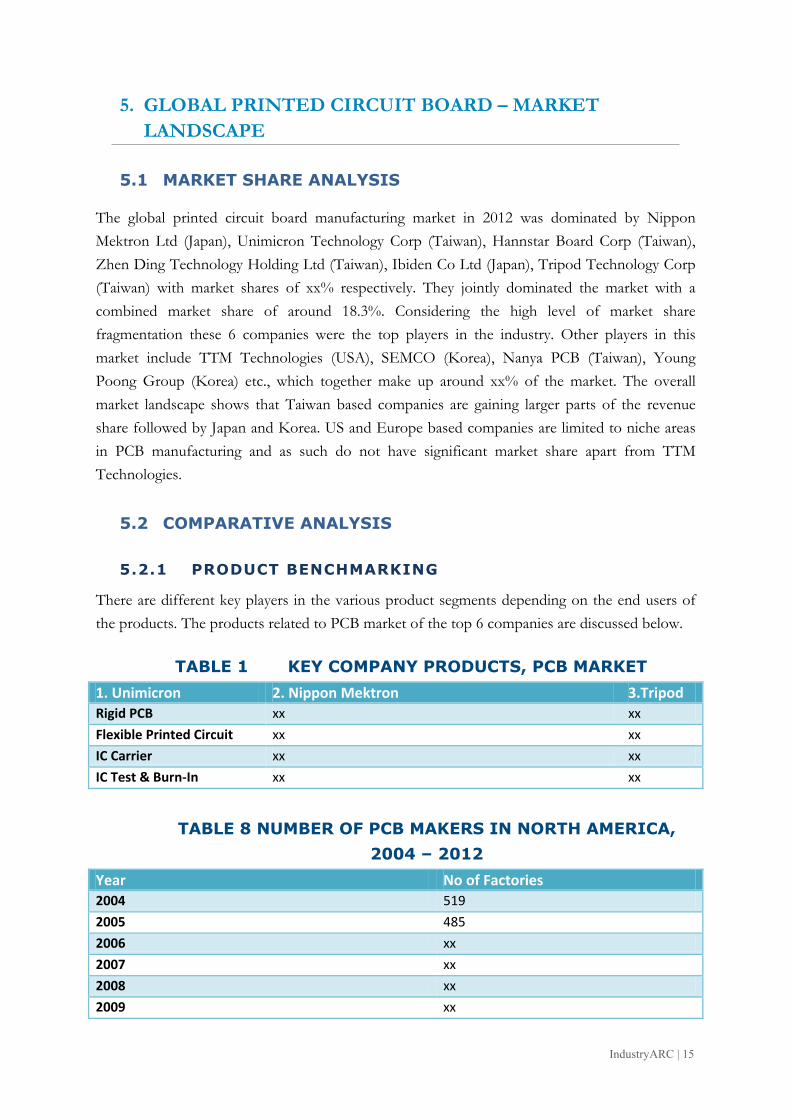
The global printed circuit board manufacturing market in 2012 was dominated by Nippon Mektron Ltd (Japan), Unimicron Technology Corp (Taiwan), Hannstar Board Corp (Taiwan), Zhen Ding Technology Holding Ltd (Taiwan), Ibiden Co Ltd (Japan), Tripod Technology Corp (Taiwan) with market shares of xx% respectively. They jointly dominated the market with a combined market share of around 18.3%. Considering the high level of market share fragmentation these 6 companies were the top players in the industry. Other players in this market include TTM Technologies (USA), SEMCO (Korea), Nanya PCB (Taiwan), Young Poong Group (Korea) etc., which together make up around xx% of the market. The overall market landscape shows that Taiwan based companies are gaining larger parts of the revenue share followed by Japan and Korea. US and Europe based companies are limited to niche areas in PCB manufacturing and as such do not have significant market share apart from TTM Technologies.
5.2 COMPARATIVE ANALYSIS
5.2.1 PRODUCT BENCHMARKING
There are different key players in the various product segments depending on the end users of the products. The products related to PCB market of the top 6 companies are discussed below.
TABLE 1 KEY COMPANY PRODUCTS, PCB MARKET 1. Unimicron 2. Nippon Mektron 3.Tripod Rigid PCB xx xx Flexible Printed Circuit xx xx IC Carrier xx xx IC Test & Burn-In xx xx
TABLE 8 NUMBER OF PCB MAKERS IN NORTH AMERICA,
2004 – 2012 Year No of Factories 2004 519 2005 485 2006 xx 2007 xx 2008 xx 2009 xx
IndustryARC | 15
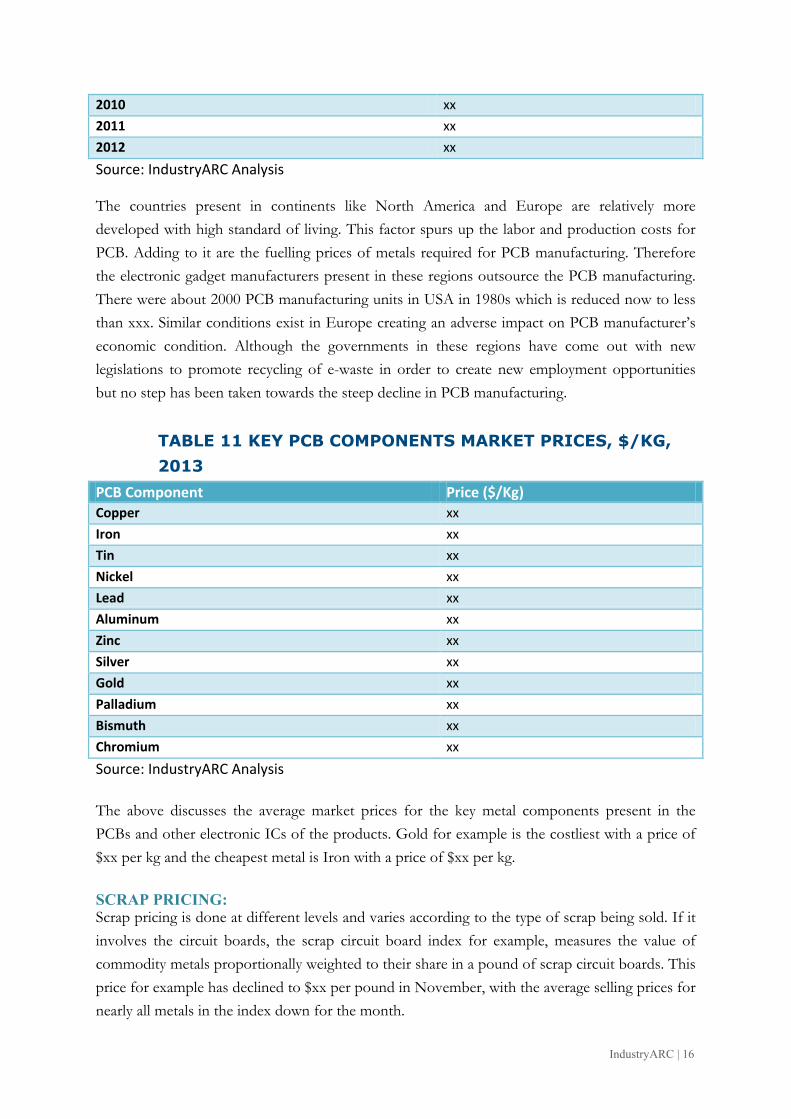
2010 xx 2011 xx 2012 xx Source: IndustryARC Analysis The countries present in continents like North America and Europe are relatively more developed with high standard of living. This factor spurs up the labor and production costs for PCB. Adding to it are the fuelling prices of metals required for PCB manufacturing. Therefore the electronic gadget manufacturers present in these regions outsource the PCB manufacturing. There were about 2000 PCB manufacturing units in USA in 1980s which is reduced now to less than xxx. Similar conditions exist in Europe creating an adverse impact on PCB manufacturer’s economic condition. Although the governments in these regions have come out with new legislations to promote recycling of e-waste in order to create new employment opportunities but no step has been taken towards the steep decline in PCB manufacturing.
TABLE 11 KEY PCB COMPONENTS MARKET PRICES, $/KG, 2013
PCB Component Price ($/Kg) Copper xx Iron xx Tin xx Nickel xx Lead xx Aluminum xx Zinc xx Silver xx Gold xx Palladium xx Bismuth xx Chromium xx Source: IndustryARC Analysis The above discusses the average market prices for the key metal components present in the PCBs and other electronic ICs of the products. Gold for example is the costliest with a price of $xx per kg and the cheapest metal is Iron with a price of $xx per kg. SCRAP PRICING: Scrap pricing is done at different levels and varies according to the type of scrap being sold. If it involves the circuit boards, the scrap circuit board index for example, measures the value of commodity metals proportionally weighted to their share in a pound of scrap circuit boards. This price for example has declined to $xx per pound in November, with the average selling prices for nearly all metals in the index down for the month.
IndustryARC | 16
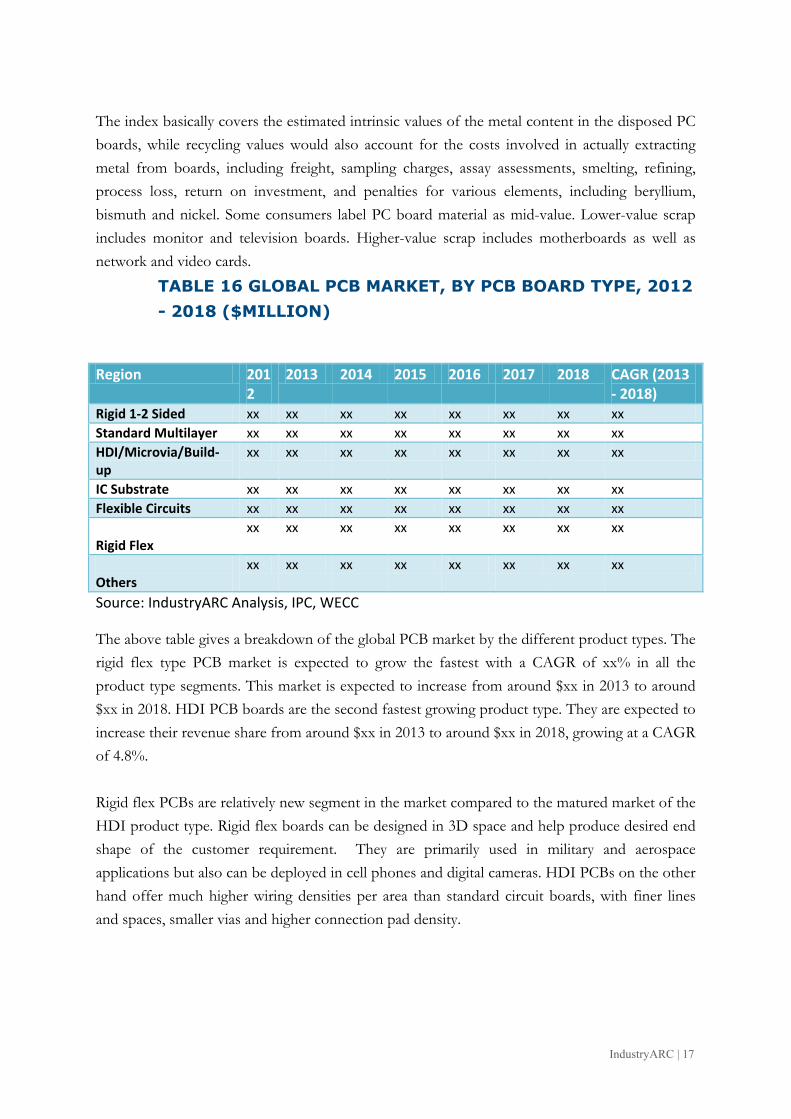
The index basically covers the estimated intrinsic values of the metal content in the disposed PC boards, while recycling values would also account for the costs involved in actually extracting metal from boards, including freight, sampling charges, assay assessments, smelting, refining, process loss, return on investment, and penalties for various elements, including beryllium, bismuth and nickel. Some consumers label PC board material as mid-value. Lower-value scrap includes monitor and television boards. Higher-value scrap includes motherboards as well as network and video cards.
TABLE 16 GLOBAL PCB MARKET, BY PCB BOARD TYPE, 2012 - 2018 ($MILLION)
Region 201
2 2013 2014 2015 2016 2017 2018 CAGR (2013
- 2018) Rigid 1-2 Sided xx xx xx xx xx xx xx xx Standard Multilayer xx xx xx xx xx xx xx xx HDI/Microvia/Build-up
xx xx xx xx xx xx xx xx
IC Substrate xx xx xx xx xx xx xx xx Flexible Circuits xx xx xx xx xx xx xx xx Rigid Flex
xx xx xx xx xx xx xx xx
Others
xx xx xx xx xx xx xx xx
Source: IndustryARC Analysis, IPC, WECC The above table gives a breakdown of the global PCB market by the different product types. The rigid flex type PCB market is expected to grow the fastest with a CAGR of xx% in all the product type segments. This market is expected to increase from around $xx in 2013 to around $xx in 2018. HDI PCB boards are the second fastest growing product type. They are expected to increase their revenue share from around $xx in 2013 to around $xx in 2018, growing at a CAGR of 4.8%. Rigid flex PCBs are relatively new segment in the market compared to the matured market of the HDI product type. Rigid flex boards can be designed in 3D space and help produce desired end shape of the customer requirement. They are primarily used in military and aerospace applications but also can be deployed in cell phones and digital cameras. HDI PCBs on the other hand offer much higher wiring densities per area than standard circuit boards, with finer lines and spaces, smaller vias and higher connection pad density.
IndustryARC | 17
9. GLOBAL PCB REMANUFACTURING MARKET – ANALYSIS AND FORECAST
9.1 MARKET OVERVIEW
PCB reconditioning and remanufacturing is the testing, repair or upgrading of obsolete electronics for resale. Some remanufactures build whole units from individual recovered components (hard drives, mother boards, etc.). Most companies extract PCBs, repair, rework or recondition them on their own or by third party logistics (3PL) companies who send them or sell them the scrap. Some established companies like Acer, Lenovo, and Samsung for example also do it on a larger scale as part of their overall product or device reconditioning program. This helps them in extracting maximum value of end of life electronics, reduce their carbon footprint and supplement their raw material needs with reconditioned components. PCB De-manufacturing is a part of the remanufacturing process in that it is used to disassemble electronics device to capture re-sellable parts and recyclable materials. These products may or may not be used in the reverse logistics program. Reverse Logistics is a relatively new but well established concept wherein an obsolete electronic item like a smartphone, laptop, PC or refrigerator is returned to the manufacturer through the distribution system, which may include involvement of retailers like BestBuy, Wal-Mart and distribution companies like UPS, Avnet, Arrow etc. The below steps explain the remanufacturing process in more detail:
• Any of the defective components like capacitors, resistors, ICs etc. are replaced.
• Sockets, components which are broken, loose are replaced or fixed.
• The boards and the devices which are repaired are then cleaned.
• The PCBs and the power supplies are then tested under load. • Remanufacturing process is initiated to replace or repair other components like
displays, cables in the electronic device before sent for selling.
Remanufacturing similar to recycling helps in reducing the e-waste problem by extending the life cycle of an electronic device. Most devices are xx% functioning with problems arising due to outdated or malfunctioning components. Simple replacement and reconditioning makes them work as brand new and can be resold in countries or markets where low cost products
IndustryARC | 18
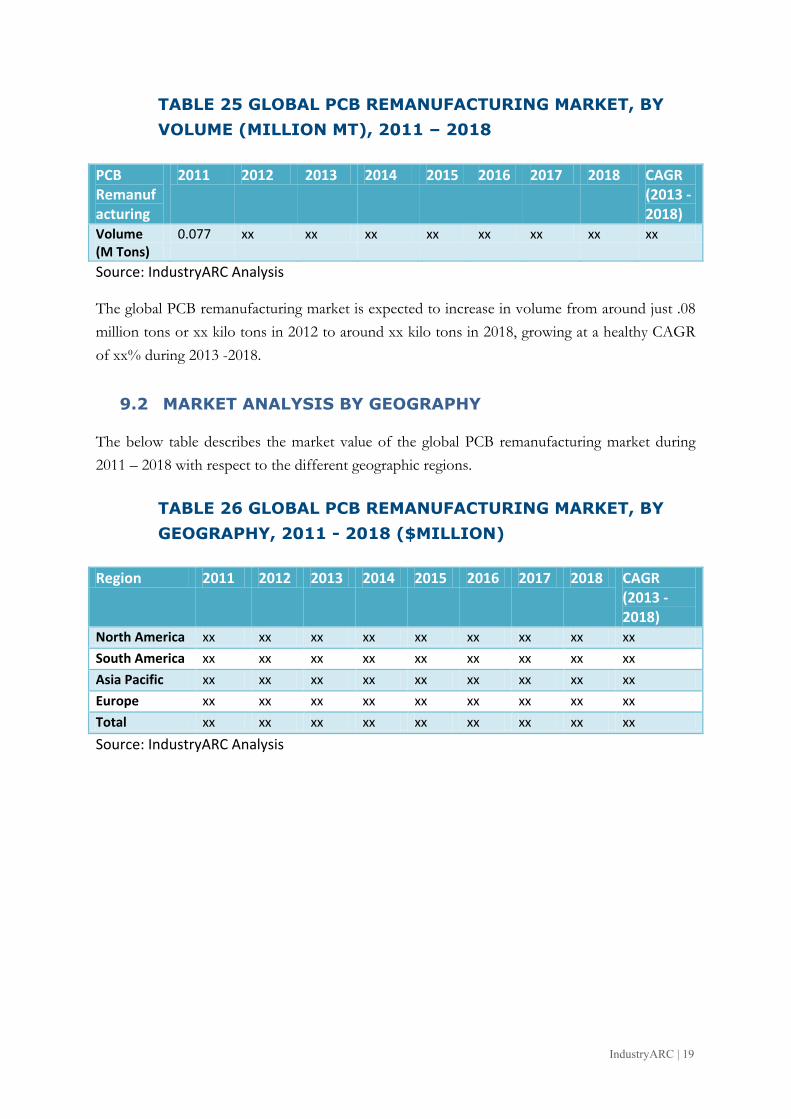
TABLE 25 GLOBAL PCB REMANUFACTURING MARKET, BY VOLUME (MILLION MT), 2011 – 2018
PCB Remanufacturing
2011 2012 2013 2014 2015 2016 2017 2018 CAGR (2013 - 2018)
Volume (M Tons)
0.077 xx xx xx xx xx xx xx xx
Source: IndustryARC Analysis The global PCB remanufacturing market is expected to increase in volume from around just .08 million tons or xx kilo tons in 2012 to around xx kilo tons in 2018, growing at a healthy CAGR of xx% during 2013 -2018.
9.2 MARKET ANALYSIS BY GEOGRAPHY
The below table describes the market value of the global PCB remanufacturing market during 2011 – 2018 with respect to the different geographic regions.
TABLE 26 GLOBAL PCB REMANUFACTURING MARKET, BY GEOGRAPHY, 2011 - 2018 ($MILLION)
Region 2011 2012 2013 2014 2015 2016 2017 2018 CAGR
(2013 - 2018)
North America xx xx xx xx xx xx xx xx xx South America xx xx xx xx xx xx xx xx xx Asia Pacific xx xx xx xx xx xx xx xx xx Europe xx xx xx xx xx xx xx xx xx Total xx xx xx xx xx xx xx xx xx Source: IndustryARC Analysis
IndustryARC | 19
MARKET – TRENDS & DATA SOURCES
TRENDS
High demand from smartphones and media devices in consumer electronics, coupled
with resurgence in industrial automation segments, is the main growth driver.
China is the leading producer with a major market share, followed by Japan and South
Korea.
PCBs constitute around 9% of weight and 4% of mass of all WEEE (Waste Electrical
and Electronic Equipment), currently of more than 10 million tones
The EU aims to recycle around 85% of WEEE by 2019 which is 10m tones or 20 kg per
capita from the current 2m tones or 4 kg per capita.
SOURCES
Internal database on device shipment numbers in consumer electronics, medical devices,
industrial machinery, defense and automotive verticals.
White papers and newsletters from global associations, trade bodies like IPC, NECA,
NEDA, EIPC and WECC.
Annual Reports and presentations from top PCB and recyclable PCB companies from
different geographic regions.
Paid interviews with executives (CXOs, Managers, VPs, AVPs, Business Development
Personnel and distributors) from the PCB industry.
Questionnaires and telephonic interviews.
IndustryARC | 20
RESEARCH METHODOLOGY The quantitative and qualitative data collected for the optical sensor market report is from a combination of secondary and primary sources. Research interviews were conducted with senior executives and/or managers of leading PCB manufacturers & distributors. These Key Opinion Leaders (KOLs) were then provided a questionnaire to gather quantitative and qualitative inputs on their operations, performance, strategies and views on the overall market, including key developments and technology trends. Data from interviews is consolidated, checked for consistency and accuracy, and the final market numbers are again validated by experts. The global market was split by products, services and geography based on different factors like primary and secondary sources, understanding of the number of companies operating in each segment and also KOL insights. We have used various secondary sources such as directories, articles, white papers, newsletters, annual reports and paid databases such as OneSource, Hoovers and Factiva to identify and collect information for extensive technical and commercial study of the PCB manufacturing & recycling market. The key players in the market and its value chain were identified through secondary research and their market opinions were also gathered in a similar way through telephonic interviews and questionnaires. We have also studied the annual reports of these top market players. Interviews with key opinion leaders such as directors, managers, marketing personnel were used extensively in understanding the need and emergence of PCB Market.
IndustryARC | 21
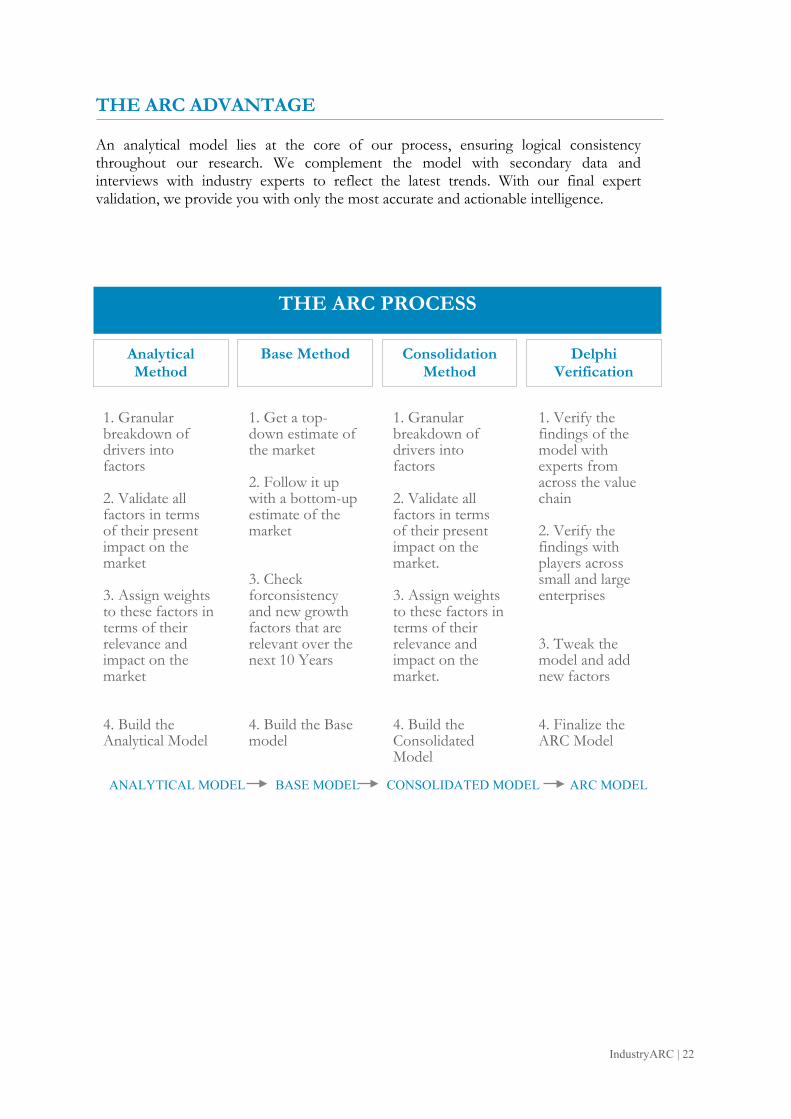
THE ARC ADVANTAGE An analytical model lies at the core of our process, ensuring logical consistency throughout our research. We complement the model with secondary data and interviews with industry experts to reflect the latest trends. With our final expert validation, we provide you with only the most accurate and actionable intelligence.
THE ARC PROCESS
ANALYTICAL MODEL BASE MODEL CONSOLIDATED MODEL ARC MODEL
Analytical Method
Base Method Consolidation Method
Delphi Verification
1. Granular breakdown of drivers into factors 2. Validate all factors in terms of their present impact on the market 3. Assign weights to these factors in terms of their relevance and impact on the market 4. Build the Analytical Model
1. Get a top-down estimate of the market 2. Follow it up with a bottom-up estimate of the market 3. Check forconsistency and new growth factors that are relevant over the next 10 Years 4. Build the Base model
1. Granular breakdown of drivers into factors 2. Validate all factors in terms of their present impact on the market. 3. Assign weights to these factors in terms of their relevance and impact on the market. 4. Build the Consolidated Model
1. Verify the findings of the model with experts from across the value chain 2. Verify the findings with players across small and large enterprises 3. Tweak the model and add new factors 4. Finalize the ARC Model
IndustryARC | 22
ABOUT US IndustryARC was started by a group of young, passionate professionals along with
extensively experienced industry veterans across various business segments. Our focus and
expertise is mainly in the field of analytics, market research and consulting. Our singular
goal is to provide accurate and affordable research to our clients.
Our research team has expertise in diverse fields like Automotive, Chemicals, Consumer
Product & Services, Electronics, Food & Beverages, Healthcare etc., However diverse the
expertise maybe, everyone in our team shares one common trait - we love data and we love
providing solutions to clients using that data even more! Seeing your business flourish
based on our solutions and strategy is what we love the most!
IndustryARC publishes more than 30 reports on an annual basis in the mentioned
Industries. Our reports are in-depth and high quality reports that can help decision makers
frame better strategies for their business requirements. These reports can be further
customized as per your needs.
Disclaimer:
• The reports sold by IndustryARC are limited publications containing valuable
market information provided to a select group of customers in response to orders.
• Our customers acknowledge and agree that any report bought from IndustryARC is
for their own internal use and not for general publication or disclosure to third
parties.
• Our reports or part of the reports, information contained in the report, cannot be
shared or resold to any other third party.
• Disclosure to third parties, usage of data in a public document, article or blog by the
customer can be done with prior permission taken from IndustryARC.
IndustryARC | 23


![PowerPoint Presentation...[1]"Pharmaceutical Drugs Global Market Report 2018", Marketresearch.com, 2019. [Online]. Available:](https://img.dokumen.tips/doc/110x75/5ff0c2a88540c36b5543be69/powerpoint-1pharmaceutical-drugs-global-market-report-2018-marketresearchcom.jpg)