Embed Size (px)
Citation preview

INDUSTRIAL ENERGY EFFICIENCY DATA ANALYSIS PROJECT DRAFT DETAILED RESULTS FOR COMMENT
Freight and air transport
Information on the energy efficiency opportunity available to the sector, its uptake to date,
and some of the factors influencing implementation
May 2013
The Industrial Energy Efficiency Data Analysis project was commissioned by the federal government and state governments through the National Strategy on Energy Efficiency, to better understand and inform:
• The size and value of energy savings that have been identified and reported (from state and federal agency energy efficiency assessment programs);
• The impact of current policies and economic drivers on unlocking those savings; and
• The further factors and policies that might be preventing or incentivising optimal uptake of energy efficiency opportunities.
Presented as a series, these reports provide detailed sector by sector preliminary results from the IEEDA project. Please note these results have not yet been fully verified by businesses, and one of the purposes of these reports is to facilitate discussions on those areas which might need further analysis and refinement.

1
Introduction
The purpose of this document is to present the preliminary results of the Industrial Energy Efficiency Data Analysis (IEEDA) project, in order to facilitate discussions with industry on how best to improve public information on energy efficiency opportunities in the industrial sector going forward.
We welcome feedback on the preliminary results included in this report. If you wish to provide feedback, please contact the project team detailed on the back cover of this report. The datasets will be updated following this consultation process.
Ultimately, the goal of the IEEDA project is to provide information to industry and government on the opportunities to improve energy productivity that are available within Australian industry, and on the support that is required to enable implementation. These reports are intended as a first step in this process.
The figures presented in these reports are based on the best data available at the time of the analysis. Their accuracy is therefore dependant on the quality of the underlying data – compiled from energy savings as reported through government programs, and complemented with analysis from energy consultants where required, particularly for the breakdown by technology and process type and the costs. As such, these figures provide a reasonable approximation of energy savings available across the sector, rather than a conclusive finding.
For example, identified possibilities for energy savings may be overestimated on some occasions and underestimated in others. Also, while overall savings by payback range and fuel type are based on company reporting, there is a high level of uncertainty on the capital costs required, the financial savings delivered and the split by technology/process and type of improvement. In regards to the tables included in the report, this means that the data included in the columns "Energy source", "Payback range", "Energy savings (TJ)", and "Emissions intensity (ktCO2e)" is mostly based on data reported by companies, while the columns "Technology/process", "Type of improvement", "Energy cost change ($m)", "Capital costs ($m)" and "Lifespan (years)" come from a literature review and consultation with energy consultants. The attribution to the category "Various industrial systems" in particular reflects either a lack of information on the technology split, or some savings that could not be attributed based on reported data.
This report includes estimates on how much energy efficiency activity is currently being undertaken by companies, and on how much has been identified to date without proceeding to the implementation stage. This is accompanied by an analysis of the factors1 that explain why some opportunities are not being taken up.
In many cases, these factors are identical to those that influence any type of business investment decision.
Energy efficiency is one way that companies can improve their productivity, and it can therefore help support economic growth in Australia. For the purposes of this analysis, energy efficiency was considered in isolation of other possible investments that a company may make to boost growth, improve productivity or reduce greenhouse gas emissions. While we recognise that the relative merits of these investments may see them prioritised over energy efficiency in business decision-making, a comparative analysis of these alternate investment options relative to energy efficiency is beyond the scope of this project.
The IEEDA data tool has a predictive capability out to 2020 for the industrial sector; however this series of reports outlines findings for the 2010-11 scenario only.
1 In ClimateWorks previous reports, these factors have been referred to as ‘barriers to implementation’.

2
Contents
EXECUTIVE SUMMARY ............................................................................................................................... 3
BACKGROUND TO IEEDA .......................................................................................................................... 4
SECTOR OVERVIEW .................................................................................................................................... 7
Overview of the sector and its energy use ......................................................................................................... 7
Where do the sector’s opportunities lie? ........................................................................................................... 8
How much is being done? ................................................................................................................................... 9
Why aren’t all the opportunities being taken up? ............................................................................................ 10
Which projects are companies more likely to act on? .................................................................................... 12
What internal company attributes enable opportunities to be implemented? .............................................. 13
ANALYSIS OF OPPORTUNITIES BY SUB-SECTOR ................................................................................. 14
HOW TO READ A MARGINAL ABATEMENT COST CURVE ..................................................................... 15
I461 – ROAD FREIGHT TRANSPORT ....................................................................................................... 16
I – OTHER TRANSPORT ........................................................................................................................... 18
3
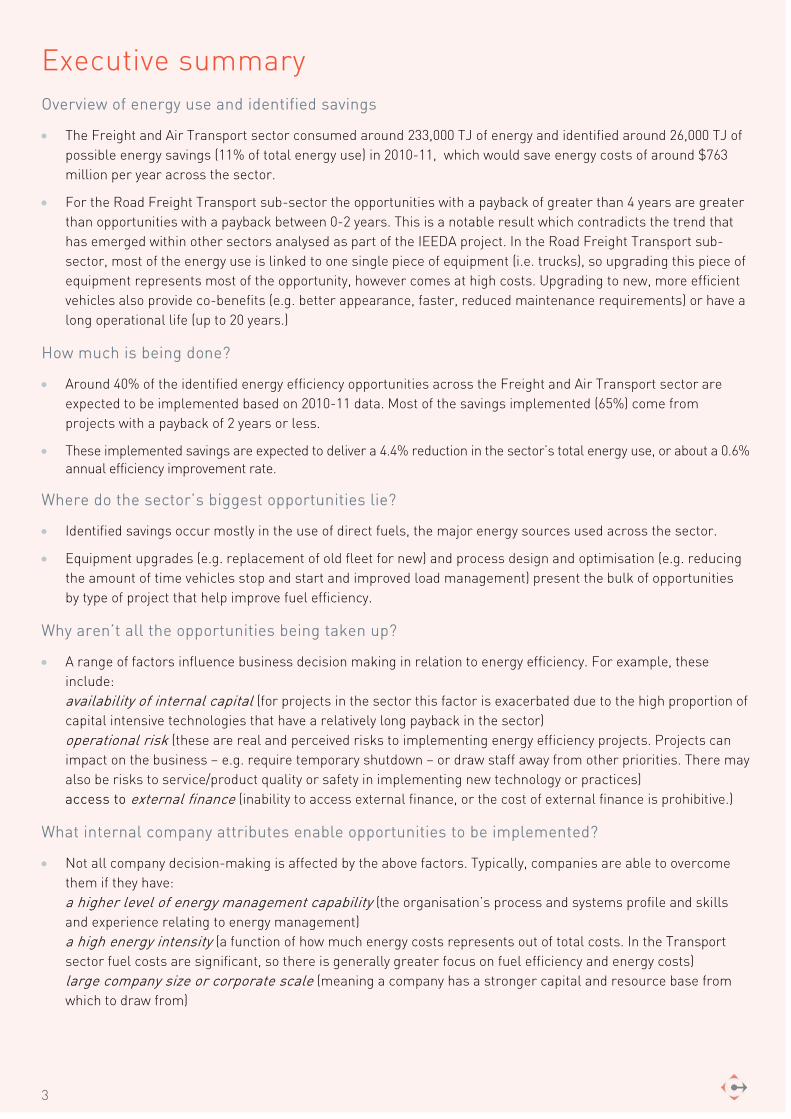
Executive summary Overview of energy use and identified savings
• The Freight and Air Transport sector consumed around 233,000 TJ of energy and identified around 26,000 TJ of possible energy savings (11% of total energy use) in 2010-11, which would save energy costs of around $763 million per year across the sector.
• For the Road Freight Transport sub-sector the opportunities with a payback of greater than 4 years are greater than opportunities with a payback between 0-2 years. This is a notable result which contradicts the trend that has emerged within other sectors analysed as part of the IEEDA project. In the Road Freight Transport sub-sector, most of the energy use is linked to one single piece of equipment (i.e. trucks), so upgrading this piece of equipment represents most of the opportunity, however comes at high costs. Upgrading to new, more efficient vehicles also provide co-benefits (e.g. better appearance, faster, reduced maintenance requirements) or have a long operational life (up to 20 years.)
How much is being done?
• Around 40% of the identified energy efficiency opportunities across the Freight and Air Transport sector are expected to be implemented based on 2010-11 data. Most of the savings implemented (65%) come from projects with a payback of 2 years or less.
• These implemented savings are expected to deliver a 4.4% reduction in the sector’s total energy use, or about a 0.6% annual efficiency improvement rate.
Where do the sector’s biggest opportunities lie?
• Identified savings occur mostly in the use of direct fuels, the major energy sources used across the sector.
• Equipment upgrades (e.g. replacement of old fleet for new) and process design and optimisation (e.g. reducing the amount of time vehicles stop and start and improved load management) present the bulk of opportunities by type of project that help improve fuel efficiency.
Why aren’t all the opportunities being taken up?
• A range of factors influence business decision making in relation to energy efficiency. For example, these include: availability of internal capital (for projects in the sector this factor is exacerbated due to the high proportion of capital intensive technologies that have a relatively long payback in the sector) operational risk (these are real and perceived risks to implementing energy efficiency projects. Projects can impact on the business – e.g. require temporary shutdown – or draw staff away from other priorities. There may also be risks to service/product quality or safety in implementing new technology or practices) access to external finance (inability to access external finance, or the cost of external finance is prohibitive.)
What internal company attributes enable opportunities to be implemented?
• Not all company decision-making is affected by the above factors. Typically, companies are able to overcome them if they have: a higher level of energy management capability (the organisation’s process and systems profile and skills and experience relating to energy management) a high energy intensity (a function of how much energy costs represents out of total costs. In the Transport sector fuel costs are significant, so there is generally greater focus on fuel efficiency and energy costs) large company size or corporate scale (meaning a company has a stronger capital and resource base from which to draw from)

4
2.1%3.5%
Grand Total 11.4%4.8% 6.6%
>4 years 3.7%0.8% 2.8%
2-4 years 2.1%0.5% 1.6%
0-2 years 5.6%
Yes No
Implemented under current policy settings
$ 1.2 b $ 2.1 b
Background to IEEDA The Industrial Energy Efficiency Data Analysis (IEEDA) project was commissioned by the federal government and state governments (through the National Framework for Energy Efficiency) with the specific intention to provide detailed information to industry on the energy efficiency opportunities available to them, what has or hasn’t been taken up to date, and why. The IEEDA project aims to provide information to industry and Government on the opportunities to improve energy productivity that are available within Australian industry, and on the support that is required to enable implementation.
In 2012, ClimateWorks published the Inputs to the Energy Savings Initiative modelling from the Industrial Energy Efficiency Data Analysis Project and a summary report, Industrial Energy Efficiency: summary of key findings from the ESI data analysis project (both available at www.climateworksaustralia.org/industrial-energy-efficiency-data-analysis).
ClimateWorks has since conducted further research that builds on this earlier work and investigates the energy efficiency opportunities available to medium to large industrial energy users – across the Mining, Metals, Chemicals, Transport and Other Manufacturing sectors – looking at the possible energy savings, the associated costs and benefits, and the factors influencing the uptake of the identified energy savings.
Across these five sectors, these energy users include 587 companies, and represent nearly 2,000 PJ of energy use, or around 50% of Australia’s total energy consumption in 2010-11.
A key strength of the IEEDA project is its focus on real world company data rather than theoretical assessments of energy efficiency possibilities:
• The primary data source was actual company data – energy savings as reported through state and federal government programs – complemented with analysis by energy consultants for the breakdown by technology and process type and the costs.
• The factors influencing the uptake of of energy efficiency have been framed as they would be experienced at the site of implementation, based on expert input, and linked to energy savings identified.
The information presented here has not yet been extensively verified. As such, this report aims to both provide information on possible opportunities to improve energy efficiency, and to facilitate discussion on the areas of this analysis which would benefit from further refinement (in particular in regards to the breakdown by technology and process type and the costs).
Figure 1 – Energy savings identified and share expected to be implemented, 2010-11, % of energy use

5
Key findings across the five sectors examined include:
• Significant energy savings have been identified across the industrial sector, representing around 11% of total energy use (shown in Figure 1 above).
• The majority of opportunities offer a payback below 2 years.
• These energy savings equate to a decrease in annual energy costs of $3.3 billion per year (in 2010 real dollars). Note: the dollar value of these energy savings are not modelled net of implementation costs and are based on common energy prices that may differ from actual prices (particularly for industries that use their own product or for those companies that operate under long-term energy contracts).
• Not all savings identified will be implemented, due to a range of factors that influence business decision-making.
• Based on company reports, around 40% of the opportunity identified – worth $1.2 billion – is likely to be implemented. The remainder – $2.1 billion – is not expected to be taken up in current business implementation plans.
More detail on the IEEDA project can be found in the Inputs to the Energy Savings Initiative modelling from the Industrial Energy Efficiency Data Analysis Project report, available online on ClimateWorks’ website (www.climateworksaustralia.org/industrial-energy-efficiency-data-analysis) or the Energy Savings Initiative (ESI) Secretariat website (www.climatechange.gov.au/government/initiatives/energy-savings-initiative.aspx).
Please note refinements have been conducted to the database since the Inputs to the Energy Savings Initiative report was published, and some small sub-sectors were excluded from this analysis for confidentiality reasons. This explains the difference between the earlier analysis and the analysis included in the five sector reports in this series.
In total, five reports are included in the series: (1) Mining, (2) Metals manufacturing, (3) Chemicals and energy manufacturing, (4) Other manufacturing, construction and services, and (5) Freight and air transport.
All reports cover sites and companies that trigger the NGERs threshold in these sectors.
The proportional energy use and energy savings for each of these groupings are shown in Figure 2 below.
Figure 2 – Total energy use (left) and total energy savings identified (right) by sector, 2010-11
18%
21%
Freight and air transport(233 PJ)
12%
Othermanufacturing,
constructionand services
(348 PJ)
Chemicals and Energymanufacturing
(409 PJ)
21% Metalsmanufacturing (578 PJ)
29%
Mining (414 PJ)
Total energy use = 1,982 PJ
21%
21%
Freight and air transport(26 PJ)
11%
Othermanufacturing,
constructionand services
(48 PJ)
Chemicals and Energymanufacturing
(65 PJ)
29%
Metalsmanufacturing(38 PJ)
18%
Mining (47 PJ)
Total energy savings identified = 225 PJ

6
This report for the Freight and Air Transport sector contains:
• An overview of the sub-sectors included in the analysis.
• An overview of key findings and an analysis of the factors influencing business uptake of energy savings opportunities.
• Detailed energy savings opportunities by sub-sector. This includes an overview of the major technology and processes which present energy savings possibilities, a cost curve comparing the energy efficiency opportunities identified by net cost, and a table with detailed energy savings data by opportunity for 2010-11.
7
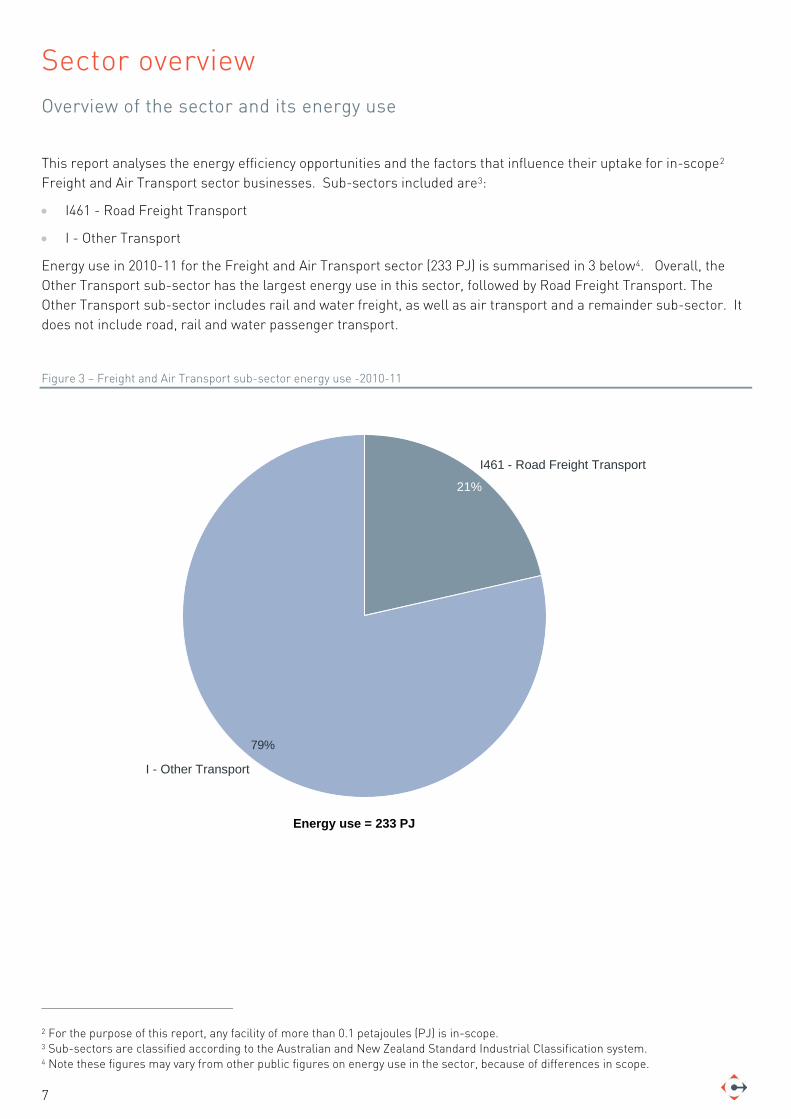
Sector overview Overview of the sector and its energy use
This report analyses the energy efficiency opportunities and the factors that influence their uptake for in-scope2 Freight and Air Transport sector businesses. Sub-sectors included are3:
• I461 - Road Freight Transport
• I - Other Transport
Energy use in 2010-11 for the Freight and Air Transport sector (233 PJ) is summarised in 3 below4. Overall, the Other Transport sub-sector has the largest energy use in this sector, followed by Road Freight Transport. The Other Transport sub-sector includes rail and water freight, as well as air transport and a remainder sub-sector. It does not include road, rail and water passenger transport.
Figure 3 – Freight and Air Transport sub-sector energy use -2010-11
2 For the purpose of this report, any facility of more than 0.1 petajoules (PJ) is in-scope. 3 Sub-sectors are classified according to the Australian and New Zealand Standard Industrial Classification system. 4 Note these figures may vary from other public figures on energy use in the sector, because of differences in scope.
Energy use = 233 PJ
79%
I461 - Road Freight Transport
21%
I - Other Transport

8
Where do the sector’s opportunities lie?
Summarised in Figure 4 below, our analysis reveals that:
• Significant energy savings have been identified across the Freight and Air Transport sector, representing 11.0% of total energy use.
• Just under half of the opportunities across the sector offer paybacks below 2 years.
• For the Road Freight Transport sub-sector the opportunities with a payback of greater than 4 years are greater than opportunities with a payback between 0-2 years. This is a notable result which contradicts the trend that has emerged within other sectors analysed as part of the IEEDA project. In the Road Freight Transport sub-sector, most of the energy use is linked to one single piece of equipment (i.e. trucks), so upgrading this piece of equipment represents most of the opportunity, however comes at high costs. Upgrading to new, more efficient vehicles also provide co-benefits (e.g. better appearance, faster, reduced maintenance requirements) or have a long operational life (up to 20 years.)
• Identified savings occur mostly in the use of direct fuels, the major energy sources used across the sector.
• Prominent project opportunties associated with Road Freight Transport can be separated into two categories. The first of these is behaviour change and maintenance practices. Opportunities within this category might include training in fuel efficient driving and idle time reduction, improved maintenance practices and optimisation of transport routes and loads carried. The second opportunity category is equipment upgrade, which includes the retrofitting of existing vehicles with new technology to improve efficiency, or the old for new replacement of vehicles.
• The Other Transport sub-sector includes opportunities associated with behaviour change, maintenance practices and equipment upgrades. Due to the nature of the equipment operated within air transport, prominent opportunities are primarily associated with the upgrade of existing fleet or improvements in flight operation. Similar opportunities are also prominent within rail transport operations, with changes to the operation of these rail systems through driver training and behaviour modification also producing efficiency benefits.
Figure 4 – Energy savings identified, percentage of energy use, 2010-11
I - Other Transport
16.6%
Grand Total 11.0%
9.4%
I461 - Road FreightTransport
0-2 years
>4 years2-4 years
By type of projectBy payback period
11.0%
9.4%
16.6%
Equipment upgrade
Various energy efficiency opportunities
Process design and optimisation
Process controls and measurements
Behaviour change and maintenance practices
By fuel type
11.0%
9.4%
16.6%
Direct fuelElectricity

9
How much is being done?
Based on 2010-11 reported data, analysis shows that around 40% of identified energy efficiency opportunities in the Freight and Air Transport sector are expected to be implemented (Figure 5).
Most of the savings implemented (65%) will come from projects with a payback of 2 years or less. Only a small share of those opportunities with a greater than 2 year payback are expected to occur.
Figure 5 – Implementation profile for Freight and Air Transport sector opportunities, 2010-11
Overall, these implemented savings correspond to a 4.4% reduction in energy use. With an estimated implementation timeframe of 7 years, this is equivalent to an annual efficiency improvement of 0.6% improvement.
Research suggests that energy efficiency improvement rates across all industrial sectors in Australia are now about three times as high as historical levels (pre-2005)5.
5 ClimateWorks Australia, Tracking Progress towards a low carbon economy – Discussion paper, November 2012
2-4 years >4 years0-2 years
79%
35%
65%
11
21%
1
79%
39%
61%
26
Total
14
21%
Not Implemented Implemented
2010-11 (PJ)

10
Why aren’t all the opportunities being taken up?
A range of factors exist that influence business decision-making in relation to energy efficiency projects. These relate to project attractiveness, company capacity (in relation to the specific opportunity) and company motivation. Figure 6 provides an overview of those factors that are most likely to inhibit the uptake of identified energy savings. It considers each of these factors along two dimensions:
• Coverage – the proportion of energy savings identified in the Freight and Air Transport sector which are influenced by the factor, even to a small degree.
• Strength – the level of impediment created by the factor. It has been modelled as the percentage of companies for whom that factor prevents the uptake of identified energy efficiency opportunities.
The size of the bubbles denotes the overall impediment of each factor (number in parenthesis next to the labels). This is the total percentage of energy savings blocked by that factor, or the product of the coverage and strength.
Figure 6 – Factors inhibiting the uptake of energy efficiency in the Freight and Air Transport sector
Figure 6 shows that one factor inhibits most of the opportunity on the basis of both its significant coverage and strength. This is the availability of internal capital – companies may have limited capital or make limited amounts of capital available for projects. In the Freight and Air Transport sector, this factor is exacerbated because there are a high proportion of capital intensive technologies that have a relatively long payback in the sector.
Figure 6 also shows that the two factors that cover the most of the opportunity in the sector are:
• Operational risk – replacing equipment could interrupt operations or impact on key production lines.
0
5
10
15
20
25
30
35
40
45
50
55
60
65
70
75
80
85
90
95
100
0 5 10 15 20 25 30 35 40 45 50 55 60 65 70 75 80 85 90 95 100
Coverage (%)
Strength(%)
Regulatory barrier - Tax depreciation (13%)
Non-market pricing (12%)Internal practices (27%)
Operational risk (39%)
Opportunity cost (39%)
Innovation premium (31%)
Supply chain (29%)
Decision cycle (36%)
Project scale (20%)
Payback period (43%)
Internal skills and capability (32%)
Access to information (33%)Access to external finance (43%)
Availability of internal capital (71%)
Company motivationProject attractivenessCompany capacity

11
• Decision cycles for long-life equipment – for equipment with a long lifespan, companies can be reluctant to replace or modify the equipment before the end of its useful operating life.
In addition to those wide-coverage factors, two additional factors appear significant, but on a smaller proportion of the opportunity identified. Their impact is mostly driven by their strength – they impact on a high proportion of the opportunity which they relate to. These factors are:
• Payback period – long payback projects are likely to be rejected by companies which prefer to invest in other more profitable projects instead.
• Access to external finance – lenders may be unwilling to provide significant capital outlays to some companies in this sector.
Many factors have both a moderate strength and coverage (located in the middle of the graph). Some of these have a stronger or equal overall impediment to payback period; they include:
• Opportunity cost – Other investment opportunities other than energy efficiency projects may be preferred where limited capital is available.
• Access to information and internal skills and capability – sites may lack specific skills and knowledge to assess and implement energy efficiency opportunities. This includes technical, business case and financial knowledge as well as understanding of suppliers to assist with implementation. It also includes the availability of appropriate systems (e.g. to measure energy usage.)
• Innovation premium – more innovative energy efficiency projects are likely to meet extra resistance when the activity is very different from existing practice.
12
Which projects are companies more likely to act on?
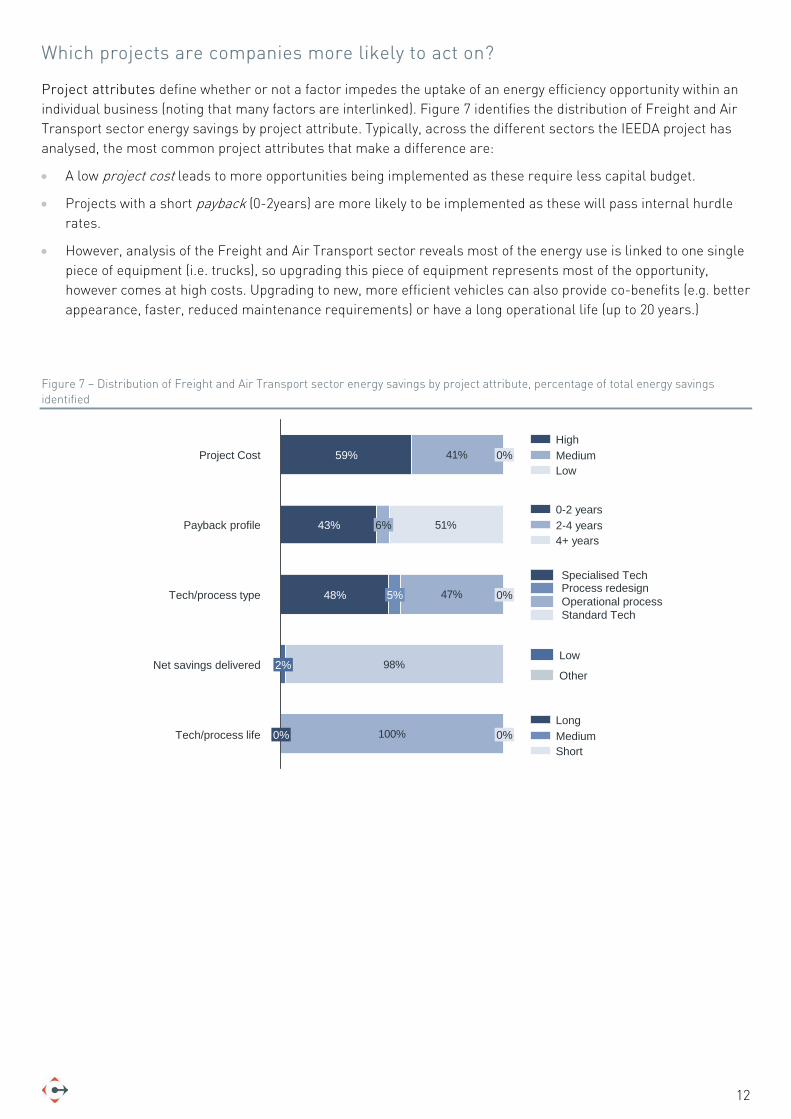
Project attributes define whether or not a factor impedes the uptake of an energy efficiency opportunity within an individual business (noting that many factors are interlinked). Figure 7 identifies the distribution of Freight and Air Transport sector energy savings by project attribute. Typically, across the different sectors the IEEDA project has analysed, the most common project attributes that make a difference are:
• A low project cost leads to more opportunities being implemented as these require less capital budget.
• Projects with a short payback (0-2years) are more likely to be implemented as these will pass internal hurdle rates.
• However, analysis of the Freight and Air Transport sector reveals most of the energy use is linked to one single piece of equipment (i.e. trucks), so upgrading this piece of equipment represents most of the opportunity, however comes at high costs. Upgrading to new, more efficient vehicles can also provide co-benefits (e.g. better appearance, faster, reduced maintenance requirements) or have a long operational life (up to 20 years.)
Figure 7 – Distribution of Freight and Air Transport sector energy savings by project attribute, percentage of total energy savings identified
41%
98%
100%
47%
51%
Tech/process life 0% 0%
Net savings delivered 2%
Tech/process type 48% 5% 0%
Payback profile 43% 6%
Project Cost 59% 0%LowMediumHigh
ShortMediumLong
Low
Other
4+ years2-4 years0-2 years
Specialised TechProcess redesignOperational processStandard Tech
13
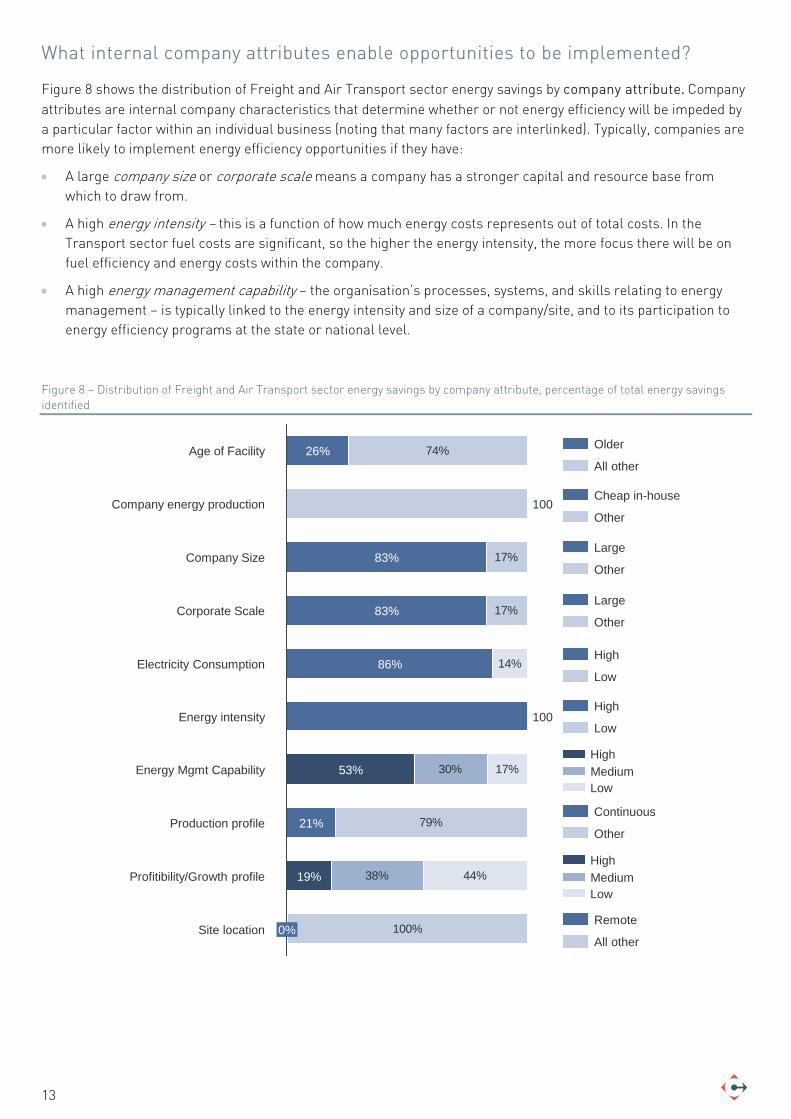
What internal company attributes enable opportunities to be implemented?
Figure 8 shows the distribution of Freight and Air Transport sector energy savings by company attribute. Company attributes are internal company characteristics that determine whether or not energy efficiency will be impeded by a particular factor within an individual business (noting that many factors are interlinked). Typically, companies are more likely to implement energy efficiency opportunities if they have:
• A large company size or corporate scale means a company has a stronger capital and resource base from which to draw from.
• A high energy intensity – this is a function of how much energy costs represents out of total costs. In the Transport sector fuel costs are significant, so the higher the energy intensity, the more focus there will be on fuel efficiency and energy costs within the company.
• A high energy management capability – the organisation’s processes, systems, and skills relating to energy management – is typically linked to the energy intensity and size of a company/site, and to its participation to energy efficiency programs at the state or national level.
Figure 8 – Distribution of Freight and Air Transport sector energy savings by company attribute, percentage of total energy savings identified
74%
17%
17%
30%
79%
38%
100%
44%
17%
14%
Site location 0%
Profitibility/Growth profile 19%
Production profile 21%
Energy Mgmt Capability 53%
Energy intensity 100
Electricity Consumption 86%
Corporate Scale 83%
Company Size 83%
Company energy production 100
Age of Facility 26% Older
All other
Cheap in-house
Other
Large
Other
Large
Other
High
Low
High
Low
LowMediumHigh
Continuous
Other
LowMediumHigh
Remote
All other
14
Analysis of opportunities by sub-sector
The following pages provide a detailed overview of the opportunities for energy efficiency by sub-sector.
• I461 - Road Freight Transport
• I - Other Transport

15
How to read a marginal abatement cost curve The marginal abatement cost curve (MACC) summarises an estimate of the realistic volume and costs of opportunities to reduce energy use. Each box on the curve represents the reduction potential of a different opportunity. The width of each box represents the reduction potential that opportunity can deliver compared to business-as-usual. The height of each box represents the average net cost per GJ through that opportunity.
The graph is ordered left to right from the lowest cost to the highest cost opportunities. Those opportunities that appear below the horizontal axis offer the potential for financial savings even after the upfront costs of capturing them have been factored in. Opportunities that appear above the horizontal axis are expected to come at a net cost.
The energy savings potential in TJ per year related to this opportunity
Estimated cost in A$ per GJ related to this opportunity
Opportunities are sorted by increasing cost
Each box represents the reduction potential of each opportunity

16
I461 – Road Freight Transport Opportunities to reduce energy use
This project has identified 14 opportunities to reduce energy use in the Road Freight Transport sub-sector.
Figure 9 shows those opportunities by technology/process type and fuel category. As can be seen on this graph, improvements in transport engines and systems represents nearly 100% of the total potential identified. Prominent opportunities associated with road transport engines and systems can be separated into two categories. The first of these is behaviour change and maintenance practices. Opportunities within this category might include training in fuel efficient driving and idle time reduction, improved maintenance practices and optimisation of transport routes and loads carried. The second opportunity category is equipment upgrade, which includes the retrofitting of existing vehicles with new technology to improve efficiency, or the old for new replacement of existing vehicles.
The savings occur in direct fuels (e.g. oil, coal, gas, biomass, bagasse, etc.), which are the major energy sources used in the sub-sector.
Energy savings associated with technology categories other than transport engines and systems reflect energy savings identified at depots, warehouses and other buildings in which the road freight transport sector operate.
Figure 9 – Identified energy savings in Road Freight Transport by technology and by fuel category, 2010-11
Figure 10 represents those opportunities on a cost curve, ordered by increasing net cost. As can be seen on the curve, the opportunities are spread across all payback ranges, corresponding to a range of improvement types, particularly equipment upgrades.
Overall, for 2010-11, the opportunities identified could add up to energy cost savings of $266 million. They would require a capital investment of $1.7 billion. Out of this total capital, one opportunity – transport engines and
Refrigeration 9
Stationary materials equipment 9
Electronic equipment 14
HVAC Systems 20
Lighting systems 30
Transport engines and systems 8,222
Compressed air systems 4
Direct Fuels Electricity
8,226Grand Total 8,30882
Savings as % energy useTotal Energy use of subsector = 50,059 TJ
16.4%
0.0%
0.0%
0.0%
0.0%
0.0%
16.6%
0.1%

17
systems equipment upgrade with a payback of greater than 4 years – represents $1.6 billion. Without this opportunity, the net annual financial savings add up to $52 million.
More detailed information on opportunities available in the Road Freight Transport sub-sector can be found in Table 1.
Figure 10 – Energy efficiency cost curve for Road Freight Transport, 2010-11
Table 1 – Detailed energy reduction opportunities for Road Freight Transport, 2010-11 scenario6
6 Interest rate used to calculate net annualised cost for this sub-sector is 8.46%
-30
-25
-20
-15
-5
0
5
10
-45
-50
-10
5,0002,5000
-35
-40
7,500
Electronic equipment - Equipment upgrade - 2-4 years - Electricity
Lighting systems - Equipment upgrade - >4 years - Electricity
Transport engines and systems - Equipment upgrade - 2-4 years - Direct Fuels
CostA$ per GJ
Reduction potentialTJ per year
Equipment upgradeProcess design and optimisation
Process controls and measurementsBehaviour change and maintenance practices
Transport engines and systems - Behaviour change and maintenance practices - 0-2 years - Direct Fuels
Transport engines and systems - Equipment upgrade - >4 years -Direct Fuels
Scenario Energy source Technology/process Type of improvementPayback range
Energy Savings (TJ)
Emissions Reductions (kt CO2-e)
Energy cost change ($m)
Capital costs ($m)
Average lifespan (years)
Net annualised cost ($m)
2010-11 Direct FuelsTransport engines and systems
Behaviour change and maintenance practices 0-2 years 1,499 104 -47.8 47.8 10 -40.5
2010-11 Direct FuelsTransport engines and systems Equipment upgrade >4 years 6,152 427 -196.0 1,559.2 10 41.3
2010-11 Direct FuelsTransport engines and systems Equipment upgrade 2-4 years 571 40 -18.2 54.6 10 -9.9
2010-11 Direct Fuels HVAC Systems Equipment upgrade 2-4 years 2 0 0.0 0.1 10 0.0
2010-11 Direct Fuels HVAC SystemsProcess controls and measurements 0-2 years 1 0 0.0 0.0 10 0.0
2010-11 Electricity Compressed air systemsBehaviour change and maintenance practices 0-2 years 1 0 -0.1 0.1 15 -0.1
2010-11 Electricity Compressed air systems Equipment upgrade 2-4 years 3 1 -0.2 0.5 15 -0.1
2010-11 Electricity HVAC SystemsBehaviour change and maintenance practices 0-2 years 6 2 -0.3 0.3 10 -0.3
2010-11 Electricity HVAC Systems Equipment upgrade >4 years 11 3 -0.6 2.6 10 -0.22010-11 Electricity Electronic equipment Equipment upgrade 2-4 years 14 4 -0.8 1.9 4 -0.22010-11 Electricity Lighting systems Equipment upgrade >4 years 30 8 -1.6 8.1 10 -0.42010-11 Electricity Refrigeration Equipment upgrade 2-4 years 6 2 -0.3 1.0 10 -0.1
2010-11 Electricity RefrigerationProcess controls and measurements 0-2 years 3 1 -0.2 0.3 10 -0.1
2010-11 ElectricityStationary materials equipment
Process controls and measurements 0-2 years 9 2 -0.5 0.4 20 -0.4
2010-11 Grand Total 8,308 592 -266.3 1,676.6 -11.0

18
I – Other Transport Opportunities to reduce energy use
This project has identified 22 opportunities to reduce energy use in the Other Transport sub-sector. This sub-sector grouping includes rail and water freight, as well as air transport and a remainder sub-sector. It does not include road, rail and water passenger transport.
Figure 11 shows those opportunities by technology/process type and fuel category. As can be seen on this graph, improvements in transport engines and systems represents nearly 80% of the total potential identified. As with road freight transport, the prominent opportunity category of transport engines and systems within the other transport sub-sector includes opportunities associated with behaviour change, maintenance practices and equipment upgrade. Due to the nature of the equipment operated within air transport, prominent opportunities are primarily associated with the upgrade of existing fleet or improvements in flight operation. Similar opportunities are also prominent within rail transport operations, with changes to the operation of these rail systems through driver training and behaviour modification also producing efficiency benefits.
Improvements in various industrial systems are the next largest opportunity, contributing most of the remaining potential identified.
The large volume of savings in the various industrial systems category comes in large part from the fact that information in certain sub-sectors was not sufficient to split savings by technology/process type.
The savings occur in direct fuels (e.g. oil, coal, gas, biomass, bagasse, etc.), which are the major energy sources used in the sub-sector.
Figure 11– Identified energy savings in Other Transport by technology and by fuel category, 2010-11
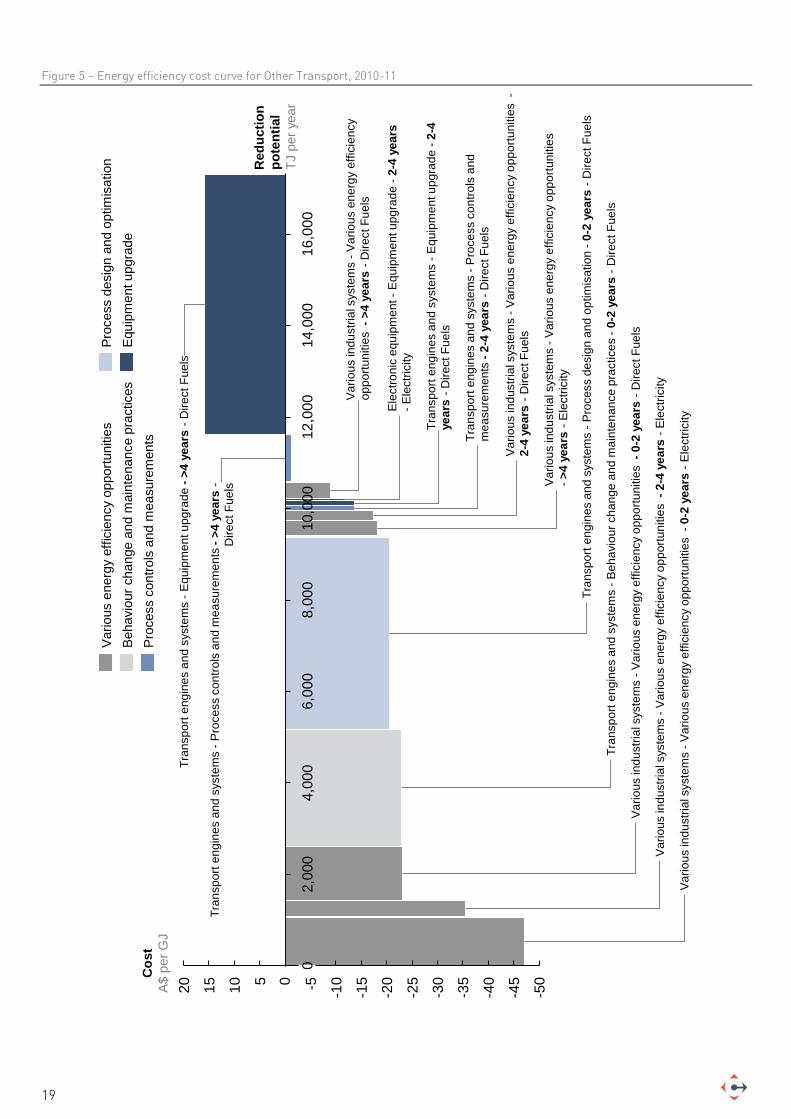
Figure 12 represents those opportunities on a cost curve, ordered by increasing net cost. As can be seen on the curve, the opportunities are spread across all payback ranges, corresponding to a range of improvement types, particularly equipment upgrades.
Overall, for 2010-11, the opportunities identified could add up to energy cost savings of $497 million. They would require a capital investment of $2.3 billion. Out of this total capital, one opportunity – transport engines and systems equipment upgrade with a payback of greater than 4 years – represents $1.6 billion. Without this opportunity, the net annual financial savings add up to $253 million. More detailed information on opportunities available in the Other Transport sub-sector can be found in Table 2.
Stationary materials equipment 7
Lighting systems 16
Electronic equipment 35
HVAC Systems 38
Various industrial systems 3,507
Transport engines and systems 13,700
Direct Fuels Electricity
15,484Grand Total 17,3031,819
Savings as % energy useTotal Energy use of subsector =183,169 TJ
7.5%
1.9%
0.0%
0.0%
0.0%
0.0%
9.4%
19
Figure 5 – Energy efficiency cost curve for Other Transport, 2010-11
-25
-20
-15
-10-505101520 -40
-45
-50
0
-35
10,0
0012
,000
14,0
0016
,000
2,00
04,
000
6,00
08,
000
-30
Var
ious
indu
stria
l sys
tem
s -V
ario
us e
nerg
y ef
ficie
ncy
oppo
rtuni
ties
->
4 ye
ars
-Ele
ctric
ity
Tran
spor
t eng
ines
and
syst
ems
-Pro
cess
des
ign
and
optim
isat
ion
-0-2
yea
rs -
Dire
ct F
uels
Tran
spor
t eng
ines
and
syst
ems
-Pro
cess
con
trols
and
m
easu
rem
ents
-2-
4 ye
ars
-Dire
ct F
uels
Var
ious
indu
stria
l sys
tem
s -V
ario
us e
nerg
y ef
ficie
ncy
oppo
rtuni
ties
-2-
4 ye
ars
-Ele
ctric
ity
Var
ious
indu
stria
l sys
tem
s -V
ario
us e
nerg
y ef
ficie
ncy
oppo
rtuni
ties
-0-
2 ye
ars
-Ele
ctric
ity
Tran
spor
t eng
ines
and
syst
ems
-Beh
avio
ur c
hang
e an
d m
aint
enan
ce p
ract
ices
-0-
2 ye
ars
-Dire
ct F
uels
Var
ious
indu
stria
l sys
tem
s -V
ario
us e
nerg
y ef
ficie
ncy
oppo
rtuni
ties
-2-
4 ye
ars
-Dire
ct F
uels
Var
ious
indu
stria
l sys
tem
s -V
ario
us e
nerg
y ef
ficie
ncy
oppo
rtuni
ties
->4
yea
rs -
Dire
ct F
uels
Tran
spor
t eng
ines
and
syst
ems
-Equ
ipm
ent u
pgra
de -
2-4
year
s-D
irect
Fue
ls
Cos
tA$
per
GJ
Red
uctio
n po
tent
ial
TJ p
er y
ear
Equi
pmen
t upg
rade
Proc
ess
desi
gn a
nd o
ptim
isat
ion
Proc
ess
cont
rols
and
mea
sure
men
tsBe
havi
our c
hang
e an
d m
aint
enan
ce p
ract
ices
Vario
us e
nerg
y ef
ficie
ncy
oppo
rtuni
ties
Var
ious
indu
stria
l sys
tem
s -V
ario
us e
nerg
y ef
ficie
ncy
oppo
rtuni
ties
-0-
2 ye
ars
-Dire
ct F
uels
Ele
ctro
nic
equi
pmen
t -E
quip
men
t upg
rade
-2-
4 ye
ars
-Ele
ctric
ity
Tran
spor
t eng
ines
and
syst
ems
-Pro
cess
con
trols
and
mea
sure
men
ts -
>4 y
ears
-D
irect
Fue
ls
Tran
spor
t eng
ines
and
syst
ems
-Equ
ipm
ent u
pgra
de -
>4 y
ears
-D
irect
Fue
ls

20
Table 2 – Detailed energy reduction opportunities for Other Transport, 2010-11 scenario7
7 Interest rate used to calculate net annualised cost for this sub-sector grouping ranges from 8.20% to 9.40% depending on the sub-sector
Scenario Energy source Technology/process Type of improvementPayback range
Energy Savings (TJ)
Emissions Reductions (kt CO2-e)
Energy cost change ($m)
Capital costs ($m)
Average lifespan (years)
Net annualised cost ($m)
2010-11 Direct FuelsTransport engines and systems
Behaviour change and maintenance practices 0-2 years 2,555 178 -66.1 50.3 10 -58.4
2010-11 Direct FuelsTransport engines and systems Equipment upgrade >4 years 5,694 396 -147.3 1,556.3 10 90.0
2010-11 Direct FuelsTransport engines and systems Equipment upgrade 2-4 years 125 9 -3.2 9.7 10 -1.7
2010-11 Direct FuelsTransport engines and systems
Process controls and measurements >4 years 1,025 71 -26.5 159.1 10 -1.3
2010-11 Direct FuelsTransport engines and systems
Process controls and measurements 2-4 years 91 6 -2.4 7.3 10 -1.3
2010-11 Direct FuelsTransport engines and systems Process design and optimisation 0-2 years 4,204 292 -108.8 147.6 10 -85.9
2010-11 Direct Fuels HVAC Systems Equipment upgrade 2-4 years 12 1 -0.1 0.5 10 -0.1
2010-11 Direct Fuels HVAC SystemsProcess controls and measurements 0-2 years 6 0 -0.1 0.1 10 0.0
2010-11 Direct FuelsVarious industrial systems
Various energy efficiency opportunities 0-2 years 1,199 82 -31.0 31.0 18 -27.6
2010-11 Direct FuelsVarious industrial systems
Various energy efficiency opportunities >4 years 350 24 -9.1 54.3 18 -3.1
2010-11 Direct FuelsVarious industrial systems
Various energy efficiency opportunities 2-4 years 221 15 -5.7 17.2 18 -3.8
2010-11 ElectricityTransport engines and systems
Behaviour change and maintenance practices 0-2 years 2 0 -0.1 0.1 10 -0.1
2010-11 ElectricityTransport engines and systems Equipment upgrade >4 years 3 1 -0.2 0.7 10 -0.1
2010-11 ElectricityTransport engines and systems Process design and optimisation 0-2 years 0 0 0.0 0.0 10 0.0
2010-11 Electricity HVAC SystemsBehaviour change and maintenance practices 0-2 years 7 2 -0.3 0.3 10 -0.3
2010-11 Electricity HVAC Systems Equipment upgrade >4 years 13 3 -0.7 3.0 10 -0.22010-11 Electricity Electronic equipment Equipment upgrade 2-4 years 35 9 -1.9 4.8 4 -0.42010-11 Electricity Lighting systems Equipment upgrade >4 years 16 4 -0.9 3.7 10 -0.3
2010-11 ElectricityStationary materials equipment
Process controls and measurements 0-2 years 7 2 -0.4 0.3 20 -0.3
2010-11 ElectricityVarious industrial systems
Various energy efficiency opportunities 0-2 years 1,060 282 -56.2 56.2 18 -50.0
2010-11 ElectricityVarious industrial systems
Various energy efficiency opportunities 2-4 years 343 91 -18.2 54.5 18 -12.2
2010-11 ElectricityVarious industrial systems
Various energy efficiency opportunities >4 years 333 89 -17.7 106.0 18 -6.1
2010-11 Grand Total 17,303 1,557 -496.7 2,263.0 -163.2

21

22
Lead authors for this report are:
Amandine Denis
Paris Nichols
With support from:
Shane Gladigau
Joe Ritchie
For detailed methodology and sources see the Inputs to the Energy Savings Initiative modelling from the Industrial Energy Efficiency Data Analysis Project
(available at www.climateworksaustralia.org/industrial-energy-efficiency-data-analysis)

23
CONTACT US
For further information about this project visit www.climateworksaustralia.org/industrial-energy-efficiency-data-analysis
Or contact:
Anna Skarbek
EXECUTIVE DIRECTOR
PHONE +61 3 9902 0738
EMAIL [email protected]
Amandine Denis
HEAD OF RESEARCH
PHONE +61 3 9902 0743
EMAIL [email protected]
Dominic Zaal
DEPARTMENT OF RESOURCES, ENERGY & TOURISM
PHONE +61 2 6243 7893
EMAIL [email protected]
ClimateWorks Australia Level 1, 31 Flinders Lane
Melbourne VIC 3000 PHONE +61 3 9902 0741
EMAIL [email protected]