Embed Size (px)
Citation preview

ed: CK / sa:MA, PY
Benign competition may turn sour
Telkomsel has launched aggressive data-pricing in Java
while lowering voice pricing outside Java
Downgrade XL to HOLD after the stock rose 70% YTD;
likely to be impacted by slower industry growth;
Downgrade Indosat to HOLD due to its higher reliance
on Java and potential loss of revenue share.
Prefer Sarana Menara Nusantara (TOWR) as proxy to
mobile data growth and Link Net (LINK) as pure proxy
to fixed broadband growth in Indonesia.
Telkomsel’s data-only promotions in Java are 60% cheaper
than peers. Our checks indicate that Telkomsel has launched
data-only starter-packs in Java around July which are ~60%
cheaper than those offered by its competitors. It seems that
Telkomsel is targeting XL’s data-savvy customers. This has
halted the data-pricing hike cycle which had started in 4Q16-
1Q17. Indosat (ISAT) and XL (EXCL) derive ~90% and ~70% of
their revenue from Java respectively vs ~35% for Telkomsel
and may react if Telkomsel does not take-off these promotions
soon. Telkomsel has also lowered its voice-tariff by 30-60%
outside Java selectively to defend its customer base. We lower
FY17F/18F industry growth to 6.5%/6.3% (from 7%/6.8%) on
the back of these promotions.
Downgrade XL to HOLD as we see limited gains after the
recent rally (up 70% YTD). EXCL’s stock price has done well
due to revenue share gains in 1H17. With an aggressive
Telkomsel now, EXCL’s revenue share gains in 2H17F will rely
on ISAT’s network improvement. EXCL may barely meet
consensus EBITDA of Rp4.6tr in 2H17F vs only Rp3.9tr EBITDA
in 1H17. We also think that XL’s consensus FY18F EBITDA of
Rp9.7tn could be cut by 3% due to slower industry growth.
Downgrade Indosat (ISAT) to HOLD due to potential
revenue share loss. ISAT has been the biggest beneficiary of
benign competition in Java, which is not the case anymore.
ISAT also faces network quality issues due to low network
capex. We expect ISAT to lag the industry growth rate in
FY17F/18F, whereby consensus EBITDA could be cut 3%/6%.
Mantain HOLD on TLKM due to rich valuations amid slower
growth. TLKM’s 9.1x adjusted FY18F EV/EBITDA (+2SD) does
not leave room for disappointment. Consensus FY16-19F
EBITDA CAGR of 10% needs non-Telkomsel business to deliver
an aggressive 20% EBITDA CAGR.
JCI : 5,884.60
Analyst Sachin MITTAL +65 6682 3699 [email protected]
EXCL gained 800 basis points revenue share in 1H17, forcing
Telkomsel to react in July 2017
Source: Companies, DBS Bank
Stabilising data-yields may resume downward journey in
2H17F
Source: Companies, DBS Bank
DBS Group Research . Equity 20 Sep 2017
Indonesia Industry Focus
Telecom Sector
Refer to important disclosures at the end of this report
STOCKS
12-mth
Price Mkt Cap Target Performance (%)
Rp US$m Price Rp 3 mth 12 mth Rating
PT Link Net Tbk 5,200 1,194 6,000 2.0 10.6 BUY PT Sarana Menara Nusantara
4,420 3,402 5,100 15.7 11.1 BUY Telekomunikasi Indonesia 4,710 35,818 4,800 4.9 15.2 HOLD XL Axiata 3,850 3,104 3,900 18.8 45.3 HOLD Indosat 6,300 2,583 6,800 (2.3) 17.2 HOLD Tower Bersama Infrastructure
6,575 2,248 6,200 (4.4) 13.9 HOLD
Source: DBS Bank, Bloomberg Finance L.P.
Closing price as of 19 Sep 2017
Page 1

Industry Focus
Telecom Sector
Telkomsel is disrupting the status quo
Telkomsel getting aggressive in Java. Our channel checks
indicate intensifying competition on the data front in the Java
region. Telkomsel has reportedly slashed pricing on its high-end
data packages, currently offering a 25GB starter pack with a 90-
day validity for just Rp55,000-45,000.
Internet packages offered by EXCL and ISAT
Source: Companies, DBS Bank
XL and Indosat had been cutting bonus data under their
packages since 4Q16-1Q17 as Indonesia data yields are among
the lowest in the region. Indonesian data yields declined nearly
50% from 2Q16 to 2Q17, with usage jumping 120% from
~260MB to 1.2GB over the same period.
Stabilising data yields may see downward trend again
Source: Companies, DBS Bank
This implies a discount of over 60% to similar data packages on
offer by Indosat and EXCL. This promotion is not mentioned
anywhere on Telkomsel’s website but dealers are offering this
promotion on the ground. Telkomsel appears to be keen on
snatching heavy data users in Java, who are mostly with EXCL,
to compensate for subscriber losses outside Java.
We believe that it is possible for Telkomsel to keep this
promotion ongoing for an extended period of time, leading ISAT
and EXCL to resort to lowering data prices. This would disrupt
the duos’ efforts in 4Q16-1Q17 to lift up data prices. Indosat
may also be facing some capacity constraint in our view due to
lower addition of 3G/4G base stations.
India and Indonesia have lowest data yields in the region
Source: M1, Maxis, Digi.com, Celcom Axiata, Bharti Airtel, idea Cellular,
Telkom, XL Axiata, Indosat, AIS,, DBS Bank
Page 2

Industry Focus
Telecom Sector
Data usage on the rise in India and Indonesia supported by
low prices
Source: M1, Maxis, Digi.com, Celcom Axiata, Bharti Airtel, idea Cellular,
Telkom, XL Axiata, Indosat, AIS,, DBS Bank
Telkomsel’s voice prices have been slashed ~ 30%-60% in
FY17
General tariffs on prepaid packages.
Source: Telkomsel, DBS Bank
Revenue share gains by EXCL likely to lose steam as Telkomsel
fires back in the ex-Java region. EXCL made steady gains in
revenue market share over the past two quarters, snatching ex-
Java market share from Telkomsel. Telkomsel lost nearly 0.9%
revenue market share over the last two quarters, of which over
0.8% was grabbed by EXCL. However, our industry checks
indicate that Telkomsel is retaliating against EXCL outside Java,
beefing up its data offerings and slashing voice prices. Since the
beginning of the year Telkomsel has slashed its voice prices by
~30%-60% in certain ex-Java regions that overlap with EXCL’s.
With the price adjustments, Telkomsel has ousted EXCL from
being the cheaper provider of legacy services ex-Java. Higher
legacy pricing of EXCL and Telkomsel’s superior network quality
outside Java may reduce the pace of EXCL’s ex-Java subscriber
acquisitions. Intensifying competition on the data front in Java,
which remains a stronghold of EXCL, could also lead to an
increase in subscriber churn. Accordingly, we believe that the
pace of revenue share gains by EXCL will likely reduce over
2H17F.
EXCL gained 800bps revenue share over 1H17, forcing
Telkomsel to react in July 2017
Source: Companies, DBS Bank
Telkomsel closes the gap on voice pricing with EXCL
Source: Companies, DBS Bank
Page 3
Industry Focus
Telecom Sector
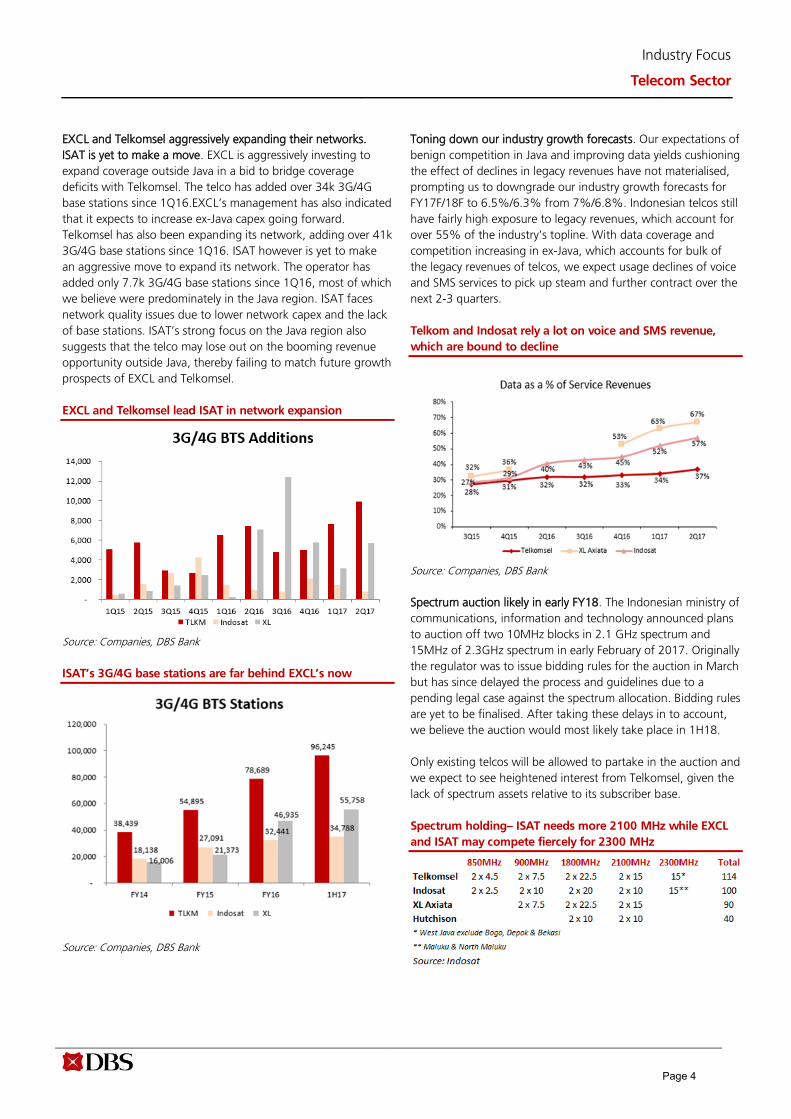
EXCL and Telkomsel aggressively expanding their networks.
ISAT is yet to make a move. EXCL is aggressively investing to
expand coverage outside Java in a bid to bridge coverage
deficits with Telkomsel. The telco has added over 34k 3G/4G
base stations since 1Q16.EXCL’s management has also indicated
that it expects to increase ex-Java capex going forward.
Telkomsel has also been expanding its network, adding over 41k
3G/4G base stations since 1Q16. ISAT however is yet to make
an aggressive move to expand its network. The operator has
added only 7.7k 3G/4G base stations since 1Q16, most of which
we believe were predominately in the Java region. ISAT faces
network quality issues due to lower network capex and the lack
of base stations. ISAT’s strong focus on the Java region also
suggests that the telco may lose out on the booming revenue
opportunity outside Java, thereby failing to match future growth
prospects of EXCL and Telkomsel.
EXCL and Telkomsel lead ISAT in network expansion
Source: Companies, DBS Bank
ISAT’s 3G/4G base stations are far behind EXCL’s now
Source: Companies, DBS Bank
Toning down our industry growth forecasts. Our expectations of
benign competition in Java and improving data yields cushioning
the effect of declines in legacy revenues have not materialised,
prompting us to downgrade our industry growth forecasts for
FY17F/18F to 6.5%/6.3% from 7%/6.8%. Indonesian telcos still
have fairly high exposure to legacy revenues, which account for
over 55% of the industry’s topline. With data coverage and
competition increasing in ex-Java, which accounts for bulk of
the legacy revenues of telcos, we expect usage declines of voice
and SMS services to pick up steam and further contract over the
next 2-3 quarters.
Telkom and Indosat rely a lot on voice and SMS revenue,
which are bound to decline
Source: Companies, DBS Bank
Spectrum auction likely in early FY18. The Indonesian ministry of
communications, information and technology announced plans
to auction off two 10MHz blocks in 2.1 GHz spectrum and
15MHz of 2.3GHz spectrum in early February of 2017. Originally
the regulator was to issue bidding rules for the auction in March
but has since delayed the process and guidelines due to a
pending legal case against the spectrum allocation. Bidding rules
are yet to be finalised. After taking these delays in to account,
we believe the auction would most likely take place in 1H18.
Only existing telcos will be allowed to partake in the auction and
we expect to see heightened interest from Telkomsel, given the
lack of spectrum assets relative to its subscriber base.
Spectrum holding– ISAT needs more 2100 MHz while EXCL
and ISAT may compete fiercely for 2300 MHz
Page 4

Industry Focus
Telecom Sector
Telkomsel would be keen on both the spectrum blocks given
its already high no. of subscribers serviced per MHz
Source: Companies, DBS Bank
We have used a 40%/80% premium to the 2.1GHz/2.3GHz
spectrum auction held in India recently (per MHz per
population) to arrive at a 5MHz spectrum pricing of ~US$43m
for the 2.1GHz band and ~US$15m for the 2.3GHz band. We
attach a higher premium to the 2.3GHz band as we expect to
see more interest on this spectrum, which reportedly would
be used for 4G services. We assume that Telkomsel will
acquire spectrum assets in both bands. We also expect to see
ISAT acquiring one 10MHz block in the 2.1GHz spectrum and
EXCL and ISAT both acquiring 5 MHz each in the 2.3GHz
spectrum band (Assuming that the 2.3GHz band will be
auctioned in 5MHz blocks). This results in spectrum capex of
Rp1.3tr for ISAT and Rp196bn for EXCL. We have not
factored in any upside to earnings from the additional
spectrum resources.
Historical 12-month forward EV/EBITDA multiples
Telkom’s non-adjusted + 2SD EV/EBITDA is not justified with
fixed-line compensating for slower mobile growth
Source: DBS Bank
EXCL may trade below the historical average as mobile
competition intensifies
EXCL may trade below the historical average as mobile
competition intensifies
Source: DBS Bank
ISAT may trade below the historical average due to potential
revenue share loss
Source: DBS Bank
Page 5

Industry Focus
Telecom Sector
Regional Peer Table
Source: DBS Bank; DBS Vickers
Mkt Price 12-mth CA GR
Company F YE Cap S$ Target Price % 16-18
(US$m) 18/9/2017 LCL Upside Rcmd (%) 17F 18F 16A 17F 16A 17F 17F 18F
China / Hong Kong SHCOMP Index 3,363
China Mobile Dec 212,440 81.10 114.00 41% BUY 4 12.4 11.8 3.5% 7.8% 1.4x 1.4x 3.3x 3.0x
China Telecom Dec 7,030 3.96 5.10 29% BUY 8 13.5 12.7 2.8% 3.1% 0.9x 0.8x 3.6x 3.4x
China Unicom Dec 34,251 11.18 11.30 1% HOLD nm 45.6 23.8 0.0% 0.8% 1.0x 1.0x 3.9x 3.4x
Smartone Telecom Jun 1,318 9.32 7.50 -20% FV -8 15.1 14.8 6.4% 6.4% 2.3x 2.2x 5.1x 4.9x
Hutchison Telecom Dec 1,769 2.87 3.30 15% HOLD -1 20.4 20.0 3.8% 3.7% 1.2x 1.2x 7.1x 6.8x
HKT Trust Dec 9,541 9.85 12.80 30% BUY 0 15.7 15.3 6.3% 6.4% 1.9x 1.9x 8.7x 8.5x
Malay sia KLCI Index 1783.66
Digi.Com Dec 9,038 4.87 4.20 -14% FV -4 25.7 25.2 4.3% 3.9% 72.9x 72.9x 13.9x 13.7x
Maxis Bhd Dec 10,701 5.74 5.15 -10% HOLD 0 22.7 21.9 3.5% 3.8% 9.1x 6.8x 11.8x 11.8x
Telekom Dec 5,741 6.40 7.10 11% BUY 9 27.9 24.0 3.4% 3.2% 3.1x 3.1x 7.5x 7.0x
Axiata Group Dec 10,846 5.05 4.75 -6% HOLD 1 35.4 31.3 1.6% 1.4% 1.9x 1.9x 8.0x 7.6x
Singapore ST I Index 3241.85
M1 Dec 1,235 1.79 1.78 0% FV -12 13.1 14.4 7.2% 6.1% 4.1x 4.1x 6.9x 7.5x
Starhub Dec 3,348 2.61 2.33 -11% FV -12 17.0 17.6 7.7% 6.1% 23.1x 27.1x 8.8x 9.3x
Thailand SET Index 1670.2
Advanced Info Serv ice Dec 17,430 194.00 162.00 -16% HOLD 6 19.5 17.0 5.2% 3.6% 13.5x 11.8x 10.0x 9.1x
Total Access Comm. Dec 4,132 57.75 37.90 -34% SELL 19 80.5 37.7 0.7% 0.3% 5.1x 4.9x 5.8x 5.7x
Indonesia J CI Index 5884.611
Indosat Dec 2,580 6,300 8,500 35% BUY nm 19.1 nm 0.0% 0.0% 2.6x 2.3x 3.8x 3.2x
PT Telekom Dec 35,775 4,710 4,800 2% HOLD 18 19.9 17.5 2.9% 3.5% 5.6x 5.3x 7.6x 7.1x
XL Axiata Dec 3,197 3,970 4,000 1% BUY nm 422.0 93.2 0.5% 0.1% 2.0x 2.0x 6.3x 5.7x
PT Sarana Menara Dec 3,398 4,420 5,100 15% BUY nm 19.5 17.8 0.0% 1.6% 4.2x 3.7x 10.5x 9.6x
Tower Bersama Dec 2,245 6,575 6,200 -6% HOLD -2 33.3 25.3 0.9% 3.3% 19.1x 20.5x 14.2x 13.1x
A v erage 47.7 24.0 7.8 7.4
EV /EBITDAPE (x) Div idend Y ield (%) P/BV
Page 6

Industry Focus
Telecom Sector
COMPANY GUIDES
Page 7

ed: CK / sa:MA, PY
HOLD (Downgrade from BUY)
Last Traded Price ( 18 Sep 2017): Rp6,300 (JCI : 5,884.60)
Price Target 12-mth: Rp6,800 (8% upside) (Prev Rp8,500)
Analyst Sachin MITTAL +65 6682 3699 [email protected]
What’s New Market may be underestimating the impact of rising
competition in Java which accounts for 90% of ISAT’s
revenue
FY17F/18F EBITDA may be cut 3%/6% due to lower
growth as network quality remains a concern
Downgrade to HOLD with a lower TP of Rp6,800
Price Relative
Forecasts and Valuation FY Dec (Rp m) 2016A 2017F 2018F 2019F
Revenue 29,185 30,321 30,611 31,091 EBITDA 12,778 13,079 12,967 13,046 Pre-tax Profit 1,795 2,134 1,920 1,737 Net Profit 1,105 1,306 1,137 989 Net Pft (Pre Ex.) 1,105 1,306 1,137 989 Net Pft Gth (Pre-ex) (%) nm 18.2 (12.9) (13.1) EPS (Rp) 203 240 209 182 EPS Pre Ex. (Rp) 203 240 209 182 EPS Gth Pre Ex (%) (184) 18 (13) (13) Diluted EPS (Rp) 203 240 209 182 Net DPS (Rp) 0.0 0.0 0.0 182 BV Per Share (Rp) 2,457 2,697 2,906 2,984 PE (X) 31.0 26.2 30.1 34.6 PE Pre Ex. (X) 31.0 26.2 30.1 34.6 P/Cash Flow (X) 3.5 3.2 2.9 3.4 EV/EBITDA (X) 4.5 4.0 3.9 3.7 Net Div Yield (%) 0.0 0.0 0.0 2.9 P/Book Value (X) 2.6 2.3 2.2 2.1 Net Debt/Equity (X) 1.5 1.1 0.9 0.7 ROAE (%) 8.6 9.3 7.5 6.2
Earnings Rev (%): (27) (52) (66) Consensus EPS (Rp): 355 487 624 Other Broker Recs: B: 27 S: 0 H: 3
Source of all data on this page: Company, DBS Bank, Bloomberg Finance L.P
Worse-off from rising competition in Java
Share price could be range-bound due to potential revenue
share losses. ISAT was the biggest beneficiary of benign
competition in Java due to its higher reliance on Java, which is
not the case anymore. Our checks indicate that Telkomsel is
offering data-only starter packs at over 60% discount in Java
since July-Aug 2017. ISAT offers limited upside potential after
factoring potential revenue share loss and incorporating the
potential spectrum auction price of ~Rp1.3tr in FY18F.
Where we differ? Our FY17F/18F EBITDA estimates are 3%/6%
below consensus estimates. Consensus is overestimating the
impact of stabilising data yields pre-maturely and ignoring
network quality issues at ISAT which may take a few months to
resolve. We believe that despite efforts by ISAT and EXCL to
improve data yields, aggressive competitive behaviour by
Telkomsel in the Java region is likely to reverse this trend.
Potential catalyst – significant change in network quality. ISAT
needs to ramp up its capex significantly to have enough
capacity to encourage data usage. We expect ISAT to catch up
with its peers in terms of network quality by 2H18F.
Valuation:
Downgrade to HOLD with a lower target price of Rp6,800. As
we cut FY17F/18F EBITDA by 2%/2.5%, nudge up FY18F/19F
capex and factor in the potential spectrum auction price of
~Rp1.3tr, our TP drops to Rp6,800. Our DCF-based TP assumes
a WACC of 9.4% and 1% terminal growth rate. ISAT’s
valuation is cheap but gaining revenue share is a critical factor
for the stock price to perform well.
Key Risks to Our View:
Benign competition in Java. If Telkomsel reverts back to uphold
the trend of increasing data yields within Java and thereby
cooling down competition, ISAT could record faster growth in
revenues and higher-than-expected EBITDA.
DBS Group Research . Equity 20 Sep 2017
Indonesia Company Guide
Indosat Version 6 | Bloomberg: ISAT IJ | Reuters: ISAT.JK Refer to important disclosures at the end of this report
Issued Capital (m shrs) 5,434
Mkt. Cap (Rpbn/US$m) 34,234 / 2,580
Major Shareholders (%)
Ooredoo Asia (%) 65.0
Govt of Indonesia (%) 14.3
Oredoo Asia Pte Ltd 65.00%
Free Float (%) 20.7
3m Avg. Daily Val 0.28
ICB Industry : Telecommunications / Telecommunications
Page 8

Company Guide
Indosat
CRITICAL DATA POINTS TO WATCH
Critical Factors
ISAT to be impacted the most from tightening competition in
Java. ISAT, which generates close to 90% of revenues in the
Java region is likely to be impacted the most with tightening
competitive dynamics in Java. ISAT was among the first telcos to
curtail promotions on data, which was soon followed by EXCL.
However, with Telkomsel disrupting this trend, we believe ISAT
would have no choice but to revert back to offering discounts
on data packages to prevent a loss of market share to the
incumbent. As a result, we revise our cellular revenue growth
forecasts to only 5.8%/5.5% from 7.3%/5.8%, leading us to
cut EBITDA by 2%/2.5%.
Lack of investments in and out of Java could hurt future
revenue growth. ISAT’s lack of expansions in and out of Java
could lead to the operator trailing EXCL and Telkomsel on
future growth in topline. Indosat was the least active in
expanding its network, adding over 7.7k 3G/4G BTS stations
(predominately in Java) since 1Q16 vs. 41k/34k by Telkomsel
and EXCL. Our industry checks also indicate that the operator is
facing network quality and capacity restrictions amid rising
usage of data in Java. This could result in ISAT losing data heavy
subscribers to EXCL. Restricting operations to Java and rising
network issues could result in ISAT losing revenue market share,
leading to muted growth in future revenues.
ISAT lags EXCL and Telkomsel in 3G/4G base stations
Source: Companies, DBS Banks
Reducing exposure to USD debt could bring predictability to the
bottomline. ISAT's earnings will be more predictable as it now
has lesser exposure to foreign currency debt. ISAT’s USD debt
outstanding is only 5% (2Q17) of the total outstanding debt,
lower than its historical level of ~50%. We estimate that 60%
of the outstanding USD debt is expected to mature within the
next 12 months, which should minimise forex impact on
profitability further. This should allow the counter to post
predictable stable net profit in the short to medium term.
Subscribers (m)
Blended ARPU (Rp k)
EBITDA Margin %
Capex (Rp tn)
EBITDA (Rpbn)
Source: Company, DBS Bank
Page 9
Company Guide
Indosat
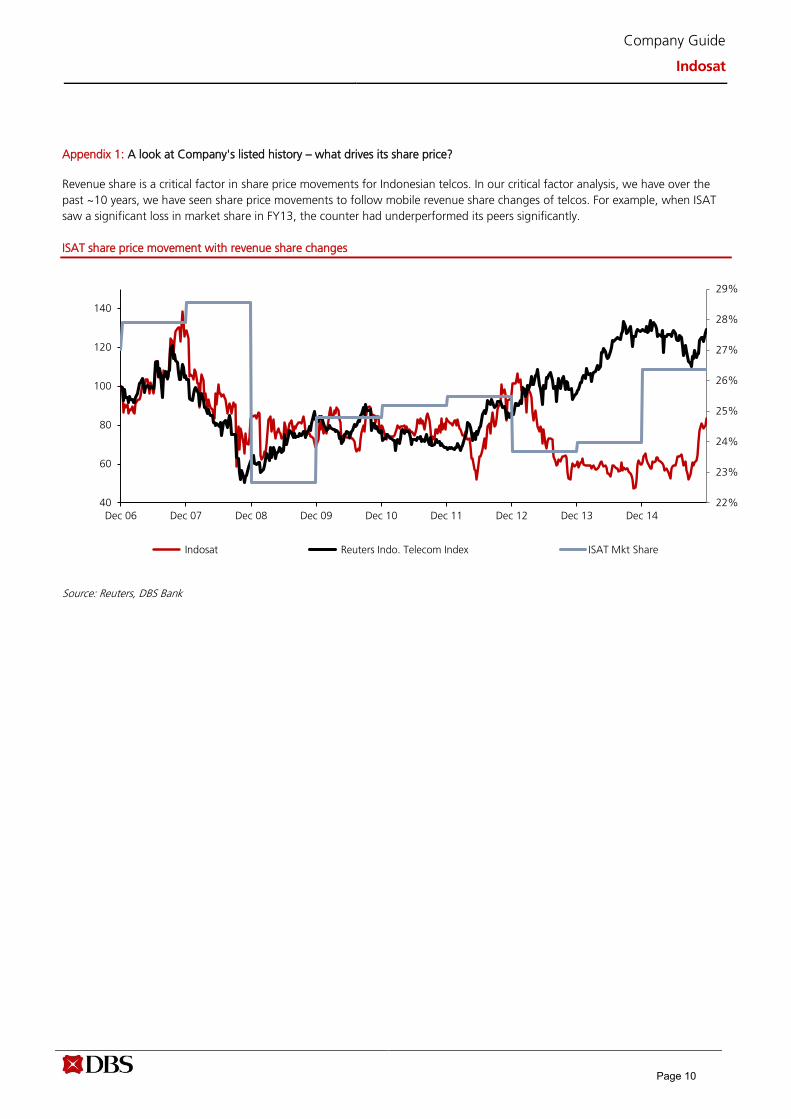
Appendix 1: A look at Company's listed history – what drives its share price?
Revenue share is a critical factor in share price movements for Indonesian telcos. In our critical factor analysis, we have over the
past ~10 years, we have seen share price movements to follow mobile revenue share changes of telcos. For example, when ISAT
saw a significant loss in market share in FY13, the counter had underperformed its peers significantly.
ISAT share price movement with revenue share changes
Source: Reuters, DBS Bank
22%
23%
24%
25%
26%
27%
28%
29%
40
60
80
100
120
140
Dec 06 Dec 07 Dec 08 Dec 09 Dec 10 Dec 11 Dec 12 Dec 13 Dec 14
Indosat Reuters Indo. Telecom Index ISAT Mkt Share
Page 10
Company Guide
Indosat
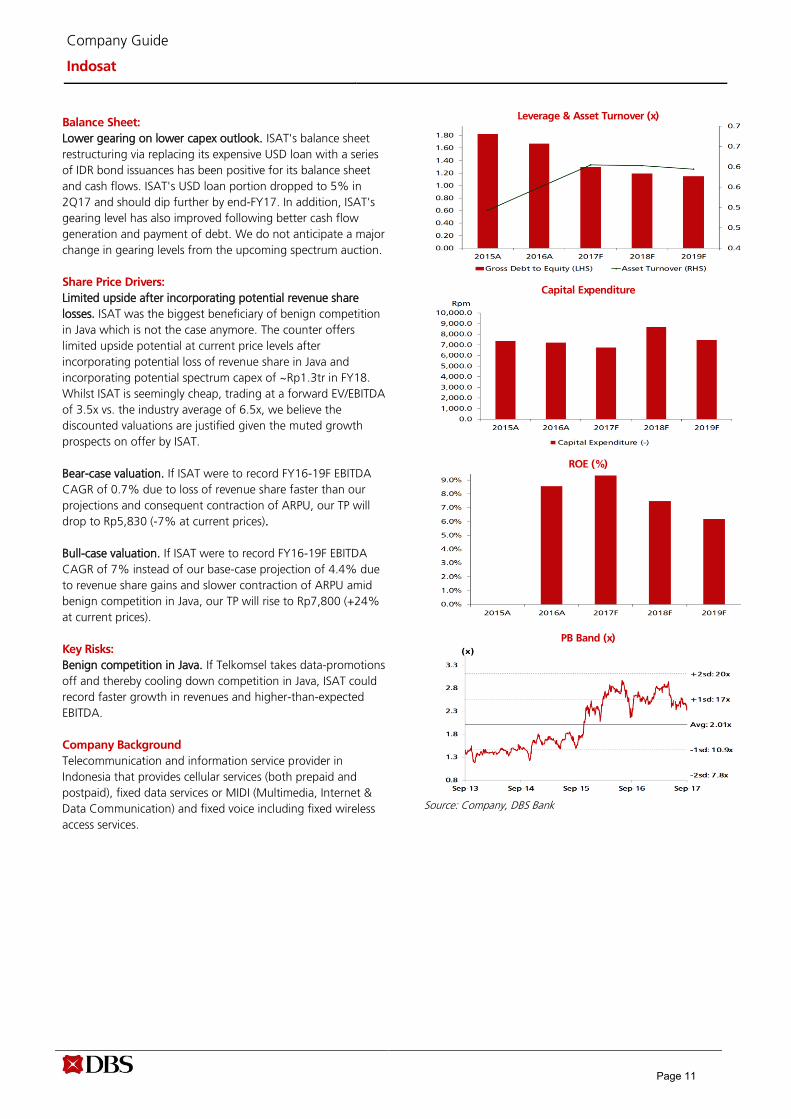
Balance Sheet:
Lower gearing on lower capex outlook. ISAT's balance sheet
restructuring via replacing its expensive USD loan with a series
of IDR bond issuances has been positive for its balance sheet
and cash flows. ISAT's USD loan portion dropped to 5% in
2Q17 and should dip further by end-FY17. In addition, ISAT’s
gearing level has also improved following better cash flow
generation and payment of debt. We do not anticipate a major
change in gearing levels from the upcoming spectrum auction.
Share Price Drivers:
Limited upside after incorporating potential revenue share
losses. ISAT was the biggest beneficiary of benign competition
in Java which is not the case anymore. The counter offers
limited upside potential at current price levels after
incorporating potential loss of revenue share in Java and
incorporating potential spectrum capex of ~Rp1.3tr in FY18.
Whilst ISAT is seemingly cheap, trading at a forward EV/EBITDA
of 3.5x vs. the industry average of 6.5x, we believe the
discounted valuations are justified given the muted growth
prospects on offer by ISAT.
Bear-case valuation. If ISAT were to record FY16-19F EBITDA
CAGR of 0.7% due to loss of revenue share faster than our
projections and consequent contraction of ARPU, our TP will
drop to Rp5,830 (-7% at current prices).
Bull-case valuation. If ISAT were to record FY16-19F EBITDA
CAGR of 7% instead of our base-case projection of 4.4% due
to revenue share gains and slower contraction of ARPU amid
benign competition in Java, our TP will rise to Rp7,800 (+24%
at current prices).
Key Risks:
Benign competition in Java. If Telkomsel takes data-promotions
off and thereby cooling down competition in Java, ISAT could
record faster growth in revenues and higher-than-expected
EBITDA.
Company Background
Telecommunication and information service provider in
Indonesia that provides cellular services (both prepaid and
postpaid), fixed data services or MIDI (Multimedia, Internet &
Data Communication) and fixed voice including fixed wireless
access services.
Leverage & Asset Turnover (x)
Capital Expenditure
ROE (%)
PB Band (x)
Source: Company, DBS Bank
Page 11

Company Guide
Indosat
Key Assumptions
FY Dec 2015A 2016A 2017F 2018F 2019F
Subscribers (m) 66.5 77.8 77.9 81.7 83.4
Blended ARPU (Rp k) 28.7 28.4 27.4 27.0 26.5
EBITDA Margin % 42.2 43.8 43.1 42.4 42.0
Capex (Rp tn) 7.30 7.20 6.70 8.70 7.50
EBITDA (Rpbn) 11,297 12,778 13,079 12,967 13,046
Segmental Breakdown
FY Dec 2015A 2016A 2017F 2018F 2019F
Revenues (Rpbn)
FWA & IDD 1,119 959 940 921 902
Cellular 21,896 24,095 25,003 25,224 25,633
MIDI 3,754 4,131 4,378 4,466 4,555
Others 0.10 0.10 0.10 0.10 0.10
Total 26,769 29,185 30,321 30,611 31,091
Income Statement (Rpbn)
FY Dec 2015A 2016A 2017F 2018F 2019F
Revenue 26,769 29,185 30,321 30,611 31,091
Cost of Goods Sold (24,100) (25,238) (26,076) (26,747) (27,411)
Gross Profit 2,669 3,946 4,246 3,863 3,680
Other Opng (Exp)/Inc 0.0 0.0 0.0 0.0 1.00
Operating Profit 2,669 3,946 4,246 3,863 3,680
Other Non Opg (Exp)/Inc (1,844) (6.3) 0.0 0.0 0.0
Associates & JV Inc 0.0 0.0 0.0 0.0 0.0
Net Interest (Exp)/Inc (2,611) (2,145) (2,112) (1,944) (1,944)
Exceptional Gain/(Loss) 0.0 0.0 0.0 0.0 0.0
Pre-tax Profit (1,786) 1,795 2,134 1,920 1,737
Tax 622 (520) (640) (576) (521)
Minority Interest (147) (171) (188) (206) (227)
Preference Dividend 0.0 0.0 0.0 0.0 1.00
Net Profit (1,310) 1,105 1,306 1,137 989
Net Profit before Except. (1,310) 1,105 1,306 1,137 989
EBITDA 11,297 12,778 13,079 12,967 13,046
Growth
Revenue Gth (%) 11.1 9.0 3.9 1.0 1.6
EBITDA Gth (%) 29.4 13.1 2.4 (0.9) 0.6
Opg Profit Gth (%) 312.6 47.9 7.6 (9.0) (4.7)
Net Profit Gth (Pre-ex) (%) 34.9 nm 18.2 (12.9) (13.1)
Margins & Ratio
Gross Margins (%) 10.0 13.5 14.0 12.6 11.8
Opg Profit Margin (%) 10.0 13.5 14.0 12.6 11.8
Net Profit Margin (%) (4.9) 3.8 4.3 3.7 3.2
ROAE (%) (10.1) 8.6 9.3 7.5 6.2
ROA (%) (2.4) 2.1 2.6 2.2 1.9
ROCE (%) 6.2 6.8 7.6 6.9 6.5
Div Payout Ratio (%) N/A 0.0 0.0 0.0 100.0
Net Interest Cover (x) 1.0 1.8 2.0 2.0 1.9
Source: Company, DBS Bank
Higher capex on spectrum assets
Lower revenue growth forecasts
Page 12

Company Guide
Indosat
Quarterly / Interim Income Statement (Rpbn)
FY Dec 2Q2016 3Q2016 4Q2016 1Q2017 2Q2017
Revenue 7,129 7,583 7,660 7,290 7,823
Cost of Goods Sold (6,271) (6,552) (6,449) (6,458) (6,403)
Gross Profit 858 1,030 1,211 832 1,420
Other Oper. (Exp)/Inc 0.0 0.0 0.0 0.0 0.0
Operating Profit 858 1,030 1,211 832 1,420
Other Non Opg (Exp)/Inc 11.0 134 (239) 5.80 (1.3)
Associates & JV Inc 0.0 0.0 0.0 0.0 0.0
Net Interest (Exp)/Inc (519) (545) (516) (528) (513)
Exceptional Gain/(Loss) 0.0 0.0 0.0 0.0 0.0
Pre-tax Profit 350 619 456 309 906
Tax (104) (170) (130) (97.9) (247)
Minority Interest (35.0) (32.1) (65.4) (37.3) (47.8)
Net Profit 211 417 260 174 610
Net profit bef Except. 211 417 260 174 610
EBITDA 3,080 3,425 3,398 3,100 3,574
Growth
Revenue Gth (%) 4.6 6.4 1.0 (4.8) 7.3
EBITDA Gth (%) 4.0 11.2 (0.8) (8.8) 15.3
Opg Profit Gth (%) 1.2 20.1 17.6 (31.3) 70.7
Net Profit Gth (Pre-ex) (%) (2.9) 97.9 (37.7) (33.2) 250.9
Margins
Gross Margins (%) 12.0 13.6 15.8 11.4 18.2
Opg Profit Margins (%) 12.0 13.6 15.8 11.4 18.2
Net Profit Margins (%) 3.0 5.5 3.4 2.4 7.8
Balance Sheet (Rpbn)
FY Dec 2015A 2016A 2017F 2018F 2019F
Net Fixed Assets 41,822 39,078 36,835 36,279 34,234
Invts in Associates & JVs 0.0 0.0 0.0 0.0 0.0
Other LT Assets 3,648 3,687 3,546 3,405 3,264
Cash & ST Invts 3,623 1,850 2,601 5,819 8,318
Inventory 39.3 79.3 79.3 81.1 83.0
Debtors 2,730 2,707 2,813 2,840 2,884
Other Current Assets 3,526 3,437 3,590 3,664 3,738
Total Assets 55,389 50,839 49,464 52,088 52,521
ST Debt 7,586 8,366 5,000 5,000 5,000
Creditor 764 845 905 926 948
Other Current Liab 11,703 9,875 10,313 11,572 11,337
LT Debt 16,607 15,309 15,309 15,309 15,309
Other LT Liabilities 5,465 2,266 2,266 2,266 2,266
Shareholder’s Equity 12,483 13,350 14,656 15,794 16,213
Minority Interests 781 827 1,015 1,221 1,448
Total Cap. & Liab. 55,389 50,839 49,464 52,088 52,521
Non-Cash Wkg. Capital (6,171) (4,497) (4,736) (5,914) (5,579)
Net Cash/(Debt) (20,569) (21,824) (17,708) (14,489) (11,991)
Debtors Turn (avg days) 32.9 34.0 33.2 33.7 33.6
Creditors Turn (avg days) 17.2 17.9 18.5 18.9 19.0
Inventory Turn (avg days) 1.0 1.3 1.7 1.7 1.7
Asset Turnover (x) 0.5 0.5 0.6 0.6 0.6
Current Ratio (x) 0.5 0.4 0.6 0.7 0.9
Quick Ratio (x) 0.3 0.2 0.3 0.5 0.6
Net Debt/Equity (X) 1.6 1.5 1.1 0.9 0.7
Net Debt/Equity ex MI (X) 1.6 1.6 1.2 0.9 0.7
Capex to Debt (%) 30.4 30.4 33.1 42.8 36.7
Z-Score (X) 1.2 1.5 1.9 2.1 2.2
Source: Company, DBS Bank
Lower interest costs after balance sheet restructure
Page 13
Company Guide
Indosat
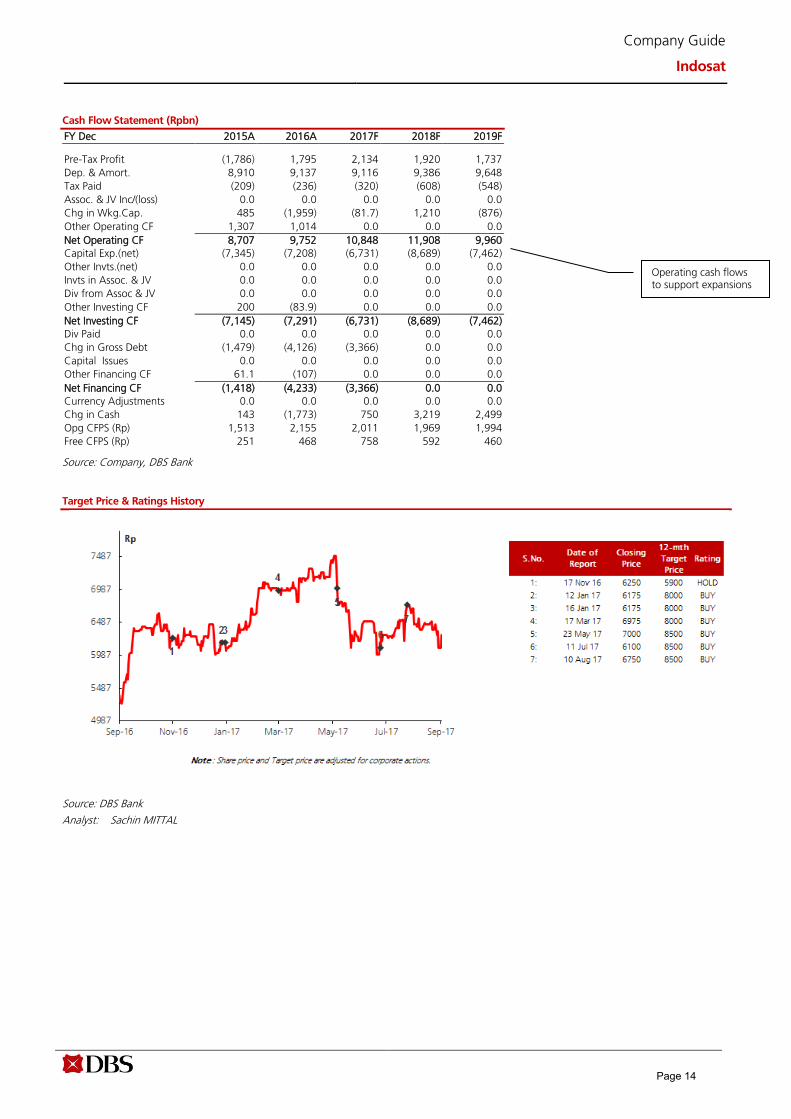
Cash Flow Statement (Rpbn)
FY Dec 2015A 2016A 2017F 2018F 2019F
Pre-Tax Profit (1,786) 1,795 2,134 1,920 1,737
Dep. & Amort. 8,910 9,137 9,116 9,386 9,648
Tax Paid (209) (236) (320) (608) (548)
Assoc. & JV Inc/(loss) 0.0 0.0 0.0 0.0 0.0
Chg in Wkg.Cap. 485 (1,959) (81.7) 1,210 (876)
Other Operating CF 1,307 1,014 0.0 0.0 0.0
Net Operating CF 8,707 9,752 10,848 11,908 9,960
Capital Exp.(net) (7,345) (7,208) (6,731) (8,689) (7,462)
Other Invts.(net) 0.0 0.0 0.0 0.0 0.0
Invts in Assoc. & JV 0.0 0.0 0.0 0.0 0.0
Div from Assoc & JV 0.0 0.0 0.0 0.0 0.0
Other Investing CF 200 (83.9) 0.0 0.0 0.0
Net Investing CF (7,145) (7,291) (6,731) (8,689) (7,462)
Div Paid 0.0 0.0 0.0 0.0 0.0
Chg in Gross Debt (1,479) (4,126) (3,366) 0.0 0.0
Capital Issues 0.0 0.0 0.0 0.0 0.0
Other Financing CF 61.1 (107) 0.0 0.0 0.0
Net Financing CF (1,418) (4,233) (3,366) 0.0 0.0
Currency Adjustments 0.0 0.0 0.0 0.0 0.0
Chg in Cash 143 (1,773) 750 3,219 2,499
Opg CFPS (Rp) 1,513 2,155 2,011 1,969 1,994
Free CFPS (Rp) 251 468 758 592 460
Source: Company, DBS Bank
Target Price & Ratings History
Source: DBS Bank
Analyst: Sachin MITTAL
Operating cash flows to support expansions
Page 14

ed: CK / sa:MA, PY
HOLDLast Traded Price ( 18 Sep 2017): Rp4,710 (JCI : 5,884.60)
Price Target 12-mth: Rp4,800 (2% upside)
Analyst Sachin MITTAL +65 6682 3699 [email protected]
What’s New Telkomsel’s growth to slow sharply in FY17F;
Corporate and Fibre broadband to support fixed
segment revenue
Ex-Java competition from EXCL is a concern
Maintain HOLD with unchanged TP of Rp4,800
Price Relative
Forecasts and Valuation FY Dec (Rp m) 2016A 2017F 2018F 2019F
Revenue 116,333 127,316 136,997 145,442 EBITDA 59,498 66,266 71,560 76,066 Pre-tax Profit 38,189 45,069 48,729 51,284 Net Profit 19,352 23,634 26,816 28,868 Net Pft (Pre Ex.) 19,352 23,634 26,816 28,868 Net Pft Gth (Pre-ex) (%) 24.9 22.1 13.5 7.7 EPS (Rp) 194 237 269 289 EPS Pre Ex. (Rp) 194 237 269 289 EPS Gth Pre Ex (%) 25 22 13 8 Diluted EPS (Rp) 194 237 269 289 Net DPS (Rp) 137 166 188 202 BV Per Share (Rp) 845 890 934 972 PE (X) 24.3 19.9 17.5 16.3 PE Pre Ex. (X) 24.3 19.9 17.5 16.3 P/Cash Flow (X) 10.0 9.6 7.8 6.9 EV/EBITDA (X) 8.3 7.6 7.1 6.7 Net Div Yield (%) 2.9 3.5 4.0 4.3 P/Book Value (X) 5.6 5.3 5.0 4.8 Net Debt/Equity (X) 0.0 0.0 CASH CASH ROAE (%) 24.3 27.3 29.5 30.4
Earnings Rev (%): 0 0 0 Consensus EPS (Rp): 235 265 297 Other Broker Recs: B: 25 S: 0 H: 9
Source of all data on this page: Company, DBS Bank, Bloomberg Finance L.P
Premium valuation suggests high
expectations Premium valuation warrants high growth from Non-Telkomsel
business. We project Telkomsel revenue to grow below 7%
(versus 14% last year) implying that Non-Telkomsel revenue
needs to grow 20% in FY17F (versus 12% last year) to meet
consensus expectations. TLKM’s rich multiple of 9.1x adjusted
FY18F EV/EBITDA does not leave any room for disappointment
Where we differ? We see some room for disappointment to
ours and consensus’ FY17F/18F EBITDA forecasts. Voice & SMS
revenue of Telkomsel grew 4.5% in FY16 but is likely to decline
from FY17F onwards due to rising competition outside Java and
higher smartphone penetration. While 1H17 Non-Telkomsel
revenue jumped c.24% y-o-y to Rp19tn, we are not sure about
the sustainability of such growth. The growth mainly came from
sale of customer premises equipment for ICT solutions.
Potential catalyst. We see a potentially sharp slowdown in the
Telkomsel business in 2H17F with rising competition and
smartphone penetration approaching 30% plus in the non-Java
region. As Telkomsel generates 63% of its revenues from voice
and SMS services (vs 33% for EXCL and 43% for ISAT), it is
likely to be impacted more over the next 2-3 years.
Valuation:
Maintain HOLD. The counter is trading at a relatively high
adjusted Fy18F EV/EBITDA of 9.1x, with EBITDA CAGR of 7%
over FY17-19. Our DCF-based (WACC 9.1%, terminal growth
1%) TP is Rp4,800.
Key Risks to Our View:
Disruption of its strong presence outside Java. We have not
factored any network sharing between EXCL and ISAT in our
model. Any network sharing arrangement could hurt TLKM
quite badly outside the Java region where people do not have
much choice other than Telkomsel currently.
At A Glance Issued Capital (m shrs) 100,800 Mkt. Cap (Rpbn/US$m) 474,768 / 35,775 Major Shareholders (%) Govt. of Indonesia (%) 51.0
Free Float (%) 49.0 3m Avg. Daily Val (US$m) 24.0 ICB Industry : Telecommunications / Telecommunications
DBS Group Research . Equity 20 Sep 2017
Indonesia Company Guide
Telekomunikasi Indonesia Version 6 | Bloomberg: TLKM IJ | Reuters: TLKM.JK Refer to important disclosures at the end of this report
Page 15

Company Guide
Telekomunikasi Indonesia
CRITICAL DATA POINTS TO WATCH
Critical Factors
Telkomsel growth hampered by legacy decline. Telkomsel was
the key growth driver over the past few years with 14% top line
growth in FY16. Telkomsel has been able to avoid decreases in
its legacy services due to its presence outside Java. However, we
believe the industry dynamics are at a tipping point which
would drastically reduce Telkomsel’s growth in the immediate
future. The company is already witnessing steep drops in SMS
revenues while voice usage levels are also in steady decline.
Voice revenues, which have been sustained through bundling
and cluster base pricing, are unlikely to sustain at these levels in
our view, due to increasing competition outside Java and overall
drop in voice demand. As a result, we expect the Indonesian
mobile segment to expand at 6.5%, despite the strong mobile
data growth, down from 11% last year. Telkomsel generates
66% of its revenues from legacy services, compared to 37% for
EXCL and 48% for ISAT. Hence, we do not expect Telkomsel to
outperform the market like it did in previous years, despite its
strong market position.
Corporate segment to offset Telkomsel slowdown. We expect
TLKM’s corporate segment growth to remain strong in FY17
with higher revenues being booked through ICT solutions and
managed services. The corporate segment saw its external
revenues increase by 15% in FY16 while the segment’s higher
ICT solution due to increases due to a revenue jump from
Customer Premise Equipment revenue was the key contributor
to the 23% q-o-q bump in 1Q17 TLKM fixed segment revenues.
IndiHome will support overall growth, but still early days.
IndiHome added ~150k subscribers in 1Q17 though a majority
of the subscribers were upgrading from their existing fixed
broadband packages. Management expects the IndiHome
uptake to accelerate as the year progresses which should
support fixed home segment (voice, broadband, pay TV)
growth. With voice services contracting, we expect the
segment’s growth to add ~Rp1.5tr to the topline, or around
~1% to the overall TLKM’s revenue in FY17.
GSM Subscribers (m)
Data revenue
EBITDA Margin %
Net Capex (Rp tr)
EBITDA (Rptn)
Source: Company, DBS Bank
Page 16

Company Guide
Telekomunikasi Indonesia
Appendix 1: A look at company's listed history – what drives
its share price?
Market share a critical factor in share price movements for Indonesian telcos. In our critical factor analysis we have over the
past ~10 years, we have seen share price movements to follow mobile revenue share changes of telcos. This has held true for all telcos including TLKM, which derives a majority of its revenues from Telkomsel.
TLKM share price movement with Telkomsel revenue share changes
Source: Reuters, DBS Bank
50%
51%
52%
53%
54%
55%
56%
57%
58%
59%
40
60
80
100
120
140
160
Dec
06
Dec
07
Dec
08
Dec
09
Dec
10
Dec
11
Dec
12
Dec
13
Dec
14
PT Telkom Reuters Indo. Telecom Index TLKM Mkt Share
Page 17

Company Guide
Telekomunikasi Indonesia
Balance Sheet:
No exposure to foreign debt. TLKM has the strongest balance
sheet among peers because of zero exposure to foreign debt,
and the lowest gross debt to equity ratio of 0.25x. The low
leverage also means TLKM has better flexibility to acquire digital
or other businesses. TLKM's capex will be sustainable at 23-
25% of revenue, at Rp31tr in FY17. Capex will be focused on
mobile and fixed broadband investments.
Share Price Drivers:
Limited upside despite fixed line growth. Telkomsel which
accounts for ~75% of topline is under threat from voice and
SMS cannibalisation and an aggressive EXCL. The counter is
trading at a relatively high adjusted EV/EBITDA of 9.7x with an
average EBITDA CAGR of 8% over FY16-FY19. Our DCF-based
(WACC 9.15%, Terminal growth 1%) TP of Rp4,800 indicates
3% potential upside with c.3% yield.
Bear-case valuation. TLKM were to see FY16-19F EBITDA grow
at 5% versus our base case CAGR of 8% due to slower fixed
line growth coupled with 5% EBITDA CAGR at Telkomsel, our
TP will drop to Rp4100.
Bull-case valuation. If TLKM were to see FY16-19F EBITDA grow
at 11% versus our base case CAGR of 8% due to faster fixed
line growth coupled with 7% EBITDA CAGR at Telkomsel, our
TP will rise to Rp5500.
Key Risks:
EXCL’s cannot gain traction outside Java. If EXCL is not able to
gain traction outside Java, Telkomsel could potentially maintain
its voice revenue growth.
Slowdown in corporate revenues. Despite strong growth in
corporate revenues, the segment relies on new contracts in the
areas of ICT solutions and manage services. A slowdown in
new orders could potentially slow down TLKM
Company Background
TLKM Indonesia is the largest telecommunication and network
provider in Indonesia. The company offers a wide range of
network and telecommunication services, including fixed-line
connection services, cellular services, network and
interconnection services, as well as Internet and data
communication services. TLKM also operates multimedia
businesses such as content and applications, completing its
business portfolio that spans Telecommunication, Information,
Media, Edutainment and Services (TIMES).
Leverage & Asset Turnover (x)
Capital Expenditure
ROE (%)
Forward PE Band (x)
PB Band (x)
Source: Company, DBS Bank
Page 18

Company Guide
Telekomunikasi Indonesia
Key Assumptions
FY Dec 2015A 2016A 2017F 2018F 2019F
GSM Subscribers (m) 153 175 182 189 197
Data revenue 47.8 59.0 69.6 79.1 87.6
EBITDA Margin % 50.2 51.1 52.0 52.2 52.3
Net Capex (Rp tr) 27.4 29.4 30.6 31.5 31.7
EBITDA (Rptn) 51.4 59.5 66.3 71.6 76.1
Segmental Breakdown
FY Dec 2015A 2016A 2017F 2018F 2019F
Revenues (Rpbn)
Fixed Line 7,833 7,542 7,240 6,951 6,673
Wireless Voice 37,285 38,497 37,727 36,973 36,233
Interconnection 4,290 4,151 4,027 3,906 3,789
Data/Internet & SMS 47,820 58,971 69,644 79,098 87,562
Others 5,242 7,172 8,679 10,071 11,186
Total 102,470 116,333 127,316 136,997 145,442
Income Statement (Rpbn)
FY Dec 2015A 2016A 2017F 2018F 2019F
Revenue 102,470 116,333 127,316 136,997 145,442
Cost of Goods Sold (51,055) (56,835) (61,050) (65,437) (69,376)
Gross Profit 51,415 59,498 66,266 71,560 76,066
Other Opng (Exp)/Inc (18,534) (18,532) (20,257) (21,980) (23,971)
Operating Profit 32,881 40,966 46,009 49,580 52,094
Other Non Opg (Exp)/Inc (463) (1,771) 0.0 0.0 0.0
Associates & JV Inc (2.0) 88.0 96.8 101 105
Net Interest (Exp)/Inc (1,074) (1,094) (1,037) (953) (915)
Exceptional Gain/(Loss) 0.0 0.0 0.0 0.0 0.0
Pre-tax Profit 31,342 38,189 45,069 48,729 51,284
Tax (8,025) (9,017) (10,817) (11,695) (12,308)
Minority Interest (7,828) (9,820) (10,618) (10,218) (10,108)
Preference Dividend 0.0 0.0 0.0 0.0 0.0
Net Profit 15,489 19,352 23,634 26,816 28,868
Net Profit before Except. 15,489 19,352 23,634 26,816 28,868
EBITDA 51,415 59,498 66,266 71,560 76,066
Growth
Revenue Gth (%) 14.2 13.5 9.4 7.6 6.2
EBITDA Gth (%) 12.6 15.7 11.4 8.0 6.3
Opg Profit Gth (%) 15.2 24.6 12.3 7.8 5.1
Net Profit Gth (Pre-ex) (%) 7.0 24.9 22.1 13.5 7.7
Margins & Ratio
Gross Margins (%) 50.2 51.1 52.0 52.2 52.3
Opg Profit Margin (%) 32.1 35.2 36.1 36.2 35.8
Net Profit Margin (%) 15.1 16.6 18.6 19.6 19.8
ROAE (%) 21.7 24.3 27.3 29.5 30.4
ROA (%) 10.1 11.2 12.6 13.2 13.1
ROCE (%) 19.4 22.3 22.9 22.5 21.8
Div Payout Ratio (%) 61.0 70.5 70.0 70.0 70.0
Net Interest Cover (x) 30.6 37.4 44.4 52.1 56.9
Source: Company, DBS Bank
Voice starting to decline from FY17
Topline revised upward due to fixed-line business
Page 19
Company Guide
Telekomunikasi Indonesia
Quarterly / Interim Income Statement (Rpbn)
FY Dec 1Q2016 2Q2016 3Q2016 4Q2016 1Q2017
Revenue 27,542 28,912 29,734 30,145 31,022
Cost of Goods Sold (12,887) (14,772) (14,151) (15,025) (14,213)
Gross Profit 14,655 14,140 15,583 15,120 16,809
Other Oper. (Exp)/Inc (4,405) (4,334) (4,618) (5,175) (4,773)
Operating Profit 10,250 9,806 10,965 9,945 12,036
Other Non Opg (Exp)/Inc (663) 520 (557) (983) 472
Associates & JV Inc 0.0 0.0 0.0 0.0 0.0
Net Interest (Exp)/Inc (271) (144) (289) (390) (184)
Exceptional Gain/(Loss) 0.0 0.0 0.0 0.0 0.0
Pre-tax Profit 9,316 10,182 10,119 8,572 12,324
Tax (2,423) (2,412) (2,613) (1,569) (2,948)
Minority Interest (2,307) (2,430) (2,700) (2,383) (2,688)
Net Profit 4,586 5,340 4,806 4,620 6,688
Net profit bef Except. 4,586 5,340 4,806 4,620 6,688
EBITDA 14,655 14,140 15,583 15,120 16,809
Growth
Revenue Gth (%) 3.0 5.0 2.8 1.4 2.9
EBITDA Gth (%) 2.2 (3.5) 10.2 (3.0) 11.2
Opg Profit Gth (%) 10.1 (4.3) 11.8 (9.3) 21.0
Net Profit Gth (Pre-ex) (%) 16.3 16.4 (10.0) (3.9) 44.8
Margins
Gross Margins (%) 53.2 48.9 52.4 50.2 54.2
Opg Profit Margins (%) 37.2 33.9 36.9 33.0 38.8
Net Profit Margins (%) 16.7 18.5 16.2 15.3 21.6
Balance Sheet (Rpbn)
FY Dec 2015A 2016A 2017F 2018F 2019F
Net Fixed Assets 103,700 114,498 124,882 134,412 142,147
Invts in Associates & JVs 0.0 0.0 0.0 0.0 0.0
Other LT Assets 14,561 17,412 17,469 17,570 17,674
Cash & ST Invts 30,935 31,238 30,195 35,871 47,181
Inventory 528 584 754 809 857
Debtors 7,517 7,363 9,247 9,950 7,272
Other Current Assets 8,932 8,516 12,282 12,748 13,164
Total Assets 166,173 179,611 194,830 211,359 228,295
ST Debt 4,444 5,432 5,877 5,877 5,877
Creditor 13,994 13,518 17,193 18,428 20,813
Other Current Liab 16,975 20,812 17,277 18,445 19,542
LT Debt 30,168 26,367 25,922 25,477 25,032
Other LT Liabilities 7,164 7,938 7,938 7,938 7,938
Shareholder’s Equity 75,136 84,384 88,845 93,198 96,989
Minority Interests 18,292 21,160 31,778 41,996 52,104
Total Cap. & Liab. 166,173 179,611 194,830 211,359 228,295
Non-Cash Wkg. Capital (13,992) (17,867) (12,186) (13,366) (19,061)
Net Cash/(Debt) (3,677) (561) (1,604) 4,517 16,271
Debtors Turn (avg days) 24.9 23.3 23.8 25.6 21.6
Creditors Turn (avg days) 144.9 131.1 137.4 149.6 157.7
Inventory Turn (avg days) 5.6 5.3 6.0 6.6 6.7
Asset Turnover (x) 0.7 0.7 0.7 0.7 0.7
Current Ratio (x) 1.4 1.2 1.3 1.4 1.5
Quick Ratio (x) 1.1 1.0 1.0 1.1 1.2
Net Debt/Equity (X) 0.0 0.0 0.0 CASH CASH
Net Debt/Equity ex MI (X) 0.0 0.0 0.0 CASH CASH
Capex to Debt (%) 79.2 92.2 96.4 100.5 102.6
Z-Score (X) 5.7 5.8 5.8 5.7 5.5
Source: Company, DBS Bank
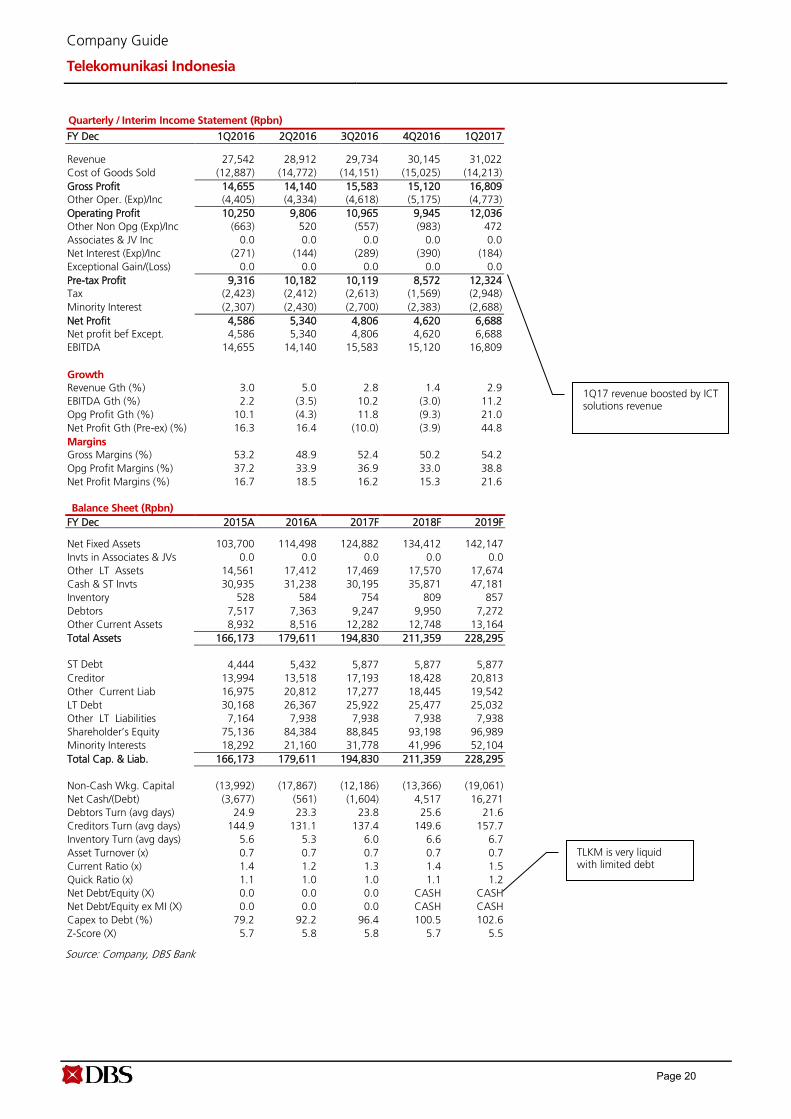
1Q17 revenue boosted by ICT solutions revenue
TLKM is very liquid with limited debt
Page 20
Company Guide
Telekomunikasi Indonesia
Cash Flow Statement (Rpbn)
FY Dec 2015A 2016A 2017F 2018F 2019F
Pre-Tax Profit 31,342 38,189 45,069 48,729 51,284
Dep. & Amort. 18,534 18,532 20,257 21,980 23,971
Tax Paid (9,509) (14,000) (11,067) (11,475) (12,155)
Assoc. & JV Inc/(loss) 2.00 (88.0) (96.8) (101) (105)
Chg in Wkg.Cap. 3,811 7,297 (5,432) 961 5,541
Other Operating CF (511) (2,699) 0.0 0.0 0.0
Net Operating CF 43,669 47,231 48,731 60,094 68,537
Capital Exp.(net) (27,425) (29,330) (30,641) (31,509) (31,706)
Other Invts.(net) (61.0) 1,307 (1,307) 0.0 0.0
Invts in Assoc. & JV 0.0 0.0 0.0 0.0 0.0
Div from Assoc & JV 0.0 0.0 0.0 0.0 0.0
Other Investing CF 65.0 466 0.0 0.0 0.0
Net Investing CF (27,421) (27,557) (31,948) (31,509) (31,706)
Div Paid (10,427) (10,555) (19,173) (22,463) (25,077)
Chg in Gross Debt 11,778 (3,734) 0.0 (445) (445)
Capital Issues 68.0 3,259 0.0 0.0 0.0
Other Financing CF (7,222) (6,994) 0.0 0.0 0.0
Net Financing CF (5,803) (18,024) (19,173) (22,908) (25,522)
Currency Adjustments 0.0 0.0 0.0 0.0 0.0
Chg in Cash 10,445 1,650 (2,390) 5,676 11,309
Opg CFPS (Rp) 399 400 543 592 631
Free CFPS (Rp) 163 179 181 286 369
Source: Company, DBS Bank
Target Price & Ratings History
Source: DBS Bank
Analyst: Sachin MITTAL
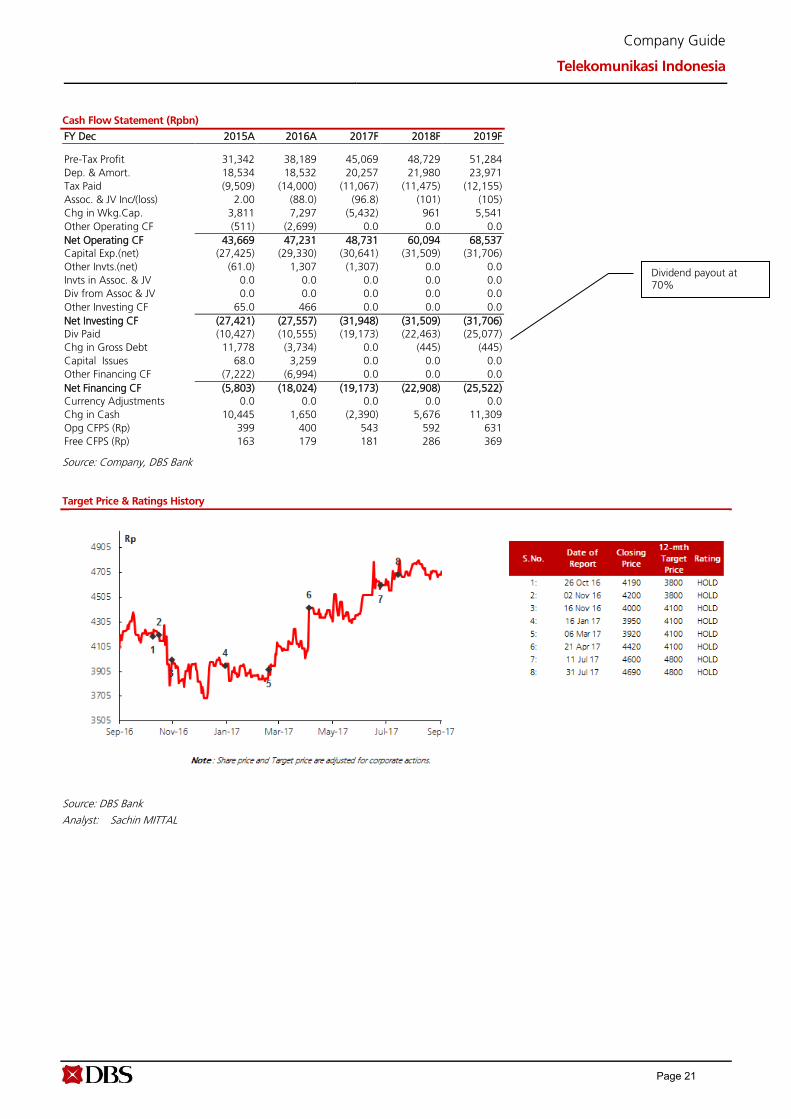
Dividend payout at 70%
Page 21
ed: CK / sa:MA, PY
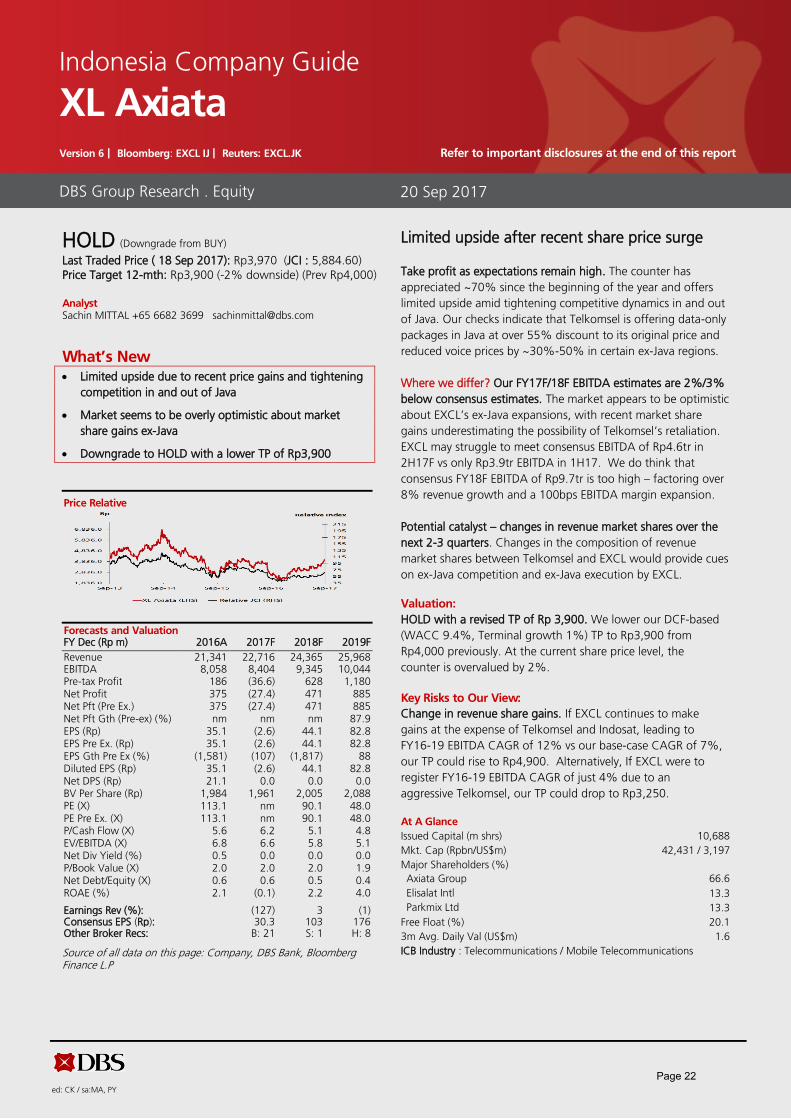
HOLD (Downgrade from BUY)
Last Traded Price ( 18 Sep 2017): Rp3,970 (JCI : 5,884.60)
Price Target 12-mth: Rp3,900 (-2% downside) (Prev Rp4,000)
Analyst Sachin MITTAL +65 6682 3699 [email protected]
What’s New Limited upside due to recent price gains and tightening
competition in and out of Java
Market seems to be overly optimistic about market
share gains ex-Java
Downgrade to HOLD with a lower TP of Rp3,900
Price Relative
Forecasts and Valuation FY Dec (Rp m) 2016A 2017F 2018F 2019F
Revenue 21,341 22,716 24,365 25,968 EBITDA 8,058 8,404 9,345 10,044 Pre-tax Profit 186 (36.6) 628 1,180 Net Profit 375 (27.4) 471 885 Net Pft (Pre Ex.) 375 (27.4) 471 885 Net Pft Gth (Pre-ex) (%) nm nm nm 87.9 EPS (Rp) 35.1 (2.6) 44.1 82.8 EPS Pre Ex. (Rp) 35.1 (2.6) 44.1 82.8 EPS Gth Pre Ex (%) (1,581) (107) (1,817) 88 Diluted EPS (Rp) 35.1 (2.6) 44.1 82.8 Net DPS (Rp) 21.1 0.0 0.0 0.0 BV Per Share (Rp) 1,984 1,961 2,005 2,088 PE (X) 113.1 nm 90.1 48.0 PE Pre Ex. (X) 113.1 nm 90.1 48.0 P/Cash Flow (X) 5.6 6.2 5.1 4.8 EV/EBITDA (X) 6.8 6.6 5.8 5.1 Net Div Yield (%) 0.5 0.0 0.0 0.0 P/Book Value (X) 2.0 2.0 2.0 1.9 Net Debt/Equity (X) 0.6 0.6 0.5 0.4 ROAE (%) 2.1 (0.1) 2.2 4.0
Earnings Rev (%): (127) 3 (1) Consensus EPS (Rp): 30.3 103 176 Other Broker Recs: B: 21 S: 1 H: 8
Source of all data on this page: Company, DBS Bank, Bloomberg Finance L.P
Limited upside after recent share price surge
Take profit as expectations remain high. The counter has
appreciated ~70% since the beginning of the year and offers
limited upside amid tightening competitive dynamics in and out
of Java. Our checks indicate that Telkomsel is offering data-only
packages in Java at over 55% discount to its original price and
reduced voice prices by ~30%-50% in certain ex-Java regions.
Where we differ? Our FY17F/18F EBITDA estimates are 2%/3%
below consensus estimates. The market appears to be optimistic
about EXCL’s ex-Java expansions, with recent market share
gains underestimating the possibility of Telkomsel’s retaliation.
EXCL may struggle to meet consensus EBITDA of Rp4.6tr in
2H17F vs only Rp3.9tr EBITDA in 1H17. We do think that
consensus FY18F EBITDA of Rp9.7tr is too high – factoring over
8% revenue growth and a 100bps EBITDA margin expansion.
Potential catalyst – changes in revenue market shares over the
next 2-3 quarters. Changes in the composition of revenue
market shares between Telkomsel and EXCL would provide cues
on ex-Java competition and ex-Java execution by EXCL.
Valuation:
HOLD with a revised TP of Rp 3,900. We lower our DCF-based
(WACC 9.4%, Terminal growth 1%) TP to Rp3,900 from
Rp4,000 previously. At the current share price level, the
counter is overvalued by 2%.
Key Risks to Our View:
Change in revenue share gains. If EXCL continues to make
gains at the expense of Telkomsel and Indosat, leading to
FY16-19 EBITDA CAGR of 12% vs our base-case CAGR of 7%,
our TP could rise to Rp4,900. Alternatively, If EXCL were to
register FY16-19 EBITDA CAGR of just 4% due to an
aggressive Telkomsel, our TP could drop to Rp3,250.
At A Glance
Issued Capital (m shrs) 10,688
Mkt. Cap (Rpbn/US$m) 42,431 / 3,197
Major Shareholders (%)
Axiata Group 66.6
Elisalat Intl 13.3
Parkmix Ltd 13.3
Free Float (%) 20.1
3m Avg. Daily Val (US$m) 1.6
ICB Industry : Telecommunications / Mobile Telecommunications
DBS Group Research . Equity 20 Sep 2017
Indonesia Company Guide
XL Axiata Version 6 | Bloomberg: EXCL IJ | Reuters: EXCL.JK Refer to important disclosures at the end of this report
Page 22

Company Guide
XL Axiata
CRITICAL DATA POINTS TO WATCH
Critical Factors
Revenue share gains likely to halt as Telkomsel fires back. EXCL
made steady gains in market share over the past two quarters,
snatching nearly 800bps of revenue market share from
Telkomsel. However, our industry checks indicate that Telkomsel
is retaliating against EXCL outside Java, slashing voice prices by
~30%-60% to oust EXCL as the cheaper provider of legacy
services outside Java. Intensifying competition on the data front
in Java, which remains a stronghold of EXCL, could also lead to
an increase in subscriber churn. This could reduce the pace of
future revenue share gains by the operator. Accordingly, we
revise down our FY17 revenue growth forecasts for EXCL to
6.4% from 8.6% and curtail our EBITDA growth forecasts for
FY17 to 5.7% from 8.1%.
Declining data yields and a data savvy subscriber base may
reduce the pace of growth in data revenues. EXCL boasts a
data-savvy subscriber base with a subscriber on average using
~1.9GB of data per month vs. 900MB at ISAT and Telkomsel.
Data usage also grew at 140% from 2Q16 to 2Q17 vs. ~100%
growth in the industry. While a data heavy subscriber base
cushions potential declines in legacy revenues, EXCL may find it
difficult to post above-industry average growth in revenues if
data yields continue to decline. With data usage already at high
levels, subscribers may remain relatively inelastic to changes in
data pricing, thereby limiting usage growth. Limited usage
growth combined with declining data yields could reduce the
pace of growth in data revenues of EXCL in the future.
Data usage already remains high
Source: Company, DBS Bank
Improving EBITDA margin in FY18. Tower rental renewals, lower
expenses from the managed services contract and stable
interconnection costs are expected to improve EBITDA margin in
FY18. EXCL is expecting up to 50% savings on each tower lease
renewal, with a large chunk of towers being renewed over the
next three years. Managed service contract expenses are also
expected to come down due to lower revenue-sharing going
forward. In addition, interconnection costs are expected to
remain stable despite expansion outside Java due to higher VoIP
use. We believe EXCL would be able to expand its FY18 EBITDA
margin by 60bps from FY16 levels.
Subscribers (m)
ARPU (Rp K)
EBITDA margins (%)
Capex (Rp tn)
EBITDA (Rpbn)
Source: Company, DBS Bank
Page 23

Company Guide
XL Axiata
Appendix 1: A look at Company's listed history – what drives its share price?
Revenue share is a critical factor in share price movements for XL. In our critical factor analysis over the past ~10 years, we have seen share price movements to follow mobile market share changes of telcos. This was clearly observable when revenue share dropped in FY15.
Source : Reuters, DBS Bank
15%
16%
17%
18%
19%
20%
21%
22%
23%
24%
25%
30
80
130
180
230
280
330
Dec 06 Dec 07 Dec 08 Dec 09 Dec 10 Dec 11 Dec 12 Dec 13 Dec 14
XL Axiata Reuters Indo. Telecom Index XL Mkt Share
Page 24
Company Guide
XL Axiata
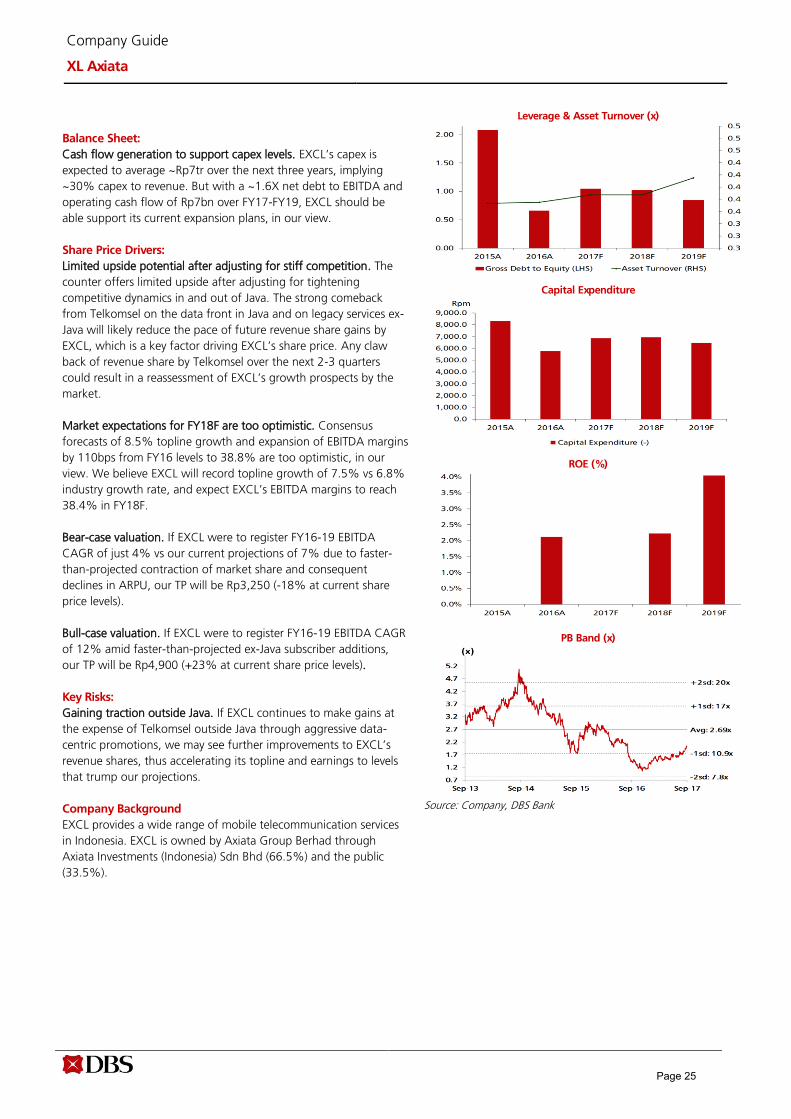
Balance Sheet:
Cash flow generation to support capex levels. EXCL’s capex is
expected to average ~Rp7tr over the next three years, implying
~30% capex to revenue. But with a ~1.6X net debt to EBITDA and
operating cash flow of Rp7bn over FY17-FY19, EXCL should be
able support its current expansion plans, in our view.
Share Price Drivers:
Limited upside potential after adjusting for stiff competition. The
counter offers limited upside after adjusting for tightening
competitive dynamics in and out of Java. The strong comeback
from Telkomsel on the data front in Java and on legacy services ex-
Java will likely reduce the pace of future revenue share gains by
EXCL, which is a key factor driving EXCL’s share price. Any claw
back of revenue share by Telkomsel over the next 2-3 quarters
could result in a reassessment of EXCL’s growth prospects by the
market.
Market expectations for FY18F are too optimistic. Consensus
forecasts of 8.5% topline growth and expansion of EBITDA margins
by 110bps from FY16 levels to 38.8% are too optimistic, in our
view. We believe EXCL will record topline growth of 7.5% vs 6.8%
industry growth rate, and expect EXCL’s EBITDA margins to reach
38.4% in FY18F.
Bear-case valuation. If EXCL were to register FY16-19 EBITDA
CAGR of just 4% vs our current projections of 7% due to faster-
than-projected contraction of market share and consequent
declines in ARPU, our TP will be Rp3,250 (-18% at current share
price levels).
Bull-case valuation. If EXCL were to register FY16-19 EBITDA CAGR
of 12% amid faster-than-projected ex-Java subscriber additions,
our TP will be Rp4,900 (+23% at current share price levels).
Key Risks:
Gaining traction outside Java. If EXCL continues to make gains at
the expense of Telkomsel outside Java through aggressive data-
centric promotions, we may see further improvements to EXCL’s
revenue shares, thus accelerating its topline and earnings to levels
that trump our projections.
Company Background
EXCL provides a wide range of mobile telecommunication services
in Indonesia. EXCL is owned by Axiata Group Berhad through
Axiata Investments (Indonesia) Sdn Bhd (66.5%) and the public
(33.5%).
Leverage & Asset Turnover (x)
Capital Expenditure
ROE (%)
PB Band (x)
Source: Company, DBS Bank
Page 25

Company Guide
XL Axiata
Key Assumptions
FY Dec 2015A 2016A 2017F 2018F 2019F
Subscribers (m) 41.5 45.9 56.1 60.3 64.5
ARPU (Rp K) 34.0 35.0 34.2 34.8 34.8
EBITDA margins (%) 36.7 37.8 37.0 38.4 38.7
Capex (Rp tn) 8.30 5.80 6.90 6.90 6.40
EBITDA (Rpbn) 8,393 8,058 8,404 9,345 10,044
Segmental Breakdown
FY Dec 2015A 2016A 2017F 2018F 2019F Revenues (Rpbn)
GSM Revenue 19,454 18,588 18,866 20,378 21,840
GSM interconnect 2,308 1,744 3,000 3,120 3,245
Other GSM 0.0 0.0 0.0 0.0 0.0
Others 1,115 1,009 850 867 883
Total 22,876 21,341 22,716 24,365 25,968
Income Statement (Rpbn)
FY Dec 2015A 2016A 2017F 2018F 2019F
Revenue 22,876 21,341 22,716 24,365 25,968
Cost of Goods Sold (2,321) (1,926) (2,953) (2,924) (3,064)
Gross Profit 20,555 19,415 19,763 21,441 22,904
Other Opng (Exp)/Inc (19,298) (19,403) (18,200) (19,324) (20,445)
Operating Profit 1,258 12.2 1,562 2,117 2,459
Other Non Opg (Exp)/Inc (808) 1,706 0.0 0.0 0.0
Associates & JV Inc 0.0 0.0 0.0 0.0 0.0
Net Interest (Exp)/Inc (1,080) (1,533) (1,599) (1,489) (1,279)
Exceptional Gain/(Loss) 0.0 0.0 0.0 0.0 0.0
Pre-tax Profit (631) 186 (36.6) 628 1,180
Tax 605 190 9.10 (157) (295)
Minority Interest 0.0 0.0 0.0 0.0 0.0
Preference Dividend 0.0 0.0 0.0 0.0 0.0
Net Profit (25.3) 375 (27.4) 471 885
Net Profit before Except. (25.3) 375 (27.4) 471 885
EBITDA 8,393 8,058 8,404 9,345 10,044
Growth
Revenue Gth (%) (1.0) (6.7) 6.4 7.3 6.6
EBITDA Gth (%) 2.8 (4.0) 4.3 11.2 7.5
Opg Profit Gth (%) (6.1) (99.0) 12,683.1 35.5 16.1
Net Profit Gth (Pre-ex) (%) 97.9 nm nm nm 87.9
Margins & Ratio
Gross Margins (%) 89.9 91.0 87.0 88.0 88.2
Opg Profit Margin (%) 5.5 0.1 6.9 8.7 9.5
Net Profit Margin (%) (0.1) 1.8 (0.1) 1.9 3.4
ROAE (%) (0.2) 2.1 (0.1) 2.2 4.0
ROA (%) 0.0 0.7 0.0 0.7 1.4
ROCE (%) 2.5 0.0 3.2 3.0 3.6
Div Payout Ratio (%) N/A 60.0 N/A 0.0 0.0
Net Interest Cover (x) 1.2 0.0 1.0 1.4 1.9
Source: Company, DBS Bank
Higher capex on spectrum assets
Revenue growth to slow down amid tightening ex-Java competition
Page 26

Company Guide
XL Axiata
Quarterly / Interim Income Statement (Rpbn)
FY Dec 2Q2016 3Q2016 4Q2016 1Q2017 2Q2017
Revenue 5,237 5,229 5,258 5,266 5,668
Cost of Goods Sold (418) (526) (578) (659) (630)
Gross Profit 4,820 4,704 4,680 4,607 5,037
Other Oper. (Exp)/Inc (4,844) (4,524) (5,143) (4,438) (4,667)
Operating Profit (24.2) 179 (463) 169 371
Other Non Opg (Exp)/Inc 413 108 718 102 78.7
Associates & JV Inc
Net Interest (Exp)/Inc (415) (378) (195) (344) (351)
Exceptional Gain/(Loss) 0.0 0.0 0.0 0.0 0.0
Pre-tax Profit (26.1) (90.6) 60.8 (72.6) 98.3
Tax 81.6 25.6 155 119 (1.6)
Minority Interest 0.0 0.0 0.0 0.0 0.0
Net Profit 55.5 (65.0) 216 46.5 96.6
Net profit bef Except. 55.5 (65.0) 216 46.5 96.6
EBITDA 2,065 1,979 1,823 1,848 2,073
Growth
Revenue Gth (%) (6.7) (0.2) 0.6 0.1 7.6
EBITDA Gth (%) (5.8) (4.2) (7.9) 1.4 12.1
Opg Profit Gth (%) (107.6) (841.7) (358.0) (136.6) 119.3
Net Profit Gth (Pre-ex) (%) (67.2) (217.2) (431.9) (78.5) 107.8
Margins
Gross Margins (%) 92.0 89.9 89.0 87.5 88.9
Opg Profit Margins (%) (0.5) 3.4 (8.8) 3.2 6.5
Net Profit Margins (%) 1.1 (1.2) 4.1 0.9 1.7
Balance Sheet (Rpbn)
FY Dec 2015A 2016A 2017F 2018F 2019F
Net Fixed Assets 33,427 33,183 33,201 32,919 31,774
Invts in Associates & JVs 0.0 0.0 0.0 0.0 0.0
Other LT Assets 15,266 14,907 14,907 14,907 14,907
Cash & ST Invts 3,312 1,400 9,087 10,394 9,707
Inventory 79.0 161 41.3 44.0 46.7
Debtors 898 637 545 585 623
Other Current Assets 5,863 4,609 4,609 4,609 4,609
Total Assets 58,844 54,896 62,391 63,458 61,667
ST Debt 4,290 3,973 3,973 3,973 3,973
Creditor 5,257 6,503 5,679 6,048 6,430
Other Current Liab 6,201 4,002 4,597 4,823 4,766
LT Debt 25,054 10,024 18,000 18,000 15,000
Other LT Liabilities 3,950 9,186 9,186 9,186 9,186
Shareholder’s Equity 14,092 21,209 20,957 21,428 22,312
Minority Interests 0.0 0.0 0.0 0.0 0.0
Total Cap. & Liab. 58,844 54,896 62,391 63,458 61,667
Non-Cash Wkg. Capital (4,619) (5,098) (5,080) (5,633) (5,916)
Net Cash/(Debt) (26,032) (12,597) (12,885) (11,578) (9,266)
Debtors Turn (avg days) 16.2 13.1 9.5 8.5 8.5
Creditors Turn (avg days) (367.8) (350.7) (571.7) (497.3) (503.7)
Inventory Turn (avg days) (5.9) (7.2) (9.5) (3.6) (3.7)
Asset Turnover (x) 0.4 0.4 0.4 0.4 0.4
Current Ratio (x) 0.6 0.5 1.0 1.1 1.0
Quick Ratio (x) 0.3 0.1 0.7 0.7 0.7
Net Debt/Equity (X) 1.8 0.6 0.6 0.5 0.4
Net Debt/Equity ex MI (X) 1.8 0.6 0.6 0.5 0.4
Capex to Debt (%) 28.3 41.2 31.2 31.6 33.9
Z-Score (X) 1.0 1.1 1.2 1.2 1.3
Source: Company, DBS Bank
Declining network costs support growth in EBITDA
Page 27

Company Guide
XL Axiata
Cash Flow Statement (Rpbn)
FY Dec 2015A 2016A 2017F 2018F 2019F
Pre-Tax Profit (631) 186 (36.6) 628 1,180
Dep. & Amort. 7,135 8,046 6,842 7,228 7,585
Tax Paid (15.5) 361 (167) (73.9) (226)
Assoc. & JV Inc/(loss) 0.0 0.0 0.0 0.0 0.0
Chg in Wkg.Cap. 513 (1,001) 158 470 214
Other Operating CF 0.0 0.0 0.0 0.0 0.0
Net Operating CF 7,002 7,591 6,797 8,252 8,753
Capital Exp.(net) (8,317) (5,762) (6,860) (6,945) (6,440)
Other Invts.(net) 0.0 1,054 0.0 0.0 0.0
Invts in Assoc. & JV 0.0 0.0 0.0 0.0 0.0
Div from Assoc & JV 0.0 0.0 0.0 0.0 0.0
Other Investing CF 0.0 0.0 0.0 0.0 0.0
Net Investing CF (8,317) (4,708) (6,860) (6,945) (6,440)
Div Paid 0.0 0.0 (225) 0.0 0.0
Chg in Gross Debt (2,360) (13,348) 7,976 0.0 (3,000)
Capital Issues 35.8 6,721 0.0 0.0 0.0
Other Financing CF 0.0 1,831 0.0 0.0 0.0
Net Financing CF (2,325) (4,796) 7,751 0.0 (3,000)
Currency Adjustments 0.0 0.0 0.0 0.0 0.0
Chg in Cash (3,639) (1,912) 7,688 1,307 (687)
Opg CFPS (Rp) 607 804 621 728 799
Free CFPS (Rp) (123) 171 (5.9) 122 216
Source: Company, DBS Bank
Target Price & Ratings History
Source: DBS Bank
Analyst: Sachin MITTAL
Strong operating cash flows to support expansions
Page 28

Industry Focus
Telecom Sector
DBS Bank recommendations are based an Absolute Total Return* Rating system, defined as follows:
STRONG BUY (>20% total return over the next 3 months, with identifiable share price catalysts within this time frame)
BUY (>15% total return over the next 12 months for small caps, >10% for large caps)
HOLD (-10% to +15% total return over the next 12 months for small caps, -10% to +10% for large caps)
FULLY VALUED (negative total return i.e. > -10% over the next 12 months)
SELL (negative total return of > -20% over the next 3 months, with identifiable catalysts within this time frame)
Share price appreciation + dividends
Completed Date: 20 Sep 2017 07:36 (SGT) Dissemination Date: 20 Sep 2017 08:00 (SGT)
Sources for all charts and tables are DBS Bank unless otherwise specified.
GENERAL DISCLOSURE/DISCLAIMER
This report is prepared by DBS Bank Ltd. This report is solely intended for the clients of DBS Bank Ltd, its respective connected and associated
corporations and affiliates only and no part of this document may be (i) copied, photocopied or duplicated in any form or by any means or (ii)
redistributed without the prior written consent of DBS Bank Ltd.
The research set out in this report is based on information obtained from sources believed to be reliable, but we (which collectively refers to DBS
Bank Ltd, its respective connected and associated corporations, affiliates and their respective directors, officers, employees and agents (collectively,
the “DBS Group”) have not conducted due diligence on any of the companies, verified any information or sources or taken into account any other
factors which we may consider to be relevant or appropriate in preparing the research. Accordingly, we do not make any representation or
warranty as to the accuracy, completeness or correctness of the research set out in this report. Opinions expressed are subject to change without
notice. This research is prepared for general circulation. Any recommendation contained in this document does not have regard to the specific
investment objectives, financial situation and the particular needs of any specific addressee. This document is for the information of addressees
only and is not to be taken in substitution for the exercise of judgement by addressees, who should obtain separate independent legal or financial
advice. The DBS Group accepts no liability whatsoever for any direct, indirect and/or consequential loss (including any claims for loss of profit)
arising from any use of and/or reliance upon this document and/or further communication given in relation to this document. This document is not
to be construed as an offer or a solicitation of an offer to buy or sell any securities. The DBS Group, along with its affiliates and/or persons
associated with any of them may from time to time have interests in the securities mentioned in this document. The DBS Group, may have
positions in, and may effect transactions in securities mentioned herein and may also perform or seek to perform broking, investment banking and
other banking services for these companies.
Any valuations, opinions, estimates, forecasts, ratings or risk assessments herein constitutes a judgment as of the date of this report, and there can
be no assurance that future results or events will be consistent with any such valuations, opinions, estimates, forecasts, ratings or risk assessments.
The information in this document is subject to change without notice, its accuracy is not guaranteed, it may be incomplete or condensed, it may
not contain all material information concerning the company (or companies) referred to in this report and the DBS Group is under no obligation to
update the information in this report.
This publication has not been reviewed or authorized by any regulatory authority in Singapore, Hong Kong or elsewhere. There is no planned
schedule or frequency for updating research publication relating to any issuer.
The valuations, opinions, estimates, forecasts, ratings or risk assessments described in this report were based upon a number of estimates and
assumptions and are inherently subject to significant uncertainties and contingencies. It can be expected that one or more of the estimates on
which the valuations, opinions, estimates, forecasts, ratings or risk assessments were based will not materialize or will vary significantly from actual
results. Therefore, the inclusion of the valuations, opinions, estimates, forecasts, ratings or risk assessments described herein IS NOT TO BE RELIED
UPON as a representation and/or warranty by the DBS Group (and/or any persons associated with the aforesaid entities), that:
(a) such valuations, opinions, estimates, forecasts, ratings or risk assessments or their underlying assumptions will be achieved, and
(b) there is any assurance that future results or events will be consistent with any such valuations, opinions, estimates, forecasts, ratings or risk
assessments stated therein.
Page 29

Industry Focus
Telecom Sector
Please contact the primary analyst for valuation methodologies and assumptions associated with the covered companies or price targets.
Any assumptions made in this report that refers to commodities, are for the purposes of making forecasts for the company (or companies)
mentioned herein. They are not to be construed as recommendations to trade in the physical commodity or in the futures contract relating to the
commodity referred to in this report.
DBSVUSA, a US-registered broker-dealer, does not have its own investment banking or research department, has not participated in any public
offering of securities as a manager or co-manager or in any other investment banking transaction in the past twelve months and does not engage
in market-making.
ANALYST CERTIFICATION
The research analyst(s) primarily responsible for the content of this research report, in part or in whole, certifies that the views about the
companies and their securities expressed in this report accurately reflect his/her personal views. The analyst(s) also certifies that no part of his/her
compensation was, is, or will be, directly or indirectly, related to specific recommendations or views expressed in the report. The research analyst (s)
primarily responsible for the content of this research report, in part or in whole, certifies that he or his associate1 does not serve as an officer of the
issuer or the new listing applicant (which includes in the case of a real estate investment trust, an officer of the management company of the real
estate investment trust; and in the case of any other entity, an officer or its equivalent counterparty of the entity who is responsible for the
management of the issuer or the new listing applicant) and the research analyst(s) primarily responsible for the content of this research report or
his associate does not have financial interests2 in relation to an issuer or a new listing applicant that the analyst reviews. DBS Group has
procedures in place to eliminate, avoid and manage any potential conflicts of interests that may arise in connection with the production of
research reports. The research analyst(s) responsible for this report operates as part of a separate and independent team to the investment
banking function of the DBS Group and procedures are in place to ensure that confidential information held by either the research or investment
banking function is handled appropriately. There is no direct link of DBS Group's compensation to any specific investment banking function of the
DBS Group.
COMPANY-SPECIFIC / REGULATORY DISCLOSURES
1. DBS Bank Ltd, DBS HK, DBS Vickers Securities (Singapore) Pte Ltd (''DBSVS''), DBSV HK or their subsidiaries and/or other affiliates have a
proprietary positions in the China Mobile, China Telecom, China Unicom, SmarTone, Hutchison Telecom, HKT Trust, M1, StarHub,
Advanced Info Service, Total Access Communication recommended in this report as of 31 Aug 2017.
2. Neither DBS Bank Ltd, DBS HK nor DBSV HK market makes in equity securities of the issuer(s) or company(ies) mentioned in this Research
Report.
3. DBS Bank Ltd, DBS HK, DBSVS, DBSV HK, their subsidiaries and/or other affiliates have a net long position exceeding 0.5% of the total issued
share capital in M1 recommended in this report as of 31 Aug 2017.
Compensation for investment banking services:
4. DBS Bank Ltd, DBS HK, DBSVS, DBSV HK, their subsidiaries and/or other affiliates of DBSVUSA have received compensation, within the past
12 months for investment banking services from StarHub, Indosat, XL Axiata, PT Sarana Menara Nusantara, Tower Bersama Infrastructure
as of 31 Aug 2017.
5. DBS Bank Ltd, DBS HK, DBSVS, their subsidiaries and/or other affiliates of DBSVUSA have managed or co-managed a public offering of
securities for from StarHub, Indosat, XL Axiata, PT Sarana Menara Nusantara, Tower Bersama Infrastructure as of 31 Aug 2017.
6. DBSVUSA does not have its own investment banking or research department, nor has it participated in any public offering of securities as a
manager or co-manager or in any other investment banking transaction in the past twelve months. Any US persons wishing to obtain further
information, including any clarification on disclosures in this disclaimer, or to effect a transaction in any security discussed in this document
should contact DBSVUSA exclusively.
1 An associate is defined as (i) the spouse, or any minor child (natural or adopted) or minor step-child, of the analyst; (ii) the trustee of a trust of which the analyst, his spouse, minor child (natural or adopted) or minor step-child, is a beneficiary or discretionary object; or (iii) another person accustomed or obliged to act in accordance with the directions or instructions of the analyst.
2 Financial interest is defined as interests that are commonly known financial interest, such as investment in the securities in respect of an issuer or a new listing applicant, or financial accommodation arrangement between the issuer or the new listing applicant and the firm or analysis. This term does not include commercial lending conducted at arm's length, or investments in any collective investment scheme other than an issuer or new listing applicant notwithstanding the fact that the scheme has investments in securities in respect of an issuer or a new listing applicant.
Page 30

Industry Focus
Telecom Sector
Directorship/trustee interests
7. Nihal Vijaya Devadas Kaviratne CBE, a member of DBS Group Holdings Board of Directors, is a Director of Starhub as of 30 Jun 2017.
Disclosure of previous investment recommendation produced:
8. DBS Bank Ltd, DBS Vickers Securities (Singapore) Pte Ltd (''DBSVS''), their subsidiaries and/or other affiliates may have published other
investment recommendations in respect of the same securities / instruments recommended in this research report during the preceding 12
months. Please contact the primary analyst listed in the first page of this report to view previous investment recommendations published by
DBS Bank Ltd, DBS Vickers Securities (Singapore) Pte Ltd (''DBSVS''), their subsidiaries and/or other affiliates in the preceding 12 months.
RESTRICTIONS ON DISTRIBUTION
General This report is not directed to, or intended for distribution to or use by, any person or entity who is a citizen or resident of or located in any locality, state, country or other jurisdiction where such distribution, publication, availability or use would be contrary to law or regulation.
Australia This report is being distributed in Australia by DBS Bank Ltd. (“DBS”) or DBS Vickers Securities (Singapore) Pte Ltd (“DBSVS”). DBS holds Australian Financial Services Licence no. 475946.
DBSVS is exempted from the requirement to hold an Australian Financial Services Licence under the Corporation Act 2001 (“CA”) in respect of financial services provided to the recipients. DBSVS is regulated by the Monetary Authority of Singapore under the laws of Singapore, which differ from Australian laws.
Distribution of this report is intended only for “wholesale investors” within the meaning of the CA.
Hong Kong This report has been prepared by a person(s) who is not licensed by the Hong Kong Securities and Futures Commission to carry on the regulated activity of advising on securities in Hong Kong pursuant to the Securities and Futures Ordinance (Chapter 571 of the Laws of Hong Kong). This report is being distributed in Hong Kong and is attributable to DBS Vickers Hong Kong Limited, a licensed corporation licensed by the Hong Kong Securities and Futures Commission to carry on the regulated activity of advising on securities pursuant to the Securities and Futures Ordinance (Chapter 571 of the Laws of Hong Kong).
For any query regarding the materials herein, please contact Paul Yong (CE. No. ASE988) at [email protected].
Indonesia This report is being distributed in Indonesia by PT DBS Vickers Sekuritas Indonesia.
Malaysia This report is distributed in Malaysia by AllianceDBS Research Sdn Bhd ("ADBSR"). Recipients of this report, received from ADBSR are to contact the undersigned at 603-2604 3333 in respect of any matters arising from or in connection with this report. In addition to the General Disclosure/Disclaimer found at the preceding page, recipients of this report are advised that ADBSR (the preparer of this report), its holding company Alliance Investment Bank Berhad, their respective connected and associated corporations, affiliates, their directors, officers, employees, agents and parties related or associated with any of them may have positions in, and may effect transactions in the securities mentioned herein and may also perform or seek to perform broking, investment banking/corporate advisory and other services for the subject companies. They may also have received compensation and/or seek to obtain compensation for broking, investment banking/corporate advisory and other services from the subject companies.
Wong Ming Tek, Executive Director, ADBSR
Singapore This report is distributed in Singapore by DBS Bank Ltd (Company Regn. No. 196800306E) or DBSVS (Company Regn No. 198600294G), both of which are Exempt Financial Advisers as defined in the Financial Advisers Act and regulated by the Monetary Authority of Singapore. DBS Bank Ltd and/or DBSVS, may distribute reports produced by its respective foreign entities, affiliates or other foreign research houses pursuant to an arrangement under Regulation 32C of the Financial Advisers Regulations. Where the report is distributed in Singapore to a person who is not an Accredited Investor, Expert Investor or an Institutional Investor, DBS Bank Ltd accepts legal responsibility for the contents of the report to such persons only to the extent required by law. Singapore recipients should contact DBS Bank Ltd at 6327 2288 for matters arising from, or in connection with the report.
Page 31

Industry Focus
Telecom Sector
Thailand This report is being distributed in Thailand by DBS Vickers Securities (Thailand) Co Ltd. Research reports distributed are only intended for institutional clients only and no other person may act upon it.
United Kingdom
This report is produced by DBS Bank Ltd which is regulated by the Monetary Authority of Singapore.
This report is disseminated in the United Kingdom by DBS Vickers Securities (UK) Ltd, ("DBSVUK"). DBSVUK is authorised and regulated by the Financial Conduct Authority in the United Kingdom.
In respect of the United Kingdom, this report is solely intended for the clients of DBSVUK, its respective connected and associated corporations and affiliates only and no part of this document may be (i) copied, photocopied or duplicated in any form or by any means or (ii) redistributed without the prior written consent of DBSVUK. This communication is directed at persons having professional experience in matters relating to investments. Any investment activity following from this communication will only be engaged in with such persons. Persons who do not have professional experience in matters relating to investments should not rely on this communication.
Dubai International Financial Centre
This research report is being distributed by DBS Bank Ltd., (DIFC Branch) having its office at PO Box 506538, 3rd Floor, Building 3, East Wing, Gate Precinct, Dubai International Financial Centre (DIFC), Dubai, United Arab Emirates. DBS Bank Ltd., (DIFC Branch) is regulated by The Dubai Financial Services Authority. This research report is intended only for professional clients (as defined in the DFSA rulebook) and no other person may act upon it.
United Arab Emirates
This report is provided by DBS Bank Ltd (Company Regn. No. 196800306E) which is an Exempt Financial Adviser as defined in the Financial Advisers Act and regulated by the Monetary Authority of Singapore. This report is for information purposes only and should not be relied upon or acted on by the recipient or considered as a solicitation or inducement to buy or sell any financial product. It does not constitute a personal recommendation or take into account the particular investment objectives, financial situation, or needs of individual clients. You should contact your relationship manager or investment adviser if you need advice on the merits of buying, selling or holding a particular investment. You should note that the information in this report may be out of date and it is not represented or warranted to be accurate, timely or complete. This report or any portion thereof may not be reprinted, sold or redistributed without our written consent.
United States This report was prepared by DBS Bank Ltd. DBSVUSA did not participate in its preparation. The research analyst(s) named on this report are not registered as research analysts with FINRA and are not associated persons of DBSVUSA. The research analyst(s) are not subject to FINRA Rule 2241 restrictions on analyst compensation, communications with a subject company, public appearances and trading securities held by a research analyst. This report is being distributed in the United States by DBSVUSA, which accepts responsibility for its contents. This report may only be distributed to Major U.S. Institutional Investors (as defined in SEC Rule 15a-6) and to such other institutional investors and qualified persons as DBSVUSA may authorize. Any U.S. person receiving this report who wishes to effect transactions in any securities referred to herein should contact DBSVUSA directly and not its affiliate.
Other jurisdictions
In any other jurisdictions, except if otherwise restricted by laws or regulations, this report is intended only for qualified, professional, institutional or sophisticated investors as defined in the laws and regulations of such jurisdictions.
Page 32

Industry Focus
Telecom Sector
DBS Regional Research Offices
HONG KONG DBS Vickers (Hong Kong) Ltd Contact: Paul Yong 18th Floor Man Yee Building 68 Des Voeux Road Central Central, Hong Kong Tel: 65 6878 8888 Fax: 65 65353 418 e-mail: [email protected] Participant of the Stock Exchange of Hong Kong
MALAYSIA AllianceDBS Research Sdn Bhd Contact: Wong Ming Tek (128540 U) 19th Floor, Menara Multi-Purpose, Capital Square, 8 Jalan Munshi Abdullah 50100 Kuala Lumpur, Malaysia. Tel.: 603 2604 3333 Fax: 603 2604 3921 e-mail: [email protected]
SINGAPORE DBS Bank Ltd Contact: Janice Chua 12 Marina Boulevard, Marina Bay Financial Centre Tower 3 Singapore 018982 Tel: 65 6878 8888 Fax: 65 65353 418 e-mail: [email protected] Company Regn. No. 196800306E
INDONESIA PT DBS Vickers Sekuritas (Indonesia) Contact: Maynard Priajaya Arif DBS Bank Tower Ciputra World 1, 32/F Jl. Prof. Dr. Satrio Kav. 3-5 Jakarta 12940, Indonesia Tel: 62 21 3003 4900 Fax: 6221 3003 4943 e-mail: [email protected]
THAILAND DBS Vickers Securities (Thailand) Co Ltd Contact: Chanpen Sirithanarattanakul 989 Siam Piwat Tower Building, 9th, 14th-15th Floor Rama 1 Road, Pathumwan, Bangkok Thailand 10330 Tel. 66 2 657 7831 Fax: 66 2 658 1269 e-mail: [email protected] Company Regn. No 0105539127012 Securities and Exchange Commission, Thailand
Page 33