Embed Size (px)
Citation preview

INDONESIA CLIMATE CHANGE MITIGATION STRATEGY AND ITS IMPLICATION ON ENERGY SECTOR DEVELOPMENT
EASS MEETING, BEIJING, 23-24 SEPT 2010
Fabby Tumiwa, IESR

Ambitious Target
At G20 Summit in Pittsburg (2009), Indonesia President committed to a 26% - 41% emission reduction target by 2020 making Indonesia the first large developing country to do so.
Similar statement made in Copenhagen COP-15, followed by submitting official pledge to UNFCCC in February 2010 to support Copenhagen Accord.
Government agencies prepared plan, intervention scenarios to achieve the reductions target, and domestic policies to support implementation of the plan.


Achieving 26-41% reductions from 2020 baseline would require reducing annual emissions by 0.6-1 GtCO2e
In short term, largest emission reduction is expected to come from peat and forestry sector.


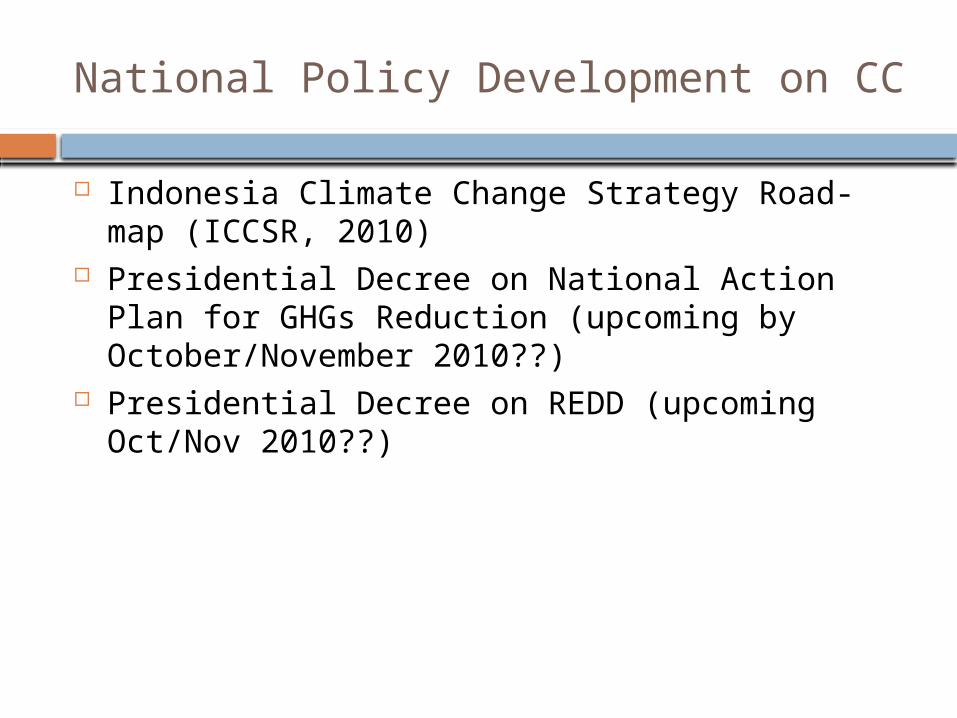
National Policy Development on CC
Indonesia Climate Change Strategy Road-map (ICCSR, 2010)
Presidential Decree on National Action Plan for GHGs Reduction (upcoming by October/November 2010??)
Presidential Decree on REDD (upcoming Oct/Nov 2010??)

Implication to Power Sector Development and Strategy
Modest target and lack of attention for GHGs emission reduction from power sector.
Emission reduction target 30 Mton CO2 by 2020 Energy efficiency: demand side
management Increasing utilization of renewable energy
Geothermal: 7000 MW (by 2020) Micro and small hydro Others: solar PVs, wind power
Fuel switching: diesel oil to bio-fuel

Energy Mix Scenario for Power Generation
HSD 12%
MFO 7%
GAS22%
LNG0%
BATUBARA 46%
HYDRO 7%
GEOTHERMAL 6%
2009
HSD 2%
MFO 0%
GAS16%
LNG4%
BATUBARA 59%
HYDRO 4% PUMPED
STORAGE1%
GEOTHERMAL 14%
2019
Source: PLN’s Power Supply Development Plan (2009-2019)

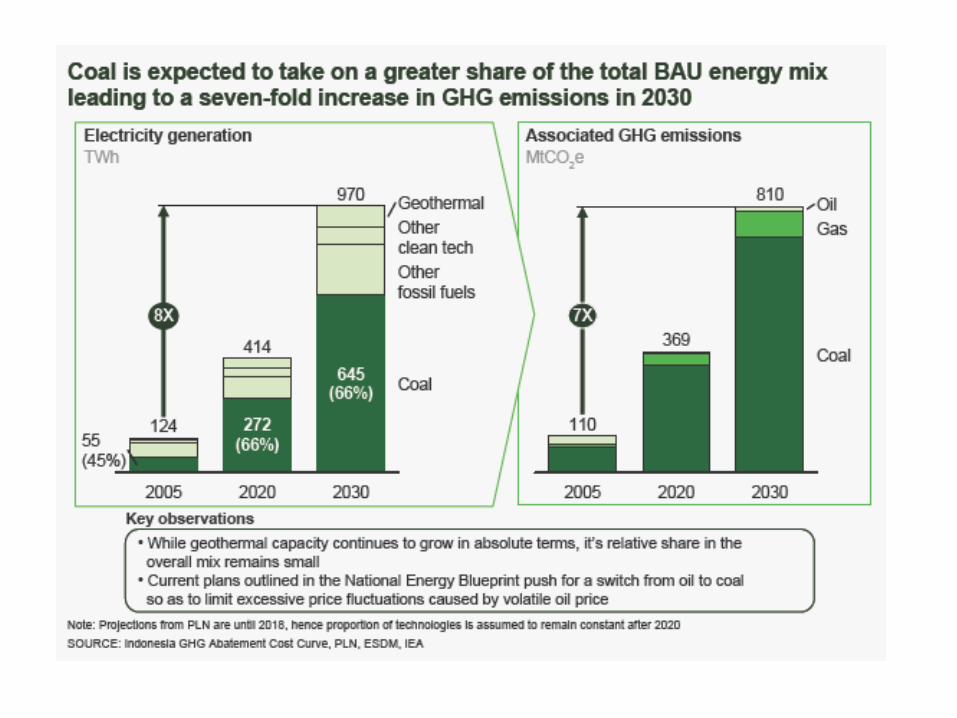
Fossil fuel will still dominates 80-85% of power generation for the next decade.
Coal will dominates power generation (~60% of total generating capacity) Currently only 15% of national production of
coal are being used for power generation, 30% – 40% in 2020.
Dominate by pulverized coal PP, some CCTs fleet will come online after 2014/2015.

Nuclear power has not yet consider as GHGs mitigation measures Development are slow, controversial, and
not gain full support from current administration, public opposition is still high.
NPP unlikely to be operated in Indonesia before 2025 Up to 2015 to determine and study new sites
(outside Java) NPP proponent is trying to win people’s support Most optimistic scenario: NPP construction will
start in 2018

Sustainable Electricity Scenario for Indonesia (IESR, 2008)
Result of LEAP model (2008)
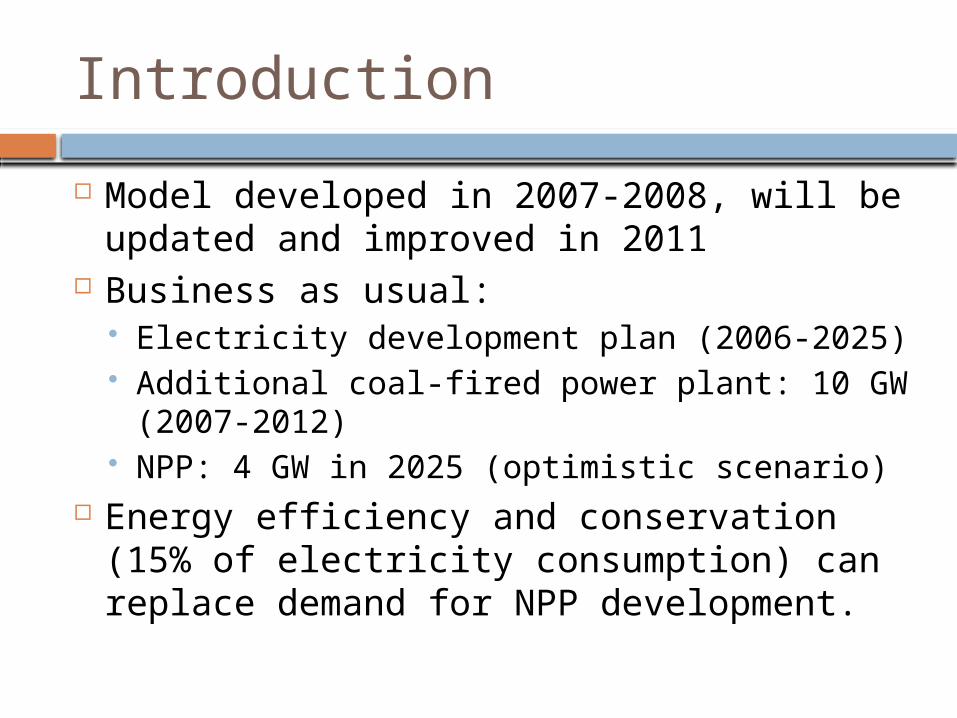
Introduction
Model developed in 2007-2008, will be updated and improved in 2011
Business as usual: Electricity development plan (2006-2025) Additional coal-fired power plant: 10 GW
(2007-2012) NPP: 4 GW in 2025 (optimistic scenario)
Energy efficiency and conservation (15% of electricity consumption) can replace demand for NPP development.

Model Structure
Demand structure: Energy demand: electricity & non-electricity Electricity demand is categorized by
system (islands-based system) Non-electricity demand is bundled, non-
specific
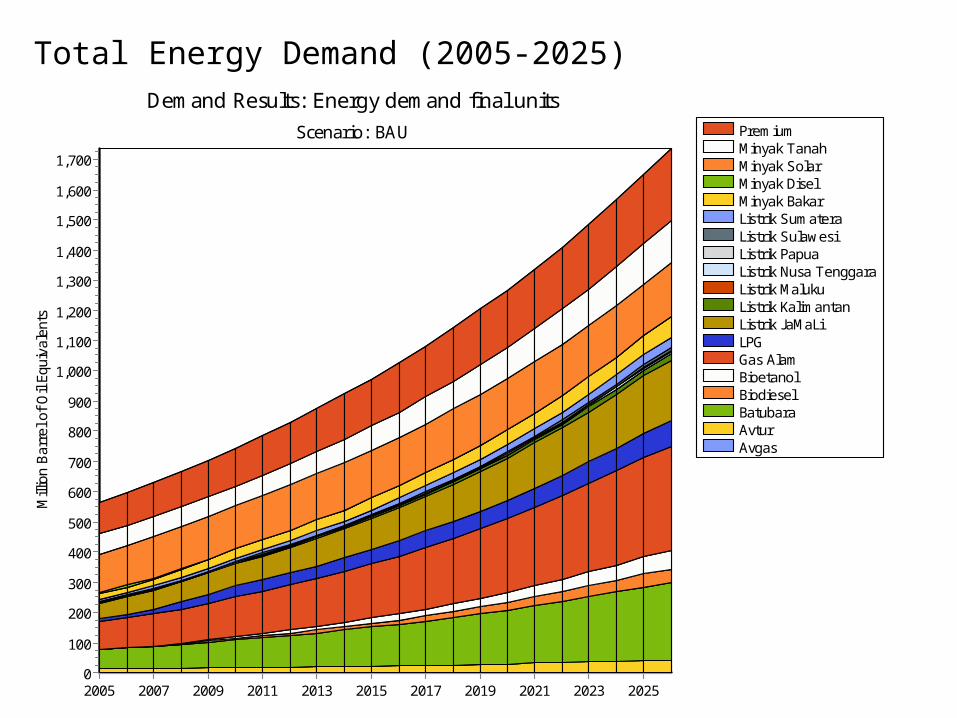
PremiumMinyak TanahMinyak SolarMinyak DiselMinyak BakarListrik SumateraListrik SulawesiListrik PapuaListrik Nusa TenggaraListrik MalukuListrik KalimantanListrik JaMaLiLPGGas AlamBioetanolBiodieselBatubaraAvturAvgas
Demand Results: Energy demand final units
Scenario: BAU
2005 2007 2009 2011 2013 2015 2017 2019 2021 2023 2025
Mill
ion
Bar
rel o
f O
il Eq
uiva
lent
s
1,700
1,600
1,500
1,400
1,300
1,200
1,100
1,000
900
800
700
600
500
400
300
200
100
0
Total Energy Demand (2005-2025)

Listrik SumateraListrik SulawesiListrik PapuaListrik Nusa TenggaraListrik MalukuListrik KalimantanListrik JaMaLi
Demand Results: Energy demand final units
Scenario: BAU
2005 2007 2009 2011 2013 2015 2017 2019 2021 2023 2025
Tho
usan
d G
igaw
att-
Hou
rs
440
420
400
380
360
340
320
300
280
260
240
220
200
180
160
140
120
100
80
60
40
20
0
Projection of Electricity Consumption (2005-2025)

Supply structure: Power Plant Power Transmission (island
based-grid/interconnection) Oil refineries LPG and LNG refineries Oil, Gas, and Coal mines Ethanol processing plants Biodiesel plants
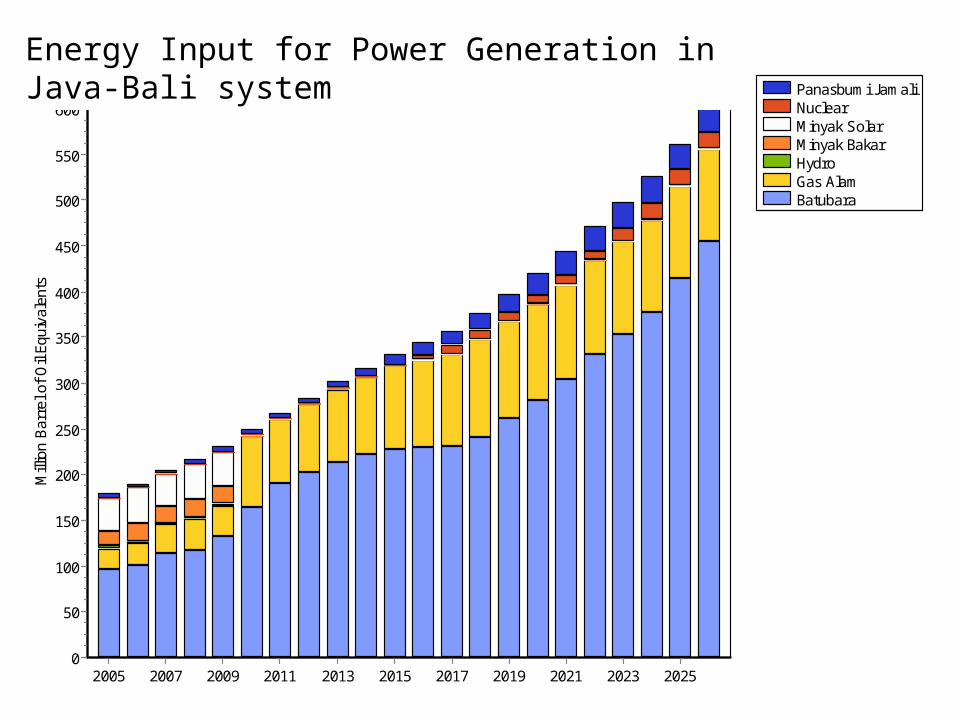
Panasbumi JamaliNuclearMinyak SolarMinyak BakarHydroGas AlamBatubara
Transformation Results: Inputs
Scenario: BAU, Input fuel type: All Input fuel types
2005 2007 2009 2011 2013 2015 2017 2019 2021 2023 2025
Mill
ion
Bar
rel o
f O
il Eq
uiva
lent
s
600
550
500
450
400
350
300
250
200
150
100
50
0
Energy Input for Power Generation in Java-Bali system

KonservasiBAUAL3AL2AL1
Environmental Results: Pollutant loadings
Fuel: All Fuels, Effects: Carbon Dioxide Non Biogenic
20062007 2009 2011 2013 2015 2017 2019 2021 2023 2025
Bill
ion
Kilo
gram
mes
400
380
360
340
320
300
280
260
240
220
200
180
160
140
120
100
80
60
40
20
0

Recent development
Diesel oil consumption is still high (22% of total electricity generated).
2nd stage of Electricity crash program (2009-2014): 40% coal, 60% renewables (geothermal, hydro)
Declining natural gas supply for power plant in the last 2 years, plan to build LNG liquefaction plant near Jakarta by 2012/2013.
Poor geothermal development, target to add 6.5 GW up to 2020 is hardly to meet.
Uncertainty in nuclear development. Failure of biofuels development program Development of new technology: e.g: Coal Bed Methane (CBM) Impact of GHGs various mitigation measures, including CCTs.
INSTITUTE FOR ESSENTIAL SERVICES REFORM
JAKARTA, INDONESIA www.iesr-indonesia.org
FABBY [email protected]