Embed Size (px)
Citation preview

Individual Preferences over High-Skilled Immigration in the United States*
Gordon H. Hanson University of California, San Diego and NBER
Kenneth Scheve Yale University
Matthew J. Slaughter
Tuck School of Business at Dartmouth and NBER
April 2007
Abstract. In this paper, we examine individual preferences toward skilled immigration in the United States. We ask whether individuals are less opposed to immigration in states with more-skilled immigrant populations. Previous literature suggests that attitudes about immigration depend on an individual’s skill level, the size of the immigrant population in an individual’s state, and the exposure of an individual to the fiscal consequences to immigration. We investigate the consequences of the skill composition of immigrants on policy opinions. Our main finding is that skill composition does matter, but not across the board. Less-skilled natives are less opposed to immigration when living in states with a relatively skilled mix of immigrants. The sensitivity of less-skilled natives’ opinions to the skill composition of immigrants resonates with earlier findings that the labor-market pressures of immigration are an important determinant of policy opinions about immigration restrictions.
*Email addresses: [email protected], [email protected], and [email protected]. This paper has been prepared for the Conference on Skilled Migration, March 4-5, 2005, sponsored by Council on Foreign Relations and Russell Sage Foundation. For financial support we gratefully acknowledge the National Science Foundation.

1
1. Introduction
In the United States, immigration is a source of intense political conflict. Despite widespread
criticism of U.S. immigration practices, there is little consensus about how to change the
management of immigrant inflows. Current immigration policy is viewed as allowing a large
number of illegal aliens to enter the United States, increasing the supply of low-skilled labor in
the country, and admitting individuals who place large demands on public expenditure. These
outcomes, in turn, are blamed for expanding the underground economy, hurting low-income U.S.
workers, and increasing fiscal deficits.
Among the more sweeping proposals for reforming U.S. immigration is the suggestion to
replace the current system, in which legal admissions of permanent immigrants are based
primarily on family reunification, with one in which admissions are instead based on the skill set
that an individual possesses (Borjas, 1999; Huntington, 2004). Shifting from a family-based to a
skills-based admissions criterion, the reasoning goes, would allow the United States to select
individuals who have high earnings potential, good prospects for succeeding in the U.S.
economy, and a low likelihood of drawing on public benefits.1
It is unclear, however, whether there is sufficient political support to shift U.S. policy
towards favoring high-skilled immigrants. The public is sharply divided over immigration.
When asked about the level of U.S. immigration, nearly half of survey respondents would prefer
to see the numbers admitted reduced (Scheve and Slaughter, 2001a). This opposition is surely
conditional on the nature of U.S. policies. But would changing admissions criteria reduce
opposition to immigration sufficiently to make reform of U.S. immigration feasible?
1 Presumably, the United States would also have to strengthen enforcement against illegal immigration. Otherwise, any change in legal admissions would likely be undone by a change in illegal inflows. See Hanson (2005).

2
Previous research offers many reasons to think the answer may be, “yes.” Skilled
immigrants have been shown to be a source of entrepreneurial activity. For example, during the
1990s information-technology boom in Silicon Valley, Chinese and Indian immigrants started
new companies at an accelerating rate and accounted for 25% of the senior executives at all start-
up firms (Saxenian, 1999). Firms started by and/or populated by immigrants forge a wide range
of international networks with home countries and elsewhere, which may foster economic
growth by facilitating cross-border flows of ideas, capital, and goods and services (Rauch, 2001;
Rauch and Trindade, 2002; Saxenian, 2002b). More generally, in recent decades skilled
immigrants—many of whom were educated at American universities—have accounted for
sharply increasing shares of very highly skilled segments of the U.S. labor force that are critical
for supporting highly productive, highly compensated jobs. By 2000, 38% of all American PhDs
in science and engineering occupations were foreign born—up from only 23% in 1990 (National
Science Foundation, 2004). This evidence on the potential dynamic benefits from skilled
immigrants might make natives more inclined to favor liberalization of immigration policy
where they are more exposed to skilled immigration.
In this paper, we examine individual preferences toward skilled immigration in the United
States. In particular, we ask whether individuals are less opposed to immigration in states with
more-skilled immigrant populations. To implement the analysis, we combine micro data on
public attitudes toward immigration with data on the size and composition of U.S. immigrant
populations across regions and over time.
That opinions about immigration vary is not surprising. Immigration, like international trade,
foreign investment and other aspects of globalization, changes the distribution of income within
a country. In the United States, a disproportionate number of immigrants have low skill levels,

3
concentrating the negative labor-market effects of immigration on less-skilled U.S. residents. In
2003, 33% of foreign-born adults in the U.S. had less than 12 years of education, compared with
only 13% of native-born adults. By increasing the relative supply of low-skilled labor,
immigration puts downward pressure on the wages of low-skilled native-born workers. Borjas
(2003) finds that between 1980 and 2000 immigration had the largest effect on the low-skilled,
reducing the wages of native-born high-school dropouts by 9%.2
Consistent with these labor-market repercussions, Scheve and Slaughter (2001c) find that
opposition to immigration is higher among less-educated U.S. workers. Less-skilled laborers’
skepticism about immigration mirrors their skepticism about globalization in general.3
A second source of opposition to immigration relates to its consequences for public finances.
Low-skilled immigrants tend to earn relatively low wages, to contribute relatively little in taxes,
and to enroll in government entitlement programs with relatively high frequency. There is
abundant evidence that immigrants make greater use of welfare programs than natives (Borjas
and Hilton, 1996; Borjas, 1999a; Fix and Passel, 2002). This has remained true even after the
1996 reform of U.S. welfare law, which restricted immigrant access to many types of
government benefits (Zimmerman and Tumlin, 1999; Fix and Passel, 2002). In U.S. states with
large immigrant populations, such as California, immigration appears to increase net burdens on
native taxpayers substantially (Smith and Edmonston, 1997).
The fiscal impact of immigration is reflected in public attitudes toward immigration policy.
Hanson, Scheve, and Slaughter (2007) find that U.S. natives who are more exposed to immigrant
fiscal pressures (i.e., individuals living in states that have large immigrant populations and that
2 While many early studies of the labor-market consequences of immigration found that its wage impacts were small (Borjas, 1999b), recent studies find that immigration depresses wages for native workers who are likely to substitute for immigrant labor (Borjas, Freeman, and Katz, 1997; Borjas, 2003). 3 See Rodrik (1997, 1998), Scheve and Slaughter (2001a, 2001b, 2001c, 2004), O’Rourke and Sinnott (2001, 2003), Mayda and Rodrik (2005), Hainmueller and Hiscox (2004), and Mayda (2006).

4
provide immigrants access to generous public benefits) are more in favor of reducing
immigration. This public-finance cleavage is strongest among natives with high earnings
potential (e.g., the college educated or individuals in the top income quartile), and its substantive
magnitude is as large as the labor-market cleavage cited above.
In short, previous literature suggests that individual attitudes about immigration depend on an
individual’s skill level, the size of the immigrant population in an individual’s state, and the
exposure of an individual to the fiscal consequences to immigration. In this paper we add to this
discussion the possibility that individuals also care about the skill composition of immigration.
In section 2, we develop a simple framework of voter preferences toward immigration. One
channel through which the skill composition of immigration may affect individual policy
preferences is through knowledge spillovers or other non-pecuniary externalities. As discussed
above, high-skilled immigrants may bring new technology, new information about foreign
markets, or new ways of doing business, any of which would increase U.S. labor demand. A
second channel is through its impact on the fiscal consequences of immigration. Individuals may
expect higher-skilled immigrants to generate positive net fiscal transfers to native households. If
either of these channels is operative, individuals may be less opposed to immigration the more
skilled is the immigrant population in their region.
This reasoning depends, of course, on holding constant other individual and regional
characteristics. Obviously, high-skilled immigrants are likely to compete with high-skilled
natives in the labor force, which may temper the enthusiasm of high-skilled natives for high-
skilled immigrant admissions. Indeed, the documented opposition of low-skilled U.S. natives to
immigration appears to reflect their concerns about downward wage pressures from low-skilled
immigrants. However, if high-skilled immigration creates positive fiscal benefits and/or non-

5
pecuniary externalities, the opposition of more-skilled natives to high-skilled immigration may
be weaker than the opposition of less-skilled native to low-skilled immigrant inflows.
Data for the analysis, described in section 3, come from several sources. We combine the
1992 and 2000 American National Election Studies (NES) surveys (Sapiro, et al, 1998) with data
on immigrant and native populations, labor-force participation, and use of public assistance from
the 1990 and 2000 U.S. Censuses of Population and Housing. Additional data includes
information on state fiscal policies, in particular their welfare generosity in general and towards
immigrants in particular. Our data allow us to exploit variation both across states and over time,
such as the fact that some high-immigrant states (Massachusetts, New Jersey) have highly skilled
immigrant populations while other high-immigrant states (Texas, Arizona) do not.
To preview the empirical results, reported in section 4, our main finding is that skill
composition does matter, but not across the board. Less-skilled natives tend to support freer
immigration more when living in states with a relatively skilled mix of immigrants. The
sensitivity of less-skilled natives’ opinions to the skill composition of immigrants resonates with
earlier findings of concern over the labor-market pressures of immigration. By way of
conclusion in section 5, we consider the implications of our results for political prospects of
proposals to reform U.S. immigration policy.
2. Theoretical Framework
In this section we develop a simple framework of voter preferences to examine how
cleavages regarding immigration vary across jurisdictions. While our focus is on individual
economic welfare, there are surely many non-economic determinants of attitudes towards

6
globalization.4 These non-economic determinants we set aside for now, but they will be an
important consideration in our empirical analysis.
Let V(p, Ii) be the indirect utility enjoyed by individual i, which depends on the vector of
prices for consumption goods and services, p, and also on after-tax income available for
consumption, Ii. In turn, after-tax income depends on the pre-tax wage income, yi, the income-
tax rate, ti, and government transfers, gi, such that
iiii g)t1(yI +−= . (1)
Tax rates and government transfers vary across individuals by both state of residence and level
of income. Equation (1) assumes all income is from labor earnings and only labor earnings are
taxed. Neither assumption is essential, but they simplify the presentation.
First consider the impact on individual welfare of an increase in immigration. By
differentiating the indirect utility function we obtain the following,
MMI
IVM
Mp
pVV i
ii Δ
∂∂
∂∂
+Δ∂∂
∂∂
=Δ , (2)
where ΔM is the change in immigration in the state in which person i resides. It is useful to re-
express this change in welfare in monetary terms. This can be done by using equation (1) to
solve for ∂Ii/∂M in terms of the components of after-tax income, and then dividing equation (2)
by ∂V/∂Ii, the marginal utility of income:
MMty
MgM)t1(
MyM
Mp
I/Vp/V
I/VV i
ii
ii
ii
i Δ⎟⎠⎞
⎜⎝⎛
∂∂
−∂∂
+Δ−∂∂
+Δ∂∂
∂∂∂∂
=∂∂
Δ . (3)
Consider the three terms on the right-hand side of equation (3). The first term is the
monetary value of the utility change associated with immigration’s impact on product prices. To
the extent immigration lowers the price at which goods are available in individual i’s state 4 See, for example, Citrin, Green, Muste, and Wong (1997), Scheve and Slaughter (2001a, 2001b, 2001c), Kessler (2001), O’Rourke and Sinnott (2001, 2003), Mayda and Rodrik (2005), Mayda (2006), and Hainmueller and Hiscox (2004).

7
(relative to labor income), this term will be positive. If the share of individual spending on non-
traded services (e.g., construction, housekeeping, yard care, restaurants, lodging) is increasing in
income and if these services are intensive in immigrant labor, the price impact of immigration
may be largest for higher-income individuals, making them relatively more supportive of freer
immigration. Looking ahead to our empirical analysis, we do not have data on individual
expenditure patterns. But we do have data on other individual characteristics that may proxy for
these patterns, such as age and schooling. We will also control for any state-specific components
of this price channel, due to the size of immigrant inflows or other state characteristics.
The second term on the right of (3) is the immigration-induced change in pre-tax labor
income. If immigration increases the relative supply of low-skilled labor, we expect this term to
be positive for high-skilled natives and negative for the low-skilled. If the only impact of skilled
immigration is on the supply of labor, we would expect the opposite signs if immigrants are
predominantly high-skilled. However, to the extent that high-skilled immigrants are also a
source of knowledge spillovers, ∂yi/∂M will be more positive for low-skilled individuals and less
negative (or even positive) for high-skilled natives.
The third term on the right of equation (3) is the change in the net fiscal transfer received by
individual i. This net fiscal transfer, gi-yiti, contains state and federal components. We assume
the federal component can be expressed as a reduced-form function of individual characteristics.
The state component of the net fiscal transfer will depend on the interaction of individual
characteristics and state tax and spending policies. In states with generous benefits and
progressive taxation, we expect the net fiscal transfer an individual receives to be decreasing in
individual income. In states with less generous benefits and less progressive taxation, we expect
the correlation between fiscal transfers and income to be less negative.

8
How will immigration change net fiscal transfers received by natives? We assume that the
arrival of immigrants is accommodated through a combination of reduced government transfers
to and increased taxation of native state residents.5 If immigrants are primarily low-skilled, then
immigration is likely to reduce the net fiscal transfer received by natives, with this reduction
being larger (a) in states that have larger immigrant populations and that are more generous in
the public benefits they provide, and (b) for high-income individuals (at least in states with
progressive income taxation) (Hanson, Scheve, and Slaughter, 2007).
If immigrants are primarily high-skilled, these immigrants may make positive net fiscal
transfers to U.S. native taxpayers. If increased revenues from high-skilled immigrants are not
fully offset by decreased taxes or reduced borrowing, then their arrival may expand transfers
received by low-income residents (especially in more-generous states). For low-skilled natives,
we thus expect ∂gi/∂M ≥ 0 in the case of high-skilled immigration. In states with progressive
taxation, low-income individuals pay relatively little in taxes, which makes the impact of
immigration on their tax payments, ∂ti/∂M, small. Thus, for low-income individuals we expect
the impact of high-skilled immigration on net fiscal transfers to be weakly positive (particularly
for generous states with progressive taxation).
Now consider high-income individuals. They are likely to receive little in state transfers,
making ∂gi/∂M small. But they are likely to bear a relatively large share of the state tax burden
(especially in states with progressive income taxes). If the gain in tax revenues associated with
high-skilled immigration is partially offset by a reduction in state tax rates, then ∂ti/∂M will be
negative (their tax rates fall). Combining terms, we expect that for high-income individuals the
impact of high-skilled immigration on net fiscal transfers to be weakly positive, as well.
5 Although in principle fiscal impact of immigration could also be accommodated through increased borrowing, all states but Vermont self-impose balanced-budget requirements of some type.
9
Finally, consider middle-income individuals. They are likely to receive less in state transfers
than low-income individuals. They are also likely to pay less of their income in taxes than high-
income individuals. Accordingly, we might expect immigration to affect the net fiscal transfers
of middle-income individuals least of all.
In states that lack generous public benefits and progressive taxation, the impact of
immigration on net fiscal transfers is likely to be relatively small for either low-income or high-
income individuals. For individuals in these states, the after-tax fiscal term in (3) is thus likely to
be dominated by the pre-tax price and labor-income terms.
Equation (3) offers a framework for how immigration cleavages may differ across
individuals and fiscal jurisdictions. The pre-tax labor-income pressures from immigration are
likely to cleave across skill groups within all jurisdictions. But there should also be after-tax
fiscal pressures that vary with both skill type and the state taxing/spending regime. The
perceived effects of high-skilled immigration on labor markets and public finances depend, in
addition, on whether individuals expect high-skilled immigration to generate knowledge
spillovers or positive net fiscal transfers to natives.
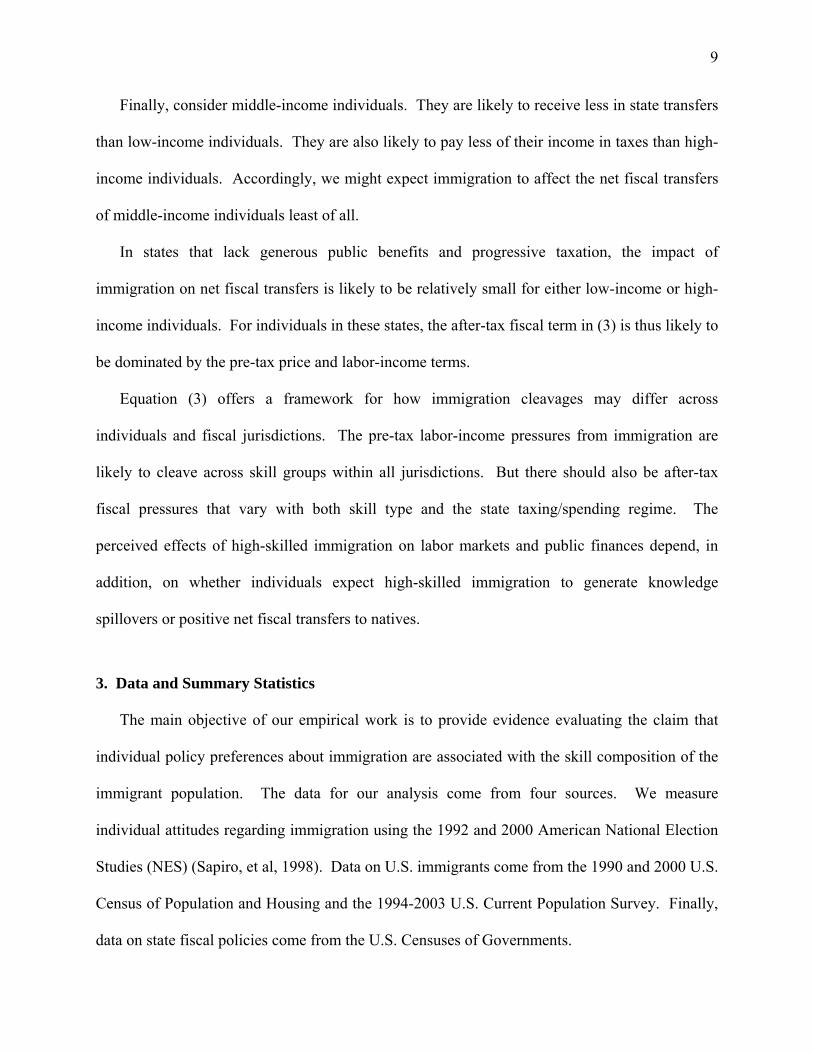
3. Data and Summary Statistics
The main objective of our empirical work is to provide evidence evaluating the claim that
individual policy preferences about immigration are associated with the skill composition of the
immigrant population. The data for our analysis come from four sources. We measure
individual attitudes regarding immigration using the 1992 and 2000 American National Election
Studies (NES) (Sapiro, et al, 1998). Data on U.S. immigrants come from the 1990 and 2000 U.S.
Census of Population and Housing and the 1994-2003 U.S. Current Population Survey. Finally,
data on state fiscal policies come from the U.S. Censuses of Governments.
10
3.1 Immigrant Populations in U.S. States
We begin our discussion of the data by showing that states vary both in their exposure to
immigration and in the skill composition of their immigrant populations. Figure 1 shows the
distribution of natives and immigrants by schooling category, based on U.S. census data. As is
well-documented, immigrants are concentrated at the extremes of the skill distribution.
Immigrants are heavily over-represented among those with less than a high-school education,
under-represented among those with a high-school degree or some college, equally represented
among those with a college degree, and slightly over-represented among those with an advanced
degree. Not surprisingly, educational attainment is strongly correlated with the economic
performance of immigrants. Figure 2 shows that immigrants with at least a high-school degree
have substantially higher earnings than the immigrant population overall. Immigrant earnings
potential, as summarized by the level schooling, may influence native perceptions of the
economic consequences of immigration. Schooling affects both with whom immigrants compete
in the labor market and the likelihood that immigrants draw on public benefits.
Also well known is that states vary in the size and composition of their immigrant
populations. Figure 3, which plots the share of immigrants in the state working-age adult
population, reproduces the familiar fact that immigrants are geographically concentrated. For the
United States as a whole, the immigrant adult population share rises sharply from 1990 to 2000.
In 2000, the immigrant population ratio is between 30% and 40% in two states (California, New
York) and above the national average of 16.5% in eleven others.6
6 These states are New Jersey, Hawaii, Florida, Nevada, Texas, Connecticut, Massachusetts, Arizona, Rhode Island, Illinois, and District of Columbia.

11
More-educated immigrants appear to concentrate where skilled native workers are in
relatively short supply. Figures 4a and 4b plot the relative supply of high-skilled workers for
state immigrant and native populations, where we measure the relative supply of skilled labor as
the ratio of college graduates (individuals with 16 or more years of schooling) to high-school
dropouts (individuals with less than 12 years of schooling and no high-school diploma). There is
a negative relationship between the relative supply of immigrant and native college graduates
across U.S. states. This suggests that high-skilled (low-skilled) immigrants may be drawn to
regions where the size of this labor group is relatively small among the native population. In
both 1990 and 2000, U.S. states in the southwest and on west coast stand out as having a
relatively abundant supply of low-skilled immigrants.
Heterogeneity in state immigrant populations is also reflected in the economic performance
of immigrants. Figures 5a and 5b plot the ratio of immigrant to native per capita income against
the immigrant ratio of college graduates to high school dropouts over the native ratio of college
graduates to high school dropouts. There is a strong positive relationship between the relative
supply of skilled immigrants and immigrant relative incomes. Immigrants have high incomes
relative to natives in states in which high-skilled immigrants are relatively abundant.
Differences in schooling between immigrants and natives affect the likelihood with which the
two groups use public assistance. Table 1 shows immigrant and native usage of different types
of public assistance for the period 1994 to 2002. In 2002, immigrant-headed households were
much more likely than native-headed households to participate in welfare programs.7 Among
7 When considering immigrant use of public assistance, we take households (rather than individuals) as the unit of analysis. We define as an immigrant household a unit in which the household head is foreign born. This definition thus includes in immigrant households U.S.-born children of immigrants who live with their parents. Households are the units on which government agencies assess income taxes, property taxes, and other levies. For determining individual eligibility for means-tested benefit programs, it is typically the characteristics of the household that are evaluated (Zimmermann and Tumlin, 1999).

12
immigrant households, 24.2% had at least one member who used some type of social assistance,
compared to 14.9% of native households. Immigrant households were thus 9.3% more likely
than native households to receive public benefits (Figure 6). Since the early 1990’s, researchers
have consistently found that immigrants are more likely than natives to receive social assistance
(Borjas, 1999a and 2002). Given that immigrants are more likely to earn low incomes and that
participation in welfare programs is means tested, this is hardly surprising.
Figure 6 shows that the immigrant-native differential in overall welfare use has fluctuated
over time, but does not show a consistent trend. In 1994, the share of households receiving
welfare was 24.6% for immigrants and 15.3% for natives, which is the same differential (9.3%)
as in 2002. This stability is perhaps unexpected in light of important recent changes in U.S.
welfare policy. In 1996, Congress undertook a major overhaul of federal welfare programs.
Among other changes, the reform excluded non-citizens from access to many benefits. Congress
also substituted state entitlements to federal funds with block grants, leaving states wide
discretion over individual eligibility criteria. For legal immigrants arriving before 1996, states
have the option of whether to use their federal block grants to provide this group with benefits.
For legal immigrants arriving after 1996, states may not use federal block grants to provide non-
citizens with benefits, but they are free to use other state funds to create substitute programs.
While the immigrant-native differential in overall welfare use hasn’t changed over time, the
composition of benefits received by immigrants and natives has changed. In 1994, immigrant
households were 5.2% more likely than native households to receive some type of cash benefit
(general assistance, AFDC, SSI) (Figure 6). By 2002, this differential had fallen to 2.0%.
Similarly, between 1994 and 2002 the differential between immigrant and native use of food
stamps declined from 5.3% to 1.0%. Medicaid is the only major category in which the

13
immigrant-native welfare differential didn’t fall (and in fact increased from 9.1% to 9.6%). The
share of immigrant households using of all types of social assistance except Medicaid has
declined, both in absolute terms and relative to natives. What appears to explain immigrants
continued access to Medicaid is that it is a program for which U.S.-born children are eligible,
regardless of the citizenship of their parents. Many immigrant-headed households may have
retained their access to Medicaid by virtue having children that are U.S. citizens.8
Underlying national patterns in welfare usage, there is considerable variation across states in
immigrant uptake of public assistance. Zimmerman and Tumlin (1999) categorize U.S. states
according to the relative generosity of their welfare programs and immigrant access to these
programs. We categorize states as providing immigrants with high access to benefits if they both
provide generous welfare benefits and make these benefits relatively available to immigrants.
While the level of benefits available to immigrants has changed markedly over time, the ranking
of states in terms of their generosity toward immigrants has been relatively stable. Figures 7a
and 7b plot the fraction of immigrant and native households receiving cash assistance in 1990
and 2000. During the 1990’s, the ranking of states in terms of immigrant uptake of welfare
changed relatively little, with the northeast, northern Midwest, and far west having the highest
fraction of immigrant households receiving cash assistance.
To summarize immigrant access to public benefits, we use Zimmerman and Tumlin’s
categorization.9 Table 1 shows that in 2002 the immigrant-native differential in welfare use was
11.8% in high-immigrant-access states and 4.7% in low-immigrant-access states. This compares
to 1994, when the differential was 11.9% in high-access states and 6.1% in low-access states,
8 See Leighton Ku, Shawn Fremstad, and Mathew Broaddus, “Noncitizens’ Use of Public Benefits Has Declined since 1996: Recent Report Paints Misleading Picture of Impact of Eligibility Restrictions on Immigrant Families,” Center for Budget and Policy Priorities, http://www.cbpp.org/4-14-03wel.htm. 9 A state is considered to offer immigrants high access to benefits if the state offers generous welfare benefits and makes these benefits relatively available to immigrants.

14
suggesting that over time welfare use by immigrants has fallen by more in low-access states.
Changes in welfare use over time are more pronounced at the level of individual programs. For
cash programs over 1994-2002, the immigrant-native differential in benefit use declined from
6.7% to 2.2% in high-access states and from 0.5% to -1.5% in low-access states; for food stamps,
the decline in the immigrant-native differential was from 6.3% to 2.2% in high-access states and
from 4.6% to -0.5% in low-access states. Thus, in low-access states, immigrant households
actually have become less likely than native households to use public benefits associated with
either cash transfers or food programs. Again, it is only for Medicaid that the immigrant-native
differential in welfare uptake appears to be stable over time.
Immigrant usage of public assistance is closely related to immigrant schooling. Figures 8a
and 8b plot the share of immigrant households on public assistance against the relative supply of
immigrant labor that is high skilled (the ratio of immigrant households headed by someone with
16 or more years of schooling to immigrant households headed by someone with less than 12
years of schooling).10 There is a strong negative relationship. Before or after welfare reform,
states with more skilled immigrant populations have lower immigrant uptake of welfare.
3.2 Public Opinion about Immigration
To evaluate differences in individual policy preferences about immigration, a key ingredient
is a measure of policy opinion. The NES is an extensive survey of individual political opinions,
including opinions about immigration, based on a stratified random sample of the U.S.
population. These surveys also report details on respondent characteristics including age,
10 The Census of Population and Housing collects information on pre-tax income in the form of supplemental security income (SSI), aid for families with dependent children (AFDC, which has become temporary assistance for needy families, or TANF), and general assistance. This is a partial list of means-tested entitlement programs, as the Census does not measure non-cash benefits provided through programs such as food stamps, Medicaid, public housing, etc. (Borjas and Hilton, 1996).

15
gender, educational attainment, location of residence, and other details on political views. To
evaluate preferences toward immigration, we use the following question from the NES.
"Do you think the number of immigrants from foreign countries who are permitted to come to the United States to live should be increased a little, increased a lot, decreased a little, decreased a lot, or left the same as it is now?"
For the main analyses of immigration in the paper, we set the variable Immigration Opinion
equal to 1 for those individuals favoring immigration to be decreased a little or a lot and 0 for
those individuals favoring immigration be maintained or increased. This question requires
respondents to reveal their general position on the proper direction for U.S. immigration policy.
In 2000, 44.8% of respondents favored decreasing immigration (15.0% by a little, 29.8% by a
lot), 44.5% favored leaving immigration unchanged, and 9.8% favored increasing immigration
(5.8% by a little, 4.0% by a lot).
Our theoretical discussion in Section 2 focused on two motivations for opposition to
immigration. One is the concern is that immigration put downward pressure on pre-tax wages
for less-skilled workers. A number of recent papers have found evidence consistent with this
prediction.11 Another motivation for opposition to immigrants is the concern that immigration
imposes a fiscal burden on native taxpayers. Hanson, Scheve, and Slaughter (2007) find
evidence consistent with this prediction. The focus of this paper is on how the skill-composition
of the immigrant population affects the labor-market and public-finance consequences of
immigration that individuals perceive. In the estimation, we will examine these considerations,
as well as non-economic factors possibly correlated with an individual’s stance on immigration
(e.g., political beliefs, ethnicity). But before turning to these estimates, it is instructive to see if
simple summary statistics reveal patterns consistent with these two considerations.
11 Scheve and Slaughter (2001a, 2001c), Kessler (2001), O’Rourke and Sinnott (2003), Mayda (2006). But also see Citrin, Green, Muste, and Wong (1997), and Hainmueller and Hiscox (2004).

16
Table 2 shows the fraction of native-born individuals favoring new restrictions on
immigration in the 1992 and 2000 NES surveys by three levels of education (less than high
school, high school or some college, college graduate) and by whether an individual’s state has
relatively a large immigrant population.12 In both 1992 and 2000, the least-educated natives
(those with less than high school) are more opposed to immigration in states with larger
immigrant populations. Since low-schooling natives are the group most exposed to labor-market
competition from immigrants, it makes sense that their opposition to immigration is strongest
where this competition is likely to be the most intense.
In either year, the most-educated natives (those with a college degree) are the least opposed
to immigration. However, they are somewhat more opposed to immigration in states with larger
immigrant populations (where this difference is larger in 1992 than in 2000). In high-immigrant
states, natives with high income potential are the group most exposed to the public-finance
consequences of immigration. This is suggestive evidence that individual opposition to
immigration is strongest where the fiscal burden associated with immigration is likely to be
greatest. However, since Table 2 does not control for individual characteristics, other than
education, or for state characteristics, other than the size of the immigrant population, we should
be cautious in interpreting these results. In section 4, we introduce additional controls.
To attempt to separate the labor-market versus public-finance motivations for opposition to
immigration, Table 3 adds to Table 2 a breakdown of native public opinion according to whether
an individual lives in a state in which immigrants have high access to public benefits.13 In 1992
both low-educated natives and high-educated natives are more opposed to immigration in states 12 High-immigrant states are defined to be those with a ratio of immigrants to natives of at least 0.12 (the national mean in 1990). Figure 3 shows this value identifies states that are spread out from the mass of states in the bottom left with low immigrant populations in both years. 13 In 1992, before welfare reform, high-access states are those Zimmerman and Tumlin (1999) identify as having generous public benefits. In 2000, after welfare reform, high-access states are those providing generous public benefits and relatively high availability of these benefits to immigrants.

17
in which immigrants have high access to public benefits. The same is again true for high-
educated natives in 2000. These findings, which replicate Hanson, Scheve, and Slaughter
(2007), are consistent with the theoretical framework in section 2, in which low-income natives
oppose immigration due to the perception that immigrants will crowd out their access to benefits
and high-income natives oppose immigration due to the perception that immigrants will increase
their net tax burden. The differential in opposition to immigration between high-access and low-
access states declines between 1992 and 2000, after welfare reform was implemented (and many
non-citizens lost access to welfare benefits). Again, Table 3 does not control for many other
characteristics and so should be taken as suggestive only.
To see whether the skill composition of the immigrant population matters for attitudes about
immigration policy, Tables 4 and 5 reproduce Tables 2 and 3, adding an additional breakdown
for whether a state has a high-skilled or a low-skilled immigration population. We define a high-
skilled immigration population as one in which the share of immigrants with 16 or more years of
schooling in a state is above the national average in a given year.
Table 4 shows some evidence—especially for less-skilled natives—that opposition to
immigration is weaker where the immigrant population is more skilled. For more-skilled natives
the reverse generally holds: in two of the three comparisons of college-graduate opinions across
low-skill and high-skill immigrant states, opposition is stronger in the high-skill states. These
patterns suggest that the skill composition of immigrants matters for considerations of labor-
market pressures, as high-skilled immigrants presumably complement less-skilled natives but
substitute for their more-skilled counterparts.
We see a similar pattern in Table 5, which breaks down states according to immigrant access
to public benefits and the skill composition of the immigrant population. In both years and both

18
public-finance regimes, high-school dropouts are less opposed to immigration when living in
states where the state immigrant population is more educated. The opposite is true for college
graduates in three of the four rows of Table 5.
Were a primary economic consequence of immigration to increase labor-market competition
for natives, we would expect low-skilled natives to be more opposed to low-skilled immigration
and high-skilled natives to be more opposed to high-skilled immigration. Tables 4 and 5 offer
some support for this prediction. In states where the immigrant population is more skilled, low-
skilled natives are less opposed and more-skilled natives are more opposed to liberalizing
immigration. In section 4, we extend the analysis to a regression framework.
Before moving forward, however, it is important to discuss why we think correlations
between education and opinions over immigration policy reflect labor-market issues rather than
non-economic considerations such as cultural attitudes. This issue was considered in some detail
in Scheve and Slaughter (2001a,c); here we highlight two important reasons for this
interpretation.
One reason is that the education-opinion cleavage is robust to including a wide range of
direct measures of non-economic considerations such as racial tolerance and attitudes towards
the proper role of the United States in the world. A second reason is that the education-opinion
cleavage is replicated when replacing educational attainment with alternative measures of labor-
market skills, such as actual earnings (e.g., average occupational wages). We prefer education
over earnings because income is well known to be poorly measured, nonrandomly missing in
surveys, and sensitive to transitory shocks (e.g., illness or bonuses) that do not reflect permanent
earnings power.
3.3 Individual Heterogeneity and Public Opinion

19
To this point, we have been treating individual location decisions and state fiscal and welfare
policies as exogenous or at least pre-determined. It is instructive to consider how endogenizing
these characteristics might affect the interpretation of the results. Suppose there is an
unobserved characteristic of individuals (e.g., ancestry, family history, personal experience) that
is correlated with individual policy preferences regarding immigration. All else equal, we would
expect individuals more opposed to immigration to be more likely to reside in states with smaller
immigrant populations. In Table 2, this would lead us to understate differences in public opinion
between high-immigrant and low-immigrant states (since individuals less opposed to
immigration would be more likely to live in high-immigrant states). Suppose also that states
whose native population is more opposed to immigration tend to enact welfare policies that are
less generous toward immigrants. In Table 3, this would again lead us to understate differences
in public opinion between high-immigrant and low-immigrant states (since individuals less
opposed to immigration would be more likely to live in high-immigrant-access states). It
appears, then, that likely patterns of correlation between unobserved individual characteristics
and state immigrant populations and welfare policies would tend to dampen regional variation in
public opinion, making it harder for us to find any systematic variation in attitudes toward
immigration, across either individuals or regions.
We attempt to control for non-economic factors that may affect individual attitudes toward
immigration by checking the robustness of the results to the inclusion of a large set of individual
characteristics as regressors. This is by no means a perfect solution to how unobserved
characteristics of individuals might affect the state in which they reside, but it will give a sense
of how robust the estimates are to additional covariates. We attempt to control for how
heterogeneity in state native populations might have affected state welfare policies by accounting

20
for state fixed effects in the regression. In so doing, we are assuming that changes in the state
native population do not have a large effect on state welfare policies over the eight-year period
that our sample covers. Given that the ranking of states in terms of their generosity toward
immigrants changes relatively little over the 1990’s (see Figure 7), this assumption does not
seem to be without merit. Our results are silent, however, on sources of state variation in welfare
policies. By controlling for state fixed effects, identification will come from the interaction
between individual characteristics and state characteristics, as we explain below.
A final issue related to unobserved sources of variation in public opinion has to do with
measurement error. Bertrand and Mullainathan (2001) argue that individual responses to
subjective questions are likely to contain errors in measurement, complicating their use in
econometric analysis. They are particularly suspect about using subjective responses as
dependent variables, since how individuals interpret questions or the precision and sophistication
with which they answer questions may be correlated with observed characteristics, such as age,
education, gender, race, etc. In the NES, one may be particularly concerned that individuals at
different education levels may have different interpretations of what it means to reduce
immigration by a little or a lot. There is no simple solution to this problem. We check the
robustness of the results to the inclusion of individual characteristics, where we try to use
characteristics that appear likely to be correlated with how individuals interpret questions (but
hopefully uncorrelated with opinions about immigration). However, this approach only partially
addresses the issue. The possibility of measurement error in the qualitative responses we
examine suggests it is important to exercise caution in interpreting the regression results.
4. Empirical Results
4.1 Empirical Specification

21
Our theoretical discussion in Section 2 highlighted that immigration is likely to affect an
individual’s economic well-being via pre-tax income, post-tax net fiscal transfers, and—the main
argument of this paper—perhaps by the skill mix of immigrants. Guided by this discussion, we
specify a reduced-form estimating equation for individual preferences over immigration policy.
Let *istI be a latent variable indicating opposition to immigration by a native individual i
living in state s at time t. We model the determinants of *istI as follows,
iststiststistkk
stistkkstistkkistjj0*ist
ZX)(1)(1
)(1)(1)(1)(1)(1I
μ+π+θ+λ+
γ+δ+β+α=
ImmMixEduc
FEEducImmEducEduc (4)
where j is an index from 1 to 3; k is an index from 1 to 4; )(1 istjEduc and )(1 istkEduc are a series
of dichotomous variables indicating individual educational attainment; )(1 stImmMix is the
dichotomous variable Immigrant Mix indicating whether the immigrant mix in the state in which
the respondent lives is highly skilled; )(1 stImm is the dichotomous variable High Immigration
indicating whether the state in which the respondent lives is a high-immigration state; )(1 stFE is
a dichotomous variable, Fiscal Exposure, indicating whether the state in which the respondent
lives faces a high level of fiscal exposure to immigration; X is a vector of individual-level
control variables, Z is a vector of state-level control variables; α , β , δ , γ , λ , θ , and π are
parameters to be estimated; and istμ is a mean-zero random error term that reflects unobserved
factors associated with individual preferences over changes in immigration policy, including the
impact of immigration on unobserved determinants of wage income and fiscal transfers.
The first term in this expression, 0α , is simply a constant. The second and third terms
evaluate the pre-tax income channel for how immigration and trade affect economic well-being.
The second term is indexed by j because for )(1 istjEduc we include three indicator variables,

22
High School, Some College, and College, with No High School as the omitted category. The
third term is indexed by k because we interact all four educational categories with the variable
High Immigration, indicating whether the respondent lives in high immigration state.
This parameterization provides a pre-tax labor-market interpretation of 3...1β and, when its
interactions are included, 4...1δ . In the presence of low-skilled immigration, we expect opposition
to immigration to be decreasing in respondent skill levels because of its effect on earnings across
skills. Thus the coefficient for College, 3β , should be less than zero, and perhaps the same will
hold for Some College, 2β . If immigrants alter wages locally rather than nationally, then
correlations between skills and opinion should be stronger in states with higher immigration
levels. This implies that the coefficient on the interaction between No High School and High
Immigration, 1δ , should be greater than zero and/or that the coefficient on the interaction
between College and High Immigration, 4δ , should be less than zero. 14
The fourth term in equation (4), )FE(1)Educ(1 stistkkγ , evaluates if the consequences of
immigration for post-tax net fiscal transfers have an important effect on policy opinions. We
interact all four educational variables (our proxy for different income groups) with Fiscal
Exposure, a dichotomous indicator equal to one for state-years that meet two conditions: (1) that
have relatively high welfare generosity, measured as above the national median welfare spending
per native; and (2) that have relatively high immigration populations defined as those states with
a ratio of immigrants to natives above the national average. See Hanson, Scheve, and Slaughter
(2007) for details on Fiscal Exposure.
14 The interactions between schooling and whether the respondent lives in a high-immigration state may also control for the price channel through which immigration affects individual utility. If consumption patterns vary by income and education, then the effect of immigration on prices in a state will depend on the relative size of the immigrant population in the state.

23
The parameters 4...1γ indicate whether respondents with No High School, High School, Some
College, and College in high fiscal-exposure states are more or less likely to oppose immigration.
Our theoretical discussion suggests that all respondents should be more opposed to immigration
in states with high fiscal exposure to immigrants, and that this should be especially true for high
income/educated individuals due to the progressivity of state tax and transfer systems. We
therefore expect parameters 4...1γ to be positive and increasing in magnitude.
The fifth term in equation (4), )(1)(1 stistkk ImmMixEducλ , evaluates the main argument of this
paper: that the skill mix of local immigrants has an important effect on individual economic
well-being and thus policy opinions. To test this idea we interact all four measures of
educational attainment with Immigration Mix, a dichotomous indicator equal to one for state-
years whose share of immigrants accounted for by college graduates exceeds the national
average. If all natives perceive skilled immigrants to generate important dynamic and/or non-
pecuniary benefits, then the parameters 4...1λ should all be negative. Alternatively, if the skill
mix of immigrants matters as a dimension of labor-market concerns, then we expect these
parameters to be negative only for respondents with No High School or (perhaps) High School.
The last terms in equation (2), istXθ and stZπ , estimate the effect of various individual-level
and state-level control variables including Age, Age Squared, dichotomous indicator variables
Female and Hispanic, State Unemployment, a year indicator variable for 2000, and a full set of
state dummy variables to account for time-invariant features of states that may influence
individual attitudes towards immigration. Some of these control variables account for the price
channel through immigration affects individual utility, which depends on consumption patterns
not measured in our data. Importantly, these controls may also capture some non-economic
influences on policy opinions. We will report results with many additional control variables that

24
measure tolerance, isolationist sentiment, ideology, and partisanship, all which more directly
attempt to account for non-economic determinants of policy opinions.
In equation (4), the latent variable *istI is unobserved. Let istI , Immigration Opinion, be an
indicator variable equal to one if an individual favors decreasing immigration (restricting trade)
and zero otherwise, in which case Pr( 0* >istI ) = Pr( 1=istI ). Assuming that the idiosyncratic
component of individual preferences, μist, is normally distributed, then the following applies:
))(1)(1)(1)(1)(1()1Pr( 0 stiststistkkstistkkistjjist ZXFEEducImmEducEducI δθλγβα +++++Φ== (5)
where Φ() is the standard normal cdf. We will estimate various specifications of equation (5) as
a probit and report robust standard errors clustered on states. All estimations use NES data for
native-born individuals pooled across 1992 and 2000.
4.2. Estimation Results
Our baseline specification results are reported in Table 6. Each column of Table 6
corresponds to a different specification of equation (5). We first note that the results across all
four specifications replicate the finding in the literature that more-skilled natives are less likely to
support immigration restrictions. Here, opposition to immigration is weakest among college
graduates. The coefficients on College across all four models imply that college graduates are 17
to 26 percentage points less likely to prefer fewer immigrants than high-school dropouts.
Our main result of interest is whether support for immigration is greater in states with higher
skill mixes of immigrants. Model 1 examines this idea by including as a regressor Immigration
Mix; here, we implicitly restrict to be equal all four parameters 4...1λ . The coefficient estimate on
Immigration Mix is significantly negative. An individual living in a state with an above-average

25
share of college graduates in its immigrant population is 5.9 percentage points less likely to
support immigration restrictions than is a comparable person living in a below-average state.
Model 2 interacts Immigration Mix with our full set of education indicators, to look for
variation in the impact of immigrant skill mix on native opinions. It is clear that the restrictive
Model 1 masked important differences across education groups. The coefficients on the
interactions between Immigration Mix and No High School and High School are negative, large
in magnitude, and statistically significant. But the coefficients on the interactions between
Immigration Mix and both Some College and College Graduate are smaller and not significantly
different from zero. Only less-skilled natives are more supportive of immigration in the presence
of more-skilled immigrants—the estimates in Model 2 imply by 18.4 and 8.3 percentage points
for high-school dropouts and high-school graduates, respectively.
This is the main finding of our paper. It is inconsistent with the hypothesis that more-skilled
immigrants elicit more support for freer immigration in all natives thanks to perceived dynamic
and/or non-pecuniary benefits. Instead, it resonates with earlier findings of concern over the
labor-market pressures of immigration. The opposition of less-skilled natives to freer
immigration is ameliorated when exposed to more-skilled immigrants that likely complement
rather than substitute for them in the labor market.
Models 3 and 4 in Table 6 examine the robustness of this interaction between native skills
and immigrant skill mix by expanding the specification of equation (5) to include other
regressors found to matter in earlier research. Model 3 adds the interactions of individual skills
with the indicator High Immigration, for high levels of immigration. As in Hanson, Scheve, and
Slaughter (2007), we find that native high-school dropouts living in high-immigration states are
significantly more likely to oppose freer immigration. This is consistent with immigrant inflows

26
having local rather than national labor-market impacts. Results for Immigration Mix are
attenuated for high-school dropouts, with a fall in magnitude and significance for its coefficient
estimate. But results for Immigration Mix interacted with High School are now stronger.
Finally, Model 4 adds the interactions of individual skills with the indicator Fiscal Exposure,
to capture states with high fiscal pressures from immigrant inflows. As in Hanson, Scheve, and
Slaughter (2007), college graduates are much less supportive of freer immigration when living in
states with high fiscal pressures from immigrants. For these highly skilled natives, pre-tax labor
market benefit of immigrant inflows may be offset by post-tax fiscal costs. But as in Model 3,
our results for Immigration Mix interacted with individual skills are largely unchanged. As in
Model 2, here in Model 4 the coefficients on the interactions between Immigration Mix and No
High School and High School are negative, large in magnitude, and statistically significant.
In Table 7 we examine the robustness of our Table 6 findings by adding to equation (5)
additional control regressors in istX . Consistent with many earlier studies showing an important
role for non-economic considerations in shaping opinions over immigration policy, we add
control regressors Government Employee (dichotomous indicator); Ideology, Isolationism, and
Tolerance (continuous, each constructed from various NES survey responses); and Union
Member (dichotomous indicator). These regressors may also be correlated with Bertrand-
Mullainathan measurement errors in qualitative responses about immigration.
These additional control regressors somewhat attenuate our results for our key regressor of
interest, Immigrant Mix. In Model 1 the coefficient estimate on Immigrant Mix is now smaller
and not significantly different from zero. In Models 2 through 4 the coefficient on the
interaction of Immigrant Mix and High School remains negative but is now again smaller and not
significantly different from zero. In Models 2 and 4, the coefficient on the interaction between
27
Immigration Mix and No High School remains negative, large in magnitude, and statistically
significant. We conclude from Table 7 that the broad pattern of Table 6 remains, but that the
role for the skill mix of immigrants in shaping policy opinions is less clear.
The attenuation of the results controlling for these other factors has at least three possible
interpretations. First, including measures such as Ideology, Isolationism, and Tolerance risks
introducing endogeneity into the analysis. For example, ideology may simply be a summary
statistic of individuals’ policy preferences including those about immigration policy. Second, the
attenuation of these estimates may indicate that the effect of skilled-immigration on policy
opinions is through these attitudinal variables. Respondents exposed to skilled immigration may,
for example, develop less isolationist and more tolerant attitudes that are correlated with less
restrictionist immigration policy positions. Finally, to extent that the attitudinal variables are
exogenous and well measured, the attenuation of the estimates may indeed reflect that the effect
of skill-immigration on policy opinions is weaker than reported in Table 6.
In unreported results, we examined additional factors that may shape individual opinions
about immigration policy. Huntington (2004) argues that opposition to immigration may be
rooted not just in the skill mix of immigrants but also in the perceived negative affects that
increasing cultural, ethnic, and linguistic diversity may have on the United States. He singles out
immigration from Latin America, which accounts for over 50% of new immigrant inflows since
1990, as having particularly weakened American identity. To the extent there are individuals in
our data who share Huntington’s views, opposition to immigration as expressed in the NES may
simply be proxying for opposition to Latino immigration. To examine this idea, we included
controls for the share of the state immigrant population that is from Latin America. In no

28
specification did the inclusion of this variable affect the results reported in Tables 6 and 7.
Additionally, the variable was statistically insignificant in most regressions.
5. Conclusions
Voters today remain sharply divided over the proper direction for U.S. immigration controls.
In this paper we have built on earlier research examining which cleavages underlie opinions over
immigration policy. We have examined whether individual opinions vary with the skill mix of
state immigrant inflows, above and beyond the pre-tax labor-market and post-tax fiscal cleavages
found in earlier work.
Our main finding is that skill composition does matter, but not across the board. Less-skilled
natives tend to support freer immigration more when living in states with a relatively skilled mix
of immigrants. The sensitivity of less-skilled natives’ opinions to the skill composition of
immigrants resonates with earlier findings of concern over the labor-market pressures of
immigration. It does not resonate with arguments that more-skilled immigrants will be preferred
because of perceived dynamic and/or non-pecuniary benefits.
One possible research extension of our study would be to examine the skill mix of local
immigrants in finer detail. Our analysis uses state-level data. It might be that immigration
opinions are especially sensitive to immigrant skill compositions far closer to home—e.g., by
counties or metropolitan areas, rather than entire states. For geographically large and ethnically
diverse states such as California, this finer focus might strengthen our somewhat mixed results.
We close with one possible policy implication suggested by our study. As discussed in the
introduction, today there are many calls for a reform of U.S. immigration policy with the broad
goal of overhauling admission rules to favor more-skilled immigrants. For various economic
goals (e.g., maximizing the boost to national output) such an overhaul might make sense. Our

29
findings in this paper suggest that this sort of policy reform may increase support for
immigration among the native constituency most opposed to liberalization—less-skilled workers.

30
References
Baker, Andy. 2003. “Why is Trade Reform so Popular in Latin America?” World Politics 55 (April): 423-55. Beaulieu, Eugene. 2002. “Factor or Industry Cleavages in Trade Policy? An Empirical Test of the Stolper-Samuelson Theorem.” Economics and Politics Vol. 14 No. 2 (July):99-131. Bertrand, Marianne and Sendhil Mullainathan. 2001. “Do People Mean What They Say? Implications for Subjective Survey Data.” American Economic Review Papers and Proceedings. 91(May): 67-72. Borjas, George J. 1999a. Heaven’s Door: Immigration Policy and the American Economy. Princeton, N.J.: Princeton University Press. Borjas, George J. 1999b. “The Economic Analysis of Immigration.” In Orley C. Ashenfelter and David Card, eds., Handbook of Labor Economics, Amsterdam: North-Holland, pp. 1697-1760. Borjas, George. 2003. “The Labor Demand Curve is Downward Sloping: Reexamining the Impact of Immigration on the Labor Market.” Quarterly Journal of Economics 118(4): 1335-74 Borjas, George J., Richard B. Freeman, and Lawrence F. Katz. 1997. "How Much Do Immigration and Trade Affect Labor Market Outcomes?" Brookings Papers on Economic Activity 1: 1-90. Borjas, George J., and Lynette Hilton. 1996. “Immigration and the Welfare State: Immigrant Participation in Means-Tested Entitlement Programs,” Quarterly Journal of Economics, 111(2), pp. 575-604. Card, David. 2001. “Immigrant Inflows, Native Outflows, and the Local Labor Market Impacts of Higher Immigration.” Journal of Labor Economics, 19 (1): 22-64. Citrin, Jack, Donald Green, Christopher Muste, and Cara Wong. 1997. "Public Opinion Toward Immigration Reform: The Role of Economic Motivation." The Journal of Politics 59 (3): 858-81. Fix, Michael, and Jeffrey Passel. 1999. “Trends in Citizens’ and Noncitizens’ Use of Public Benefits Following Welfare Reform, 1994-1997.” Washington, DC: The Urban Institute. Fix, Michael, and Jeffrey Passel. 2002. “The Scope and Impact of Welfare Reform’s Immigrant Provisions.” Washington, DC: The Urban Institute. Hainmueller, Jens, and Michael J. Hiscox. 2004. “Educated Preferences: Explaining Attitudes Toward Immigration in Europe.” Paper prepared for presentation at the Annual Meeting of the American Political Science Association.

31
Hanson, Gordon. 2005. "Challenges for U.S. Immigration Policy," in C. Fred Bergsten, ed., The United States and the World Economy: Foreign Economic Policy for the Next Decade, Washington, DC: Institute for International Economics, 343-372. Hanson, Gordon H. and Matthew J. Slaughter. 2002. “Labor-Market Adjustment in Open Economies: Evidence from U.S. States,” Journal of International Economics, 57 (1), pp. 3-29. Hanson, Gordon, Kenneth Scheve, and Matthew Slaughter. 2007. “Public Finance and Individual Preferences over Globalization Strategies.” Economics and Politics Vol. 19 No. 1 (March):1-33. Huntington, Samuel. 2004. “The Hispanic Challenge.” Foreign Policy, March/April 2004, pp. 30-45. International Monetary Fund. 2004. Government Finance Statistics. Washington, D.C. Kessler, Alan. 2001. “Immigration, Economic Insecurity, and the “Ambivalent” American Public.” Working Paper No. 41. Center for Comparative Immigration Studies, UCSD. Jain, Sanjay, Devesh Kapur, and Sharun Mukand. 2004. “Outsourcing and International Labor Mobility: A Political Economy Analysis.” Paper presented at the Institute for World Economics, Kiel, Germany.
Kletzer, Lori, and Robert Litan. 2001. “A Prescription to Relieve Worker Anxiety.” Policy Brief #01-2, Washington, D.C: Institute for International Economics.
Mayda, Anna Marie. 2006. “Who is Against Immigration?: A Cross-Country Investigation of Individual Attitudes toward Immigrants.” Review of Economics and Statistics Vol. 88:510-530. Mayda, Anna Marie, and Dani Rodrik. 2005. “Why Are Some People (and Countries) More Protectionist Than Others?” European Economic Review Vol. 49:1393-1430. National Science Foundation. 2004. Science and Engineering Indicators: 2004. Washington, D.C.: National Science Foundation. O’Rourke, Kevin, and Richard Sinnott. 2001. “The Determinants of Individual Trade Policy Preferences: International Survey Evidence.” In Brookings Trade Forum: 2001, Collins, S. M. and Rodrik, D. (eds.). Washington, D.C.: Brookings. O’Rourke, Kevin, and Richard Sinnott. 2003. “Migration Flows: Political Economy of Migration and the Empirical Challenges.” Working Paper. Rauch, James E. 2001. “Business and Social Networks in International Trade.” Journal of Economic Literature, 39, pp. 1177-1203. Rauch, James E., and Vitor Trindade. 2002. “Ethnic Chinese Networks in International Trade.” Review of Economics and Statistics, 84(1), pp. 116-130.
32
Rodrik, Dani. 1997. Has Globalization Gone Too Far? Washington, DC: Institute for International Economics. Rodrik, Dani. 1998. “Why Do More Open Economies Have Bigger Governments?” Journal of Political Economy Vol. 106 No. 5:997-1032. Sapiro, Virginia, Steven J. Rosenstone, Warren E. Miller, and the National Election Studies. 1998. American National Election Studies, 1948-1997 [CD-ROM]. ICPSR ed. Ann Arbor, MI: Inter-university Consortium for Political and Social Research [producer and distributor]. Saxenian, AnnaLee. 1999. Silicon Valley’s New Immigrant Entrepreneurs. Monograph, Public Policy Institute of California. Saxenian, AnnaLee. 2002. Local and Global Networks of Immigrant Professionals in Silicon Valley. Monograph, Public Policy Institute of California. Scheve, Kenneth F., and Matthew J. Slaughter. 2001a. Globalization and the Perceptions of American Workers. Washington DC: Institute for International Economics. Scheve, Kenneth F., and Matthew J. Slaughter. 2001b. "What Determines Individual Trade-Policy Preferences." Journal of International Economics, Vol. 54 No. 2 (August):267-292. Scheve, Kenneth F., and Matthew J. Slaughter. 2001c. "Labor-Market Competition and Individual Preferences Over Immigration Policy." Review of Economics and Statistics, Vol. 83 No. 1 (February):133-145. Scheve, Kenneth F. and Matthew J. Slaughter. 2004. “Economic Insecurity and the Globalization of Production.” American Journal of Political Science Vol. 48 No. 4 (October). Smith, J.P. and Edmonston, B (eds.). 1997. The New Americans: Economic Demographic, and Fiscal Effects of Immigration. National Academy Press: Washington, D.C. United States Trade Representative. 2003. “Revenue Implications of Trade Liberalization: Communication from the United States.” Communication to World Trade Organization, dated April 10. Zimmermann, Wendy, and Karen Tumlin. 1999. “Patchwork Policies: State Assistance for Immigrants under Welfare Reform.” The Urban Institute Occasional Paper Number 24.

33
Educational Attainment of Immigrants and Natives, March 2003
0.0
5.0
10.0
15.0
20.0
25.0
30.0
35.0
40.0
Less than 9thgrade
9th to 12th grade(no diploma)
High schoolgraduate
Some college orassociate degree
Bachelor's degree Advanced degree
Educational Attainment
NativesImmigrants
Figure 1

34
Earnings Distribution of Immigrants and Natives, 2002
0.0
5.0
10.0
15.0
20.0
25.0
30.0
$1 to 14,999 15,000 to 24,999 25,000 to 34,999 35,000 to 49,999 50,000 to 74,999 75,000 and up
Income Category
Natives
Immigrants
Immigrants with 12or more years ofeducation
Figure 2

35
Figure 3
Share of Immigrants in State Population
Imm
igra
nt S
hare
200
0
Immigrant Share 19900 .1 .2 .3 .4
0
.1
.2
.3
.4
North Ca
IndianaLouisian
Massachu
IowaWyoming
New Hamp
South Da
WisconsiVermont
MarylandColorado
GeorgiaUtah
Florida
Ohio
New Jers
Mississi
New Mexi
Kentucky
KansasIdahoMinnesot
New York
Pennsylv
West Vir
Hawaii
Washingt
Californ
Illinois
Nevada
Tennesse
Michigan
Connecti
Montana
District
Nebraska
VirginiaDelaware
Oklahoma
North Da
Oregon
Arizona
Maine
Texas
AlabamaArkansasSouth CaMissouri
Alaska
Rhode is

36
Figure 4a
Ratio of College Graduates to High School Dropouts, 1990Im
mig
rant
Col
lege
Gra
d R
atio
Native College Grad Ratio.5 1 1.5 2 2.5
0
1
2
3
4
Colorado
Hawaii
Washingt
Illinois
Tennesse
Iowa
New Jers
Utah
Louisian
Alabama
Maine
Rhode is
Massachu
Georgia
Michigan
Californ
Delaware
South Ca
New YorkMontana
Indiana
WisconsiPennsylv
Arizona
Mississi
Missouri
North Ca
Minnesot
District
North Da WyomingIdaho
Nebraska
Connecti
Alaska
Florida
New Mexi
Arkansas
South Da
Oklahoma
Maryland
Kentucky
New Hamp
NevadaTexas
Oregon
Virginia
KansasOhio
Vermont
Figure 4b
Ratio of College Graduates to High School Dropouts, 2000
Imm
igra
nt C
olle
ge G
rad
Rat
io
Native College Grad Ratio0 2 4 6
0
1
2
3
4
Michigan
Missouri
New York
IowaMassachu
Rhode is
Pennsylv
North Da
Maine
IllinoisNorth Ca
Arizona
Kansas
Delaware
AlaskaMontana
Wisconsi
Washingt
Utah
South Da
Maryland
Oklahoma
Nevada
Wyoming
Tennesse
Hawaii
Mississi New HampGeorgia
Vermont
Florida
MinnesotIndiana
Ohio
Connecti
KentuckyDistrict
Oregon
Idaho
CalifornNebraska
South Ca
Colorado
New Jers
TexasNew Mexi
Louisian
Arkansas
Virginia
Alabama

37
Figure 5a
Immigrant-Native Relative Education and Per Capita Income, 1990Im
mig
rant
/Nat
ive
Col
. Gra
d R
atio
Immigrant/Native Income.6 .8 1 1.2 1.4
0
2
4
6
8
Montana
North Ca
Georgia
North DaIllinois New Hamp
ConnectiNew Mexi
South DaKansas
Louisian
MassachuNew York
Tennesse
OregonIdaho
Missouri
AlaskaWyoming
Virginia
FloridaPennsylv
Iowa
VermontUtah
Ohio
Nevada
Minnesot Michigan
Kentucky
ColoradoHawaiiArizona
Mississi
Alabama
Maine
Arkansas
TexasRhode isCaliforn
South Ca
Oklahoma
MarylandIndiana
WashingtNew JersNebraska
DistrictDelaware
Wisconsi
Figure 5b
Immigrant-Native Relative Education and Per Capita Income, 2000
Imm
igra
nt/N
ativ
e C
ol. G
rad
Rat
io
Immigrant/Native Income.6 .8 1 1.2 1.4
0
1
2
3
OregonNevada
Iowa
Ohio
Mississi
Arizona
Michigan
New York
Arkansas
Minnesot
Kentucky
Texas
Missouri
Idaho
New Hamp
Maryland
Rhode is
North Da
Wyoming
Alabama
Indiana
Colorado
Alaska
Oklahoma
South Ca
FloridaWisconsi
New MexiCaliforn
Maine
Kansas
District
Tennesse
Delaware
Nebraska
New Jers
PennsylvNorth CaMontana
Hawaii
Virginia
Vermont
ConnectiWashingt
Georgia
Illinois
Louisian
MassachuUtah
South Da

38
Difference in Immigrant and Native Welfare Participation Rates
0.0
2.0
4.0
6.0
8.0
10.0
12.0
1994 1995 1996 1997 1998 1999 2000 2001 2002
Year
(Per
cent
of I
mm
igra
nt H
ouse
hold
s Rec
eivi
ng A
ssis
tanc
e)
- (Pe
rcen
t of N
ativ
e H
ouse
hold
s Rec
eivi
ng A
ssis
tanc
e)
Any Type of AssistanceAny Type of Cash BenefitMedicaidFood Stamps
Figure 6

39
Figure 7a
Share of Households Receiving Cash Assistance, 1990S
hare
of I
mm
igra
nts
on W
elfa
re
Share of Natives on Welfare0 .05 .1 .15
0
.05
.1
.15
Iowa
Oklahoma
Kansas
Tennesse
North Da
Californ
Kentucky
South Da
Massachu
Colorado
Alaska
Connecti
MarylandNew Hamp
VermontDelaware
LouisianOhio
Hawaii
Nevada
New Jers
Wisconsi
Wyoming
West Vir
Michigan
New York
Florida
Alabama
New Mexi
DistrictNorth Ca
IndianaMontana
Washingt
Georgia
MaineArizona
Nebraska
Virginia Arkansas
Illinois
Pennsylv
Texas
Rhode is
South Ca
Minnesot
Utah
Mississi
Missouri
Oregon
Idaho
Figure 7b
Share of Households Receiving Cash Assistance, 2000
Sha
re o
f Im
mig
rant
s on
Wel
fare
Share of Natives on Welfare0 .05 .1 .15
0
.05
.1
.15
Wyoming
Massachu
South Ca
MississiMontana
Nebraska
Alaska
Florida
South Da
Utah IllinoisIowa
Minnesot
WisconsiArizona
Maryland
Ohio
New Hamp
Georgia
Idaho
Louisian
Kansas
Maine
District
Texas
Tennesse
Connecti
Californ
West VirNew JersNorth Da
Oklahoma
AlabamaKentucky
New York
North Ca
Indiana
ArkansasNevada
PennsylvHawaii
New Mexi
OregonVermont
Washingt
Colorado
Virginia
Rhode is
MissouriMichigan
Delaware

40
Figure 8a
Education and Uptake of Cash Assistance among Immigrants, 1990S
hare
of I
mm
igra
nts
on W
elfa
re
Immigrant College Grad Ratio0 1 2 3 4
0
.05
.1
.15
Missouri
Utah
Pennsylv
Rhode is
Connecti
District
Oregon
Idaho
North Da
Minnesot
Delaware
Washingt
Oklahoma
Arkansas
Maine
IndianaSouth CaGeorgia
Alaska
Alabama
Wisconsi
Nebraska
Californ
South Da
New Hamp
Kansas
New Jers
Colorado
Illinois
VermontVirginia
Tennesse
Kentucky
Ohio
Massachu
North Ca
Maryland
New MexiTexas
Louisian Mississi
MichiganIowa
New York
ArizonaWyoming
Montana
Florida
Nevada
Hawaii
West Vir
Figure 8b
Education and Uptake of Cash Assistance among Immigrants, 2000
Sha
re o
f Im
mig
rant
s on
Wel
fare
Immigrant College Grad Ratio0 1 2 3 4
0
.05
.1
.15
Iowa
Nevada
North DaWisconsi Vermont
New Mexi
GeorgiaArkansas Virginia
TennesseIndiana
New Jers
MassachuPennsylv
Alabama
Oklahoma
WashingtNebraska
IdahoMaine
Texas
Californ
Maryland
Connecti
KansasMontana
Wyoming
Mississi
Oregon
South Ca
ColoradoUtah Michigan West Vir
North Ca
MissouriArizona
District
Florida
Illinois
Alaska
Delaware
New Hamp
Minnesot
Louisian
Kentucky
Ohio
South Da
New York
Rhode is
Hawaii

41
Table 1: Welfare Participation in More and Less Generous States
A. Welfare Participation Rates B. Cash Program Participation Rates
(% of Households Receiving Some Type of Assistance) (% of Households Receiving Cash Assistance)
Year
Less Generous
States
More Generous
States
Less Generous
States
More Generous
States
Less Generous
States
More Generous
States
Less Generous
States
More Generous
States Natives Immigrants Natives Immigrants
1994 16.7 13.9 22.8 25.2 7.7 7.6 8.2 14.3 1995 15.8 13.7 22.9 25.2 7.2 7.5 8.2 14.0 1996 16.2 13.9 19.3 24.0 7.0 7.6 7.4 13.1 1997 14.7 12.9 17.1 22.4 6.6 6.4 6.1 11.3 1998 13.9 12.6 16.9 21.9 5.7 6.0 5.6 10.5 1999 13.6 12.6 15.5 21.5 5.4 5.6 4.7 9.9 2000 14.0 12.9 15.4 23.7 5.1 5.1 3.4 9.1 2001 15.2 13.4 18.5 25.3 5.1 4.9 3.5 8.6 2002 16.0 13.7 20.7 25.5 4.9 4.9 3.4 8.3
C. Medicaid Participation Rates D. Food Stamp Participation Rates
(% of Households Receiving Medicaid) (% of Households Receiving Food Stamps)
Year
Less Generous
States
More Generous
States
Less Generous
States
More Generous
States
Less Generous
States
More Generous
States
Less Generous
States
More Generous
States Natives Immigrants Natives Immigrants
1994 14.1 12.4 18.6 23.6 9.6 7.3 14.2 13.6 1995 13.5 12.4 19.5 23.6 8.6 7.1 13.1 12.6 1996 14.0 12.6 17.2 22.7 8.3 7.2 11.0 11.4 1997 12.8 11.8 15.2 20.9 7.3 6.0 9.2 10.3 1998 12.2 11.6 15.4 20.7 6.4 5.2 5.7 9.1 1999 12.2 11.7 13.8 20.7 5.8 4.6 6.2 7.7 2000 12.5 12.2 14.0 22.6 5.8 4.3 4.8 6.7 2001 13.7 12.6 17.3 24.5 6.2 4.3 5.3 6.7 2002 14.5 12.8 19.4 24.7 6.3 4.6 5.8 6.8 Source: Current Population Survey, Annual Demographic Files, various years.

42
Table 2: Support for Immigration Restrictions
by Education Group and Size of State Immigrant Population
State Immigrant No High High School or College Year Population School Some College Graduate
1992 Low 46.0% 55.9% 40.0%
High 56.2% 53.7% 41.0%
2000 Low 49.7% 55.3% 35.3% High 70.1% 49.5% 37.2%
Notes: Table 2 reports the percent of native-born respondents stating they would prefer immigration to be decreased (by a little or by a lot) in the NES survey for a given year. No high school refers to those with up to 12 years of schooling but no high-school diploma, high school or some college refers to those with 12 to 15 years of schooling (with a high-school diploma), and college graduates refers to those with 16+ years of schooling. States with a high immigrant population have a ratio of immigrants to natives of at least 0.12 (the mean state immigrant/native population ratio for working-age adults in 1990). Summary statistics use NES sampling weights.
Table 3: Support for Immigration Restrictions by Education Group and Immigrant Access to Public Benefits
Immigrant Access No High High School or College
Year to Public Benefits School Some College Graduate
1992 Low 46.2% 54.7% 37.6% High 56.1% 55.7% 43.7%
2000 Low 59.7% 53.6% 34.7% High 56.0% 50.5% 38.8%
Notes: States with high immigrant access to public assistances are those with generous welfare benefits (in 1992) or with generous welfare benefits and high availability of these benefits to immigrants (in 2000) (see Zimmerman and Tumlin, 1999). See Notes to Table 2 for other details.

Table 4: Support for Immigration Restrictions by Education Group, Size of State Immigrant Population, and Composition of Immigrant Population
No High School High School or Some College College Graduate Size of State State Immigrant Skills State Immigrant Skills State Immigrant Skills
Year Immigrant Population Low High Low High Low High
1992 Low 56.9% 42.8% 56.2% 55.8% 38.4% 40.8% High 56.2% N.A. 53.7% N.A. 41.0% N.A.
2000 Low 46.4% 50.8% 56.9% 54.6% 25.0% 38.5% High 70.6% 67.7% 48.6% 53.7% 37.8% 35.0%
Notes: High-skilled immigrant population refers to states with a share of immigrants who have a college education that is above the national average. N.A. indicates average could not be calculated due to too few underlying observations in that cell. See Notes to Table 2 for other details.
Table 5: Support for Immigration Restrictions by Education Group, Immigrant Access to Public Benefits, and Composition of Immigrant Population
No High School High School or Some College College Graduate Immigrant Access State Immigrant Skills State Immigrant Skills State Immigrant Skills
Year to Public Benefits Low High Low High Low High
1992 Low 53.8% 42.9% 54.4% 54.9% 31.7% 42.3% High 59.0% 42.3% 54.8% 61.7% 45.0% 31.7%
2000 Low 66.5% 53.6% 49.8% 56.8% 34.3% 35.1% High 57.2% 54.4% 51.8% 47.3% 36.3% 43.4%
Notes: See Notes to Table 4.
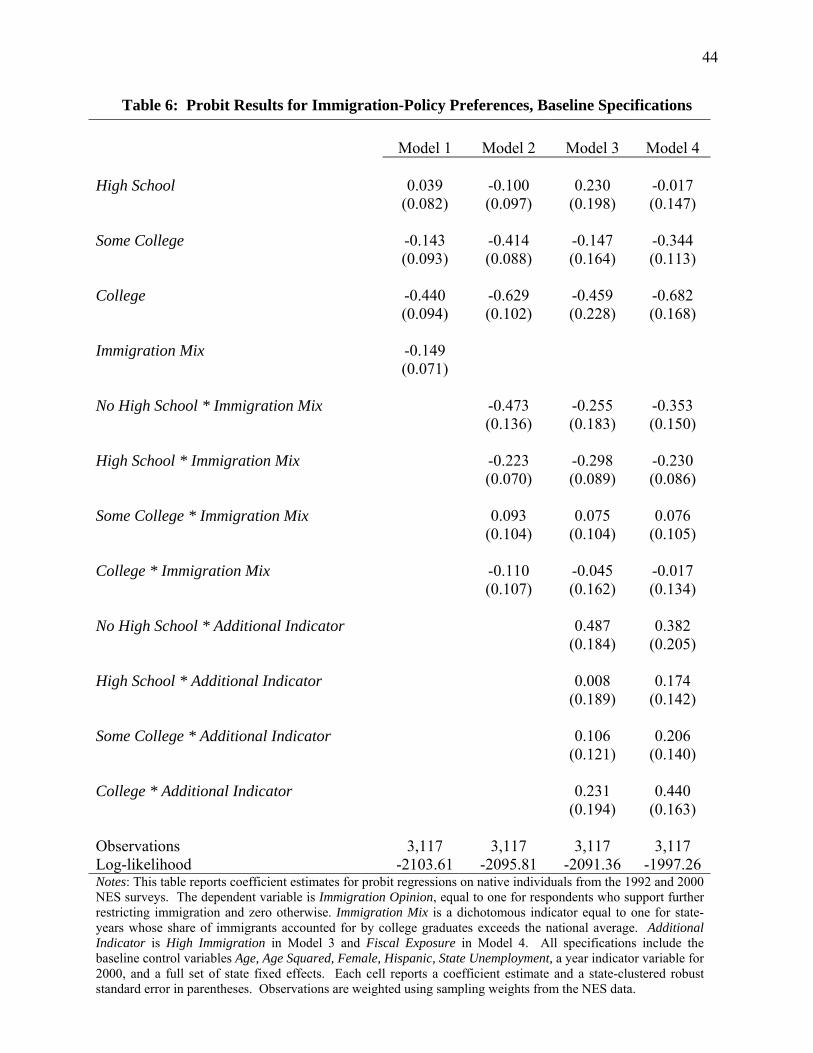
44
Table 6: Probit Results for Immigration-Policy Preferences, Baseline Specifications Model 1 Model 2 Model 3 Model 4 High School 0.039 -0.100 0.230 -0.017 (0.082) (0.097) (0.198) (0.147) Some College -0.143 -0.414 -0.147 -0.344 (0.093) (0.088) (0.164) (0.113) College -0.440 -0.629 -0.459 -0.682 (0.094) (0.102) (0.228) (0.168) Immigration Mix -0.149 (0.071) No High School * Immigration Mix -0.473 -0.255 -0.353 (0.136) (0.183) (0.150) High School * Immigration Mix -0.223 -0.298 -0.230 (0.070) (0.089) (0.086) Some College * Immigration Mix 0.093 0.075 0.076 (0.104) (0.104) (0.105) College * Immigration Mix -0.110 -0.045 -0.017 (0.107) (0.162) (0.134) No High School * Additional Indicator 0.487 0.382 (0.184) (0.205) High School * Additional Indicator 0.008 0.174 (0.189) (0.142) Some College * Additional Indicator 0.106 0.206 (0.121) (0.140) College * Additional Indicator 0.231 0.440 (0.194) (0.163) Observations 3,117 3,117 3,117 3,117 Log-likelihood -2103.61 -2095.81 -2091.36 -1997.26 Notes: This table reports coefficient estimates for probit regressions on native individuals from the 1992 and 2000 NES surveys. The dependent variable is Immigration Opinion, equal to one for respondents who support further restricting immigration and zero otherwise. Immigration Mix is a dichotomous indicator equal to one for state-years whose share of immigrants accounted for by college graduates exceeds the national average. Additional Indicator is High Immigration in Model 3 and Fiscal Exposure in Model 4. All specifications include the baseline control variables Age, Age Squared, Female, Hispanic, State Unemployment, a year indicator variable for 2000, and a full set of state fixed effects. Each cell reports a coefficient estimate and a state-clustered robust standard error in parentheses. Observations are weighted using sampling weights from the NES data.

45
Table 7: Probit Results for Immigration-Policy Preferences, Expanded Specifications
Model 1 Model 2 Model 3 Model 4 High School -0.026 -0.215 0.005 -0.150 (0.114) (0.145) (0.280) (0.203) Some College -0.234 -0.560 -0.410 -0.497 (0.130) (0.136) (0.229) (0.152) College -0.479 -0.729 -0.569 -0.763 (0.126) (0.133) (0.234) (0.181) Immigration Mix -0.072 (0.124) No High School * Immigration Mix -0.563 -0.419 -0.494 (0.224) (0.264) (0.239) High School * Immigration Mix -0.155 -0.199 -0.148 (0.128) (0.134) (0.130) Some College * Immigration Mix 0.183 0.193 0.191 (0.114) (0.152) (0.148) College * Immigration Mix -0.013 -0.006 0.075 (0.146) (0.193) (0.161) No High School * Additional Indicator 0.402 0.409 (0.290) (0.276) High School * Additional Indicator 0.091 0.266 (0.146) (0.151) Some College * Additional Indicator 0.180 0.261 (0.146) (0.165) College * Additional Indicator 0.164 0.456 (0.204) (0.186) Observations 2,277 2,277 2,277 2,277 Log-likelihood -1478.91 -1471.22 -1469.68 -1422.17 Notes: This table reports coefficient estimates for probit regressions on native individuals from the 1992 and 2000 NES surveys. The dependent variable is Immigration Opinion, equal to one for respondents who support further restricting immigration and zero otherwise. Immigration Mix is a dichotomous indicator equal to one for state-years whose share of immigrants accounted for by college graduates exceeds the national average. Additional Indicator is High Immigration in Model 3 and Fiscal Exposure in Model 4. All specifications include the baseline control variables Age, Age Squared, Female, Hispanic, State Unemployment, a year indicator variable for 2000, and a full set of state fixed effects. They also include the additional control variables Government Employee, Ideology, Isolationism, Tolerance, and Union Member. Each cell reports a coefficient estimate and a state-clustered robust standard error in parentheses. Observations are weighted using NES sampling weights.