Embed Size (px)
Citation preview

UNCTAD Expert Meeting on Results from Pilot
Surveys on Exports of ICT-enabled Services
Indian survey - implementation, preliminary results and
next steps
28-29 November 2017Geneva, Switzerland
Dr Prafulla Chandra MishraStatistical Advisor, DGFT
Ministry of Commerce & Industry,
Government of India
1

India’s Trade in Services – Current Scenario
2
India’s services export increased from $ 151.5 billion in 2013-14 to
160.7 billion in 2016-17. The CAGR of services export (2016-17
over 2013-14) is estimated at 2.3%.
In August 2017, India’s Services export was US$ 13.7 billion as
compared to US$ 13.4 billion in August 2016, registering a positive
growth of 2.39%.
During April- August, 2017 it was US$ 66.6 billion as compared to
US$ 65.8 billion during the corresponding period of the previous
year, registering a positive growth of 1.15%.
India’s services import also increased from US$ 85.7 billion in 2015-
16 to US$ 95.7 billion in 2016-17 and during the current year (Apr-
Aug 2017) the value of import was US$ 38.3 billion.
India has thus maintained a favourable trade balance in services
trade: US$ 65.2 billion in 2016-17 and US$ 28.3 billion in the
current year (April-August 2017).

India’s Trade in Services – Recent Trends
3
1290413430 13388 13178
13701
72227615 7457 7334
8658
5682 5815 5931 58445043
0
2000
4000
6000
8000
10000
12000
14000
16000
Apr, 17 May, 17 June, 17 July, 17 Aug, 17
Va
lue
in U
S$
Mil
lio
nFig 1: Trend of Services Trade during April, 17 to August,
17
Exports
Imports
Trade
Balance
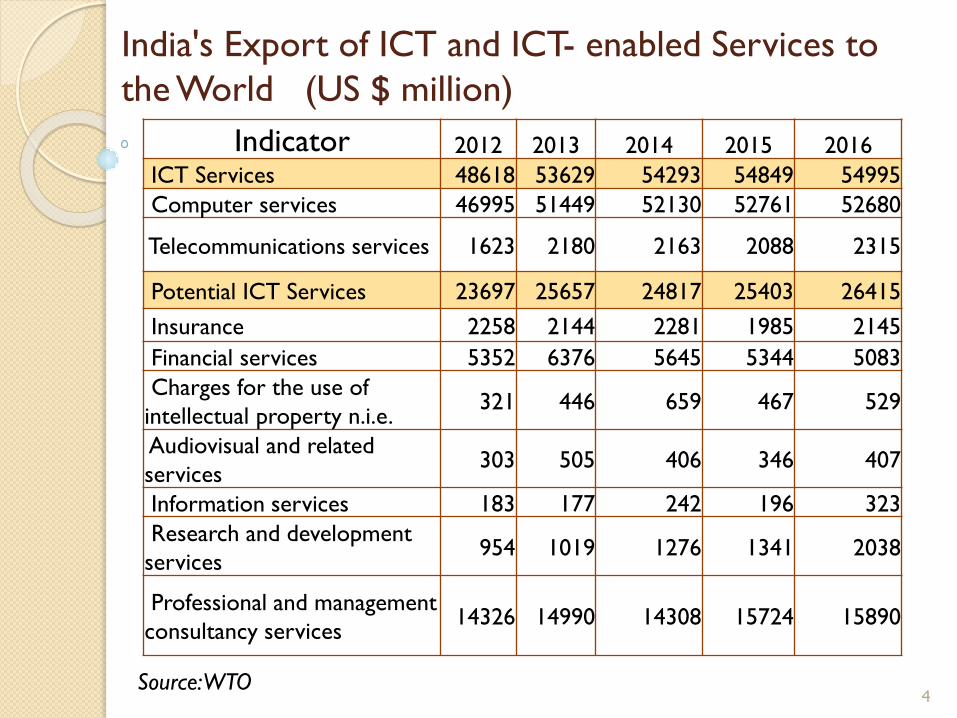
India's Export of ICT and ICT- enabled Services to
the World (US $ million)
Indicator 2012 2013 2014 2015 2016
ICT Services 48618 53629 54293 54849 54995
Computer services 46995 51449 52130 52761 52680
Telecommunications services 1623 2180 2163 2088 2315
Potential ICT Services 23697 25657 24817 25403 26415
Insurance 2258 2144 2281 1985 2145
Financial services 5352 6376 5645 5344 5083
Charges for the use of
intellectual property n.i.e.321 446 659 467 529
Audiovisual and related
services303 505 406 346 407
Information services 183 177 242 196 323
Research and development
services954 1019 1276 1341 2038
Professional and management
consultancy services14326 14990 14308 15724 15890
Source: WTO4

0
10000
20000
30000
40000
50000
60000
2012 2013 2014 2015 2016
Miilio
n U
S$
Computer services
Telecommunications
services
Insurance services
Financial services
Charges for the use of
intellectual property n.i.e.
Audiovisual and related
services
Information services
Research and
development services
Professional and
management consulting
services
India's Export of ICT and ICT- enabled Services to
the World
5
Source: WTO
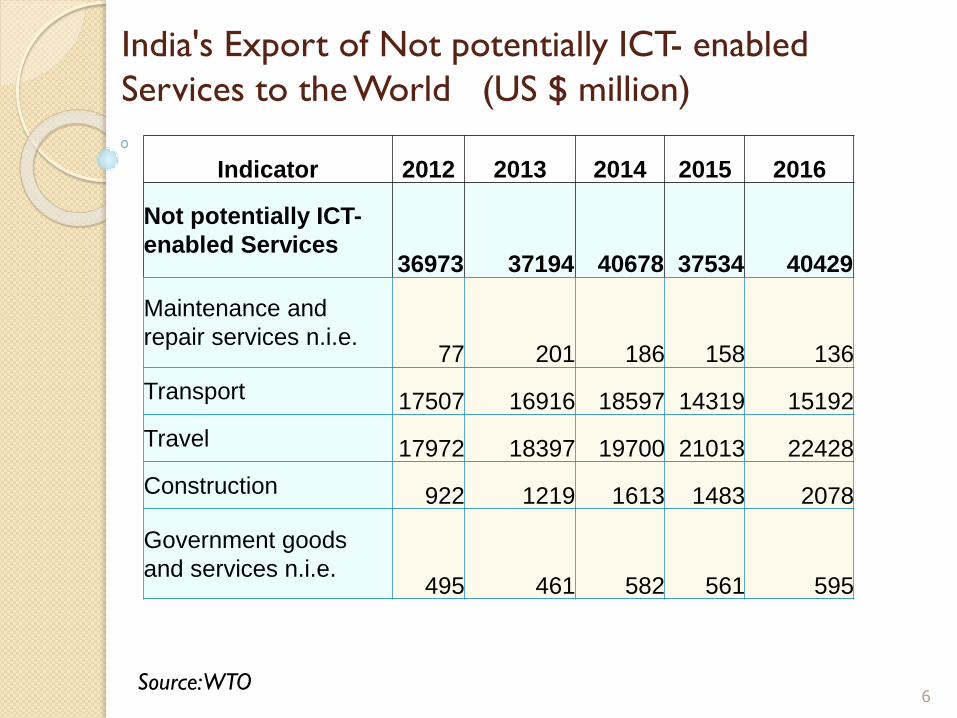
India's Export of Not potentially ICT- enabled
Services to the World (US $ million)
6
Indicator 2012 2013 2014 2015 2016
Not potentially ICT-
enabled Services36973 37194 40678 37534 40429
Maintenance and
repair services n.i.e.77 201 186 158 136
Transport 17507 16916 18597 14319 15192
Travel 17972 18397 19700 21013 22428
Construction 922 1219 1613 1483 2078
Government goods
and services n.i.e.495 461 582 561 595

India's Export of Not potentially ICT- enabled
Services to the World
7
0
5000
10000
15000
20000
25000
2012 2013 2014 2015 2016
Miilio
n U
S$
Maintenance and
repair services n.i.e.
Transport
Travel
Construction
Government goods
and services n.i.e.

Services Trade in India – Importance and Data
Sources
8
As per the Balance of Payment (BOP) data published by the Reserve Bank of
India (RBI), Telecommunications, Computer and Information services,
Business services, Travel, Transport and Insurance services contribute to
more than 92% of India’s services export.
Analysis based on WTO data shows that ICT and ICT-enabled services
export contribute to about 50 percent of the total services exports in India.
Hence there is a growing interest in accurately measuring the data in this
sector for necessary policy intervention by Directorate General of Foreign
Trade (DGFT), Department of Commerce, Government of India in order to
promote export in services in general and ICT and ICT-enabled services in
particular.
The Reserve Bank of India (RBI) provides aggregate level statistics on
services trade following the standard classification as stipulated under the
IMF’s Balance of Payment Manual, Version 6 (BPM 6).
More disaggregated quarterly data on invisibles receipts/payments covering
63 services categories, including IT and ITeS, are released by RBI through
press releases. However, this also does not meet the demand for disaggregate
level services trade statistics –by partner country and mode of delivery.

Data Generation for ICT and ICT- enabled Services
Trade in India
9
There are several classifications in use by different agencies for
classifying IT & ITeS services for generation of data:
SOFTEX Form – Classifies software exports into 6 different categories
Annual Survey of RBI – Classifies software & IT services exports into 34
different categories
STPI - Classifies software & IT services exports into 27 different categories
Technical Group constituted by Department of Commerce -
Recommended classification of IT & ITeS into 21 different categories
The major sources of data in this sector are:
BOP data released by RBI every month.
Annual survey of RBI on Computer Software and Information
Technology enabled services exports carried out since 2002-03.
STPI annual reports
SEZ data by Department of Commerce

Data Generation for ICT and ICT- enabled Services
Trade in India
10
Following the recommendations of the BPM 6, the survey collects and
compiles information on 4 major categories of IT-enabled services:
o IT Services
o ITES/Business Process Outsourcing (BPO) Services
o Engineering Services
o Software Products
RBI compiles and publishes figures on exports of computer software
and IT-enabled services for (i) groups of countries and (ii) mode of
delivery.
However, the survey does not cover other important categories of ICT-
enabled services like Telecommunications, Information services,
Insurance, Licensing services, Sales & marketing services, and Education
and training services.
Data generation in these categories is still a distant reality, though five
pilot surveys on trades in Telecommunications, Audiovisual, Logistics
and Professional Services and Health Services have been carried out in
India to collect mode-wise and country-wise trade in services data.

Pilot Survey on ICT-enabled services in technical
collaboration with UNCTAD
11
A pilot survey to collect international trade data in ICT-enabled
services was launched in July 2017 in technical collaboration with
UNCTAD after a training workshop organized at DGCI&S, Kolkata .
The UNCTAD classification of 9 categories of services has been
adopted in this survey with minor deviations in financial services and
exclusion of insurance services.
The survey is to provide information on both country wise and mode
wise export for the 8 sub-sectors of the ICT- enabled services.
Financial services has been kept outside the coverage of the
present survey as RBI is conducting an annual survey on international
trade in banking services and collects fairly disaggregate level
information on this category.
In the current survey, information on financial services are being
collected from those units who along with other ICT-enabled services
also provide financial services.

Pilot Survey on ICT-enabled services in technical
collaboration with UNCTAD
12
In view of the complexity involved in collection of information for
insurance sector and also because of the fact that the usual concept of
mode of supply does not appropriately apply to this sector, it has been
decided not to cover insurance services in the present survey.
The reference period for the survey is the financial year 2016-17
(April 2016 to March 2017).
The survey is being conducted under the legal framework of
Collection of Statistics Act (CSA) 2008 that makes statutorily
obligatory on part of the respondents to furnish the information called
for within the prescribed time.
The CSA 2008 also guarantees the confidentiality of the information
provided and there are legal penalty provisions available under the
Act to deal with non-compliance .

Sampling Frame
13
The first and foremost requirement for conduct of a survey is
the availability of a business register or the complete list of
units engaged in exports of services.
Non-availability of a business register in India is a major
challenge in conduct of a countrywide survey.
Sector specific frames have been prepared by collating basic
information like name of unit, address, contact details, website
address etc. from a number of sources, but still not exhaustive.
Information collected in this way has been updated before
beginning the survey to capture the latest changes in address
as well as contact details of the existing units.
The sampling frame (list of units) has been prepared with
inputs from RBI, STPI, NASSCOM and several other sources.

Survey Design and Conduct of the Pilot Survey
14
A mixed approach of covering census and sampling sector adopted.
Units are covered 100% for Census sector and sampling units are
chosen following simple random sampling without replacement
(SRSWOR) for Sampling sector; Category -wise survey design in
next two slides.
The selected enterprises have been issued notices under the CSA
2008 and encouraged to self-compile on the basis of the guidelines
issued and submit information to DGCI&S within one month from
the date of the receipt of the notice, followed by telephonic
persuasion and issue of reminders for submission of information
expeditiously.
Field investigators are not available now to be sent for collection of
information to those enterprises that are unable to self-compile
for submission of the information. Recruitment of 34 field
personnel in 7 large cities is in progress now after approval by
DGFT /DoC.
A total of 2600 units were initially proposed to be covered in the
survey.
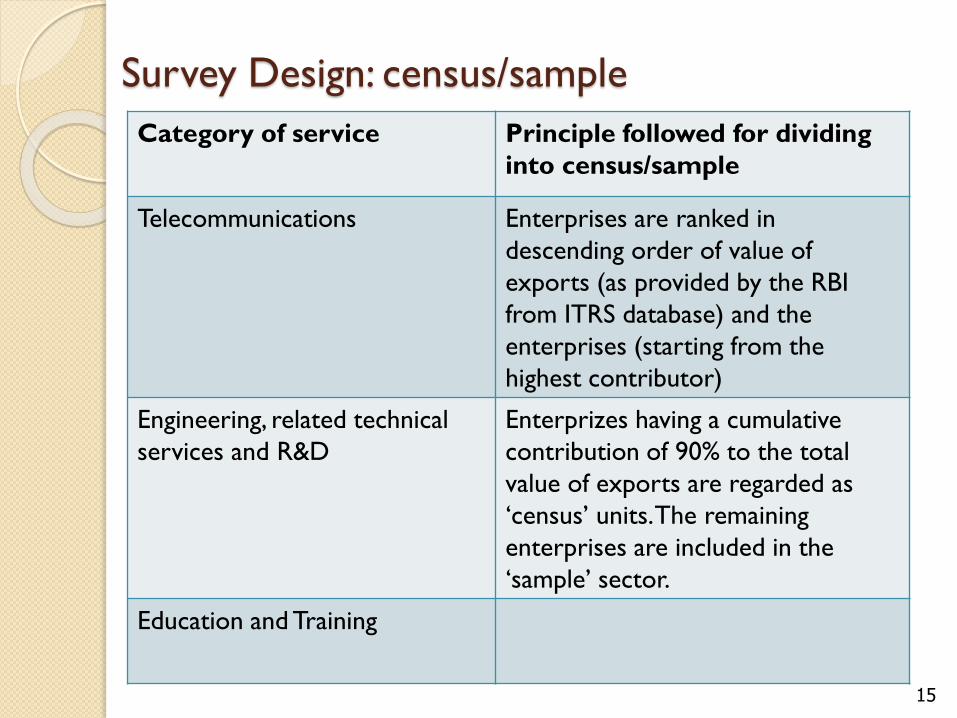
Survey Design: census/sample
15
Category of service Principle followed for dividing
into census/sample
Telecommunications Enterprises are ranked in
descending order of value of
exports (as provided by the RBI
from ITRS database) and the
enterprises (starting from the
highest contributor)
Engineering, related technical
services and R&D
Enterprizes having a cumulative
contribution of 90% to the total
value of exports are regarded as
‘census’ units. The remaining
enterprises are included in the
‘sample’ sector.
Education and Training

16
Category of service Principle followed for dividing
into census/sample
Computer services (including
computer software)
Top 100 enterprises from
NASCOMM’s member list having a
cumulative contribution of 70% to
the total value of exports are
included in ‘census’ sector. Apart
from this, STPI units which are not
members of NASCOMM are also
regarded as ‘census’ units. The
remaining enterprises are included
in the ‘sample’ sector.
Sales and marketing services,
not including trade and leasing
services
Information services
Management, administration and
back office services
Licensing services
Survey Design: census/sample

Progress of ICT-enabled Services Survey 2016-17
17
Category of Services Notices Delivered Reply Received
Audio Visual 84 40
Education 154 85
Engineering 143 73
Telecom 65 41
IT 776 488
STPI 1082 623
Financial 181 76
Total 2485 1426
Out of the originally proposed 2600 units, notices could be served
to only 2485 in 7 subsectors.
As on 20 Nov 2017, the overall response is only 1426 (57%) as
exhibited in the following table.

Timeline originally proposed for the survey
18
Activity Jun
2017
Jul
2017
Aug
2017
Sep
2017
Oct
2017
Nov
2017
Dec
2017
Jan
2018
Feb
2018
Mar
2018
Issue of
notices
Completion
of data
collection
Scrutiny,
validation
of data and
generation
of tables
Report
writing and
release of
results

Challenges and Issues
19
Survey on trade in services requires a pre-established business directory.
Absence of a business directory for all the covered sectors is a major
hindrance for conduct of surveys in the area of services trade. FIEO
(Federation of Importers and Exporters Organisation) and Export
Promotion Councils working under Department Commerce
should be taken on board for updating sectoral frames.
Non-availability of a proper frame severely affects the design of the survey,
issue of notices and the precision of the survey estimates.
Reluctance of industry and trade associations like CII and FICCI to share
their Members 'lists. Moreover, all those registered with associations and
councils do not necessarily trade.
A number of enterprises do not understand the modes of services trade.
Others who know do not collect detailed information on international trade
by sub-sectors and by modes of supply.
Some of the respondents pointed out that raised concerns about sharing
financial information without permission from higher authorities.
Online survey is given least priority in the absence of a regulatory
framework and other technical issues like slow server speed, etc.
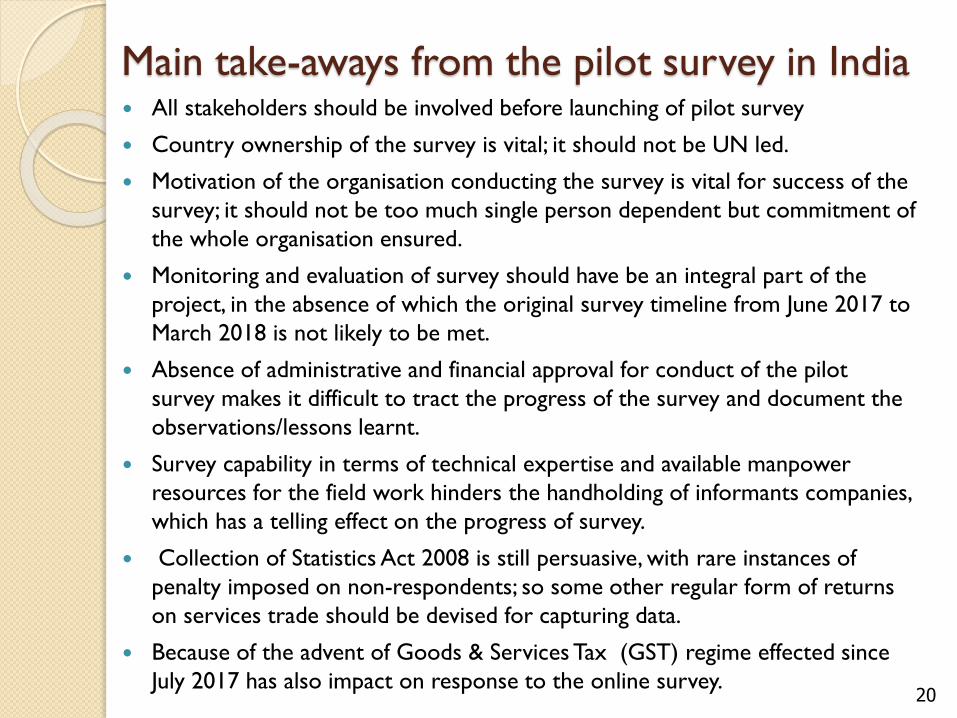
Main take-aways from the pilot survey in India
20
All stakeholders should be involved before launching of pilot survey
Country ownership of the survey is vital; it should not be UN led.
Motivation of the organisation conducting the survey is vital for success of the
survey; it should not be too much single person dependent but commitment of
the whole organisation ensured.
Monitoring and evaluation of survey should have be an integral part of the
project, in the absence of which the original survey timeline from June 2017 to
March 2018 is not likely to be met.
Absence of administrative and financial approval for conduct of the pilot
survey makes it difficult to tract the progress of the survey and document the
observations/lessons learnt.
Survey capability in terms of technical expertise and available manpower
resources for the field work hinders the handholding of informants companies,
which has a telling effect on the progress of survey.
Collection of Statistics Act 2008 is still persuasive, with rare instances of
penalty imposed on non-respondents; so some other regular form of returns
on services trade should be devised for capturing data.
Because of the advent of Goods & Services Tax (GST) regime effected since
July 2017 has also impact on response to the online survey.

Way Forward
21
Data collection capability of DGCI&S through surveys is being strengthened; as
an interim measure, DGFT/DoC has approved the engagement of 34 retired
field personnel from NSSO, MoSPI in the major cities of Bengaluru, Mumbai,
Chennai, Delhi, Kolkata, Hyderabad and Ahmadabad, where Services trade are
predominant.
The process of engaging retired field personnel to supervise ICT-enabled
services exports and other surveys has been initiated and deployment likely
from January 2018.
As an alternative to setting up Regional units of DGCIS, a proposal to
strengthen NSSO Field Offices through creation of infrastructure and
manpower is also under discussion with the MOSPI.to undertake services trade
surveys.
At the request of DoC, NSSO has launched in September 2016 a nationwide
survey on services trade in its 74th round to capture values of exports and
imports by top 5 partner countries and top 5 types of services; the survey is to
be completed in June 2017 and estimates are expected to be released by the
end of Aug 2018.
Quarterly data on exports of IT & IT enabled services based on data from STP
units is expected to be compiled by DGCI&S from the first Quarter of 2017-18
for only Mode 1 delivery of services.

Way Forward
22
Based on the National Product Classification for Services Sector 2010, GST
Council has notified 567 Service Accounting Codes (SAC) for classifying
services under GST framework, launched in India from 1st July 2017.
Compilation of Export and Import of Services through the returns of GSTR 1 &
GSTR 2 is likely to bring uniformity in classification of services trade and reduce
data gaps to a large extent in future.
GSTR 1 provides details of outward supplies of goods and services while GSTR
2 provides the data on import of service.
With some suggested modifications to GSTRs, it is possible to capture SAC
wise and country wise information of services export and import on a
monthly/annual basis.
The GST Network (GSTN) has provisions for registering all enterprises
carrying out export and import of both goods and services; this will pave the
way for developing a sector wise business directory and once this is done, it
would be possible to launch a Generic Survey to estimate India’s overall services
exports by partner country and mode of supply annually.
Quarterly data on exports of IT & IT enabled services based on data from STP
units is also expected to be compiled by DGCI&S from the first Quarter of
2017-18 for only Mode 1 delivery of services.

23