Embed Size (px)
Citation preview
1 | P a g e I S M D E P T O F C O M M E R C E A N D H U M A N I T I E S E C O N O M I C S N O T E S
INDIAN SCHOOL MUSCAT SENIOR SECTION
Department of Commerce and Humanities
Class : XII Question Bank SERIES -1
MICRO ECONOMICS
Reference:
NCERT Text
Book
Date of issue
--------------2017
ECONOMICS (030)
Date of submission
------------------2017
UNIT-I
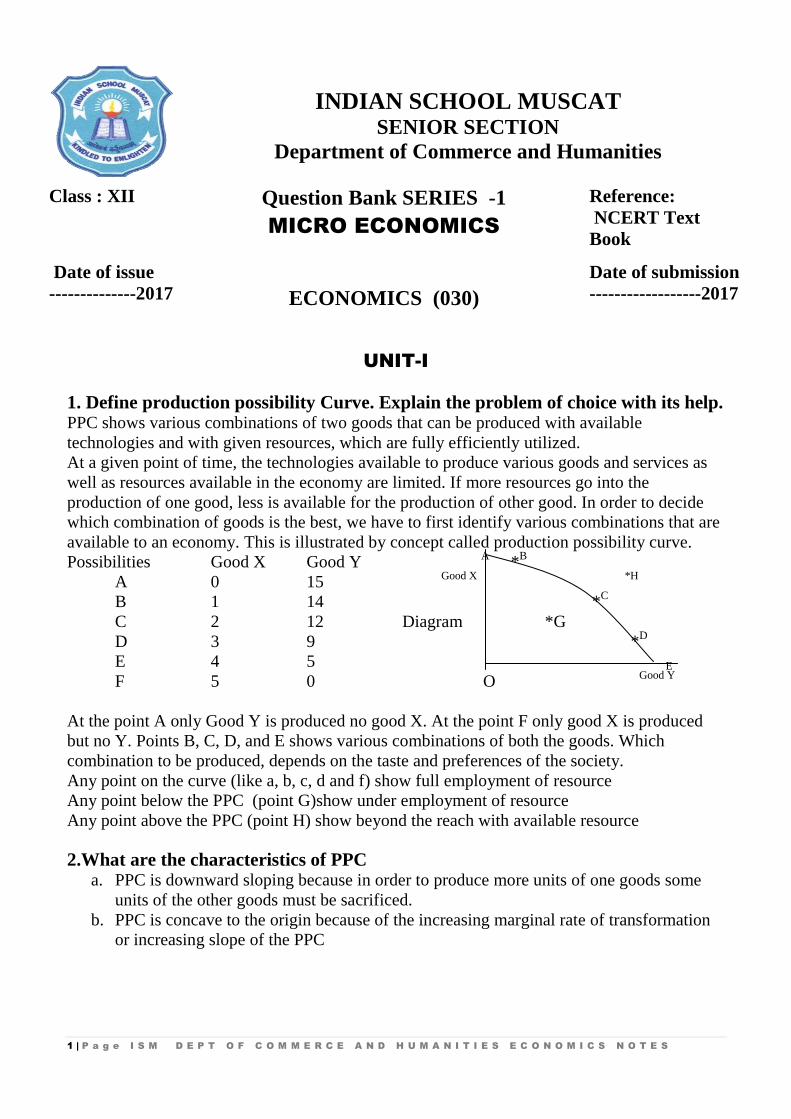
1. Define production possibility Curve. Explain the problem of choice with its help. PPC shows various combinations of two goods that can be produced with available
technologies and with given resources, which are fully efficiently utilized.
At a given point of time, the technologies available to produce various goods and services as
well as resources available in the economy are limited. If more resources go into the
production of one good, less is available for the production of other good. In order to decide
which combination of goods is the best, we have to first identify various combinations that are
available to an economy. This is illustrated by concept called production possibility curve.
Possibilities Good X Good Y A *
B
A 0 15 Good X *H
B 1 14 *C
C 2 12 Diagram *G
D 3 9 *D
E 4 5 E
F 5 0 O Good Y
At the point A only Good Y is produced no good X. At the point F only good X is produced
but no Y. Points B, C, D, and E shows various combinations of both the goods. Which
combination to be produced, depends on the taste and preferences of the society.
Any point on the curve (like a, b, c, d and f) show full employment of resource
Any point below the PPC (point G)show under employment of resource
Any point above the PPC (point H) show beyond the reach with available resource
2.What are the characteristics of PPC a. PPC is downward sloping because in order to produce more units of one goods some
units of the other goods must be sacrificed.
b. PPC is concave to the origin because of the increasing marginal rate of transformation
or increasing slope of the PPC
2 | P a g e I S M D E P T O F C O M M E R C E A N D H U M A N I T I E S E C O N O M I C S N O T E S
3. What are the causes of Shift in PPC to right? It indicates economic growth. It can be due to:-
a. Increase in labour availability
b. Improvement in technology of production
c. Increase in productivity of labour
d. Growth of finding of new resources
4. What are the causes of Shift in PPC to left? It indicates decrease in productive capacity of the economy. It can be due to:-
a. Natural calamities and wide spread destruction of capital stock
b. Decrease in labour supply
c. Depletion if resources.
5. Define Resources. State its two characteristics. Resources are inputs used in the production of goods and services. Two important features of
resources that give rise to economic problems are
a. Resources are limited in supply
b. Resources have alternative uses.
6. Explain the Central Problems of an economy related to allocation of resources. a. What is produced and in what quantities:- How much of each commodity to be
produced-whether to produce more food, clothing, housing, luxury goods etc. Whether
to allocate more resources on production of education, health or military services etc.
Whether to produce more consumer goods or investment goods.
b. How are these goods produced?- This refer to technology of production. How much
of which of the resources to use in production of each of the different good. Whether to
use more labour or capital or which of the available technology to be utilized?
c. For whom to produce?- how should the produce of the economy be distributed among
the individuals in an economy? Who gets more and who gets less? Whether to ensure a
minimum amount of consumption to every one in the society? Whether the basic
education and public health be available to all in the country Etc. For whom to produce
refer to distribution of income in the society.
7. Define Micro and Macro economics. Micro economics: It deals with individual economic units. Example: Price theory
Macro economic: It deals with the economy as a whole: Theory of income determination
8. Distinguish between positive and normative economics. Positive economics: It deals with ‘what a phenomenon is’ and ‘what it likely to be’- It
explains a fact. There are no value judgement
Normative economics: It deals with “what should be” or what is desirable” based on value
judgment.
3 | P a g e I S M D E P T O F C O M M E R C E A N D H U M A N I T I E S E C O N O M I C S N O T E S
UNIT II- UTILITY ANALYSIS
9. Define utility:- UTILITY is the satisfaction that a consumer derives from consuming a
product.
10.Define Marginal Utility and State law of diminishing marginal utility.
MARGINAL UTILITY is the utility from the last unit consumed. It is defined as addition to
total utility from the consumption of an additional unit of a good.
The law of diminishing marginal utility states that the intensity of desire of a commodity
must fall when a consumer consumes more and more unity of the same commodity. According
to this law marginal utility of a commodity diminishes as more and more units of a commodity
is consumed.
11. State the relationship between Total Utility and Marginal Utility. Total Utility is the sum of marginal utility. Total utility increases at a diminishing rate.
Marginal Utility diminishes continuously. When MU is zero TU reaches maximum. Beyond
this when MU is negative TU diminishes.
12. EXPLAIN THEORY OF CONSUMER EQUILIBRIUM USING UTILITY ANALYSIS OR
(How much of a commodity that a consumer would consume?)
One commodity model:-Consumer buys a good because of its utility. Utility from the last
unit purchased is called marginal utility.
Suppose the Marginal Utility of good that the consumer purchase is more than the price of the
good that he pays, he gets more than what he pays. He will buy more units of that good.
If MU of the good is less than the price that he pays, he gets less than what he pays. He buys
fewer units of that good.
When MU=Price of the good, consumer is most satisfied and gets maximum satisfaction so
that he will that much units of the good at which MU=Price.
Thus consumer is in equilibrium when MU=Price. or MU/P =1 that is marginal utility of the
last rupee spent.
Two commodity case: Suppose the consumer buys only two goods X and Y. Given the
income and price of the goods (Px and Py), Consumer maximizes the satisfaction by spending
his income in such a way that he gets same utility from the last rupee spend on each good
MUx/Px = MUy/Py = MU of rupee spend on a good
If MUx/PX > MUy/PY; Consumer will buy more units of X till the till the MUx comes down
and MUx/Px becomes equal to MUy/Py.
Indifference curve analysis
13. Define Budget Line: BL is the line that consists of all the bundles of two goods that
consumer can buy which cost exactly equal to consumer’s budget.
14. Explain the causes of Changes in budget line
4 | P a g e I S M D E P T O F C O M M E R C E A N D H U M A N I T I E S E C O N O M I C S N O T E S
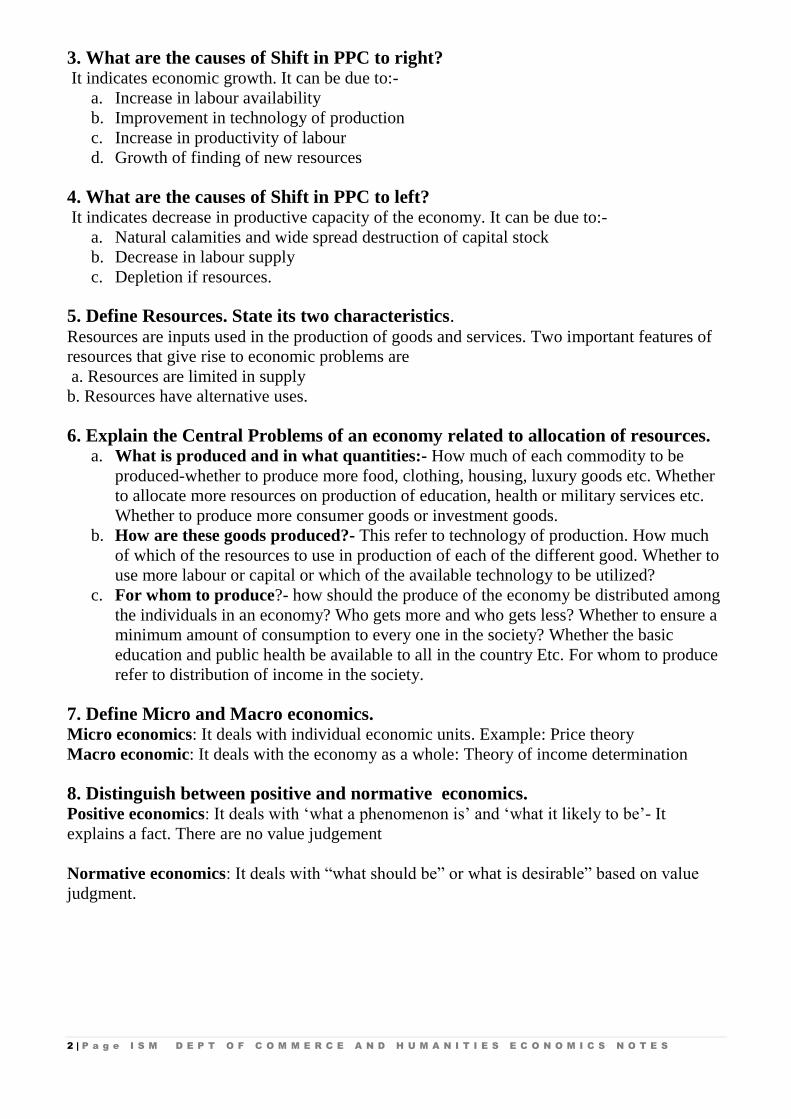
The set of bundles depend on prices of two good and income of the consumer. Budget line
shifts if price of the good changes or income of the consumer changes.
a. Change in income and the budget line. If income increases (M
1 >M), Budget line shifts outward. Consumer buys more of both the
goods at the prevailing price. If income decreases (M1< M), budge line shifts left ward.
Consumer can buy only less goods at the prevailing prices. In both the cases slope of the
budget line remains the same.
M/P2 Decrease in income M
1/P
2 Increase in income
Causes parallel shift causes parallel shift
M1/P
2 inward M/P
2 outward
Good2
M/P1M
1/P
1
M1/P
1 M/P
1 Good1
b. Change in price and budget line:- If price of good1 increases the absolute value of the slope of the budget line increases. Budget
line becomes steeper. It shifts inward. If price of good1 decreases the absolute value of slope of
the budget line decreases. Budget line becomes flatter. It shifts outward.
M/P2
M/P2
M/P1
M/P M/P M/P1
Good 1 Good 1
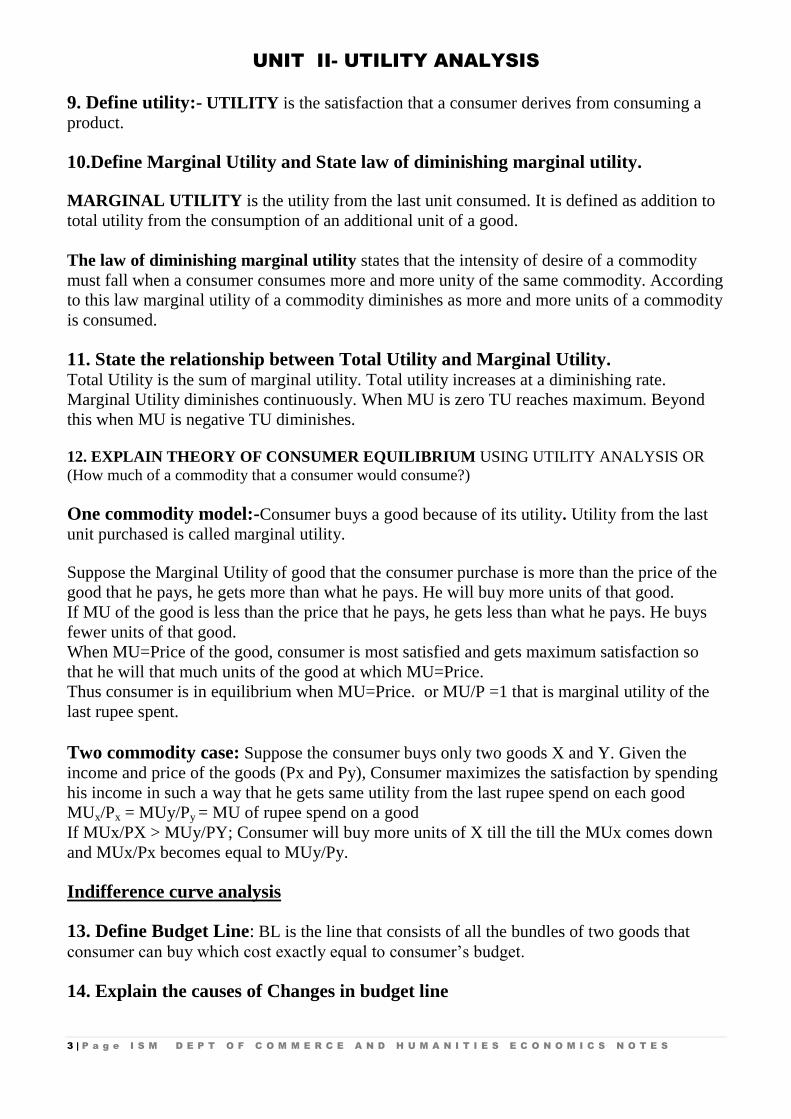
15. Define Indifference Curve. Explain using a diagram. A consumers’ preferences to
set of bundles can be represented diagrammatically. The points representing bundles which are
considered indifferent by the consumer can be joined to obtain indifference curve. Indifference
curve is the diagram that shows different points representing bundles among which the
consumer is indifferent.
Good1
*A
C*Preferred bundle
*Dinferior bundle
*B
IC
Good1
Bundle above the indifference curve (C) is preferred to the bundle on the I.C. Bundles on the
indifference curve A and B are preferred to the bundle below the indifference curve D.
5 | P a g e I S M D E P T O F C O M M E R C E A N D H U M A N I T I E S E C O N O M I C S N O T E S
16. What is the Shape of indifference curve? Why is it so? Shape of indifference curve is determined by the rate of substitution. IC slopes downward. An
increase in demand for one good is associated by decrease in demand for the other. This
monotonicity of preferences implies that IC is downward sloping.
The diminishing marginal rated of substitution makes indifference curve convex to the origin.
Amount of good2 the consumer is willing to give up for an extra unit of good1 declines as the
consumer has more units of good1.
17. Explain the theory of Optimal Choice of the Consumer Or
Why must the price ratio be equal to Marginal Rate of Substitution at consumer
equilibrium? OR Which bundle does the consumer choose?
A consumer is a rational individual. She clearly knows what is good and what is bad for her.
She always try to achieve the best for herself.
A budget set describes the bundles that are available to the consumer.
An indifference map shows her preferences over the available bundles. A rational consumer
always tries to move to the point on the highest indifference curve possible giver her budget
set.
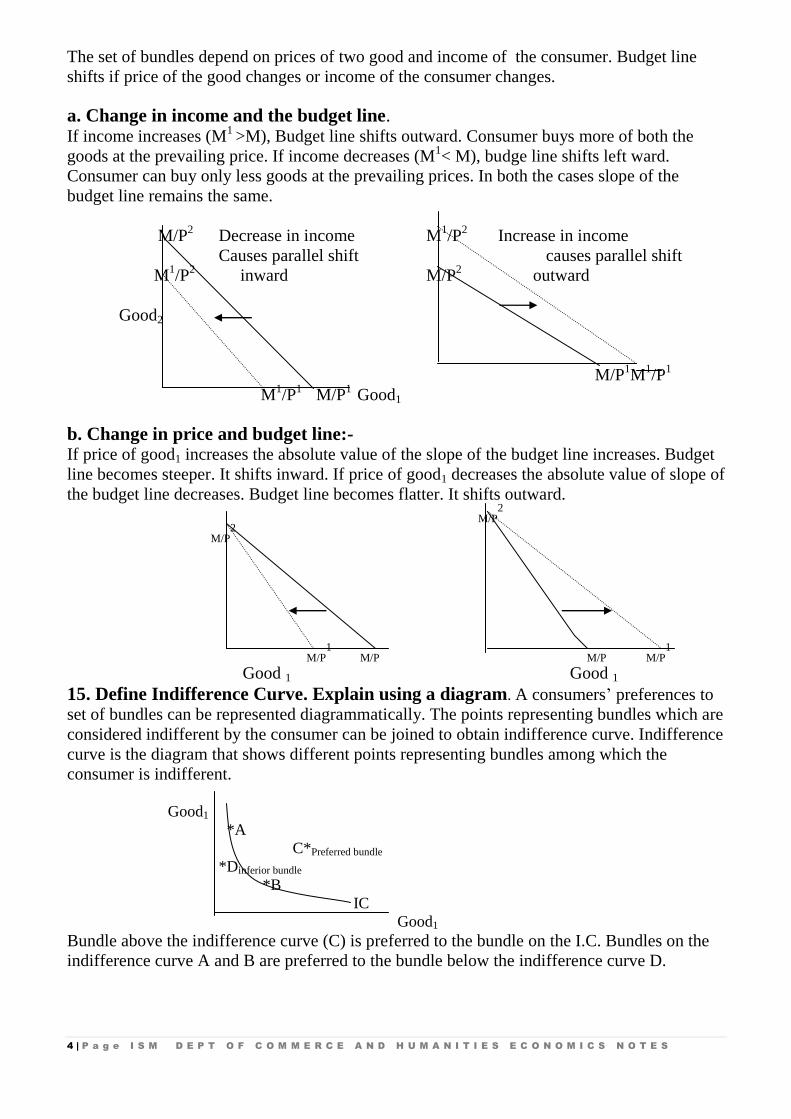
Optimum point would be located on the budget line. A point below the budget line cannot be
optimum. The point above the budget line is not available with the given income. These could
be some point on the budget line, which is preferred by the consumer. This optimum bundle of
the consumer is located at the point where the budget line is tangent to the Indifference curve.
At the point the absolute value of the slope of the IC (MRS) and that of the budget line (Price
Ratio) are the same.
MRS=Price ratio. IC
1 IC
2
‘AB’ is the budget line. At the point ‘E’ A
Budget line touches the highest possible IC IC
0 (x1*,x2*)
Consumer buys ON units of good2 and Good2 E
OM units of good1 N
O M Good1 B
Rationale behind the theory At any choice problem, there are a feasible set of alternatives available to the consumer. A
rational consumer tries to do the best for herself. A budget set is the feasible bundle of two
goods that a consumer can buy at the prevailing market price and income. Among the budget
sets the consumer chooses the most preferred bundle. The most preferred bundle is on the
highest possible indifference curve. So the consumer chooses that bundle of good at which
budget line is tangent to the highest possible indifference curve.
Demand Analysis
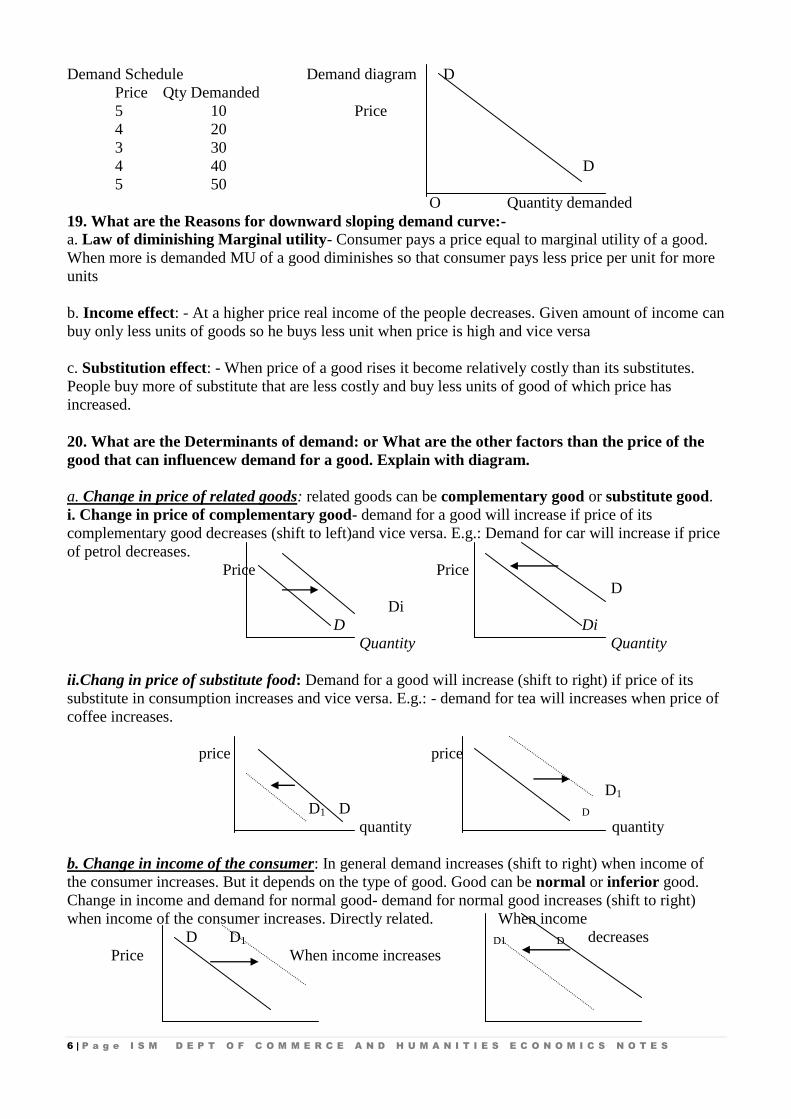
18. State LAW OF DEMAND Explain with a schedule and diagram
Law of demand states that other things remaining unchanged, as own price of a commodity increases,
the quantity demanded of it by a consumer falls. Other things refer to price of related goods, income of
the consumer, taste etc.
6 | P a g e I S M D E P T O F C O M M E R C E A N D H U M A N I T I E S E C O N O M I C S N O T E S
Demand Schedule Demand diagram D
Price Qty Demanded
5 10 Price
4 20
3 30
4 40 D
5 50
O Quantity demanded
19. What are the Reasons for downward sloping demand curve:-
a. Law of diminishing Marginal utility- Consumer pays a price equal to marginal utility of a good.
When more is demanded MU of a good diminishes so that consumer pays less price per unit for more
units
b. Income effect: - At a higher price real income of the people decreases. Given amount of income can
buy only less units of goods so he buys less unit when price is high and vice versa
c. Substitution effect: - When price of a good rises it become relatively costly than its substitutes.
People buy more of substitute that are less costly and buy less units of good of which price has
increased.
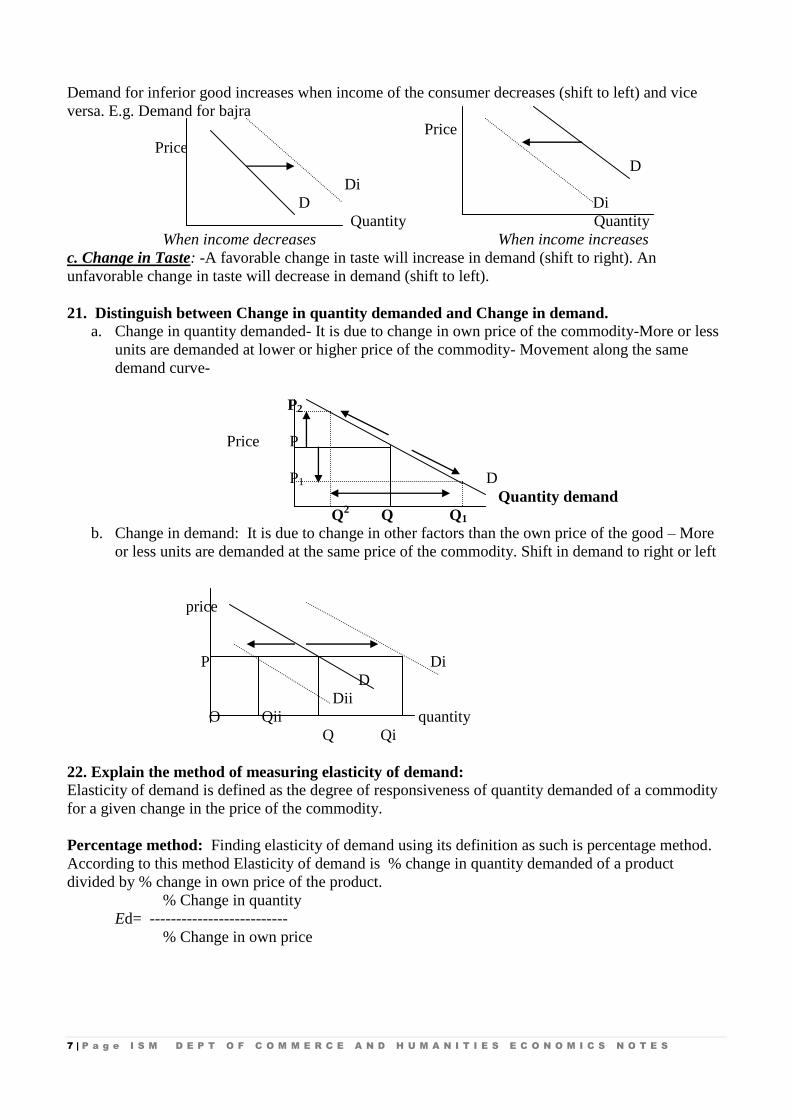
20. What are the Determinants of demand: or What are the other factors than the price of the
good that can influencew demand for a good. Explain with diagram.
a. Change in price of related goods: related goods can be complementary good or substitute good.
i. Change in price of complementary good- demand for a good will increase if price of its
complementary good decreases (shift to left)and vice versa. E.g.: Demand for car will increase if price
of petrol decreases.
Price Price
D
Di
D Di
Quantity Quantity
ii.Chang in price of substitute food: Demand for a good will increase (shift to right) if price of its
substitute in consumption increases and vice versa. E.g.: - demand for tea will increases when price of
coffee increases.
price price
D1
D1 D D
quantity quantity
b. Change in income of the consumer: In general demand increases (shift to right) when income of
the consumer increases. But it depends on the type of good. Good can be normal or inferior good.
Change in income and demand for normal good- demand for normal good increases (shift to right)
when income of the consumer increases. Directly related. When income
D D1 D1 D decreases
Price When income increases
7 | P a g e I S M D E P T O F C O M M E R C E A N D H U M A N I T I E S E C O N O M I C S N O T E S
Demand for inferior good increases when income of the consumer decreases (shift to left) and vice
versa. E.g. Demand for bajra
Price
Price
D
Di
D Di
Quantity Quantity
When income decreases When income increases
c. Change in Taste: -A favorable change in taste will increase in demand (shift to right). An
unfavorable change in taste will decrease in demand (shift to left).
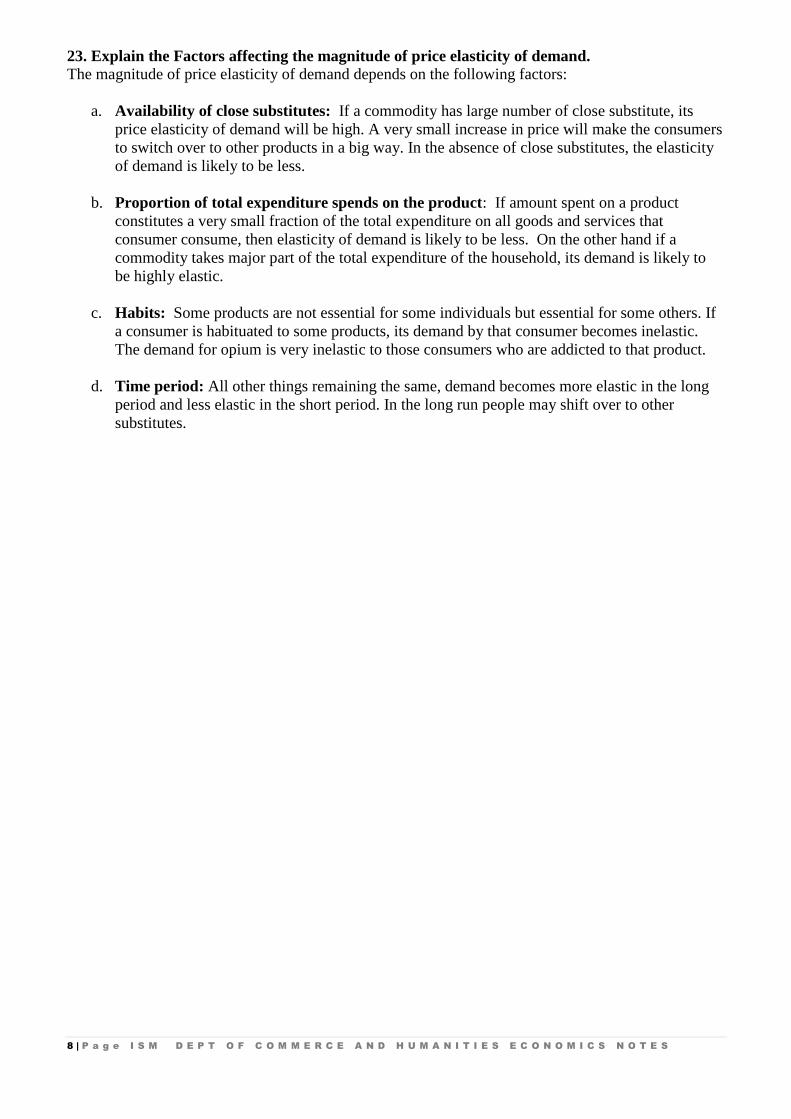
21. Distinguish between Change in quantity demanded and Change in demand.
a. Change in quantity demanded- It is due to change in own price of the commodity-More or less
units are demanded at lower or higher price of the commodity- Movement along the same
demand curve-
P2
Price P
P1 D
Quantity demand
Q2 Q Q1
b. Change in demand: It is due to change in other factors than the own price of the good – More
or less units are demanded at the same price of the commodity. Shift in demand to right or left
price
P Di
D
Dii
O Qii quantity
Q Qi
22. Explain the method of measuring elasticity of demand:
Elasticity of demand is defined as the degree of responsiveness of quantity demanded of a commodity
for a given change in the price of the commodity.
Percentage method: Finding elasticity of demand using its definition as such is percentage method.
According to this method Elasticity of demand is % change in quantity demanded of a product
divided by % change in own price of the product.
% Change in quantity
Ed= --------------------------
% Change in own price
8 | P a g e I S M D E P T O F C O M M E R C E A N D H U M A N I T I E S E C O N O M I C S N O T E S
23. Explain the Factors affecting the magnitude of price elasticity of demand. The magnitude of price elasticity of demand depends on the following factors:
a. Availability of close substitutes: If a commodity has large number of close substitute, its
price elasticity of demand will be high. A very small increase in price will make the consumers
to switch over to other products in a big way. In the absence of close substitutes, the elasticity
of demand is likely to be less.
b. Proportion of total expenditure spends on the product: If amount spent on a product
constitutes a very small fraction of the total expenditure on all goods and services that
consumer consume, then elasticity of demand is likely to be less. On the other hand if a
commodity takes major part of the total expenditure of the household, its demand is likely to
be highly elastic.
c. Habits: Some products are not essential for some individuals but essential for some others. If
a consumer is habituated to some products, its demand by that consumer becomes inelastic.
The demand for opium is very inelastic to those consumers who are addicted to that product.
d. Time period: All other things remaining the same, demand becomes more elastic in the long
period and less elastic in the short period. In the long run people may shift over to other
substitutes.
9 | P a g e I S M D E P T O F C O M M E R C E A N D H U M A N I T I E S E C O N O M I C S N O T E S
UNIT III
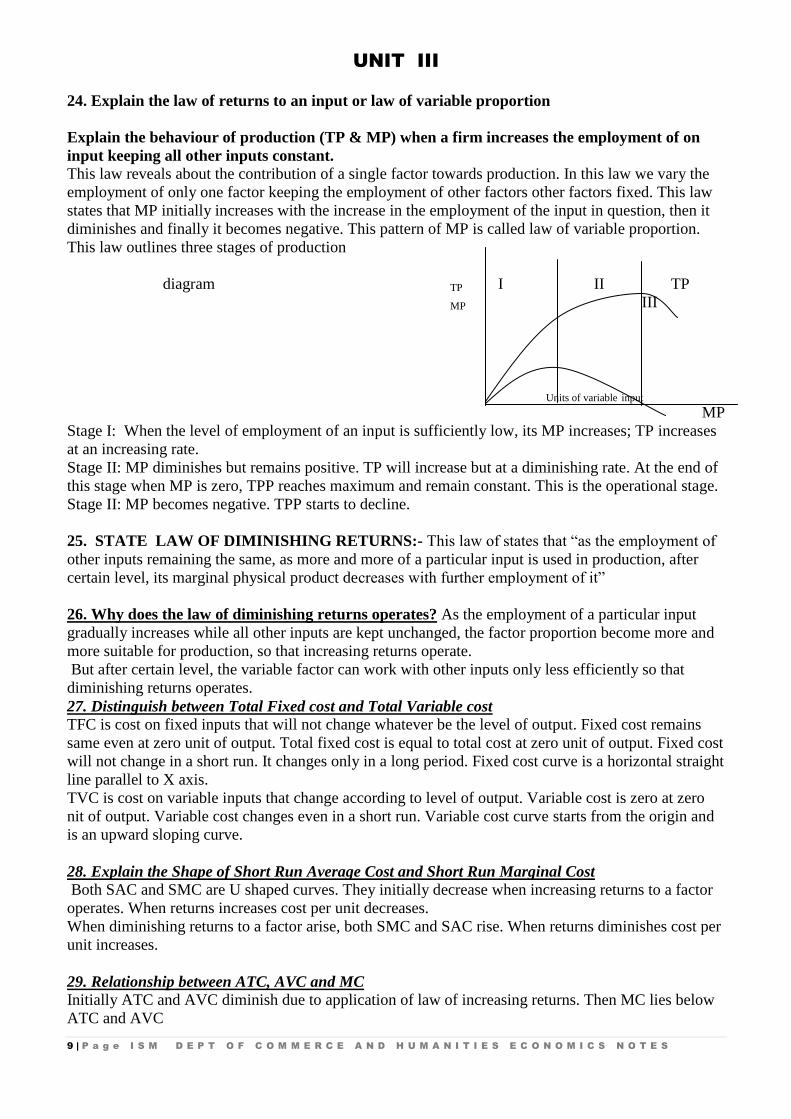
24. Explain the law of returns to an input or law of variable proportion
Explain the behaviour of production (TP & MP) when a firm increases the employment of on
input keeping all other inputs constant.
This law reveals about the contribution of a single factor towards production. In this law we vary the
employment of only one factor keeping the employment of other factors other factors fixed. This law
states that MP initially increases with the increase in the employment of the input in question, then it
diminishes and finally it becomes negative. This pattern of MP is called law of variable proportion.
This law outlines three stages of production
diagram TP I II TP
MP III
Units of variable input
MP
Stage I: When the level of employment of an input is sufficiently low, its MP increases; TP increases
at an increasing rate.
Stage II: MP diminishes but remains positive. TP will increase but at a diminishing rate. At the end of
this stage when MP is zero, TPP reaches maximum and remain constant. This is the operational stage.
Stage II: MP becomes negative. TPP starts to decline.
25. STATE LAW OF DIMINISHING RETURNS:- This law of states that “as the employment of
other inputs remaining the same, as more and more of a particular input is used in production, after
certain level, its marginal physical product decreases with further employment of it”
26. Why does the law of diminishing returns operates? As the employment of a particular input
gradually increases while all other inputs are kept unchanged, the factor proportion become more and
more suitable for production, so that increasing returns operate.
But after certain level, the variable factor can work with other inputs only less efficiently so that
diminishing returns operates.
27. Distinguish between Total Fixed cost and Total Variable cost
TFC is cost on fixed inputs that will not change whatever be the level of output. Fixed cost remains
same even at zero unit of output. Total fixed cost is equal to total cost at zero unit of output. Fixed cost
will not change in a short run. It changes only in a long period. Fixed cost curve is a horizontal straight
line parallel to X axis.
TVC is cost on variable inputs that change according to level of output. Variable cost is zero at zero
nit of output. Variable cost changes even in a short run. Variable cost curve starts from the origin and
is an upward sloping curve.
28. Explain the Shape of Short Run Average Cost and Short Run Marginal Cost
Both SAC and SMC are U shaped curves. They initially decrease when increasing returns to a factor
operates. When returns increases cost per unit decreases.
When diminishing returns to a factor arise, both SMC and SAC rise. When returns diminishes cost per
unit increases.
29. Relationship between ATC, AVC and MC
Initially ATC and AVC diminish due to application of law of increasing returns. Then MC lies below
ATC and AVC
10 | P a g e I S M D E P T O F C O M M E R C E A N D H U M A N I T I E S E C O N O M I C S N O T E S
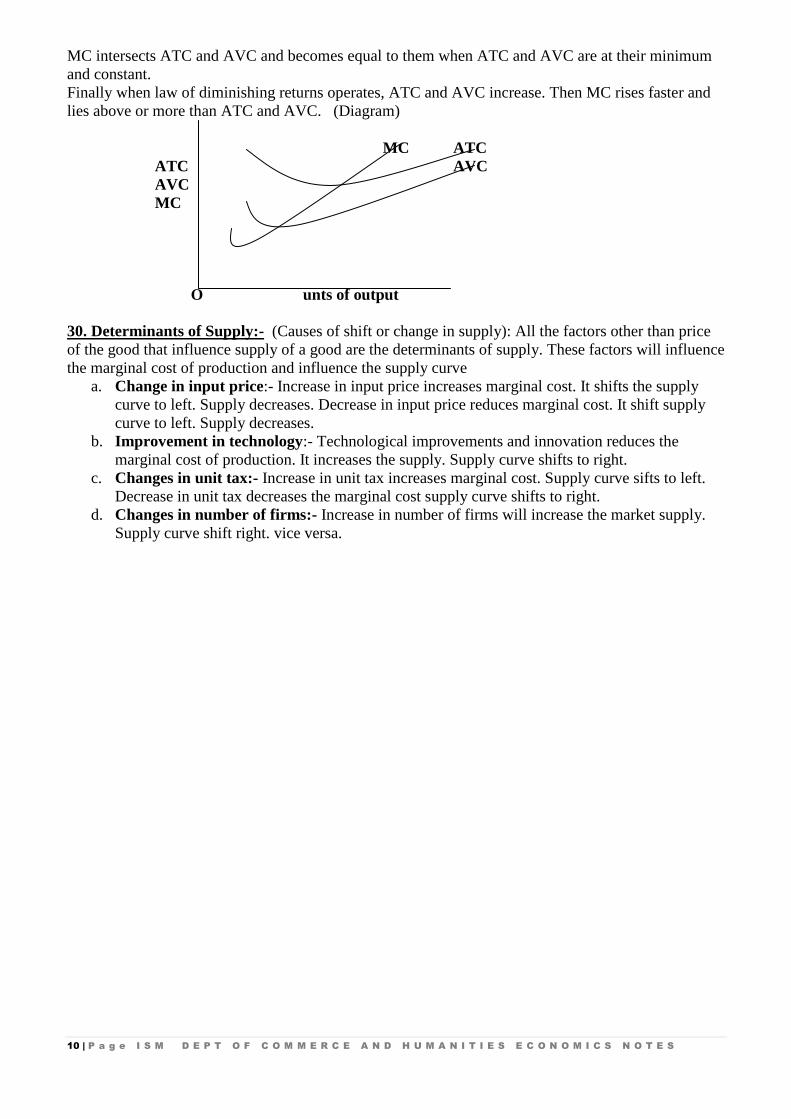
MC intersects ATC and AVC and becomes equal to them when ATC and AVC are at their minimum
and constant.
Finally when law of diminishing returns operates, ATC and AVC increase. Then MC rises faster and
lies above or more than ATC and AVC. (Diagram)
MC ATC
ATC AVC
AVC
MC
O unts of output
30. Determinants of Supply:- (Causes of shift or change in supply): All the factors other than price
of the good that influence supply of a good are the determinants of supply. These factors will influence
the marginal cost of production and influence the supply curve
a. Change in input price:- Increase in input price increases marginal cost. It shifts the supply
curve to left. Supply decreases. Decrease in input price reduces marginal cost. It shift supply
curve to left. Supply decreases.
b. Improvement in technology:- Technological improvements and innovation reduces the
marginal cost of production. It increases the supply. Supply curve shifts to right.
c. Changes in unit tax:- Increase in unit tax increases marginal cost. Supply curve sifts to left.
Decrease in unit tax decreases the marginal cost supply curve shifts to right.
d. Changes in number of firms:- Increase in number of firms will increase the market supply.
Supply curve shift right. vice versa.
11 | P a g e I S M D E P T O F C O M M E R C E A N D H U M A N I T I E S E C O N O M I C S N O T E S
UNIT IV
31. HOW IS MARKET EQUILIBRIUM DETERMINED or EXPLAIN THE THEOY OF
DETERMINATION OF EQUILIBRIUM PRICE AND QUANTITY
Market equilibrium is defined as a situation of zero excess demand and zero excess supply. It is
defined by the equality between quantity demanded and quantity supplied.
The price at which quantity demanded of a commodity is equal to its price is called equilibrium price.
Demand is inversely related to price. Consumers demand more units of a commodity at a lower price
and less at a higher price.
Supply is directly related to price. Sellers supply more units of a commodity at a higher price and less
at a lower price.
When demand and supply forces intersect or are equal to each other, equilibrium price is determined
and market is in equilibrium.
Price Quantity Quantity Price D
Demanded Supplied excess supply S
1 50 10—Excess Demand
2 40 20—Excess Demand P E
3 30 30—zero Excess Demand/Excess Supply
4 20 40—Excess Supply
5 10 50—Excess Supply excess demand
Quantity Q
Equilibrium Price is Rs.3 Quantity demanded is equal to quantity supplied. There is no excess demand
or excess supply. Market is in equilibrium.
At prices less than the equilibrium price, excess demand arises. This will push up the price to
equilibrium.
At prices more than the equilibrium price, excess supply arises. This will bring down the price back to
equilibrium.
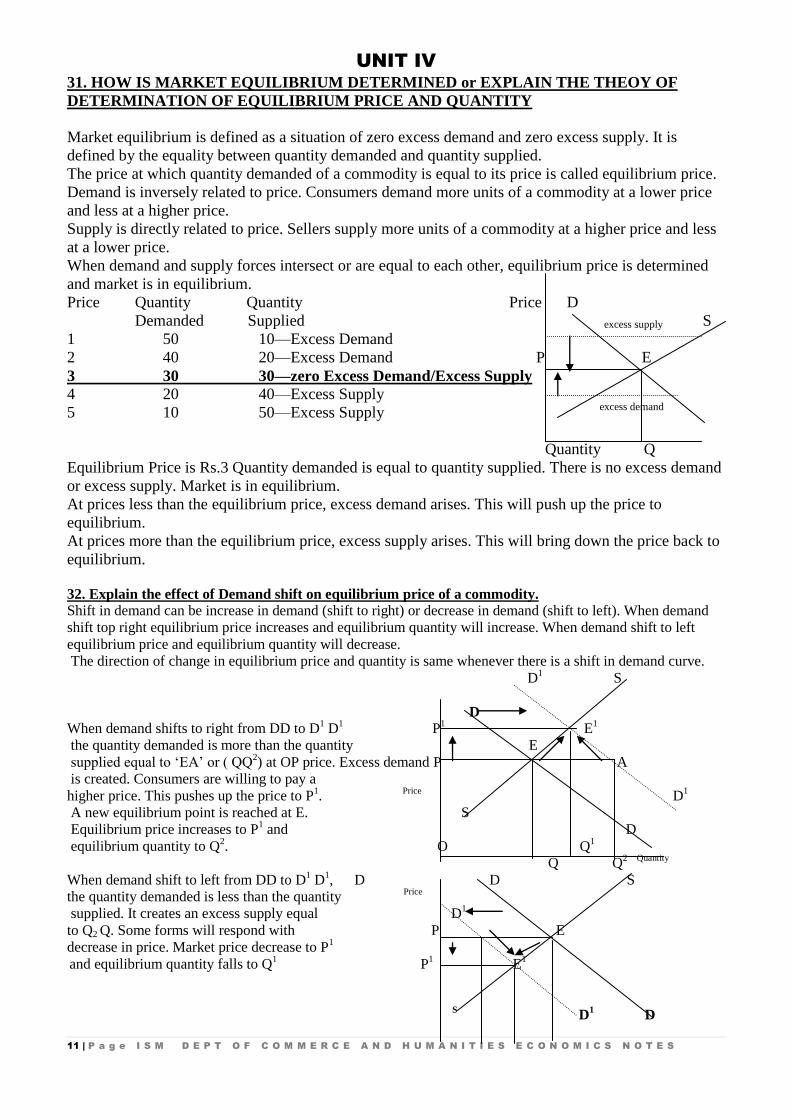
32. Explain the effect of Demand shift on equilibrium price of a commodity.
Shift in demand can be increase in demand (shift to right) or decrease in demand (shift to left). When demand
shift top right equilibrium price increases and equilibrium quantity will increase. When demand shift to left
equilibrium price and equilibrium quantity will decrease.
The direction of change in equilibrium price and quantity is same whenever there is a shift in demand curve.
D1
S
D
When demand shifts to right from DD to D1 D
1 P
1 E
1
the quantity demanded is more than the quantity E
supplied equal to ‘EA’ or ( QQ2) at OP price. Excess demand P A
is created. Consumers are willing to pay a
higher price. This pushes up the price to P1.
Price D
1
A new equilibrium point is reached at E. S
Equilibrium price increases to P1 and D
equilibrium quantity to Q2. O Q
1
Q Q2 Quantity
When demand shift to left from DD to D1 D
1, D D S
the quantity demanded is less than the quantity Price
supplied. It creates an excess supply equal D1
to Q2 Q. Some forms will respond with P E
decrease in price. Market price decrease to P1
and equilibrium quantity falls to Q
1 P
1 E
1
S D
1 D
12 | P a g e I S M D E P T O F C O M M E R C E A N D H U M A N I T I E S E C O N O M I C S N O T E S
O Q2 Q
1 Q
Quantity
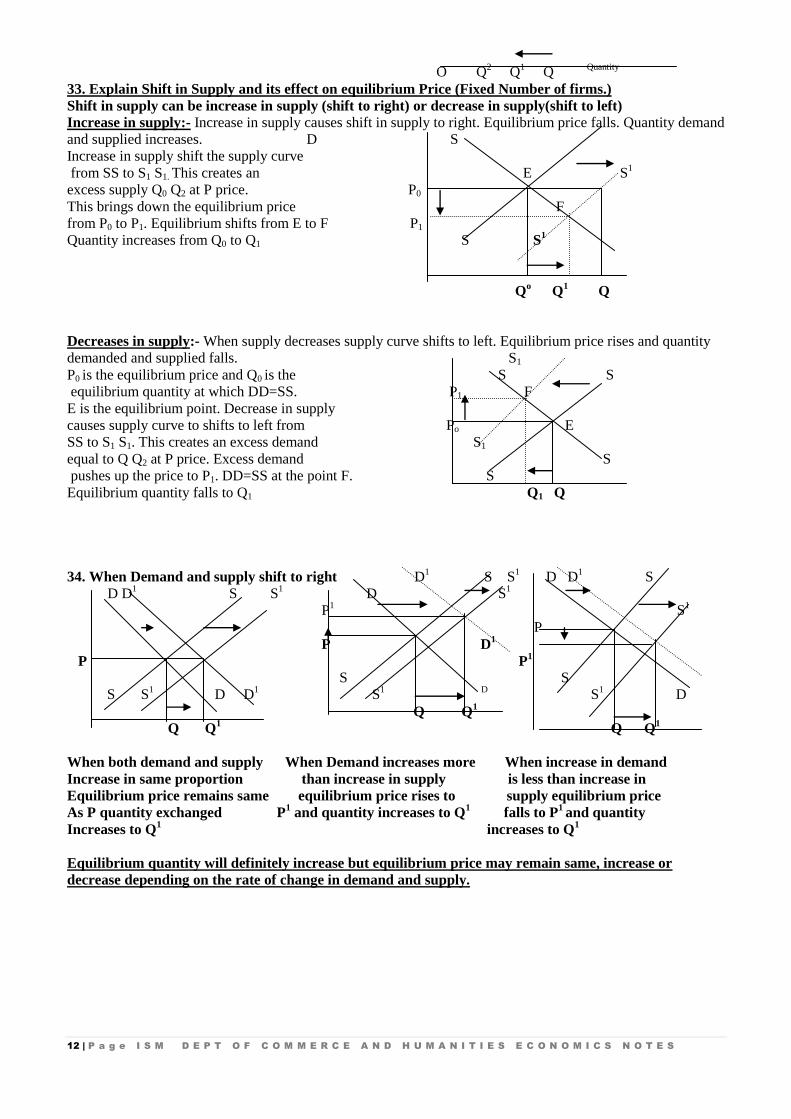
33. Explain Shift in Supply and its effect on equilibrium Price (Fixed Number of firms.)
Shift in supply can be increase in supply (shift to right) or decrease in supply(shift to left)
Increase in supply:- Increase in supply causes shift in supply to right. Equilibrium price falls. Quantity demand
and supplied increases. D S
Increase in supply shift the supply curve
from SS to S1 S1. This creates an E S1
excess supply Q0 Q2 at P price. P0
This brings down the equilibrium price F
from P0 to P1. Equilibrium shifts from E to F P1
Quantity increases from Q0 to Q1 S S1
Qo
Q1
Q
Decreases in supply:- When supply decreases supply curve shifts to left. Equilibrium price rises and quantity
demanded and supplied falls. S1
P0 is the equilibrium price and Q0 is the S S
equilibrium quantity at which DD=SS. P1 F
E is the equilibrium point. Decrease in supply
causes supply curve to shifts to left from Po E
SS to S1 S1. This creates an excess demand S1
equal to Q Q2 at P price. Excess demand S
pushes up the price to P1. DD=SS at the point F. S
Equilibrium quantity falls to Q1 Q1 Q
34. When Demand and supply shift to right D1 S S
1 D D
1 S
D D1 S S
1 D S
1
P1 S
1
P
P D1
P P1
S S
S S1 D D
1 S
1 D S
1 D
Q Q1
Q Q1 Q Q
1
When both demand and supply When Demand increases more When increase in demand
Increase in same proportion than increase in supply is less than increase in
Equilibrium price remains same equilibrium price rises to supply equilibrium price
As P quantity exchanged P1 and quantity increases to Q
1
falls to P
1 and quantity
Increases to Q1
increases to Q1
Equilibrium quantity will definitely increase but equilibrium price may remain same, increase or
decrease depending on the rate of change in demand and supply.
13 | P a g e I S M D E P T O F C O M M E R C E A N D H U M A N I T I E S E C O N O M I C S N O T E S
35.When demand and supply shift to left
S1 S1
D S D1 D S D
D1 S1
P1 Price
S Price
P E D1
P E P
S1
S1 D P
1 D
S D D1 S1 S
D1 S D1
Q1 Q Quantity Q1 Q Quantity Q1 Q Quanitity
When demand and supply When decrease in demand is When decrease in demand is
Decrease in same ratio less than decrease in supply more than decrease in supply
Equilibrium price remains Equilibrium price rises equilibrium price falls
and
Same quantity decreases and quantity decreases quantity decreases
When demand and supply both decrease equilibrium quantity decrease but equilibrium price may
increase, decrease or remain same depending on the ratio of change in demand and supply
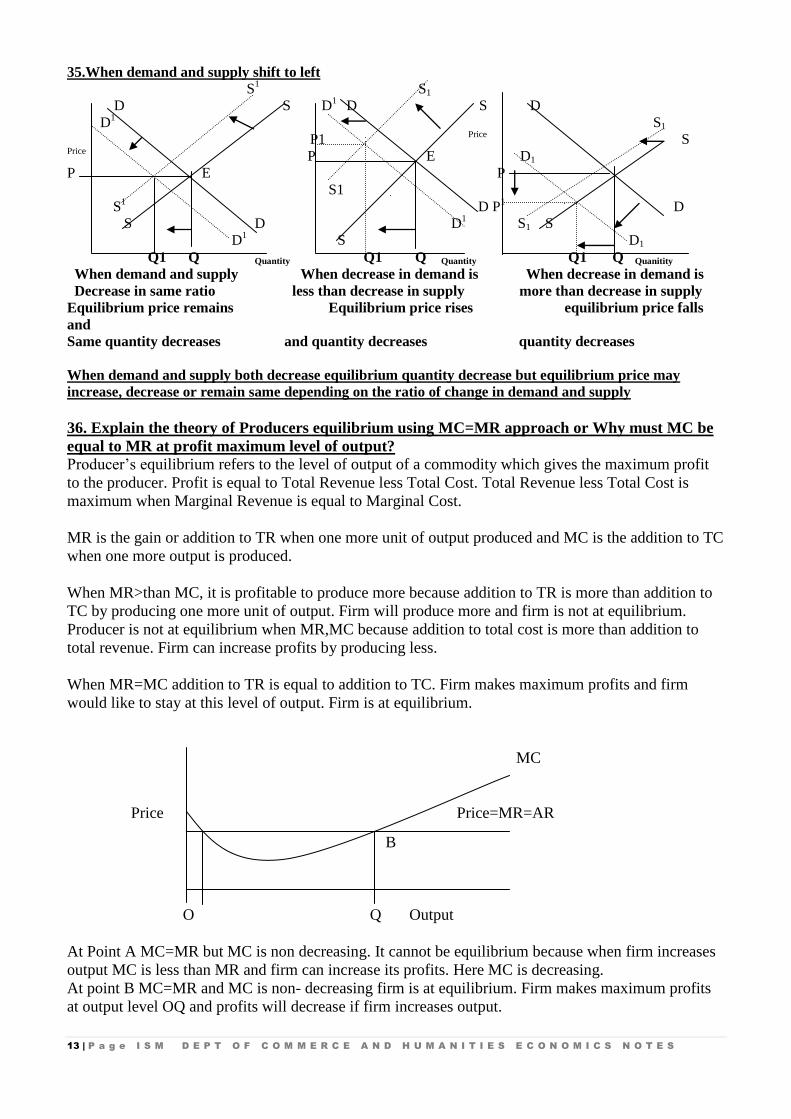
36. Explain the theory of Producers equilibrium using MC=MR approach or Why must MC be
equal to MR at profit maximum level of output?
Producer’s equilibrium refers to the level of output of a commodity which gives the maximum profit
to the producer. Profit is equal to Total Revenue less Total Cost. Total Revenue less Total Cost is
maximum when Marginal Revenue is equal to Marginal Cost.
MR is the gain or addition to TR when one more unit of output produced and MC is the addition to TC
when one more output is produced.
When MR>than MC, it is profitable to produce more because addition to TR is more than addition to
TC by producing one more unit of output. Firm will produce more and firm is not at equilibrium.
Producer is not at equilibrium when MR,MC because addition to total cost is more than addition to
total revenue. Firm can increase profits by producing less.
When MR=MC addition to TR is equal to addition to TC. Firm makes maximum profits and firm
would like to stay at this level of output. Firm is at equilibrium.
MC
Price Price=MR=AR
B
O Q Output
At Point A MC=MR but MC is non decreasing. It cannot be equilibrium because when firm increases
output MC is less than MR and firm can increase its profits. Here MC is decreasing.
At point B MC=MR and MC is non- decreasing firm is at equilibrium. Firm makes maximum profits
at output level OQ and profits will decrease if firm increases output.
14 | P a g e I S M D E P T O F C O M M E R C E A N D H U M A N I T I E S E C O N O M I C S N O T E S
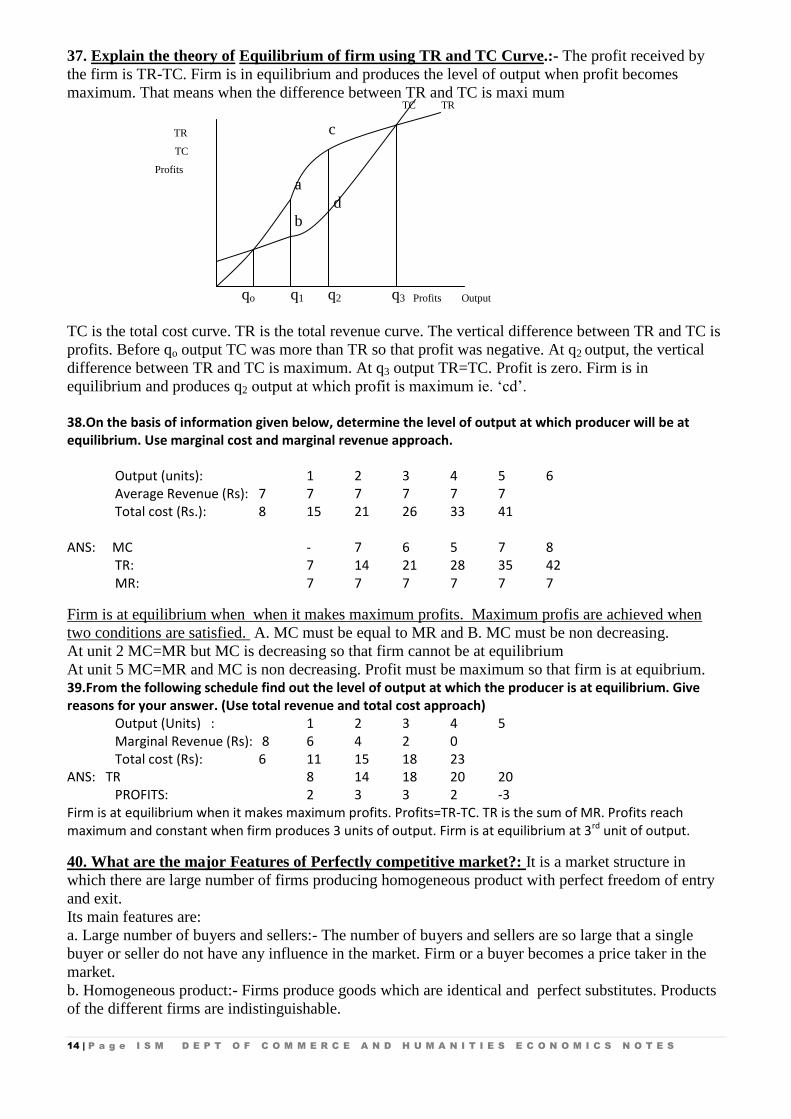
37. Explain the theory of Equilibrium of firm using TR and TC Curve.:- The profit received by
the firm is TR-TC. Firm is in equilibrium and produces the level of output when profit becomes
maximum. That means when the difference between TR and TC is maxi mum
TC
TR
TR c
TC
Profits
a
d
b
qo q1 q2 q3 Profits Output
TC is the total cost curve. TR is the total revenue curve. The vertical difference between TR and TC is
profits. Before qo output TC was more than TR so that profit was negative. At q2 output, the vertical
difference between TR and TC is maximum. At q3 output TR=TC. Profit is zero. Firm is in
equilibrium and produces q2 output at which profit is maximum ie. ‘cd’. 38.On the basis of information given below, determine the level of output at which producer will be at equilibrium. Use marginal cost and marginal revenue approach.
Output (units): 1 2 3 4 5 6 Average Revenue (Rs): 7 7 7 7 7 7 Total cost (Rs.): 8 15 21 26 33 41
ANS: MC - 7 6 5 7 8 TR: 7 14 21 28 35 42 MR: 7 7 7 7 7 7
Firm is at equilibrium when when it makes maximum profits. Maximum profis are achieved when
two conditions are satisfied. A. MC must be equal to MR and B. MC must be non decreasing.
At unit 2 MC=MR but MC is decreasing so that firm cannot be at equilibrium
At unit 5 MC=MR and MC is non decreasing. Profit must be maximum so that firm is at equibrium. 39.From the following schedule find out the level of output at which the producer is at equilibrium. Give reasons for your answer. (Use total revenue and total cost approach)
Output (Units) : 1 2 3 4 5 Marginal Revenue (Rs): 8 6 4 2 0 Total cost (Rs): 6 11 15 18 23
ANS: TR 8 14 18 20 20 PROFITS: 2 3 3 2 -3 Firm is at equilibrium when it makes maximum profits. Profits=TR-TC. TR is the sum of MR. Profits reach maximum and constant when firm produces 3 units of output. Firm is at equilibrium at 3rd unit of output.
40. What are the major Features of Perfectly competitive market?: It is a market structure in
which there are large number of firms producing homogeneous product with perfect freedom of entry
and exit.
Its main features are:
a. Large number of buyers and sellers:- The number of buyers and sellers are so large that a single
buyer or seller do not have any influence in the market. Firm or a buyer becomes a price taker in the
market.
b. Homogeneous product:- Firms produce goods which are identical and perfect substitutes. Products
of the different firms are indistinguishable.
15 | P a g e I S M D E P T O F C O M M E R C E A N D H U M A N I T I E S E C O N O M I C S N O T E S
c. Freedom of entry and exit: firms have perfect freedom to enter or exit from the market. If existing
firms are making abnormal profits, new firms will enter the market and the profits will be competed
away. This ensures only normal profits in the long run.
d. Perfect knowledge of the market. Buyers and sellers have perfect knowledge about the market price
and cost condition.
16 | P a g e I S M D E P T O F C O M M E R C E A N D H U M A N I T I E S E C O N O M I C S N O T E S
UNIT-V
41. A MONOPOLY MARKET : A market form in which there is only one firm dealing with a
product which doesn’t have any substitutes. Its features are:-
a) Single seller or producer - there is a single firm or seller of the commodity. This implies that
firm and industry are the same. Firm becomes a price maker
b) Absence of close substitutes - the product or service under monopoly does not have close
substitutes. Consumer has no choice. AR or demand curve slopes down and inelastic.
c) Restrictions to entry and exit - there are barriers or restrictions to the entry of firms in the
market. New firms cannot enter the market. Firm can make abnormal profit in the long run.
d) Price discrimination – charging different prices for the same product or service from different
consumers on the basis of personal, situational and trade considerations is termed as price
discrimination. The motive behind price discrimination is to maximise profits.
42. MONOPOLISTIC COMPETITION
A monopolistic competitive market structure is a market form characterised by the combined
elements of competition and monopoly. It has the following features –
a) Presence of large number of buyers and sellers - Existence of large number of firms
together means that each firm is very small compared to the whole market and no single firm
can influence the market price.
b) There is free entry and exit. – If existing firms make abnormal profit new firm will enter the
market. If existing firms make loss they are free to leave the market. Firms earn zero abnormal
profits in the long run.
c) Product is differentiated – Each firm produces a brand or variety of the same product that is
unique i.e. different from what any other firm produces. Products differ in terms of brand
name, quality, quantity price, shape colour etc. This makes the firm enjoy some monopoly
power because the varieties produced are close substitutes.
43. What are the major features of Oligopoly market?: Oligopoly is a market situation in which
there are only a few firm producing homogenous nor differentiated good.
Its basic features are:-
Few sellers:- Oligopoly market structure consist of more than one seller for a product but the number
of sellers is a few. It can be a few firms producing most of the output. The word few is not defined nut
the number is enough to make a guess on the likely reaction of the rival firms. Each firm has
considerable influence on the market.
If market has only two sellers, it is called duopoly. This is considered as a special case of oligopoly.
Nature of the product:- Product can be homogenous in nature. This situation is called pure oligopoly
or pure duopoly. If products are differentiated, the situation is called differentiated oligopoly.
Interdependency:- Price output decision of one firm would necessarily affect the market price.
Therefore, it influences the Total Revenue of the other firms. This means changes in price output
policy of one firm is followed by a similar reaction from another firms.
Barriers of entry of new firms:- There are barriers which prevent entry of new firms into the
industry. Patents, large capital, control over crucial raw materials etc prevent new firms from entering
into the industry. Only those who are able to cross over these barriers will enter the industry.
Non price competition:-Firms try to avoid price competition for fear of price war. They use other
methods like advertisement, better service to customer etc to compete with each other.
17 | P a g e I S M D E P T O F C O M M E R C E A N D H U M A N I T I E S E C O N O M I C S N O T E S
Collusion:-Oligopoly or duopoly firms may decide to collude together and decide not to compete with
each other to maximise the total profits. In such case both the firms behave like as single monopoly.
This is known as cartel formation.
Price rigidity: _ Oligopoly market structure makes the market price of a commodity rigid. Market
price does not move freely in response to changes in demand.
If one firm increases the price to generate higher profit, other firms will not follow the same. This
leads to huge fall in demand, which may reduce its Total Revenue. This means demand curve above
the ruling price is highly elastic and demand below the ruling price is very inelastic. This makes the
ruling price rigid.
44. Distinguish between explicit cost and implicit cost
Explicit cost: It is the actual money expenditure on inputs, like expenditure of purchases of raw
materials, on payment of wages, interest, rent etc.
Implicit cost:-It is the estimated value of inputs supplied by the owner of a firm, like imputed salaries
of owners, imputed interest on money invested by the owners etc.