Embed Size (px)
Citation preview
Contents
Stakeholder MapTimeline Process DiagramAppendicesPrint
PEvidence in Practice
Case Studies
View AlphabeticallyView GeographicallyView by Discipline
Full ReportSummary + Findings
Teaching at the Right LevelPratham Education Foundation, one of India’s largest educational non-governmental organizations, is recognized globally for its evidence-based pedagogical approach.By Shira Beery
INDIA | EDUCATION
Contents
Stakeholder MapTimeline Process DiagramAppendicesPrint
Page 02 of 29
PEvidence in Practice
Case Studies
View AlphabeticallyView GeographicallyView by Discipline
Full ReportSummary + Findings
Evidence in Practice Introduction
Part I: The TaRL StoryBackgroundAbout TaRLCommitment to Ongoing LearningInstitutionalizing Measurement, Monitoring + EvaluationEvaluating Pratham and Establishing a Proof of ConceptExperimenting with Pathways to ScaleOptimizing Pathways to ScaleThe Annual Status of Education Report
Part II: Evidence in Practice: Key Themes + InsightsAlternative Definitions of EvidenceIncentive StructuresTiming MisalignmentsTrust, Respect, and Buy-in Among StakeholdersDevoting Time and Resources to Integrating EvidenceOperationalizing Evidence Captured InternallyLearning from FailureConclusion
Part III: ResourcesStakeholder MapTimeline Process DiagramAppendices
03
040405060607080910
141415161719192021
22232425
Teaching at the Right Level Table of Contents
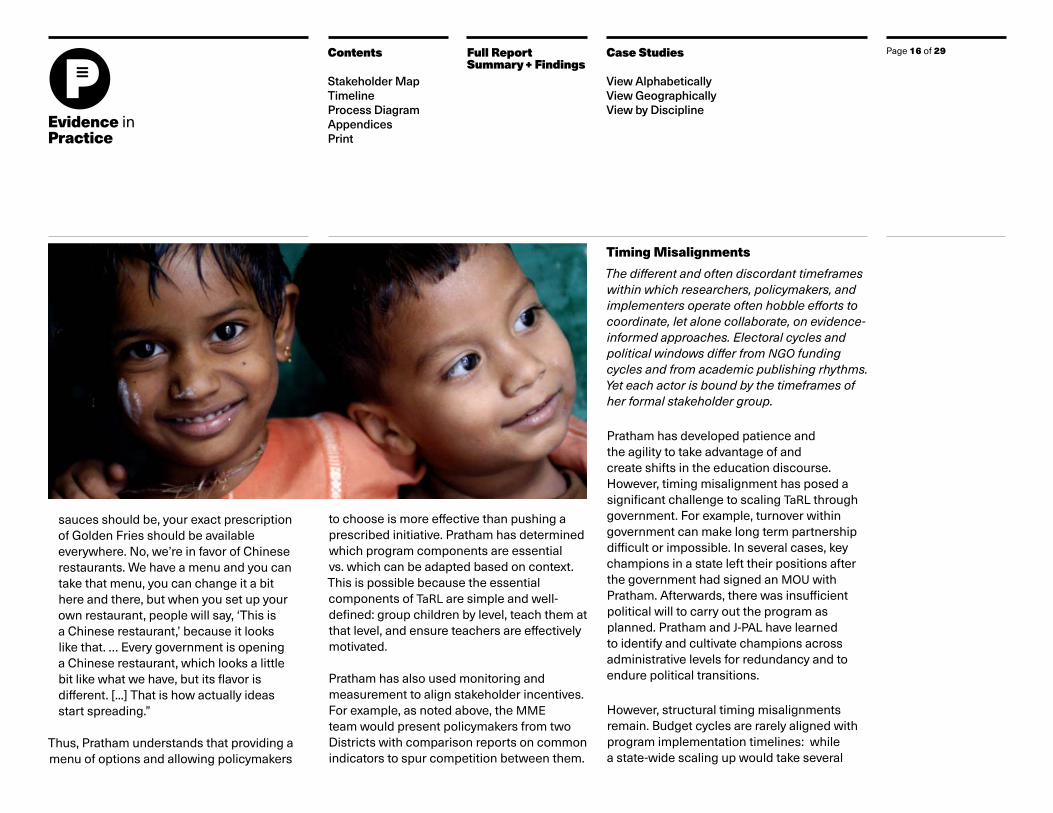
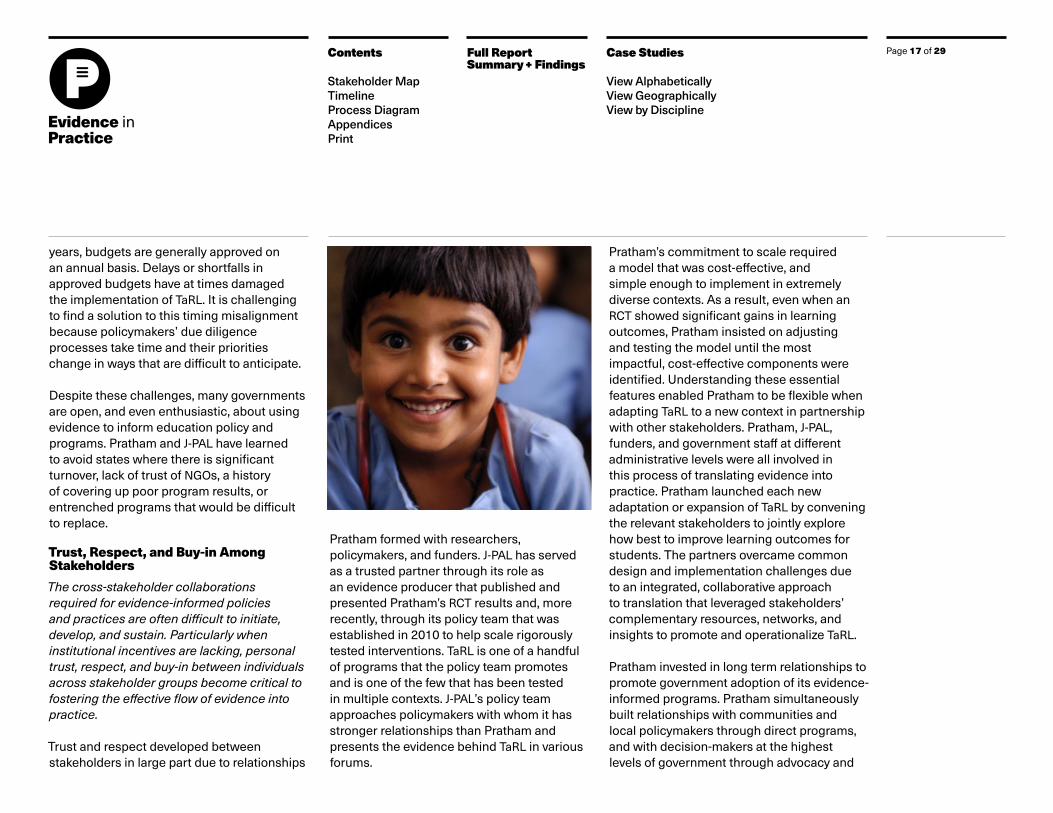
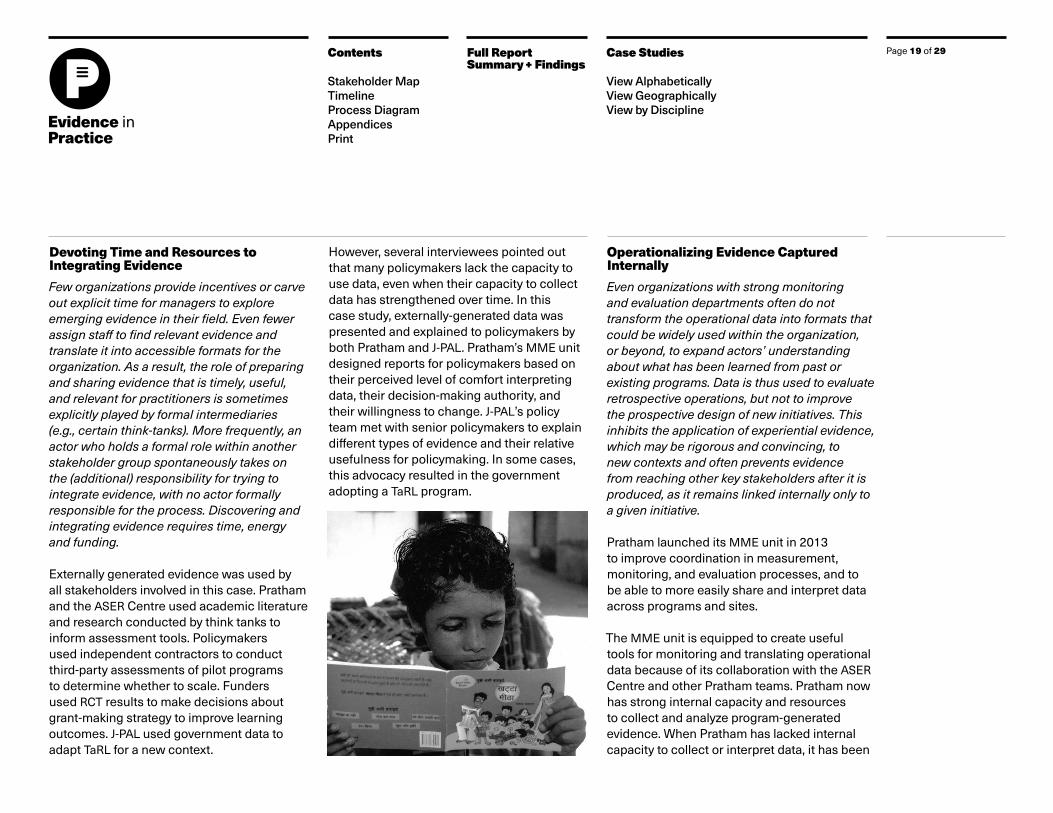
Image CreditsCover: Ryan Lobo/Pratham BooksPage 5: Ryan Lobo/Pratham BooksPage 8: Ryan Lobo/Pratham BooksPage 9: Pratham BooksPage 10: Ryan Lobo/Pratham BooksPage 12: Ryan Lobo/Pratham BooksPage 16: Ryan Lobo/Pratham BooksPage 17: Ryan Lobo/Pratham BooksPage 19: Pratham Books

Contents
Stakeholder MapTimeline Process DiagramAppendicesPrint
Page 03 of 29
PEvidence in Practice
Case Studies
View AlphabeticallyView GeographicallyView by Discipline
Full ReportSummary + Findings
1 Please see the appendex for a detailed description on Data and Methods.
2 While some of our interviewees identified “Influencers” (such as the media, the general public, lobbyists, and influential individuals) as playing an important role in the evidence-to-practice eco-system, this group did not play an explicit role in the narrative of any of the case studies. So we have included the category here, though it does not appear in the stakeholder maps of the individual case studies.
3 We use the term “beneficiaries” to indicate those whom a specific policy or program is intended to help. Different analytic frameworks use various terms to describe this group, including clients, users, recipients, etc.
The Evidence In Practice research project at the Yale School of Management, funded by the William and Flora Hewlett Foundation, was conducted from January 2016 to January 2018 in order to better understand the conditions under which rigorous evidence can be effectively integrated into public policies and non-governmental organization (NGO) practices in the field of international development.
The Evidence in Practice project followed a rigorous methodology comprised of three broad elements: First we conducted an initial round of expert interviews with individuals who have spent a significant portion of their professional lives attempting, researching, or promoting the integration of evidence into development practice, including academics, government officials, foundation program officers, NGO practitioners, and think-tank
directors. Second, we conducted a matched comparison of eight cases of development programs or interventions where rigorous evidence was integrated with varying degrees of effectiveness. This case study is one of the eight produced by the project. The third component, conducted in parallel to the eight case studies, consisted of interviews with prototypical representatives of each of the stakeholder groups, or individuals who could clearly describe the typical experience of enacting a particular stakeholder role. Our synthesis analysis is presented in the accompanying report.1
Stakeholder Characterization
Based on our research, we have found it useful to think of the flow of evidence into policy and practice as an “ecosystem” in which a set of archetypical stakeholder groups interact. This set of stakeholder categories was described and reinforced by our interviewees throughout the project. While this is not a perfect description (e.g., some organizations fall within more than one stakeholder group and individuals often shift across stakeholder groups or play roles that effectively span categories), it can help frame the conversation to identify the critical roles, incentives, and relationships that animate the
complex relationship between “evidence” and “practice.” These representative stakeholder groups are: Researchers, Funders, Influencers2, Intermediaries, Policymakers, Implementers, and Beneficiaries3.
Each of the cases thus contains a map of the specific organizations (and individuals) that defined its evolution, their structural affiliation to a stakeholder category (in some cases, organizations played more than one formal, structural role), the informal roles that certain individual actors played, as well as the key relationships between these individuals and organizations.
See the relationship between the stakeholders in this project in the stakeholder map.

Page 04 of 29Contents
Stakeholder MapTimeline Process DiagramAppendicesPrint
PEvidence in Practice
Case Studies
View AlphabeticallyView GeographicallyView by Discipline
Full ReportSummary + Findings
Part I: The TaRL StoryPratham Education Foundation (Pratham), one of India’s largest educational non-governmental organizations, is recognized globally for its evidence-based pedagogical approach, dubbed Teaching at the Right Level (TaRL) or Combined Activities for Maximized Learning (CAMaL, which means amazing in Hindi).4 This case study explores how Pratham designed and scaled TaRL, from the perspective of an evidence-in-practice lens, and an analysis of the factors that encouraged different types of stakeholders to participate in the process.
This was the genesis of Pratham’s mission statement: “Every child in school and learning well.”
With support from UNICEF and the Mumbai Municipal Corporation, Chavan and Lambay launched a network of low-cost, community-based pre-schools. In 1995, Pratham was incorporated as a charitable trust and by 1998 it ran 3,000 pre-schools.9 During this period, Chavan was exposed to the concept of remedial education while visiting a school in Australia, where recent immigrants or children lagging behind received additional instruction
Beyond TaRL, Pratham implements a diverse set of programs with funding from a range of individuals, corporations, foundations, and governments. Pratham is one of the largest NGOs in India with an annual budget of over US$30 million.5 Today, Pratham’s programs serve children, young adults, and adult high school drop-outs across the country.
BackgroundBoth academic and practical evidence have always shaped Pratham’s approach. The 1990 UNESCO World Conference on Education for All in Jomtien, Thailand—emphasizing universal access to primary education and learning outcomes6—played an important role in Pratham’s inception.7 In the years following, UNICEF and the Mumbai Municipal Corporation partnered to address education access in the city. The partners recruited
Dr. Madhav Chavan and Farida Lambay, who had research backgrounds and experience working in Mumbai slums, to conduct a secondary analysis using government data to estimate how many children were out of school in Mumbai.
The two researchers knew from experience that, in Mumbai slums, government data overestimated the number of unenrolled school-aged children. Through their own surveys and interviews with local teachers they learned that, in fact, children’s lack of preparation for first grade was the more pressing issue. Rather than focus exclusively on enrollment, Chavan and Lambay concluded that pre-school programs—globally recognized for reducing the risk of dropping out of school—were needed to prepare children for success in school.8
4 In this case study, for simplicity’s sake we will refer to the program as “TaRL.”
5 “Financials,” Pratham USA, 2018. Access here.
6 “Education for All Movement,” UNESCO, 2017. Access here.
7 Stakeholder Interviews conducted between December 2016 and March 2018
8 “Pre-kindgergarten,” Center for Public Education. Access here.
9 R. Banerji and M. Chavan, “Improving literacy and math instruction at scale in India’s primary schools: The case of Pratham’s Read India program,” Journal of Educational Change 17, no. 4: 453-475. Access here.
Page 05 of 29Contents
Stakeholder MapTimeline Process DiagramAppendicesPrint
PEvidence in Practice
Case Studies
View AlphabeticallyView GeographicallyView by Discipline
Full ReportSummary + Findings
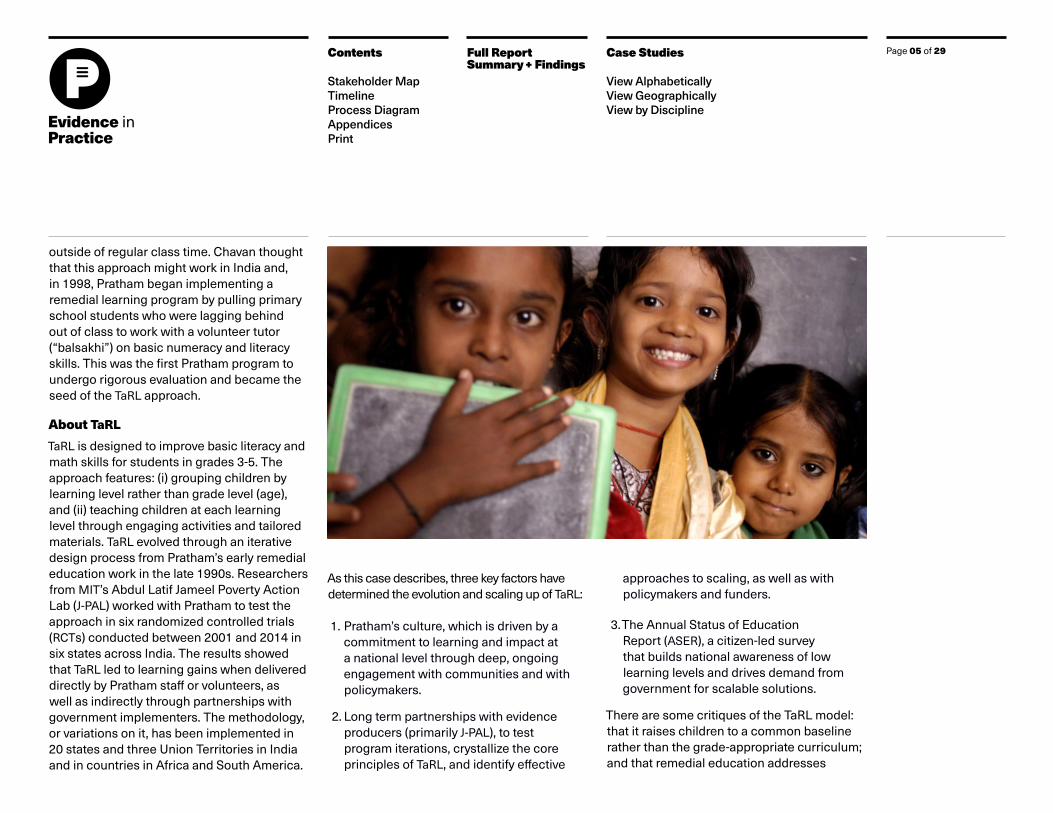
outside of regular class time. Chavan thought that this approach might work in India and, in 1998, Pratham began implementing a remedial learning program by pulling primary school students who were lagging behind out of class to work with a volunteer tutor (“balsakhi”) on basic numeracy and literacy skills. This was the first Pratham program to undergo rigorous evaluation and became the seed of the TaRL approach.
About TaRL
TaRL is designed to improve basic literacy and math skills for students in grades 3-5. The approach features: (i) grouping children by learning level rather than grade level (age), and (ii) teaching children at each learning level through engaging activities and tailored materials. TaRL evolved through an iterative design process from Pratham’s early remedial education work in the late 1990s. Researchers from MIT’s Abdul Latif Jameel Poverty Action Lab (J-PAL) worked with Pratham to test the approach in six randomized controlled trials (RCTs) conducted between 2001 and 2014 in six states across India. The results showed that TaRL led to learning gains when delivered directly by Pratham staff or volunteers, as well as indirectly through partnerships with government implementers. The methodology, or variations on it, has been implemented in 20 states and three Union Territories in India and in countries in Africa and South America.
As this case describes, three key factors have determined the evolution and scaling up of TaRL:
1. Pratham’s culture, which is driven by a commitment to learning and impact at a national level through deep, ongoing engagement with communities and with policymakers.
2. Long term partnerships with evidence producers (primarily J-PAL), to test program iterations, crystallize the core principles of TaRL, and identify effective
approaches to scaling, as well as with policymakers and funders.
3. The Annual Status of Education Report (ASER), a citizen-led survey that builds national awareness of low learning levels and drives demand from government for scalable solutions.
There are some critiques of the TaRL model: that it raises children to a common baseline rather than the grade-appropriate curriculum; and that remedial education addresses

Page 06 of 29Contents
Stakeholder MapTimeline Process DiagramAppendicesPrint
PEvidence in Practice
Case Studies
View AlphabeticallyView GeographicallyView by Discipline
Full ReportSummary + Findings
a symptom instead of the larger problem. However, TaRL is designed to address the critical challenge of low foundational literacy and numeracy skills in India, and evidence shows that it has successfully improved learning outcomes for millions of children.
Commitment to Ongoing LearningTaRL is a pedagogical approach that is rooted in rigorous evaluation and has been implemented at a large scale. Pratham is unique among education NGOs in India for its investment in building organizational capacity for monitoring and evaluation, its willingness to expose itself to evaluation by external researchers, and its commitment to sharing evaluation results publicly. By contrast, one former policymaker describes the context in
India’s education sector:
“The tradition of evidence-based decision-making is very, very weak in our country. There is no premium or incentive on it. There is no centralized mechanism of validating that this program seems to have done well […] compared with this one.”
Since 2001, Pratham has built a strong partnership with J-PAL, whose staff describe Pratham as “very, very results-oriented.” Pratham staff bring professional expertise in collecting and analyzing data and routinely attend trainings and workshops delivered by J-PAL and other evidence producers. One Pratham staff member describes the unique partnership:
“I think we’ve been very lucky because nobody forced any of these [evaluations] on us, so it was a [voluntary] coming together of two sides...”
“I think we’ve been very lucky because nobody forced any of these [evaluations] on us, so it was a [voluntary] coming together of two sides … We were very lucky to have them as partners because we have done some work with other people as well, but we see that they [J-PAL] really treat you as a partner and as an equal.”
Institutionalizing Measurement, Monitoring + EvaluationBy 2013, Pratham was implementing diverse programs across India and collecting data to inform its work and report to funders. However, data collection and analysis was decentralized and varied by program and state. To improve efficiency, Pratham CEO Rukmini Banerji created a Measurement, Monitoring, and Evaluation (MME) unit to standardize and streamline data collection and analysis for all Pratham programs. The unit’s team, which by 2016 had grown to a staff of 80, aims to digitize data collection and present data in visually useful forms for various audiences, including field staff, volunteers, teachers, funders, and policymakers. It attracts top talent, despite a lower pay scale, with a focus on generalists who are passionate about using data for the public good.

Contents
Stakeholder MapTimeline Process DiagramAppendicesPrint
Page 07 of 29
PEvidence in Practice
Case Studies
View AlphabeticallyView GeographicallyView by Discipline
Full ReportSummary + Findings
The MME team believes that measurement is necessary for accountability. For example, to spur competition between two districts, the MME team may present policymakers with a rigorous report that compares learning levels in those Districts. As people become exposed to data, they often learn to value its usefulness. For example, Pratham experienced resistance when it created a tool to help teachers track individual children. After using the tool, teachers came to demand it because it helped them do their jobs better.
The MME team designs measurement tools in partnership with other Pratham program teams with complementary expertise, but it is designed to be independent. It shares an office and works closely with the ASER Centre, discussed below, which conducts national assessments of children’s learning levels. As a result, and by design, information is gathered and shared collectively within the Pratham network:
“While it’s an internal unit it almost functions as an external unit because it’s not part of the program structure within Pratham. That has really helped as well. One of the main intentions was that we wanted the MME unit to be very evaluation, learning, research focused so the conscious decision was made to base it out of ASER Centre.”
In addition, Pratham stresses the importance of understanding the context of a community before conducting an assessment. Members of the teams involved in assessment are expected to travel to the field frequently, and any tools developed for a community are reviewed by local teams to ensure they are contextually appropriate. This learning collaboration between internal teams, and with communities, is illustrative of Pratham’s culture and has played a significant role in TaRL’s success.
Evaluating Pratham and Establishing a Proof of ConceptAt critical junctures, J-PAL has evaluated Pratham’s newest program adaptations to identify significant determinants of impact across time and context [see Appendix 1 for a summary of the RCTs]. The first RCTs were conducted between 2001 and 2004 by a team from the Massachusetts Institute of Technology, including Abhijit Banerjee and Esther Duflo, professors of Economics who co-founded J-PAL in 2003. The researchers approached Pratham because it was considered unusually data-driven and able to scale quickly and inexpensively.
These early RCTs determined that Pratham’s remedial tutoring—the balsakhi—program was cost-effective and led to significant learning gains. They also demonstrated Pratham’s ability to administer programs at scale. Thus, when Pratham wanted to adjust the model to implement the program through volunteers rather than paid tutors, J-PAL supported this experimentation.
Over the ensuing years, the partners systematically tested adjustments to improve impact and scalability, such as a 2005 evaluation for the World Bank, which showed that Pratham’s volunteer-implemented Learning to Read model resulted in a 20% increase in participants’ reading ability. This
“We wanted the MME unit to be very evaluation, learning, and research focused so the conscious decision was made to base it out of ASER Centre.”
Contents
Stakeholder MapTimeline Process DiagramAppendicesPrint
Page 08 of 29
PEvidence in Practice
Case Studies
View AlphabeticallyView GeographicallyView by Discipline
Full ReportSummary + Findings
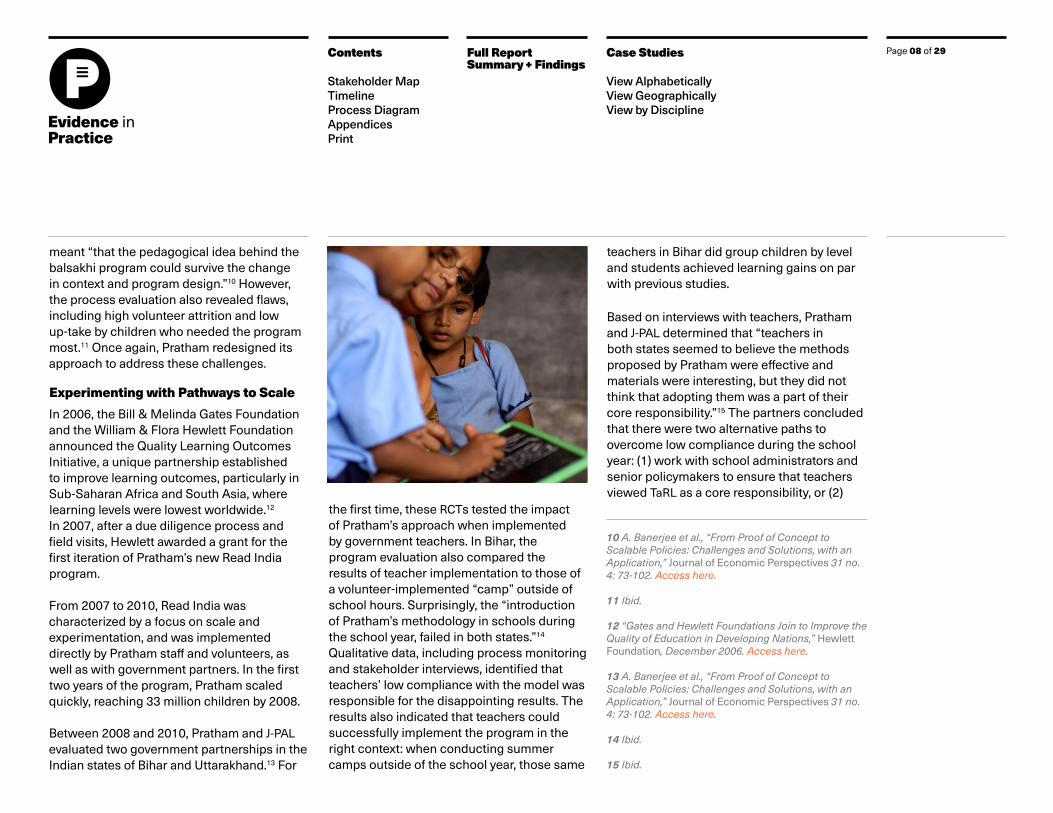
meant “that the pedagogical idea behind the balsakhi program could survive the change in context and program design.”10 However, the process evaluation also revealed flaws, including high volunteer attrition and low up-take by children who needed the program most.11 Once again, Pratham redesigned its approach to address these challenges.
Experimenting with Pathways to ScaleIn 2006, the Bill & Melinda Gates Foundation and the William & Flora Hewlett Foundation announced the Quality Learning Outcomes Initiative, a unique partnership established to improve learning outcomes, particularly in Sub-Saharan Africa and South Asia, where learning levels were lowest worldwide.12 In 2007, after a due diligence process and field visits, Hewlett awarded a grant for the first iteration of Pratham’s new Read India program.
From 2007 to 2010, Read India was characterized by a focus on scale and experimentation, and was implemented directly by Pratham staff and volunteers, as well as with government partners. In the first two years of the program, Pratham scaled quickly, reaching 33 million children by 2008.
Between 2008 and 2010, Pratham and J-PAL evaluated two government partnerships in the Indian states of Bihar and Uttarakhand.13 For
the first time, these RCTs tested the impact of Pratham’s approach when implemented by government teachers. In Bihar, the program evaluation also compared the results of teacher implementation to those of a volunteer-implemented “camp” outside of school hours. Surprisingly, the “introduction of Pratham’s methodology in schools during the school year, failed in both states.”14 Qualitative data, including process monitoring and stakeholder interviews, identified that teachers’ low compliance with the model was responsible for the disappointing results. The results also indicated that teachers could successfully implement the program in the right context: when conducting summer camps outside of the school year, those same
teachers in Bihar did group children by level and students achieved learning gains on par with previous studies.
Based on interviews with teachers, Pratham and J-PAL determined that “teachers in both states seemed to believe the methods proposed by Pratham were effective and materials were interesting, but they did not think that adopting them was a part of their core responsibility.”15 The partners concluded that there were two alternative paths to overcome low compliance during the school year: (1) work with school administrators and senior policymakers to ensure that teachers viewed TaRL as a core responsibility, or (2)
10 A. Banerjee et al., “From Proof of Concept to Scalable Policies: Challenges and Solutions, with an Application,” Journal of Economic Perspectives 31 no. 4: 73-102. Access here.
11 Ibid.
12 “Gates and Hewlett Foundations Join to Improve the Quality of Education in Developing Nations,” Hewlett Foundation, December 2006. Access here.
13 A. Banerjee et al., “From Proof of Concept to Scalable Policies: Challenges and Solutions, with an Application,” Journal of Economic Perspectives 31 no. 4: 73-102. Access here.
14 Ibid.
15 Ibid.
Contents
Stakeholder MapTimeline Process DiagramAppendicesPrint
Page 09 of 29
PEvidence in Practice
Case Studies
View AlphabeticallyView GeographicallyView by Discipline
Full ReportSummary + Findings
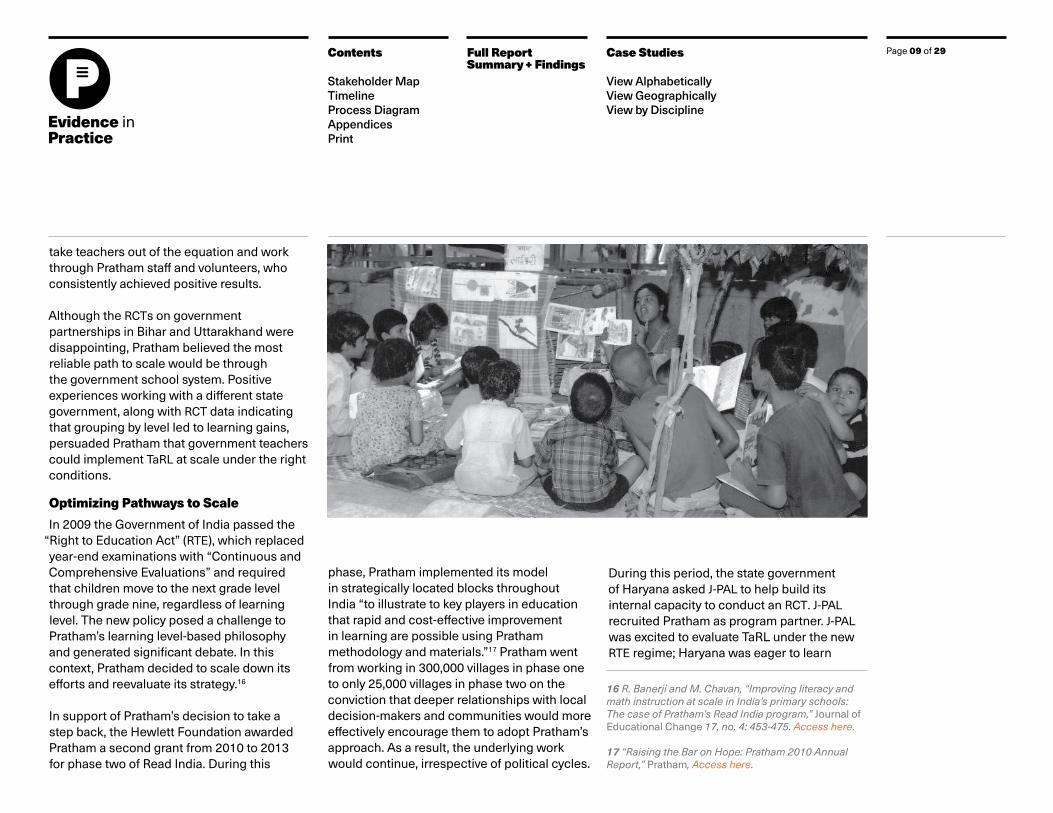
take teachers out of the equation and work through Pratham staff and volunteers, who consistently achieved positive results.
Although the RCTs on government partnerships in Bihar and Uttarakhand were disappointing, Pratham believed the most reliable path to scale would be through the government school system. Positive experiences working with a different state government, along with RCT data indicating that grouping by level led to learning gains, persuaded Pratham that government teachers could implement TaRL at scale under the right conditions.
Optimizing Pathways to ScaleIn 2009 the Government of India passed the
“Right to Education Act” (RTE), which replaced year-end examinations with “Continuous and Comprehensive Evaluations” and required that children move to the next grade level through grade nine, regardless of learning level. The new policy posed a challenge to Pratham’s learning level-based philosophy and generated significant debate. In this context, Pratham decided to scale down its efforts and reevaluate its strategy.16
In support of Pratham’s decision to take a step back, the Hewlett Foundation awarded Pratham a second grant from 2010 to 2013 for phase two of Read India. During this
During this period, the state government of Haryana asked J-PAL to help build its internal capacity to conduct an RCT. J-PAL recruited Pratham as program partner. J-PAL was excited to evaluate TaRL under the new RTE regime; Haryana was eager to learn
phase, Pratham implemented its model in strategically located blocks throughout India “to illustrate to key players in education that rapid and cost-effective improvement in learning are possible using Pratham methodology and materials.”17 Pratham went from working in 300,000 villages in phase one to only 25,000 villages in phase two on the conviction that deeper relationships with local decision-makers and communities would more effectively encourage them to adopt Pratham’s approach. As a result, the underlying work would continue, irrespective of political cycles.
16 R. Banerji and M. Chavan, “Improving literacy and math instruction at scale in India’s primary schools: The case of Pratham’s Read India program,” Journal of Educational Change 17, no. 4: 453-475. Access here.
17 “Raising the Bar on Hope: Pratham 2010 Annual Report,” Pratham, Access here.

Contents
Stakeholder MapTimeline Process DiagramAppendicesPrint
Page 10 of 29
PEvidence in Practice
Case Studies
View AlphabeticallyView GeographicallyView by Discipline
Full ReportSummary + Findings
from a reputable research institution; and Pratham hoped to prove that TaRL could scale effectively in partnership with governments. The model in Haryana addressed the challenge of teachers’ non-compliance observed in Bihar and Uttarakhand by ensuring that teachers viewed TaRL as a core responsibility. This was achieved by
• emphasizing government ownership of the program
• training cluster resource coordinators who monitored and mentored teachers
• adding a government-mandated hour of TaRL instruction to the school day
• requiring teachers to physically re-group children by learning level.
The 2012-2013 RCT revealed learning gains that exceeded expectations. Process monitoring data demonstrated much-improved compliance, with 90% of schools being grouped by learning level during the TaRL hour. Interviews suggested that cluster resource coordinators played a critical role in these outcomes.
In 2012, Pratham received a three-year grant from USAID to conduct an evaluation of an alternative TaRL implementation model that did not rely on government implementation. Instead, TaRL was delivered during a one-hour
It launched the third phase of Read India (2013-2016) with support from Hewlett focusing on scaling TaRL both directly and through government implementers. As of 2017, the teacher-led model has been implemented in over 100,000 schools across 14 states, reaching almost 5 million children, while the in-school, volunteer-led model has been implemented in over 4,000 schools across India, reaching over 200,000 children.19 Pratham has also leveraged the results of these RCTs to secure hundreds of district-level government partnerships.20
The Annual Status of Education ReportAlongside its efforts to test and identify essential components of TaRL, Pratham worked to shape the public debate around education in India. The Annual Status of Education Report (ASER) continues to be one of the organization’s most significant contributions in this respect. ASER is now a highly anticipated annual report on
session during school hours by Pratham staff and volunteers in short bursts of 10 to 20 days for a total of 40 days a year. From 2013 to 2014, J-PAL conducted a RCT of what became known as the “learning camp” model, which demonstrated “the relative ease with which apparently daunting learning gaps can be closed.”18
Based on the successful results shown by these RCTs, Pratham was confident about the essential components of TaRL and the two different approaches to scale (directly through Pratham staff and volunteers and indirectly through government partnerships).
18 A. Banerjee et al., “From Proof of Concept to Scalable Policies: Challenges and Solutions, with an Application,” Journal of Economic Perspectives 31 no. 4: 73-102. Access here.
19 Ibid.
20 S. Chatterji Dutt, C. Kwauk, J. Perlman Robinson, “Pratham’s Read India Program: Taking Small Steps Toward Learning at Scale,” Brookings, 2016. Access here.
Contents
Stakeholder MapTimeline Process DiagramAppendicesPrint
Page 11 of 29
PEvidence in Practice
Case Studies
View AlphabeticallyView GeographicallyView by Discipline
Full ReportSummary + Findings
learning levels across India and has spurred policymakers to adopt programs that will improve their state- or district-level results.
In 2004, the newly elected Government of India formed the United Progressive Alliance (UPA). The UPA government was committed to education reform, launching a 2% tax that would fund initiatives to improve access to and quality of education. Senior policy advisors familiar with Pratham’s work invited Madhav Chavan to join the National Advisory Council advising the federal government on various education issues, making one of the co-founders of Pratham a senior policy advisor in the new government.
Within the government, there was debate about the best approach to improve education outcomes. The Ministry of Education had always collected an enormous amount of data, but it focused only on aggregate outcomes instead of individual learning levels. Given new policies aimed at improving learning outcomes, Pratham gave a presentation recommending a new assessment that could be quickly implemented and would measure learning levels of individual students across India. The Planning Commission encouraged Pratham to run a pilot and report back.
Pratham’s standardized assessment tool for literacy and numeracy consisted of a single
sheet of paper with four levels of text—letters, common words, sentences in a paragraph, and stories. A similar tool was created for numeracy. The content was adapted to the local language and state-specific literacy and numeracy expectations for grade two.
Through partner organizations in rural districts across India, Pratham conducted the first household-level Annual Status of Education Report (ASER) survey in late 2005.21 The results suggested that over 90% of children ages 5 to 16 were enrolled in school, but 50% could not read at a grade two level. Meanwhile, the government commissioned a third-party assessment of total enrollment by a private company, which reported the
same enrollment figure. Pratham claimed that if the government could accept the accuracy of its impressive enrollment figures, it should also accept data on the dire state of learning outcomes for children enrolled in school. Given the accuracy and timeliness of the ASER survey data, the government decided to use the report to inform its Annual Economic Survey. From 2005 to 2012 one page of the Finance Ministry’s annual report featured ASER data. In 2012, the Ministry of Education began emphasizing learning outcomes and urged state governments to begin their own
21 For further information on the ASER Center, please see its web site here.
“The reason we’re focusing on learning in India is because ASER made the problem in learning visible. Everyone knew people weren’t learning, but they put a vocabulary around it. A vocabulary everyone understood.”

Contents
Stakeholder MapTimeline Process DiagramAppendicesPrint
Page 12 of 29
PEvidence in Practice
Case Studies
View AlphabeticallyView GeographicallyView by Discipline
Full ReportSummary + Findings
measurement processes, many of which were modeled on the ASER survey.
The ASER Centre, established as an independent unit, is “the largest household survey of children conducted in India by citizens’ groups, carried out by more than 25,000 volunteers and covering over 700,000 children in 15,000 villages each year.”22 As of 2017, the ASER survey is conducted in 595 of 613 rural districts in 29 states and four union territories and is constantly refined through rigorous field tests.
ASER has played an important role in scaling Pratham’s work, including TaRL, for three key reasons. First, ASER (with significant influence from Pratham) placed learning outcomes at the center of the national debate on education. As one expert noted:
“The reason we’re focusing on learning in India is because ASER made the problem in learning visible. Everyone knew people weren’t learning, but they put a vocabulary around it. A vocabulary everyone understood.”
Second, the ASER survey and the organization built around it highlight and reinforce Pratham’s organizational commitment and capacity to produce and use evidence.
Former ASER Director Rukmini Banerji, now CEO of Pratham, has a PhD in Education and has advised the government of India and others on using data to inform education policy. She has been a co-chair for the Global Learning Metrics Task Force, convened by the Brookings Institution and UNESCO.23
The ASER Centre reinforces Pratham’s ability to collect and use data because the two organizations are intertwined and interdependent. Moreover, ASER data on
22 Ibid.
23 “Rukmini Banerji,” International Growth Center, 2018. Access here.

Page 13 of 29Contents
Stakeholder MapTimeline Process DiagramAppendicesPrint
PEvidence in Practice
Case Studies
View AlphabeticallyView GeographicallyView by Discipline
Full ReportSummary + Findings
children’s learning levels are one of the most important forms of evidence Pratham uses to engage government or community partners and determine appropriate interventions.
Finally, ASER has generated demand from policymakers for interventions to address low learning levels in their states. ASER illuminated the scale of the problem and built demand for solutions like Pratham’s. Many states have also implemented their own solutions thanks to ASER’s reporting:
“There was a lot of action and programs, which states take to improve their metric of ASER. They [the ASER Centre] are in a very powerful position. So how they frame the problem will in fact, whether or not policymakers acknowledge it, guide the actions a lot of policymakers take. I know a lot of states, they would say they were sending out packages to different districts, saying please get these children to be able to recognize letters, words, because they are saying, look we need to get these forms up on ASER.”
TaRL evolved and achieved scale over the course of over two decades. Pratham’s leaders promoted a culture of learning, which they further institutionalized through the establishment of the Measurement, Monitoring, and Evaluation team. This internal commitment to testing and improving Pratham’s programs, along with partnerships with external evaluation organizations like J-PAL, resulted in a methodical, iterative approach to program design with demonstrated outcomes. At the same time, increased public awareness about learning levels, thanks in large part to ASER, created new opportunities to scale TaRL directly and in partnership with governments.
Pratham’s leaders promoted a culture of learning, which they further institutionalized through the establishment of the Measurement, Monitoring, and Evaluation team.
Contents
Stakeholder MapTimeline Process DiagramAppendicesPrint
Page 14 of 29
PEvidence in Practice
Case Studies
View AlphabeticallyView GeographicallyView by Discipline
Full ReportSummary + Findings
Part II: Key Themes + Insights
This section discusses the Evidence in Practice themes as they pertain to Teaching at the Right Level and summarizes key insights and implications for thinking about the translation of evidence to policy and practice more generally.
were often most effective to secure buy-in from policymakers, funders, and government implementers. In addition, policymakers commissioned third-party assessments of pilot programs to determine whether and how to scale.
In part, the open, explicit, and shared acknowledgement of the acceptability of diverse types of evidence enabled partner organizations, such as Pratham, J-PAL, funders, and government actors, to be flexible and develop trust.
Ultimately, there are times when evidence may be compelling but at odds with political promises or priorities. Thus, different forms of evidence have led to an increasingly nuanced, though still unresolved, debates on the best approaches to improving educational outcomes. The story of Pratham illustrates that there is always a tension in the policy process: between what is most effective and what is most efficient, between what is better in the long term and what is politically feasible in the short term. The quality of evidence that Pratham and its partners have created has allowed for a much deeper debate on what the next iteration of that policy development process looks like, with each successive cycle of debate based on increasingly rigorous and complete data.
policymaking process. Process monitoring and qualitative data, as well as RCTs, helped identify critical program components. The results were often used to get a foot in the door with funders and policymakers, though the extent of evidence needed to convince policymakers varied. In some cases, policymakers with academic backgrounds reviewed the RCTs. In other cases, J-PAL explained the relative rigor and objectivity of different kinds of evidence in order to persuade policymakers to try TaRL. In some cases, policymakers felt that a stamp of approval from a well-respected, elite institution like J-PAL indicated that there was sufficient evidence behind the model for a pilot to be politically acceptable.
In every case, evidence of Pratham’s ability to operate at scale was at least as important as the academic evidence. Field trips to observe children learning through the TaRL approach
Alternative Definitions of EvidenceThere are varying definitions and understandings of what constitutes
“evidence,” dependent especially on the perspectives of each stakeholder group. For example, the framing, language, and limited accessibility of academic evidence can render it less useful to other stakeholders. These diverging views of evidence create barriers across stakeholder groups, as what constitutes valid evidence for each exists in different realms and in different forms that are challenging to reconcile.
Evidence producers, policymakers, and implementers agreed that, while RCTs have played an important role in refining and legitimizing TaRL, they are a “slice” among many types of evidence required for program design and implementation. Other types of evidence have proven equally useful depending on the purpose and stage of the
Contents
Stakeholder MapTimeline Process DiagramAppendicesPrint
Page 15 of 29
PEvidence in Practice
Case Studies
View AlphabeticallyView GeographicallyView by Discipline
Full ReportSummary + Findings
Incentive StructuresThroughout the ecosystem, within and across stakeholder groups, formal and informal incentive structures are frequently not conducive—and are often in contradiction—to the integration of evidence into practice. Typically, organizational incentives are defined around an insular view of the organization (e.g., academics publish in academic journals, policymakers must exercise their budgets according to program and budgetary rules, NGOs must operationalize their programs as stated in their budgets and proposals to funders). Usually, these organizational incentives have no mandate or room for the explicit search of external evidence, much less for the generation of internal evidence that would then lead to continuous adaptation of programs and policies as new learning emerges.
Pratham’s commitment to helping all children achieve a foundation in literacy and numeracy has translated into a focus on organizational learning to improve outcomes. Pratham’s incentives have thus aligned well with evidence producers and funders with similar goals and outlooks. For example, J-PAL and Pratham have enjoyed aligned incentives throughout their partnership. J-PAL could test large-scale pedagogical interventions with an effective implementer, while Pratham could build its evidence base and credibility
collaborating with a highly respected evidence producer. However, Pratham recognized that buy-in from everyone, from communities to senior policymakers, who have vastly different incentives, was necessary for the systemic change it sought. When possible, Pratham created shared incentives by co-designing interventions with other stakeholders, investing time to build relationships, and holding stakeholders accountable through monitoring and measurement.
As noted above, policymakers at times have incentives not to use specific evidence. Political cycles and short tenures in administrative positions drive investment in programs with short-term results. Evidence supporting a policy intervention may also reduce policymakers’ discretion to adopt a more politically or personally expedient policy. Adopting a new program, even if backed by evidence, can be politically risky if it fails due to poor design or implementation. To account for and counteract such potentially misaligned incentives, both Pratham and J-PAL have found it useful to present policymakers with a menu of options as opposed to a prescribed program. This is possible with TaRL because the essential program components have been identified and can generally be financed by reallocating existing education budget line items. Policymakers from multiple states noted that Pratham’s willingness to adapt the program based on their input was a key reason they decided to partner.
By co-designing the approach with policymakers, Pratham aims to increase government “ownership” so that the TaRL approach becomes aligned with government incentives, as well as engrained and resilient to political cycles:
“In fact, our theory is that we are not about to set up a McDonald’s chain, so you insist that your meat patty and your
“...we’re in favor of Chinese restaurants. We have a menu and you can take that menu, you can change it a bit here and there, but when you set up your own restaurant people will say, ‘This is a Chinese restaurant.’”
Contents
Stakeholder MapTimeline Process DiagramAppendicesPrint
Page 16 of 29
PEvidence in Practice
Case Studies
View AlphabeticallyView GeographicallyView by Discipline
Full ReportSummary + Findings
sauces should be, your exact prescription of Golden Fries should be available everywhere. No, we’re in favor of Chinese restaurants. We have a menu and you can take that menu, you can change it a bit here and there, but when you set up your own restaurant, people will say, ‘This is a Chinese restaurant,’ because it looks like that. … Every government is opening a Chinese restaurant, which looks a little bit like what we have, but its flavor is different. [...] That is how actually ideas start spreading.”
Thus, Pratham understands that providing a menu of options and allowing policymakers
to choose is more effective than pushing a prescribed initiative. Pratham has determined which program components are essential vs. which can be adapted based on context. This is possible because the essential components of TaRL are simple and well-defined: group children by level, teach them at that level, and ensure teachers are effectively motivated.
Pratham has also used monitoring and measurement to align stakeholder incentives. For example, as noted above, the MME team would present policymakers from two Districts with comparison reports on common indicators to spur competition between them.
Timing MisalignmentsThe different and often discordant timeframes within which researchers, policymakers, and implementers operate often hobble efforts to coordinate, let alone collaborate, on evidence-informed approaches. Electoral cycles and political windows differ from NGO funding cycles and from academic publishing rhythms. Yet each actor is bound by the timeframes of her formal stakeholder group.
Pratham has developed patience and the agility to take advantage of and create shifts in the education discourse. However, timing misalignment has posed a significant challenge to scaling TaRL through government. For example, turnover within government can make long term partnership difficult or impossible. In several cases, key champions in a state left their positions after the government had signed an MOU with Pratham. Afterwards, there was insufficient political will to carry out the program as planned. Pratham and J-PAL have learned to identify and cultivate champions across administrative levels for redundancy and to endure political transitions.
However, structural timing misalignments remain. Budget cycles are rarely aligned with program implementation timelines: while a state-wide scaling up would take several
Contents
Stakeholder MapTimeline Process DiagramAppendicesPrint
Page 17 of 29
PEvidence in Practice
Case Studies
View AlphabeticallyView GeographicallyView by Discipline
Full ReportSummary + Findings
years, budgets are generally approved on an annual basis. Delays or shortfalls in approved budgets have at times damaged the implementation of TaRL. It is challenging to find a solution to this timing misalignment because policymakers’ due diligence processes take time and their priorities change in ways that are difficult to anticipate.
Despite these challenges, many governments are open, and even enthusiastic, about using evidence to inform education policy and programs. Pratham and J-PAL have learned to avoid states where there is significant turnover, lack of trust of NGOs, a history of covering up poor program results, or entrenched programs that would be difficult to replace.
Trust, Respect, and Buy-in Among StakeholdersThe cross-stakeholder collaborations required for evidence-informed policies and practices are often difficult to initiate, develop, and sustain. Particularly when institutional incentives are lacking, personal trust, respect, and buy-in between individuals across stakeholder groups become critical to fostering the effective flow of evidence into practice.
Trust and respect developed between stakeholders in large part due to relationships
Pratham formed with researchers, policymakers, and funders. J-PAL has served as a trusted partner through its role as an evidence producer that published and presented Pratham’s RCT results and, more recently, through its policy team that was established in 2010 to help scale rigorously tested interventions. TaRL is one of a handful of programs that the policy team promotes and is one of the few that has been tested in multiple contexts. J-PAL’s policy team approaches policymakers with whom it has stronger relationships than Pratham and presents the evidence behind TaRL in various forums.
Pratham’s commitment to scale required a model that was cost-effective, and simple enough to implement in extremely diverse contexts. As a result, even when an RCT showed significant gains in learning outcomes, Pratham insisted on adjusting and testing the model until the most impactful, cost-effective components were identified. Understanding these essential features enabled Pratham to be flexible when adapting TaRL to a new context in partnership with other stakeholders. Pratham, J-PAL, funders, and government staff at different administrative levels were all involved in this process of translating evidence into practice. Pratham launched each new adaptation or expansion of TaRL by convening the relevant stakeholders to jointly explore how best to improve learning outcomes for students. The partners overcame common design and implementation challenges due to an integrated, collaborative approach to translation that leveraged stakeholders’ complementary resources, networks, and insights to promote and operationalize TaRL.
Pratham invested in long term relationships to promote government adoption of its evidence-informed programs. Pratham simultaneously built relationships with communities and local policymakers through direct programs, and with decision-makers at the highest levels of government through advocacy and
Contents
Stakeholder MapTimeline Process DiagramAppendicesPrint
Page 18 of 29
PEvidence in Practice
Case Studies
View AlphabeticallyView GeographicallyView by Discipline
Full ReportSummary + Findings
advisory efforts. Pratham’s leaders also served on government committees and cultivated relationships with policymakers who went on to hold senior positions in central and state governments.
Through its experience working with government at all levels, Pratham has learned that partnerships will not move forward unless champions with convening power have been cultivated. Champions are critical at all phases of a partnership and at all administrative levels. One policymaker explained that with the Education Secretary and Minister as champions of a partnership with Pratham, it was easy to make budget allocation decisions and to move from pilot to scale.
Although Pratham is one of India’s largest NGOs and works across the country, its staff recognizes that “government is the only one that can change things. Pratham can’t change things alone.” The organization is eager to build the capacity of government partners so that more children can benefit from its evidence-informed methodology. As Pratham scales this effort, it is also learning strategies to overcome common challenges of working through government.
Policymakers reported that, given the complexity and inescapable trade-offs of their decisions, Pratham’s flexibility was especially
important. Pratham leaders share the belief that being flexible about program design and implementation based on the unique needs of a given context is not only necessary, but it also benefits Pratham’s work.
Long term relationships also helped Pratham align incentives with funders. Over time, funders developed confidence in Pratham and became comfortable supporting Pratham’s experimentation to improve its already effective model. However, even
with time there were funders who preferred scaling “proven” models over experimentation. Pratham recognized this dichotomy among funders and cultivated a “healthy mix” of donors (with different underlying incentives) to fulfill these two goals. Several individuals at funding institutions played a significant role as champions in their willingness to fund experimentation. Several such individuals moved from one foundation to another and continued their relationships with, and support for, Pratham.
“It was much more in a ‘we have a shared goal and we’re all thinking about the best way to reach it’ sort of way than in a directive ‘we’re the funders, it’s our money, and we think this is what you should do, so do it.’”FUNDER
Page 19 of 29Contents
Stakeholder MapTimeline Process DiagramAppendicesPrint
PEvidence in Practice
Case Studies
View AlphabeticallyView GeographicallyView by Discipline
Full ReportSummary + Findings
However, several interviewees pointed out that many policymakers lack the capacity to use data, even when their capacity to collect data has strengthened over time. In this case study, externally-generated data was presented and explained to policymakers by both Pratham and J-PAL. Pratham’s MME unit designed reports for policymakers based on their perceived level of comfort interpreting data, their decision-making authority, and their willingness to change. J-PAL’s policy team met with senior policymakers to explain different types of evidence and their relative usefulness for policymaking. In some cases, this advocacy resulted in the government adopting a TaRL program.
Devoting Time and Resources to Integrating EvidenceFew organizations provide incentives or carve out explicit time for managers to explore emerging evidence in their field. Even fewer assign staff to find relevant evidence and translate it into accessible formats for the organization. As a result, the role of preparing and sharing evidence that is timely, useful, and relevant for practitioners is sometimes explicitly played by formal intermediaries (e.g., certain think-tanks). More frequently, an actor who holds a formal role within another stakeholder group spontaneously takes on the (additional) responsibility for trying to integrate evidence, with no actor formally responsible for the process. Discovering and integrating evidence requires time, energy and funding.
Externally generated evidence was used by all stakeholders involved in this case. Pratham and the ASER Centre used academic literature and research conducted by think tanks to inform assessment tools. Policymakers used independent contractors to conduct third-party assessments of pilot programs to determine whether to scale. Funders used RCT results to make decisions about grant-making strategy to improve learning outcomes. J-PAL used government data to adapt TaRL for a new context.
Operationalizing Evidence Captured InternallyEven organizations with strong monitoring and evaluation departments often do not transform the operational data into formats that could be widely used within the organization, or beyond, to expand actors’ understanding about what has been learned from past or existing programs. Data is thus used to evaluate retrospective operations, but not to improve the prospective design of new initiatives. This inhibits the application of experiential evidence, which may be rigorous and convincing, to new contexts and often prevents evidence from reaching other key stakeholders after it is produced, as it remains linked internally only to a given initiative.
Pratham launched its MME unit in 2013 to improve coordination in measurement, monitoring, and evaluation processes, and to be able to more easily share and interpret data across programs and sites.
The MME unit is equipped to create useful tools for monitoring and translating operational data because of its collaboration with the ASER Centre and other Pratham teams. Pratham now has strong internal capacity and resources to collect and analyze program-generated evidence. When Pratham has lacked internal capacity to collect or interpret data, it has been
Contents
Stakeholder MapTimeline Process DiagramAppendicesPrint
Page 20 of 29
PEvidence in Practice
Case Studies
View AlphabeticallyView GeographicallyView by Discipline
Full ReportSummary + Findings
remarkably good at building relationships with organizations with complementary capacity and resources.
Learning from FailurePotential consequences for risk-taking and experimentation with innovative approaches are generally seen as negative and dissuade the exploration of novel, evidence-informed interventions. Fear of failure can further hinder the incorporation of novel evidence into practice, even when stakeholders recognize the value and applicability of the evidence.
Observers and staff emphasized Pratham’s culture of commitment to experimentation and an unusual openness to being evaluated. Pratham tends to hire people who are not tied to a specific education ideology and who have a strong interest in data and impact. There is a desire among staff across all levels of the organization to constantly improve and expand Pratham’s impact. In this environment, experimentation is encouraged and failure is accepted as an opportunity to learn.
Pratham has required funding not directly tied to program implementation to nurture its data-driven culture and to test and refine its approach. Two elements seem to enable a successful, long term relationship between
Pratham and a flexible funder. One is a shared mission and commitment to learning. As one funder explains:
“It was much more in a ‘we have a shared goal and we’re all thinking about the best way to reach it’ sort of way than in a directive ‘we’re the funders, it’s our money, and we think this is what you should do, so do it.’”
The second ingredient is open communication, in which both parties learn from one another. Two-way communication about successes and failures invites potential solutions. As one senior staff member at Pratham puts it:
“We set very high standards for ourselves and we are not scared to fail. That’s also a cultural thing in Pratham. If you do fail, it’s okay, as long as you acknowledge it and you want to make a change, it’s fine. Being open with … our partner funders on those aspects has also been very beneficial for us because we’ve been able to learn from them.”
“Internally as an organization and externally as a major player on the Indian scene, Pratham learned that it is important to be flexible and nimble, to seize and to create opportunities, and to continue to push the learning agenda on every available forum.”

Page 21 of 29Contents
Stakeholder MapTimeline Process DiagramAppendicesPrint
PEvidence in Practice
Case Studies
View AlphabeticallyView GeographicallyView by Discipline
Full ReportSummary + Findings
Conclusion Pratham, through TaRL and other programs, has had a significant impact on the education sector in India. Through its unrelenting commitment to the generation and use of evidence, Pratham has systematically influenced the public debate on remedial education, first insisting that grade level is not synonymous with learning level, then pushing for measurement of learning levels, and then partnering to implement solutions to improve learning levels. Pratham’s approach to evidence-informed policy and practice is rooted in the long term relationships it has cultivated with policymakers, researchers, funders, and communities.
As a simple and cost-effective program, TaRL is well-suited to scale through multiple channels. Pratham’s relationships, along with its organizational commitment to learn over time and achieve better outcomes, have enabled Pratham and its partners to improve learning outcomes for millions of children in India. Moreover, many governments and other organizations, in multiple settings and contexts around the world, have taken up TaRL or programs modeled after TaRL,24 achieving similarly positive results.
Pratham’s commitment to learning is summarized well by Rukmini Banerji and Madhav Chavan:25
“The major lesson for Pratham was also that the journey of transformation of communities and of systems is a long one, with continuous learnings at every step. Internally as an organization and externally as a major player on the Indian scene, Pratham learned that it is important to be flexible and nimble, to seize and to create opportunities, and to continue to push the learning agenda on every available forum. At the same time, it is also essential to play the game simultaneously on both fields—the micro dynamics at the ground level and the macro dynamics of national and state priorities, policies and plans. […] Finally, simple measurement is used to track progress of individuals and groups towards the goals and to guide corrections throughout the process.”
24 See the case study in this series on the Teacher Community Assistance Initiative in Ghana.
25 R. Banerji and M. Chavan, “Improving literacy and math instruction at scale in India’s primary schools: The case of Pratham’s Read India program,” Journal of Educational Change 17, no. 4: 453-475. Access here.
Contents
Stakeholder MapTimeline Process DiagramAppendicesPrint
Page 22 of 29
PEvidence in Practice
Case Studies
View AlphabeticallyView GeographicallyView by Discipline
Full ReportSummary + Findings
Stakeholder Map
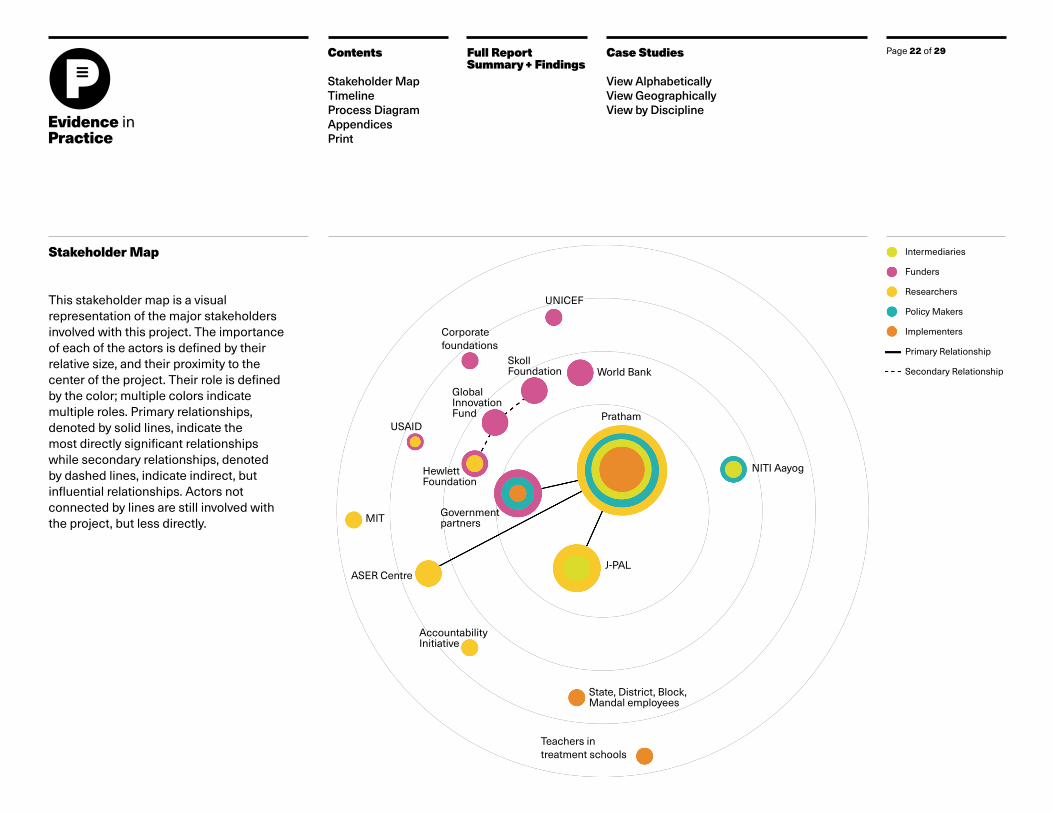
This stakeholder map is a visual representation of the major stakeholders involved with this project. The importance of each of the actors is defined by their relative size, and their proximity to the center of the project. Their role is defined by the color; multiple colors indicate multiple roles. Primary relationships, denoted by solid lines, indicate the most directly significant relationships while secondary relationships, denoted by dashed lines, indicate indirect, but influential relationships. Actors not connected by lines are still involved with the project, but less directly.
State, District, Block, Mandal employees
Government partners
ASER Centre
Global Innovation Fund
Hewlett Foundation
NITI Aayog
Pratham
MIT
Teachers in treatment schools
Skoll Foundation
Corporate foundations
USAID
J-PAL
UNICEF
Accountability Initiative
Intermediaries
Funders
Researchers
Policy Makers
Implementers
Primary Relationship
Secondary RelationshipWorld Bank
Contents
Stakeholder MapTimeline Process DiagramAppendicesPrint
Page 23 of 29
PEvidence in Practice
Case Studies
View AlphabeticallyView GeographicallyView by Discipline
Full ReportSummary + Findings
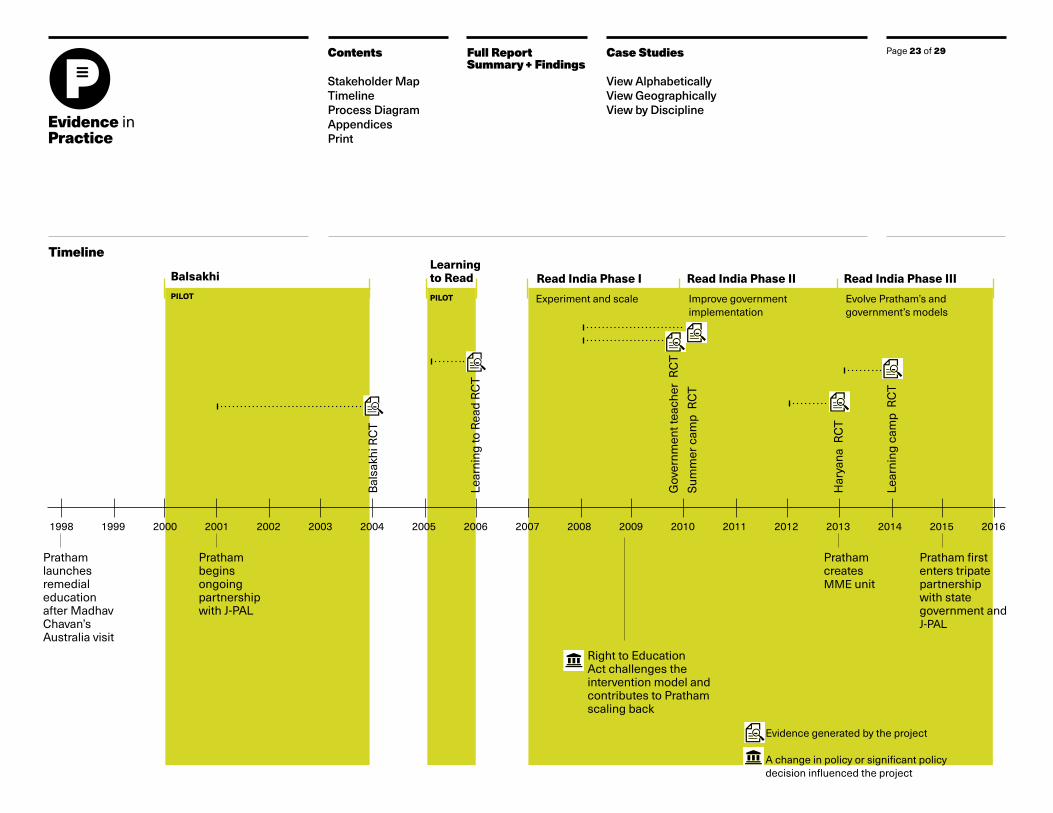
Timeline
1998 1999 2000 2001 2002 2003 2004 2005 2006 2007 2008 2009 2010 2011 2012 2013 2014 2015 2016
Bal
sakh
i RC
T
Pratham launches remedial education after Madhav Chavan’s Australia visit
Pratham begins ongoing partnership with J-PAL
Pratham creates MME unit
Pratham first enters tripate partnership with state government and J-PAL
Lear
ning
to R
ead
RC
T
Gov
ernm
ent t
each
er R
CT
Sum
mer
cam
p R
CT
Har
yana
RC
T
Lear
ning
cam
p R
CT
Read India Phase I Read India Phase II Read India Phase III
Experiment and scale Improve government implementation
Evolve Pratham’s and government’s models
Right to Education Act challenges the intervention model and contributes to Pratham scaling back
BalsakhiPILOT
Learning to ReadPILOT
Evidence generated by the project
A change in policy or significant policy decision influenced the project
Contents
Stakeholder MapTimeline Process DiagramAppendicesPrint
Page 24 of 29
PEvidence in Practice
Case Studies
View AlphabeticallyView GeographicallyView by Discipline
Full ReportSummary + Findings
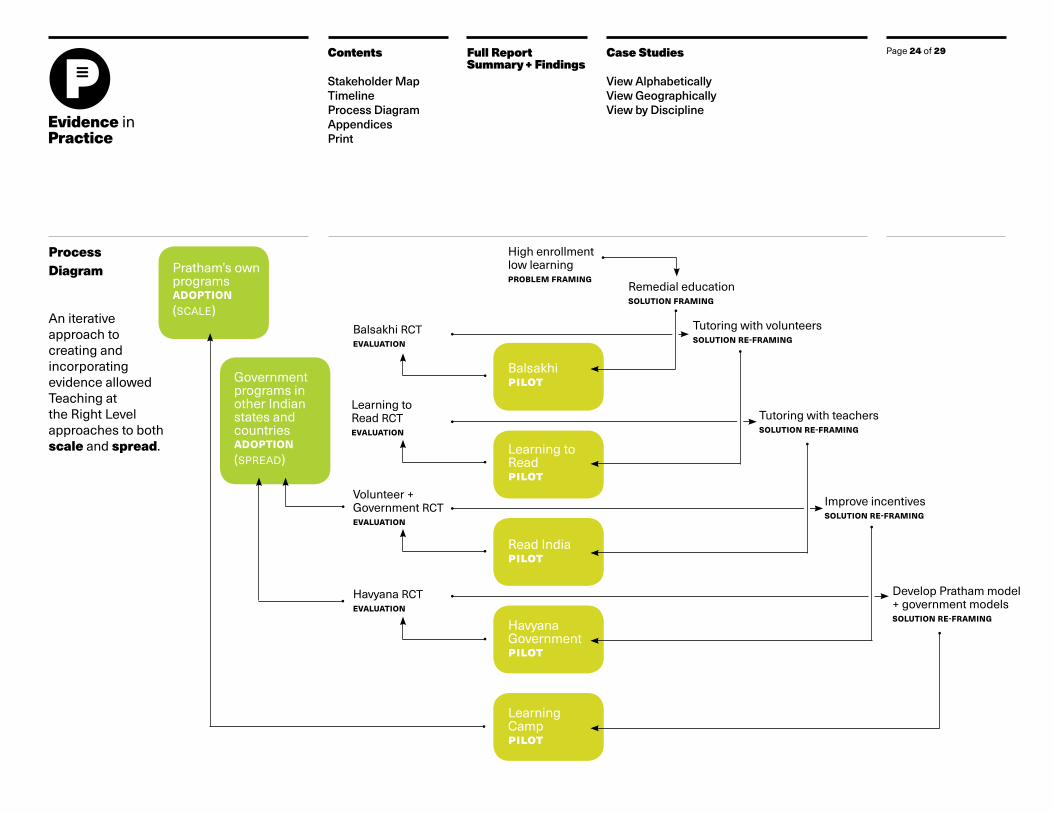
Process Diagram
An iterative approach to creating and incorporating evidence allowed Teaching at the Right Level approaches to both scale and spread.
Pratham’s own programs ADOPTION(SCALE)
High enrollmentlow learningPROBLEM FRAMING
Remedial educationSOLUTION FRAMING
Balsakhipilot
Balsakhi RCTEVALUATION
Tutoring with volunteersSOLUTION RE-FRAMING
Tutoring with teachersSOLUTION RE-FRAMING
Improve incentivesSOLUTION RE-FRAMING
Develop Pratham model + government modelsSOLUTION RE-FRAMING
Learning to Readpilot
Learning to Read RCTEVALUATION
Government programs in other Indian states and countriesADOPTION(SPREAD)
Read India pilot
Volunteer + Government RCTEVALUATION
Havyana Governmentpilot
Learning Camppilot
Havyana RCTEVALUATION
Contents
Stakeholder MapTimeline Process DiagramAppendicesPrint
Page 25 of 29
PEvidence in Practice
Case Studies
View AlphabeticallyView GeographicallyView by Discipline
Full ReportSummary + Findings
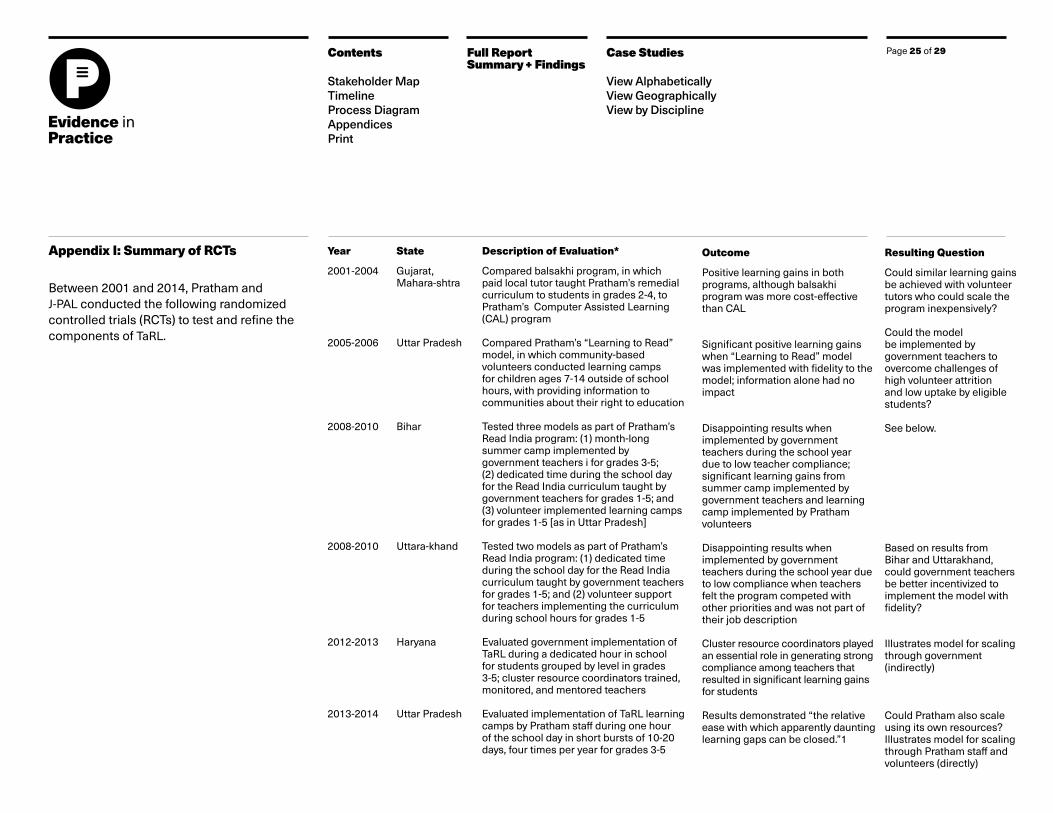
Appendix I: Summary of RCTs
Between 2001 and 2014, Pratham and J-PAL conducted the following randomized controlled trials (RCTs) to test and refine the components of TaRL.
Year
2001-2004
2005-2006
2008-2010
2008-2010
2012-2013
2013-2014
State
Gujarat, Mahara-shtra
Uttar Pradesh
Bihar
Uttara-khand
Haryana
Uttar Pradesh
Description of Evaluation*
Compared balsakhi program, in which paid local tutor taught Pratham’s remedial curriculum to students in grades 2-4, to Pratham’s Computer Assisted Learning (CAL) program
Compared Pratham’s “Learning to Read” model, in which community-based volunteers conducted learning camps for children ages 7-14 outside of school hours, with providing information to communities about their right to education
Tested three models as part of Pratham’s Read India program: (1) month-long summer camp implemented by government teachers i for grades 3-5; (2) dedicated time during the school day for the Read India curriculum taught by government teachers for grades 1-5; and (3) volunteer implemented learning camps for grades 1-5 [as in Uttar Pradesh]
Tested two models as part of Pratham’s Read India program: (1) dedicated time during the school day for the Read India curriculum taught by government teachers for grades 1-5; and (2) volunteer support for teachers implementing the curriculum during school hours for grades 1-5
Evaluated government implementation of TaRL during a dedicated hour in school for students grouped by level in grades 3-5; cluster resource coordinators trained, monitored, and mentored teachers
Evaluated implementation of TaRL learning camps by Pratham staff during one hour of the school day in short bursts of 10-20 days, four times per year for grades 3-5
Outcome
Positive learning gains in both programs, although balsakhi program was more cost-effective than CAL
Significant positive learning gains when “Learning to Read” model was implemented with fidelity to the model; information alone had no impact
Disappointing results when implemented by government teachers during the school year due to low teacher compliance; significant learning gains from summer camp implemented by government teachers and learning camp implemented by Pratham volunteers
Disappointing results when implemented by government teachers during the school year due to low compliance when teachers felt the program competed with other priorities and was not part of their job description
Cluster resource coordinators played an essential role in generating strong compliance among teachers that resulted in significant learning gains for students
Results demonstrated “the relative ease with which apparently daunting learning gaps can be closed.”1
Resulting Question
Could similar learning gains be achieved with volunteer tutors who could scale the program inexpensively?
Could the model be implemented by government teachers to overcome challenges of high volunteer attrition and low uptake by eligible students?
See below.
Based on results from Bihar and Uttarakhand, could government teachers be better incentivized to implement the model with fidelity?
Illustrates model for scaling through government (indirectly)
Could Pratham also scale using its own resources?Illustrates model for scaling through Pratham staff and volunteers (directly)
Contents
Stakeholder MapTimeline Process DiagramAppendicesPrint
Page 26 of 29
PEvidence in Practice
Case Studies
View AlphabeticallyView GeographicallyView by Discipline
Full ReportSummary + Findings
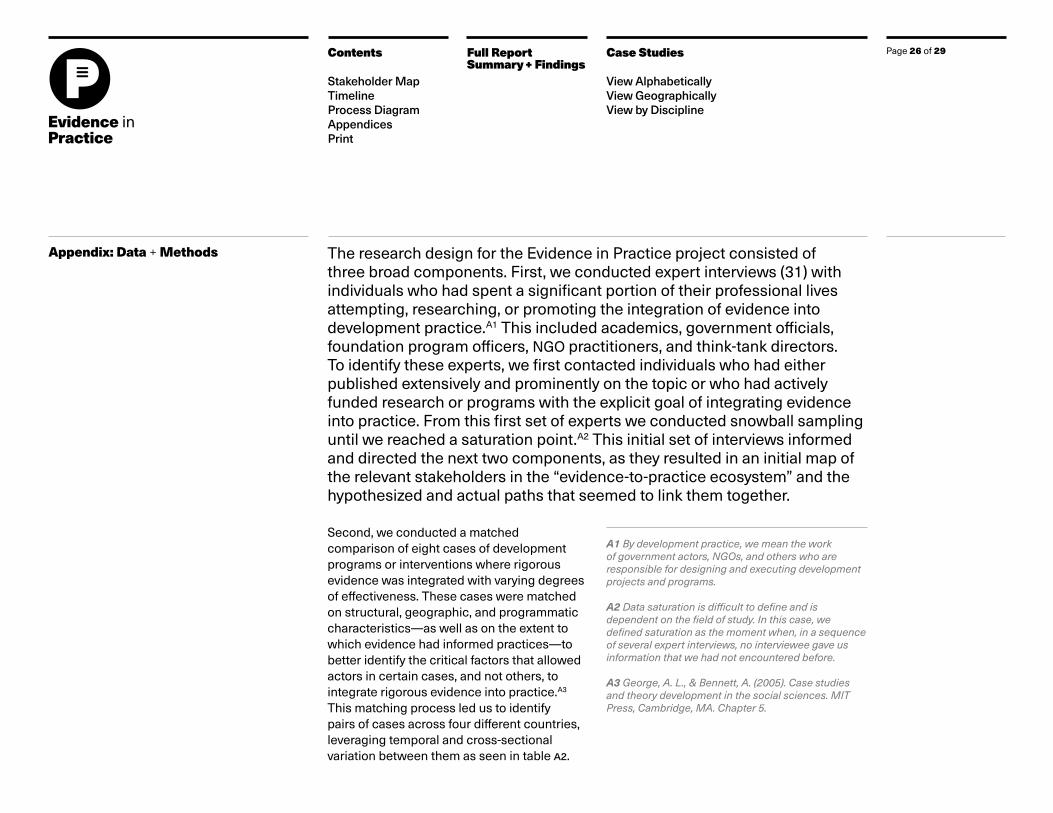
Appendix: Data + Methods The research design for the Evidence in Practice project consisted of three broad components. First, we conducted expert interviews (31) with individuals who had spent a significant portion of their professional lives attempting, researching, or promoting the integration of evidence into development practice.A1 This included academics, government officials, foundation program officers, NGO practitioners, and think-tank directors. To identify these experts, we first contacted individuals who had either published extensively and prominently on the topic or who had actively funded research or programs with the explicit goal of integrating evidence into practice. From this first set of experts we conducted snowball sampling until we reached a saturation point.A2 This initial set of interviews informed and directed the next two components, as they resulted in an initial map of the relevant stakeholders in the “evidence-to-practice ecosystem” and the hypothesized and actual paths that seemed to link them together.
Second, we conducted a matched comparison of eight cases of development programs or interventions where rigorous evidence was integrated with varying degrees of effectiveness. These cases were matched on structural, geographic, and programmatic characteristics—as well as on the extent to which evidence had informed practices—to better identify the critical factors that allowed actors in certain cases, and not others, to integrate rigorous evidence into practice.A3
This matching process led us to identify pairs of cases across four different countries, leveraging temporal and cross-sectional variation between them as seen in table a2.
A1 By development practice, we mean the work of government actors, NGOs, and others who are responsible for designing and executing development projects and programs.
A2 Data saturation is difficult to define and is dependent on the field of study. In this case, we defined saturation as the moment when, in a sequence of several expert interviews, no interviewee gave us information that we had not encountered before.
A3 George, A. L., & Bennett, A. (2005). Case studiesand theory development in the social sciences. MITPress, Cambridge, MA. Chapter 5.
Page 27 of 29Contents
Stakeholder MapTimeline Process DiagramAppendicesPrint
PEvidence in Practice
Case Studies
View AlphabeticallyView GeographicallyView by Discipline
Full ReportSummary + Findings
For each case, we first identified, through existing literature and interviews with subject experts, a series of key informants who had detailed knowledge of the case’s history and protagonists. These initial interviews with case experts led to the creation of a detailed actor/stakeholder map for each case, where we identified the key stakeholder groups that either participated in or were affected by the program, as well as the specific individuals who played an active role in the program’s evolution.A4 These stakeholder maps were validated with several informants for each of the cases. We then conducted interviews with each of the key individuals across stakeholder groups. Interviewees were asked to relate chronologies of objective events, behaviors, choices at critical junctures, and facts of the processes described.A5 In every instance, the goal was to identify the individuals responsible for the particular evolution of a case, as well as the specific
tactics they employed throughout the process, to better understand the rationale behind their decisions as well as the factors that led them to succeed or fail. In total, we conducted 161 interviews across the eight cases. Interviews were complemented with a wealth of archival information including media articles, private documents (donor reports, internal presentations and communications, etc.), and public documents (announcements, academic articles, editorial pieces). These data were used to trace the chronological list of events for the overall development of each case. Each storyline was developed in an extensive document that established the causal links described by the subjects and ensuring a balanced consideration of different stakeholders.A6
The third component, conducted in parallel to the eight case studies, consisted of interviews with prototypical representatives of each of
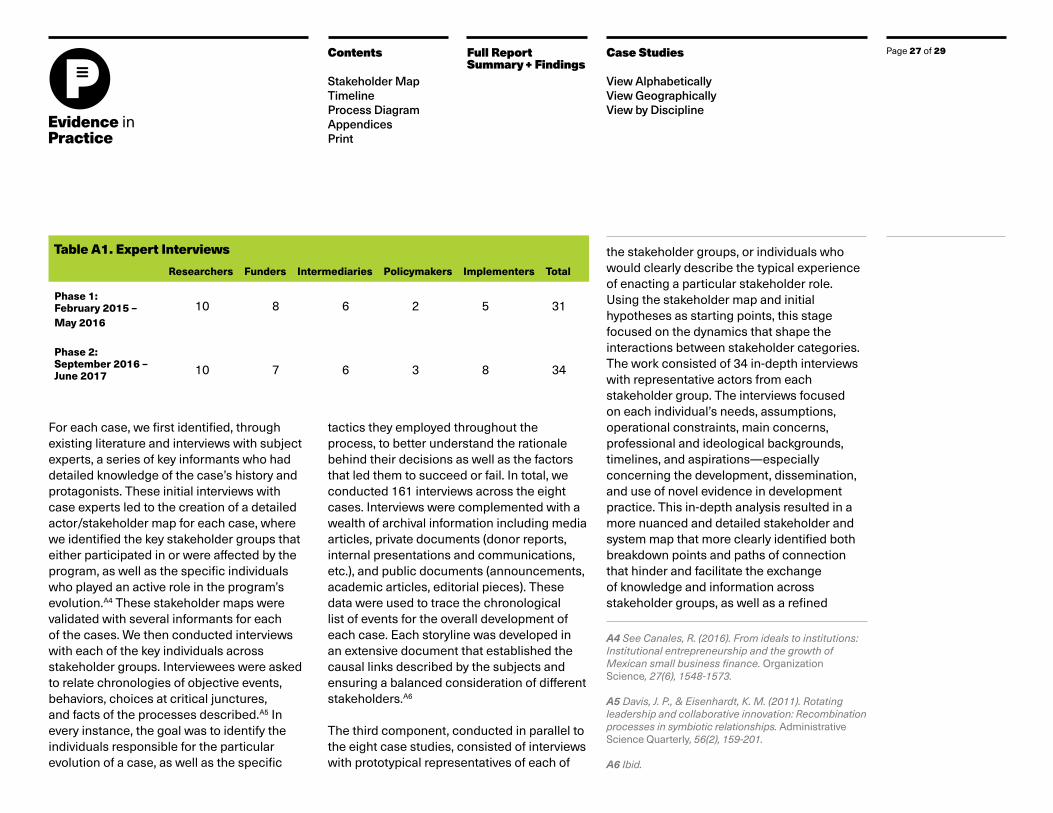
the stakeholder groups, or individuals who would clearly describe the typical experience of enacting a particular stakeholder role. Using the stakeholder map and initial hypotheses as starting points, this stage focused on the dynamics that shape the interactions between stakeholder categories. The work consisted of 34 in-depth interviews with representative actors from each stakeholder group. The interviews focused on each individual’s needs, assumptions, operational constraints, main concerns, professional and ideological backgrounds, timelines, and aspirations—especially concerning the development, dissemination, and use of novel evidence in development practice. This in-depth analysis resulted in a more nuanced and detailed stakeholder and system map that more clearly identified both breakdown points and paths of connection that hinder and facilitate the exchange of knowledge and information across stakeholder groups, as well as a refined
Phase 1:February 2015 – May 2016
Phase 2:September 2016 – June 2017
Table A1. Expert InterviewsResearchers Funders Intermediaries Policymakers Implementers Total
10 8 6 2 5 31
10 7 6 3 8 34
A4 See Canales, R. (2016). From ideals to institutions: Institutional entrepreneurship and the growth of Mexican small business finance. Organization Science, 27(6), 1548-1573.
A5 Davis, J. P., & Eisenhardt, K. M. (2011). Rotating leadership and collaborative innovation: Recombination processes in symbiotic relationships. Administrative Science Quarterly, 56(2), 159-201.
A6 Ibid.
Page 28 of 29Contents
Stakeholder MapTimeline Process DiagramAppendicesPrint
PEvidence in Practice
Case Studies
View AlphabeticallyView GeographicallyView by Discipline
Full ReportSummary + Findings
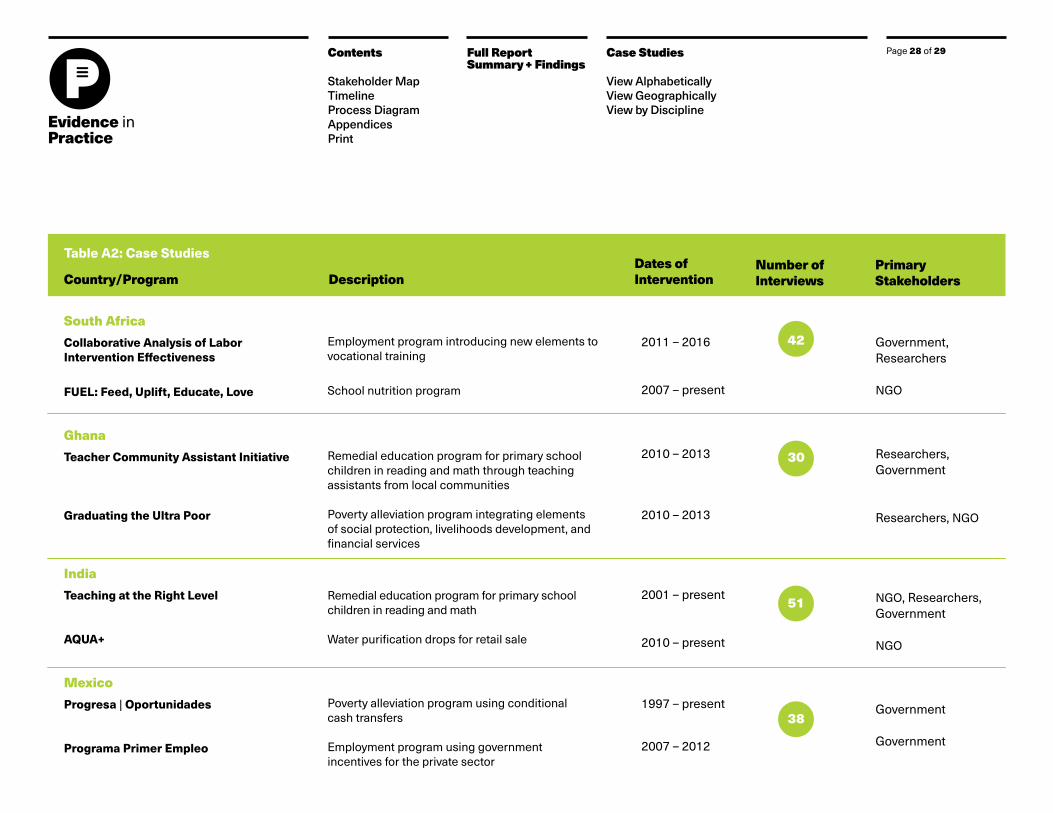
Table A2: Case Studies
Employment program introducing new elements to vocational training
School nutrition program
Remedial education program for primary school children in reading and math through teaching assistants from local communities
Poverty alleviation program integrating elements of social protection, livelihoods development, and financial services
Remedial education program for primary school children in reading and math
Water purification drops for retail sale
Poverty alleviation program using conditional cash transfers
Employment program using government incentives for the private sector
Government, Researchers
NGO
Researchers, Government
Researchers, NGO
NGO, Researchers, Government
NGO
Government
Government
South AfricaCollaborative Analysis of Labor Intervention Effectiveness
FUEL: Feed, Uplift, Educate, Love
GhanaTeacher Community Assistant Initiative
Graduating the Ultra Poor
IndiaTeaching at the Right Level
AQUA+
MexicoProgresa | Oportunidades
Programa Primer Empleo
2011 – 2016
2007 – present
2010 – 2013
2010 – 2013
2001 – present
2010 – present
1997 – present
2007 – 2012
Country/Program DescriptionDates of Intervention
Number of Interviews
Primary Stakeholders
42
30
51
38
Page 29 of 29Contents
Stakeholder MapTimeline Process DiagramAppendicesPrint
PEvidence in Practice
Case Studies
View AlphabeticallyView GeographicallyView by Discipline
Full ReportSummary + Findings
set of hypotheses about the breakdown of communication and about possible interventions to solve it.
Across the three components, we conducted a total of 226 interviews. All interviews were in-depth and semi-structured, with an average length of around 90 minutes (minimum of 60, maximum of over 120). Around two-thirds of them were done in person and the rest were conducted remotely. All interviews were recorded and transcribed verbatim.
Data analysis was conducted in several stages. Each of the 226 interview transcripts was coded extensively to identify first-order concepts related to the integration of evidence into development practice. First-order concepts include “concerns about reputation” or “short-term decision-making”. This required multiple readings of interview transcripts, field notes, and archival data to associate nearly every passage of text with one or more codes. These codes were then grouped into second-order themes,A7 always contrasting them with current research on the integration of evidence into practice. Second order themes included “incentive structures” or “timing misalignments”, each of which was developed extensively in a memo that explored the characteristics, tensions, and contradictions of each theme. In stage
three, we mapped the codes to each of our case narratives to detect patterns of activities, constraints, and decisions that defined the evolution of each case at critical junctures. This allowed us to identify similarities and discrepancies across cases, as well as to create comparable counterfactuals that could account for differing outcomes.A8
In stage four, we created process maps, concept maps, data tables, and detailed case synopses that linked key challenges, events, and decisions to the specific alternative tactics employed by actors and then to their subsequent consequences for the development program or intervention in question. This final set of analyses revealed a somewhat consistent set of factors faced at comparable stages by actors across our different settings. Throughout our analysis, we iterated between emerging insights, existing theory, and matched comparisons across cases to identify the mechanisms that operated at critical junctures.
It is worth mentioning that, at two moments of the project (the first after our first set of expert interviews was over and the second after the completion of our initial case narratives) we hosted a workshop with two different groups of highly experienced representatives from each of the stakeholder groups. During these
A7 Glaser BG, Strauss AL (1980) The Discovery of Grounded Theory: Strategies for Qualitative Research (Aldine Publishers, Hawthorne, NY).
A8 We ensured consistency in coding across the different cases and authors through several mechanisms, including: a) a selection of interviews was coded by two or more coders, after which they reviewed discrepancies and agreed on their resolution, b) a common project book where all the codes were collectively kept, aggregated, and analyzed, c) a weekly meeting to review coding process and to develop a joint coding standard, d) memos were developed jointly, with contribution from and verification by the different team members, among others. Access here.
workshops, we discussed our emerging findings and we gathered additional, essential insights from participants. The workshops served to validate and deepen our understanding of emerging insights.


![Right to Information- Hindi [INDIA].pdf](https://img.dokumen.tips/doc/110x75/55cf9d24550346d033ac680a/right-to-information-hindi-indiapdf.jpg)