Embed Size (px)
Citation preview
Independent Samples and Paired Samples t-testsIndependent Samples and Paired Samples t-tests
PSY440
June 24, 2008
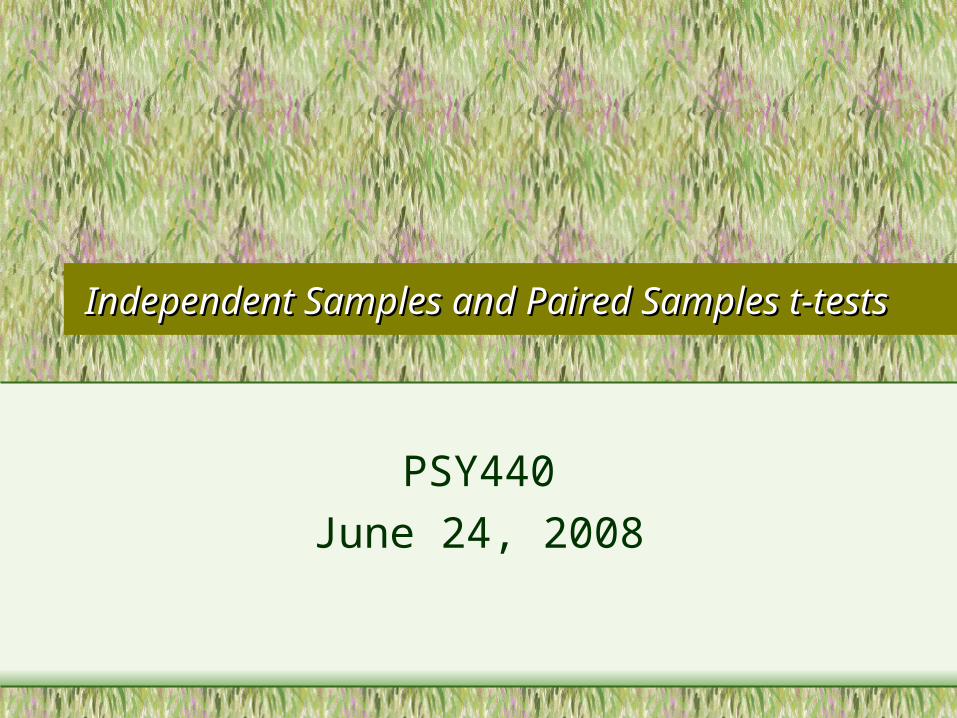
Statistical analysis follows design
• The one-sample t-test can be used when:– 1 sample
– One score per subject
– Population mean () is known
– but standard deviation () is NOT known
€
t =X − μ
X
sX
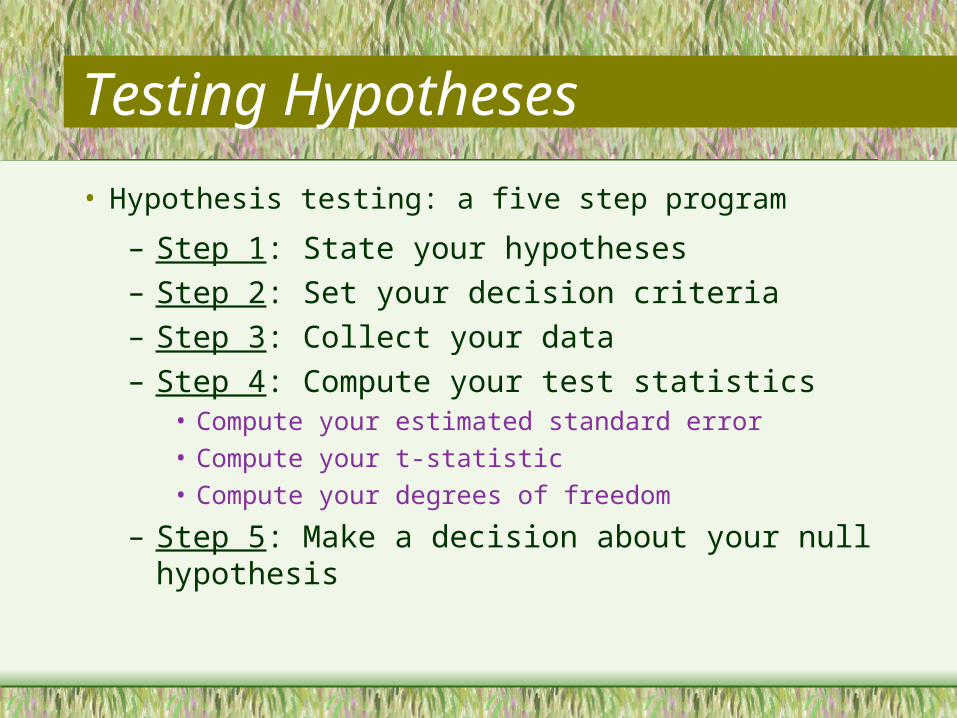
Testing Hypotheses
– Step 1: State your hypotheses
– Step 2: Set your decision criteria
– Step 3: Collect your data
– Step 4: Compute your test statistics • Compute your estimated standard error
• Compute your t-statistic
• Compute your degrees of freedom
– Step 5: Make a decision about your null hypothesis
• Hypothesis testing: a five step program
Performing your statistical test
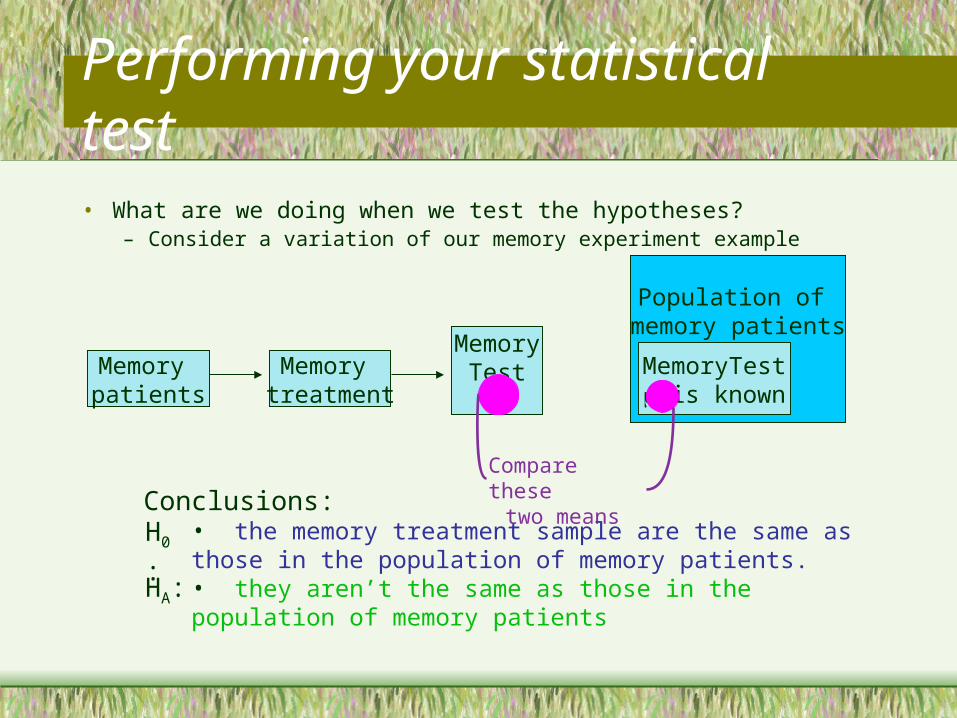
• What are we doing when we test the hypotheses?– Consider a variation of our memory experiment example
Population of memory patients
MemoryTest is known
Memory treatment
Memory patients
MemoryTest
X
Compare these two meansConclusions:
• the memory treatment sample are the same as those in the population of memory patients.• they aren’t the same as those in the population of memory patients
H0:
HA:
Performing your statistical test
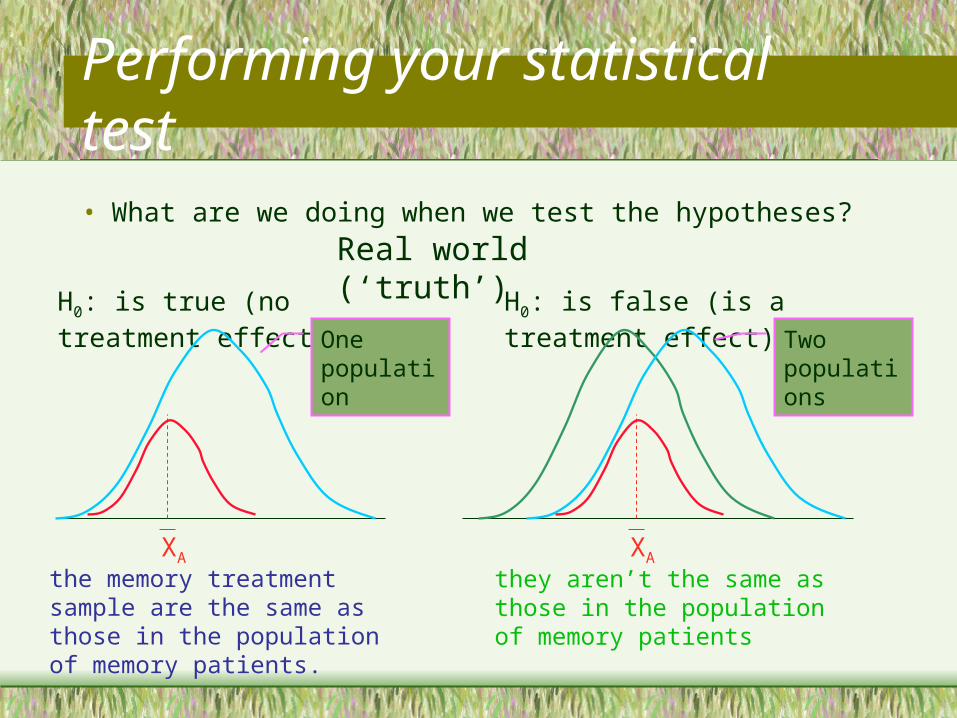
• What are we doing when we test the hypotheses?Real world (‘truth’)
H0: is false (is a treatment effect)
Two populations
XA
they aren’t the same as those in the population of memory patients
H0: is true (no treatment effect)
One population
XA
the memory treatment sample are the same as those in the population of memory patients.
Performing your statistical test
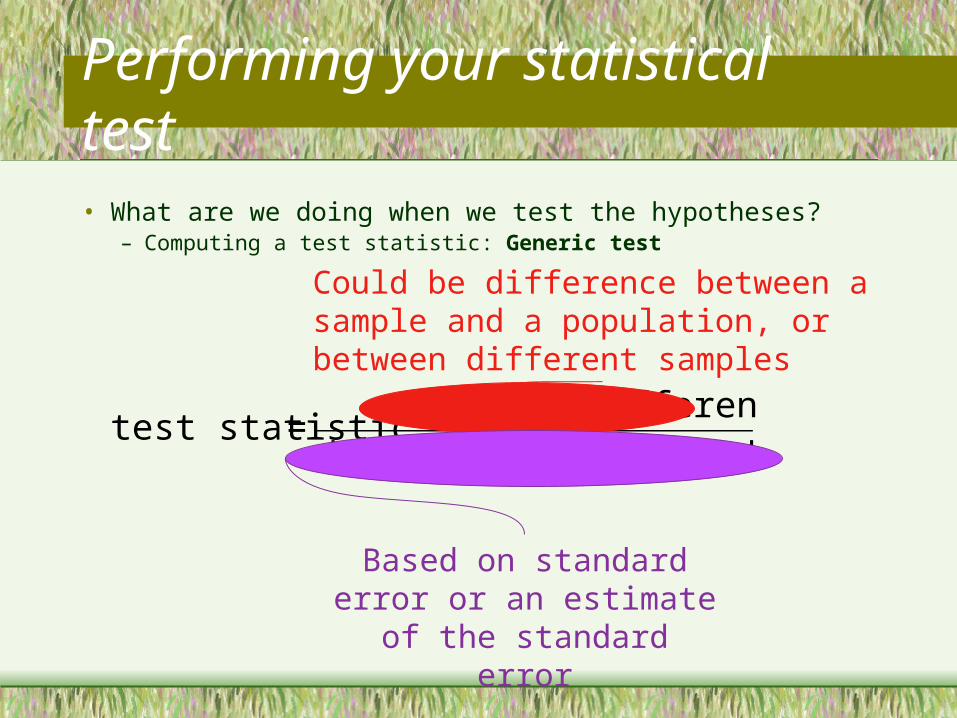
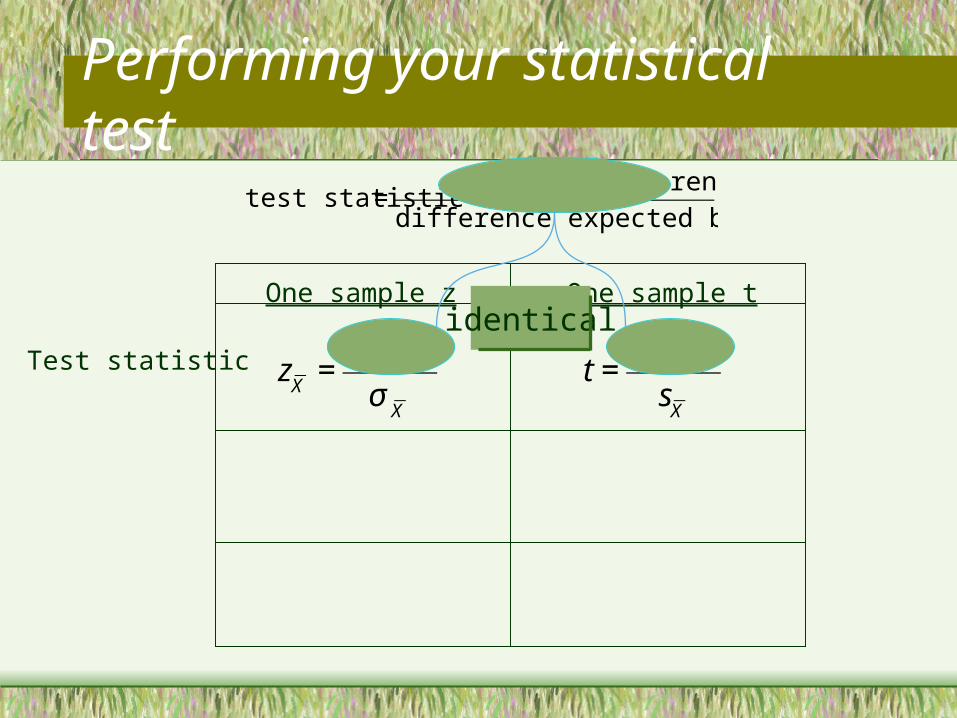
• What are we doing when we test the hypotheses?– Computing a test statistic: Generic test
€
test statistic =observed difference
difference expected by chance
Could be difference between a sample and a population, or between different samples
Based on standard error or an estimate of the standard error
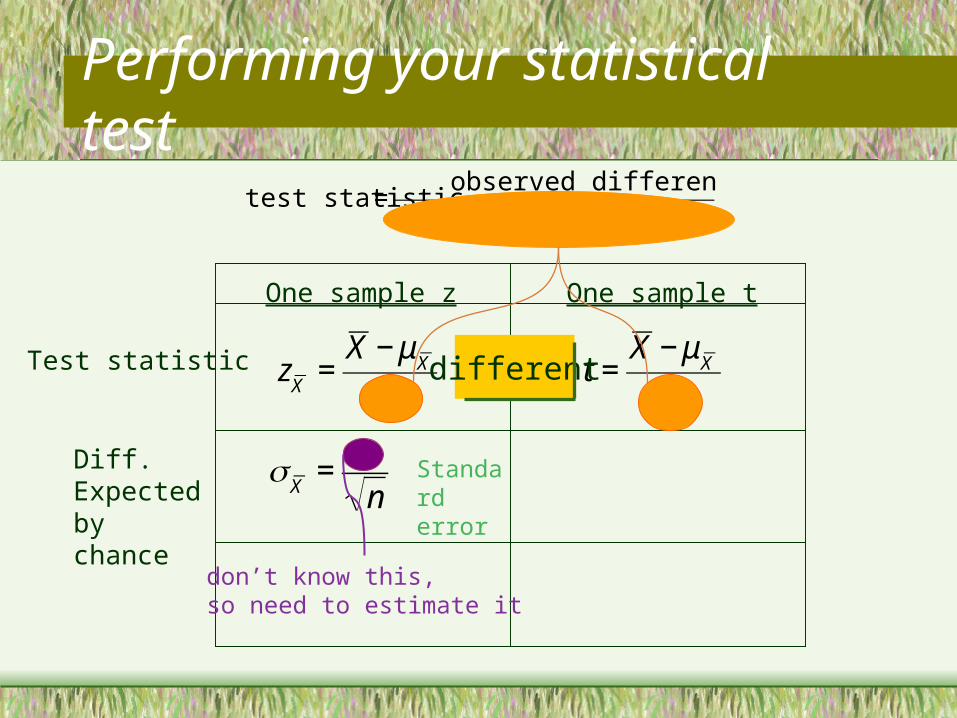
Performing your statistical test
€
test statistic =observed difference
difference expected by chance
€
t =X − μ
X
sX
€
zX
=X − μ
X
σX
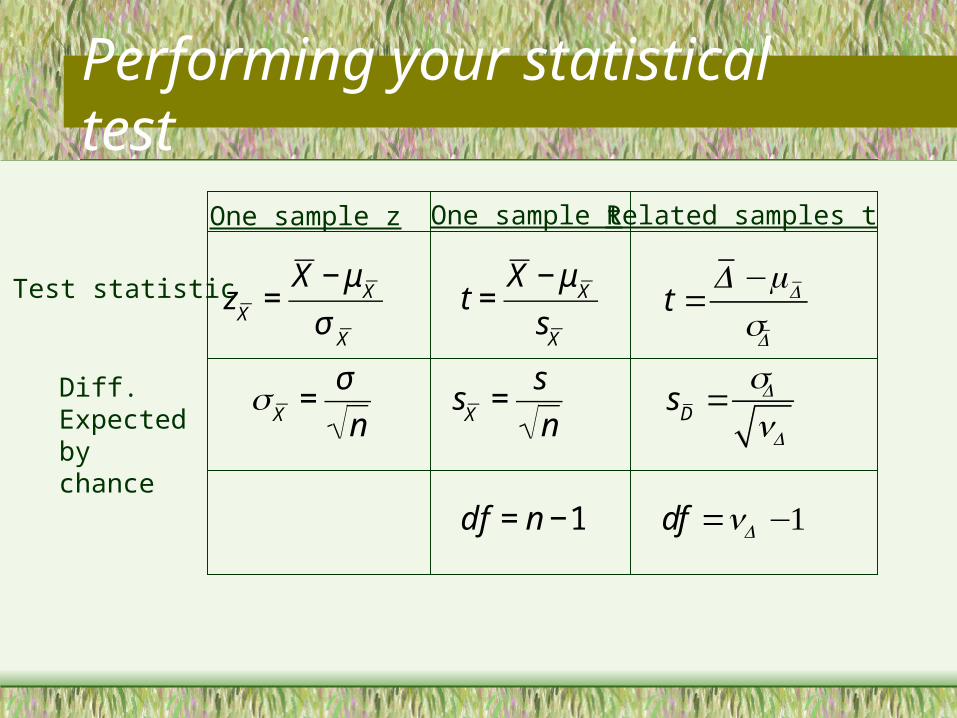
Test statistic
One sample z One sample tidentical
Performing your statistical test
€
test statistic =observed difference
difference expected by chance
€
t =X − μ
X
sX
€
zX
=X − μ
X
σX
Test statistic
Diff. Expected by chance
€
X
=σ
nStandard error
One sample z One sample t
different
don’t know this,so need to estimate it
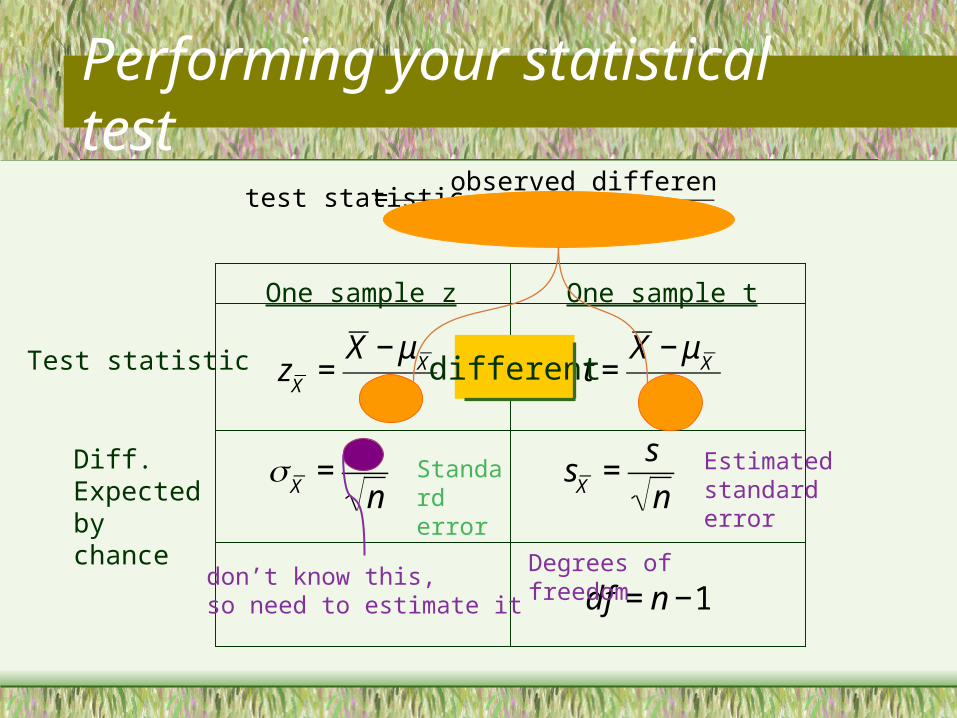
Performing your statistical test
€
test statistic =observed difference
difference expected by chance
€
t =X − μ
X
sX
€
zX
=X − μ
X
σX
€
sX
=s
n
Test statistic
Diff. Expected by chance
€
X
=σ
nStandard error
Estimated standard error
One sample z One sample t
different
don’t know this,so need to estimate it
€
df = n −1Degrees of freedom
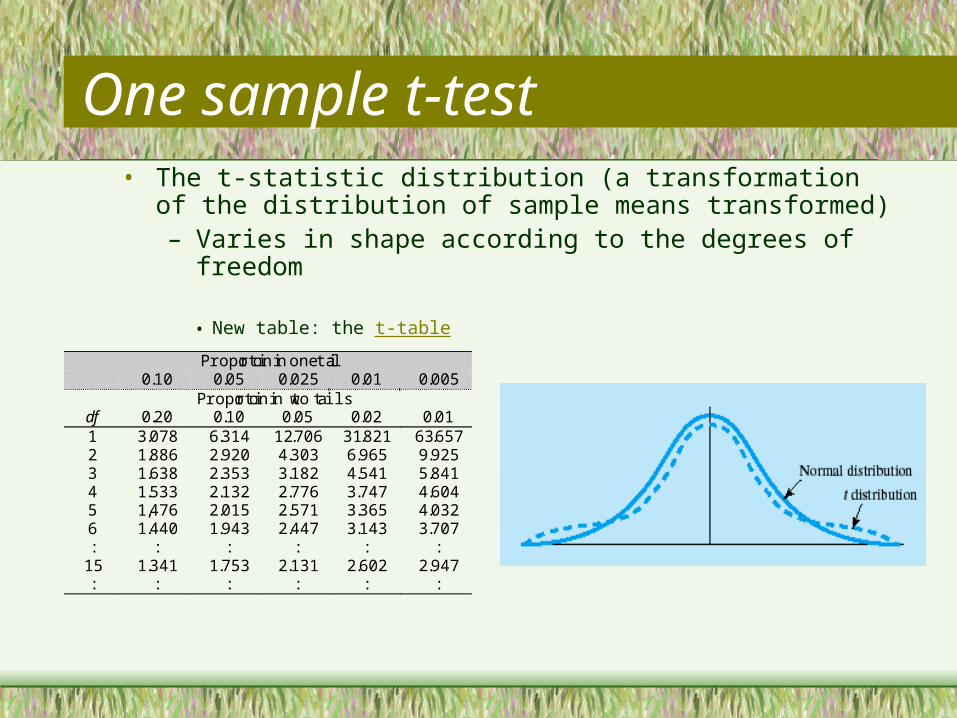
Proportion in one tail0.10 0.05 0.025 0.01 0.005
Proportion in two tailsdf 0.20 0.10 0.05 0.02 0.011 3.078 6.314 12.706 31.821 63.6572 1.886 2.920 4.303 6.965 9.9253 1.638 2.353 3.182 4.541 5.8414 1.533 2.132 2.776 3.747 4.6045 1,476 2.015 2.571 3.365 4.0326 1.440 1.943 2.447 3.143 3.707:
15:
:1.341
:
:1.753
:
:2.131
:
:2.602
:
:2.947
:
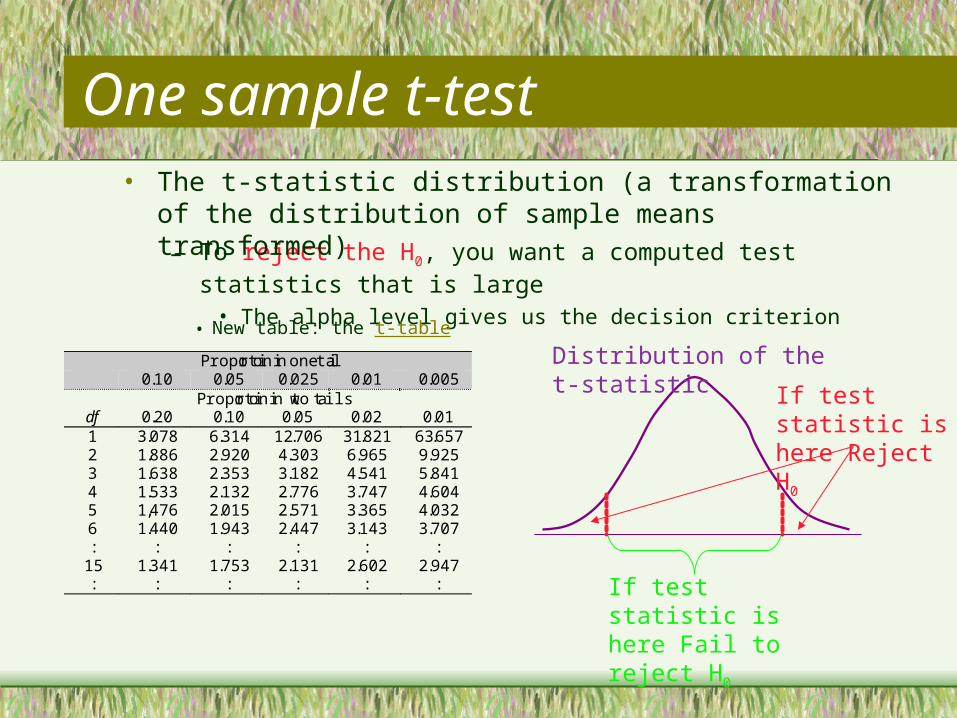
One sample t-test• The t-statistic distribution (a transformation of the distribution of
sample means transformed)– Varies in shape according to the degrees of freedom
• New table: the t-table
Proportion in one tail0.10 0.05 0.025 0.01 0.005
Proportion in two tailsdf 0.20 0.10 0.05 0.02 0.011 3.078 6.314 12.706 31.821 63.6572 1.886 2.920 4.303 6.965 9.9253 1.638 2.353 3.182 4.541 5.8414 1.533 2.132 2.776 3.747 4.6045 1,476 2.015 2.571 3.365 4.0326 1.440 1.943 2.447 3.143 3.707:
15:
:1.341
:
:1.753
:
:2.131
:
:2.602
:
:2.947
:
One sample t-test
If test statistic is here Fail to reject H0
Distribution of the t-statistic
If test statistic is here Reject H0
– To reject the H0, you want a computed test statistics that is large
• The alpha level gives us the decision criterion
• New table: the t-table
• The t-statistic distribution (a transformation of the distribution of sample means transformed)
Proportion in one tail0.10 0.05 0.025 0.01 0.005
Proportion in two tailsdf 0.20 0.10 0.05 0.02 0.011 3.078 6.314 12.706 31.821 63.6572 1.886 2.920 4.303 6.965 9.9253 1.638 2.353 3.182 4.541 5.8414 1.533 2.132 2.776 3.747 4.6045 1,476 2.015 2.571 3.365 4.0326 1.440 1.943 2.447 3.143 3.707:
15:
:1.341
:
:1.753
:
:2.131
:
:2.602
:
:2.947
:
One sample t-test
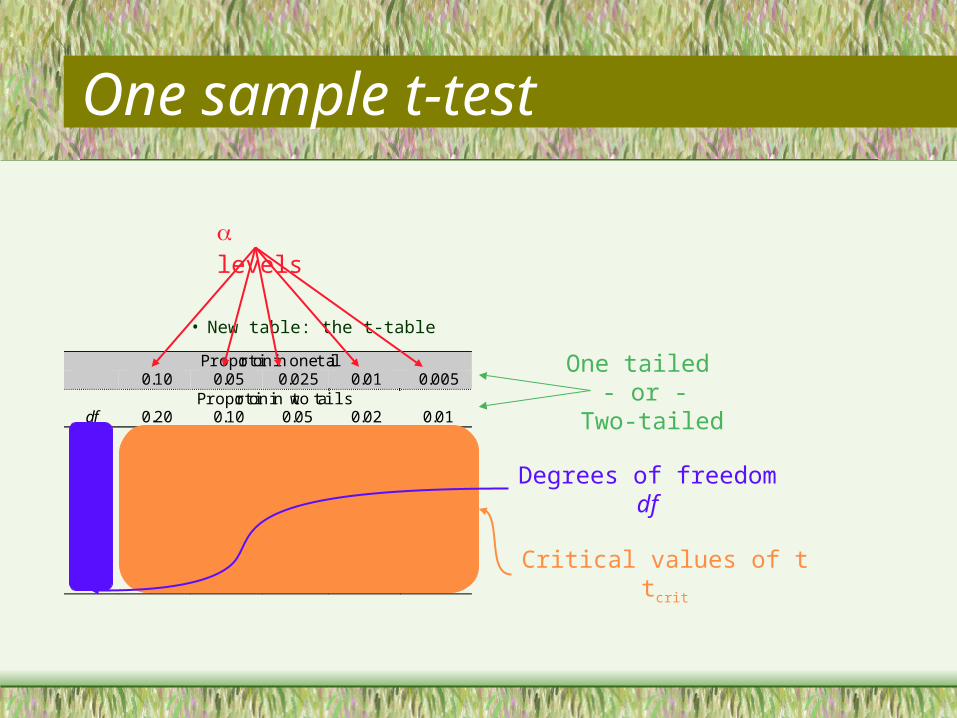
• New table: the t-tableOne tailed
- or - Two-tailed
levels
Critical values of ttcrit
Degrees of freedomdf
Proportion in one tail0.10 0.05 0.025 0.01 0.005
Proportion in two tailsdf 0.20 0.10 0.05 0.02 0.011 3.078 6.314 12.706 31.821 63.6572 1.886 2.920 4.303 6.965 9.9253 1.638 2.353 3.182 4.541 5.8414 1.533 2.132 2.776 3.747 4.6045 1,476 2.015 2.571 3.365 4.0326 1.440 1.943 2.447 3.143 3.707:
15:
:1.341
:
:1.753
:
:2.131
:
:2.602
:
:2.947
:
One sample t-test
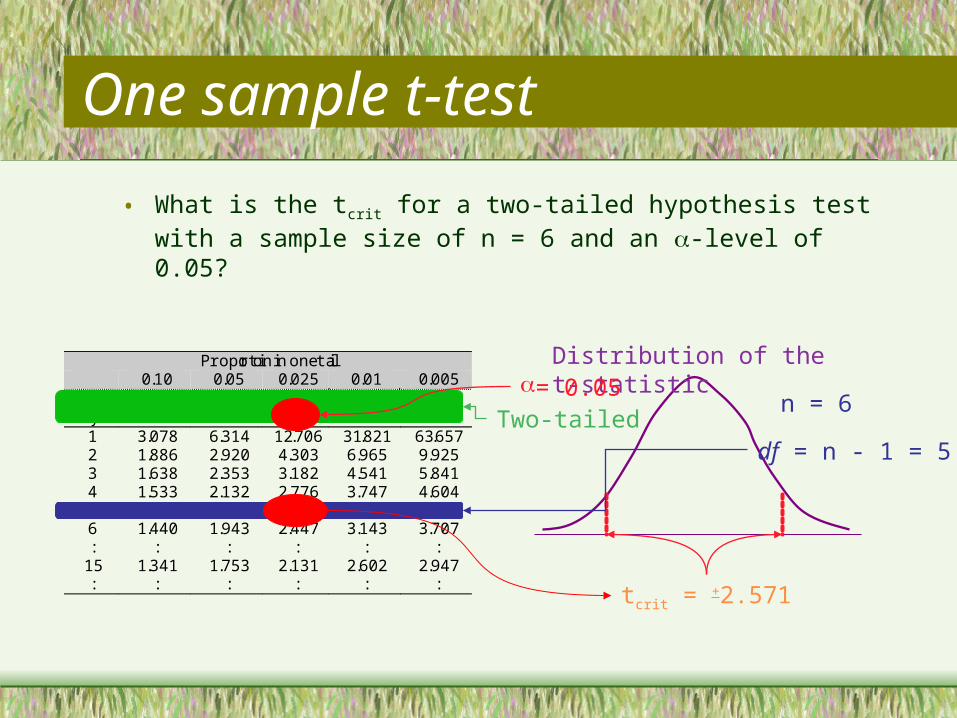
• What is the tcrit for a two-tailed hypothesis test with a sample size of n = 6 and an -level of 0.05?
Distribution of the t-statistic= 0.05Two-tailed
n = 6
df = n - 1 = 5
tcrit = +2.571
Proportion in one tail0.10 0.05 0.025 0.01 0.005
Proportion in two tailsdf 0.20 0.10 0.05 0.02 0.011 3.078 6.314 12.706 31.821 63.6572 1.886 2.920 4.303 6.965 9.9253 1.638 2.353 3.182 4.541 5.8414 1.533 2.132 2.776 3.747 4.6045 1,476 2.015 2.571 3.365 4.0326 1.440 1.943 2.447 3.143 3.707:
15:
:1.341
:
:1.753
:
:2.131
:
:2.602
:
:2.947
:
One sample t-test
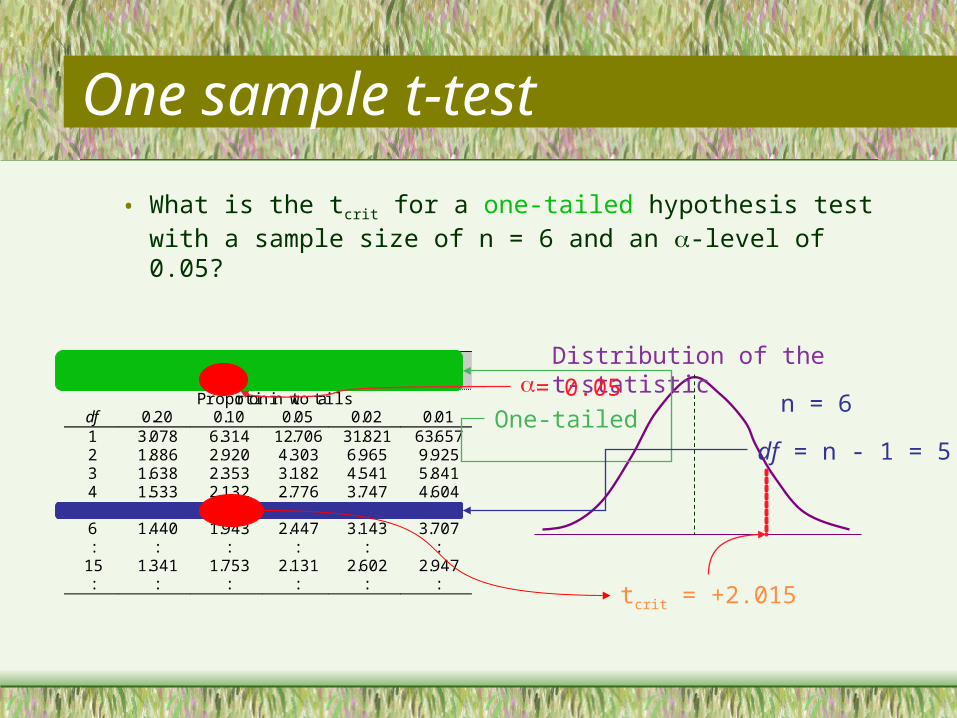
Distribution of the t-statistic= 0.05One-tailed
n = 6
df = n - 1 = 5
tcrit = +2.015
• What is the tcrit for a one-tailed hypothesis test with a sample size of n = 6 and an -level of 0.05?
One sample t-test
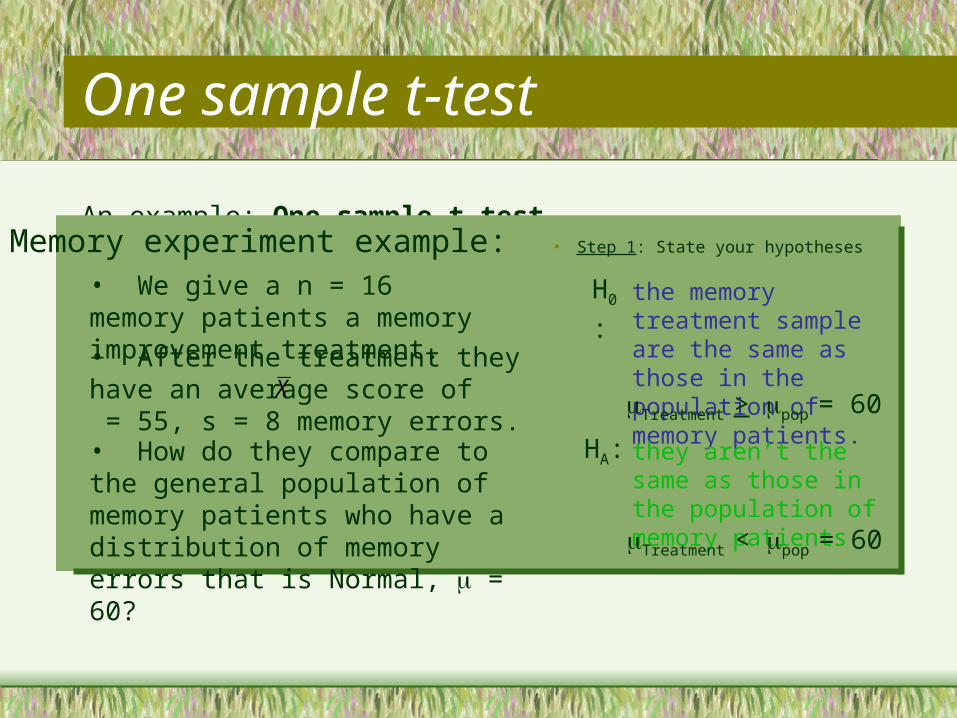
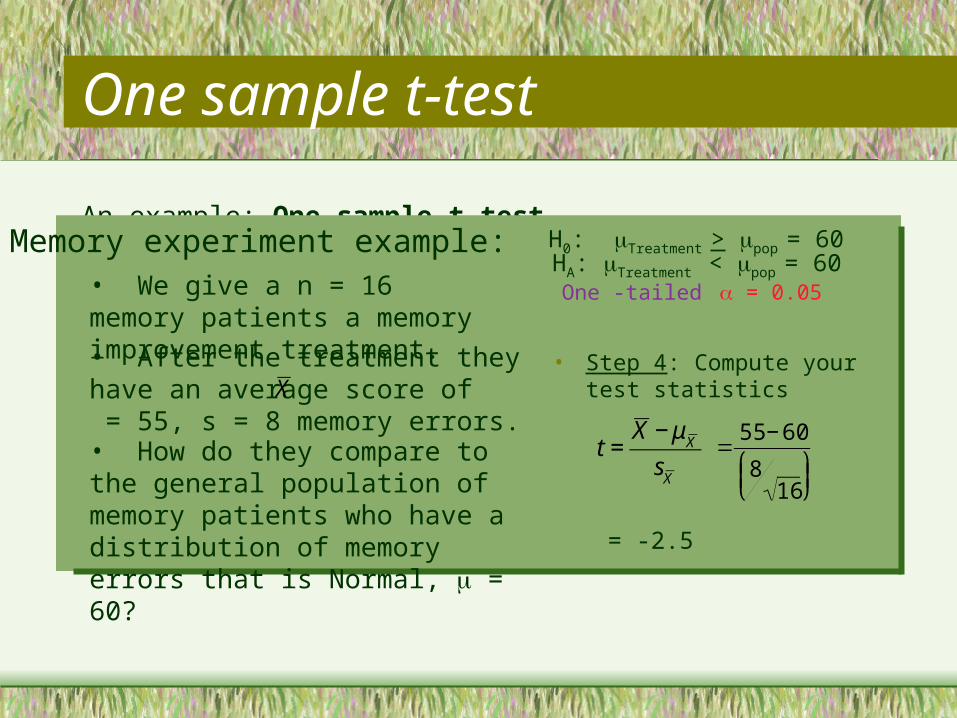
An example: One sample t-testMemory experiment example:
• We give a n = 16 memory patients a memory improvement treatment.
• How do they compare to the general population of memory patients who have a distribution of memory errors that is Normal, = 60?
• After the treatment they have an average score of = 55, s = 8 memory errors.
€
X
• Step 1: State your hypotheses
H0: the memory treatment sample are the same as those in the population of memory patients.
HA: they aren’t the same as those in the population of memory patients
Treatment > pop = 60
Treatment < pop = 60
One sample t-test
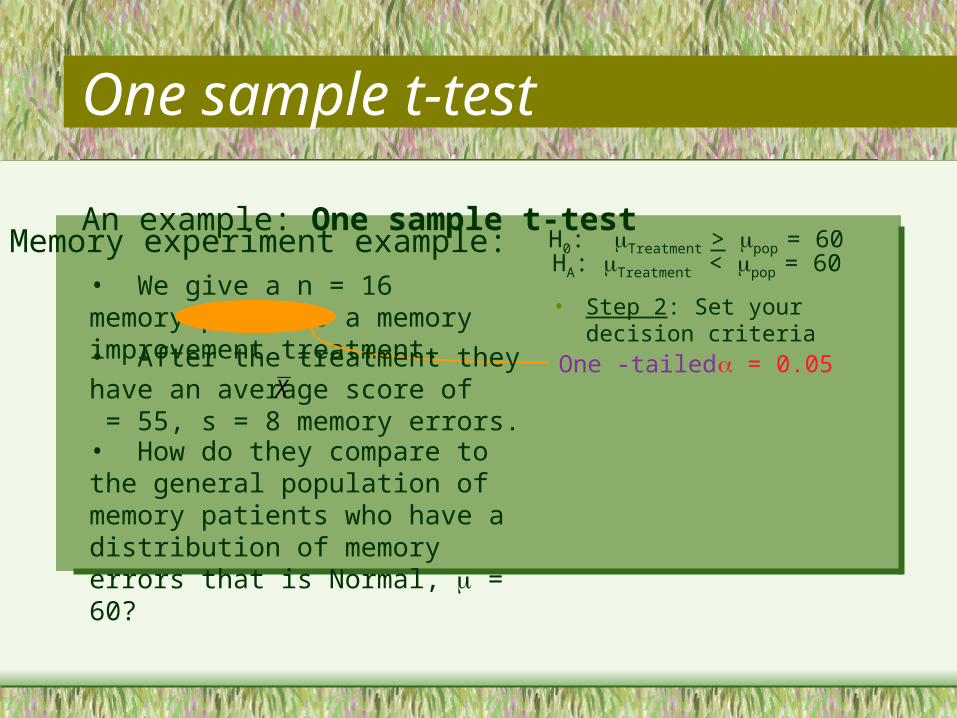
Memory experiment example:• We give a n = 16 memory patients a memory improvement treatment. • Step 2: Set your decision
criteria
H0: Treatment > pop = 60 HA: Treatment < pop = 60
= 0.05One -tailed
• How do they compare to the general population of memory patients who have a distribution of memory errors that is Normal, = 60?
• After the treatment they have an average score of = 55, s = 8 memory errors.
€
X
An example: One sample t-test
One sample t-test
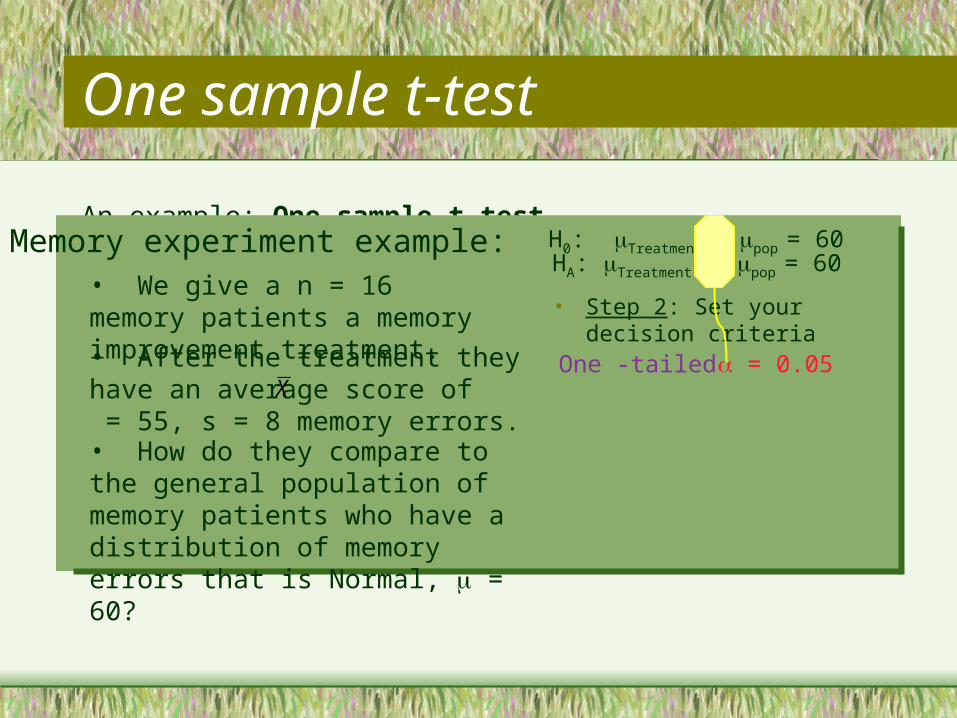
An example: One sample t-testMemory experiment example:
• We give a n = 16 memory patients a memory improvement treatment. • Step 2: Set your decision
criteria
H0: Treatment > pop = 60 HA: Treatment < pop = 60
= 0.05One -tailed
• How do they compare to the general population of memory patients who have a distribution of memory errors that is Normal, = 60?
• After the treatment they have an average score of = 55, s = 8 memory errors.
€
X
One sample t-test
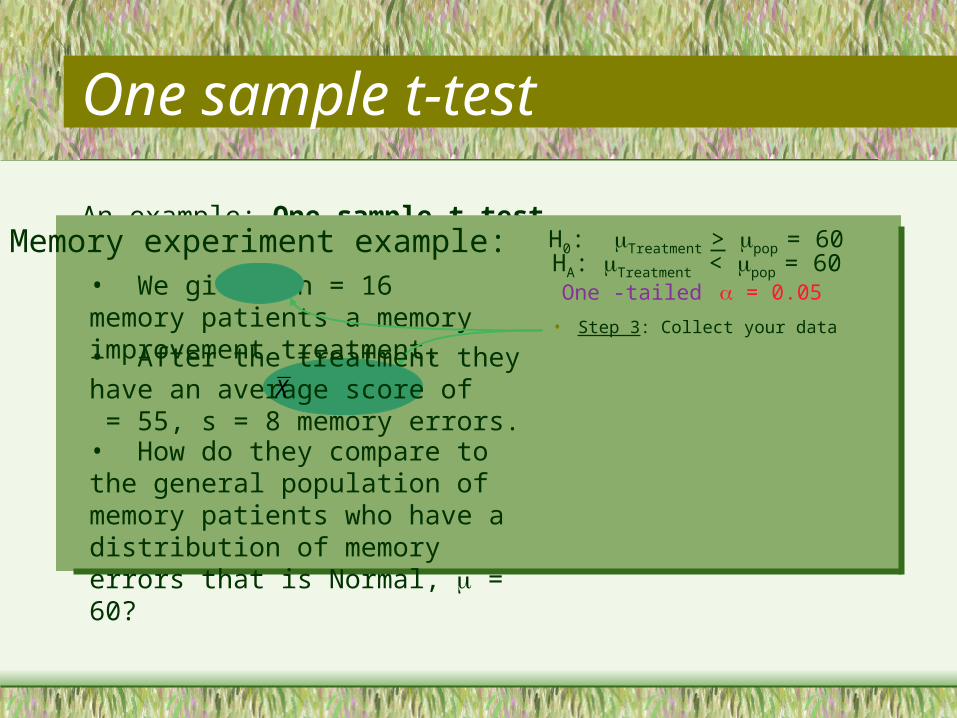
An example: One sample t-testMemory experiment example:
• We give a n = 16 memory patients a memory improvement treatment.
= 0.05One -tailed
• Step 3: Collect your data
H0: Treatment > pop = 60 HA: Treatment < pop = 60
• How do they compare to the general population of memory patients who have a distribution of memory errors that is Normal, = 60?
• After the treatment they have an average score of = 55, s = 8 memory errors.
€
X
One sample t-test
An example: One sample t-testMemory experiment example:
• We give a n = 16 memory patients a memory improvement treatment.
= 0.05One -tailed
• Step 4: Compute your test statistics
€
t =X − μ
X
sX
€
=55 − 60
816
⎛ ⎝ ⎜
⎞ ⎠ ⎟
= -2.5
H0: Treatment > pop = 60 HA: Treatment < pop = 60
• How do they compare to the general population of memory patients who have a distribution of memory errors that is Normal, = 60?
• After the treatment they have an average score of = 55, s = 8 memory errors.
€
X
One sample t-test
An example: One sample t-testMemory experiment example:
• We give a n = 16 memory patients a memory improvement treatment.
= 0.05One -tailed
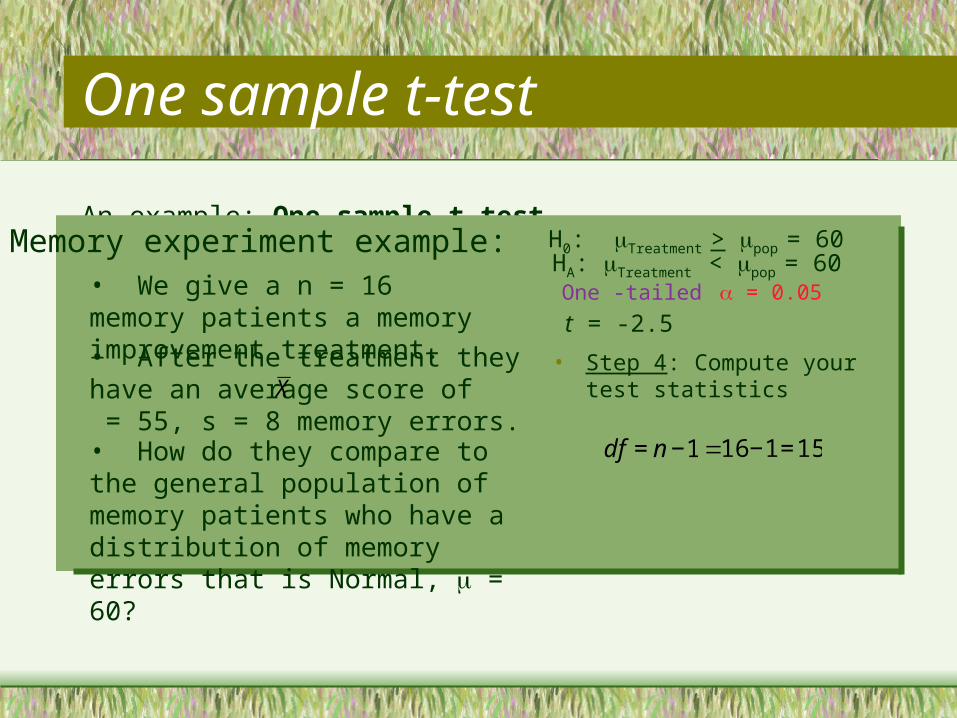
• Step 4: Compute your test statistics
€
df = n −1
t = -2.5
H0: Treatment > pop = 60 HA: Treatment < pop = 60
• How do they compare to the general population of memory patients who have a distribution of memory errors that is Normal, = 60?
• After the treatment they have an average score of = 55, s = 8 memory errors.
€
X
€
=16 −1=15
One sample t-test
An example: One sample t-testMemory experiment example:
• We give a n = 16 memory patients a memory improvement treatment.
= 0.05One -tailed
€
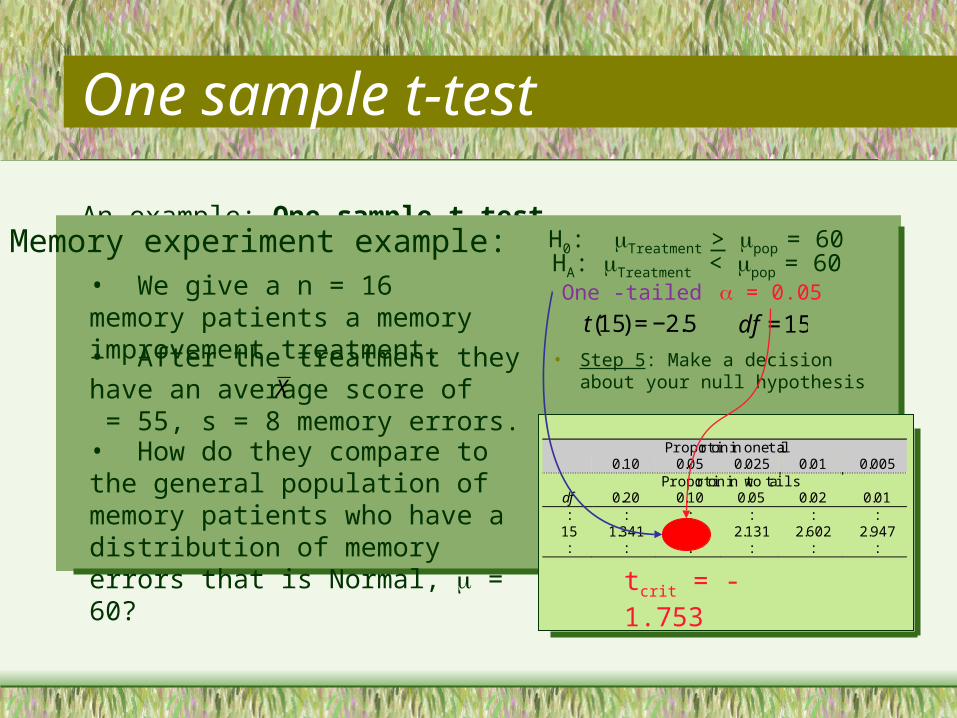
t(15) = −2.5
• Step 5: Make a decision about your null hypothesis
H0: Treatment > pop = 60 HA: Treatment < pop = 60
• How do they compare to the general population of memory patients who have a distribution of memory errors that is Normal, = 60?
• After the treatment they have an average score of = 55, s = 8 memory errors.
€
X
€
df =15
Proportion in one tail0.10 0.05 0.025 0.01 0.005
Proportion in two tailsdf 0.20 0.10 0.05 0.02 0.01:
15:
:1.341
:
:1.753
:
:2.131
:
:2.602
:
:2.947
:
tcrit = -1.753
One sample t-test
An example: One sample t-testMemory experiment example:
• We give a n = 16 memory patients a memory improvement treatment.
= 0.05One -tailed
€
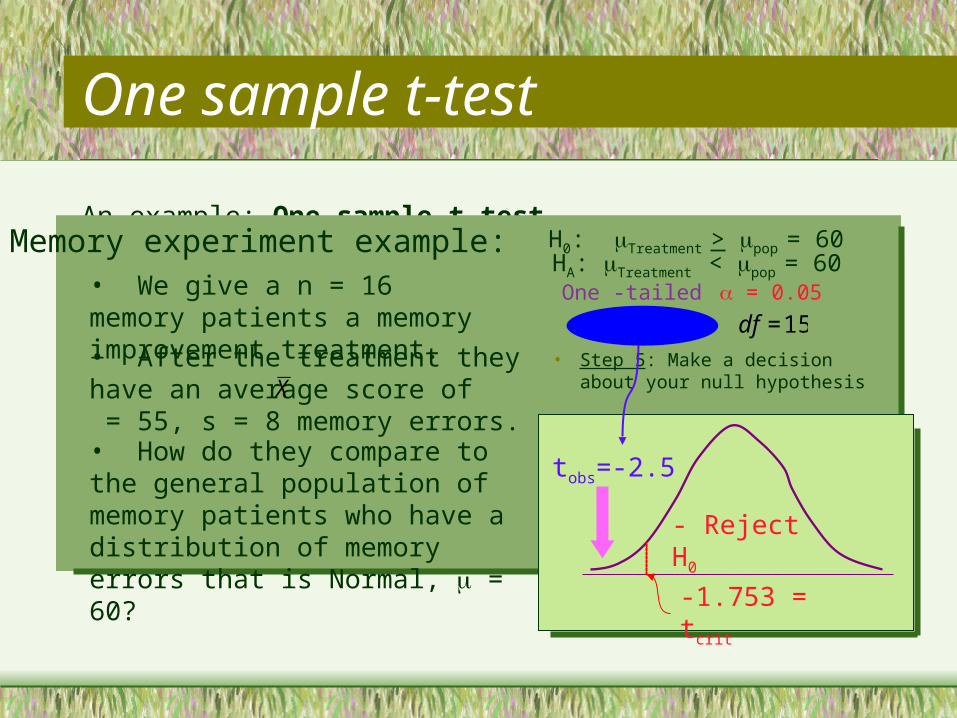
t(15) = −2.5
• Step 5: Make a decision about your null hypothesis
H0: Treatment > pop = 60 HA: Treatment < pop = 60
• How do they compare to the general population of memory patients who have a distribution of memory errors that is Normal, = 60?
• After the treatment they have an average score of = 55, s = 8 memory errors.
€
X
€
df =15
-1.753 = tcrit
tobs=-2.5
- Reject H0
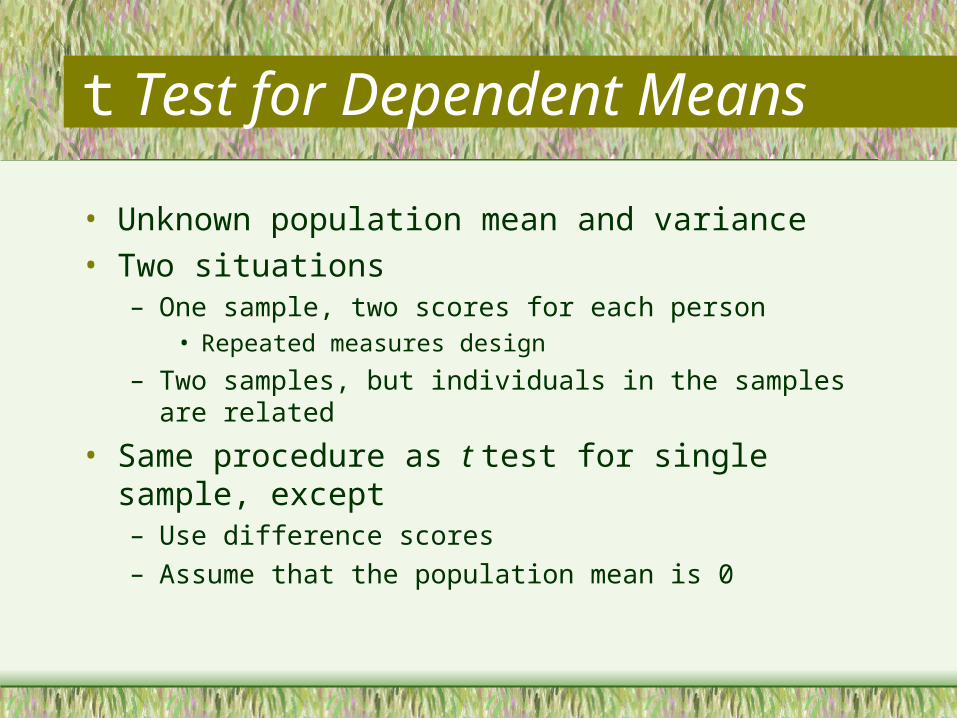
t Test for Dependent Means
• Unknown population mean and variance
• Two situations– One sample, two scores for each person
• Repeated measures design
– Two samples, but individuals in the samples are related
• Same procedure as t test for single sample, except– Use difference scores
– Assume that the population mean is 0
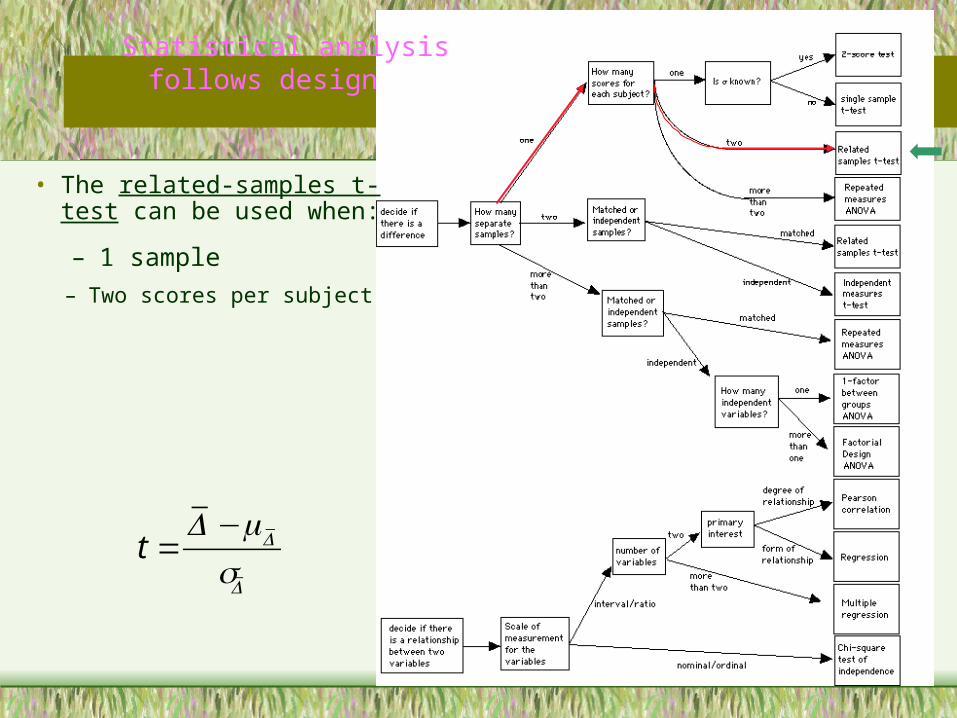
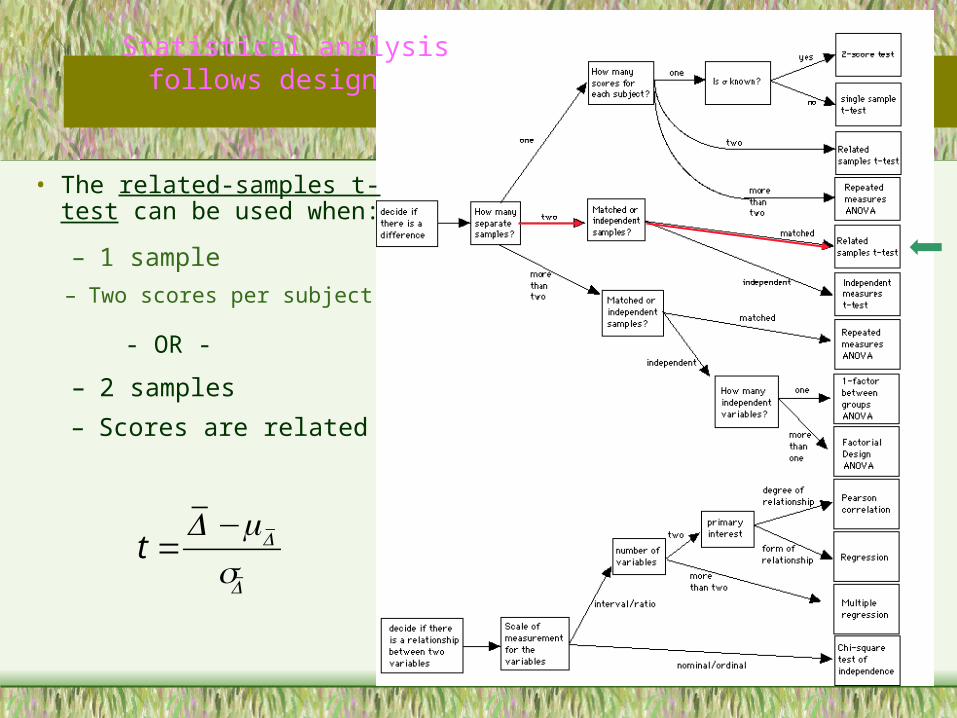
Statistical analysis follows design
• The related-samples t-test can be used when:– 1 sample
t =D−D
sD
– Two scores per subject

Statistical analysis follows design
• The related-samples t-test can be used when:– 1 sample
– Two scores per subject
t =D−D
sD
– 2 samples
– Scores are related
- OR -
Performing your statistical test
€
test statistic =observed difference
difference expected by chance
€
sD
=sD
nD
Diff. Expected by chance
Estimated standard error of the differences
€
df = nD −1
Test statistic
€
t =D − μ
D
sD
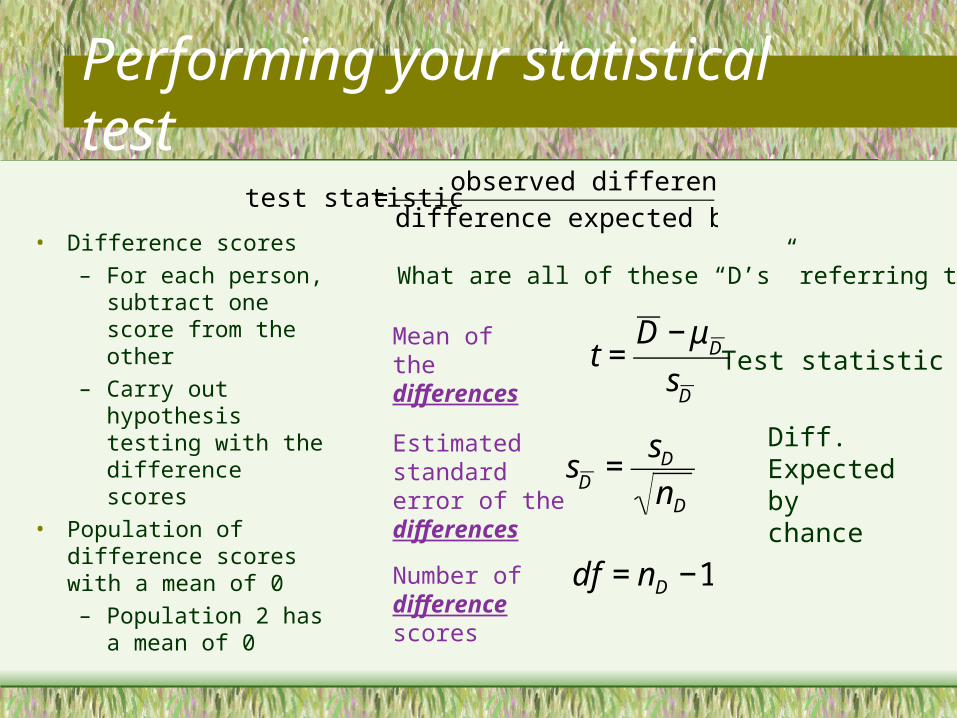
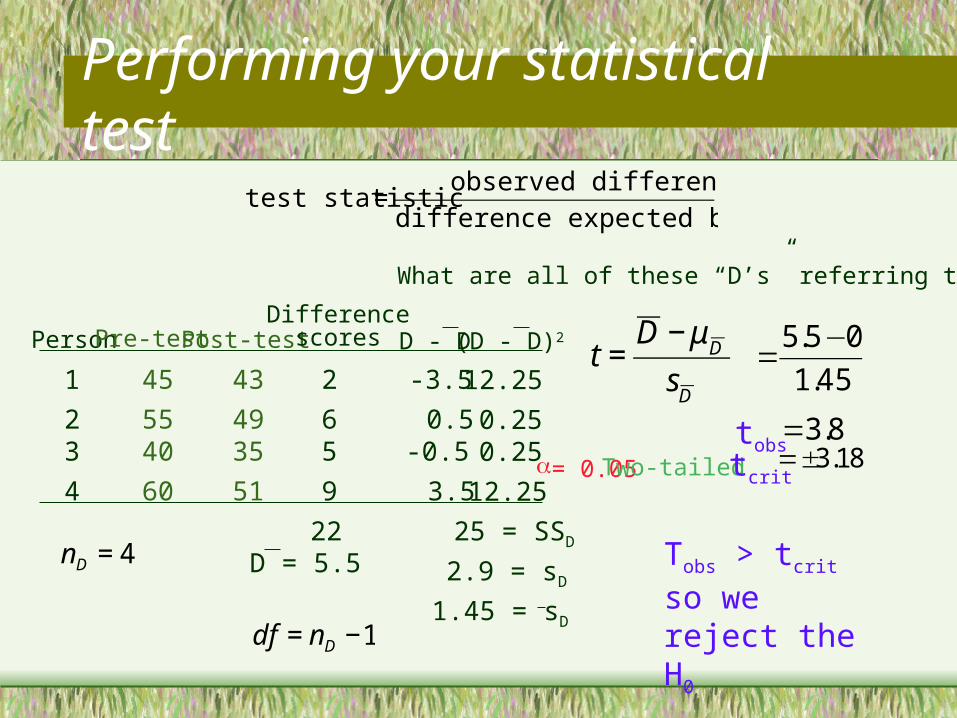
What are all of these “D’s” referring to?
Mean of the differences
Number of difference scores
• Difference scores
– For each person, subtract one score from the other
– Carry out hypothesis testing with the difference scores
• Population of difference scores with a mean of 0
– Population 2 has a mean of 0
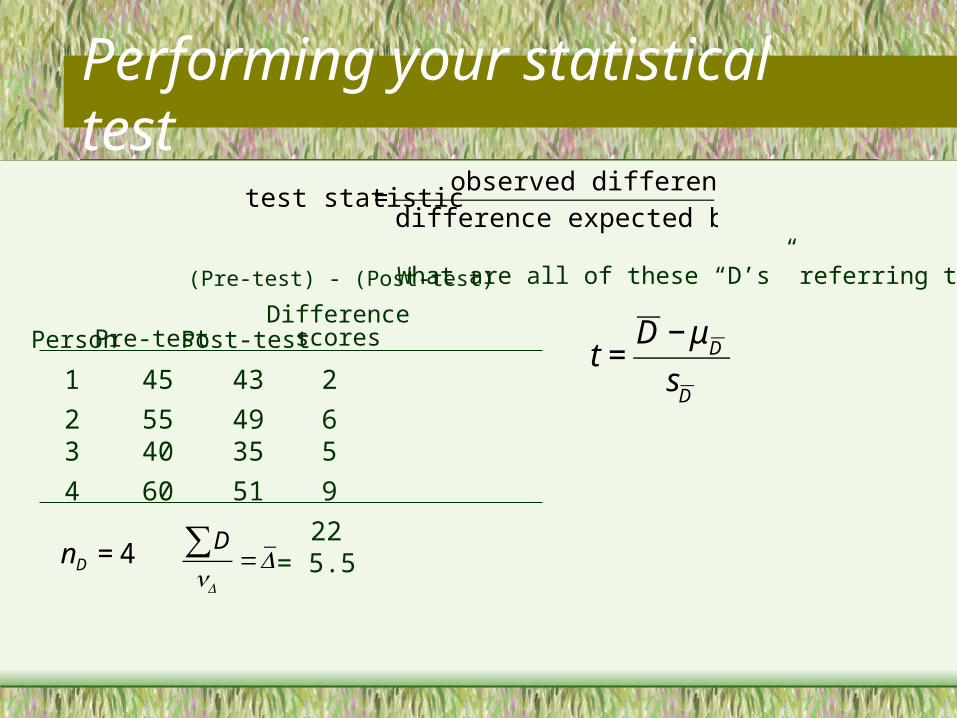
Performing your statistical test
€
test statistic =observed difference
difference expected by chance
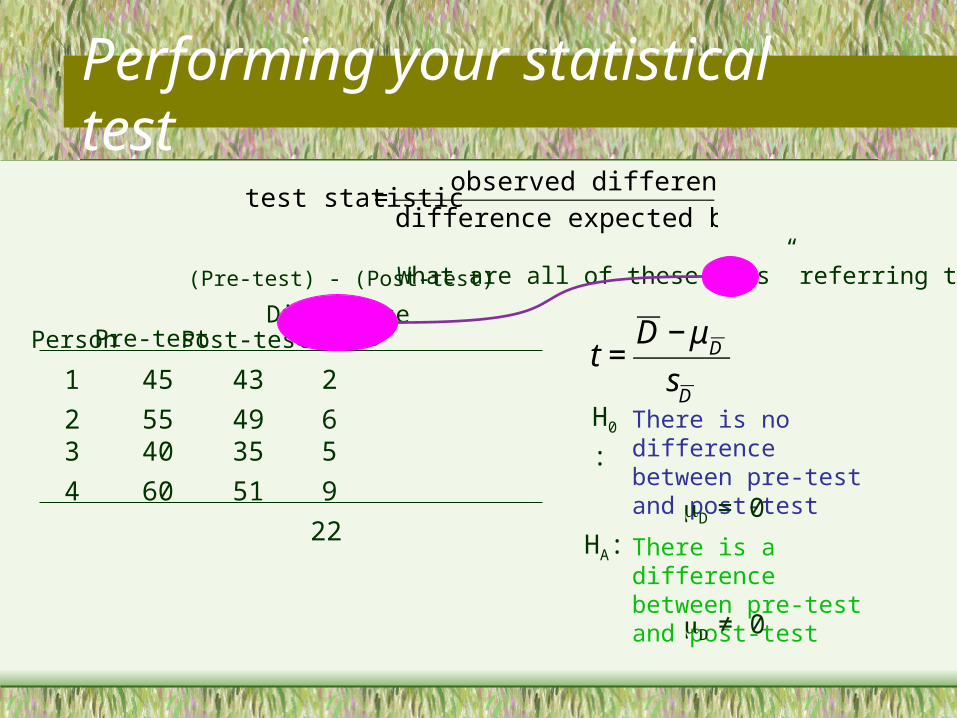
What are all of these “D’s” referring to?
Differencescores
2
65
9
22 €
t =D − μ
D
sD
Person Pre-test Post-test
1
23
4
45
5540
60
43
4935
51
(Pre-test) - (Post-test)
H0: There is no difference between pre-test and post-test
HA: There is a difference between pre-test and post-test
D = 0
D ≠ 0
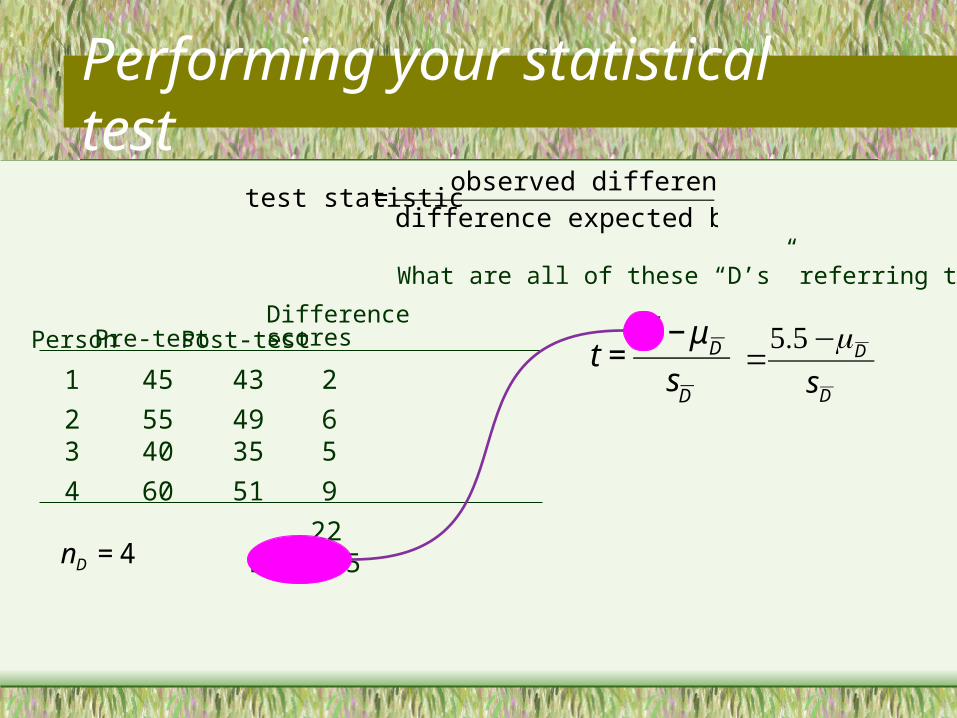
Performing your statistical test
€
test statistic =observed difference
difference expected by chance
What are all of these “D’s” referring to?
Differencescores
2
65
9
22= 5.5
€
t =D − μ
D
sD
Person Pre-test Post-test
1
23
4
45
5540
60
43
4935
51
€
nD = 4
(Pre-test) - (Post-test)
D∑nD
=D
Performing your statistical test
€
test statistic =observed difference
difference expected by chance
What are all of these “D’s” referring to?
Person Pre-test Post-testDifferencescores
1
23
4
45
5540
60
43
4935
51
2
65
9
22D = 5.5
€
t =D − μ
D
sD D
D
s
−=
5.5
€
nD = 4
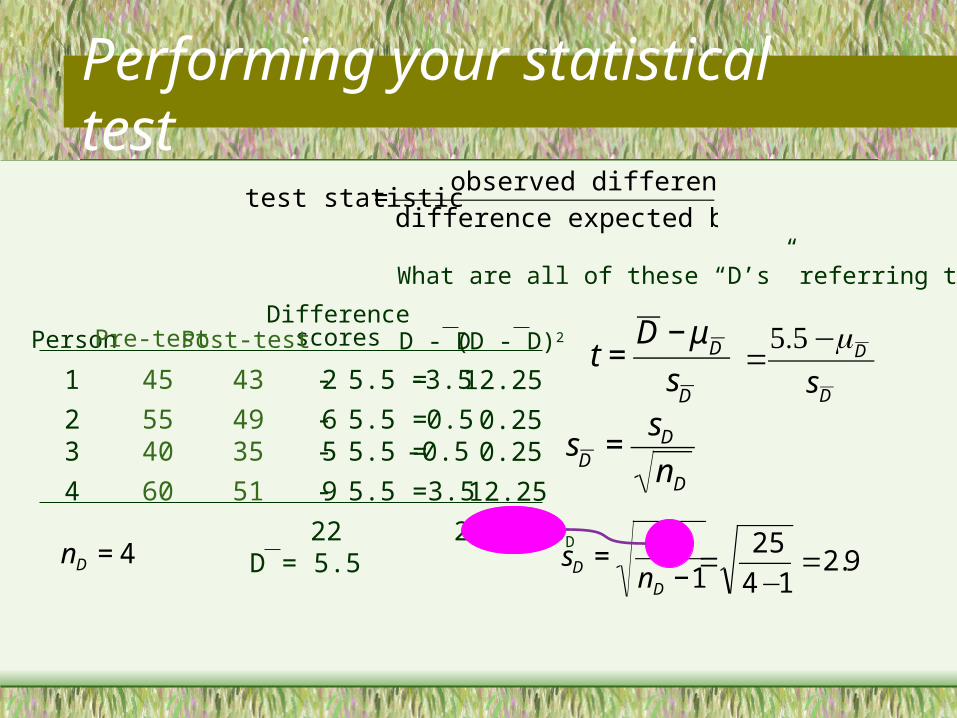
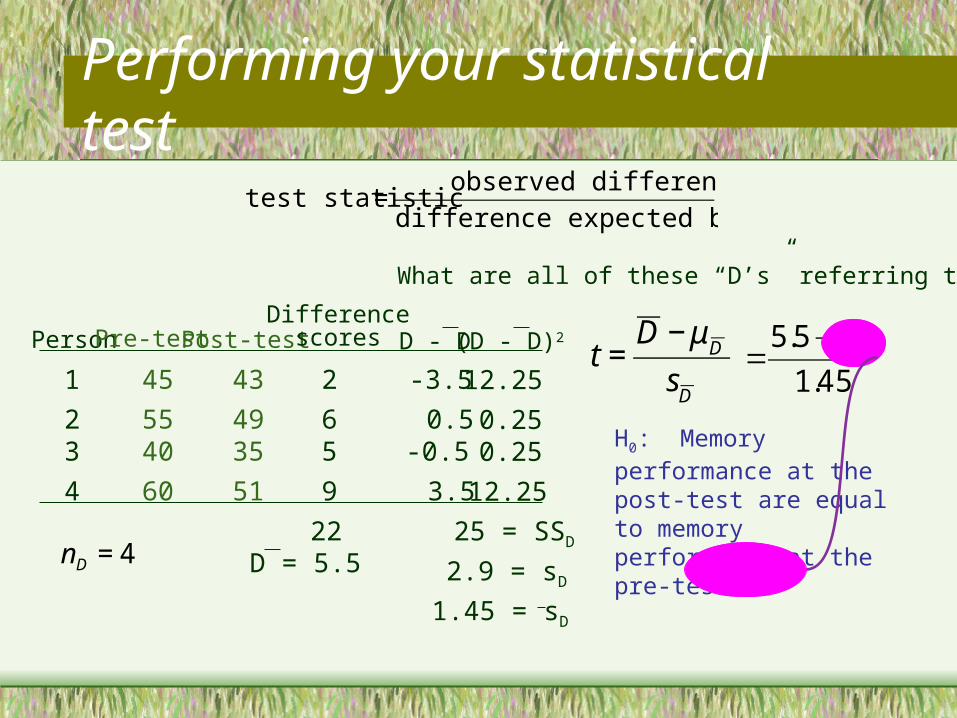
Performing your statistical test
€
test statistic =observed difference
difference expected by chance
What are all of these “D’s” referring to?
PersonDifference
scores
1
23
4
Pre-test Post-test
45
5540
60
43
4935
51
2
65
9
22D = 5.5
€
sD
=sD
nD
€
t =D − μ
D
sD
-3.5- 5.5 =
0.5- 5.5 =-0.5- 5.5 =
3.5- 5.5 =
12.25
0.250.25
12.25
25 = SSD
D - D (D - D)2
€
sD =SSD
nD −19.2
14
25=
−=
D
D
s
−=
5.5
€
nD = 4

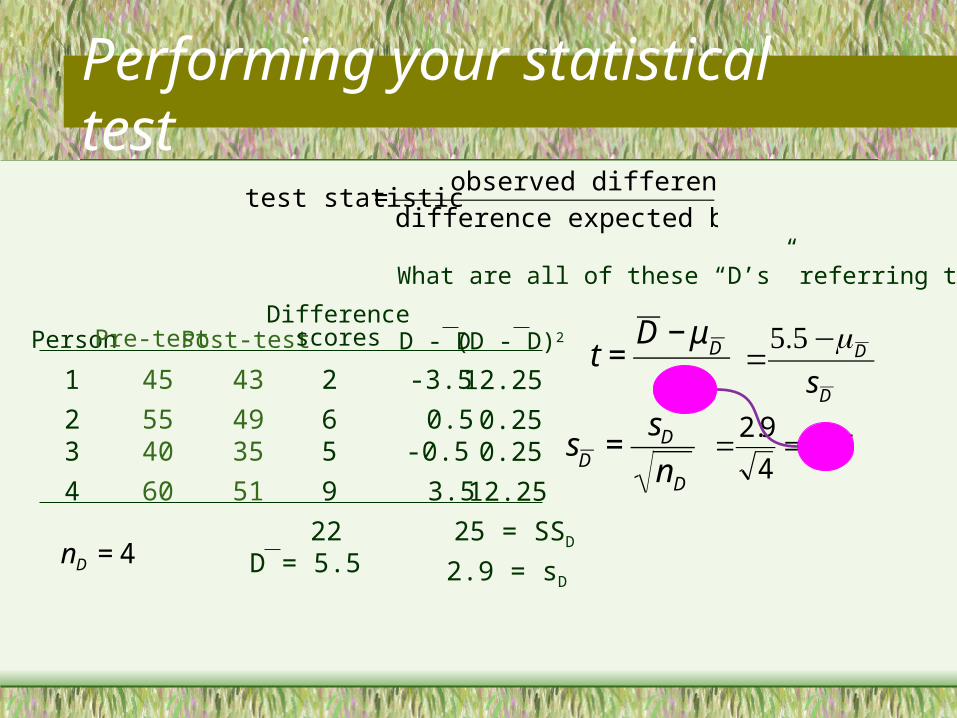
Performing your statistical test
€
test statistic =observed difference
difference expected by chance
What are all of these “D’s” referring to?
Person
1
23
4
Pre-test Post-test
45
5540
60
43
4935
51
2
65
9
22D = 5.5
€
sD
=sD
nD
€
t =D − μ
D
sD
25 = SSD
(D - D)2
€
sD =SSD
nD −19.2
14
25=
−=
D
D
s
−=
5.5 -3.5
0.5-0.5
3.5
D - DDifference
scores
12.25
0.250.25
12.25
€
nD = 4
Performing your statistical test
€
test statistic =observed difference
difference expected by chance
What are all of these “D’s” referring to?
Person
1
23
4
Pre-test Post-test
45
5540
60
43
4935
51
2
65
9
22D = 5.5
€
t =D − μ
D
sD
25 = SSD
(D - D)2
€
sD
=sD
nD
45.14
9.2==
2.9 = sD
D
D
s
−=
5.5 -3.5
0.5-0.5
3.5
D - DDifference
scores
12.25
0.250.25
12.25
€
nD = 4

Performing your statistical test
€
test statistic =observed difference
difference expected by chance
What are all of these “D’s” referring to?
Person
1
23
4
Pre-test Post-test
45
5540
60
43
4935
51
2
65
9
22D = 5.5
€
t =D − μ
D
sD
25 = SSD
(D - D)2
2.9 = sD
45.1
5.5 D−=
1.45 = sD
?Think back to the null hypotheses
-3.5
0.5-0.5
3.5
D - DDifference
scores
12.25
0.250.25
12.25
€
nD = 4
Performing your statistical test
€
test statistic =observed difference
difference expected by chance
What are all of these “D’s” referring to?
Person
1
23
4
Pre-test Post-test
45
5540
60
43
4935
51
2
65
9
22D = 5.5
€
t =D − μ
D
sD
25 = SSD
(D - D)2
2.9 = sD
45.1
5.5 D−=
1.45 = sD
H0: Memory performance at the post-test are equal to memory performance at the pre-test.
€
D
= 0
-3.5
0.5-0.5
3.5
D - DDifference
scores
12.25
0.250.25
12.25
€
nD = 4
Performing your statistical test
€
test statistic =observed difference
difference expected by chance
What are all of these “D’s” referring to?
Person
1
23
4
Pre-test Post-test
45
5540
60
43
4935
51
2
65
9
22D = 5.5
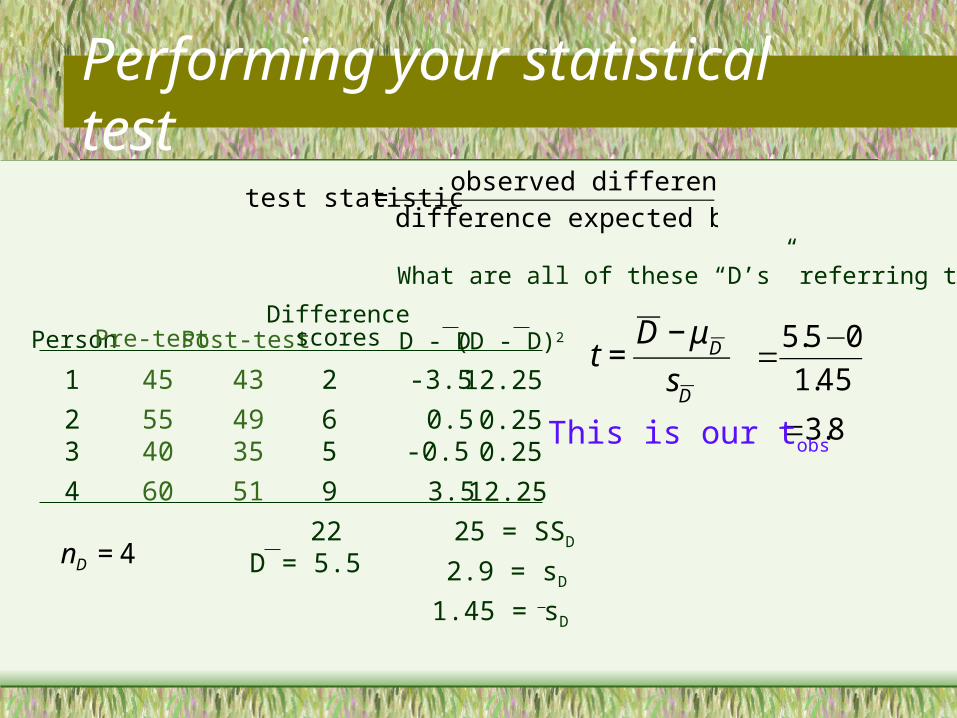
€
t =D − μ
D
sD
25 = SSD
(D - D)2
2.9 = sD
45.1
05.5 −=
1.45 = sD
8.3=This is our tobs
-3.5
0.5-0.5
3.5
D - DDifference
scores
12.25
0.250.25
12.25
€
nD = 4
Performing your statistical test
€
test statistic =observed difference
difference expected by chance
What are all of these “D’s” referring to?
Person
1
23
4
Pre-test Post-test
45
5540
60
43
4935
51
2
65
9
22D = 5.5
€
t =D − μ
D
sD
25 = SSD
(D - D)2
2.9 = sD
45.1
05.5 −=
1.45 = sD
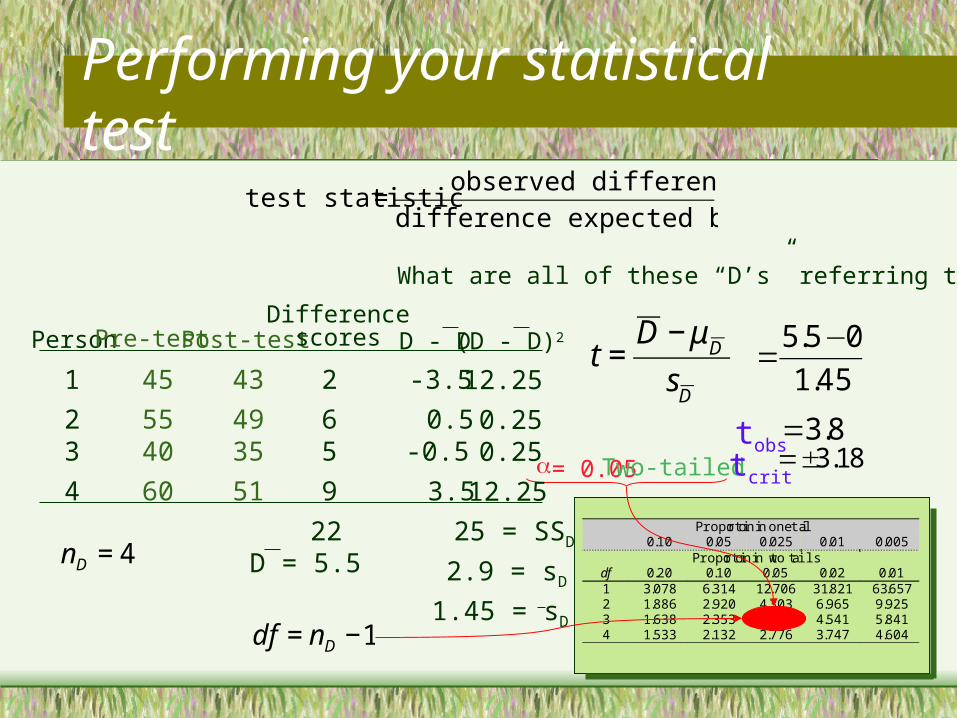
8.3=tobs
Proportion in one tail0.10 0.05 0.025 0.01 0.005
Proportion in two tailsdf 0.20 0.10 0.05 0.02 0.011 3.078 6.314 12.706 31.821 63.6572 1.886 2.920 4.303 6.965 9.9253 1.638 2.353 3.182 4.541 5.8414 1.533 2.132 2.776 3.747 4.604
= 0.05 Two-tailed tcrit
€
df = nD −1
=±3.18
-3.5
0.5-0.5
3.5
D - DDifference
scores
12.25
0.250.25
12.25
€
nD = 4
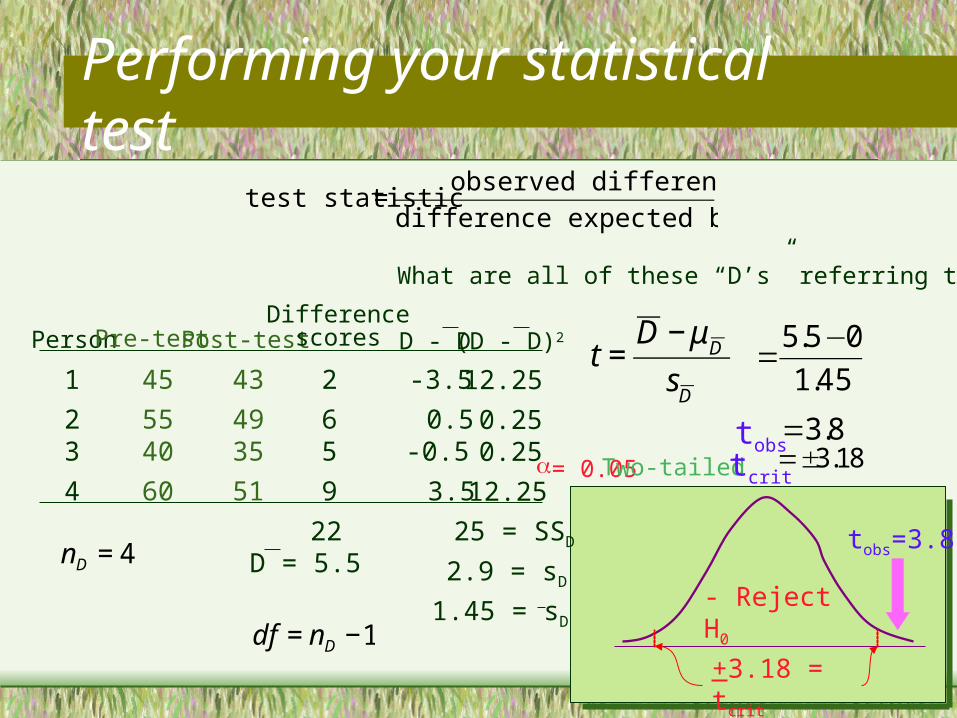
+3.18 = tcrit
- Reject H0
Performing your statistical test
€
test statistic =observed difference
difference expected by chance
What are all of these “D’s” referring to?
Person
1
23
4
Pre-test Post-test
45
5540
60
43
4935
51
2
65
9
22D = 5.5
€
t =D − μ
D
sD
25 = SSD
(D - D)2
2.9 = sD
45.1
05.5 −=
1.45 = sD
8.3=tobs= 0.05 Two-tailed tcrit
€
df = nD −1
=±3.18
-3.5
0.5-0.5
3.5
D - DDifference
scores
12.25
0.250.25
12.25
€
nD = 4 tobs=3.8
Performing your statistical test
€
test statistic =observed difference
difference expected by chance
What are all of these “D’s” referring to?
Person
1
23
4
Pre-test Post-test
45
5540
60
43
4935
51
2
65
9
22D = 5.5
€
t =D − μ
D
sD
25 = SSD
(D - D)2
2.9 = sD
45.1
05.5 −=
1.45 = sD
8.3=tobs= 0.05 Two-tailed tcrit
€
df = nD −1
=±3.18
Tobs > tcrit so we reject the H0
-3.5
0.5-0.5
3.5
D - DDifference
scores
12.25
0.250.25
12.25
€
nD = 4

Statistical analysis follows design
• The related-samples t-test can be used when:– 1 sample
t =D−D
sD
– Two scores per subject
Statistical analysis follows design
• The related-samples t-test can be used when:– 1 sample
– Two scores per subject
t =D−D
sD
– 2 samples
– Scores are related
- OR -
Performing your statistical test
€
t =X − μ
X
sX
€
zX
=X − μ
X
σX
€
sX
=s
n
Test statistic
Diff. Expected by chance
€
X
=σ
n
One sample z One sample t
€
df = n −1
Related samples t
t =D−D
sD
sD =sDnD
df =nD −1
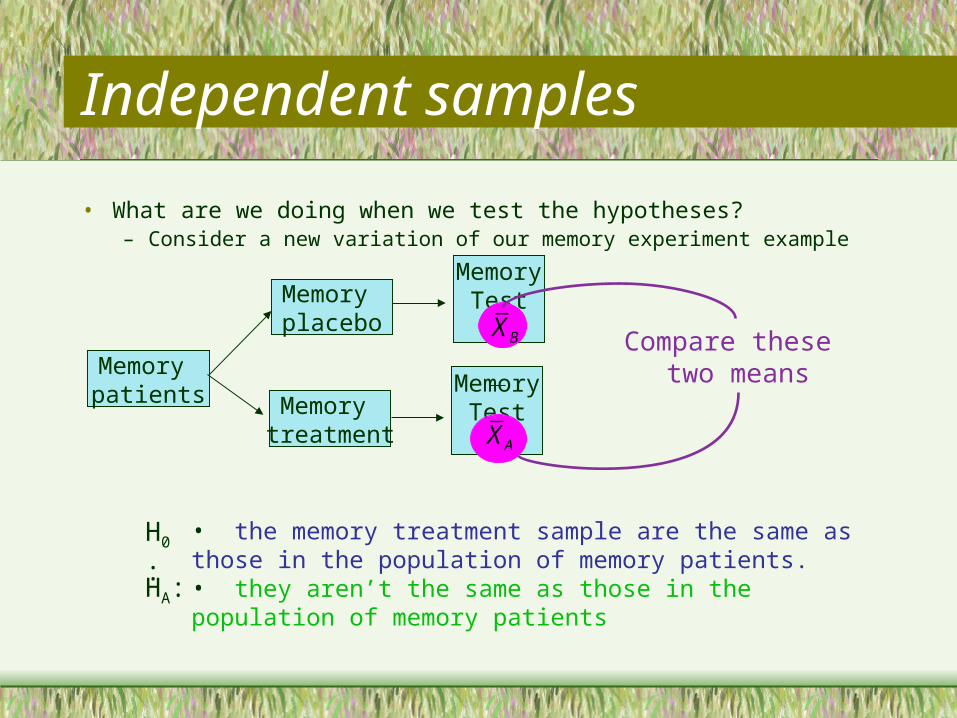
Independent samples
• What are we doing when we test the hypotheses?– Consider a new variation of our memory experiment example
Memory treatment
Memory patients Memory
Test
• the memory treatment sample are the same as those in the population of memory patients.• they aren’t the same as those in the population of memory patients
H0:
HA:
Memory placebo
MemoryTest
Compare these two means
XA
XB
Statistical analysis follows design
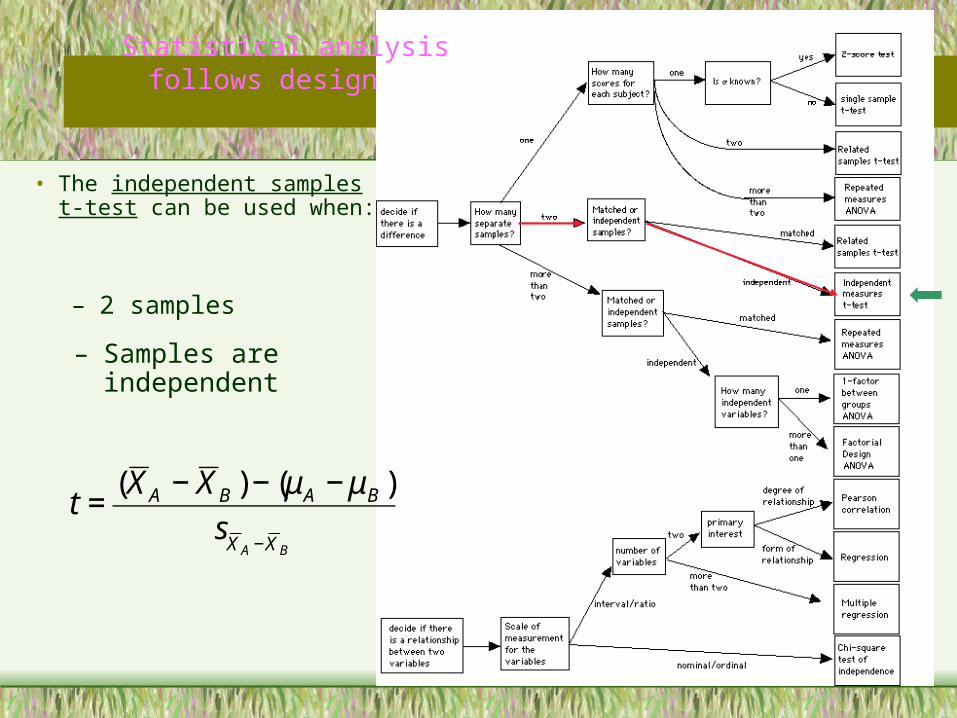
• The independent samples t-test can be used when:
– 2 samples
– Samples are independent
€
t =(X A − X B ) − (μA − μB )
sX A −X B
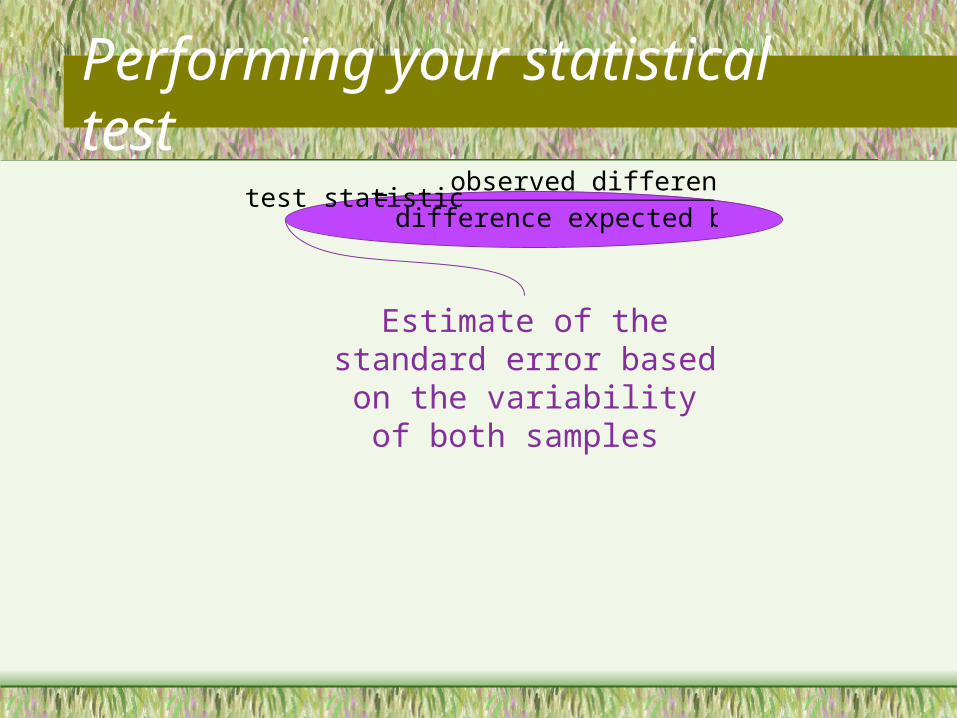
Performing your statistical test
Estimate of the standard error based on the variability of
both samples
€
test statistic =observed difference
difference expected by chance
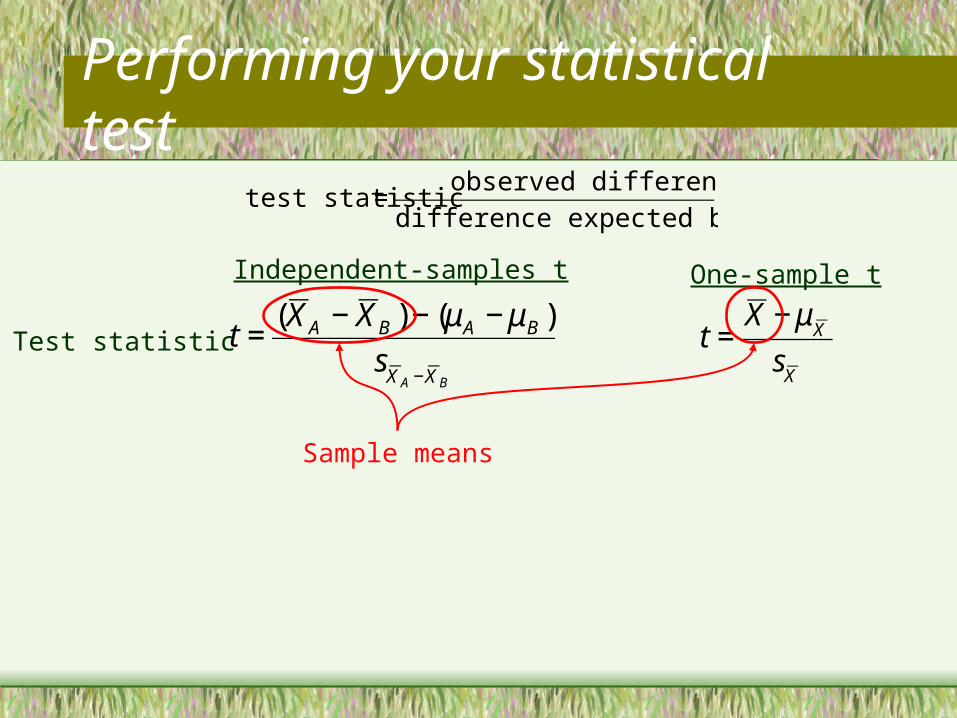
Performing your statistical test
€
test statistic =observed difference
difference expected by chance
Test statistic
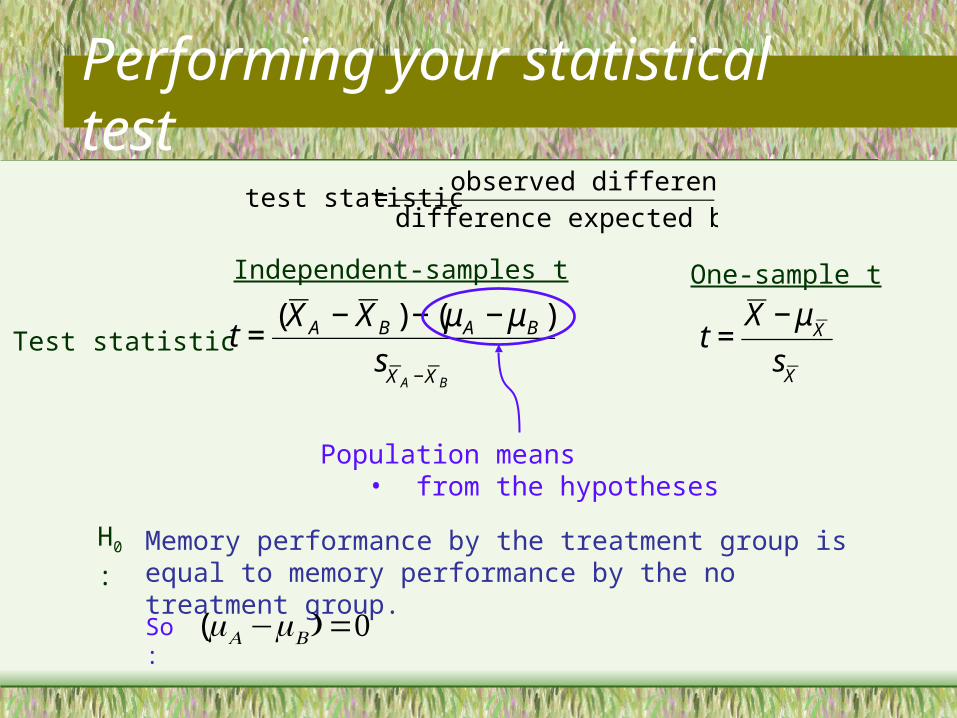
€
t =(X A − X B ) − (μA − μB )
sX A −X B
€
t =X − μ
X
sX
One-sample tIndependent-samples t
Sample means
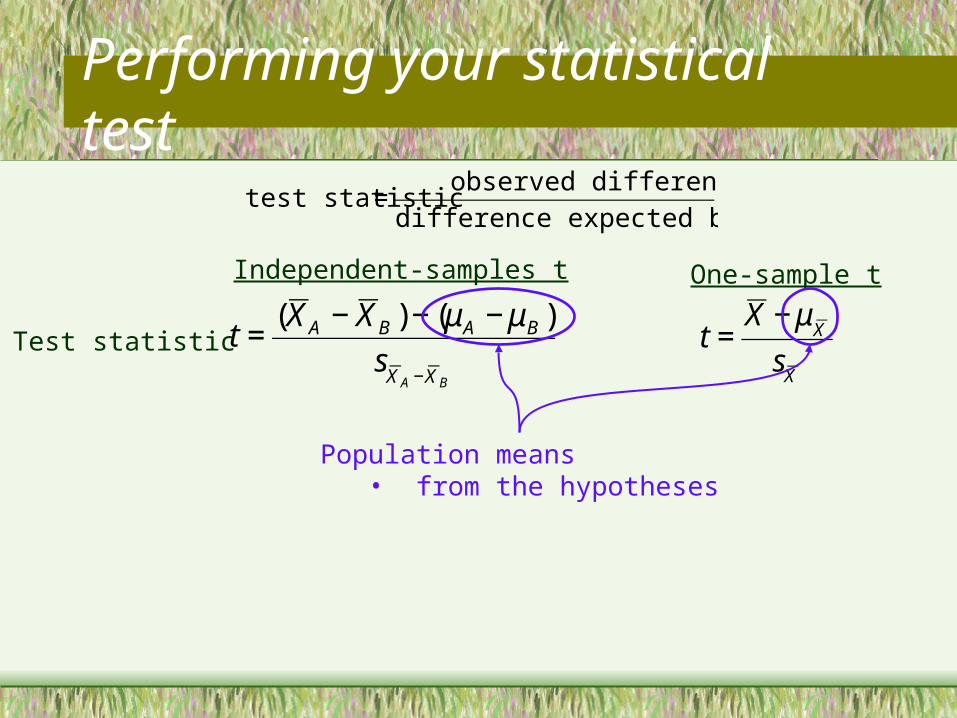
Performing your statistical test
€
test statistic =observed difference
difference expected by chance
Test statistic
€
t =(X A − X B ) − (μA − μB )
sX A −X B
€
t =X − μ
X
sX
One-sample tIndependent-samples t
Population means• from the hypotheses
Performing your statistical test
€
test statistic =observed difference
difference expected by chance
Test statistic
€
t =(X A − X B ) − (μA − μB )
sX A −X B
€
t =X − μ
X
sX
One-sample tIndependent-samples t
Population means• from the hypotheses
H0: Memory performance by the treatment group is equal to memory performance by the no treatment group.
So: (A −B) =0
Performing your statistical test
€
test statistic =observed difference
difference expected by chance
Test statistic
€
t =X − μ
X
sX
One-sample t
€
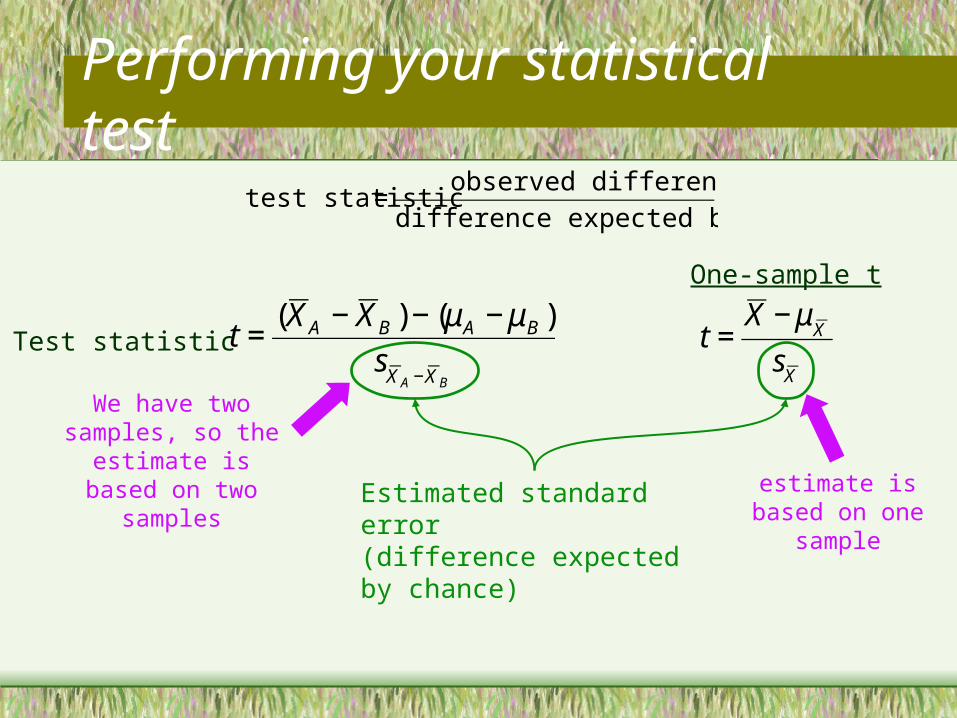
t =(X A − X B ) − (μA − μB )
sX A −X B
Estimated standard error(difference expected by chance)
estimate is based on one sample
We have two samples, so the estimate is based
on two samples
Performing your statistical test
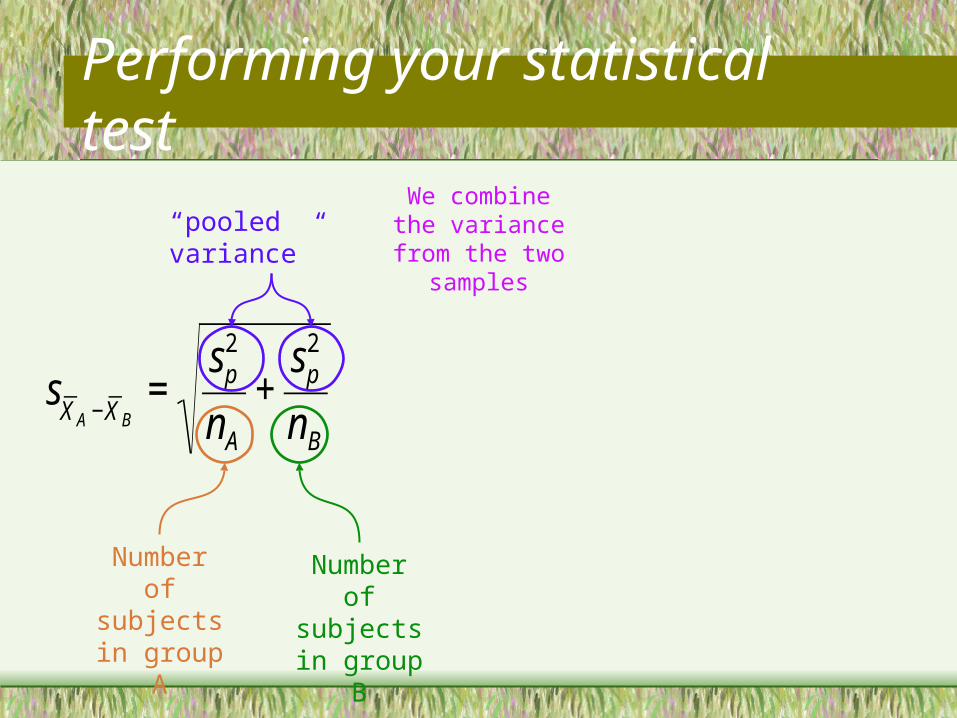
€
sX A −X B
=sp
2
nA
+sp
2
nB
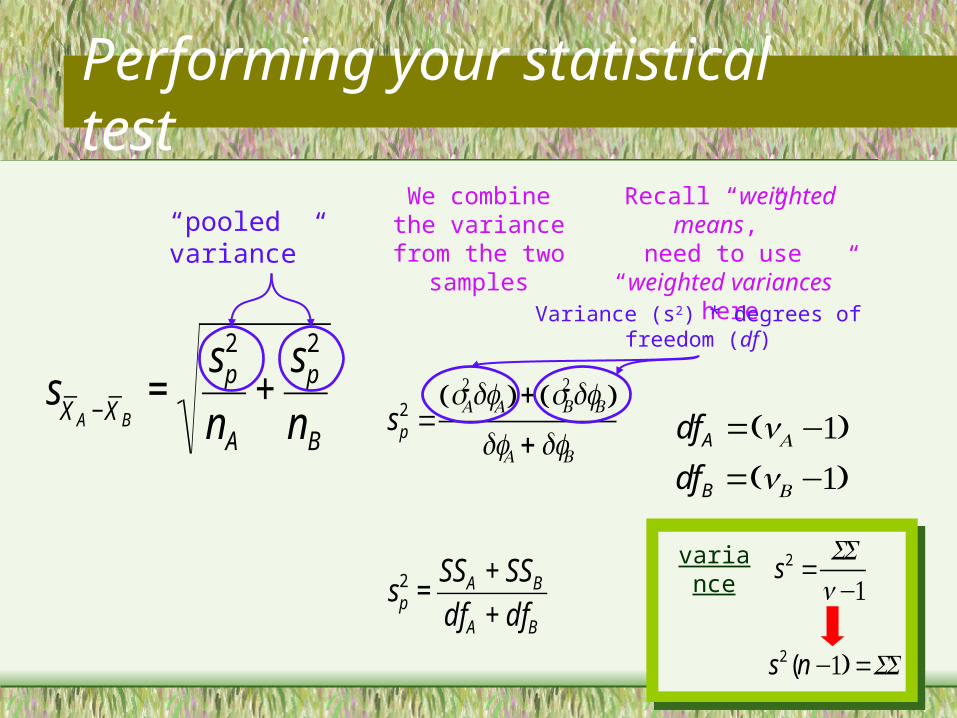
“pooled variance”We combine the
variance from the two samples
Number of subjects in group A
Number of subjects in group B
s2 =SSn−1
variance
Performing your statistical test
€
sX A −X B
=sp
2
nA
+sp
2
nB
“pooled variance”We combine the
variance from the two samples
Recall “weighted means,” need to use
“weighted variances” here
€
sp2 =
SSA + SSB
dfA + dfB
sp2 =
sA2dfA( ) + sB
2dfB( )dfA +dfB
dfA =(nA −1)dfB =(nB −1)
Variance (s2) * degrees of freedom (df)
s2 (n −1) =SS
Performing your statistical test
€
sX A −X B
=sp
2
nA
+sp
2
nB
€
df = nA + nB − 2
€
t =(X A − X B ) − (μA − μB )
sX A −X B
€
=(nA −1) + (nB −1)
€
sp2 =
SSA + SSB
dfA + dfB
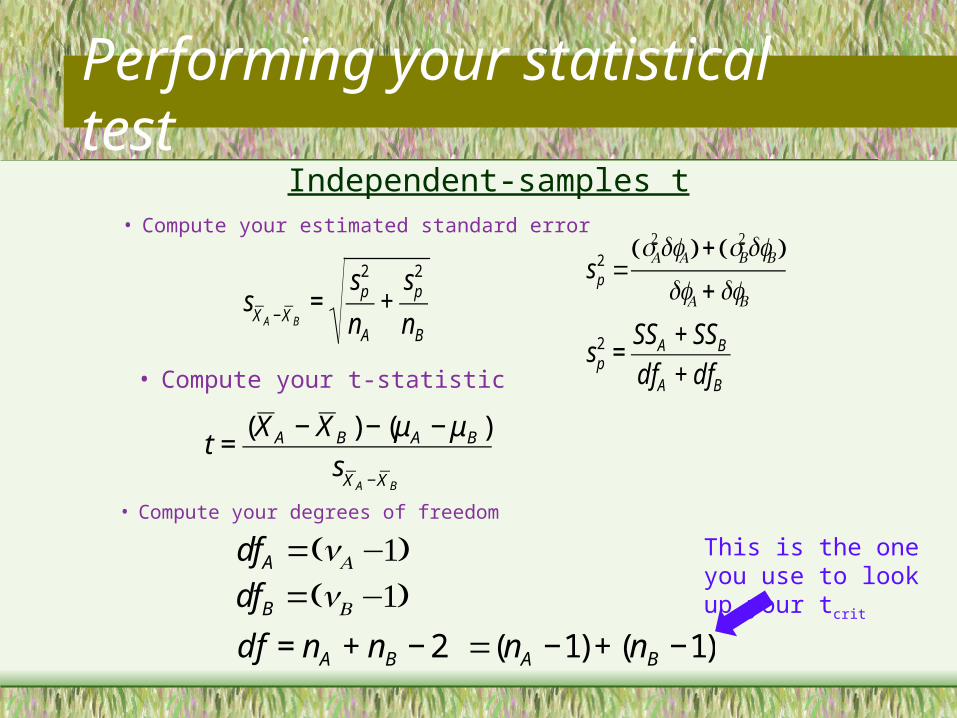
Independent-samples t• Compute your estimated standard error
sp2 =
sA2dfA( ) + sB
2dfB( )dfA +dfB
• Compute your t-statistic
• Compute your degrees of freedom
dfA =(nA −1)dfB =(nB −1)
This is the one you use to look up your tcrit
Performing your statistical test
PersonExp.
groupControl group
1
23
4
45
5540
60
43
4935
51
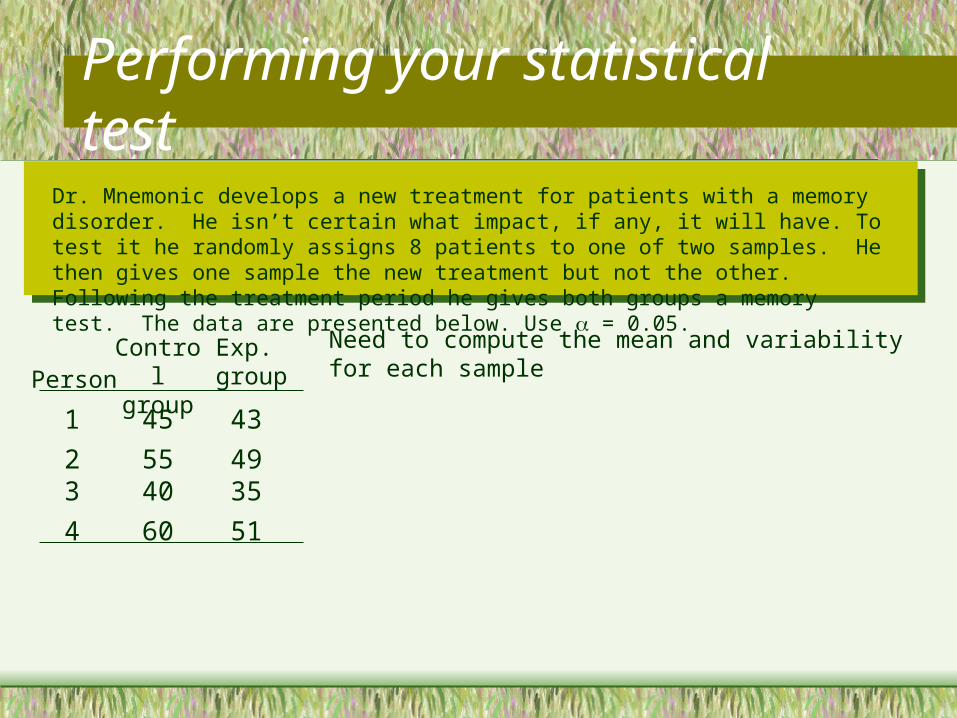
Need to compute the mean and variability for each sample
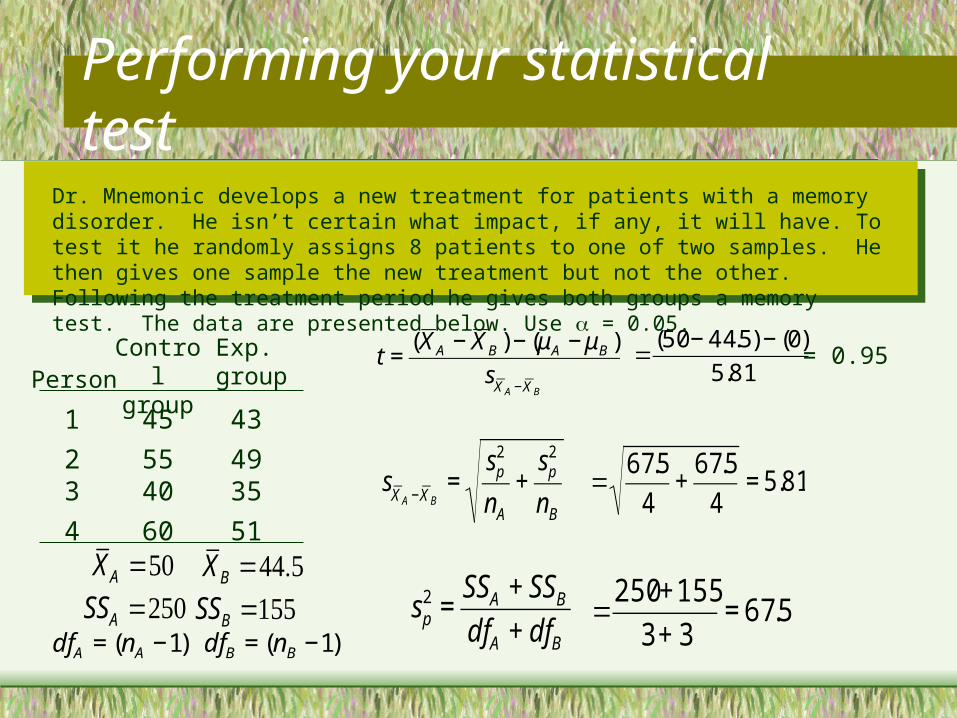
Dr. Mnemonic develops a new treatment for patients with a memory disorder. He isn’t certain what impact, if any, it will have. To test it he randomly assigns 8 patients to one of two samples. He then gives one sample the new treatment but not the other. Following the treatment period he gives both groups a memory test. The data are presented below. Use = 0.05.
Performing your statistical test
PersonExp.
groupControl group
1
23
4
45
5540
60
43
4935
51
Need to compute the mean and variability for each sample
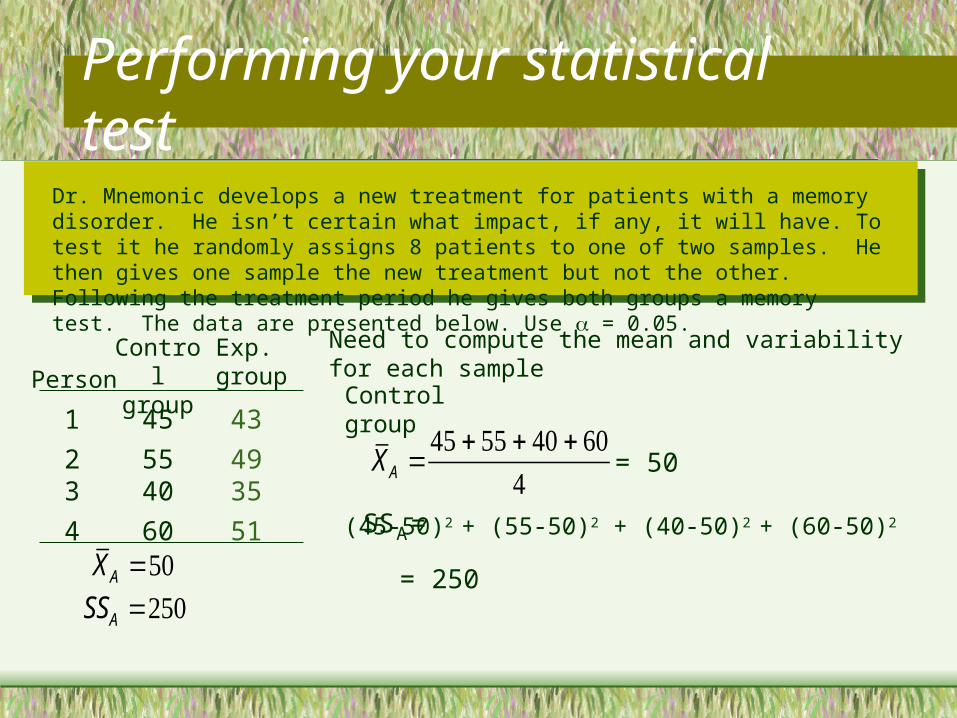
Control group
= 50
(45-50)2 + (55-50)2 + (40-50)2 + (60-50)2
= 250
SS =A
Dr. Mnemonic develops a new treatment for patients with a memory disorder. He isn’t certain what impact, if any, it will have. To test it he randomly assigns 8 patients to one of two samples. He then gives one sample the new treatment but not the other. Following the treatment period he gives both groups a memory test. The data are presented below. Use = 0.05.
XA =45 + 55 + 40 + 60
4
XA =50SSA =250
Performing your statistical test
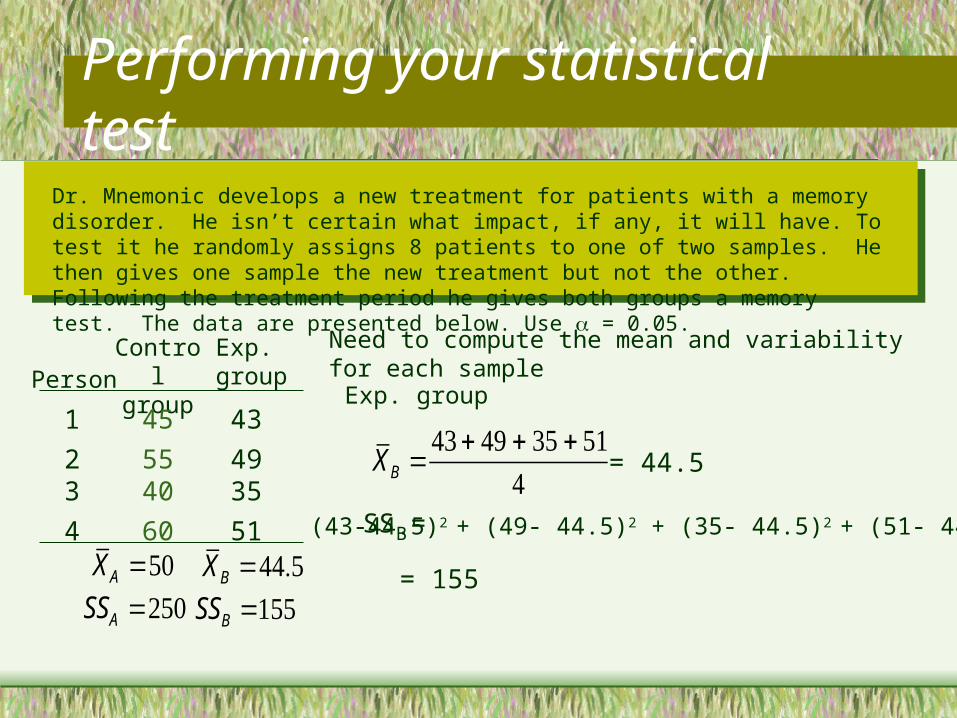
Exp. group
(43-44.5)2 + (49- 44.5)2 + (35- 44.5)2 + (51- 44.5)2
= 155
SS =B
PersonExp.
groupControl group
1
23
4
45
5540
60
43
4935
51
Need to compute the mean and variability for each sample
Dr. Mnemonic develops a new treatment for patients with a memory disorder. He isn’t certain what impact, if any, it will have. To test it he randomly assigns 8 patients to one of two samples. He then gives one sample the new treatment but not the other. Following the treatment period he gives both groups a memory test. The data are presented below. Use = 0.05.
XB =43+ 49 + 35 + 51
4
XA =50SSA =250
XB =44.5SSB =155
= 44.5
Performing your statistical test
€
sX A −X B
=sp
2
nA
+sp
2
nB
€
t =(X A − X B ) − (μA − μB )
sX A −X B
€
sp2 =
SSA + SSB
dfA + dfB
€
=250 +155
3+ 3= 67.5€
=67.5
4+
67.5
4= 5.81€
=(50 − 44.5) − (0)
5.81
€
dfA = (nA −1)
€
dfB = (nB −1)
PersonExp.
groupControl group
1
23
4
45
5540
60
43
4935
51XA =50
SSA =250XB =44.5
SSB =155
Dr. Mnemonic develops a new treatment for patients with a memory disorder. He isn’t certain what impact, if any, it will have. To test it he randomly assigns 8 patients to one of two samples. He then gives one sample the new treatment but not the other. Following the treatment period he gives both groups a memory test. The data are presented below. Use = 0.05.
= 0.95
Performing your statistical test
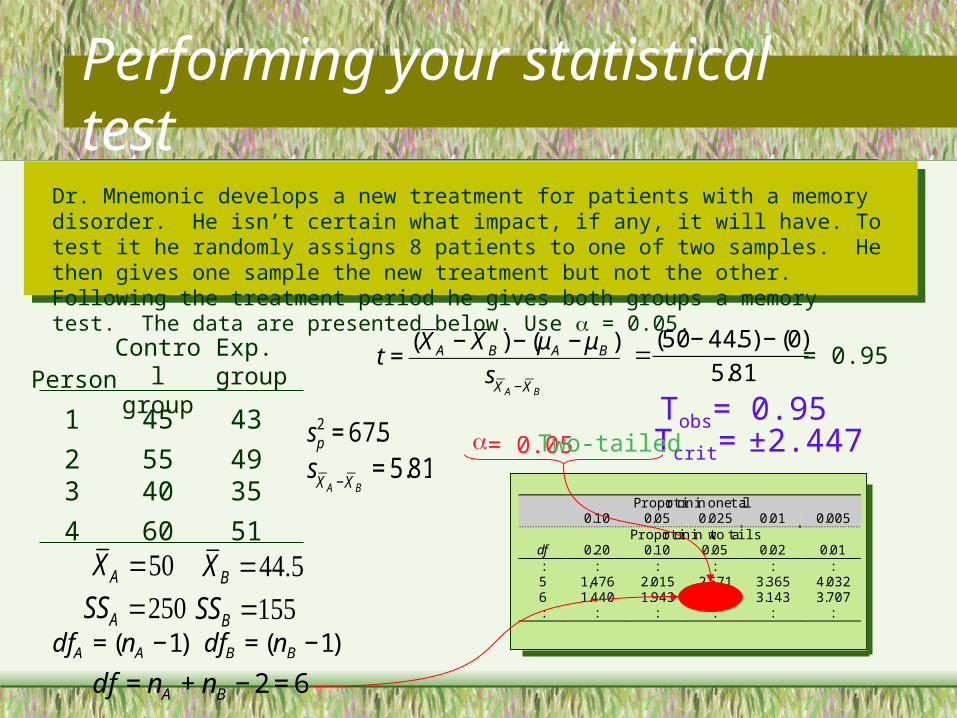
Tobs= 0.95Tcrit= ±2.447
€
sX A −X B
= 5.81
€
sp2 = 67.5
Proportion in one tail0.10 0.05 0.025 0.01 0.005
Proportion in two tailsdf 0.20 0.10 0.05 0.02 0.01: : : : : :5 1,476 2.015 2.571 3.365 4.0326 1.440 1.943 2.447 3.143 3.707: : : : : :
€
df = nA + nB − 2 = 6
= 0.05 Two-tailed
PersonExp.
groupControl group
1
23
4
45
5540
60
43
4935
51
Dr. Mnemonic develops a new treatment for patients with a memory disorder. He isn’t certain what impact, if any, it will have. To test it he randomly assigns 8 patients to one of two samples. He then gives one sample the new treatment but not the other. Following the treatment period he gives both groups a memory test. The data are presented below. Use = 0.05.
€
t =(X A − X B ) − (μA − μB )
sX A −X B
€
=(50 − 44.5) − (0)
5.81
€
dfA = (nA −1)
€
dfB = (nB −1)
XA =50SSA =250
XB =44.5SSB =155
= 0.95
Performing your statistical test
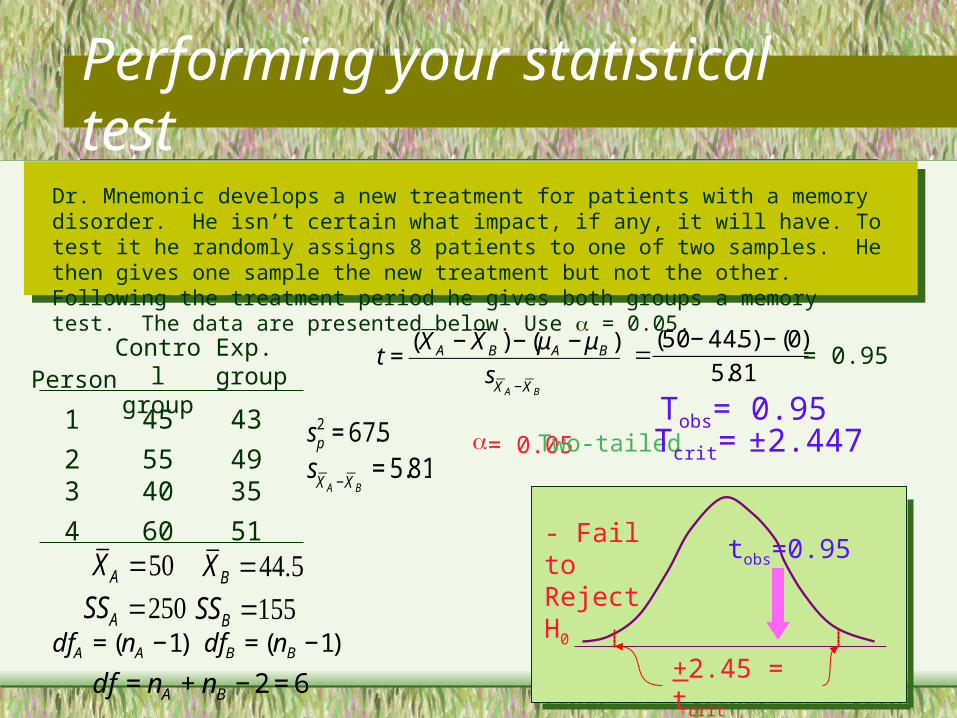
Tobs= 0.95= 0.05 Two-tailed Tcrit= ±2.447
PersonExp.
groupControl group
1
23
4
45
5540
60
43
4935
51
€
sX A −X B
= 5.81
€
sp2 = 67.5
€
df = nA + nB − 2 = 6
Dr. Mnemonic develops a new treatment for patients with a memory disorder. He isn’t certain what impact, if any, it will have. To test it he randomly assigns 8 patients to one of two samples. He then gives one sample the new treatment but not the other. Following the treatment period he gives both groups a memory test. The data are presented below. Use = 0.05.
€
t =(X A − X B ) − (μA − μB )
sX A −X B
€
=(50 − 44.5) − (0)
5.81
€
dfA = (nA −1)
€
dfB = (nB −1)
XA =50SSA =250
XB =44.5SSB =155
+2.45 = tcrit
- Fail to Reject H0
tobs=0.95
= 0.95
Performing your statistical test
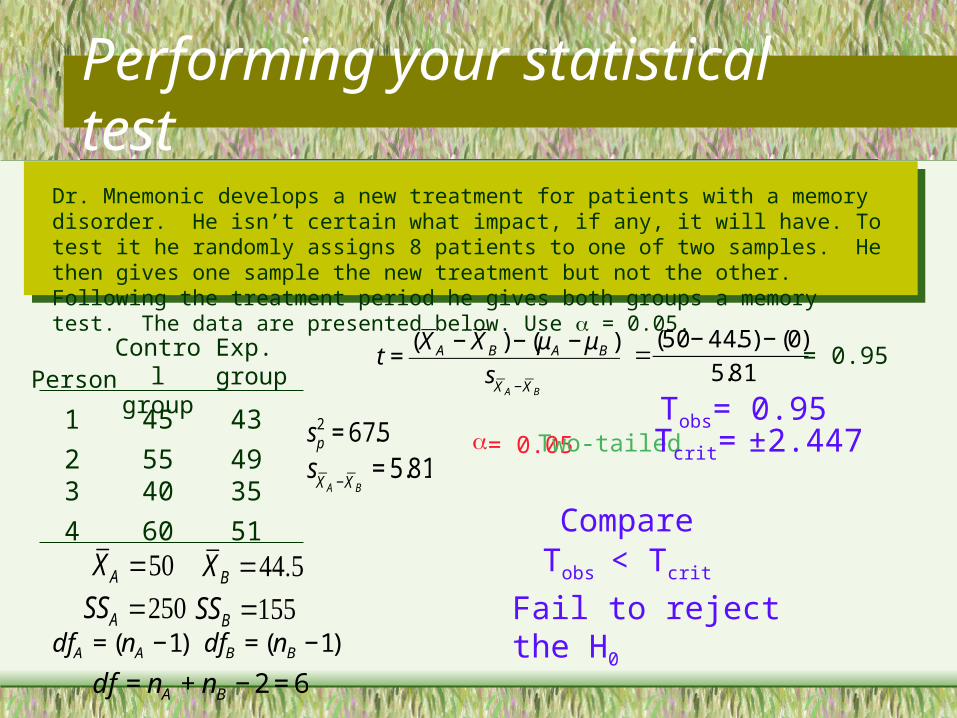
Tobs= 0.95= 0.05 Two-tailed Tcrit= ±2.447
Tobs Tcrit
Compare<
Fail to reject the H0
PersonExp.
groupControl group
1
23
4
45
5540
60
43
4935
51
€
sX A −X B
= 5.81
€
sp2 = 67.5
€
df = nA + nB − 2 = 6
Dr. Mnemonic develops a new treatment for patients with a memory disorder. He isn’t certain what impact, if any, it will have. To test it he randomly assigns 8 patients to one of two samples. He then gives one sample the new treatment but not the other. Following the treatment period he gives both groups a memory test. The data are presented below. Use = 0.05.
€
t =(X A − X B ) − (μA − μB )
sX A −X B
€
=(50 − 44.5) − (0)
5.81
€
dfA = (nA −1)
€
dfB = (nB −1)
XA =50SSA =250
XB =44.5SSB =155
= 0.95
Assumptions
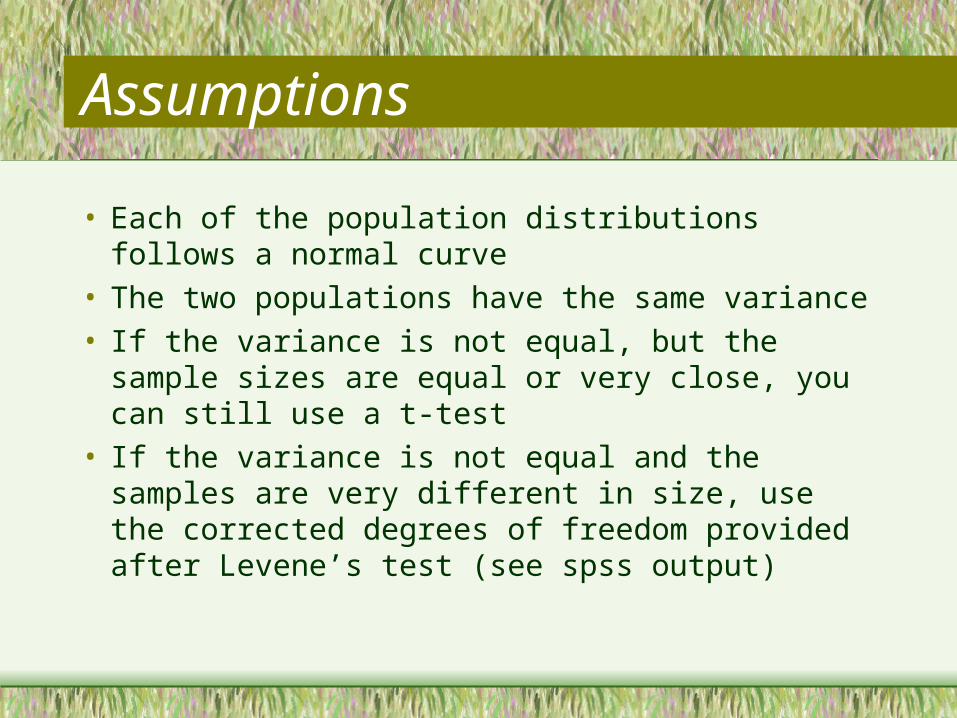
• Each of the population distributions follows a normal curve
• The two populations have the same variance• If the variance is not equal, but the sample sizes
are equal or very close, you can still use a t-test• If the variance is not equal and the samples are
very different in size, use the corrected degrees of freedom provided after Levene’s test (see spss output)
Using spss to conduct t-tests
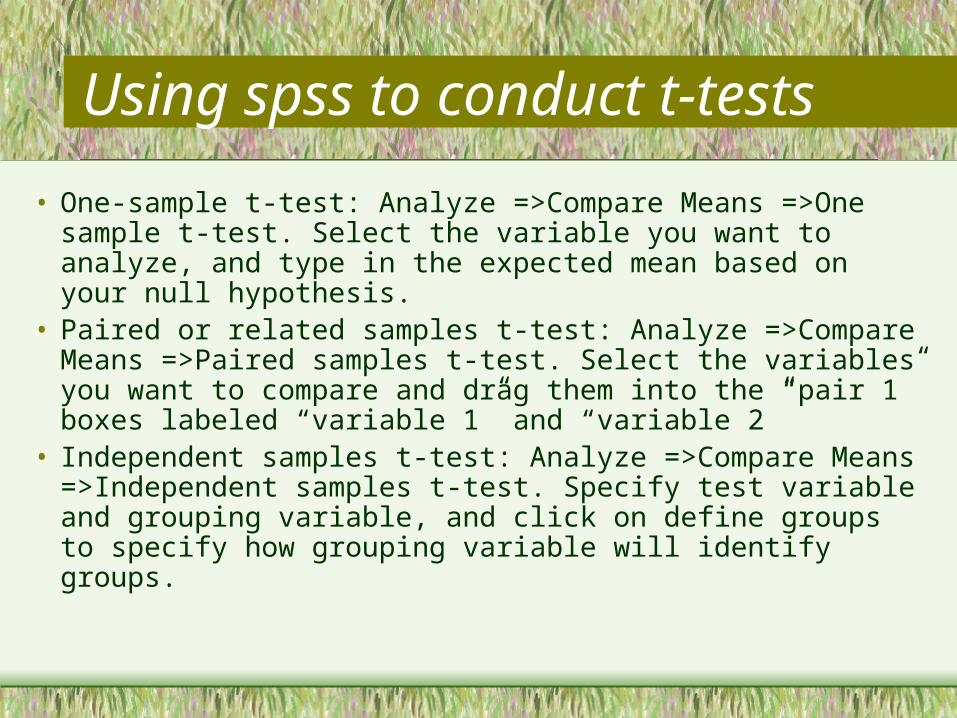
• One-sample t-test: Analyze =>Compare Means =>One sample t-test. Select the variable you want to analyze, and type in the expected mean based on your null hypothesis.
• Paired or related samples t-test: Analyze =>Compare Means =>Paired samples t-test. Select the variables you want to compare and drag them into the “pair 1” boxes labeled “variable 1” and “variable 2”
• Independent samples t-test: Analyze =>Compare Means =>Independent samples t-test. Specify test variable and grouping variable, and click on define groups to specify how grouping variable will identify groups.
Using excel to compute t-tests
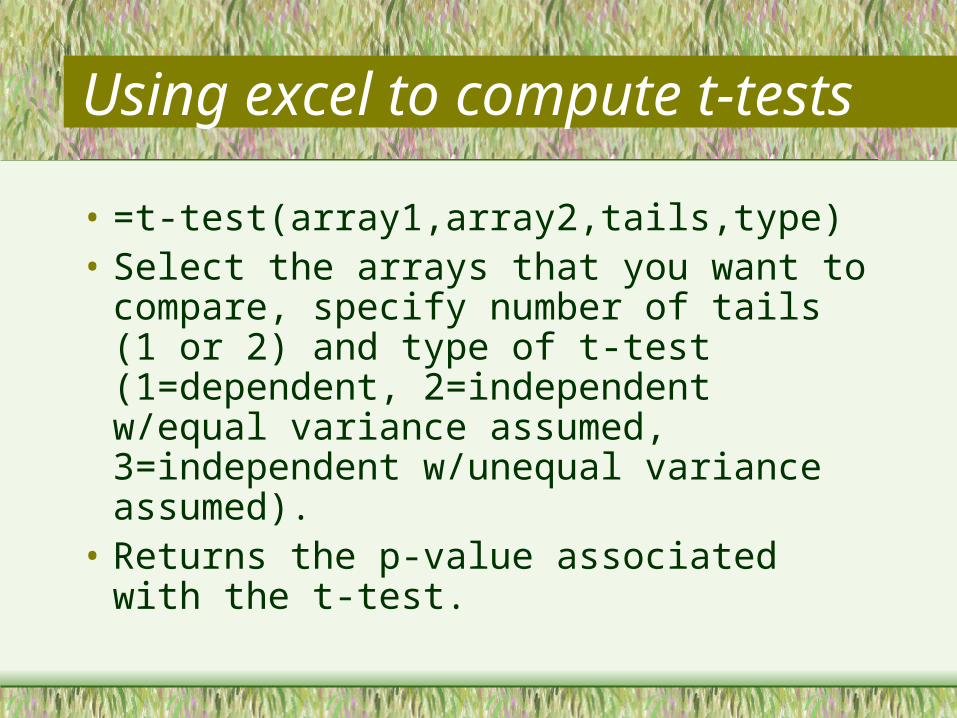
• =t-test(array1,array2,tails,type)• Select the arrays that you want to compare,
specify number of tails (1 or 2) and type of t-test (1=dependent, 2=independent w/equal variance assumed, 3=independent w/unequal variance assumed).
• Returns the p-value associated with the t-test.
t-tests and the General Linear Model
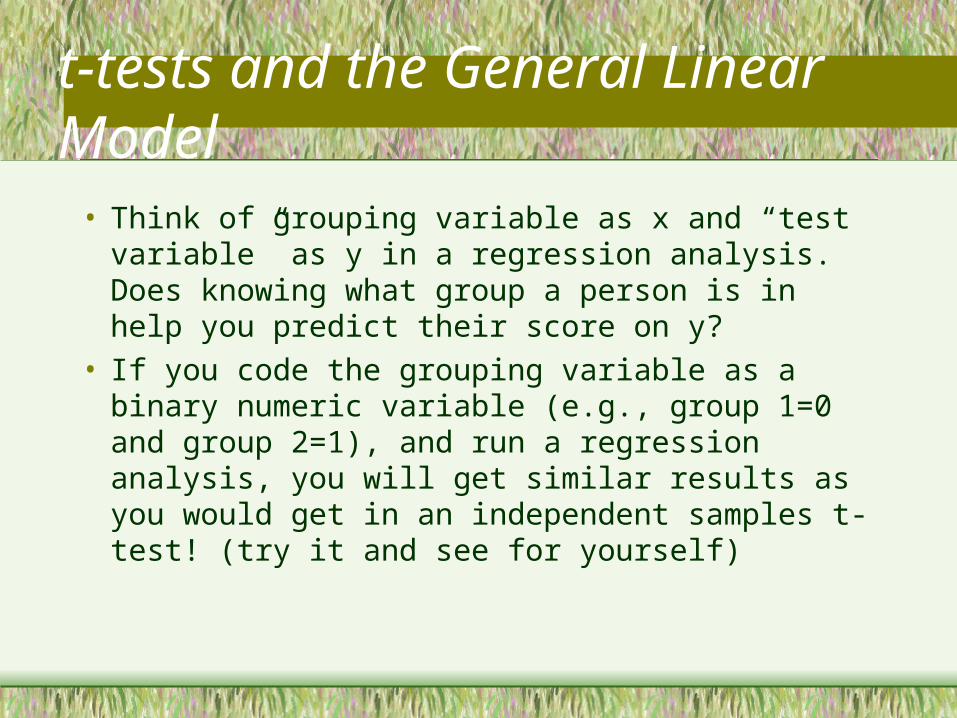
• Think of grouping variable as x and “test variable” as y in a regression analysis. Does knowing what group a person is in help you predict their score on y?
• If you code the grouping variable as a binary numeric variable (e.g., group 1=0 and group 2=1), and run a regression analysis, you will get similar results as you would get in an independent samples t-test! (try it and see for yourself)

Conceptual Preview of ANOVA
• Thinking in terms of the GLM, the t-test is telling you how big the variance or difference between the two groups is, compared to the variance in your y variable (between vs. within group variance).
• In terms of regression, how much can you reduce “error” (or random variability) by looking at scores within groups rather than scores for the entire sample?
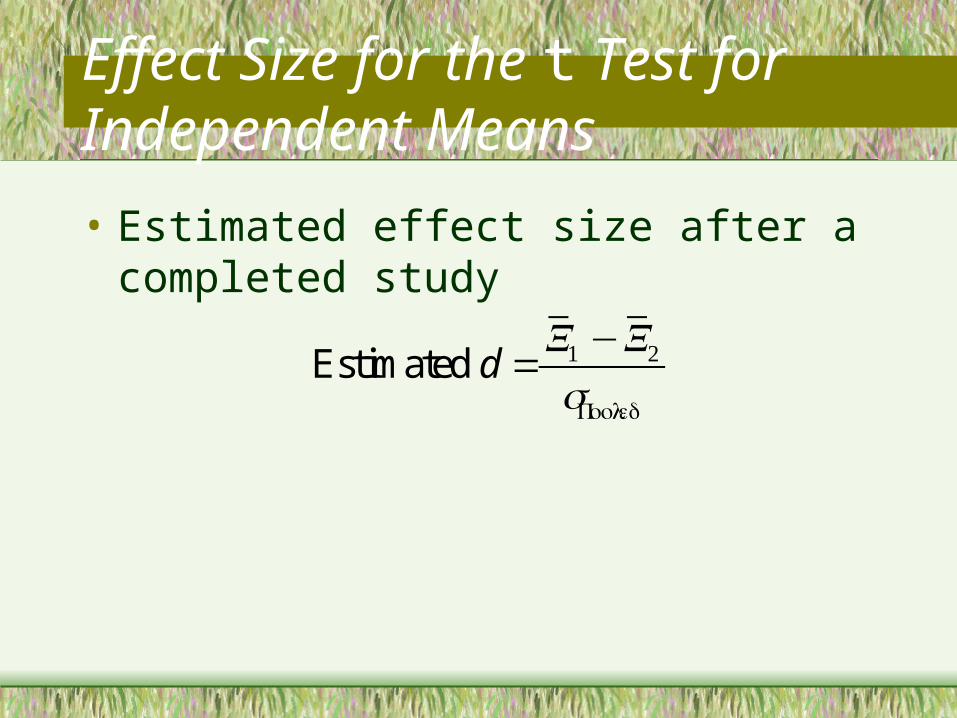
Effect Size for the t Test for Independent Means
• Estimated effect size after a completed study
Estimated d =X1 −X2
sPooled
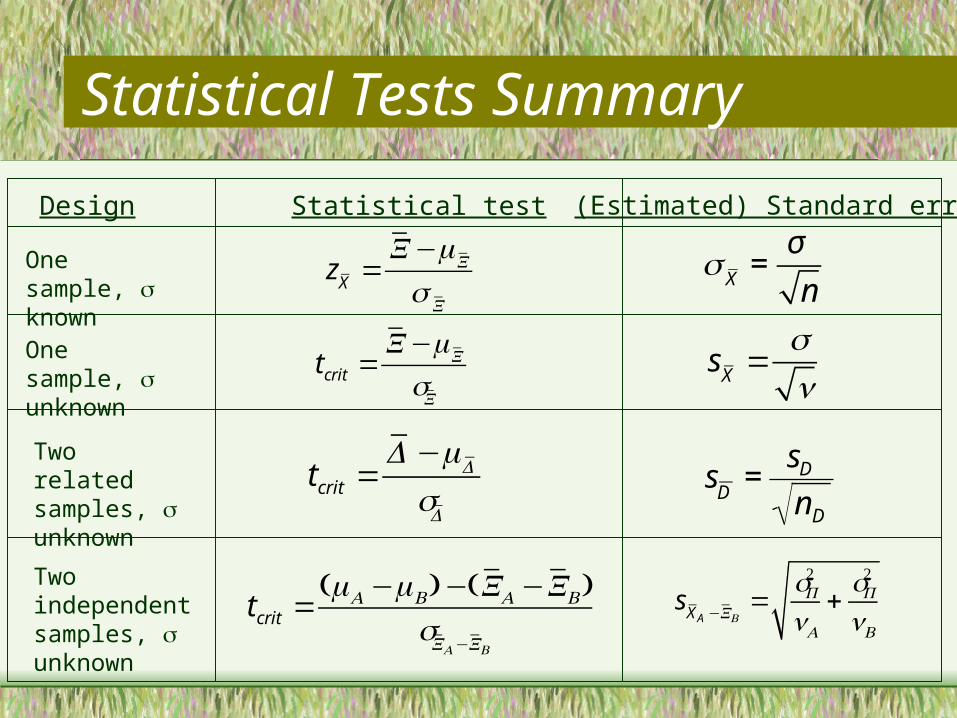
Statistical Tests Summary
Design Statistical test (Estimated) Standard error
tcrit =(A −B)−(XA −XB)
sXA−XBsXA −XB
=sP2
nA+sP2
nB€
sD
=sD
nD
tcrit =D−D
sD
sX =sn
tcrit =X−X
sX
zX =X−X
X
X =σ
nOne sample, known
One sample, unknown
Two related samples, unknown
Two independent samples, unknown