Embed Size (px)
Citation preview
Navy Personnel Research "and Development CenterSan Diego, California 92152-6800.. AP-92-6 March 1992
INDEPENDENT RESEARCHand
INDEPENDENTEXPLORATORY DEVELOPMENT
FY91 ANNUAL REPORT
AD- A248 331
~ I~k\~ I'I~I~ III~ 1~I 1111 IIU 1I~lI~ ________4D_
_____2 2-08838

NPRDC-AP-92-5 March 1992
Independent Research and IndependentExploratory Development Programs:
FY91 Annual Report
William E. Montague(Editor)
A 'c e F - . I
Reviewed by NTIS CRA&M 1
Richard C. Sorenson UlnK, TAB EI
Technical Director (Acting) .ia ............................
.3... .........................................Dit. ib: tion I
Approved and released by ---• ,T•-iabi•l ..
Thomas F. Finley Av- .!: - :i. c . ...co ---
Captain, U.S. Navy )I Sj)2Ci?,i
Commanding Officer
Approved for public release; distribution. is unlimited.
Navy Personnel Research and Development CenterSan Diego, California 92152-6800
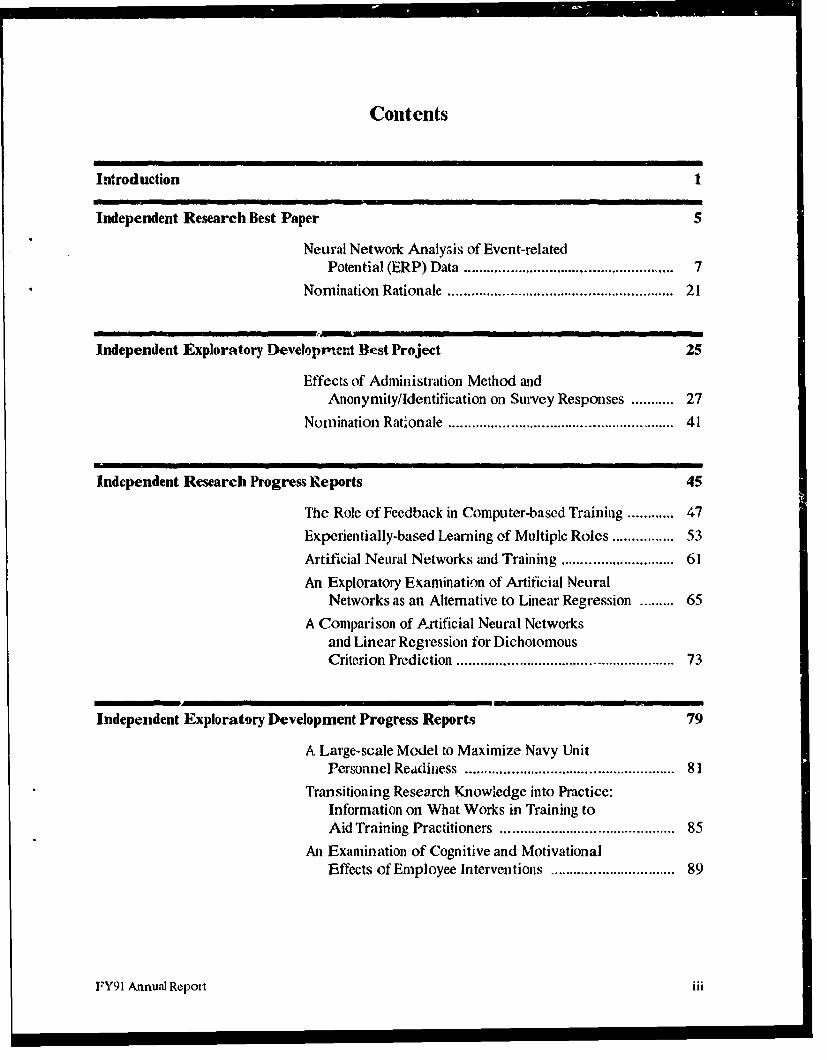
Contents
Introduction 1
Independent Research Best Paper 5
Neural Network Analysis of Event-relatedPotential (ERP) Data ..................................................... 7
Nom ination Rationale ......................................................... 21
Independent Exploratory Developm-•ent Best Project 25
Effects of Administration Method andAnonymity/Identification on Survey Responses ........... 27
Nom ination Rationale ......................................................... 41
Independent Research Progress Reports 45
The Role of Feedback in Computer-based Training ............ 47
Experientially-based Learning of Multiple Roles ............... 53
Artificial Neural Networks and Training ........................... 61
An Exploratory Examination of Artificial NeuralNetworks as an Alternative to Linear Regression ......... 65
A Comparison of A-rtificial Neural Networksand Linear Regression for DichotomousC riterion Prediction ....................................................... 73
Independent Exploratory Development Progress Reports 79
A Large-scale Model to Maximize Navy UnitPersonnel Readiness ................................................... 81
Transitioning Research Knowledge into Practice:Information on What Works in Training toA id Training Practitioners .......................................... 85
An Examination of Cognitive and MotivationalEffects of Employee Interventions .............................. 89
FY91 Annual Report iii

Independent Research and Independent ExploratoryDevelopment Programs: FY91 Annual Report
Introduction
The Technical Director encourages scientists and engineers atthe Navy Personnel Research and Development Center(NPRDC) to generate new and innovative proposals to promotescientific and technological growth in the organization and thedevelopment of knowledge and technology of interest to theNavy. Support for this is provided by discretionary fundingfurnished by the Independent Research (IR) and IndependentExploratory Development (IED) programs of the Office ofNaval Research and the Office of Naval Technology. Theseprograms support initial research and development of interest tothe Navy with emphasis on the NPRDC mission areas of theacquisition, training, and effective utilization of personnel.
Funds are provided to the Technical Directors of NavyLaboratories to support innovative and promising research anddevelopment outside the procedures required under normalfunding authorization. The funds are to encourage creativeefforts important to mission accomplishment. They enablepromising researchers to spend a portion of their th.ie onexamining the feasibility of self-generated new ideas andscientific advances. They can provide an important and rapid testof promising new technology and can help fill gaps in theresearch and development program. This may involvepreliminary work on speculative solutions too risky to be fundedfrom existing prcgrams.
The funds also serve as means to maintain and increase thenecessary technology base skill levels and build in-houseexpertise in areas likely to become important ir die future. Theseprograms contribute to the scientific base for fitureimprovements in the manpower, personnel, and training systemtechnology and provide coupling to university and industrialresearch communities.
The FY91 IR/IED programs began with a call for proposals inJune 1990. Technical reviews were provided by supervisors andscicnffic conlt.1ant', and cix 1R ?.=d f'-tmr IPD projccts werefunded. An invitation to prepare a special issue of aninternational journal, during FY91, provided an opportunity toexamine the effectiveness of a technique to help in technologytransfel: This report documents the results and accomplishments
FY91 Annual Report I
of these projects. Dr. William E. Montague administers the IRand IED programs, coordinating project selection, reporting, andreviewing to assure al innovative and productive program ofscience and technology.
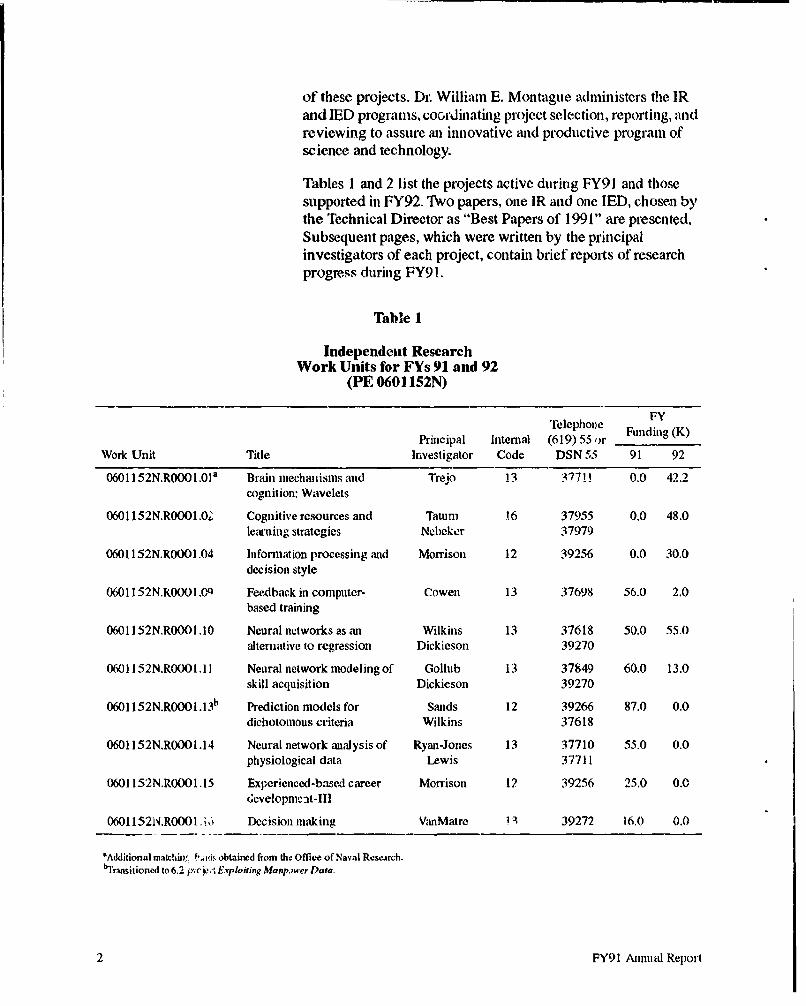
Tables I and 2 list the projects active during FY9l and thosesupported in FY92. Two papers, one IR and one lED, chosen bythe Technical Director as "Best Papers of 1991" are presented.Subsequent pages, which were written by the principalinvestigators of each project, contain brief reports of researchprogress during FY91.
Table 1
Independent ResearchWork Units for FYs 91 and 92
(PE 0601152N)
FYflelephou~e Funding (K)
Principal Internal (619) 55 ,)r 0_rWork Unit Title Investigator Code DSN 55 91 92
0601152N.ROOO.Oa Brain iechianisnis and Trejo 13 377!! 0.0 42.2cognition: Wavelets
0601152N.ROOO1.OZ Cognitive resources and Taturn 16 37955 0.0 48.0learning strategies Ncbekcr 37979
0601152N.ROOO1.04 Information processing and Morrison 12 39256 0.0 30.0decision style
0601152N.K(KOI.OQ Feedback in computer- Cowen 13 37698 56.0 2,0based training
0601152N.ROOOI.10 Neural networks as an Wilkins 13 37618 50.0 55.0alternative to regression Dickieson 39270
0601152N.ROOO1.11 Neural network modeling of Gollub 13 37849 60.0 13.0skill acquisition Dickieson 39270
0601152N.ROOOI.13b Prediction models for Sands 12 39266 87.0 0.0dichotomous criteria Wilkins 37618
0601152N.ROOOI.14 Neural network analysis of Ryan-Jones 13 37710 55.0 0.0physiological data Lewis 37711
0601152N.ROOO1.15 Experienced-based career Morrison 12 39256 25.0 0.C4evelopmcnt-Ill
0601152N.ROOOli Decision making VanMatre VA 39272 16.0 0.0
mAdditional matclh,ýi f~wid, obtained from the Office of Naval Rescarch.bl'ransitioned to 6.2 pic ,,", E.rploiting Manpower Data.
2 FY91 Annual Report
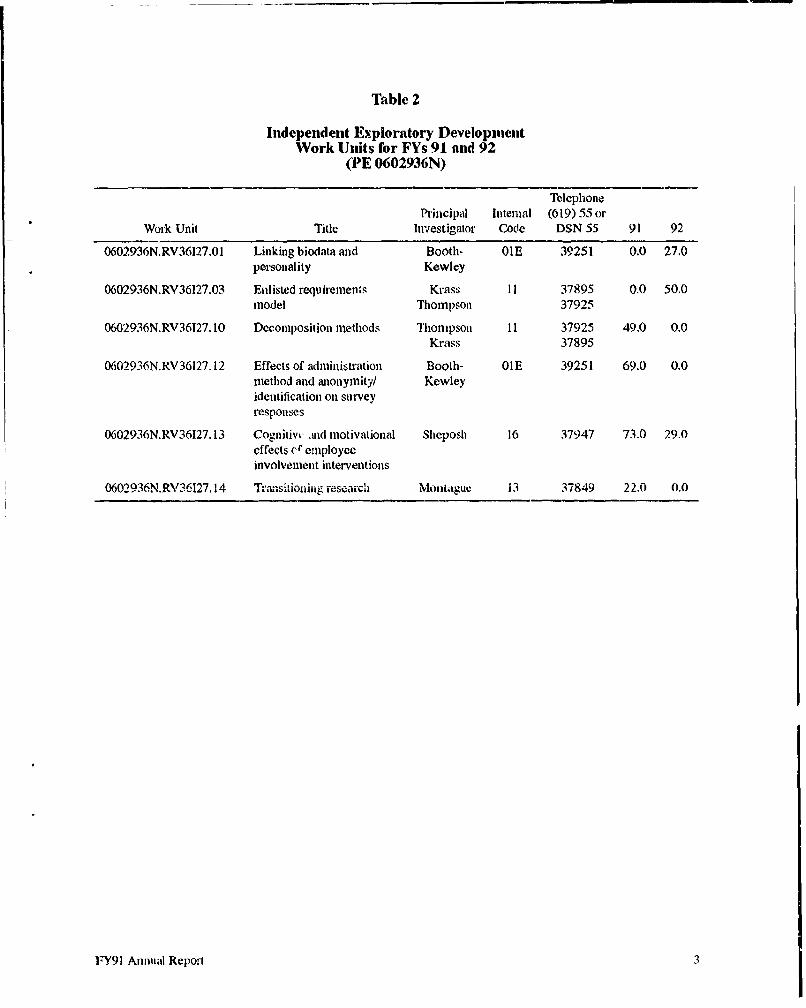
Table 2
Independent Exploratory DevelopmentWork Units for FYs 91 and 92
(PE 0602936N)
Telephone
Principal Internal (619) 55 orWork Unit Title Investigator Code DSN 55 91 92
0602936N.RV36127.01 Linking biodata and Booth- OlE 39251 0.0 27.0personality Kewley
0602936N.RV36127.03 Enlistcd requirements Krass 11 37895 0.0 50.0model Thompson 37925
0602936N.RV36127. 10 Decomposition inethods Thlompson 11 37925 49.0 0.0Krass 37895
0602936N.RV36127.12 Effects of administration Booth- OlE 39251 69.0 0.0method and anonyinity/ Kewleyidentification on survey
responses
0602936N.RV36127.13 Cognitivw ,•id motivational Sheposh 16 37947 73.0 29.0effects Co employeeinvolvement interventions
0602936N.RV36127.14 Trmsitioning research MonLt'uc 13 37849 22.0 0.0
FY91 Annual Report 3

".. .. . . .. .. .. .
"Ideenen Research
~Best Pape
FY1 imodReor
Neural Network Analysis of Event-related Potential (ERP) Data
David L. Ryan-Jones and Gregory W. Lewis
Abstract
Cortical event-related potentials (ERPs) reflect sequences ofinformation processing in different areas of the brain. ERPs aregenerated by both linear and nonlinear processes, and as a result,may be difficult to analyze. hi this research, thebackpropagation network algorithm was applied to analyses ofERP data. The results suggested that neural network techniquesoffer an improved and practical alternative to traditionalstatistical methods.
Introduiction
Recent research has suggested that cortical informationprocessing involves the activation of complex serial and parallelneural networks (Van Essen, Anderson, & Felleman, 1992).These networks may span a large numnb.r of discrete corticalareas, and these areas may 5 active for several seconds after aprocessing sequence is initiated. The actual sequence andlocation of processing can often bc inferred from thephysiological activity which results from the processing (Posner,Petersen, Fox, & Raichle, 1988). This is because the temporalsequence of brain processing at any cortical location is presumedto be preserved in the neuroelectric and neuromagneticvariations recorded at the scalp above that location (Nunez,1981). As a result, it may be possible to relate individualdifferences in patterns of cortical activity to differences in skilland ability.
There are seveial potential problems in utilizing anclectrophysiological measure, such as the cortical event-relatedpotential (ERP) to predict belavior. First, there are several ERPwaveformi components and measures that could be used forbehavioral prediction. Each component may be effected in adlifferent manner by stinmulus, task, amatomical, psychological,and physiological ,-haracteristics (Roemer, Josiassen, &Shagass, 1990). Second, there are large differences betweensubjects in the ERP waveform features elicited by any particularstimmtus. Some normal subjects may not show all of the known"waveform components, or there may be differences in the
Neural Network Analysis of ERP Data 7
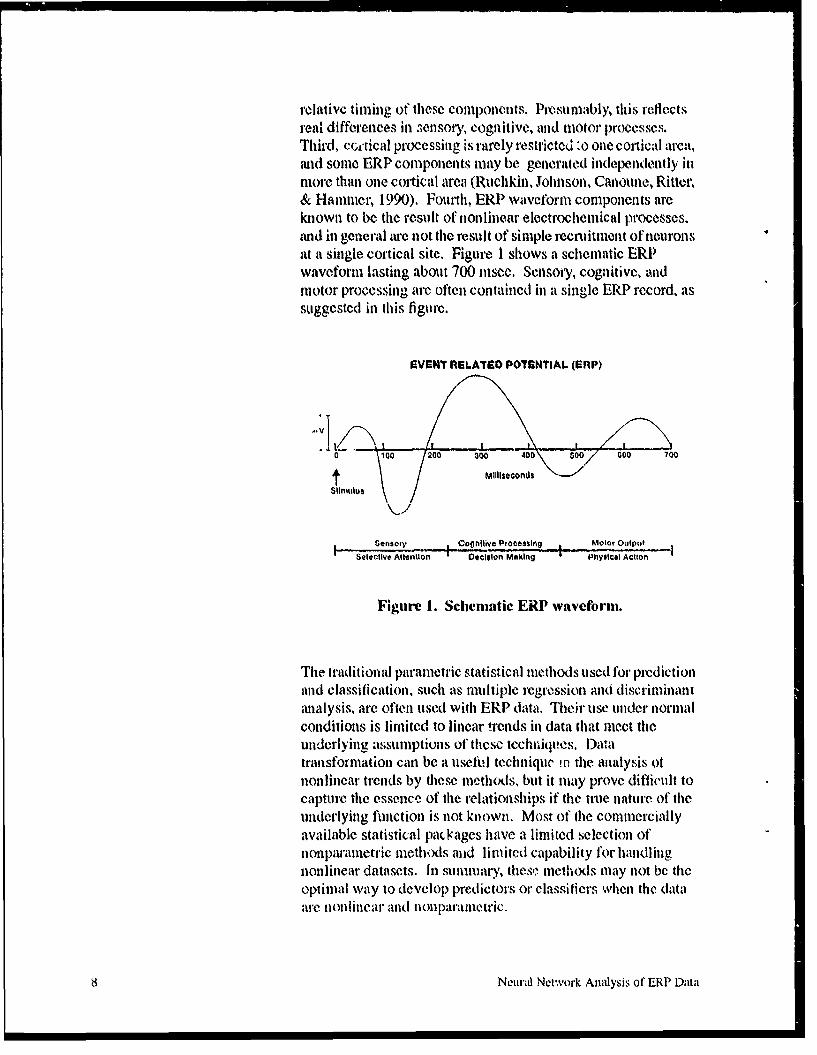
relative timing of thesecComponlenlts. Presumably, this reflectsreal differences in sensoty, cognitive, and motor processes.Third, crw-tical processing is rarely restricted :o one corticail arc.%,anid some ERP component% may be generated independently it]more than one cortical areai (Ruclikin, Johnson, Canoune, Ritter,& Hammner, 1990). Fourth, ERP waveform components areknowni to be the result of nonlinear electrochemical processes.anid in general are not the result of simple recniftnient of nouronsat a single cortical site. Figure 1 shows a schematic ER1Pwaveformi lasting about 700 nisce. Sensory, cognitive, Luid
motor processing arc often contained in a single ERP record, assuggcstcd in this figure.
EVENT RELAYED POTENTIAL (ORP)
0 110 /2001 110 40D \"600/ 600 700
SnoyCognitive Processing Molar Output
Selective Attentin Dson' Making PhysicalAction~
Figure 1. Schematic ERP ivavctorni.
The tradlition al parametric statistical mnethods usedl for predictionand classification, Such as multiple regressionl And discrimliinantanalysis, are often used with ERP data. Thecir use uinder normalconditions is liraited to linear tronds in data that mieet theunderlying assumptions of these ticchi-iques. D~atatranlsformation canl be a useful technique in the analysis otnonlinear trends by these mnethodIs, but it may prove difficult tocapture the essence of the relationships if the tine nature of theundlerlying fullctionl is not known. Most of thie commferciallyavailable statistical packages have a limited selection ofnonparamnetric miethods and limnited capability for handlingnonlinear datasets. InI summary, these. mnethod~s may not bc theoptimial way to dev'elop predictors or clasgifiers when the dataare nionlinlcar and 11oilparaIluetric.
8 Neurald Network Analysis of ERP Data
One technology that has been used in recent ya,'Us :0 deal withcomplex datasets is the artific-ial neural network. An artificialneural network can be described as a hardware or softwaremodel that mnimics the computational ability of real neurons.such as leamning and memlory (Marnt, 1990). Tlhere ire manydiftbrent typos of network algorithims, mid each can be describedin ternis of the input and output characteristics, number of layers,nodal connections, training method, and leatrmin1 parameters(Dailey & Thompson, 1990). Artificial neurons or nodes can be-ither fully or partially interconnected to other layers of nioies,and these interconnections may be forward, backward, or lateral.depending upon the au'chitecture of the network. Informationthat is passed to another node may be transformed and weighted.It is typically the values of the connection weights that aremoiftied during the learning process. Network methods canwork well With linear inptit-output relationships, and nonlinearrelationships can be captured by a variety of transformationfunctions, including logistic. gaussian, and step functions.Neural networks can "learn" the conect associations betweeninput and output by one of several self-modification algorithmsor learning rules (Zeidonberg, 1990).
Neu-a- network- aloi t .... b s.......u... ap. i e. to _variety of real-wo-eld problems, including feature classification,adaptive control, signal filtering, image compression, neuralmodeling, evaluation of bank loans, airline flight schedulingg,mnd production control. In gencral, the network -olutions tothese applications were shown to work at least as well assohitions derived from statistical methods or expert jiidgnk'elit.One advantage of neural network techniques is that they do notrequire many assumptions abot the nature of the relationshipbetween the predictor variables and the behavioral criteria. Oneof the most widely used and best understood network algo-ithmsis the backward error prolp:•ation. or simply backpi-olpagationlnetwork (Wasserman, 1989). 'Fle relationship betweenbackpropagation and more traditional statistical techniques hasbeen reviewed (White, 1989a). Leaming in a backpropagationnetwork with continuous input data, logistic data transformation,and only input and output layers is analogous to nonlinearmultiple regressioii. The two techniques are best viewed asaltemaiive statistical methods for solving the least squaresproblem (White, 1989b). It has also been shown thlwtb:ickpiropagation ne.works can estimate the optinmal Bayesiandiscrtiniaiant flulction., and, under certain conditions, the outputof the netwerk represents the a posteriori probability of classmembership (Wan. 1990: Shoemaker, 1991).
Neural Network Analysis of ERP Data 9
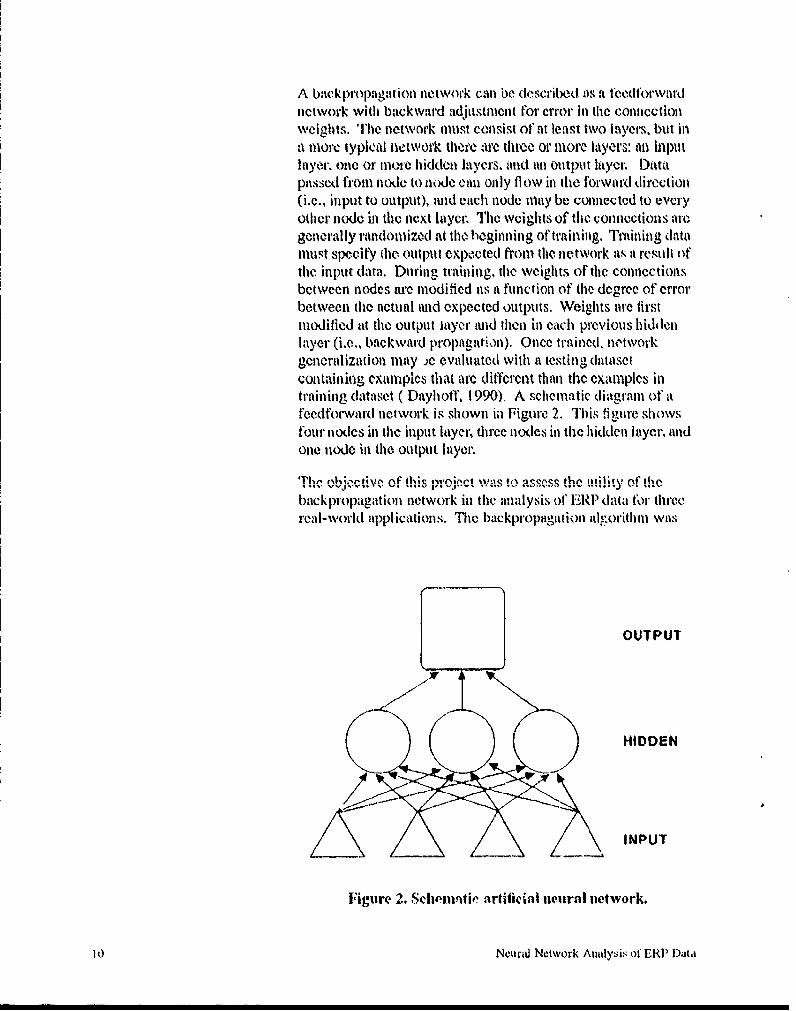
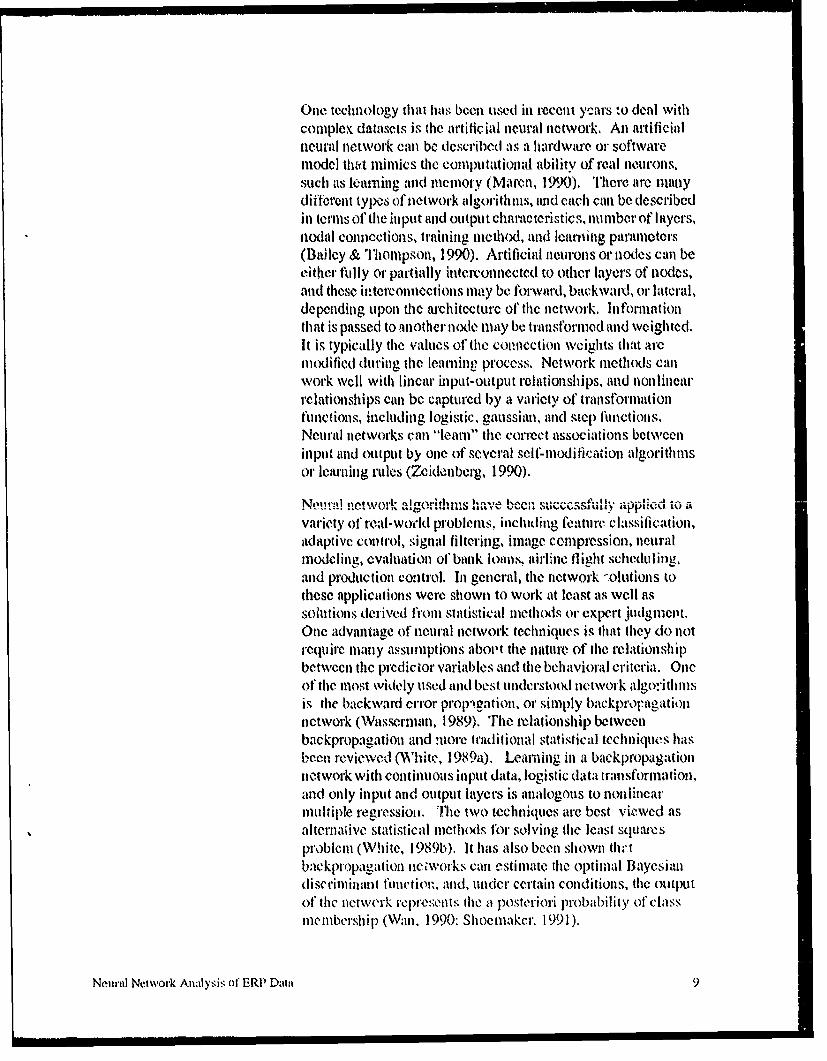
A backptropagaiton network can be described a)s a tccdf(lwtarW dnetwork with backward adjlustment for error in the connectionweights. I'he network must consist of at least two layers, but ina more typical network there are three or more layers: an inputlayer, one or more hidden laecrs. and an output layer. Datapassed from node to node can only flow hi the forward direction(i.e., input to output), aid cach node may be connected to everyother node bi the next layc. The weights of the connections aregenerally rauldomized at the beginning of training. Trailing datamust specify (lie output expected from the network a', a result ofthe input data. During training, the weights of tie connectionsbetween nodes are modified as a function of the degree of errorbetween the actual and expected outputs. Weights are firstmodified at the output layer and then in each previous hiddenlayer (i.e., backward propagation). Once trained, networkgeneralization mllay .e evaluated with a testin( datasetcontaining examples that are different than the examples intraining dataset ( Dayhoff, 1990). A schematic diagram of afccdforward network is shown ia Figure 2. This figure showsfour nodes in the input layer, thrce nodes in the hidden layer. andone node in the output layoer
The1 objpctivce of this p- .'t as to) asscss the fe; *I%l)ackpropagation network in the analysis of ERI, data for threereal-world a)pplications. Thil backpropagation alg.-orith i was
OUTPUT
HIDDEN
IN PUT
Figure 2. Sclle!1itie artificial netiral network.
1 0) Nound Network Analysis of ERP D)ata
'elected tor this project because of its success il previousapplication studies, commercial availabi lity of the software. andthe high level ofunderstanding of the workings of tie .alorithmin the seicitific conummnity. Specilically, the areas of' interest forthe piroject Were: (1) real-time pertor-mance 1noniloring aundcontrol in humami-nachinc systems. (2) identification ofindividuals from brainwave pamterns. and (3) prediction of rillema'ksmanship fiom performance onl a laboratory simulationtask. In tie studios that follow, a coinnerfeilly availablebackpropagation network software package running on a 20Ml-z, 386-baseci, IBM compatible personal computer was used.
Real-time Perforniantice Moitilorinlig
Real-time adaptive control of miachine activity, based uponbehavioral and physiological responses from the human in tlhesystem. has been Wm elusive goal ofengitneering and psychology.ERP data may be considered as one catcory of informationprocessing measures, which could potentially be utilized in anadaptive control system. However; there are several problemsthat must be solved before such a system could be considered tobe !P'r't~i"ci'l anoiwiabi~e. ERP' (itt frequenlty itave a low siani-to-noise ratio. This nletms that several samples of the: sigpalusually must be averaged together to redutce the amplitude ofuncorrelated noise. ERP data may also contain a variety ofartifhcts, such as eyeblinks and muscle activity. Since theamplitude of these ar(ifacts may exceed the amplitude of theERPR a real-time monitoring system must bc able to distinguishthese artifacts from the stimu lus-evoked neural activity, In anadaptive control system, it is important to be able to determinethe state of tile operator at any instant, perhaps fronm a single:;ample of the signal. In the tbllowing cxamples, the ability of abackpropagattion ntwork to extract arti fact and signalinformation from single samples (epochs) of ERP data was
evaluated.
E yeblink Artifact Detection
Artifacts arC comml1l1Onl in ERP data (Ryan-Jones & Lewis,1991b). Eye movements. eycblinks, and other muscle activityare dihe -fiost COImlilOIl SotlI'Ces of artifacts seen in data recortdedfromt the scalp. Eveblink artifacts are generally the large.s; ;,anll~litutde. lllwse awtifact:; aire much la0er (i.e.. Mitlivolts) thanthe typical ERP signal (i.e., microvolts), and must generally be
Neural Network Analysis of ERP DIata II
removed from the data before processing. The commonapproach is to exclude any epoch with artifacts from subsequentanalyses. Automated rejection algorithms may identify as manyas 70 percent of all eyeblink artifacts, but may also incorrectlyidentify large ERP features as artifacts. This error may be due inpart to the large differences between subjects in thecharacteristics of artifacts and waveform features. The only sureway to identify all eye movement artifacts is to monitor eyemovement activity with a dedicated set of electrodes. This wouldnot be very practical in an operational environment. The purposeof the current analysis was to determine if a backpropagationnetwork could be trained to recognize eyeblink artifact patternsin single-epoch data recorded from standard electrode sites. Thedata used in this, and some of the following analyses, wereextracted from an existing ERP database collected from 130Marines at Camp Pendleton, CA. The Marines performed a 400trial, two-letter visual discriminatioi, task over a 24 minuteperiod. ERP epochs, sampled at 128 Hz, were recorded on eichtrial from 200 msec prestimulus to 1,000 msec poststimulus.Recordings were made from the mid-line frontal (anteriorassociation, Fz), central (sensory-motor, Cz), parietal (posteriorassociation, Pz), and from both hemispheres in the occipital(vision, 01 and 02) regions.
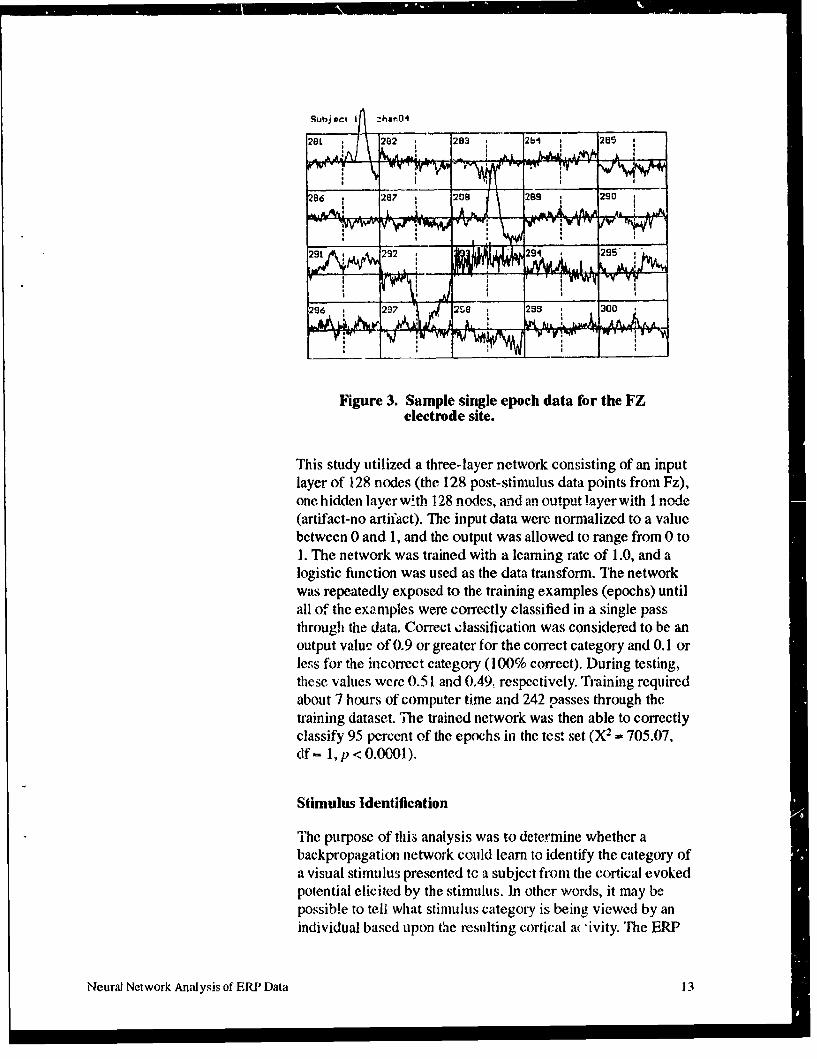
This analysis used data from five subjects randomly selectedfrom a subgroup of subjects with eyeblink artifacts on30-50 percent of the trials. Previous experience had shown thatbackpropagation networks with more than 100 input elements,and more than a few hundred training examples can take weeksor months to approximate the underlying relationships in thedata. Therefore, in order to redauce training time, not all of theavailable subjects were selected for this analysis. The dataconsisted of the 1,000 misec poststimulus interval for each of the400 epochs for each subject recorded from the most anteriorelectrode site (Fz). 'This recording site had the largest eyeblinkartifacts, compared to the other sites, due to its proximity to theeyes. Out of the 2,000 epochs, 1,000 odd-numbered epochs wereused to train the network, and 1,000 even-numbered epochswere used to test the network. This strategy was adopted becausethere are often significant changes in ERP amplitude, waveformmorphology, and eyeblink frequency over a long recordingperiod, as well as large individual differences in waveformmorphology. Therefore, both the training and testing data in thisstudy could be expected to have similar characteristics. Sampleartifact data are shown in Figure 3. Eyeblink artifacts are seen inepoch numbers 281 and 288, a large baseline artifact (negativeshift) is seen in epoch number 292, and muscle artifact is seen inepoch number 293.
12 Neural Network Analysis of ERP Data
-ubjert I "har04
28k 2'02 283 2bi 205
206 287 200 299 290
1. A. A ' A .A
* | I I, I9 ' •
29L 92 294 4295, , I,' I , PV4"Y1
296 29? 28 295 300
Figure 3. Sample single epoch data for the FZelectrode site.
This study utilized a three-layer network consisting of an inputlayer of 128 nodes (the 128 post-stimulus data points from Fz),one hidden layer with 128 nodes, and an output layer with 1 node(artifact-no artifact). The input data were normalized to a valuebetween 0 and 1, and the output was allowed to range from 0 to1. The network was trained with a learning rate of 1.0, and alogistic function was used as the data transform. "lhe networkwas repeatedly exposed to the training examples (epochs) untilall of the examples were correctly classified in a single passthrough the data. Correct classification was considered to be anoutput value of 0.9 or greater for the correct category and 0.1 orless for the incorrect category (100% correct). During testing,these values were 0.51 and 0.49, respectively. Training requiredabout 7 hours of computer time and 242 passes through thetraining dataset. The trained network was then able to correctlyclassify 95 percent of the epochs in the test set (X2 - 705.07,(If = 1, p < 0.001).
Stimulus Identification
The purpose of this analysis was to determine whether abackpropagation network could learn to identify the category ofa visual stimulus presented te a subject from the cortical evokedpotential elicited by the stimulus. In other words, it may bepossible to tell what stimulus category is being viewed by anindividual based upon the resulting cortical a( -ivity. The ERP
Neural Network Analysis of ERP Data 13
" M - M M -
waveform data for this application came from five subjects whowere asked to discriminate between 40 geometric designs and40 human faces. During performance of the task, ERP epochs,sampled at 128 Hz, were recorded from 125 msee prestimulus to825 ms poststimulus at sites F3, F4, C3, C4, P3, P4, 01, and 02.In order to reduce the dataset to a more reasonable size, thisanalysis utilized the data from one pair of sites (P4, F3). Thesetwo sites were selected because of previous studies ofhemispheric differences in the processing of facial stimuli. The2WX odd-numbered epochs were used to train the network andthe 200 even-numbered epochs were used to test the trainednetwork.
The backpropagation network consisted of an input layer with256 nodes (128 data points each from P4 and F3), one hiddenlayer with 128 nodes, and an output layer with 1 node (face-notface). Input values were normalized to values between 0 and 1and the output value was allowed to vary between 0 and 1. Thenetwork was trained using a logistic transform function and alearning ate of 0.7. Training continued until all epochs werecorrectly classifie 'l uring a single pass through the data. Duringtraining, correct classification was considered to be an output of0.9 or above if the stimulus was a face, or an output of 0.1 andbelow if the stimulus was a geometric figure. During testing,these values were 0.51 and 0.49 ,pectively. The trainingr-,quired about 72 hours of c t..er time and 2,000 passesthrough the trainiing set. TI ned network was then able tocorrectly classify 178 (89', iie epochs in the test set(X2 - 122.12, df= 1. 1- 0.0(.,, '.
Response Predir -"
The objective of this auatysis was to determine if a back-propagation network could be trained to predict whether or not asubject would make a correct or an incorrect behavioralresponse. It is possible to distinguish between correct andincorrect responses from average ERP data using traditionalstatistical techniques. However, the relatively low signal-to-noise ratio in the single epoch data effectively preventsletermination of the accuracy of the response at this level.
Since these data were to be typical of what could be expected ina real-time environment, the study did include ERP datacontaining eyeblink artifacts. The datab -.e used in this analysisconsisted of the poststimulus portior .ae epochs from thesame five subjects used in eyeblnlnk ;tion analysis. Inaddition, a flag value was added to kach epoch to indicate
14 Neural Network Analysis of ERP Data

whether or not tie epoch contained an artifact. Again, thetraining set consisted of the 1,000 odd-numbered epochs and thetest set consisted of the 1,000 even-numbered epochs.
The backpropagation network consisted of an input layer with129 nodes (128 poststimulus data points. tnd 1 artifact flag), onehidden layer with 128 nodes, and an output layer with 3 nodes(hit, miss, or no response). Input data were normalized to valuesbetween 0 and 1 and the output values were allowed to rangefrom 0 to 1. The network was trahied with a learning rate of 0.7and used a logistic data transform. Training continued until allthe epochs in the training set were correctly classified during asingle pass through the data. Correct classification wasconsidered to be an output of 0.9 and above for the correctcategory and 0.1 and below for the two incorrect categories.During testing, these values were 0.51 and 0.49, respectively.The training required about 48 hours and 360 passes though thedata. The trained network was then able to correctly classify 925(93%) of the epochs (X3 = 1036.04, df = 4, p < 0.0001).
Individual Identification
Individual identification is an essential part of any securityaccess control system. Neuroelectric and neuromagneticmeasures may offer a new method for access control. Althoughthe shape of an ERP waveform differs greatly from subject tosubject, there is considerable stability in ERP waveform shapeover time within subjects (Lewis, 1984). Therefore, it may bepossible to use ERP data for individual identification (Lewis &Ryan-Jones, 1,992). The purpose of this study was to determinewhether or not backpropagation network could be trained toidentify individuals from their ERP waveform pattern.
The ERP data, which were used in this analysis, came from 35subjects who pertfonmed the two-letter discrimination taskdescribed in the previcus section. The 400 epochs of ERP datafor each subject from site Pz were divided into eight successiveblocks of 50 epochs. Within each block of 50 epochs, the first 10epochs that were artifact-free and correct in response wereaveraged within the block to produce a total of eight ERPs foreach subject. Each ERP was then divided into 25 windows, witheach window containing 6 sampling points. The points in eachwindow were then averaged to produce a single value for eachwindow. These windowed ERPs were then used as the databasefor the neural network analysis. The purpose of windowing these
Neural Network Analysis of ERP Data 15
data was to reduce the time required to train the network byreducing the size of the network.
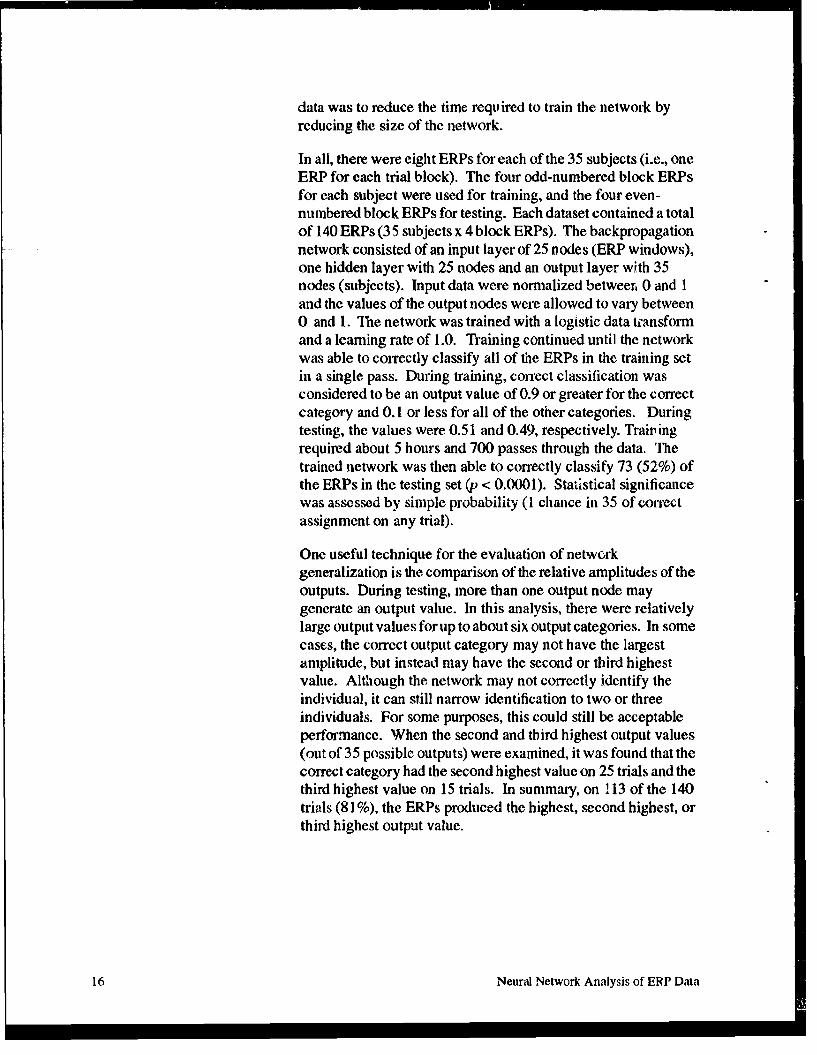
In all, there were eight ERPs for each of the 35 subjects (i.e., oneERP for each trial block). The four odd-numbered block ERPsfor each subject were used for training, and the four even-numbered block ERPs for testing. Each dataset contained a totalof 140 ERPs (3 5 subjects x 4 block ERPs). The backpropagationnetwork consisted of an input layer of 25 nodes (ERP windows),one hidden layer with 25 nodes and an output layer with 35nodes (subjects). Input data were normalized betweern 0 and 1and the values of the output nodes were allowed to vary between0 and 1. The network was trained with a logistic data transformand a learning rate of 1.0. Training continued until the networkwas able to correctly classify all of the ERPs in the training setin a single pass. During training, correct classification wasconsidered to be an output value of 0.9 or greater for the correctcategory and 0.1 or less for all of the other categories. Duringtesting, the values were 0.51 and 0.49, respectively. Trainingrequired about 5 hours and 700 passes through the data. Thetrained network was then able to correctly classify 73 (52%) ofthe ERPs in the testing set (p < 0.0001). Statistical significancewas assessed by simple probability (I chance in 35 of correctassignment on any trial).
One useful technique for the evaluation of networkgeneralization is the comparison of the relative amplitudes of theoutputs. During testing, more than one output node maygenerate an output value. In this analysis, there were relativelylarge output values for up to about six output categories. In somecases, the correct output category may not have the largestamplitude, but instead may have the second or third highestvalue. Although the network may not correctly identify theindividual, it can still narrow identification to two or threeindividuals. For some purposes, this could still be acceptableperformance. When the second and third highest output values(out of 35 possible outputs) were examined, it was found that thecorrect category had the second highest value on 25 trials and thethird highest value on 15 trials. In summary, on 113 of the 140trials (81%), the ERPs produced the highest, second highest, orthird highest output value.
16 Neural Network Analysis of ERP Data
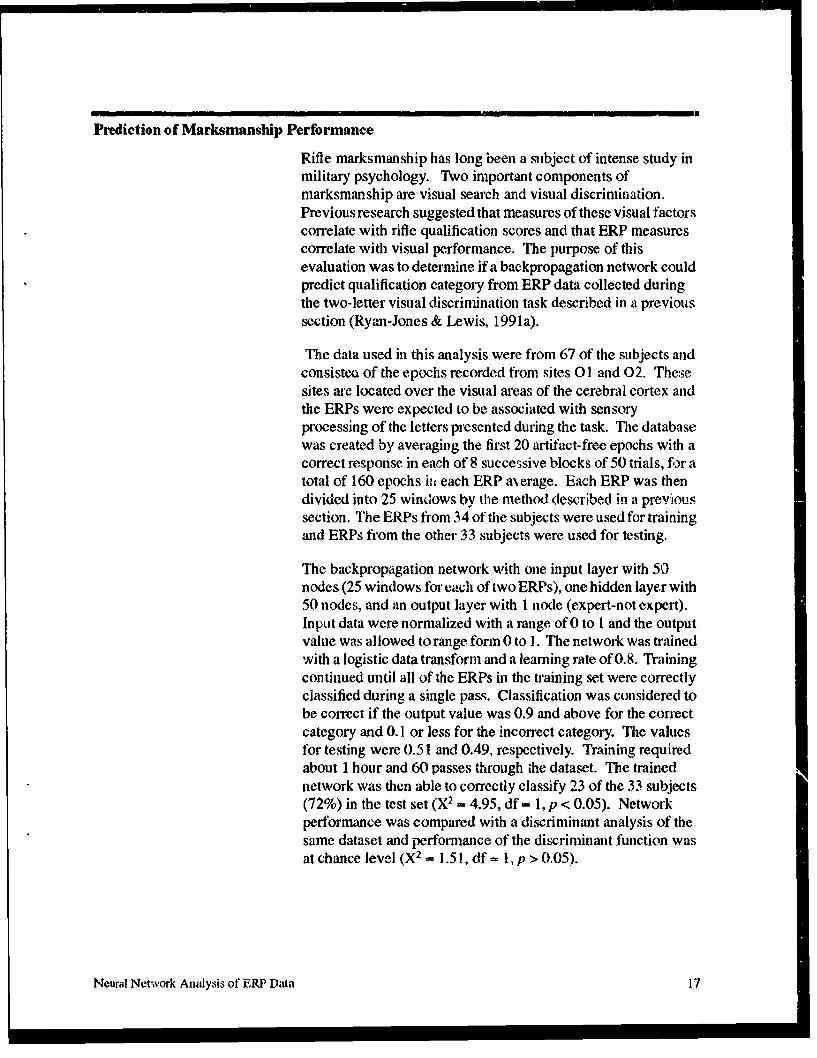
Prediction of Marksmanship Performance
Rifle marksmanship has long been a subject of intense study inmilitary psychology. Two important components ofmarksmanship are visual search and visual discrimination.Previous research suggested that measures of these visual factorscorrelate with rifle qualification scores and that ERP measurescorrelate with visual performance. The purpose of thisevaluation was to determine if a backpropagation network couldpredict qualification category from ERP data collected duringthe two-letter visual discrimination task described in a previoussection (Ryan-Jones & Lewis, 1991a).
The data used in this analysis were from 67 of the subjects andconsisteu of the epochs recorded from sites 01 and 02. Thesesites are located over the visual areas of the cerebral cortex andthe ERPs were expected to be associated with sensoryprocessing of the letters presented during the task. The databasewas created by averaging the first 20 artifact-free epochs with acorrect response in each of 8 successive blocks of 50 trials, for atotal of 160 epochs ii each ERP a\erage. Each ERP was thendivided into 25 windows by the method described in a previoussection. The ERPs from 34 of the subjects were used for trainingand ERPs from the other 33 subjects were used for testing.
The backpropagation network with one input layer with 50nodes (25 windows for each of two ERPs), one hidden layer with50 nodes, and an output layer with I node (expert-not expert).Input data were normalized with a range of 0 to I and the outputvalue was allowed to range form 0 to 1. The network was trainedwith a logistic data transform and a leaming rate of 0.8. Trainingcontinued until all of the ERPs in the training set were correctlyclassified during a single pass. Classification was considered tobe correct if the output value was 0.9 and above for the correctcategory and 0.1 or less for the incorrect category. The valuesfor testing were 0.51 and 0.49, respectively. Training requiredabout 1 hour and 60 passes through the dataset. The trainednetwork was then able to correctly classify 23 of the 33 subjects(72%) in the test set (X2 = 4.95, df = 1, p < 0.05). Networkperformance was compared with a discriminant analysis of thesame dataset and performance of the discriminant function wasat chance level (X2 1.5 1, df = l, p > 0.05).
Neural Network Analysis of ERP Data 17

ConclusionsDuring this project, the utility of a backpropagation neuralnetwork in the analysis of ERP data was assessed in threeapplication areas. In each area, neural network techniques doappear to be useful in the analysis of ERP data. There are manypositive aspects about these techniques. First, the user does nothave to make assumptions about the data other than to identifyall of the possible variables that could predict the criteria.Second, a neural network approach may be better thantraditional statistical methods for classification if there arecomplex nonlinearities in the data. A neural network with 1-3hidden layers can represent almost any function in a dataset,capturing both the linear and nonlinear aspects of the data.Finally, neural networks require minimal preprocessing of ERPdata. This means that when appropriate, raw ERP data can bethe input into the network. Once a network is trained, new datacan be classified in milliseconds. This greatly improves thelikelihood that ERP data can be collected and analyzed in nearreal-time on adaptive control tasks.
There are several potential drawbacký, in using neural networkmethods. First, selection of the appropriate network algorithmand design of the networi- may be a pr-blem. Selection of thealgorithm is constrained 1-y the database characteristics and theprojected use of the network. Design of the network can requirea great amount of experimentation to determine the optimalstructure. Second, the learning process may take a relativelylong period of time. If there are more than 100 input variablesand thousands of examples, training may literally take days orweeks. Third, very minor changes in the design of the net andthe initial conditions can make a great deal of difference in therate of convergence and in the final level of training andgeneralization. Unacceptable training or testing performancemay only mean that the network structure is suboptimal, or thatthe initial conditions need to be changed. Finally, interpretationof the structure and weighting of a trained network may be verydifficult. Weights can depend upon both the importance of aconnection and the range of the values passed over theconnection. This may place some limits on the usefulness ofneural networks for exploratory data analysis. Recently, newresearch has suggested several useful strategies for theinterpretation of connection weights (Garson, 1991). Even withthe potential problems suggested here, there are many potentialapplications of neural network techniques that this Center willcontinue to explore in the futwre.
18 Neural Network Analysis of ERP Data
ReferencesBailey, D., & Thompson, D. (1990). How to develop neural-
network applications. Al Expert, 6, 38-48.
Dayhoff, J. (1990). Neural network architectures: Anintroduction. New York: Van Nostrand Reinhold.
Garson, G. (1991). Interpreting neural-network connectionweights. Al Expert, 4, 47-51.
Lewis, G. (1984). Temporal stability of multichannel,multimodal ERP recordings. International Journal ofNeuroscience, 25, 131-144.
Lewis, G., & Ryan-Jones, D. (1992, June). Neural networkidentification of individuals from ERP patterns. Paper to bepresented at the Fourth Annual Meeting of the AmericanPsychological Society, San Diego, CA.
Maren, A. (1990). Introduction to neural networks. In A.Maren, C. Harston, & R. Pap (Eds.), Handbook of neuralcomputing applications. San Diego: Academic Press.
Nunez, P. (1981). Eiectric fields of the brain: The neuropkysicsof EEG. New York: Oxford University Press.
Posner, M., Petersen, S., Fox, P., & Raichle, M. (1988).Localization of cognitive operations in the human brain.Science, 240, 1627-163 1.
Roemer, R., Josiassen, R., & Shagass, C. (1990). Comparingprincipal components analyses of evoked potentials recordedfrom heterogeneous groups of subjects. Psychophysiology.27, 101-110.
Ruchkin, D., Johnson, R., Canoune, H., Ritter, W., & H-ammer,M. (1990) Multiple sources of P3b associated with differenttypes of information. Psychophysiology, 27, 157-176.
Ryan-Jones, D., & Lewis, G. (1991 a). Application of neuralnetwork methods to prediction of job performance.Proceedings of the Second Workshop on Neural Networks:Acadenic/Industria!/NASA/Defense (pp. 731-736).Madison, WI: Oniipress.
Neural Network Analysis of ERP Data 19
Ryan-Jones, D., & Lewis, G. (1991b). Application of neuralnetwork techniques to artifact detection and correction incortical event-related potentials. Proceedings of the SecondAnnual R&D Information Exchange Conference (NWC TS91-22, p. 57). Naval Weapons Center, China Like, CA.
Shoemaker, P. (1991). A note on least-sqbares learningprocedures and classification by neural network models.IEEE Transactions on Neural Networks, 2, 158-160.
Van Essen, D., Anderson, C., & Felleman, D. (1992).hiformation processing in the primate visual system: Anintegrated systems perspective. Science, 255, 419-422.
Wan, E. (1990). Neural network classification: A Bayesianinterpretation. IEEE Transaction on Neural Networks, 1,303-305.
Wassernman, P. (1989). Neural computing: Theory and practice.New York: VMan Nostrand Reinhold.
White, H. (1989a). Learning in artificial neural networks: Astatistical perspective. Neural Computing, 1, 425-464.
White, H. (1989b). Neral-nctwork learning and statistics. A/Expert, 12, 48-52.
Zeilenberg, M. (1990). Neural Networks in artificialintelligence. New York: Ellis Horwood.
20 Neural Ne' work Analysis of ERP Datai
Best Paper Nomination Rationale
Research MeritEvent related brain potentials (ERPs) tire seeing greatlyincreased use as research tools, in addition to clinicalapplications, for assessing sensory/perceptual, otherphysiological functions, and cognitive (decision making)processes. To date, complexity of ERP signal processing andanalysis requirements has limited the use of ERPs for manyapplications, including real-time monitoring in militaryenvironments. Neural network (NN) procedures offer potentialnew power to ERP signal processing and analytic areas. Eventhough ERP and NN research and development has bece donefor several years, the u"" of NN technology for assessing ERPrecords of cognitive processing is a very recent application.
Research Approach/Plaii/Focus/CoordiiiatioIi
The approach of this research was to demonstrate the applicationof backpropagation neural networks in three potentialapplication areas of ERP data. These included:
1. Real-time monitoring in operational systems, includingtarget recognition and behavioral response prediction.
2. Individual identification in personnel security.
3. Rifle marksmanship performance prediction.
Coordination has been maintained with the neural networkresearch community, as well as the ERP and applied researchcommunities. The relevant research literature has beenmonitored constantly.
Difficulty of Problem Addressed
Effective prediction of human performance has remained adesirable, but intractable, goal in personnel assessment. Currentas.essment techniques account for a reliable, but relativelysmall, portion of the variance in predicting job performance.This has remained so although large amounts of manpoi,,:- axidfunding have been expended over many years on researchintended to improve prediction. The new capability of assessing
Best Paper Nomination Rationale 21

cognitive processing, including decision-making and workloadthrough direct brain recordings (ERPs), shows greater promise.thmn otlier assessment techniques for improvlng performanceprediction. Cognitive processing is extremely complex even forrelatively simple tasks. Complexity of ERP preprocessing,signal processing, analyses, and subsequent application tooperational problems is great. But, it no longer remainsintractable, due to powerful new tools such as neural networkanalyses, ERP recordhigs, and brain imag'n. and mappingtechniques.
Originality of Approach
We know of no other application of neural network techniques toERP analyses for personnel assessment and peiformanceprediction.
Potential Ihpact on Navy/Center Needs
There is increased recognition of the need for improvedassessment of cognitive proessing during the performance ofmost military tasks, especially those found in CombatInformation Center environments, (e.g., EW, ASW). Withimproved assessment of personnel decision-makingrequirements and capabilities, large reductions in personnel andtraining costs will be realized. The current research hasdemonstrated several points of impact on Navy needs, including(1) research has shown that it may be possible to extract and useinformation from ERP data as feedback in adaptive training andin operational systems, and (2) research has shown that neuralnetwork techniques can identify meaningful relationshipsbetween ERP and Ferfoinanice data, which may not be obtainedby traditional statistical techniques.
Probability of Achieving Impact on Naval Needs
There is moderate-to-high risk and high payoff for improvedpersonnel assessment, training, and job performance predictionusing NN and ERP technology. Prognosis is good midprobability is increasing that these two technologies will effectNavy personnel needs in a positive way.
22 Best Paper Nomination Rationale

Punblication and llesentationsThe following papers report the results of this effort.
Ryan-Jones, D., & Lewis, 0. (1991 a), Application of neuralnetwork metlitxIs to prediction of job pertorimuice.Proceedings of the Second Workshop on Neural Networks:Acadlemi,* dustrial/NASA/Defense (pp. 731-736).Madisok .. vi: Onnipress.
Ryan-Jonim, D., t.& Lewis, G. (1991b). Application of neuralnetwork techniques to tutifact detection and correction incortical event-related potentials. Proceedings of the SecondAnnual R&D njormnation Exchange Contlrrence (NWC TS91-22) (p. 57). Naval Weapons Center, China Lake, CA.
Lewis, G., & Ryan-Jones, D. (1992, June). Neural netw'orkidentification of individuals firom ERP patterns. Pap-r to bepresented at the Fourth Annual Convention of the AmericanPsychological Society, San Diego, CA.
Ryan-Jones, D., & Lewis, 0. (in press). Neural network andERP technologies: Implications for mil!itary task and Jobpeirfolkrniance assessment. Journal of Alilitat3, Psycholog3t
Best Paper Nomination Rationale 23

Independent ExploratoryDevelopment
Best Project
IR .ED FY91 Annual Repor 2
Effects of Administration Method andAnonyniityfident ification on Survey Responses
Stepjhanie Booth-Kewkcy,, !a# :k E. Edoards. and P~aul Roseit,,feh
AbstractResearchers have sought to reduce socially desirable respondingon self-report instruments. A number of studies have claimedthat cotl)liter-adtnlitisteretd attitude aitil per.t'sal ity assessmentsresult in less socially desirable responding than do paper-and-pencil assessinents. Lautenschlager and Flaherty 's (1990) recentstudy unexpectedly found that more socially desirableresponding occun'ed on computers. The present study attemptedto replicate and extend their findings. Male Navy recruits (N -246) completed several questionnaires including the BalancedInventory of Desirable Responding (IPaulhus, 1991), a measureof impression managetielnt and self-deceptive enhiancemlent.Respondents completed the qtiestionnaires in cithler a computer-adm an istered or pap r-and-pencil condition, and weer- eitherAnonymous or Identified. The results supported Launtenschliagerand fl t•_~e't ' (1 oo11 1n,1-tn rzn lfCI,$ -1. .00,M, ,'t',lfl, hl.t
higher impr'ession manaiement and self-dcce!)tive cnlanctolentscorws than Anonymous respondents. Con trary to their results,there was no systematic differe•ice between computer aid paipei.and-pencil modes. It is concluded that computer and paper-and-pencil modes of administration yield similar respoiises onattitude questionlaires.
litroduction
Computer adehinistr,.iion of psychological and otianizationalinstruments is becoming increasingly widespr,.ad (Bertram &Bavliss, 1984). With this incivased usaige has come the idea tlatcompultcr admifnistrt ;on might reOduCe or counteract socialdesirability bias--the tendency "to stretch the auth in mu effort tomake a gool irmf ess.ion" (Martin & Nagao. 1989, p. 72). Onself-report attitude nid personality instruments (eg..psychological tests, surve)s, and questionnaires). socialdesirability is seen by soioe observers as Irivasive andproblemlatic (Mrpl.hy & Davidshoftr, 1991). Demonstrating thatcoMputle'iCe(d st-iepori alitiude 11110 perollnility instrumentselicit less social desirability bias than their paper-and-pencilCO1 lntei'partl., Wouldt aru•l for gt-eat(er elialnce oll C0om1pulter
EfflŽcis of Admillistraialion Method aid Aid o iyv/Jden( ificaiioon Snlivey RespOnISeS 27
administration, given computerized administration's many otheradvantages (e.g., ease of administration, elimination of missingresponses) elimination of data entry, automatic scoring, anditem-branching capabilities (Rosenfeld, Doherty, & Carroll,1987).
In studies comparing paper-and-pencil and computer-administered attitude and personality questionnaires, thefindings have been equivocal. Studies comparing these twoadministration modes have found that respondents completingquestionnaires on a computer admitted more anxiety symptomsand scored lower on a lie scale (Evan & Miller, 1969), reportedmore fear (Carr & Ghosh, 1983), gave fewer socially desirableresponses (Kiesler & Sproull, 1986; Martin & Nagao, 1989), andwere less likely to over-report their SAT scores (Martin &Nagao, 1989). However, other studies (Erdman, Klein, & Griest,1983; Kantor, 1991; Katz & Dalby, 1981; Lukin, Dowd, Plake,& Kraft, 1985; Millstein, 1987; Rozensky, Honor, Rasinski,Tovian & Herz, 1986; Skinner& Allen, 1983; White, Clements,& Fowler, 1985; Wilson. Genco, & Yager, 1985) have found thatthese two administration modes yielded very similar results. Forexample, Rosenfeld, Doherty, Vicino, Kantor, and Greaves(1989) found that although respondents enjoyed completing acomputerized attitude questionnaire more than a paper-and-pencil version, the means for the decision-making scale were notsignificantly different. Three recent studies (Davis & Cowles,1989; Lautenschlager & Flaherty, 1990; Schuldberg, 1988)further muddle the situation by reporting that individuals whoanswered questionnaires using a computer emitted more sociallydesirable responses and were less candid than peers using paper-and-pencil. More specifically, Davis and Cowles (1989) reportedthat individuals, in the computer condition admitted feweranxiety symptoms than those in the paper-and-pencil condition.Schuldberg (1988), similarly, found that individuals in thecomputer condition reported relatively less psychopathologythan did people in the paper-and-pencil condition.
In the most recent study comparing paper-and-pencil versuscomputerized attitude questionnaires, Lautenschlager andFlaherty (1990) had college students complete Paulhus's (1984)Balanced Inventory of Desirable Responding (BIDR). TheBIDR contains two scales: impression management (IM) andself-deception (SD), that assess socially desirable responding.IM is the deliberate tendency to over-report dcsirable behaviorsand under-report undesirable ones; whereas, SD is the tendencyto give honest but overly positive reports about one's self, SD
28 Effects of Administration Method and Anonymity/Identification on Survey Responses
differs from IM in that the respondents actually believe theirpositive SD self-reports (Paulhus, 1984). Contrary to theirpredictions, Lautenschlager and Flaherty (1990) found thatstudents using computers gave more socially desirable responseson both BIDR scales than did students completing a paper-and-pencil version. Also, students whose responses were identifiedhad significantly higher scores on both scales than did studentsin the anonymous condition. These results led the authors toconclude that computer administration of psychologicalinstruments may increase the tendency to engage in impressionmanagement.
While researchers (e.g., Kiesler & Sproull, 1986; Rosenfeldet al., 1991) have speculated as to why computers ,night reducesocially desirable responding on attitude and personalityinstruments (e.g., the computer creates an impersonal socialsetting), it is unclear why computer administration of suchquestionnaires would reduce candor and increase sociallydesirable responding. An explanation offered by Lautenschl'•gcrand Flaherty (1990) pertained to the way in which the attitudequestionnaires in their computer condition were administered. Intheir computer condition, respondents had to answer each itembefore the next item would appear, an-d they could not look at orchange earlier answers. The authors suggested that having therespondents complete the attitude questionnaires in this "lock-step" fashion may have caused them to engage in moreimpression management than would have occurred ifrespondents had been able to "backtrack."
Lautenschlager and Flaherty's (1990) findings pose a challengeto the continued administration of computerized attitude andpersonality questionnaires. As they noted, "the administration of... attitude questionnaires in organizational research may beadversely affected when converted from paper-and-pencilformat. Increases due to impression management on suchdiagnostic measures may produce inaccurate and potentiallymisleading results" (p. 314). Given that organizations willprobably increase their reliance on computers for administeringself-report instruments, there is a clear need to determinewhether responses on computerized attitude and personalityinstruments are systematically different from those obtainedwith paper-and-.pencil.
With this overall goal in mind, the present study comparedresponses of Navy recruits on the IM and SD scales using Paper-and-pencil, Computer Backtrack, and Computer No-backtrack
Effects of Administration Method and Anonyinity/ldentification on Survey Responses 29
conditions. Approximately half of the recruits answered thequestionnaire anonymously, while the other half identifiedthemselves.
Method
Subjects
Navy recruits (N = 246) completing basic training it San Diego,CA served as survey respondents. Because only male recruitsreceive basic training in San Diego, females were not includedin this study. The respondents were predominantly nonHispanicwhites (78%), with small proportions of Hispanics (10%), blacks(6%), and individuals from other ethnic groups (6%). Eachrespondent had a high school diploma or general equivalencydegree; 41 percent had also completed some college. Themajority (89%) of the respondents were single. The mean agewas 20 years.
Measures
All respondents providcd their age, race/ethnicity, education,and marital status. Respcndents answered all nondemographicitems with ratings that varied from Strongly Disagree (1) toStrongly Agree (5).
The IM and SD Enhancement (SDE) scales of the BIDR Version6 (Paulhus, 1991) were administered. Sample items from the20-item IMI scale include "I always obey laws, even if I'munlikely to get caught" and "I never cover up my mistakes." TheSDE scale is a newer version of the BIDR-SD scale. Sampleitems from the 20-item SDE scale include "I never regret mydecisions" and "My first impressions of people usually turn outto be right." Higher scores indicate greater impressionmanagement or self-deceptive enhancement. Paulhus (1991)found internal consistency reliabilities ranging from .75 to .86for IM and from .68 to .80 for SDE.
The 15-item Organizational Commitment Questionnaire(Mowday, Steers, & Porter, 1979) was adapted for Navy use, bysubstituting "the Navy" for "this organization." Mowday et al.(1979) reported internal consistency reliabilities of .82 to .93 fortheir scale. Although Lautenschlager and Flaherty (1990) did notadminister this scale, it was included in the present study
30 Effects of Administration Method and Anonymity/Identification on Survey Responses
because of its relevance to industrial/organizationalpsychologists. It was of interest to determine whetherorganizational scales that applied researchers might use wouldbe affected by administration mode.
Respondents also completed the 19-item Computer AnxietyRating Scales (CARS), a measure of computer anxiety andnegative attitudes toward computers (Heinssen, Glass, &Knight, 1987). Heinssen et al. reported a coefficient alpha of .87for their measure. The CARS was administered to make sure thatrespondents in the computer and paper-and-pencil conditions didnot differ in computer anxiety. Such a difference would make itimpossible to determine whether differences in IMISDE scoresare due to the computer versus paper-antd-pencil manipulations,pre-experimental differences on computer anxiety among therespondents, or both.
Respondents provided information that was used to check themanipulations in this study. In a postexperimental questionnaire,respondents answered items (specified in the Results) thatassessed how anonymous they believed that their responseswere, how important and interesting they thought thequestionnaires were, and how they felt while completing them.
Design and Procedure
Anonymity level and administration mode were the twoindependent variables. There were two levels of anonymity:Anonymous (i.e., explicitly told to avoid indicating name orsocial security number) and Identified (i.e., explicitly told toindicate name and social security number). The three levels ofadministration mode were Computer Backtrack, Computer No-backtrack, and Paper-and-pencil. In the Computer Backtrackconditions, respondents were allowed to backtrack within thequestionnaire and change previous answers. Respondents in theComputer No-backtrack condition could not backtrack withinthe questionnaire. Respondents using paper-and-pencil could, ofcourse, change previous responses.
Respondents in all experimental conditions were administeredthe questionnaires in groups of 10 to 20 people, as a scheduledpart of basic trainin~g. The respondents were randomly assignedto one of six conditions: Anonymous Paper-and-pencil (N - 42),Identified Paper-and-penci (N - 42), Anonymous ComputerBacktrack (N - 40), Identified Computer Backtrack (N - 40),Anonymous Computer No-backtrack (N = 40), and Identified
Effects of Administration Method and Anonymity/Identification on Survey Responses 31

Computer No-backtrack (N - 42). Not included in these cellsizes are three recruits, all assigned to Paper-and-pencilconditions who chose not to volunteer for this study.
Respondents completed the demographic items, the BIDR, andthe Organizational Commitment Questionnaire in theadministration mode (i.e., computer or paper-and-pencil) towhich they had been assigned. After these data were gathered,the CARS and the postexperiment questionnaire wereadministered to everyone in paper-and-pencil format.
The sample and cell sizes for the present study were virtuallyidentical to those of Lautenschlager and Flaherty (1990). Apower analysis indicated that the power of the present study fordetecting an effect the size of that found by Lautenschlager andFlaherty (d =.36) for IM with an .05 alpha was .93 (Cohen,1977). (A power analysis was not calculated for SDE becauseLautenschlager an; Flaherty had not predicted an administrationmode effect for this variable.)
BIDR Scoring
Paulhus (1990) has recommended two scoring methods for theBIDR: (1) a continuous scoring method in which items aresimply summed after negatively-keyed items have been reversescored and (2) a dichotomous scoring method in which one pointis awarded for each "extreme" response (i.e., -6" or "7" forpositively-keyed items and "I" or "2" for negatively. keyeditems). Because Lautenschlager and Flaherty (1990) used thecontinuous scoring method and re-plication of their study was ourmajor goal, we used the continuous scoring method. However, inresponse to a reviewer's suggestion, we also rescored the BIDRscales dichotomously. Because of the loss of informationincurred by dichotomization, we focus on the results from thecontinuous method but report results for both methods.
Results
Analyses of variances (ANOVAs) were performed to test theeffects of administration mode and anonymity level on the SDEand IM scales, These results are presented in Table 1.
Contrary to Lautenschlager and Flaherty's (1990") findings, themain effects of administration mode were not significant foreither SDE, F(2, 239) = .33, p > .05, or IM, F(2, 239) -. 12,
32 Effects of Administration Method and Anonymity/Identification on Survey Responses
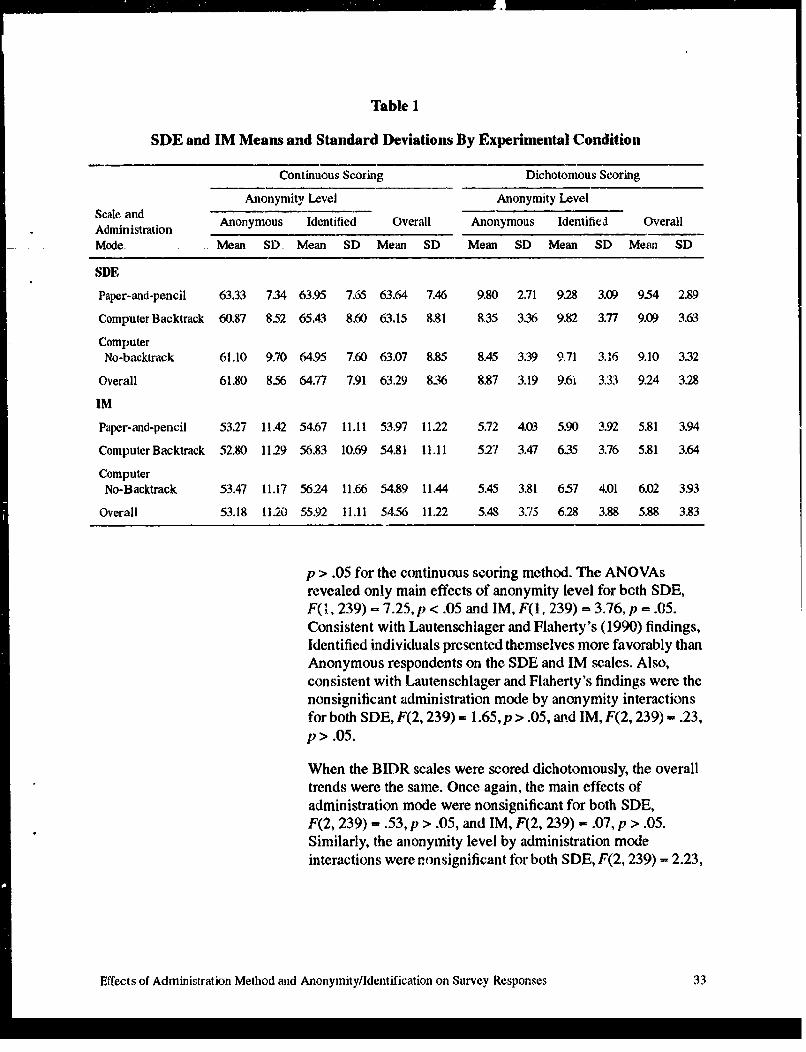
Table 1
SDE and IM Means and Standard Deviations By Experimental Condition
Continuous Scoring Dichotomous Scoring
Anonymity Level Anonymity LevelScale andAdministration Anonymous Identified Overall Anonymous Identified Overall
Mode Mean SD Mean SD Mean SD Mean SD Mean SD Mean SD
SDE
Paper-and-pencil 63.33 7.34 63.95 7.65 63.64 7.46 9.80 2.71 9.28 3.09 9.54 2.89
Computer Backtrack 60.87 8.52 65.43 8.60 63.15 8.81 8.35 3.36 9.82 3.77 9.09 3.63
ComputerNo-backtrack 61.10 9.70 64.95 7.60 63.07 8.85 8.45 3.39 9.71 3.16 9.10 332
Overall 61.80 8.56 64.77 7.91 63.29 836 8.87 3.19 9.6i 3.33 9.24 3.28
IM
Paper-and-pencil 53.27 11.42 54.67 11.11 53.97 11.22 5.72 4.03 5.90 3.92 5.81 3.94
Computer Backtrack 52.80 11.29 56.83 10.69 54.81 11.11 527 3.47 635 3.76 5.81 3.64
ComputerNo-Backtrack 53.47 11.17 56.24 11.66 54.89 11.44 5.45 3.81 6.57 4.01 6.02 3.93
Overall 53.18 11.20 55.92 11.11 54.56 11.22 5.48 3.75 6.28 3.88 5.88 3.83
p > .05 for the continuous scoring method. The ANOVAsrevealed only main effects of anonymity level for both SDE,F(1, 239) - 7.25, p < .05 and IM, F(1, 239) = 3 .7 6 , p = .05.Consistent with Lautenschlager and Flaherty's (1990) findings,Identified individuals presented themselves more favorably thanAnonymous respondents on the SDE and IM scales. Also,consistent with Lautenschlager and Flaherty's findings were thenonsignificant administration mode by anonymity interactionsfor both SDE, F(2, 239) - 1.65, p> .05, and IM, F(2, 239) - .23,p > .05.
When the BIDR scales were scored dichotomously, the overalltrends were the same. Once again, the main effects ofadministration mode were nonsignificant for both SDE,F(2, 239) - .53, p > .05, and IM, F(2, 239) - .07, p > .05.Similarly, the anonymity level by administration modeinteractions were nonsignificant for both SDE, F(2, 239) - 2.23,
Effects of Administration Method and Anonymity/Identification on Survey Responses 33
p > .05, and IM, F(2, 239).39, p > .05. The only differencebetween results from the continuous and dichotomous scoringmethods occurred for the main effects of anonymity level.Although the pattern of scores remained the same, the maineffects of anonymity level were not significant for either SDE,F(1, 239) - 3.1 8,p >.05 or IM, F(1, 239) = 2.58,p >.05, whendichotomous scoring was used.
In further support of the similarity of results for computer versuspaper-and-pencil administration of attitude scales, internalconsistency reliability coefficients for the computer versions(collapsed across Backtrack and No-backtrack conditions) of thecontinuously scored IM and SDE scales (alphas of .85, and .71,respectively) were similar to those found for the paper-and-pencil versions (alphas of .86 and .63, respectively). Finally, theintercorrelations between the two (continuously scored) BIDRscales were .43 collapsed across the two computer conditionsand .55 for the paper-and-pencil condition. (Theintercorrelations for the Anonymous and Identified conditionswere .46 and .44, respectively.) The similar but somewhat lowerintercolTelation across the computer conditions contradicted asuggestion made by one of Lautenschlager and Flaherty'sreviewers that the increased motivation to appear sociallydesirable might lead to increased intercorrelations for thecomputer condition relative to the paper-and-pencil condition.
An ANOVA was performed to test the effects of administrationmode and anonymity level on Organizational Commitment.Neither anonymity level, F(1, 238) = 1.81, p > .05, noradministration mode, F(2, 238) = .65, p > .05, affectedcommitment scores. The interaction was also not significant,F(2, 238) - .6 7 , p > .05.
Computer anxiety (CARS) scores did not vary by anonymitylevel, F(l, 241) -. 89, p > .05, or administration modes,F(2, 240) - 1.11, p > .05; nor was the interaction significant,F(2, 239) - .69, p > .05.
Analyses comparing the postexperiment questionnaireresponses for the Anonymous and Identified conditions revealedthat Anonymous respondents were less likely to agree that "Itwould be easy for someone to find out my answers to thissurvey," 4(243) = 2.10, p < .05 (one-tailed), and were more likelyto agree with the statement, "I doubt that my survey answers willever be linked with my name or any other information thatidentifies me," t(243) = 3.77, p < .05 (one-tailed).
34 Effects of Administration Method and Anonyinity/ldentification on Survey Responses
Analyses comparing the postexperiment questionnaireresponses for the computer (collapsed across Backtrack and No-backtrack conditions) and paper-and-pencil conditions showedthat respondents in the computer conditions were less likely tothink that it would be easy for someone to determine theirquestionnaire answers, F(I, 244) = 4.46, p <.05); less likely tothink the questionnaire was boring, F(1, 244) - 8.74,p < .05, andmore likely to think it was important, F(l, 244) - 4.14,p < .05.Also, respondents in the computer conditions were more likelythan those in the paper-and-pencil conditions to report feelingvery aware of their thoughts and feelings while completing thequestionnaire, F(1, 244) - 4.93 ,p <.05. Finally, in the ComputerBacktrack condition, 61 percent of the respondents backtrackedat least once; 45 percent backtracked more than once. Thenumber of times respondents backtracked ranged from 0 to 24.
Discussion
Behavioral and organizational researchers have attempted toreduce social desirability response bias in attitude andpersonality measurement using methods ranging from theassessment of physiological responses such as pupil dilation(Hess, 1965), galvanic skin response, and facial musclecontractions (cf. Petty & Cacioppo, 1981), to psychologicalmanipulations such as the bogus pipeline (a machine purportedto have lie-detecting capabilities [Jones & Sigall, 1971]). inparticular, improvements on the basic paper-and-pencil, self-report scale have been eagerly sought. The computer, it appears,has been the latest of these "holy grails." With regard to reducingsocial desirability bias in attitude and personality measurement,the computer's promise may have been greater than its delivery.The results of the present study suggest that computer and paper-and-pencil modes of administration yield similar results. Thisfinding indicates that, where financial and logisticalconsiderations allow, researchers are justified in usingcomputers instead of paper-and-pencil to gather attitude databecause of the many previously cited advantages ofcomputerized data collection.
Our results did not support Lautenschlager and Flaherty's (1990)surprising finding of increased social desirability on thecomputer. While the main effect of anonymity was replicated forboth the IM and SDE scales, there was no significant effect dueto mode of administration for IM, SDE, or organizationalcommitment. Our results also failed to support an explanation
Effects of Admnihstration Method and Anonyinity/Identification on Survey Responses 35
of•ered by Lautenschlager and Flaherty (1990) for their findings.Lautenschlager and Flaherty suggested that their respondents'inability to backtrack on the computer may have been a reasonfor their greater impression management (relative to the paper-and-pencil respondents). If true, differences in IM scores wouldhave been expected between the Computer Backtrack and theComputer No-backtrack conditions in the present study. In fact,no difference between these conditions was found.
In trying to explain why their results directly contradicted thoseof Martin and Nagao (1989), Lautenschlager and Flaherty(1990) pointed to a number of procedural and methodologicaldifferences between the two studies. A similar case could bemade to explain the results reported in the present study versusthe findings of Lautenschlager and Flaherty. For example, theyused BIDR Version 3 whereas we used Version 6. Also, theirrespondents were college students, 70 percent of whom werefemale, while the respondents in the present study were maleNavy recruits. Differences between males and females orbetween military and college populations could account for ourfailure to replicate Lautenschlager and Flaherty's results. At anyrate, researchers may need to employ less obtrusive measuressuch as response latency (George & Skinner, 1990) to betterdetermine when and for whom (e.g., see Rosenfeld et al., 1991)computers increase, decrease, or have no effect on sociallydesirable responding in attitude and personality scales.
Although researchers are often disappointed by null results,there are advantages associated with the present findings of "nodifference." Knowing that under certain circumstancescomputer and paper-and-pencil administered questionnairesyield similar means and standard deviations is valuable forresearchers and organizational practitioners faced with theoption of giving their questionnaires under one or both of theseadministration modes. Also, in the present study respondentswho used the computer found the questionnaire to be moreinteresting, more important, and felt more aware of theirthoughts and feelings than respondents who used paper-and-pencil. Other researchers (e.g., Lukin et al., 1985; Rosenfeldet al., 1989) have obtained similar results. Thus, when computer-administered attitude questionnaires yield similar scale means,standard deviations, and reliabilities, an argument for the use ofcomputers is that they are typically regarded more favorably byrespondents.
36 Effects of Administration Method mid Anonymityildentification on Survey Responses
In conclusion, the present results of no systematic differencebetween computer and paper-and-pencil responding on attitudequestionnaires are consistent with much of the publishedresearch literature. As the use of computers and computer-generated information continues to grow, and as the generalpopulation becomes further "enlightened" (Gergen, 1973) aboutcomputers' true capabilities, many of the differences that existbetween computer and paper-and-pencil administration modesmay dissipate even further. For the interim, re' earchers shouldattempt to identify the boundary and contextual conditions thatproduce differences in computer versus paper-and-pencilresponses.
References
Bertram, D., & Bayliss, R. (1984). Automated testing: Past,present, and future. Journal of Occupational Psychology, 57,221-237.
Carr, A. C., & Ghosh, A. (1983). Accuracy of behavioralassessment by computer. British Journal of Psychiatry, 142,66-70.
Cohen, J. (1977). Statistical power analysis for the behavioralsciences. New York: Academic Press.
Davis, C., & Cowles, M. (1989). Automated psychologicalteeting: Method of administration, need for approval, andmeasures of anxiety. Educational and Psychological Testing,49, 311-320.
Erdman, H., Klein, M. H., & Griest, I. H. (1983). The reliabilityof a computer interview for drug use/abuse information.Behavior Research Methods and Instrumentation, 15, 66-68.
Evan, W. M., & Miller, J. R., (1969). Differential effects onresponse bias of computer vs. conventional administration ofa social science questionnaire: An exploratorymethodological experiment. Behavioral Science, 14, 216-227.
Gergen, K.J. (1973). Social psychology as history. Journal ofPersonality and Social Psychology, 26, 309-320.
Effects of Administration Method and Anonymity/Identification on Survey Responses 37
George, M. S., & Skinner, H. A. (1990). Using response latencyto detect inaccurate responses in a computerized lifestyleassessment. Computers in Human Behavior, 6, 167-175.
Heinssen, R. K., Glass, C. R., & Knight, L. A. (1987). Assessingcomputer anxiety: Development and validation of thecomputer anxiety rating scale. Computers in HumanBehavior, 3, 49-59.
Hess, E. H. (1965). Attitude and pupil size. Scientific American,212, 46-54.
Jones, E. E., & Sigall, H. (1971). The bogus pipeline: A newparadigm for measuring affect and attitudes. PsychologicalBulletin, 76, 349-364.
Kantor, J. (1991). The effects of computer administration andidentification on the Job Descriptive Index (JDI). Journal ofBusiness and Psychology, 5, 309-323.
Katz, L., & Dalby, J. T. (198 1). Computer and manualadministration of the Eysenck Personality Inventory.Journal of Clinical Psychology, 37, 586-588.
Kiesler, S., & Sproull, L. (1986). Response effccts in theelectronic survey. Public Opinion Quarterly, 50, 402-413.
Lautenschlager, G. J., & Flaherty, V. L. (1990). Computeradministration of questions: More desirable or more socialdesirability? Journal of Appfied Psychology, 75, 310-314.
Lukin, M. E., Dowd, E. T., Plake, B. S., & Kraft, R. G. (1985).Comparing computerized versus traditional psychologicalassessment. Compuiters in Human Behavior, 1, 49-58.
Martin, C. L., & Nagao, D. H. (1989). Some effects ofcomputerized interviewing on job applicant responses.Journal of Applied Psychology, 74, 72-80.
Millstein, S. 0. (1987). Acceptability and reliability of sensitiveinformation collected via computer interview. Educationaland Psychological Measurement, 47, 523-533.
Mowday, R. 1., Steers, R. M., & Porter, L. W. (1979). Themeasurement of organizational commitment. Journal ofVocational Behavior, 14, 224-247.
38 Effects of Administration Method and Anonymity/Identification on Survey Responses
Murphy. K. R., & Davidshofer, C. 0. (1991). Psychologicaltesting: Principles and applications (2nd ed.). EnglewoodCliffs, NJ: Prentice-Hall.
Paulhus, D. L. (1984). Two-component models of sociallydesirable responding. Journal of Personality and SocialPsychology, 46, 598-609.
Paulhus, D. L. (1990). Assessing self-deception and impressionmanagement in self-reports: The balanced inventory ofdesirable responding--Reference manual for version 6.Unpublished manual.
Paulhus, D. L. (1991). Measurement and control of responsebias. hi J. P. Robinson, P. R. Shaver, & L. S. Wrightsman(Eds.), Measures of personality and social psychologicalattitudes (pp. 17-59). San Diego: Academic Press.
Petty, R. E., & Cacioppo, J. T. (1981). Attitudes and persuasion:Classic and contemporary approaches. Dubuque, IA: Win.C. Brown.
Rosenfeld, P., Doherty, L. M.. & Carroll. L. (1987).Microcomputer-based organizational survey assessment:Applications to training. Journal of Business andPsychology, 2, 182-193.
Rosenfeld, P., Doherty, L. M., Vicino, S. M., Kantor, J., &Greaves, J. (1989). Attitude assessment in organizations:Testing three microcomputer-based survey systems. Journalof General Psychology, 116, 145-154.
Rosenfeld, P., Giacalone, R. A., Knouse, S. B., Doherty, L. M.,Vicino, S. M., Kantor, J., & Greaves, J. (1991). Impressionmanagement, candor, and microcomputer-basedorganizational surveys: An individual differences approach.Computers in Human Behavior, 7, 23-32.
Rozensky, R. H.. Honor, L. F., Rasinski, K., Tovian, S. M., &Herz, G. 1. (1986). Paper-and-pencil versus computer-administered MMPIs: A comparison of patients' attitudes.Computers in Human Behavior, 2, 111-116.
Schuldberg, D. (1988). The MMPI is less sensitive to theautomated testing format than it is to repeated testing: Itemand scale effects. Computers in Humnan Behavior, 4, 285-298.
Effects of Admifistration Method mad Anonymity/Identification on Survey Responses 39
Skinner, H. A., & Allen, B. A. (1983). Does the computer makea difference? Computerized versus faco-tc-face Versus self-report assossnient of alcohol, drug and tobacco use. Journalof Consulting and Clinical PsYchology, 51, 267-275.
White, D. M., Clements, C. B., & Fowler, R. D. (1985). Acomparison of computer administntation with standardadministration of the MMPI. Computers in Human
Behavior, 1, 153-162.
Wilson, F. R., Genco, K. T., & Yager, C. G. (1985). Assessingthe equivalence of paper-and-pencil vs. computerized tests:Demonstration of a promising methodology. Computers inHuman Behavior, 1, 265-275.
40 Effects of Administration Method and Anonymity/identification on Survey Responses

Best P'roject Nomination Rationiule
Orlginality/fIechiical Merit
Computerized surveys, as substitutes for papr-and(I-plncilsurveys, are growing in popularity in military and civilianorgulizations as computer technology becomes widespread. ThebetneWits offered by computerized surveys (e.g., elimination ofmissing responses, automated data entry) em be offset byrespondents' concem that their anonymity may becompromised, affecting their responses and reducing validity.The empirical research literaturc on thuis question has beenincoilSiSteil t: SometimOS ComUptterized surveys produced lessvalid responses than paper-and-pencil surveys, Sometimes more,and sometimes they have not differed.
It is importait to resolve those differences if Computeorizedsurveys are to be used in organizational management. Thepresent research attempted to clarify the problem by replicatingand extendingi a recent major study that questioned the validityof computerized, orgamizational surveys. Most studies used
O 'ýidi~ a's sub I C Tile. preI rnt re.etdi comlpared tileresponses of Navy recnhits on either a comptterized or at paper-and-pencil survey in an applied organization aIsetti lg
Research Approach/Pla I/Focus/Coordinlatiotn
Navy recruits, split into appropriate groups, completed either apcncil-and-paper or computerized survey, Some respondedanonymously, while others were self-identified. As expected,there was an increase in socially desirable responding whenrespondents were identifiable. However, scores for theconputerized and pencil-and-paper conditions did not differ.Furthermore. the internal consistency in-iabilities of the SurveyScales wcre similar for the two conditions.
Difliculty of Problem Addressed
The ambivalence of previous research findings posed a difficultproblem for both researchers interested in survey meth Js andpractitioners who admninister ONu1.1rizational surveys. Tilhepresent study utilized an applied orlmu.zationtil settin, whilemaintaining strict experimental control, It is difficult to imiiainain
Best Project Nomijnation Raitioiale 41
such control in applied settings. Thus, a direct test of thecomparability of computer-based and traditional methods wasachieved. The experimental rigor allowed for the conclusion thatthe methods did not differ significantly.
Potential Impact on Navy/Center Needs
The Navy frequently uses organizational surveys to assessperceptions, attitudes, and behavior tendencies of personnel. Ascomputers in the workplace become more commonplace, theadministration of large-scale computerized surveys becomesfeasible. hIformation regarding the techniques needed to obtainvalid results is needed before the technology can beimplemented. The results of this exploratory research provideinformation favorable to the use of computerized surveys. Theychallenge claims that the quality of data obtained by computer isless valid than that obtained by traditional pencil-and-papersurveys.
Productivity
The effort was highly produ.ctive. The research was completedquickly. Several papers have been completed and submitted forpublication. In addition, the study can contribute directly toproductivity in conducting Navy surveys. Computerized surveyscan be more accurate, reduce labor in entering data, and provideinformation to Navy managers more quickly. Developing theappropriate techniques for computerizing surveys can haveimportant practical consequences.
Appropriateness of lED Support
The availability of computer technology to help in gatheringimportant information on Navy personnel can bring about largeincreases in efficiency. However, we must be sure that theinfomiation obtained is a valid representation of personnelresponses (i.e., that computerized method does not differ fromthe non-computerized method currently used). To help in thisprocess, this study developed computer-based survey techniquesand explored whether they obtained information comparablewith standard survey methods. Such information has importantimplications for practice in determining whether we can capturethe efficiencies inherent in computerized surveying.
42 Best Project Nomination Rationale
Publication Status
Booth-Kewley, S., Edwards, J. E., & Rosenfeld, P. (in press).Impression management, social desirability, and computeradministration of attitude questionnaires: Does the computermake a difference? Journal of Applied Psychology.
Booth-Kewley, S., Rosenfeld, P., & Edwards, J. E. (in press).Impression management and self-deceptive enhancementamong Hispanic and non-Hispanic white Navy recruits.Journal of Social Psychology.
Edwards, J. E., Booth-Kewley, S., & Rosenfeld, P. (19911Computer administration of questionnaires: Impressionmanagement and social desirability. Paper presented at the33rd annual conference of the Military Testing Association,San Antonio, TX.
Best Project Nomination Rationale 43
Independent Research
N N Progress Reports
WRIED FY91 AnnualI Report 45
The Role of Feedback in Computer-based Training
Michael Cowen
AbstractCurrent research in computer-based training (CBT) provideslittle guidance as to when feedback should be provided and howto design feedback content. An experimental CBT lesson on howto operate a military phone system was administered to 80 Navystudents. Results showed those who received delayed feedbacksignificantly outperformed those who received immediatefeedback. However, the delayed feedback subjects also spentsignificantly more time in the practice segment of the lesson.Moreover, only short term retention (i.e., immediately after thepractice) of the material was measured. The follow-on work isdesigned to replicate the outcomes controlling for practice timeand to test for long-term effects.
Introduction
Navy personnel often have difficulty operating the state-of-the-art programmable equipment employed in radar systems,communication systems, and weapon systems. These types ofdevices tend to be designed without adequate consideration ofthe user interface. Indeed, conceptual models of how the deviceworks are used in the engineering of the device but engineersoften give little thought on how the user will make it work (e.g.,pushing buttons, flipping switches). Computer-based trainingsystems have been developed to help users overcome thelearning difficulties associated with operating these types ofdigitally controlled devices. Computers are used to teach deviceoperation because they provide a safe environment for users tolearn about how to operate equipment without endangeringthemselves and others or harming the equipment.
Feedback to student responses is an important design feature ofCBT. Feedback provides information to the student about thecorrectness of the student's knowledge of the device procedures.Feedback is implemented unsystematically in current CBTsystems. Although meta-analyses have demonstrated thatcomputerized instruction can improve student achievement,there is no clear indication from the literature as to when andhow much feedback should be provided during CB'I The
The Role of Feedback in Computer-based Training 47
objective of this effort is to determine how manipulating thetiming and the content of feedback in CBT affects learning tooperate a digitally controlled device.
Two theories of cognition and skill acquisition, ACT* theoryand instructionless learning have different implications for whenand how much feedback should be provided during CBT. ACT*(adaptive control of thought) is a theory that describes thelearning of procedures. ACT* is a theory of cognition and skillacquisition based on production systems. A production system isa hierarchical set of mental tasks consisting of condition-actionpairs called productions. The condition-action pairs representspecific mental and physical actions that should occur if aparticular state occurs in working memory. Implications ofACT* are that feedback that provides the correct response to astudent error should be more effective than feedback in the forma "you are wrong" statement, and immediate feedback should bemore effective than delayed feedback.
Instructionless learning, a type of discovery learning, suggeststhat users can learn how to work a digitally controlled devicewithout the benefit of any written or verbal instructions. Usersfigure out how to work a device by discovering device behaviorsas a result of user actions. During instructionless learning, thestudents form hypotheses about the syntax and semantics of thedevice switches, buttons, and dials. Implications ofinstructionless learning are that feedback in the form of a "youare wrong" statement as a response to a student error should bemore effective than feedback that provides the correct response,and delayed feedback should be more effective than immediatefeedback.
During the base effort, experimental computer-based trainingwas administered to 80 Navy students. Instruction on how tooperate a digitally controlled device was presented individuallyon an Apple Macintosh microcomputer using "HyperCard"-typesoftware. This lesson used a modified drill and practiceinstructional strategy. The lesson had three parts: introduction,drill, and performance test. The introduction presented sonicgeneral information about the digitally controlled device. Itlisted the features of the device and presented the name andlocation of each of the device's buttons. It did not present anyinformation on how to work the device.
During the drill, the subjects received training on eight devicetasks. Drill consisted of practicing each task by "clicking" witha mouse on a computerized graphic representation of the device.
48 The Role of Feedback in Computer-based Training
The graphic representation had 16 active buttons. If an error wasmade, the CBT system provided feedback. There was fourfeedback conditions: immediate confirmatory feedback,immediate correckive feedback, delayed confirmatory feedback,and delayed corrective feedback.
Immediate feedback was defined as feedback provided theinstant an error was made by the subject. In the immediateconfirmatory feedback condition, feedback was a "wrong"indication by the computer to an error. In the immediatecorrective feedback condition, feedback was a presentation of asingle correct operation to an error. Also, in the immediatefeedback conditions the subjects could not move to the next stepuntil the correct step had been clicked. After all the correct stepshad been entered for that task, the subject proceeded to the nexttask (i.e., activating another feature).
Delayed feedback was defined as feedback provided at the endof button-pushing for that task. End of button-pushing wasspecified as a click on a "done" button that was located on thegraphic representation. The subject clicked the "done" buttononly after he had clicked a sequence of button-pushes that mighthave activated the target task. The subjects could not move to thenext task until the correct sequence of steps has been entered. Inthe delayed corrective feedback condition, feedback was apresentation of the entire correct sequence of steps for that taskas a response to any error in the entered sequence. In the delayedconfirmatory feedback condition, feedback to student errors wasa listing by the computer of the entered steps that were correct interms of whether that keypress was a component of that task andwhether that keypress was entered at the correct step.
During the performance test, the subject was asked to performeach of the device tasks on the graphic representation of thedigitally controlled device. For each item, the subjects wasrequired to click a sequence of button-pushes and then click onthe "done" button. The items of the performance test wasdifferent than the items practiced during the drill. The number ofitems correct and the subject's time on each item was recorded.Control subjects were also tested. The control group wasadministered the introduction and performance test portions ofthe lesson, but not the drill.
Results from the base effort showed that those who receiveddelayed feedback significantly outperformed those who receivedimmediate feedback. However, the delayed feedback subjectsalso spent significantly more time in the practice segment of the
The Role of Feedback in Computer-based Training 49
lesson. Indeed, increased practice time may be a desiredcharacteristic in the design of CBT. However, an experiment inwhich the subjects in all the conditions have equal practice timemay provide a more appropriate test of feedback in CBT.Moreover, only short-term retention (i.e., immediately after thepractice) of the material was measured. It is unclear whetherthere was any long-term effects for delayed feedback. Thefollow-on work is an attempt to replicate the outcomes found inthe base effort controlling for possible confounding variables.
Progress and Plans
Segments of the computer-based training developed for the baseeffort were revised so that the practice time would be increasedduring the CBT with immediate feedback and decreased duringthe CBT with delayed feedback. Practice time during CBT withimmediate feedback was increased by requiring the subjects inthis condition to practice each task twice.
Practice time during CBT with delayed feedback was decreasedby showing these subjects how to do a task before they practicea task. Other features of CBT with delayed feedback were alsomodified in order to decrease practice time. These included notforcing subjects to start at the beginning of the task each timethey wanted to redo a step (an "erase last entry" feature was,mplemented) and the use of only corrective feedback. In thebase effort, it was found that the delayed condition withconfirmatory feedback used significantly more practice timethan the delayed condition with corrective feedback. It should benoted that these two groups performed about the same on thepost-test.
In total, the follow-on study tested five conditions: threeimmediate corrective feedback groups and two delayedcorrective feedback groups. The immediate feedback conditionsconsisted of (1) a condition identical to the immediate correctivefeedback treatment used in the base effort, (2) a conditionidentical to the first using two practice trials, and (3) a conditionidentical to the first with the addition of having these subjectsshown how to do a task before they practice a task. The delayedfeedback conditions consisted of (4) a condition identical to thedelayed corrective feedback treatment used in the base effortwith the addition of the "erase last entry" feature., and (5) acondition identical to the fourth with the addition of having thesesubjects shown how to do a task before they practice a task.
50 The Role of Feedback in Computer-based Training
Also, the follow-on study added a second administration of thepost-test 24 hours after the experimental CBT.
The revised experimental CBT has been administered toapproximately 150 Navy students awaiting instruction at sonartechnician "A" school. Data analysis is underway. Results willbe published in an NPRDC technical report.
Expected Benefit
In addition to substantially incrementing our knowledge of howpeople learn to operate digitally controlled devices, this effortmade a considerable step toward designing a practical system tbrtraining. For a digitally controlled device of reasonablecomplexity, a low-cost simulation was implemented. Althoughsome feedback groups performed better than others, all feedbackgroups significantly outperformed the control group. Therefore,with appropriate attention to implementation, this computer-based instructional system could impact the performance of aNavy system.
Publications and Presentations
Cowen, M. B. (June, 1991). Computer-based training (CBT)foroperating a digitally controlled device: The role offeedback.Paper presented at the fourth Navy IR/IED symposium,Laurel, MD.
Cowen, M. B. (July, 1991). The development of a computer-based instructional simulation for operating complexelectronic products. Paper presented at the fifth annual adultliteracy and technology conference, Costa Mesa, CA.
Cowcn, M. B. (October, 1991). A comparison oflobur types offeedback during computer-based training ((CBT) (NPRDC-TR-92-2). San Diego: Navy Personnel Research andDevelopment Center.
The Role of Feedback in Computer-based Training 51
Experientially-based Learning of Multiple Roles
Robert F. Morrison
AbstractThe primary source of learning a job is the job itself, but little isknown about the factors that enhance or inhibit such experience-based learning. Preliminary research has demonstrated thatexperience-based learning of a new, middle-managementposition is influenced by the characteristics of the individual,job, immediate work context, and more macro work and non-work environment. While these factors have been shown toaffect the total position, it would be anticipated that differentones may be salient in the learning of some job roles but notothers. The objective of this research is to contrast the predictorsets of variables for each of 11 middle-management job roles.The results will be used to supplement the model of experience-based learning (EBL) reported previously. The EBL modelshould aid an organization that rapidly and continuouslytransfers personnel among jobs, to establish policies andpractices that optimize the learning/adaptability of the personnelbeing transferred.
Background and Problems
Preliminary research on managerial positions challenges theassumption that all effective learning must occur in a structured(classroom-like) environment. Such research indicates that themajority of learning occurs as a result of work experience(Brousseau, 1984; Fleischman & Mumford, 1989; Hall, 1991;McCall, Lombardo, & Moiltson 1988; Morgan, Hall & Martier,1979; Vineberg & Taylor, 1972). While a model andprope,.tions covering an entire career have been proposed(Morrison & Hock, 1986), the attributes of its components werenot defined in detail. This definition is imperative to theadequate explication of the career development process.
The speed with which experienced personnel (surface warfaredepartment heads) learn a totally new position during anassignment appears to be influenced by a multitude of factors(Morrison & Brantner, in press). These factors includeindividual-differences, job-characteristics, immediate workcontext, and more macro work and non-work environmental
Experientially-based Learning of Multiple Roles 53

effects. Further; any position consists of numerous roles thatmay be learned at different rates and may be affected by differentfactors. It would be very useful in the development of theory asweil as application to establish if the factors that influence thelearning of different roles are significantly different.
A plethora of demands (e.g., joint service and materielprofessional development) has forced policymakers to shortenbillet and command tours until they are frequently less than 18months. Such policies have been designed using manpower flowmodels without considering their effect on the officers'performance and career development. The fleet's personnelreadiness and the effectiveness with which support activitiesperform are affected directly by the opportunity that officershave to develop the capability to learn the requisite knowledgeand skill of each billet and to develop them beyond the level ofmastery. Tour lengths that are too short do not provide theopportunity to develop, while ones that are too long makeinefficient use of the officer force and may lower the officersmotivation to perform at a high level or learn new tasks/jobs.
Objective
Tlhe broad objective of this research is to develop a genericmodel describing the factors that influence how long it takes anindividual to develop an expert-level of skill in performingwork. The specific objective is to develop, test, and modify apreliminary model of the learning that occurs while theincumbent is in a mid-level leadership position on a surface ship.
General Approach
A literature search was used to identify: (1) the steps that anindividual goes through in learning how to perform a job to thepoint of mastery, (2) the parameters that contribute to the levelof performance at entry, and (3) the factors influencing what islearned and how quickly it is learned. This information was usedto form an initial model of the experiential learning process.
The preliminary model was revised using information acquiredfrom interviews (Morrison & Brantner, 1989). Research(Morrison & Brantner, in press) was conducted to test asituationally specific model of experiential learning for theaggregate position of department heads on surface warfare ships.
54 Experientially-bascd Learning of Multiple Roles
With the support of the Office of the Chief of Naval Operations(OP-13) and Surface Forces, Atlantk Fleet and Pacific Fleet,data were obtained from 396 department heads representing 322surface ships. These data emphasized perceptions of individualdifferences, job characteristics, context, and environment factorsplus assessments of the extent that the officers had learned eachof the 11 roles required to do their jobs. The initial analyses weredone using a sample of 324 officers in which their CO's hadreported the officers' positions on the learning curve. Since theCOs' evaluations were too skewed to use, it was decided to useonly the officers' data.
Progress
Additional data were loaded into the database enlarged the totalsample size from 324 to 396. For the purposes of this research,the usable sample size increased from 295 to 365. Thisimproved the stability of the learning curves reported by theofficers in both the first and second half of the split tour. Thenumber of officers in the single, long tour increased marginallyfrom 40 to 42, and there was no effective change in the stabilityof that group's learning curves.
Intercorrelations were high among the officers' self-ratings oftheir positions on the learning curves for the I 1 roles required inthe performance of the department head position. Suchcorrelations were high enough that the ratings could becombined additively to represent a position on the learning curvefor the over-all position. However, the shapes and/or levels ofthe learning curves are nearly all significantly different fromeach other. In addition, the predictors of position on each of the11 learning curves vary among the roles as noted below.
Independent path analyses were conducted on each of the IIroles. In each instance, only the individual differences, jobcharacteristics, context, and environmental factors that made adirect, significant contribution to explaining the variance inposition on the learning curve beyond time on the job wereretained in each model (see Table 1). While the second-levelfactors that predicted the first-level factors described in theprevious sentence were investigated, only the first-level factorsare summarized in this report.
Experieutially-bascd Lemning of Multiple Roles 55
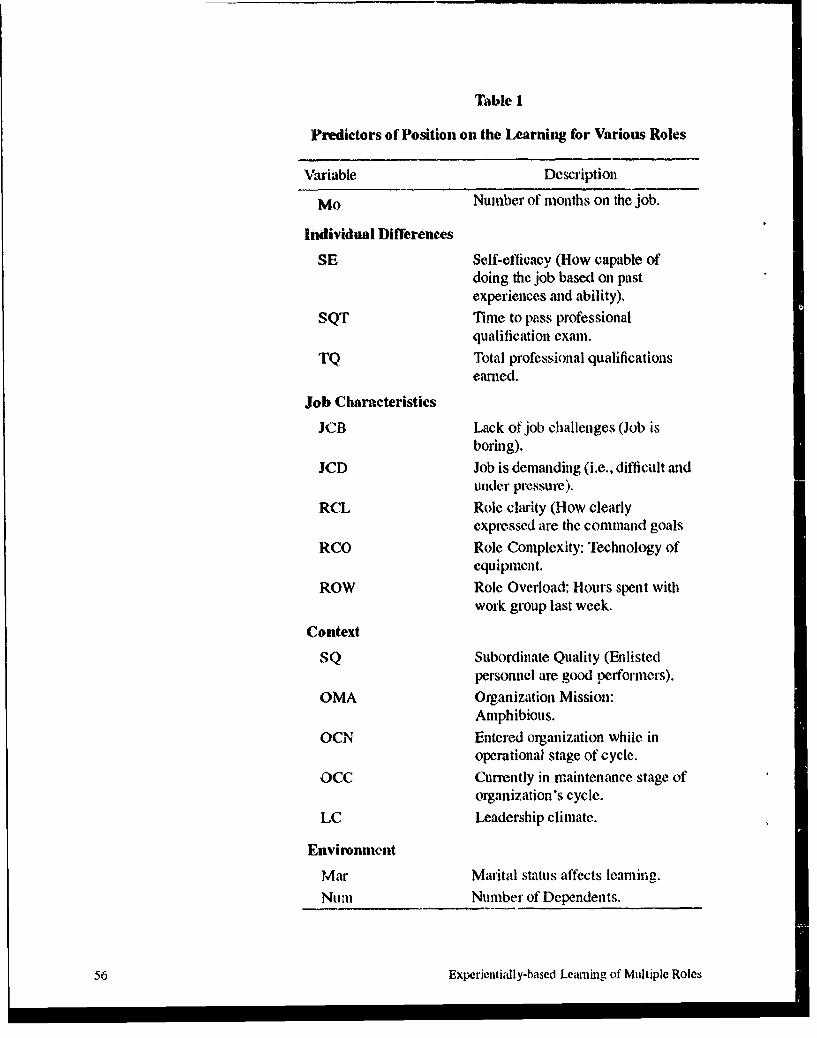
Table 1
Predictors of Position on the Learning for Various Roles
Variable Description
Mo Number of months on the job.
Individual Differences
SE Self-efficacy (How capable ofdoing the job based on pastexperiences and ability).
SQT Time to pass professionalqualification exam.
TQ Total professional qualificationsearned.
Job Characteristics
JCB Lack of job challenges (Job isboring).
JCD Job is demanding (i.e., difficult anduider pressure).
RCL Role clarity (How clearlyexpressed are the command goals
RCO Role Complexity: Technology ofequipment.
ROW Role Overload: H-tours spent withwork group last week.
Context
SQ Subordinate Quality (Enlistedpersonnel are good performers).
OMA Organization Mission:Amphibious.
OCN Entered organization while inoperational stage of cycle.
OCC Currently in maintenance stage oforganization's cycle.
LC Leadership climate.
Environment
Mar Marital status affects learning.Num Number of Dependents.
56 Experientially-based Learning of Multiple Roles
The significant first-level factors that predicted position on thelearning curves beyond tinme on the job are noted for six of the11 department head job roles (note the increase in R2 betweenthe base equation for months on the job and the full equations).
Working Relationship Roles
Iimuckdmate Subordinates - 1.56 Mo - 2.12 Mo2 + .96 Mo3
(R2 - 16)
Ininedinate Subordiates - 1.76 Mo - 2.77 M6 2 + 1.30Mo+ 11 SE +.21 JCB +. 12 RCL +.17 SQ +. 14 OMA+ .A1 OCN -. 10 Mar (R2 -. 28)
" Distal Subordinates = 1.82 Mo - 2.56 Mo" + 1.09 Mo3
(R2 =. 16)
Distal Subordinates - 1.98 Mo - 3.00 Mo2 + 1.30 MoW +.12 SE +.19 JCB +.20 SQ +.14 OCN-. 13 Mar (R2 =.28)
" Peers == 1.55 Mo - 2.29 Mo2 + 1.12 Mo3 (R2 -. 13)
Peers - 1.93 Mo - 3.26 Mo 2 + 1.69 Mo3 + .27 JCB -.13 JCD+ .12 ROW +.26 LC (R- -. 31)
Superior - .88 Mo - .63 Mo-, (R -,. i .)
Superior= .88 Mo- .65 Mo 2 +.14 SE +. 19 JCB -. 10 Mar(R2 .35)
Technical Roles
Material Condition = .84 Mo - .48 Mo 2 (R2 -. 17)
Material Condition =.85 Mo - .54 MO2 +. 13 SE -, 10 SQT+.15JCB +.12RCL +.13RCO-.IOOCC-.16 Mar+.10 Num (R. .30)
Technical Knowledge -. 75 Mo .36 Mo2 (R2 =. 18)
Technical Knowledge - .84 Mo - .47 Mo 2 + .20 SE +.17 TQ +.16JCB +.13 RCO (R2 -. 30)
'These two classes of roles provide an interesting contrast sincecognitive concerns such as the attainment of professionalqualifications and the technology of equipment are contributorsto learning technical roles but not working relationship roles.The context of the job appears te be more important in learningworkhig relationship roles, especially those with subordinates,than technical roles. Self-efficacy, job challenges, and maritalsupport are consistent predictors of enhanced learning rolesregardless of their social or cognitive content.
Experientially.based Learning of Multiple Roles 57
Plans
In FY92. confirmatory factor analysis and stnictural equationmodeling using LISREL 7 will bx applicd to thiso data. [heyshould either provide a verification of thcse results or questiontheir vwdidity.
A paper, (Morrison, In review) based on the path analyses fromthis project, has been submitted for presentation in a postersession at dte annual meeting of the Americani PsychologicalSociety.
Awards
Moirison, R. F., & Brantner, T M. (1991). What affects howquickly a new job is leined? In J. L. Wall, & L. R. Jauch(E,;.), Academy of management best paper proceedings1991 (pp. 52-56). Monroe, LA: Academy of Management.
References
Brousseau, K. R. (1984). Job-Ip.rson dytramies and careerdevelopment. Research in Personnel and 2-lumana ResourcesManagement, 2. 125-154.
Fleischman, E. A., & Mumnford. M. D. (1989). individualattributes and training pelrfornmance. n I. L. Ooldstein (Ud.),Training and development in organizotions (pp. 1813-255).San Francisco: Jossey-Bass.
Hall, D. '1 (1991). 'l\vcnty questions: Research needed toadvmice the field of careers. hi R. F. Morrison & J, Adams(Eds.), Contemnporarv issues in career de'velopment,itillAlale, NJ: Lawrence Eribaium.
McCall, M. W., Lombardo, M ' , & Morrison, A. M. (1988).The lessons of experience "fington. MA: LexingtonBooks.
Mowgln, M.. Hall. D. T. & Martier, A. (1979). Careerdevelopmient strategies in ind(llstry: Whre', are weand whereshould we be? Personnel, 56(2). 13-3 1.
Morrisoii, R. F. (in process). L'arninug work roles: Workinare lationships vary from task knowledge.
58 Exicrentially-Nased 1Learning of Multiple Roles
Morrison, R. F., & Brantner, T. M. (1989). An experience-basedlearning model: A pilot study (unpublished mnanuscript).San Diego: Navy Personnel Research and DevelopmentCenter.
Morrison, R. F., & Brantner, T. M. (in press). What enhances orinhibits learning a new job: A basic career issue. Journal ofApplied Psychology.
Morrison, R. F., & Hoch, R. R. (1986). Career building:Learning from cumulative work experience. In D. T. Hall(Ed.), Career development in organizations (pp. 236-273).San Francisco, CA.
Vineberg, R., & Taylor, E.N. (1972). Performance in four Armyjobs by men at different aptitude (AFQT) levels: 3. Therelationship ofAFQTand job experience to job performa nce(HunmRRO Tech. Rep. 72- 22). Alexandria, VA: HumanResources Research Organization.
Expeiecntially-bascd Learning of Multiple Roles 59
Artificial Neural Networks and raining
Jan Dickieson and Lew Gollub
AbstractThe development of effective training methods requirespredicting how the trainee will respond to the training procedure.At present, only qualitative models and intuitions can guide thetraining developer. A quantitative model of human behavior, asit changes through training, would facilitate the development ofoptimal training methods and materials by providing a platformfor rapidly pretesting procedures prior to a more costly field test.This project used neural network analysis techniques to developa model of the acquisition of some aspects of a Navy trainingtask (Air Intercept Controller). This model will then serve as thebasis for predicting the effects of changes in training conditions.
Rationale
The primary goal of this research project has been to develop anartificial neural network (ANN) model of learning andperformance on a Navy relevant task. Such a model can then beused to predict the effects of changes in training conditions withthe long-term goal of developing a model that can predict theeffects of novel combinations of training parameters. Thisresearch will attempt to develop a neural network model of aleamer's response to complex, demanding environmentalsituations, such as Air Intercept Control (AIC), Air TrafficControl, or Air Combat Maneuvering (ACM).
Artificial neural networks are a recently developed method formodeling complex systems. A great variety of processes havealready been modeled with this approach, including perceptvalsystems for detecting SONAR profiles, entrance criteria forUnited States Naval Academy (USNA) applicants, and financialcharacteristics of good and bad loan applicants as well asnumerous physiological and behavioral conditioning systems.The diversity of applications indicates the flexibility of theapproach.
in essence, an ANN is a collection of highly interconnectedsimple processing elements (PEs) analogous to the neurons ofthe nervous system. Each PE ;cceives one or more inputs, which
Artificild Neural Networks and Training 61
may "stimulate" or "inhibit" it. As a result of these inputs, the PEmay produce an output signal that is, itself, an input to anotherPE or the system output. An ANN model consists of a specificstructure of interconnected elements and rules governing howthe model changes. The influence of input information (similarto sensory neurons) on interconnecting ("hidden") elements andon output ("motor") elements is adjusted according to learningrules.
Although there are a number of specific findings that describethe acquisition of high-performance skills, no successful unifiedmodel of learning has been developed for this important class ofactivities. Since these situations involve changes in responsewith repeated presentation of learning scenarios, ANNs offer aplausible modeling approach, since they permit a broad range ofmodel structures and learning rules.
Relatively few studies have been reported in which ANNs havebeen used to model human or other complex behavior. However,successful attempts have modeled ACM decision making as wellas simple conditioning and discrimination learning in laboratoryanimals. Thus, it is plausible to apply ANNs to the trainingenvironment.
Approach
The AIC task was chosen for study. A trainee examines the NavyTactical Data System (NTDS) display screen, fixing a targetaircraft by moving a computer trackball, and issuing coyrmandsto a controlled aircraft to intercept (or avoid) the target. This taskinvolves a series of perceptual and fine motor responserequirements as well as complex decision-making. This taskthus demands a variety of skills. whose acquisition can be studiedunder different training conditions.
The research plan involves three phases: (1) development of asimulation of the AIC task on personal computers (PCs), so thatstudies can be perforrued on a variety of computer equipment,(2) collection of training data on simple tasks in which stimulusand response conditions car, be recorded in detail, and (3)selecting and developing a model involving stimulus and time(training) inputs for subject behaviors.
62 Artificial Neural Networks and Training

ProgressSoftware was obtained to run the task from Dr. Schneider of theUniversity of Pittsburgh. The original program written in Pascalwas recoded in C-language. Additionally, several traininglessons were written involving low-level intercept skills:hooking and intercept path estimation. The recording of traineedata was improved, so that we have a complete record showingthe state of the display, the subject's response, feedbackmessages, and time of occurrence.
We continued to review the published literature for applicationsof ANNs to learning and performance. Because ANNs have notbeen applied to skill learning situations, a thorough review ofrelated studies on simple classical and operant conditioning wasundertaken to examine points of similarity and difference fromskill learning.
Reductions in FY92 project funding after the first quarterresulted in suspending the research until funds are available.
Artificial Neural Networks and Training 63
An Exploratory Examination of Artificial Neural Networksas an Alternative to Linear Regression
Jan Dickieson and C'harles Wilkins
Abst.-actAccurate prediction of the future performance of personnel is avital piece of information, which the Navy must use to makeappropriate decisions. These predictions are most commonlymade using some type of linear-regression-based method. Thismeans that not all available information (e.g., nonlinearrelationships) are used in making predictions. Artificial NeuralNetwork (ANN) technology, on the other hand, allowsprediction models to be created, which do take into accountnonlinear relationships. This study was designed primarily toexplore the feasibility of applying neural network technology toa typical Navy problem, specifically, predicting prematureattrition from the U.S. Naval Academy. Attrition data fromvarious classes of the Naval Academy was used to predictprcmature attrition using both standard linear regression and avariety of ANN models. Under robust conditions, it was foundthat the predictive efficacy of the ANN models was superior tothat of linear regression, leading to the conclusion that ANNmodels do indeed merit additional research. Future research intohow to take full advantage of ANN technology is discussed.
Background and Problem
The Navy makes important decisions everyday about a varietyof personnel issues based, in part, upon the prediction of futureperformance. To the degree that these predictions are less thanoptimal, the resulting decisions may have an adverse impact.The most common technique used to predict performance issimple multiple linear regression. However, any nonlinearrelationships that exist in the data being studied cannot beaccounted for by simple linear regression-based procedures.Nonlinear regression techniques exist; however, these typicallyrequire a priori specification of a model of the nonlinearrelationship. Unless the form of the nonlinearity is wellunderstood, it is difficult to choose such a nonlinear model.
In recent years, new techniques have been developed in whichcomputers 'learn' the relationships between a set of variables,
An Exploratory Examination of ANNs as an Alternative to Linear Regression 65
without needing a priori information about the relationships.These techniques, called ANNs, have been applied to a widevariety of problems which include controlling robotic armmovement (Martinetz & Schulten, 1990), modelling the spelliigability of brain-damaged persons (Olson & Caramazza, 1988)and artificial intelligence problems such as learning to playbackgammon (Tesauro, 1990).
Far less research has been conducted on the efficacy of usingneural networks for prediction. Recently, a number ofresearchers have proven that neural networks (at leasttheoretically) serve as universal approximators under a widevariety of conditions (Hecht-Nielsen, 1990; Hornik,Stinchcombe & White, 1990). However, neural networks areiterative techniques, and many questions remain, such as how tobest choose the neural network configuration to use, decidingwhen to terminate the iteration process, how to best encode theinput data, etc. Therefore, in practice at least, there remain manyunresolved questions about the predictive efficacy of neuralnetworks.
This current research was designed to examine some of thesepractical issues in the context of a serious Navy probiern, namelypremature voluntary attrition from the United States NavalAcademy. The Academy is one of the Navy's most importantresources for recruiting and training top quality officers. It is anexpensive resource, however, with a 4-year course of studycosting approximately $153,000 per person (GAO, 1991). Whena midshipman prematurely attrites from the Academy, themoney that has been invested in his or her training has beenessentially wasted. In light of reduced operating budgets, it isimportant to study ways in which attrition can be reduced, sinceeven a small reduction could lead to substantial savings.
Objective
The objective of this work was to explore, empirically, theadvantages and drawbacks of using ANNs as an alternative tolinear regression techniques for various prediction problems ofconcern to the Navy, specifically predicting premature voluntaryattrition from the Naval Academy. The study was designed todetermine whether ANNs showed sufficient promise as aprediction methodology to warrant additional research into howbest to apply ANNs to Navy personnel and manpower problems.
66 An Exploratory Examnination of ANNs as an Alternative to Linear Regression
ApproachThe basic approach of this study was to develop predictionmodels using both linear regression and ANNs and to thencompare the predictive efficacy of the two methods. The studyused data from three recent classes of the Naval Academy. Thethree classes in this study will be referred to as Class I, Class II,and Class III.
The prediction models for both methods were developed usingthe seven predictors currently used by the Academy to evaluatecandidates. These variables are SAT-Verbal, SAT-Quantitative,high school rank in class, recommendations from high schoolofficials, extracurricular activity score, technical interest score,and career interest score (Wahrenbrock & Neumann, 1989).These seven predictors are currently used because they have thestrongest linear relationship with criteria of interest to theAcademy (academic performance, military performance, choiceof major, and the criterion of interest in this study--voluntaryattrition). Choosing these predictors does not take full advantageof the ANNs ability to model nonlinear relationships, but it is anappropriate initial comparison, since these are the predictorscurrently used by the Naval Academy.
The first part of this study consisted of using Class I to calculatean appropriate regression equation, utilizing the same stepwiseprocedure currently used by the Nova! Academy. This regressionequation was then cross-validated using data from Class III,which was completely independent of Class I.
The procedure for the ANN portion of the study was morecomplicated, because ANNs are trained with an iterativeprocedure, and there is no simple stopping criterion for ANNswith the type of data used in this study. Therefore, a two-phasecross-validation paradigm was developed. Six different neuralnetworks of varying characteristics were used (see Table 1).Each ANN was trained on data from Class I in increments of10,000 iterations. The ANNs were then cross-validated on ClassII at each number of iterations. These results were used todetermine the number of iterations for training, and then thenetwork was cross-validated again on Class II, which wasindependent of both Classes I and II.
Two different stopping criteria were examined in this study.Criterion A was simply the number of iterations that providedthe maximum cross-validation correlation coefficient for ClassII. Criterion B was the midpoint of the range of iterations for
An Exploratory Examination of ANNs as am Alternative to Linear Regression 67
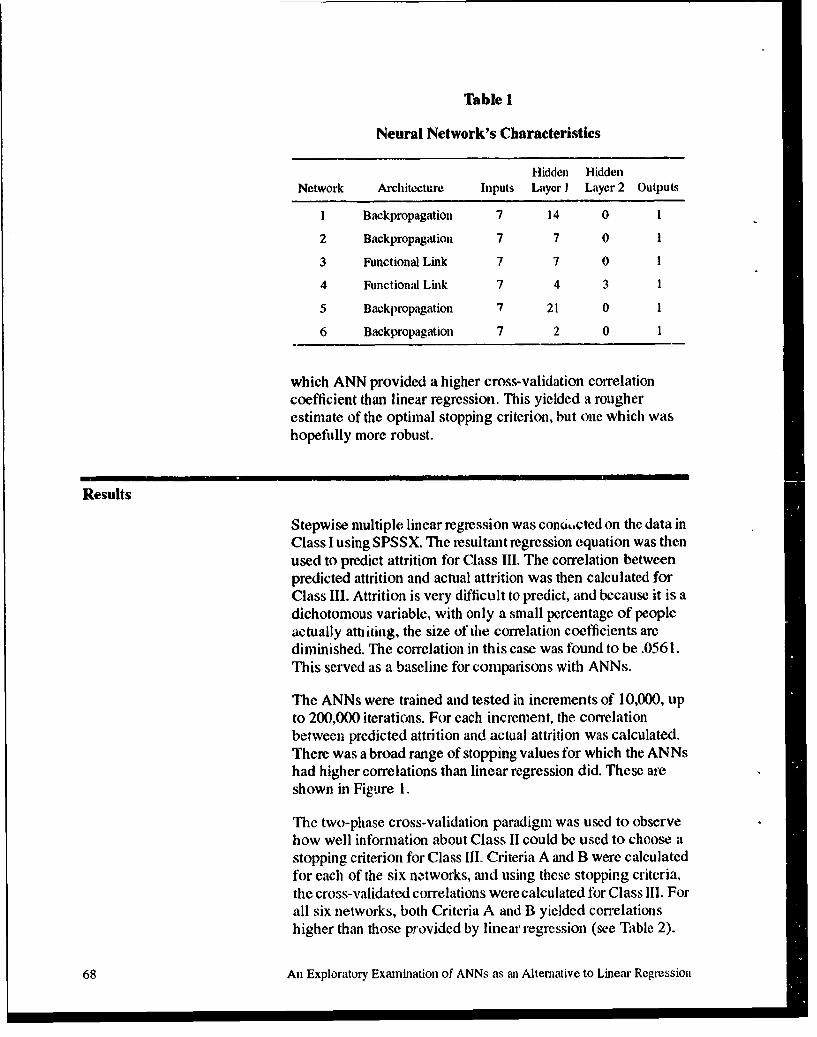
Table 1
Neural Network's Characteristics
Hidden HiddenNetwork Architecture Inputs Layer I Layer 2 Outputs
1 Backpropagation 7 14 0 1
2 Backpropagation 7 7 0 1
3 Functional Link 7 7 0 1
4 Functional Link 7 4 3 1
5 Backpropagation 7 21 0 1
6 Backpropagation 7 2 0 1
which ANN provided a higher cross-validation correlationcoefficient than linear regression. This yielded a rougherestimate of the optimal stopping criterion, but one which washopefully more robust.
Results
Stepwise multiple linear regression was con&,,cted on the data inClass I using SPSSX. The resultant regression equation was thenused to predict attrition for Class III. The correlation betweenpredicted attrition and actual attrition was then calculated forClass HI. Attrition is very difficult to predict, and because it is adichotomous variable, with only a small percentage of peopleactually attitling, the size of the correlation coefficients arediminished. The correlation in this case was found to be .0561.This served as a baseline for comparisons with ANNs.
The ANNs were trained and tested in increments of 10,000, upto 200,000 iterations. For each increment, the correlationbetween predicted attrition and actual attrition was calculated.There was a broad range of stopping values for which the ANNshad higher correlations than linear regression did. These areshown in Figure 1.
The two-phase cross-validation paradigm was used to observehow well information about Class II could be used to choose astopping criterion for Class III. Criteria A and B were calculated
for each of the six networks, and using these stopping criteria,the cross-validated correlations were calculated for Class III. Forall six networks, both Criteria A and B yielded correlationshigher than those provided by linear regression (see Table 2).
68 An Exploratory Examination of ANNs as ma Altenmative to Linear Regression
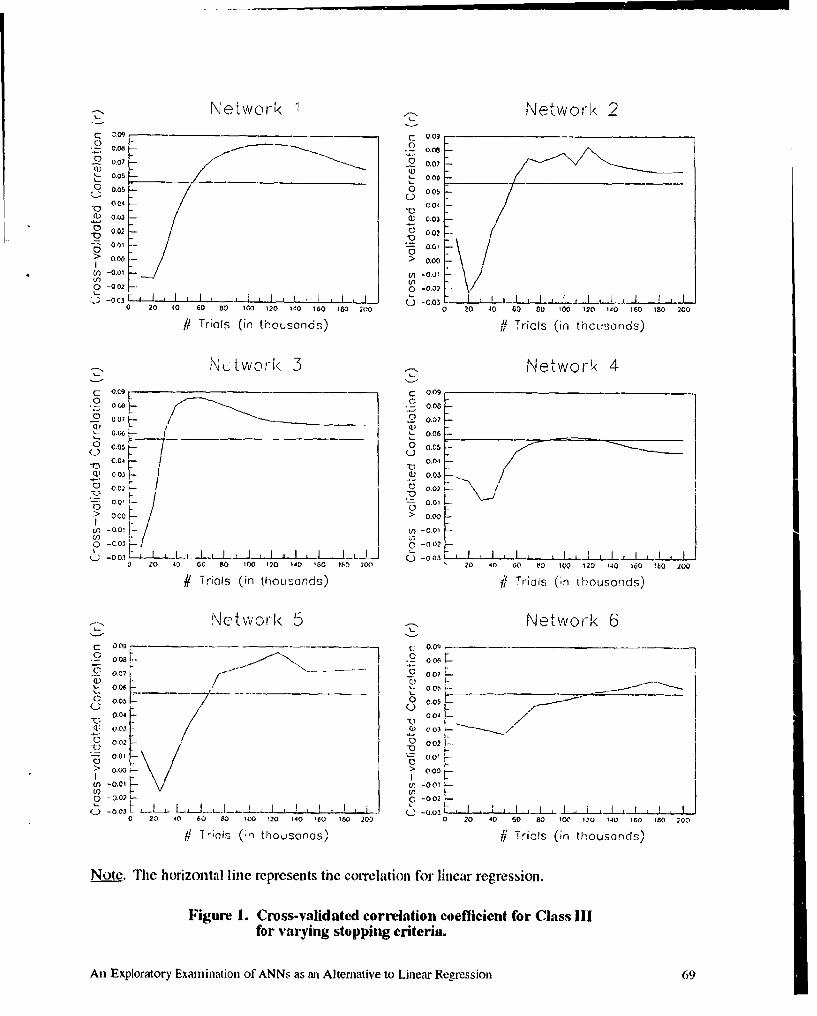
Networ• 1 Network 2o o. -- o o.o0.Zo 0 o0 2 o.o08
0.07 F- 2000.01 0.00
.- 0.o - 0 ,
,C))"0 004 H0,040L . 003 C- -.•0.02 0 02
- 0 o ,- . , 0
> 0.0 > (a00 /tO -0.01 (f) -0,01V)( - -/0 -002 0 -0.02
"-0030 20 40 60 so 100 120 1110 160 180 20.0 0 20 40 60 00 100 120 140 M6 180 200
/1 Trials (in thousands) 1, Trials (in thoWuonds)
N ctwork 3 , Network 40.419 - 0.09 -o
.2 oow- 1 9 0.00.04- 2 0.07
' 0.00 C - 0.0 0
0.04 0.03
"' 0.02 / 0.02
I-001--' 001
0 .01> 000 ~-> 0.0
0j1 -0.0 1j0 -0.01
0 .02 -. -0 02
0 20 40 G0 8io 100 120 IAO '0 O 11 200 20 40 CI0 60 'Q0 120 140 160 140 .00
# Triols (in thousands) #/ Trials (in thousands)
Network 5 - Network 6C: 0(1 DD .- 0
008 00LS L.- 007 o
0.07 0.05'- 0.06 1- - 008 4
-oo, V , _o, : 0 .1o _o01- o, -ooLi , C -. o) ,7 -_i • I _ _
0.04 0.01
> 0,00> 0.00
-0.000L
C) -. 02~ I . A -0.010 20 40 80 0 m 00 ?20 140 0 1 80 200 0 20 40 s0 80 10W 10 140 I G 16 80 200
#/ 1"riais (;n thousands) #] Trials (in thousands)
Note. The horizontal line represents the correlation for linear regression.
Figure 1. Cross-validated correlation coefficient for Class IIIfor varying stopping criteria.
An Exploratory Examination of ANNs as am Alternative to Linear Regression 69
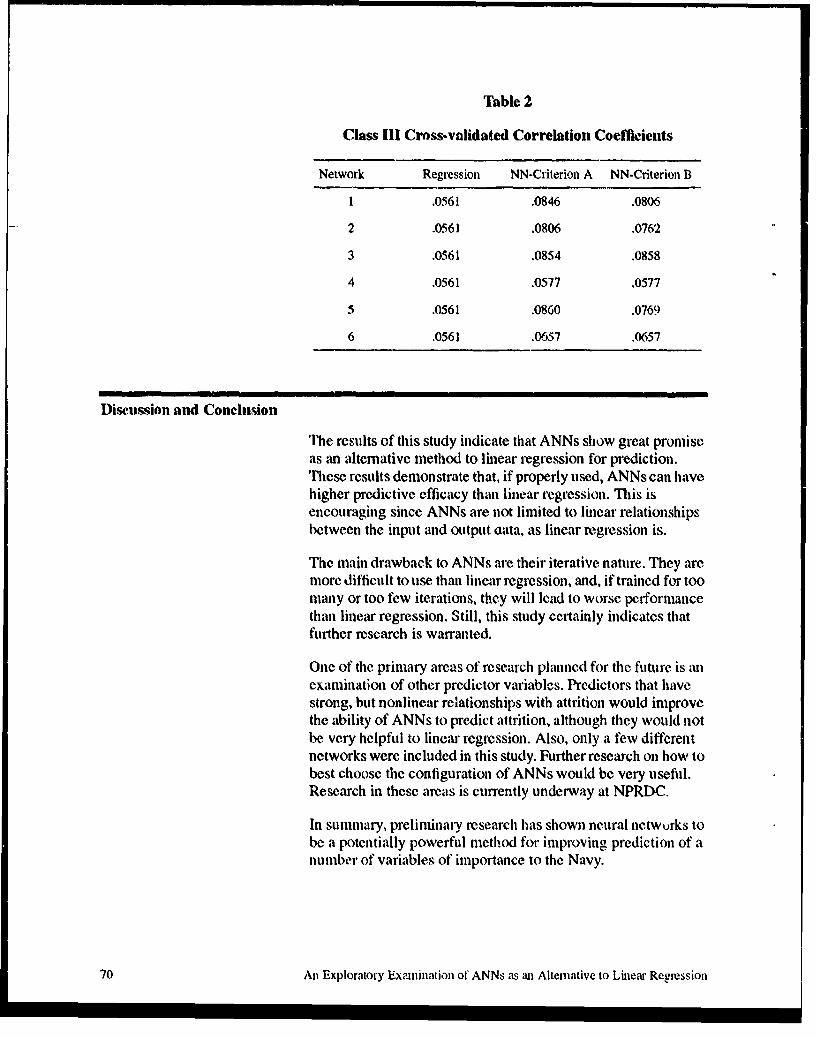
Table 2
Class III Cross-validated Correlation Coeffiients
Network Regression NN-Criterion A NN-Criterion B
1 .0561 .0846 .0806
2 .0561 .0806 .0762
3 .0561 .0854 .0858
4 .0561 .0577 .0577
5 .0561 .0860 .0769
6 .0561 .0657 .0657
Discussion and Conclusion
The results of this study indicate that ANNs show great promiseas an alternative method to linear regression for prediction.These results demonstrate that, if properly used, ANNs can havehigher predictive efficacy than linear regression. This isencouraging since ANNs are not limited to linear relationshipsbetween the input and output aata, as linear regression is.
The main drawback to ANNs are their iterative nature. They aremore difficult to use than linear regression, and, if trained for toomany or too few iterations, they will lead to worse performancethan linear regression. Still, this study certainly indicates thatfurther research is warranted.
One of the primary areas of research planned for the future is anexamination of other predictor variables. Predictors that havestrong, but nonlinear relationships with attrition would improvethe ability of ANNs to predict attrition, although they would notbe. very helpful to linear regression. Also, only a few differentnetworks were included in this study. Further research on how tobest choose the configuration of ANNs would be very useful.Research in these areas is currently underway at NPRDC.
In summary, preliminary research has shown neural netwurks tobe a potentially powerful method for improving prediction of anumber of variables of importance to the Navy.
70 An Exploratory Examnination of ANNs as an Alternative to Linear Regression
ReferencesGeneral Accounting Office (GAO). (1991). DOD service
academies: Improved cost and performance monitoringneeded (GAO/NSIAD- 91-79). Washington, DC. Author.
1-iecht-Nielsen, R. (1990). Neurocomputing. Addison-Wesley,Reading, MA.
Hornik, K., Stinchcombe, M., & White, H. (1990). Universalapproximation of an unknown mapping and its derivativesusing multi layer feedforward networks. Neural Networks, 3,551-560.
Martinetz, T., & Schulten, K. (1990). Hierarchical neural net forlearning control of a robot's arm and gripper. Proceedings ofIJCNN-90, San Diego, 2, 747-752.
Olson, A. C., & Caramazza, A. (1988). Lesioning aconnectionist model of spelling. Paper presented at Venice111: Conference on Cognitive Neuropsychology andConnectionism, Venice, Italy.
Rumelhart, D., & McClelland, J. (1986). Parallel distributedprocessing: Microstructure of cognition: Vol. 2.Psychological and biological models. Cambridge, MA: MITPress.
Tesauro, G. (1990). Neurogammon: A neural-networkbackgammon program. Proceedings of IJCNN-90, SanDiego, 3, 33-39.
Wahrenbrock, A. L., & Neumann, 1. (1989). United States NavalAcademy longitudinal officer database documentation.San Diego: Navy Personnel Research and DevelopmentCenter.
Aji Exploratory Examination of ANNs as an Alternative to Linear Regression 71
A Comparison of Artificial Neural Networks andLinear Regression for Dichotomous Criterion Prediction
William A. Sands and Charles A. Wilkins
AbstractMany important criteria in military personnel research aredichotomous or dichotomized (e.g., successful completion offirst-term obligated service vs. premature attrition). Frequently,prediction of dichotomous criteria is done using Ordinary Least-Squares Linear Regression (OLS-LR) techniques. This studywas designed to develop, evaluate, and compare alternativeprediction models for forecasting dichotomized criteria, usingArtificial Neural Network Back-Propagation (ANN-BP)technology. Computer-simulated data distributions were createdand used to evaluate the cross-validated predictive efficacy ofOLS-LR and ANN-BP under a variety of personnel selectiondecision/outcome situations. Classification accuracy, defined asthe proportion of correct selection/rejection decisions, was thebasis for comparing the two different approaches. Based uponthe higliy favorable results obtained with the ANN-BP model,the authors concluded that this approach to predictingdichotomous criteria appeared quite promising and that furtherrewarch was definitely merited.
Background and Problem
Many of the important criteria for military personnel predictionproblems are dichotomlous (or continuous variables that havebeen dichotomized). An excellent example of these dichotomouscriteria is successful completion of first tour of obligated servicevs. prenmture attrition. Thc efficacy of prediction models forforecasting these dichotomous criteria is a paramount issue inpersonnel selection research.
Purpose
The purpose of this research was to compare and contrast thepredictive utility of the OLS-LR mWlel with an ANN-BPapproach for personnel selection. Use of ANN models ,for avariety of research problems has been receiving increasingattention (Hecht-Nielsen, 1990 Khanna, 1990: McClelland &
A Comparison of Artificial Neural Networks and Linear Regression 73

Rumelha't, 1986: NeuralWanve, 1991a; Runielhiart &McClelland, 1986). Ideally, this comparison should provideresults that will allow generalization to a diverse set of personnelselection situations. This goal suggested the use of computer-simulated data, These data have the adwviutage of being "well-behaved" (in a statistical sense). Use of any real empiricaldataset nuis the risk of limiting (perhaps severely) the extent towhich the results may be generalized.
Approach
The ANN technique used in this study was "back-propagation,"as implemented by the NeuralWorks Professional II/PLUSsoftware (NeuralWare, 1991 b) on a Macintosh llfxmic'ocomputer. The dimensions of the study included (hefollowing:
1. Function formins of tile data distributions.
2. Total sample sizes.
3. Ertors--the degree to which the data ip)ints in tiledistribution deviate randomly from the idea! function form. Thisis nIeaircd by tile standard deviation of the points around tile
function form. In the linear case, this error can be transt'or'ed toa vaidity coeflicient (the cotTelation between the predictor andcriterion).
4, Base rates--the proportion of successes beforeintroducing a new election instronlont.
5. Selection ratios--the proportion of persons selected,using the new selection instrument.
6. Sample splits--the alloc'ation of simulated persons("simuslee,") in each total sample into two subsets: thedevelopment sample (used to develop a prediction model) andthe evaluation sample (used to evaluate the prediction model),
The error of the distributions was chosen so as to yield desiredvalidities in the linear case (.05_ .25, .50, .75, and .90). The errorscorr'esponding to these target Correlations were used to generatetotal bivwriate distr-ibutions for tliihre sample sizes (100, 500, and5,000) for each function form (linear and curvilinear). 'liTen, thesimulees in these total distributions were alie ateal to
74 A Comparison of Artificial Neural Networks mid Linear Regression
development or evaluation sample)Is, with thle followvingalternative splits (20-80%r, 50-50%, & 60-40%).
Tlhe vector of score(s was rank-ordered and then dichotomizedcaccording to (lhe desired base rate, producing two groups(successes and1( failures). This procedure was followed separatelyfor cacti alternative base rate (.05, .25, .50, & ~95).
Ani OLS-LR model was determinend for each developmentsample. Thiese models were used to predict criterion scores forcatct shimulee in the associated evaluation sample. Theseevaluation samTple siniuleeg wvere then rank-ordered by thepredicted criterion score. Alternative selection ratio.,- (.05, .25,.75, &. .W) wecrc imposed, dividing thle evaluation sample inltothose who wvould bec slected and thosc wvho wvould be rejected litcacti speci fied selection naifo.
At this poinit, thle actual criterion staltus (success, vs. failure) andselection vs. rejection status for cacti simutlec w~ere available.This allowed the formation of four decision- outcomeccombinations: (1) correct acceptances, (2) erroneousacceptanccs, (3) correct rejections. and (4) erroneous reiect!olls'.Thmis in formation was combined into the total uwuber of correctdecisions and the total number of enroneOus deccisions. Thleproportion ot correct decisions (''hit rate") was emiployed as thlemeasu~tre of effectiveniess for conmparimig the OLS-,R approach tothle. ANN-BP approach, under cactih combiniation of conditions(function formi, samiple size, degree of en-or from thle idealfunction formi, base rate, sclcetion ratio, & sample split).
Results
There, were 62 comparisons ini which there was at significantdifference betwveen the two methods (p < IM0). All of thesesmenifican t diftfcrences were obsei'ved for tile CurvilIinear'(listinbtitiotis: smonie Wts obser'ed ft lie linecar distributions.Sixty-one of these significant diffe ices favored thie ANN-lWmodel over thec OLS-LR ni~xel. Fifty-six of thie 62 significantdifferences wemi' observed in the largest sample .'ize (5,0W0), 6 insamiples of 500. and none when thle sample size NN its 100). Theounibcr of sian ificamit difforenccs (p < .001.) dlid not appear- to berelated to base ratcs- selection ratios, or samiple splits.
A Comparison of Artificial Neural Network., and Linear Regressioni 7.5

Discussion and Conclusion
The results of this study concerning the use of the ANN-BPapproach for predicting dichotomous criteria are quiteencouraging. One of the major advantages of the ANN-BPapproach is that the researcher does not need to know the mostappropriate function form for a dataset. In theory, the ANN-BPapproach should seek out and discover the most effectiveprediction system. The OLS-LR model, on the other hand, willperform quite well on a dataset where the underlyingrelationship between the predictor and criterion is linear; butsubstantially less well when the underlying relationship isnonlinear. Unfortunately, the nature of the underlyingrelationship between a predictor variable and a criterion variableis frequently unknown. This study showed that a single ANN-BPconfiguration with a single fixed number of training iterationsdid as well as, or outperformed the OLS-LR approach under awide variety of base rates, validities, selection ratios, and samplesplits. The two factors that did have an important impact onproducing significant differences between the two approacheswere function form and sample size.
In the linear function form case, ANN-BP performedcomparably to the OLS-LR approach. This finding is as much asone could hope, given that the OLS-LR will perform optimallyfor this function form. In the curvilinear case, the ANN-BPapproach outperformed the OLS-LR approach in manyinstances. This is not surprising, since the OLS-LR procedure istrying to fit a linear model to curvilinear data. While it is true thatan OLS-LR model could be specified to fit ,. certain nonlinearfunction, such a function would have to be specified in advanceby the researcher. This is also true of traditional nonlinearregression approaches (e.g., logisiic regression). One advantageof the ANN-BP approach is that no such prior functional formspecification is required, and a single ANN- BP model can fitmalay diverse functional forms.
The ability of the ANN-BP approach to outperform the OLS-LRapproach was related to sample size. When the size of the totalsample (inciuding the development and evaluation subsamples)was 100, no significant differences were observed (p < .001).When the total satmple size was 5(X), ANN-BP outperformed theOLS-LR approach in six of 240 comparisons, while theremaining comparisons showed no significant differences(p < .001). When the total sample size was 5,(X)0, therc were 55cases in which ANN-B3P outpcrformed OLS-LR, 1 in which
76 A Comparison of Artificial Neural Networks mid Linear Regresion
OLS-LR was superior, and the remaining cases showed nosignificant differences (p < .001). In view of the fact that onlyone ANN-BP configuration and stopping criterion wereemployed for the large variety of conditions examined, thesefinding are quite encouraging. Clearly, the ANN-BP a.pproachwas quite robust, often producing superior performance.Examination of the one case wherein OLS-LR significantlyoutperformed ANN-BP (p < .001) suggested that the explanationinvolved the choice of a single ANN-BP configuration andstopping rule for all combinations of dimensions studied.Indeed, when the same network configuration was trained for anadditional 100,000 iterations on the development sample data,the ANN-BP model significantly outperformed the OLS-LRmodel on the assuciated evaluation sample data.
In summary, a crude ANN-BP approach was found Io perf )rm aswell as the OLS-LR approach under a wide variety ofcircumstances, and to significantly outperform the OLS-LRapproach when sample sizes were large and the underlyingfunction form deviated from a linear form. While additionalresearch needs to be done to determine how to most effectivelyuse ANN- BP models, it seems quite clear that this approach ispromising tool for military personnel research.
Papers and Presentations
Sands, W. A. (in press). Artificial networks: A tool forpsychologists. Proceedings of the 33rd Annual Conference
of the Military Testing Association. San Antonio, TX.
Sac-ds, W. A., & Wilkins, C. A. (in press). Artificial neuralnetworks for personnel selection. Proceedings of the 33rdAnnual Conference of the Military Testing Association.San Antonio, TX.
References
liecht-Nielsen, R. (19%X)). Neurocomptiing. Reading, MA:Addison-Wesley Publishing Co.
Khanna, '1. (1990). Foundations of neural networks. Reading,MA: Addison-Wesley Publishing Co.
A Compauison ol Artificial Nearal Networks and Linear Regression 77

McClelland, J. I.., & Rumelhart, D. E. (Eds.) (1986). Paralleldistributed processing: E&plorations in the microstructure ofcognition-psychological and biological models (Vol. 2).Cambridge, MA: The MIT Press.
NcuralWare (1991 a). Neural computing. Pittsburgh, PA:NeuralWare, Inc.
NeuralWare (1991 b). Reference guide. Pittsburgh, PA:NeuralWare, Inc.
Rumelhart, D. E., & McClelland, J. L. (Eds.) (1986). Paralleldistributed processing: Explorations in the microstructure ofcognition-fjundations (Vol. 1). Cambridge, MA: The MITPress.
78 A Comptrison of Artificial Neurl Networks and Linear Regr-ession

Independent ExploratoryDevelopment
Progress Reports
IR/1ED FY91 Annual Report 79
A Large-scale Model to Maximize Navy Unit Personnel Readiness
losif A. Krass and Theodore J. Thompson
AbstractThe problem of optimally (re)allocating Navy personnel tocombat units is compounded by several considerations:availability of trained personnel, staffing of positions byoccupation groups or ranks, and maintaining an acceptable levelof readiness. We formulate this problem as a network flowproblem with side constraints. An additional, non-networkvariable measures the readiness level. The problem size cangrow to as many as 36,000 ,ucs and 17,000 nodes with 3,700 sideconstraints. We develop two numerical methods for efficientlysolving this problem. One method is based on a hcuristic and isable to provide a feasible solution to the problem in reasonabletime. We also develop an application of the Linear-QuadraticPenalty (LQP) method to exploit the embedded networkstructure by placing the side constraints into the objectivefunction. The resulting nonlinear nctwork program is solvedusing a simplicial decomposition of the network constraint set.Numerical results with both solution methods are provided.
Background
Every Navy combat unit is required to report the status ofpersonnel readiness for the unit. The goal of the personnel unitreadiness report is to ensure that combat ships and squadronshave sufficient personnel with specific skills to operate. Eachcombat unit is characterized by a number of functional missionareas such as mobility, anti-air warfare, or submarine warfare. Amission area within a unit requires personnel with different skillsto support operational capabilities. Personnel ,,kills are definedby rating or occupation and pay grade. A unit's capability toperform its functions in all its mission areas is referred to as"readiness."
The problem of maximizing personnel readiness of the U.S.Navy fleet can be formulated as a large scale, mixed integerproblem. The size of the readiness problem is approximately50,(X) variables and 30,0(X) constraints. Commercial linearprogramming packages cannot solve this size problem, withinreasonable timc and space requirements, even using a super
A Large-scale Model to Maximize Navy Unit Personnel Readiness 81

computer. A possibie exception is the AT&T KORBX machine,which is an. integrated hardware and software optimizationsystem. We developed a decomposition method, capable ofsolving this problem on moderate sized mainframe computers(e.g., NPRDC's IBM 4381).
The readiness problem can be formulated using existing datafiles. The demand side of the problem can be defined frommanning files. These files provide the shortage or excess ofpersonnel within pay grade, skill, and mission area for readinessactivities. The supply side of the problem is defined fromEnlisted Projection System files. These files contain projectednumber of people by skill, pay grade, and composite availat le tofill job openings. Composite defines sea or shore eligible.
Objective
'[he objectives of this work are (1) formulate an optimizationmodel to maximize personnel unit readiness, and (2) develop amethod capable of solving this model.
Approach
Our approach to this problem is:
1. Formulate the problem as a network with sideconstraints. Use maximal network and minimal side constraintsin the formulation.
2. Attempt to solve the problem using NETSID.
3. Develop a heuristic solution technique.
4. Solve the problem using NETSID with the heuristicsolution as a starting point.
5. Attempt to find an alternative solution technique ifunsuccessful with NETSID.
Results
A mathematical mn'xiel was formulated, which presentspersonnel unit readiness as an optimization on a network withside constraints. Based on this mathematical model, the problem
82 A Large-scale Model to Maximize Navy Unit Personnel Readiness
was decomposed into a large scale network (about 22,000 nodesand 50,000 arcs) with a relatively small number (about 4,000) ofside constraints. The model generator was written in FORTRANand debugged. We attempted to solve this problem withNETSID but were unsuccessful. NETSID is a state-of-the-art'network with side constraints' code that we obtained fromProfessor Kennington of Southern Methodist University.
We then developed a heuristic algorithm to solve the readinessoptimizadion problem on our IBM 4341. This heuristic solutionwas then used a the starting point for NETSID. This was alsounsuccessful. However, we now have what we believe is a goodheuristic algorithm for solving the problem.
Our work on this problem has generated interest in the academiccommunity. Professor Stavros Zenios from Warton School,University of Pennsylvania said that he has a code that can solvethis size problem. We provided the model specifications to him.They successfully solved the problem using the LQP algorithm.We are jointly preparing a paper (see below) for publication.
Papers and Presentations
Krass, I. A., Pinar, M. C., Thompson, T. J., & Zenios, S. A. (inprocess). A Large-scale model to maximize Navy unitpersonnel readiness.
Pinar; M. C., & Zenios, S. A. (1991). A suooth penaltyalgorithm fio network structured problems and itsapplication to naval personnel assignment. Paper presentedat the Organizational Research Society of America/TheInstitute of Management Sciences Joint National Meeting,Anaheim, CA.
Krass, I. A., & Thompson, T. J. (1991). Decomposition inethodfir solving a large-scale model to inaxiinize Navy unitpersonnel readiness. Paper presented at the OrganizationalResearch Society of America/The Institute of ManagementSciences Joint National Meeting, Anaheim, CA.
Krass, I. A., & Thompson, T. J. ( 1991). Navy Fleet PersonnelReadiness Problem. Paper presented at the OrganizationalResearch Society of America/The Institute of ManagementSciences Joint National Meeting, Nashville, TN.
A Large-scale Model to Maximize Navy Unit Personnel Readiness 83
"M MI
Transitioning Research Knowledge into Practice: Information onWhat Works in Training to Aid Training Practitioners.
William E. Montague and Frederick G. Knirk
AbstractTraining practitioners do not know much about the largeresearch literature on learning and instruction and are not currentin the theory of cognition and learning that underlies theresearch. Yet they arc responsible for determining what to trainand how, and for deciding how to assess the progress of studentlearning. They develop, design, and implement training coursesand curricula. They write tie books and manuals. The purpose ofthis project is to provide research syntheses that recommendtraining practices that work effectively and to develop a betteravenue for transition ing research knowledge into practice. Thesesunmmaries will be published as a special issue of theInternational Journal of Educational Technology. This Journalprovides a forum for communicating with a large audience oftraining practitioners and managers.
Background
The military services (and much of industry) rely on subject-matter specialists/experts for developing training. Theseindividuals are seldom more than novices about the scientificresearch knowledge that provides the basis for choosingrepresentations, methods of presentation, learning assessmentprocedures, and fostering the development of competency inadult learners (cf Latham, 1988). Yet they write the books andother training materials, design the tests, manage thedevelopment of competency, or approve the quality of contractordeveloped materials. A detailed knowledge and understandingof the research literature on cognition, learning, and instructionaltechnology would enhance performance of these tasks.Therefore, any mechamism that could communicate thisinformation effectively would contribute to improving thequality of training.
Training system practitioners, in part, try to overcome some otthe deficits by hiring training or educational specialists to help.Although they do provide an important resource &-at improvesthe system, the adequacy of their training is questionable (there
Transitioning Research Knowledge into Practice 85

are few focused programs to train thenm nationwide), and thereare relatively few of them available. Thus, the bulk of the workpreparing instructional materials, and decisions about theiradequacy or quality, is done by individuals relativelyuninfornmed about the empirical and theoretical basis forinstructional techniques. How can we transition into practice theknowledge about different methods' effectiveness?
We adapted an approach to help solve this problem, which wasfirst used by the Department of Education (Bennett, 1986). Theapproach provides summaries of information based on asynthesis of research in an easily understandable, accurate formabout what works in educating and training students. TheDepartment of Education document became the most widelydistributed document on instructional research ever. It wastargeted primarily at parents and teachers of young childrenattending schools in the U.S. The focus of our document is oilinstructing young adulus attending military schools. Thesummaries provide a source of information to guide executiveswho manage and make policy, instructors and trainingspecialists who are curriculum designers, developers, andevaluators. This information was presented as a document(Montague, 1988) published as a Navy Education and TrainingCommand report and distributed widely among Navy trainingorganizations.
Recently, because of the success of the approach, we were askedto refine it further. We were invited to prepare a special issue ofthie International Journal of Educational Research based on theoriginal Navy document and to report oil the reactions and use ofthe document in Navy training organizations. This projectprovi Jed partial support for preparing this document.
Objectives
As a technological development, the purpose of the presenteffort is to explore the usefulness of research syntheses fortransitioning research knowledge into prectice, to develop aspecial issue displaying the research syntheses, and to discusstheir utility.
86 Transitioning Research Knowledge into Practice
ApproachResearch syntheses were brought up to date and revised, basedon comments on the earlier issue. Several new syntheses wereprepared. Articles were solicited from professionals discussingthe adequacy and utility of such syntheses for guidinginstnrction and instructional development. Data were obtainedon the use of the materials in Navy training and are presented inan article.
Progress
A new document was drafted during the last half of FY91entitled; What works it? adult instruction: The itanagenttent,design, and delivery qfinstruction. It is being edited and revisedand its expected completion date is early 1992, with publicationsoon thereafter.
In one chapter, we list the organizations using the document andreport the comments of training managers, specialists, andinstructors regarding its use. An extensive discussion regardingthe perceived 'obviousness' of generalizations for social/behavioral science research was included to confront commentsthat the information is conimon sense knowledge and to explainthat perception is deceiving. We will record the use of the specialissue and will include a response form for users to notify usabout the material presented in the Special Issue.
References
Bennett, W. J. (1986). What works: Research about teaching andlearning. Washington, DC: U.S. Department of Education.
Latham, G. P. (1988). Human resource training anddevelopment. Annual Review of Psychology, .39, 545-582.
Montague, W. E. (Ed.) (1988). What works: Sumnmary ojresearch findings with implications for Navy instruction andlearning (NAVEDTRA 115-1). Pensacola, FL: Chief ofNaval Education ,and 'fraining.
Trausitioning Rescarch Knowledge into Practice 87
An Exanminationi of Cognitive and MotivationalEffects of Employee Interventions
Jo/n, P. S/ieposli
*AbstractTotal Quality Leadership (TQL) requires a fundamental changein the way work is conducted and an organization oierates. Themajor focus of the present research is onl the effect of TQL onlworker empowerment and intrinsic motivation. A model wasdesigned to test the. following relationships: (1) Specific TQLrelated impediments and organizational climiate influenice theacceptanice and use of TQL, (2) TQL acceptance and use has antimpact onl properties of individual jobs and employees'perception of their jobs, (3) thcse effects combine to influencejob satisfaction and perceived stress. Data were collected onlsurveys in two Navy engineering facilities. T7he 368 subjectswere engaged in jobs that werc primarily scientific and technicalin nature. Results indicated that the strongest impediments tosuccessful imIplemen tati Onlare associated. with an or~ganiizationallclimate that is inconsistent with TQL principles. In addition, theresults wvere generally consistent with the proposedl model thusproviding support for the contention that the employee's sense ofempowerment and intrinsic motivation mediates the relationshipbetween TQL and levels of satisfaction and stress.
Background
Public and pri vate sector organizations are Showing Continuinginterest in adopting Total Quality Managcmcnt as a system toimprove organizational performance. 'Ibis is clearly evidentfromn the Navy-wide implementation of TQL_ that is presentlytak-ing place. Total quality programis arc characterized by thefollowing: a foctis onl systemic rather thani individual causes ofpoor quality, the use of statistical evidence as the basis forquality improvement actions and for the assessment of theirimpact, anl emphasis onl intra- andl inter-departmientalconiunitiication in solving and preventing problemis, andremoval of defects through process improvement rather thanlthroughi in si-vtica (Deming, 1982). Full-sc ale adoption of thesePrinciples inv~o!v'Cs a major change in the organization's,orientation toward the wvay work is conducted. TQL is far from
An Examination of Coanitive wuid motivational Effects of Employee Inteiventions 89

a cosmetic fix. It requires a fundamental change inl tile way wvorkis conducted and tile way anl organization operates.
Considering thle nature of the changes dictated by a qualityimprovement initei volition (e.g., required training, changes inlwork procedures) and the effort required of individual workersto enlact these changes, it is extremely important to examine tileway inl which the quality program affects the individualemployee. Tho emphasis inl selling these programs.understandably, is onl the advantages they give the organization.Solely restricting the focus to the benefits to the organization(e.g., profitability, higher productivity, and improved clientsatisfaction), however, may create some serious difficulties inselling quality improvement programs to emiployees (c.f.Gunspari, 1987). By only stressing organizationa! beniefits, tilcemployee may perceive that he/she is being asked to change, towork harder, to be more closely mionjtored, and to achieve goalsof increasing difficulty without personal rewards. This mayseriously compromlisc thle implementation effort. It follows thatresearch onl the effects of quality programs onl the individualw~ould~ be beneficial to the assessment and implementation ofsuch quality programs.
TQL, when properly implemented, should alter a person's job inlsignificant ways (egcollect ing and ireporting data, focus onlprocess, increased interaction with supervisors, co-workers andmanagement, increascd respon sibiIi ty, and more precise andfrequent job feedback). Ideally, these changes prov'ide workersthe opportun ity to participate in decision -mak-ing and enhancepersonal reliance, a sense of autonomly and control whichtheoretically should lead to heightened intrinsic motivation andempowermenit (Conger & Kantingo, 1988). The effect of TQLon, worker empowerment and intrinsic motivation is the majorfocus of thle l)Ze5eIlt research.
lIn order to test thle, effect 01' 1Q1. oil workers' sense ofempowerment and intrinsic motivation of a model, whichincorporates elements of previous models (e.g., Hackmnan &Oldhamn, 1980,4inlon, 1988) as well as information concerningtile organization and the implementation, is proposed (see Fig iie1). The model is dlesigned to test the following proposedrelationships: (1) specific TQL-related impediments andorganizational climate factors influence the degree to whichl'QL is successltilly implemlented and practiced, (2) the status ofTQL inl terms of implementation and tise inl turn is exp~ected toaffect prope~rties of ind~ividual jobs and employees' perception's
90 An Examination of Cogilive mid Motmivtion~al Effects of Employee Interv'entions
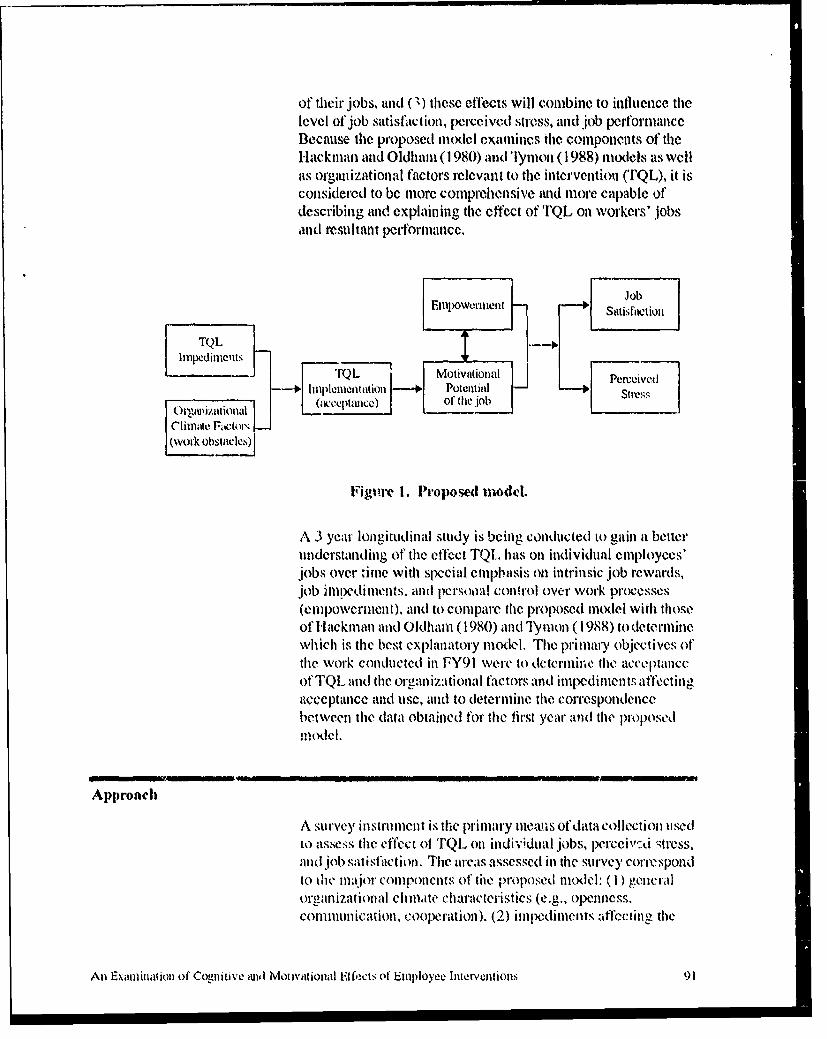
of their jobs, and (3) these effects will combine to influence thelevel of job satisfaiction, pe[rceimd stress, and job performanceBecause tile proposed 11o(del examines tile components of theHackman and Oldham (1980) and 'F'mol (1988) moxlels as wellas orgamizational factors relevant to the intervention (TQL), it isconsidered to be more comprehensive and more capable ofdescribing and explaining the effect of TQL on workers' jobsakil resultant p•,formance.
EnipmmlentJoblditTQL tEnweriiet ["Satsfittioll
IlnpeVdimcents ....---.-TQL Motivaiiotml Perceived
--+ Implemenatation 1-- Potential jo
[ Clinmatc:e F• fots ti-j-
(work- obstackjJ
Figtme I. Propo.ed 111odel.
A 3 year longitudinal study is being conducted to gain a betterunderstanding of the effect TQI.. has on individual employees'jobs overz ime with special emphasis on intrinsic job rewards,job hlledillelltS, and pcrso0.1l control oVer work processes(eCmlpowerment), and to compare tile proposed model with thoseof I-lackman and Oldham (1980) and T1ymon (1 988) to deternlinewhich is the best explanatory model. The primm'y objectives ofthe work conducted in FY91 were to determine the acceptanceof TQL and the organizational factors and impediments affectingacceptance and Use, and to determille the Correspondencebetween the data obtained for tile first year and tile p)oposedinode!.
Approach
A survey instrument is the primary lllnciS of data collection usedto assess the effect ol TQL on individual jobs. percci\'cdi stress,and job satisfaction. The areas assessed in tile survey correspondto tie maIJor corponents of tile proposed mllodel: (i) geeiralori'anizational cli mate characteristics (e.g.. openness.communication, cooperation). (2) imipediments affecting the
Aln Examination of Cognitive mid Motmivtional Efects of Empployee Intetvcntions 91

successf'ul inl)leenleltation and use of TQL (e.g., fear, lack ofsupport, lack of adequate train ing), (3) lwersonal andorgan izational acceptance of TQL, (4) slpcific jobcharacteristics (e.g., skill variety, task sigi' ificance), (5)cmpowerment (e.g., accomplish objectives), (6) job satisfaction,and (7) perceived job and organuizational stress (e.g., lack ofcontrol over job decisions).
l\vo U.S. Navy engineering facilities, Naval Ship Weapon
Systems Engineering Station (NSWSES) and the IntegratedCombat Systems Engineering Station (ICSTP) are serving as thetest sites. A first administration of the survey questionnaire hasbeen conducted at both sites. TWo hundred inlld ninety-fiverandomly s.Aected employees from NSWSES and all 73empioyecs from ICSTF completed the survey.
Resilis
Overall the results from the first survey admninistrration indicatethat the strongcst i mpedi ments to successful implplemenltationwere a.sociaited with )an or-ganilationll litrnate h'wo'nsit.mt withTQL principles (c.g.. poor fit between current policies andTQL). Results also indicate that tihe mnijority of thei mrveyrespondeins were positively disposed toward TQL but reportedthat organizational support was less positive. Personialacceptance of TQL was most strongly associated with TQLinvolvement. Organizational acceptance of'lQl., was moststrongly affected by levels of perceived itntp.diments andor-anizational climate characteristics.
In addition, the data were gencrally Consistent with he pIroposedmodel with sonme nmodification (see Figure 2). OrganuizationalClimate 4inid TQL at -t-ted eil),owernilon and the motivatingpropertics of one's Job, and these variables in tufn affected thelevel of reported job satisfaction and stress. In contrast to theproposed model, empowerment is siglnificantly related to jobsatisfaction bti not to job stress while the motivating potential ofthe job is significantly linked solely to job stress. Thesepreliminary results suggycst that TQL .ihas an impact onl onle'sperceived s.ense of empowerllent aiid inltrinsic Illotiv.-ion oftthejob and that the proposed model sucecssfully captures thcm.einterrelatiolnships.
Contiuinuati Wn of this study will provide information about theeffect of TQL over time on individual -niployees' jobs thlat
92 An Examination 0f Coritive mid Motivational Effc"s of Employee Interventions
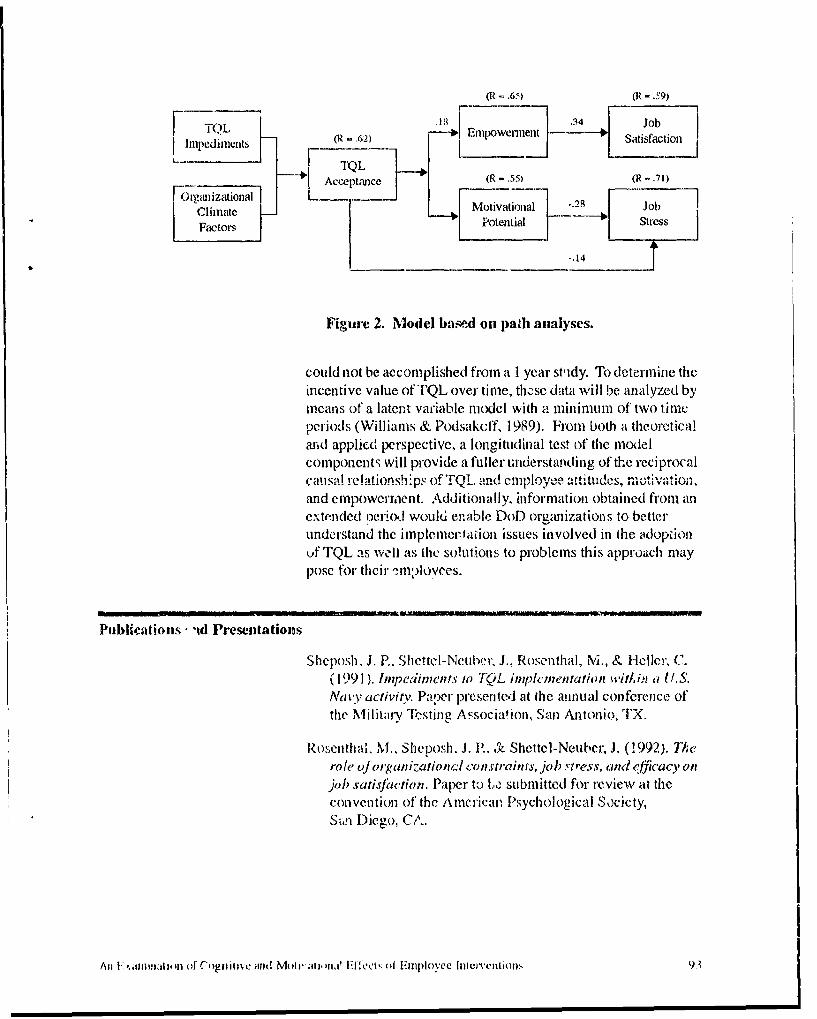
OZ - 65)(8-
.1.34 Job
F TQL (R-.62) *Empowerinent Saisac+oImpedients TQL Sliflto
FJ a izton IAcceptanice (R -55 (R -. 71)
Cli mite Motivational -.28 JobFactors Potential Stress
-.14
Figure 2. Model bnszed oil padit analyses.
could not be accomplished fromn a 1 year st'tdy. To determnine thleincentive value of TQL over timtie, thesc data will be analyzed bymeans of a latent variable model with a minimum of two timeperiod., (Williams & Podsakcff, 1989). From both a theore~ticaland applied perspective, a longitudinal test of the modelcomponenlts will provide a fuller understanding of the reciprocalcatlsa1rehltionsh~ps of TQL and cn--loyce attitudeýs, -notivan~on,and c mpowcnri-en t. Additionally, information obtained from anextended nerioý.. would enaible DoD organizations to betterunderstand the implemer~taion issues involved in the kidop~ionuf TQL as w,ýi as thc solut~ions to problems this approach maypose for, thleir ',m:loveeS.
Piablications'- id Presentations
Sheposh. J, P.. Shettel-Neuber, J.. Rosenthal, M., & Heller, C.(1991 ). Imnpedimneirs io TOL. impifcentatiEon viflli-n ai U .S.Nlavy, actiit'if V. Papoer presented at the annual Conference ofthe NMilita.ry 'Vhstins- A~ssociawion, San Antonio, TX.
Rosenthal, M&.. Sheposh. J. P.. & Shettel-Neuber. J. (!992). Therole ofor-ganizzaliona-1 constrain fs, job strress, and efic-acy onrjob satisfaction. Paper to Lo submitted for review ait theconvyen tion of the A merican Psychological Socicty,Simn Diego, C.A..
Al F4ajmnati ill on f (C gi iii and gutmohi', j' a l i" hct of Emiployee I ll eiveitjOO'zý 91
ReferencesCenget; J. A., & Kanwigo, R. N. (1988). The empowerment
process: Integrating theory and practice. Academy ofManagement Review, 2 7, 454-489.
Demting, W. E. (1982). Quality, productivity, and competitivepos"tion. Cambridge, MA: MIT, Center for AdvancedEngineering Study.
Guaspari, J. (1987). The role of human resources in "selling"quality improvement to employees. Management Review,20-24.
Hackman, J. R., & Oldham, G. R. (1980). Work Redesign.Reading, MA: Addison-Wesley.
'lymon, W. G., Jr. (1988). An empirical investigation of acognitive model of empowerment (unpublished doctoraldissertation). Philadelphia, PA: Temple University.
Williams, L. J., & Podsakoff, P. M. (1989) Longitudinal fieldn'th-"s for studying reciprocal relationships inorganizational behavior research: Toward improved causalanalysis. In L.L. Cummings & B.,/. Staw (Eds.), Researchin organizational behavior (Vol 11, pp. 247-292). Green wich,CT: JAI Press.
94 An Exammaiiluri ol ( ltive wud Mot iwtional E'flcctF .of Emph-oyc bnteventions
Distribution List
DistributionChief of Naval PersonnelAssistant for Manpower, Personnel, and Training (O?-987H)Annapolis Technical Information Center, D. W. Taylol Naval
Ship R&D CenterCommanding Officer, Naval Coastal Systems Center
(Code 2120)Commanding Office-, Naval Underwater Systems Cenwer
(Code 102)Commander, Navw.' Command, Control and Ocean Sur% eillance
Center, Resear'h, Development, Test and EvaluationDivi';ion (Codt 0141)
Commander, N'4val Air Development Center (Code 01LI)Officer in Charge, Naval Surface Warfare Center Detacihment,
White Oak Laboratory (Code R04, Code 1-1023)Commander, Naval Weapons Center, Technical Library
(Code 343)Office of Naval Research (OCNR- 10P6)Office of Naval Research, Detachment LondonOffice of Naval Technology (OCNR-2OP4)Chief of Naval Education and Training (Code LO1)Commanding Officer, Naval Aerospace Medical Research
Laboratory (Code 26)Commander, U.S. ARI, Behavioral and Social Sciences
(PERI-POT-I)
Department of the Air Force, DEI 5, Armstrong LaboratoryDirectorate, Brooks Air ForceBasc, TX
Program Manager, Life Sciences Directorate, Bolling Air iorceBase (AFOSR/NRL)
Commander, Air Force Hiuman Resources Laboratoly, Wright-Patterson Air Force Base (AFHRIJLRS-TDC)
Department of the Akir Force (AFSC), Air Force HumanResources Lal ,ratory, Lowry Air Force Base (APHRL/ID)
Superintendent, Naval Postgraduate SchoolDirector of Research. U.S. Naval Academyinstitute for Defense Analyses, Science and "Ilchnology
DivisionDefense Technical Information Center (DTIC)
FY91 Annuld Report 95

Public repoi•ng burden for this colecion of I ormauon Ies t en i to svora'e I hur Prir re-r -n - Fii_ ,_-li'W",6Wources. gathering and raalning the data neededl, ano• tcreing and reviewing the collecon of h'lonnallow. Send mnmnts regarding Its burden estJUre or ay otheraspec of this coledion of knormabon. Including suggestions for reducing this burden, to WaSIJngton Headquautor Sae1., Dkedors. for IntorrmL on CMperatlku and
Reports, 1215 Jefferson Davis Highway, Suite 1204, Arlington, VA 22202.4302, and to fti Office of Managemrent and Budget, Paperwork Redu~cton Project (0704.0188).Washington. DC 20503.
1. AGENCY USE ONLY (Leave banik) 2. REPORT DATE 3. REPORT TYPE AND DATE COVERED
March 1992 Administrative Publication- Oct 90-914. TITLE AND SUBTITLE 6. FUNDING NUMBERS
Independent Research and Independent Exploratory Development Center OverheadFY91 Annual Report
6. AUTHOR(S)William E. Montague (Editor)
7. PERFORMING ORGANIZATION NAME(S) AND ADDRESS(ES) 8. PERFORMING ORGANIZATIONNavy Personnel Research and Development Center REPORT NUMBERSan Diego, California 92152-6800 NPRDC-AP-92-5
9. SPONSORING/MONITORING AGENCY NAME(S) AND ADDRESS(ES) 10. SPONSORING/MONITORINGOffice of Naval Technology/Office of Naval Research AGENCY REPORT NUMBER800 North Quincy StreetArlington, VA 22217-5000
11. SUPPLEMENTARY NOTES
12a. DISTRIBUTION/AVAILABILITY STATEMENT 12b. DISTRIBUTION CODEApproved for public release; distribution is unlimited. A
13. ABSTRACT (Maximum 200 words)
This report documents 6.1 and 6.2 research efforts conducted at the Navy Personnel Research and Development Center under theIndependent Research/Independent Exploratory Development (IRAfED) program. The FY91 IR program includes the following projectirticles: The Role of Feedback in Computer-based Training; Exploratory Examination of Artificial Neural Networks as an Alternative:o Linear Regression; Artificial Neural Networks and Training; A Comparison of Artificial Neural Networks and Linear Regression;]sing Neural Networks to Predict Behavior from Psychological Data; and Experimentally-based Learning of Multiple Roles. Progress-eports on IED projects include: A Large-scale Model to Maximize Navy Unit Personnel Readiness; Effects of Administration Methodmd Anonymity/Identification on Survey Responses; An Examination of Cognitive and Motivational Effects of Employeeinterventions; and Transitioning Research Knowledge into Practice.
14. SUBJECT TERMS 15. NUMBERt OF PAGES!¶.epeendent Resfarch. Independent Exploratory Development, IRAED 94
16. PRICE CODE
i7. SECURITY CLASSIFICATION 18. SECURITY CLASSIFICATION 19. SECURITY CLASSIFICATION 20. LIMITATION OF ABSTRACTOF REPORT OF THIS PAGE OF ABSTRACT
UNCLASSIFIED UNCLASSIFIED UNCLASSIFIED UNLIMITED
ISN 7M4o.01-2.0-5500 Stmdtid Fom 291 (Rv. 9,-9)Prtoilbed by ANSI Ski. 230e18298-102