Embed Size (px)
Citation preview
Designing an aviation noise attitudes survey Recommendations on survey design

At NatCen Social Research we believe that social research has the power to make life better. By really understanding the complexity of people’s lives and what they think about the issues that affect them, we give the public a powerful and influential role in shaping decisions and services that can make a difference to everyone. And as an independent, not for profit organisation we’re able to put all our time and energy into delivering social research that works for society.
NatCen Social Research 35 Northampton Square London EC1V 0AX T 020 7250 1866 www.natcen.ac.uk A Company Limited by Guarantee Registered in England No.4392418. A Charity registered in England and Wales (1091768) and Scotland (SC038454) This project was carried out in compliance with ISO20252
Contents
1 Executive Summary 5 2 Summary of the survey development process 9
2.1 Background 9 2.1.1 Overview of project phases and methods 9
2.2 Stakeholder engagement 11 2.2.1 Research aims based on stakeholder consultation 13
2.3 Deciding the survey population and sampling 15 2.3.1 Deciding who should be included in the survey 16
2.3.2 Quantification of exposure to aviation noise for use in a sampling strategy 17
2.3.3 Strategies to define populations exposed to levels of aviation noise <51dB LAeq,16hr 20
2.3.4 Population distributions of residents exposed to aviation noise around selected airports 21
2.3.5 Sampling Strategy 23
2.3.6 Selection of Airports 24
2.3.7 Design of a Stratification Scheme 27
2.3.8 Sample sizes for robust estimates 29
2.4 Mode, timing and frequency 32 2.4.1 Survey mode 32
2.4.2 Survey frequency 34
2.4.3 Fieldwork timings and seasonality 34
2.4.4 Cross-sectional vs. longitudinal data collection 36
2.4.5 Recommendations 37
2.5 Questionnaire review and outcome measures 38 2.5.1 Overview of measures 38
2.5.2 Annoyance questions 41
2.5.3 Influencing factors: sociodemographic variables and non-acoustic factors 42
2.5.4 Outcome measures 45
4
2.5.5 Measuring change and perceptions of change 48
3 Shortlisted options 50 3.1 Option one: A repeated cross-sectional survey using face-to-face methods 50
3.1.1 Reactions to option one 52
3.2 Option two: A repeated cross-sectional web-CAPI survey 52 3.2.1 Reactions to option two 55
3.3 Option three: A repeated cross-sectional web survey 56 3.3.1 Reactions to option three 58
3.4 Option four: A longitudinal panel 59 3.4.1 Reactions to option four 60
4 Recommendations for the final design 61 4.1 Our recommended approach 61 4.2 Further development work on the feasibility of a web option 64 4.3 An experimental web pilot alongside CAPI data collection 65
4.3.1 Aims 66
4.3.2 Sampling Strategy 66
4.3.3 Sample size for the experiment 67
References 68
1 Executive Summary NatCen were commissioned by ICCAN to help design a new survey on people’s experiences of aviation noise to ensure policy decisions are based on up-to-date evidence. The main aim of the project was to develop a survey that acts as a robust evidence base for policy decisions on aviation noise. The survey design seeks to address the information needs of multiple stakeholders, including community groups, academics, data analysts, industry bodies and government. This report outlines NatCen’s recommendations for a future survey and describes the process by which we came to the recommendations presented in this report.
After consulting with a wide range of stakeholders to establish the main objectives of the new survey, we undertook some specific development work on defining the survey population, sampling, mode, timings and survey frequency, questionnaire reviews and outcome measurement reviews. Following this development work, NatCen presented a number of different methodological options to ICCAN for a future survey, with a detailed discussion of the advantages and disadvantages of each approach with regards to the identified prioritised survey aims and estimated costings. After a roundtable discussion with ICCAN and comments from the advisory board, we finalised our recommendations on the most appropriate methodological choices for a future survey.
Given the wide variety of information needs and areas of interest expressed by stakeholders, together with practical and logistical constraints, it is not possible to investigate every research question posed. Indeed, some research questions are not best addressed using a survey, but rather are much better addressed using, for instance, qualitative research methods or an epidemiological research approach.
After discussing priorities with ICCAN, the advisory board for this project and other relevant stakeholders, we considered pertinent trade-offs in all areas of survey design. The recommendations presented in this report represent the approach which fits best with current priorities. We see this survey being a robust evidence base which can be used to inform policy decisions on aviation noise, but it is important to note that this survey will not be a panacea for understanding all local-level issues relating to aviation noise or giving a full qualitative understanding of individual experiences of aviation noise in all possible scenarios.
Recommendations
We recommend a repeated cross-sectional survey using face-to-face methods as the most appropriate approach for a new survey on aviation noise to meet the main objectives of this survey.
Survey population
The target population for the new survey should be people who are currently exposed to aviation noise, rather than the general population or communities who may be exposed in the future. To be consistent with current UK policy thresholds and previous surveys of aviation noise, we recommend firstly defining the target population using average noise during the day (LAeq,16h) as the primary noise metric. However, we also suggest it is not enough to only use LAeq,16h. Other metrics should be used in the stratification scheme when selecting addresses to participate in the survey
6
(see the section below on sampling). We suggest that the choice of summer or annual metrics should relate to the analytical priorities of the survey (which are still to be determined by ICCAN). However, regardless of which time period is chosen, it will be possible to analyse collected survey data according to either summer or annual metrics.
While there is stakeholder interest in collecting responses from residents exposed to aviation noise at low levels, we suggest it will not be feasible to include residents exposed to aviation noise below 45 dB LAeq,16h, as there is too much uncertainty around the quantification of exposure below this level in current estimates. If estimation improves, we would suggest including populations exposed at levels down to 42 dB LAeq,16h in a target population for the survey.
Sampling
We recommend conducting an address-based survey that aims to represent residential populations exposed to aviation noise around a selection of different airports. This type of approach will require a 2-stage sampling process. First, airports will need to be selected for the survey, followed by a stratified random probability sample of addresses around each selected airport.
We recommend that purposive sampling methods are used for the selection of airports. We recommend that a sample frame of airports is produced, which classifies all airports according to a number of relevant characteristics including: airport size, whether addresses surrounding an airport are in an urban/rural location, presence or absence of night operations, availability of aviation noise exposure data and other features of interest, e.g. those undergoing changes in operations. Purposive sampling allows for the survey to always include airports that are particularly of interest to policy makers.
ICCAN will still need to decide on the optimal number of airports to include in a future survey. For a given sample size of a future survey, there is a trade-off between ensuring estimates of annoyance are robust at the airport level (and having a larger sample size per airport) and including more airports (with smaller target sample sizes per airport). ICCAN will need to decide whether inclusivity or robustness of estimates should be prioritised for a future survey.
After airports have been selected, we recommend using a stratified random probability sample of addresses around each selected airport. Stratification schemes should vary on an airport-by-airport basis and will be partially dependent on what metrics and acoustic measures are available for each site. Generally, we suggest the first stratifier should be LAeq,16h, and recommend using additional stratification variables such as LAeq,8h (to ensure variance in night noise exposure), N65day (to ensure variance in the number of 65 dB or greater events), and change in LAeq,16h over time to ensure that addresses with a range of aviation noise exposure experiences are included in the sample.
Additional stratification principles should be applied to addresses that are exposed to levels of aviation noise of 45-50 dB LAeq,16h, where the quantification of aviation noise exposure is less reliable. For this sub-sample we recommend combining acoustic measures with overflight metrics so that households with a range of overflight experiences are included in the survey sample.
If CAPI only or web-CAPI methods are chosen as the mode of data collection we suggest clustering of addresses at <54 dB LAeq,16h will be necessary. We recommend stratifying clusters by population weighted averages of other exposure metrics (such as LAeq,8h or N65day or other metrics chosen) or overflight metrics where appropriate before clusters are selected to ensure a range of experiences are included in the survey. We also recommend comparing chosen clusters to a map of areas reporting large numbers of complaints to ensure some areas where residents have complained are included.
Based on our discussion with stakeholders (which identified annoyance differences between 45-50 and 51-53; and 51-53 and 54-56 as analysis priorities for a future survey), we recommend a large survey option of approximately 6,500 respondents, which should be large enough to identify key differences in annoyance by aviation noise exposure band with adequate precision.
Mode, timing and frequency
Our discussions with stakeholders indicated that the robustness of results is a priority for this survey. In an ideal scenario, where cost is no object, we recommend face-to-face surveys administered by Computer Assisted Personal Interviews (CAPI-only) as the data collection method for the first round of this survey. CAPI-only is the most robust data collection method for the research questions this survey aims to address. CAPI-only methods achieve consistently higher response rates and present the smallest risks of non-response biases.
We also considered the usefulness of a web-CAPI mode of administration. In web-CAPI methods participants are invited, via a mailing, to complete an online survey. Non-responders are followed up by interviewer home visits who complete a face-to-face interview. Given the new survey should be repeated at regular intervals, the web-CAPI mode would offer some small cost savings per wave that could become more substantial cost savings over time whilst achieving high response rates. Web-CAPI methods may also allow the survey to be more flexible in the future if CAPI is not possible or CAPI-only response rates decline.
We do not recommend web-CAPI for the first round of the survey because there are risks that it may not be as robust as CAPI-only due to inadvertent data quality issues. However, given the advantages detailed above, we recommend further work is undertaken to compare web-CAPI and CAPI-only data collection methods for addressing the research priorities of this survey. In particular, if ICCAN want to consider web-CAPI for later waves, they should consider also including a web-pilot that runs in parallel to the CAPI-only.
Given the recommended sample-size (6,500 respondents) and mode of data collection (CAPI-only for the first wave), we recommend rolling fieldwork conducted across all seasons of the year, with targets set to maximise summer-period fieldwork based on what is possible for survey suppliers to deliver in the specific geographies selected. It will be important to ensure that data is collected systematically for all sampled airports and aviation noise exposure bands across the year. For instance, it would not be appropriate to conduct fieldwork in one area first and then move on to another fieldwork area the following month. The sampling design would have to stipulate who is to be interviewed in which period.
We recommend that the new survey makes use of a repeated cross-sectional design and is repeated every 3-5 years. In our discussions with ICCAN and stakeholders, a fully longitudinal
8
design was discounted. However, we recommend that all survey respondents are asked for permission to recontact. This would allow for some elements of longitudinal data collection (or follow-up surveys of sub-samples), should these become desirable in the future.
Questionnaire design and outcome measures
We recommend that the questionnaire developed for the new survey should collect information on annoyance, socio-demographic factors, non-acoustic factors, standardised wellbeing measures, sleep, impact on day-to-day activities and perceptions of change in aviation noise exposure.
The questionnaire should include multiple items on annoyance towards aviation noise, including ICBEN standardised questions on annoyance in the last 12 months, SoNA 2014 items on annoyance during the summer period, and revised questions on annoyance at different times of the day and different periods of flight (take-off, descent, etc).
Standardised measures of wellbeing and sleep quality are to be included in the new survey. For these we recommend the following standardised measures: SWEMWBS, ONS4-life satisfaction, GHQ, and PSQI.
Unless otherwise specified, many of the questions on other topics used in SoNA 2014 could be repurposed for the new survey. We have provided ICCAN with a questionnaire review spreadsheet with details of all SoNA 2014 questions and whether they meet standardised quality criteria. We recommend that some relevant SoNA 2014 items would benefit from streamlining to make them more appropriate for web administration. This is a way of future-proofing the questions if a web-CAPI option were adopted in the future.
New questions should be developed on the following topics: annoyance seeing aircraft; perceived effect of aviation emissions on climate change and air quality; perceived safety of industry; impact of aviation noise on enjoyment of local amenities; updated questions on impacts on day-to-day activities; new questions on coping strategies; and new questions on perceptions of change.
We recommend that any new and updated questions are tested qualitatively with people who are exposed to aviation noise at different levels. This could be done via cognitive interviewing methods commissioned alongside the new survey as part of the survey piloting process.
We anticipate that new questionnaire will be around 35 minutes long (the same as SoNA 2014). Although new questions have been proposed, some of the questions used in SoNA 2014 will be dropped, and others streamlined. Assumptions on questionnaire length will need to be checked during the piloting process.
The new survey should conform to latest ISO standards on social-acoustic surveys on noise effects (TS 15666).

2 Summary of the survey development process
2.1 Background The last Survey of Noise Attitudes (SoNA) (Ref 1) conducted in 2014 is one important piece of evidence on attitudes towards aviation noise and how they relate to aircraft noise exposure indices. However, this data was collected over six years ago, thus there is currently a gap in the evidence. Additionally, there has been debate around the robustness of the methodology used in SoNA 2014, with some stakeholders voicing concerns about the survey’s design and the resulting statistics. In particular, some community stakeholder groups have voiced concerns that the design of SoNA 2014 may have meant levels of annoyance in affected communities could have been underestimated.
Consequently, NatCen have been commissioned by the Independent Commission on Civil Aviation Noise (ICCAN) to help design a new survey on people’s experiences of aviation noise to ensure policy decisions are based on up-to-date evidence. The main aim of the project was to develop a survey that meets the needs of a diverse range of stakeholders and acts as a robust evidence base for policy decisions on aviation noise. The survey design seeks to address the information needs of multiple stakeholders, including community groups, academics, data analysts, industry bodies and government. In order to be able to present the best methodology (or methodologies) for the new survey, the pros and cons of different aspects of survey design have been considered in depth.
2.1.1 Overview of project phases and methods
In the following section, we will briefly describe the process by which we came to the recommendations contained within this report. The project, to date, has consisted of three main work packages, outlined below.
● Work package 1 (WP1): Stakeholder engagement phase. This strand involved a consultation with a wide range of stakeholders and industry experts on various aspects of survey content and design. A series of workshops and telephone interviews were conducted with a variety of stakeholders, including community groups, academics, data analysts, industry bodies and government. Findings from this strand led to the formulation of the research questions that the new survey should aim to address and an outline of the topic areas that are of priority interest to stakeholders. The output of this strand was a brief report outlining stakeholder objectives. More information on this strand can be found in Section 1.2.
● Work package 2 (WP2): Development work on five different strands looking at:
a) Defining the survey population: This strand identified who should be targeted for interview for a future survey, explored the advantages and disadvantages of available metrics of noise exposure, considered strategies to identify people exposed at low
10
levels of aviation noise, and estimated the population exposed to different levels of aviation noise. This strand involved a desk review of the literature, interviews with topical experts, and analysis of noise metrics and population data for selected airports. More information on this strand can be found in Section 1.3.
b) Sampling: This strand examined sampling methods to ensure robust estimates of the relationship between chosen noise exposure metrics and aviation noise annoyance, including strategies to choose which airports to include in the survey, which variables to include in a sampling stratification scheme, the utility of disproportionate sampling and a power analysis of different designs to ensure robust subgroup analysis. This strand used SoNA 2014 data to identify key stratification variables for survey sampling, and power calculation to determine appropriate sample sizes for a future survey based on analytic priorities. More information on this strand can be found in Section 1.3.
c) Mode, timings and frequency: This strand considered the best mode for the survey, how frequently data should be collected and whether data collection should be cross-sectional or longitudinal. The strand involved an expert panel event to discuss possibilities with regard to mode, timing and frequency. It also involved a review of existing aviation noise surveys conducted in the UK and elsewhere, to examine the mode used, how (if at all) the survey dealt with seasonality, and how (if at all) the survey handled change in annoyance and the ‘change-effect’. Finally, the strand involved a coding exercise of all questions asked in SoNA 2014. In the coding exercise, all SoNA 2014 questions were assessed in terms of the potential risk of measurement error were these questions to be used in different modes. More information on this strand can be found in Section 1.4.
d) Questionnaire review: This strand consisted of a desk review of existing noise and annoyance surveys to ascertain which questions should be included in the new survey. The strand consisted of establishing whether the topic areas of interest to stakeholders had been measured in existing questionnaires with a particular focus on the SoNA 2014 questionnaire. In order to assess the quality of the SoNA 2014 questions, a comprehensive desk review was conducted using the Questionnaire Appraisal System (QAS) (Ref 2). When topic areas of interest to stakeholders were not found to be covered in SoNA 2014, we investigated whether they had been measured in other surveys of aviation noise. More information on this strand can be found in Section 1.5.
e) Outcome measure review: A variety of additional outcome measures were reviewed to ascertain which could be included in the new survey. The first part of the strand consisted of a rapid review of the options available for measuring wellbeing, mental health and quality of life. The second part consisted of a rapid review of options for sleep quality measures. In both reviews, a range of options were identified, and information was gathered to examine the pros and cons of each measure. The final element of this strand involved an expert panel of survey practitioners in order to discuss the different ways in which the new survey could collect data on wellbeing, sleep disturbance, the impact of aviation noise on day-to-day activities, and other health measures of relevance. During the panel event, the different options were discussed in terms of the pros and cons as well as the practical considerations involved in their administration. More information on this strand can be found in Section 1.5.
● Work package 3 (WP3): Synthesis of findings and recommendations of different options for the new survey. The aim of this work package was to provide ICCAN with a range of options for survey design, based on the findings from the prior work packages. Four different options for survey design were presented together with a summary of the pros and cons of each approach. Approximate costings for each option were presented. A presentation of these options was then followed by a roundtable discussion with ICCAN to review the shortlisted options.
Interim reports were produced for all the above work packages. All interim reports were reviewed by the project’s advisory board. The board consists of ICCAN and a subset of stakeholders, including government representatives, industry and community group representatives. This was to ensure that stakeholders had the opportunity to provide feedback at each stage of the design process and to provide transparency into what options had been considered and which had been rejected.
The following sections of this report provide a summary of all work conducted to date in each of the work packages. In these sections we provide updated recommendations based on a synthesis of all work conducted to date and feedback from both ICCAN and the advisory group.
It is important to note from the outset that it is not possible to design a survey which answers all possible research questions related to aviation noise. There are trade-offs that will need to be considered in all areas of survey design, which are discussed further below. Given the wide variety of information needs and areas of interest expressed by stakeholders, together with practical and logistical constraints, it will not be possible to investigate every research question posed. Indeed, some research questions are not best addressed using a survey, but rather are much better addressed using, for instance, qualitative research methods or an epidemiological research approach.
The data captured from this survey will deliver a robust evidence base which can be used to inform future policy decisions on aviation noise, but it is important to note that this survey will not be a panacea for understanding all local-level issues relating to aviation noise or giving a full qualitative understanding of individual experiences of noise. Any new national survey is not intended to replace local level consultation or community engagement. The following section provides more details on the stakeholder engagement activities that were undertaken to ascertain what the priorities for the new survey should be.
2.2 Stakeholder engagement The first package of work conducted was a stakeholder consultation with the aim of establishing what the main objectives of the new survey should be. A range of survey objectives were discussed during this consultation. These can be broadly grouped into five research questions, summarised below.
1. What is the relationship between aviation noise exposure and annoyance?
Stakeholders felt it was important to examine the relationship between different noise metrics and annoyance to define an exposure annoyance function. It was felt that the new survey should be able to establish which noise metrics (or combinations of metrics) are most associated with self-
12
reported annoyance within communities. An important issue raised by stakeholders was defining a LOAEL (Lowest Observable Adverse Effect Level): What is the lowest level of aviation noise (using different available noise metrics) at which self-reports of annoyance are detectable within communities, and what percentage of community members report being moderately or strongly annoyed? One key criticism of SoNA 2014 was that the data collected was insufficient to accurately define a LOAEL as it did not collect information from people at lower levels of exposure. Specifically, SoNA 2014 analysis is not based on samples from areas exposed to less than 51 dB LAeq. (Ref 3). The new survey needs to collect evidence on incidence of annoyance within communities with lower levels of exposure, in order to ascertain whether current LOAEL assumptions used in policy making and impact assessments are appropriate.
2. How does annoyance to aviation noise differ by local area and across population groups?
There was a consensus among stakeholders that some specifics of aviation noise exposure (and potential mitigating factors) differ by airport, and there was an appetite to have robust local-level estimates of annoyance. The types of airport level differences discussed included periods of operation, differences in aircraft fleets, type of housing stock around the airport, and/or population demographics around airport. There was a criticism that SoNA 2014 was too ‘Heathrow-centric’ and that annoyance levels are likely to vary by airport and other local factors. It was discussed that including all airports would have an impact on survey scale and cost. No consensus was reached in the stakeholder consultation regarding which airports should be selected, with some participants thinking all should be included, and some acknowledging it would be pragmatic to focus on a smaller number of airports that could be considered representative of different airport types (e.g. in terms of size and extent of operations). The new survey should aim to provide evidence on the extent to which community annoyance may be influenced by the above factors, so that policy makers can be confident that national policies are appropriate in different localities.
3. What factors explain differences in annoyance to aviation noise?
Stakeholders were interested in determining the relative influence of a variety of acoustic and non-acoustic factors in explaining differences in annoyance. Participants in the workshops gave a range of non-acoustic factors which they felt could influence the impact of noise on annoyance. Factors discussed included:
● Type of accommodation (flat or house, tenure, types of insulation, access to outside space);
● How noise impacts on day-to-day activities (e.g. use of garden and other outdoor spaces, impact on work, impact on recreational activities);
● Concerns over personal impact (property price, loss of tranquillity, sleep disturbance, perceptions on wellbeing and quality of life);
● Attitudes towards the local airport and the aviation industry in general (in terms of employment, impact on local economy, accountability, community engagement, trust, climate change, safety).
A wide variety of both acoustic and non-acoustic factors were raised by stakeholders. Further examples are discussed in Section 1.5 on questionnaire design.
4. What is the impact of aviation noise on overall health and wellbeing?
Stakeholders discussed various health outcomes that they were interested in, including measures related to sleep, wellbeing, quality of life, mental health and physical health. It was, however, felt by some stakeholders that physiological health outcomes should not be the main focus of the new survey, given that specific health outcomes (such as risk of cardio-vascular incidents) are better addressed by epidemiological research methods.
5. How do changes in exposure to aviation noise affect annoyance?
There was a consensus across all workshops that it is important to investigate how changes in exposure impact on levels of annoyance. Participants were interested in a range of different changes to aviation noise exposure. The main types of changes discussed were:
● Impact on newly or recently overflown residents (with exploration of how long post exposure change effects persist);
● Changes in flight paths, including the introduction of Performance-Based Navigation (PBN) routes;
● Changes in flight times;
● Changes in flight concentration, including changes relating to residents who experience respite;
● Changes in types of aircraft.
Community groups were interested in measuring the impact of changes that have already been introduced and using these as evidence on how potential future changes could impact on affected residents. It should be noted that some community group representatives felt that conducting new ‘pre-change’ and ‘post-change’ research would not be appropriate, as residents would have to experience potentially detrimental changes for the research to be conducted. These representatives felt that data on the impact of change should either be collected retrospectively or by a more thorough examination of existing evidence on the topic of change-effects.
Representatives from the aviation industry were also interested in measuring factors that influence change in annoyance levels over time. Representatives wanted to assess the impact of local interventions on annoyance, and to try and establish which types of intervention are most effective at reducing annoyance levels. This group also discussed an interest in measuring attitudes towards prospective interventions and which of these would be most popular.
2.2.1 Research aims based on stakeholder consultation It was agreed that designing one survey to answer all research questions of interest would be counterproductive and pose large risks to the quality of the data being collected. It was acknowledged that a single new survey would be unable to address all research aims listed by stakeholders during the consultation effectively. This is because some research methods would be best to address some questions but inappropriate or inefficient to address other questions. Consequently, a need was identified to prioritise which research question(s) the new survey should focus on, and which research questions should be addressed using other methods.
14
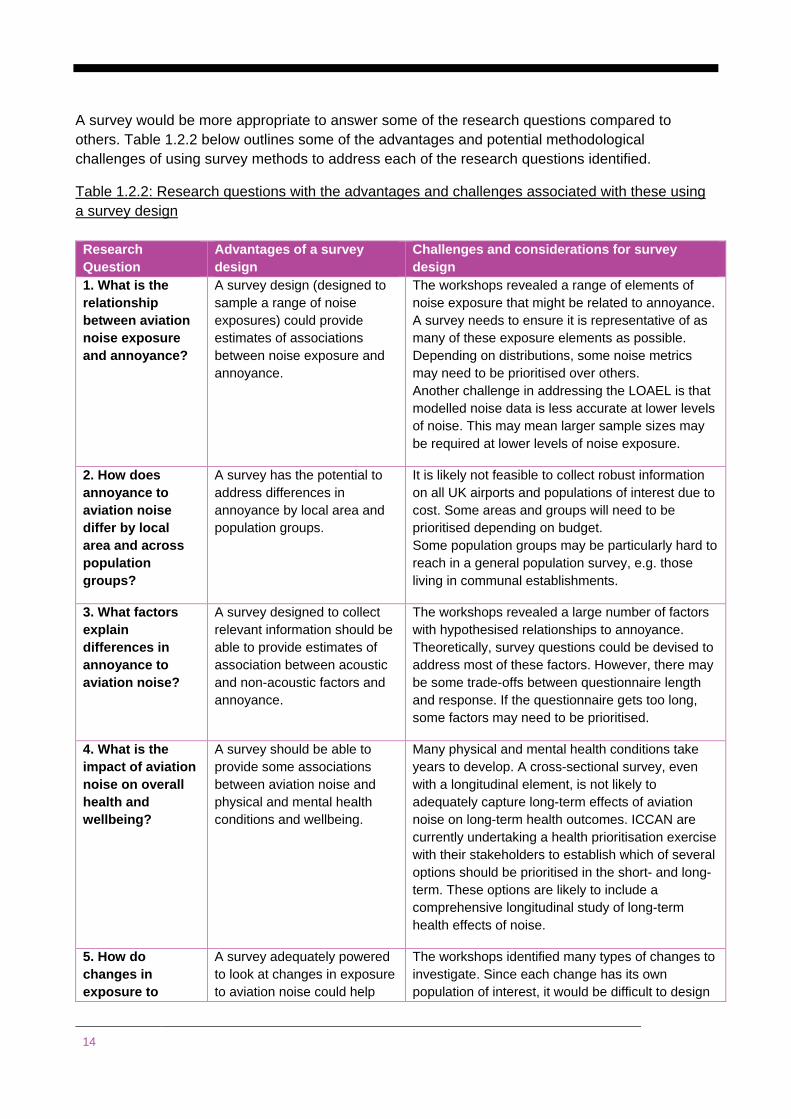
A survey would be more appropriate to answer some of the research questions compared to others. Table 1.2.2 below outlines some of the advantages and potential methodological challenges of using survey methods to address each of the research questions identified.
Table 1.2.2: Research questions with the advantages and challenges associated with these using a survey design
Research Question
Advantages of a survey design
Challenges and considerations for survey design
1. What is the relationship between aviation noise exposure and annoyance?
A survey design (designed to sample a range of noise exposures) could provide estimates of associations between noise exposure and annoyance.
The workshops revealed a range of elements of noise exposure that might be related to annoyance. A survey needs to ensure it is representative of as many of these exposure elements as possible. Depending on distributions, some noise metrics may need to be prioritised over others. Another challenge in addressing the LOAEL is that modelled noise data is less accurate at lower levels of noise. This may mean larger sample sizes may be required at lower levels of noise exposure.
2. How does annoyance to aviation noise differ by local area and across population groups?
A survey has the potential to address differences in annoyance by local area and population groups.
It is likely not feasible to collect robust information on all UK airports and populations of interest due to cost. Some areas and groups will need to be prioritised depending on budget. Some population groups may be particularly hard to reach in a general population survey, e.g. those living in communal establishments.
3. What factors explain differences in annoyance to aviation noise?
A survey designed to collect relevant information should be able to provide estimates of association between acoustic and non-acoustic factors and annoyance.
The workshops revealed a large number of factors with hypothesised relationships to annoyance. Theoretically, survey questions could be devised to address most of these factors. However, there may be some trade-offs between questionnaire length and response. If the questionnaire gets too long, some factors may need to be prioritised.
4. What is the impact of aviation noise on overall health and wellbeing?
A survey should be able to provide some associations between aviation noise and physical and mental health conditions and wellbeing.
Many physical and mental health conditions take years to develop. A cross-sectional survey, even with a longitudinal element, is not likely to adequately capture long-term effects of aviation noise on long-term health outcomes. ICCAN are currently undertaking a health prioritisation exercise with their stakeholders to establish which of several options should be prioritised in the short- and long-term. These options are likely to include a comprehensive longitudinal study of long-term health effects of noise.
5. How do changes in exposure to
A survey adequately powered to look at changes in exposure to aviation noise could help
The workshops identified many types of changes to investigate. Since each change has its own population of interest, it would be difficult to design
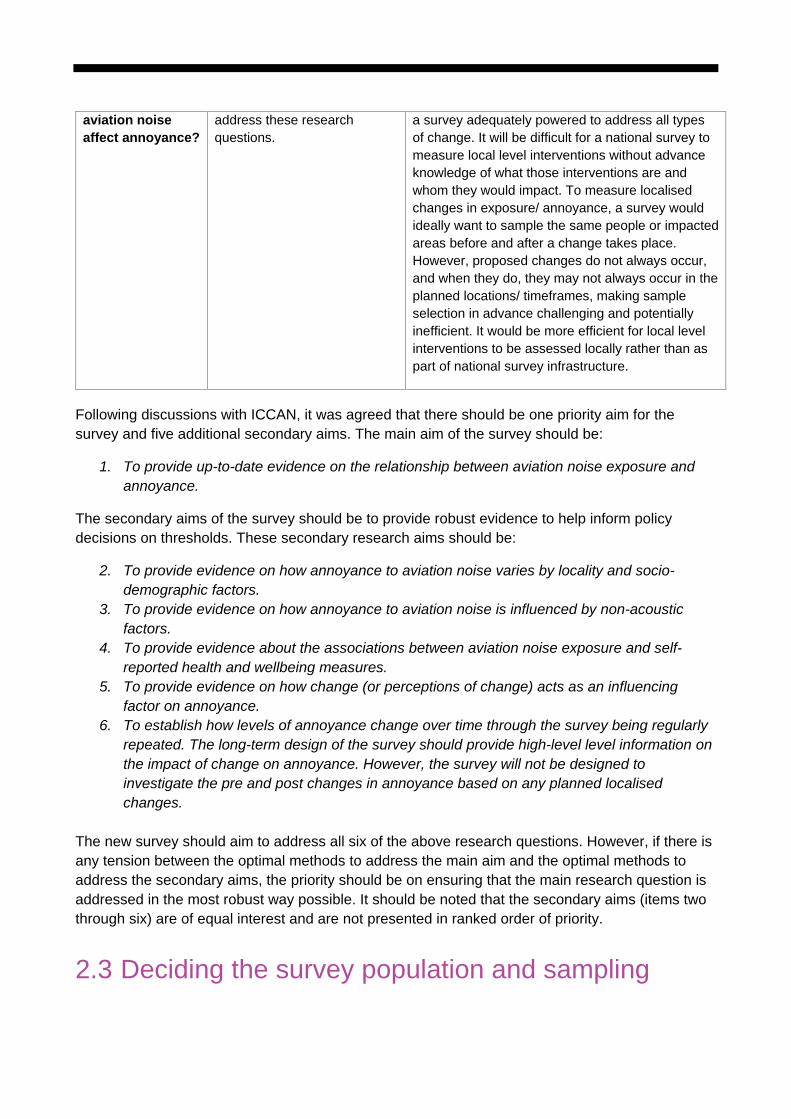
aviation noise affect annoyance?
address these research questions.
a survey adequately powered to address all types of change. It will be difficult for a national survey to measure local level interventions without advance knowledge of what those interventions are and whom they would impact. To measure localised changes in exposure/ annoyance, a survey would ideally want to sample the same people or impacted areas before and after a change takes place. However, proposed changes do not always occur, and when they do, they may not always occur in the planned locations/ timeframes, making sample selection in advance challenging and potentially inefficient. It would be more efficient for local level interventions to be assessed locally rather than as part of national survey infrastructure.
Following discussions with ICCAN, it was agreed that there should be one priority aim for the survey and five additional secondary aims. The main aim of the survey should be:
1. To provide up-to-date evidence on the relationship between aviation noise exposure and annoyance.
The secondary aims of the survey should be to provide robust evidence to help inform policy decisions on thresholds. These secondary research aims should be:
2. To provide evidence on how annoyance to aviation noise varies by locality and socio-demographic factors.
3. To provide evidence on how annoyance to aviation noise is influenced by non-acoustic factors.
4. To provide evidence about the associations between aviation noise exposure and self-reported health and wellbeing measures.
5. To provide evidence on how change (or perceptions of change) acts as an influencing factor on annoyance.
6. To establish how levels of annoyance change over time through the survey being regularly repeated. The long-term design of the survey should provide high-level level information on the impact of change on annoyance. However, the survey will not be designed to investigate the pre and post changes in annoyance based on any planned localised changes.
The new survey should aim to address all six of the above research questions. However, if there is any tension between the optimal methods to address the main aim and the optimal methods to address the secondary aims, the priority should be on ensuring that the main research question is addressed in the most robust way possible. It should be noted that the secondary aims (items two through six) are of equal interest and are not presented in ranked order of priority.
2.3 Deciding the survey population and sampling

16
In the following sections we provide a summary of how the population of interest should be defined for the new survey and how people from within this population should be selected to take part.
2.3.1 Deciding who should be included in the survey A key issue in a future survey will be deciding who to ask about their attitudes towards aviation noise. In a context of limited resources, where it won’t be possible to ask everyone in the UK about their attitudes towards aviation noise, some decisions will need to be made about how to define an appropriate target population. Once a relevant population is identified, we will need to come up with a way of selecting people to participate in the survey, so that the sampled population is representative of the target population.
Our focus in this section is to explore ways of identifying an appropriate target population for a future survey, with a view to design a sampling strategy to meet the key aims identified by stakeholders. As outlined in the previous section, the primary purpose of the future survey will be to provide up-to-date evidence on the relationship between aviation noise exposure and annoyance. Like other surveys on aviation noise annoyance, we suggest limiting the target population to people currently exposed to aviation noise. It is important to note that this strategy prioritises measuring current relationships between aviation noise and annoyance over aims related to assessing the impacts of those who have recently become exposed to aviation noise (or who may become exposed in the future).
Some stakeholders have said it is highly likely that airspace modernisation and airport developments will lead to newly exposed populations, and these people may be of significant interest. However, practically, including people that are not currently exposed to aviation noise, but who may be in the future, is challenging. It can be difficult to reliably identify these populations (as planned aviation related developments change). Further, in a context of limited resources, collecting information on people who are not currently exposed to aviation noise may be inefficient as it reduces the number of people currently exposed to aviation noise who can be included in the survey.
Deciding who is, and who is not, currently exposed to aviation noise is also not straightforward. One approach could be to define people who can hear aviation noise as currently exposed. However, not all people process noise in the same way, so some people may not notice noise even if it is present and having an impact on their health. Both the complexity of sound as a physical quantity (because of its temporal and frequency characteristics) and the complexity of people's physiological reaction to noise, make noise exposure a multifaceted and complex concept. Notably for this development work, aviation noise exposure is influenced by different elements (for instance timing, frequency, intensity), each of which may have a different relationship with annoyance. The quantification of different elements of aviation noise exposure into usable metrics presents challenges.
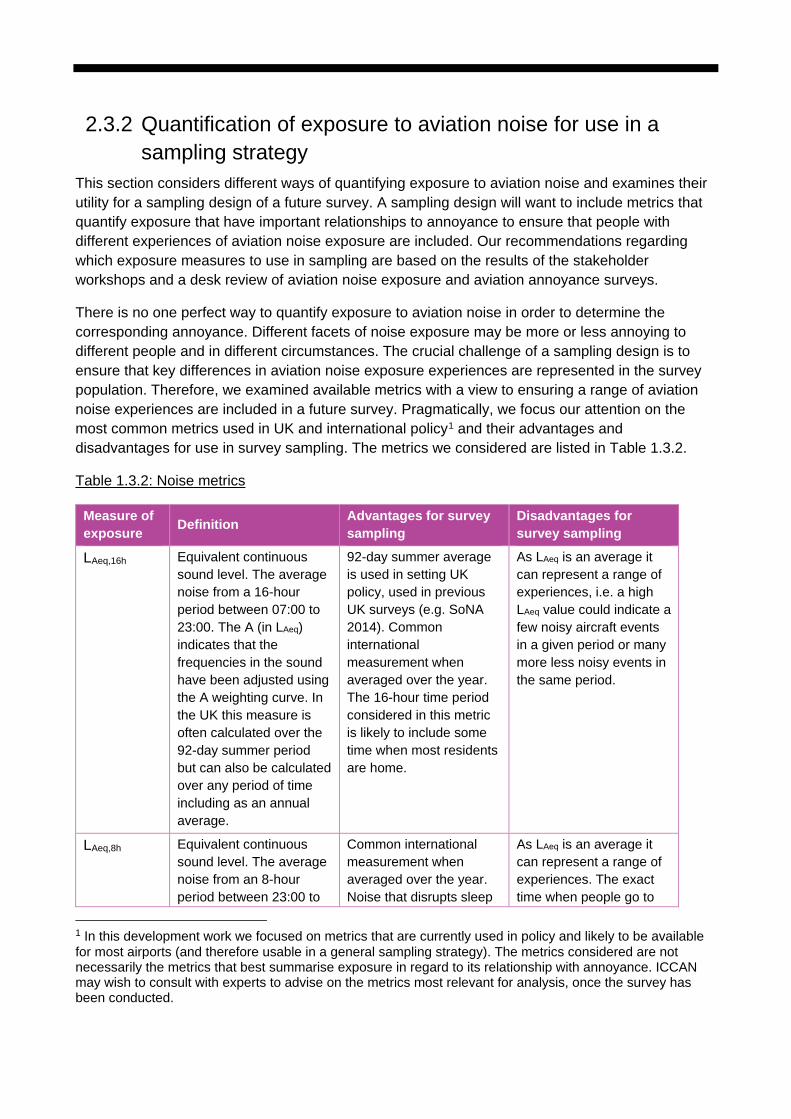
2.3.2 Quantification of exposure to aviation noise for use in a sampling strategy
This section considers different ways of quantifying exposure to aviation noise and examines their utility for a sampling design of a future survey. A sampling design will want to include metrics that quantify exposure that have important relationships to annoyance to ensure that people with different experiences of aviation noise exposure are included. Our recommendations regarding which exposure measures to use in sampling are based on the results of the stakeholder workshops and a desk review of aviation noise exposure and aviation annoyance surveys.
There is no one perfect way to quantify exposure to aviation noise in order to determine the corresponding annoyance. Different facets of noise exposure may be more or less annoying to different people and in different circumstances. The crucial challenge of a sampling design is to ensure that key differences in aviation noise exposure experiences are represented in the survey population. Therefore, we examined available metrics with a view to ensuring a range of aviation noise experiences are included in a future survey. Pragmatically, we focus our attention on the most common metrics used in UK and international policy1 and their advantages and disadvantages for use in survey sampling. The metrics we considered are listed in Table 1.3.2.
Table 1.3.2: Noise metrics
Measure of exposure Definition Advantages for survey
sampling Disadvantages for survey sampling
LAeq,16h Equivalent continuous sound level. The average noise from a 16-hour period between 07:00 to 23:00. The A (in LAeq) indicates that the frequencies in the sound have been adjusted using the A weighting curve. In the UK this measure is often calculated over the 92-day summer period but can also be calculated over any period of time including as an annual average.
92-day summer average is used in setting UK policy, used in previous UK surveys (e.g. SoNA 2014). Common international measurement when averaged over the year. The 16-hour time period considered in this metric is likely to include some time when most residents are home.
As LAeq is an average it can represent a range of experiences, i.e. a high LAeq value could indicate a few noisy aircraft events in a given period or many more less noisy events in the same period.
LAeq,8h Equivalent continuous sound level. The average noise from an 8-hour period between 23:00 to
Common international measurement when averaged over the year. Noise that disrupts sleep
As LAeq is an average it can represent a range of experiences. The exact time when people go to
1 In this development work we focused on metrics that are currently used in policy and likely to be available for most airports (and therefore usable in a general sampling strategy). The metrics considered are not necessarily the metrics that best summarise exposure in regard to its relationship with annoyance. ICCAN may wish to consult with experts to advise on the metrics most relevant for analysis, once the survey has been conducted.
18
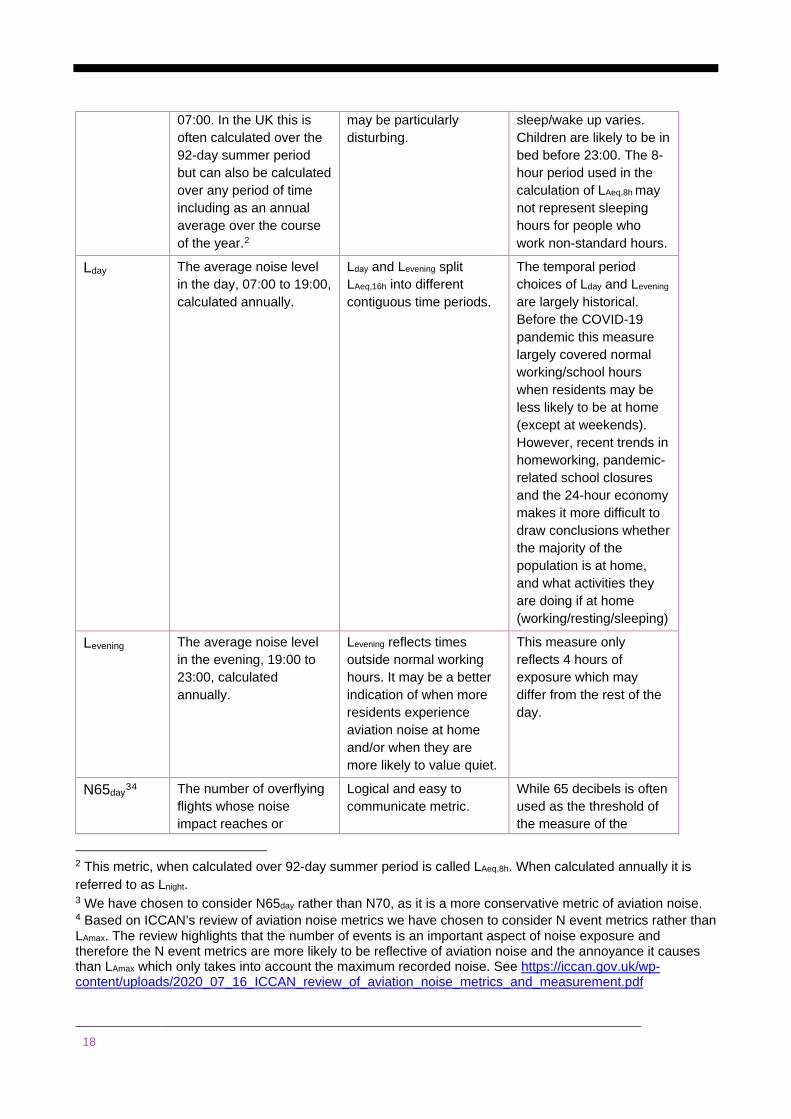
07:00. In the UK this is often calculated over the 92-day summer period but can also be calculated over any period of time including as an annual average over the course of the year.2
may be particularly disturbing.
sleep/wake up varies. Children are likely to be in bed before 23:00. The 8-hour period used in the calculation of LAeq,8h may not represent sleeping hours for people who work non-standard hours.
Lday The average noise level in the day, 07:00 to 19:00, calculated annually.
Lday and Levening split LAeq,16h into different contiguous time periods.
The temporal period choices of Lday and Levening are largely historical. Before the COVID-19 pandemic this measure largely covered normal working/school hours when residents may be less likely to be at home (except at weekends). However, recent trends in homeworking, pandemic-related school closures and the 24-hour economy makes it more difficult to draw conclusions whether the majority of the population is at home, and what activities they are doing if at home (working/resting/sleeping)
Levening The average noise level in the evening, 19:00 to 23:00, calculated annually.
Levening reflects times outside normal working hours. It may be a better indication of when more residents experience aviation noise at home and/or when they are more likely to value quiet.
This measure only reflects 4 hours of exposure which may differ from the rest of the day.
N65day34 The number of overflying flights whose noise impact reaches or
Logical and easy to communicate metric.
While 65 decibels is often used as the threshold of the measure of the
2 This metric, when calculated over 92-day summer period is called LAeq,8h. When calculated annually it is referred to as Lnight. 3 We have chosen to consider N65day rather than N70, as it is a more conservative metric of aviation noise. 4 Based on ICCAN’s review of aviation noise metrics we have chosen to consider N event metrics rather than LAmax. The review highlights that the number of events is an important aspect of noise exposure and therefore the N event metrics are more likely to be reflective of aviation noise and the annoyance it causes than LAmax which only takes into account the maximum recorded noise. See https://iccan.gov.uk/wp-content/uploads/2020_07_16_ICCAN_review_of_aviation_noise_metrics_and_measurement.pdf
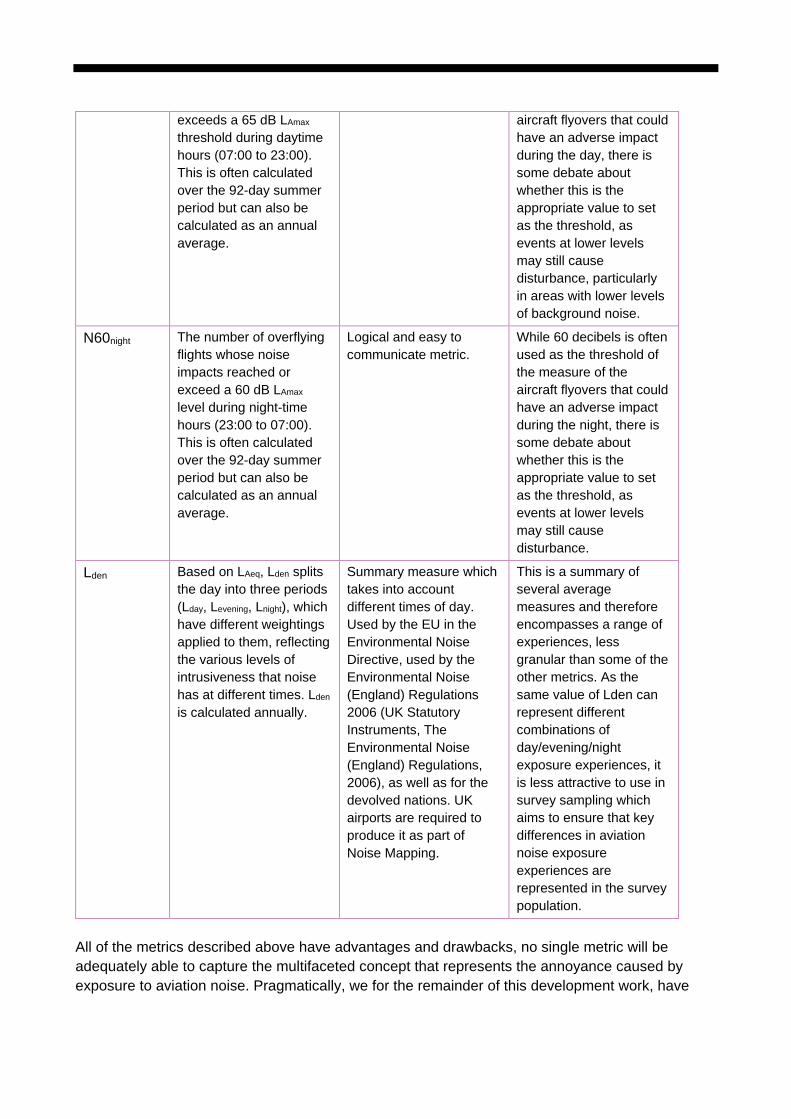
exceeds a 65 dB LAmax threshold during daytime hours (07:00 to 23:00). This is often calculated over the 92-day summer period but can also be calculated as an annual average.
aircraft flyovers that could have an adverse impact during the day, there is some debate about whether this is the appropriate value to set as the threshold, as events at lower levels may still cause disturbance, particularly in areas with lower levels of background noise.
N60night The number of overflying flights whose noise impacts reached or exceed a 60 dB LAmax
level during night-time hours (23:00 to 07:00). This is often calculated over the 92-day summer period but can also be calculated as an annual average.
Logical and easy to communicate metric.
While 60 decibels is often used as the threshold of the measure of the aircraft flyovers that could have an adverse impact during the night, there is some debate about whether this is the appropriate value to set as the threshold, as events at lower levels may still cause disturbance.
Lden Based on LAeq, Lden splits the day into three periods (Lday, Levening, Lnight), which have different weightings applied to them, reflecting the various levels of intrusiveness that noise has at different times. Lden is calculated annually.
Summary measure which takes into account different times of day. Used by the EU in the Environmental Noise Directive, used by the Environmental Noise (England) Regulations 2006 (UK Statutory Instruments, The Environmental Noise (England) Regulations, 2006), as well as for the devolved nations. UK airports are required to produce it as part of Noise Mapping.
This is a summary of several average measures and therefore encompasses a range of experiences, less granular than some of the other metrics. As the same value of Lden can represent different combinations of day/evening/night exposure experiences, it is less attractive to use in survey sampling which aims to ensure that key differences in aviation noise exposure experiences are represented in the survey population.
All of the metrics described above have advantages and drawbacks, no single metric will be adequately able to capture the multifaceted concept that represents the annoyance caused by exposure to aviation noise. Pragmatically, we for the remainder of this development work, have

20
employed a two-step approach. As a first step we have chosen to investigate population distributions by LAeq,16h in order to be consistent with current UK policy thresholds and previous surveys of aviation noise.
However, we also suggest it is not enough to only consider LAeq,16h as the only measure of exposure in survey sampling as similar levels of LAeq,16h are likely to represent a range of aviation noise experiences. Therefore, as a second step we examine using other metrics, in particular: LAeq,8h, N65day and N60night in conjunction with LAeq,16h in both our estimates of population in Section 1.3.4 and in our investigations of a sampling stratification scheme in Section 1.3.7.
2.3.3 Strategies to define populations exposed to levels of aviation noise <51dB LAeq,16hr
Results from the stakeholder consultation identified populations exposed to levels of aviation noise <51 dB LAeq,16h as a vital subgroup of interest for a future survey. However, estimating the population exposed to aviation noise at these lower levels and ensuring they are adequately included in survey sampling presents real challenges for two main reasons. First, is quantification. Our main quantity of exposure under examination, LAeq,16h, is a calculated value based on numerous factors including: the number of aircraft, the emitted noise of different types of aircraft, aircraft paths and altitude, weather conditions and wind direction. Modelled estimates are then adjusted based on the results of noise monitoring. At lower levels of exposure, however, aviation noise becomes hard to distinguish from other sources of noise (such as road traffic noise). Therefore, estimates of LAeq,16h are more difficult to quantify at lower levels and modelled estimates are less accurate because of inherent uncertainties over sound propagation and other factors.
Secondly, there are a huge number of addresses in these exposure bands. A challenge for population estimation will be to identify which addresses that are exposed to aviation noise at these levels should be prioritised to interview in a future survey. From a sampling perspective it will be important to ensure a range of experiences from residents at lower levels of aviation noise exposure are represented in a survey. Having a range of different experiences will allow for a more accurate estimate of overall prevalence of annoyance in the <51 dB LAeq,16h band and may support analyses to examine which aspects of exposure at these levels are most related to annoyance.
In this development work we considered three potential strategies of characterising addresses exposed to these lower levels of aviation noise (<51 dB LAeq,16h ) to ensure that a future survey can include a range of experiences in any sampling strategy. Each of these has pros and cons, and there are some trade-offs between ease of computation and availability, and targeting those known to have aviation noise exposure and being able to represent other types of noise exposure. The three strategies considered were:
● Distance to airports: this strategy would use distance from an airport as a way of further classifying addresses exposed below 51 dB LAeq,16h.
● Road traffic noise: this strategy would classify addresses exposed below 51 dB LAeq,16h by their exposure to road traffic noise (as a proxy for background noise). A sampling strategy could then ensure that addresses with different levels of background noise were selected to be included in a future survey.

● Overflight metrics: this strategy would use overflight metrics (or similar radar-based data) to help identify those in low exposure bands who experience frequent aviation activity.
The advantages and disadvantages are more thoroughly discussed in the WP2A&B report. In summary, both distance to airports and road noise exposure have some advantages for use in the sampling strategy of a future survey. However, given the key focus of a future survey on determining the relationship between aviation noise and annoyance, overflight metrics appear to be the most promising strategy for ensuring a range of aviation noise experiences at levels of aviation noise exposure <51 dB LAeq,16h. Sampling at levels of aviation noise exposure <51 dB, presents challenges and will require a separate sampling strategy to the rest of the survey.
What is the lowest level of exposure that is feasible to include in a target population for a future survey?
The stakeholder workshops suggested that there is policy interest around research questions examining relationships between exposure and annoyance among populations exposed at levels down to approximately 40 dB LAeq,16h. Practically, however, we suggest it will not be feasible to include populations exposed at these low levels. Recent conversations with the CAA suggest that the exposure data at <45 dB LAeq,16h (48 dB LAeq,16h around Heathrow airport) is currently too unreliable to use in the definition of a target population.5 The availability and quality of data quantifying exposure at levels of <51 dB will differ by airport. Currently most airports only produce contours down to 51 dB. Estimating exposure contours below these levels will take a significant amount of time and resource. We understand ICCAN is currently in discussions with the CAA about the investment required to improve uncertainty around estimates of exposure at levels <51 dB. If estimation improves, we would suggest including populations exposed at levels down to 42 dB (i.e. one extra 3 dB contour) in a target population for the survey.
2.3.4 Population distributions of residents exposed to aviation noise around selected airports
The primary objective of a sampling strategy is to ensure that people experiencing different types of aviation noise exposure are adequately represented in a future survey. This section examines the distribution of residential addresses by key exposure metrics to help inform a sampling strategy for a future survey.
We obtained postcode-level data from the CAA on Summer (92-day) 2018 measures of LAeq,16h, LAeq,8h, N65day and N60night for the airports listed in Table 1.3.4a. below.
Table 1.3.4a: Availability of noise metric data by airport
BHX EDI LGW LHR MAN NCL SOU STD
5 While recent discussions suggest that exposure data at levels of 45-50 dB is useable for sampling in a future survey, we would like to highlight that there are still some uncertainties around exposure estimates in this range. We therefore suggest using 45-50 as a single exposure band for sampling, rather than breaking it down into 3 dB bands.
22
LAeq,16h X x x X x x x x
LAeq,8h X x X x x
N65day X x x X x x x x
N60night X x X x x
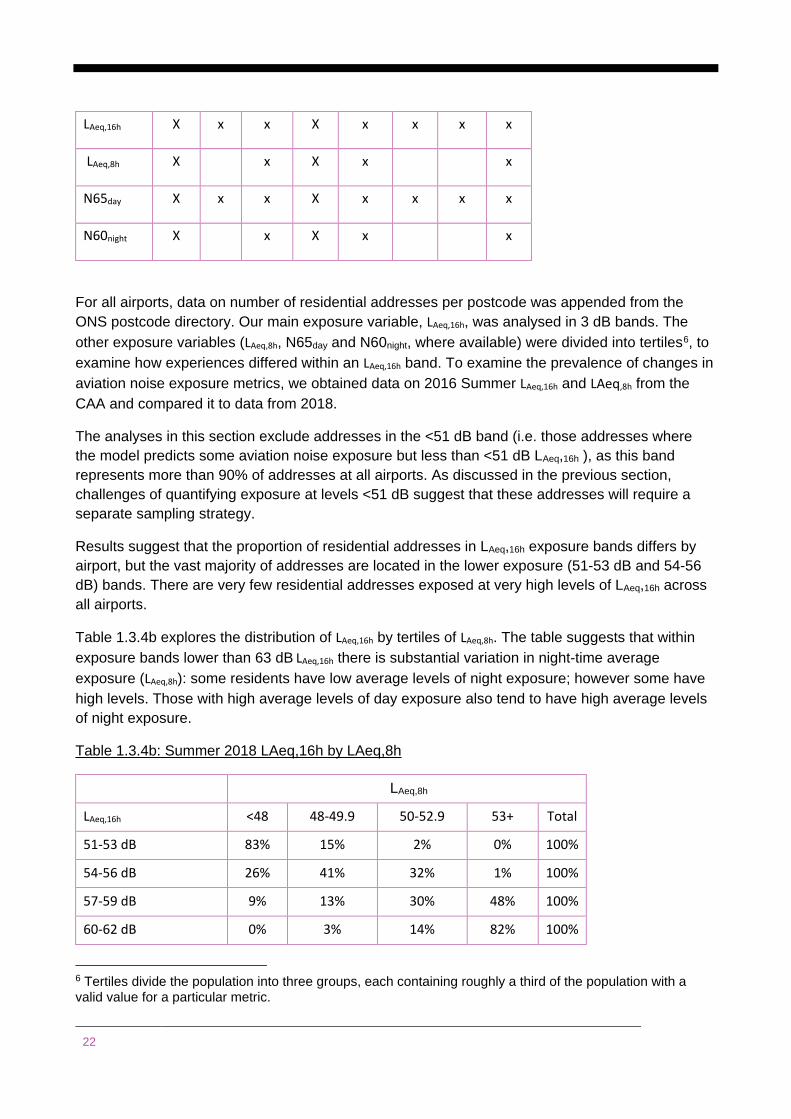
For all airports, data on number of residential addresses per postcode was appended from the ONS postcode directory. Our main exposure variable, LAeq,16h, was analysed in 3 dB bands. The other exposure variables (LAeq,8h, N65day and N60night, where available) were divided into tertiles6, to examine how experiences differed within an LAeq,16h band. To examine the prevalence of changes in aviation noise exposure metrics, we obtained data on 2016 Summer LAeq,16h and LAeq,8h from the CAA and compared it to data from 2018.
The analyses in this section exclude addresses in the <51 dB band (i.e. those addresses where the model predicts some aviation noise exposure but less than <51 dB LAeq,16h ), as this band represents more than 90% of addresses at all airports. As discussed in the previous section, challenges of quantifying exposure at levels <51 dB suggest that these addresses will require a separate sampling strategy.
Results suggest that the proportion of residential addresses in LAeq,16h exposure bands differs by airport, but the vast majority of addresses are located in the lower exposure (51-53 dB and 54-56 dB) bands. There are very few residential addresses exposed at very high levels of LAeq,16h across all airports.
Table 1.3.4b explores the distribution of LAeq,16h by tertiles of LAeq,8h. The table suggests that within exposure bands lower than 63 dB LAeq,16h there is substantial variation in night-time average exposure (LAeq,8h): some residents have low average levels of night exposure; however some have high levels. Those with high average levels of day exposure also tend to have high average levels of night exposure.
Table 1.3.4b: Summer 2018 LAeq,16h by LAeq,8h
LAeq,8h
LAeq,16h <48 48-49.9 50-52.9 53+ Total
51-53 dB 83% 15% 2% 0% 100%
54-56 dB 26% 41% 32% 1% 100%
57-59 dB 9% 13% 30% 48% 100%
60-62 dB 0% 3% 14% 82% 100%
6 Tertiles divide the population into three groups, each containing roughly a third of the population with a valid value for a particular metric.
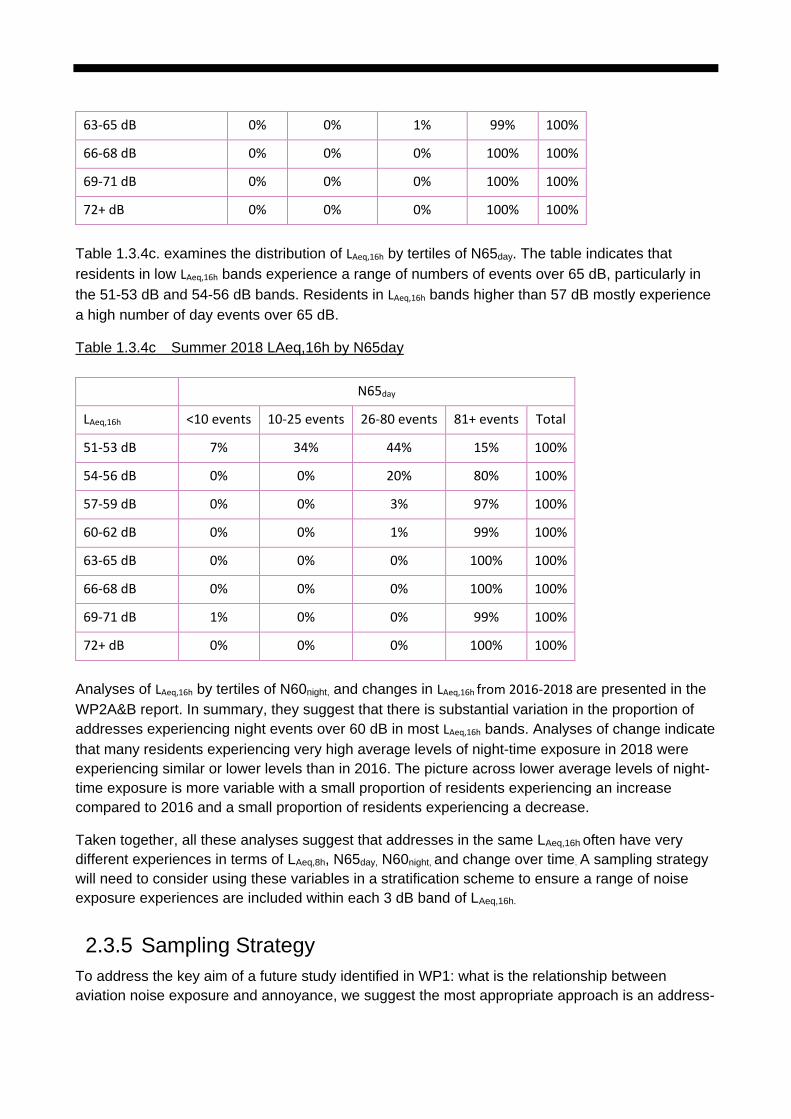
63-65 dB 0% 0% 1% 99% 100%
66-68 dB 0% 0% 0% 100% 100%
69-71 dB 0% 0% 0% 100% 100%
72+ dB 0% 0% 0% 100% 100%
Table 1.3.4c. examines the distribution of LAeq,16h by tertiles of N65day. The table indicates that residents in low LAeq,16h bands experience a range of numbers of events over 65 dB, particularly in the 51-53 dB and 54-56 dB bands. Residents in LAeq,16h bands higher than 57 dB mostly experience a high number of day events over 65 dB.
Table 1.3.4c Summer 2018 LAeq,16h by N65day
N65day
LAeq,16h <10 events 10-25 events 26-80 events 81+ events Total
51-53 dB 7% 34% 44% 15% 100%
54-56 dB 0% 0% 20% 80% 100%
57-59 dB 0% 0% 3% 97% 100%
60-62 dB 0% 0% 1% 99% 100%
63-65 dB 0% 0% 0% 100% 100%
66-68 dB 0% 0% 0% 100% 100%
69-71 dB 1% 0% 0% 99% 100%
72+ dB 0% 0% 0% 100% 100%
Analyses of LAeq,16h by tertiles of N60night, and changes in LAeq,16h from 2016-2018 are presented in the WP2A&B report. In summary, they suggest that there is substantial variation in the proportion of addresses experiencing night events over 60 dB in most LAeq,16h bands. Analyses of change indicate that many residents experiencing very high average levels of night-time exposure in 2018 were experiencing similar or lower levels than in 2016. The picture across lower average levels of night-time exposure is more variable with a small proportion of residents experiencing an increase compared to 2016 and a small proportion of residents experiencing a decrease.
Taken together, all these analyses suggest that addresses in the same LAeq,16h often have very different experiences in terms of LAeq,8h, N65day, N60night, and change over time. A sampling strategy will need to consider using these variables in a stratification scheme to ensure a range of noise exposure experiences are included within each 3 dB band of LAeq,16h.
2.3.5 Sampling Strategy To address the key aim of a future study identified in WP1: what is the relationship between aviation noise exposure and annoyance, we suggest the most appropriate approach is an address-
24
based survey aimed to represent residential populations exposed to aviation noise around airports. This type of approach will require a 2-stage sampling process. First, airports will need to be selected into the survey, and then we suggest a stratified random probability sample of addresses exposed to aviation noise around each selected airport.
An address-based approach at the second stage will be able to sample potential respondents based on their residential exposure to aviation noise and ensure a wide range of experiences are included in a sample. It is important to note, however, that there are several disadvantages to this approach regarding the survey aims. For instance, an approach based on residential addresses is not able to include populations who do not live in an area but do work or attend school in that area which is exposed to aviation noise. Furthermore, an address-based approach cannot easily ensure adequate samples of respondents based on relatively rare personal characteristics (such as presence of certain health conditions). However, we suggest it is the approach most appropriate to meet the key and secondary aims of a future survey outlined in Section 1.1.2. This is the same basic approach used in SoNA 2014.
Much of this work draws on the population distributions estimated in the previous section to make recommendations on sampling strategy. The distributions outlined in Section 1.3.4 relate to summer 2018. The recent COVID-19 pandemic has enormous implications for the aviation industry, and distributions of populations exposed to aviation noise may have changed substantially as a result. Vastly different population distributions may have implications for an optimal sampling strategy. We recommend post-March 2020 population distributions are examined once exposure data becomes available.
2.3.6 Selection of Airports The first stage of the 2-stage selection process we recommend for a future survey is determining which airports should be included. As choice of airports was discussed in the stakeholder workshops at length, it is useful to highlight some of the key findings from those discussions:
SoNA 2014 included the following airports: Birmingham, East Midlands, Gatwick, Heathrow, London City, Luton, Manchester, Newcastle and Stansted (though sample sizes around some airports were very small). As airports have different noise exposure patterns, there was an appetite for a broader range of airports to be included in a future survey. Stakeholders suggested several important differences between airports which should be considered such as airport size, urban/rural location of residents exposed to noise, respite from noise, presence of night noise, and recent changes in aircraft patterns.
From a local policy perspective, the survey will be of limited use to individual airports unless they can draw robust airport level conclusions on the relationship between aviation noise exposure and annoyance. Different airports may have different views on how many respondents are necessary to be able to inform policy decisions.
How many airports should be included in the survey?
This will largely depend on the budget for the survey. For a given sample size of a future survey, there is a trade-off between ensuring estimates of annoyance are robust at the airport level (and having a larger sample size per airport) and including more airports (with smaller target sample
sizes). ICCAN will need to decide whether inclusivity or robustness of estimates should be prioritised for a future survey. For a discussion around the total sample size of a future survey, see Section 1.3.8.
Which airports should be included?
Assuming budgetary constraints will not allow for a census of airports to be taken, we outline some potential strategies for selecting airports and discuss their advantages and disadvantages below. All of these strategies rely on setting up a sample frame of airports, i.e. a list of every airport (with commercial flights) in the UK. We suggest the sample frame of airports should include measures of airport size, urban/rural location of residents exposed to noise, presence or absence of night noise, and availability of aviation noise exposure data. An example sample frame is presented in the WP2A&B report.
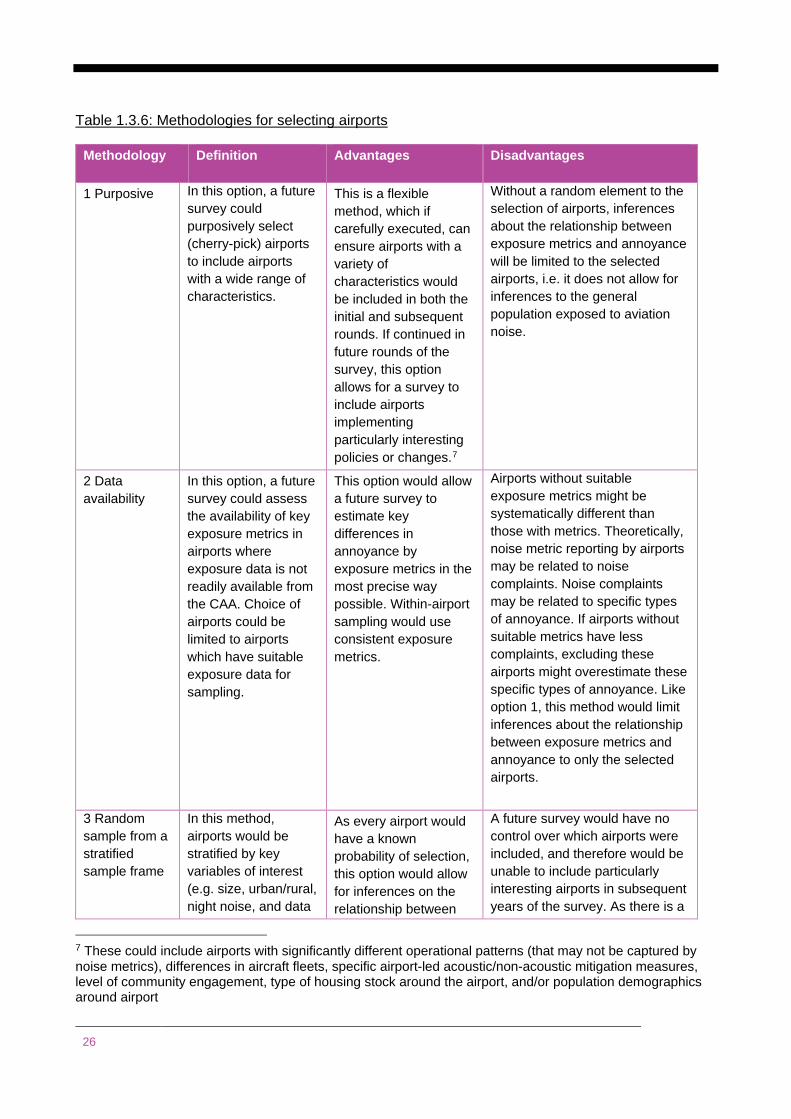
In Table 1.3.6 we outline some potential methodologies for choosing which airports should be included in a future survey. The choice of methodology on airport selection involves trade-offs between making inferences to the general population, precision of estimates, and flexibility to include airports undergoing particularly interesting changes. When assessing these options, it is worth considering how future years of a survey may be affected.
26
Table 1.3.6: Methodologies for selecting airports
Methodology Definition Advantages Disadvantages
1 Purposive In this option, a future survey could purposively select (cherry-pick) airports to include airports with a wide range of characteristics.
This is a flexible method, which if carefully executed, can ensure airports with a variety of characteristics would be included in both the initial and subsequent rounds. If continued in future rounds of the survey, this option allows for a survey to include airports implementing particularly interesting policies or changes.7
Without a random element to the selection of airports, inferences about the relationship between exposure metrics and annoyance will be limited to the selected airports, i.e. it does not allow for inferences to the general population exposed to aviation noise.
2 Data availability
In this option, a future survey could assess the availability of key exposure metrics in airports where exposure data is not readily available from the CAA. Choice of airports could be limited to airports which have suitable exposure data for sampling.
This option would allow a future survey to estimate key differences in annoyance by exposure metrics in the most precise way possible. Within-airport sampling would use consistent exposure metrics.
Airports without suitable exposure metrics might be systematically different than those with metrics. Theoretically, noise metric reporting by airports may be related to noise complaints. Noise complaints may be related to specific types of annoyance. If airports without suitable metrics have less complaints, excluding these airports might overestimate these specific types of annoyance. Like option 1, this method would limit inferences about the relationship between exposure metrics and annoyance to only the selected airports.
3 Random sample from a stratified sample frame
In this method, airports would be stratified by key variables of interest (e.g. size, urban/rural, night noise, and data
As every airport would have a known probability of selection, this option would allow for inferences on the relationship between
A future survey would have no control over which airports were included, and therefore would be unable to include particularly interesting airports in subsequent years of the survey. As there is a
7 These could include airports with significantly different operational patterns (that may not be captured by noise metrics), differences in aircraft fleets, specific airport-led acoustic/non-acoustic mitigation measures, level of community engagement, type of housing stock around the airport, and/or population demographics around airport
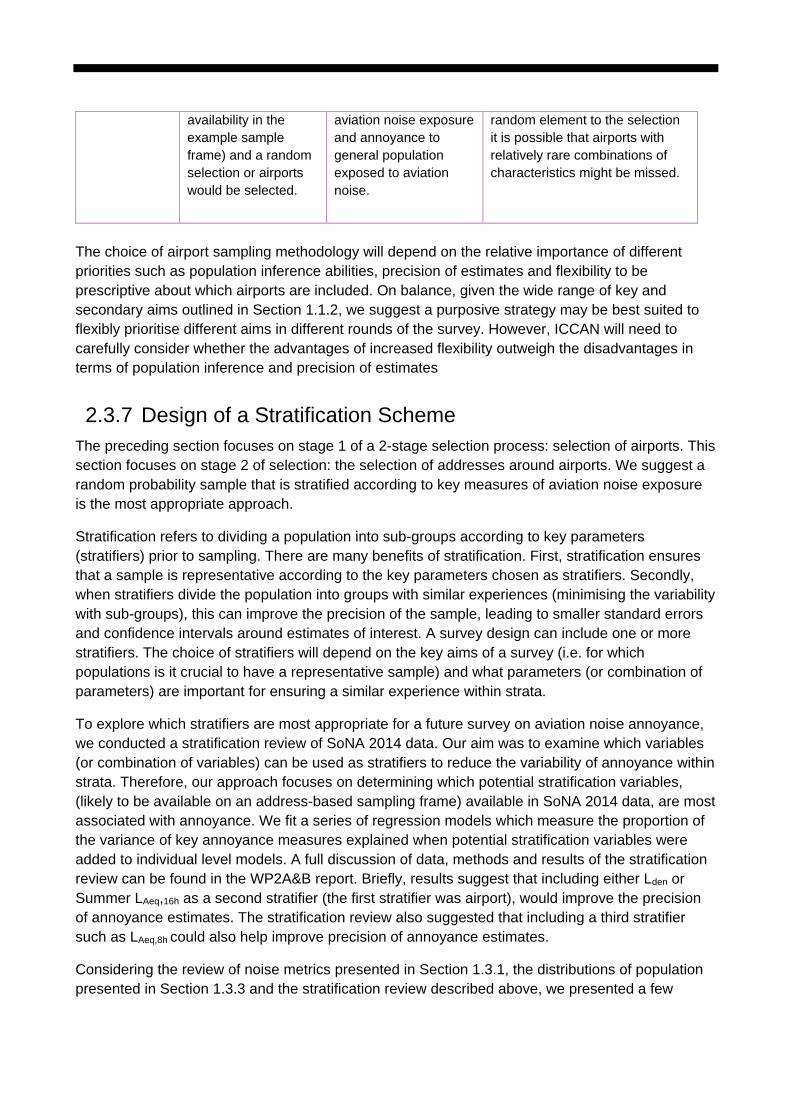
availability in the example sample frame) and a random selection or airports would be selected.
aviation noise exposure and annoyance to general population exposed to aviation noise.
random element to the selection it is possible that airports with relatively rare combinations of characteristics might be missed.
The choice of airport sampling methodology will depend on the relative importance of different priorities such as population inference abilities, precision of estimates and flexibility to be prescriptive about which airports are included. On balance, given the wide range of key and secondary aims outlined in Section 1.1.2, we suggest a purposive strategy may be best suited to flexibly prioritise different aims in different rounds of the survey. However, ICCAN will need to carefully consider whether the advantages of increased flexibility outweigh the disadvantages in terms of population inference and precision of estimates
2.3.7 Design of a Stratification Scheme The preceding section focuses on stage 1 of a 2-stage selection process: selection of airports. This section focuses on stage 2 of selection: the selection of addresses around airports. We suggest a random probability sample that is stratified according to key measures of aviation noise exposure is the most appropriate approach.
Stratification refers to dividing a population into sub-groups according to key parameters (stratifiers) prior to sampling. There are many benefits of stratification. First, stratification ensures that a sample is representative according to the key parameters chosen as stratifiers. Secondly, when stratifiers divide the population into groups with similar experiences (minimising the variability with sub-groups), this can improve the precision of the sample, leading to smaller standard errors and confidence intervals around estimates of interest. A survey design can include one or more stratifiers. The choice of stratifiers will depend on the key aims of a survey (i.e. for which populations is it crucial to have a representative sample) and what parameters (or combination of parameters) are important for ensuring a similar experience within strata.
To explore which stratifiers are most appropriate for a future survey on aviation noise annoyance, we conducted a stratification review of SoNA 2014 data. Our aim was to examine which variables (or combination of variables) can be used as stratifiers to reduce the variability of annoyance within strata. Therefore, our approach focuses on determining which potential stratification variables, (likely to be available on an address-based sampling frame) available in SoNA 2014 data, are most associated with annoyance. We fit a series of regression models which measure the proportion of the variance of key annoyance measures explained when potential stratification variables were added to individual level models. A full discussion of data, methods and results of the stratification review can be found in the WP2A&B report. Briefly, results suggest that including either Lden or Summer LAeq,16h as a second stratifier (the first stratifier was airport), would improve the precision of annoyance estimates. The stratification review also suggested that including a third stratifier such as LAeq,8h could also help improve precision of annoyance estimates.
Considering the review of noise metrics presented in Section 1.3.1, the distributions of population presented in Section 1.3.3 and the stratification review described above, we presented a few
28
different options for a stratification schemes at the second stage of sampling in the WP2A&B report. After a discussion of the advantages and disadvantages of each option, we suggest using LAeq,16h as the second stratifier (after airport) in a stratification scheme of a future survey.8 We also suggest that it is not enough to stratify the sample by LAeq,16h and that other noise metrics should be included in the stratification scheme.
The order of the stratification variables after LAeq,16h, should depend on the theoretical relative importance of the other metrics. There is a good case for including LAeq,8h as the third stratifier, as night exposure is related to annoyance, not captured in a LAeq,16h variable, and the stratification review on SoNA 2014 suggested it could lead to gains in precision. If a future survey wants to prioritise change it may want to consider using change in LAeq,16h as a fourth stratifier. If instead the survey is more concerned with ensuring a range of exposure experiences in an LAeq,16h band, the N65day9 metric could be considered as the fourth stratifier. These types of decisions will be required to design an optimal stratification scheme for a future survey. Other variables with potential relationships to annoyance such as urban/rural location of the address, background noise level, measures of deprivation, and variables which describe housing stock should also be considered.
In practice, differences in both airport characteristics and availability of noise exposure metrics at each airport selected for inclusion (see Section 1.3.2 for information on selecting airports), will likely mean that a stratification scheme may need to differ by airport. For instance, including LAeq,8h
as a third stratifier in the selection of residential addresses around airports that do not operate night flights would be of limited value. Using N65day as a third stratifier in this case would be a more useful approach to ensuring adequate representation of different aviation noise patterns in a particular LAeq,16h band.
In the current aviation climate, explicitly including change in exposure may be less helpful than in future rounds of the survey. The reduction in flights because of COVID-19 suggests that by the time a survey goes to field, most residents will have recently experienced a change in exposure levels. This offers opportunities in terms of analysis but suggests that explicitly including change measures in survey sampling is less useful in an initial round of the survey.
8 As noted in Table 1.3.2, similar values of Lden can represent different combinations of day/evening/night exposure experiences making it less attractive to use in survey sampling. While survey sampling would ensure that a particular level of Lden was represented in the population, random sampling could not ensure that all combinations day/evening/night noise at a particular Lden level were included. 9 Survey sampling in future rounds of the survey may want to consider replacing N65day with whatever threshold of number of events is currently considered to represent annoying noise events.
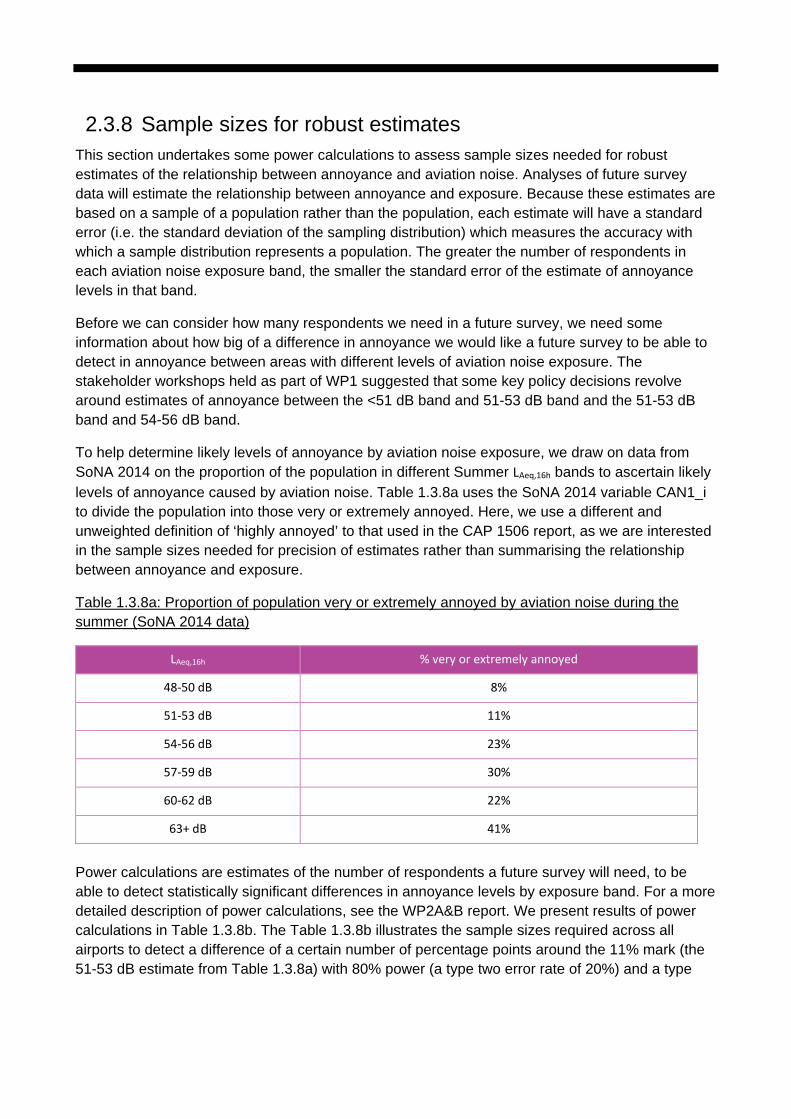
2.3.8 Sample sizes for robust estimates This section undertakes some power calculations to assess sample sizes needed for robust estimates of the relationship between annoyance and aviation noise. Analyses of future survey data will estimate the relationship between annoyance and exposure. Because these estimates are based on a sample of a population rather than the population, each estimate will have a standard error (i.e. the standard deviation of the sampling distribution) which measures the accuracy with which a sample distribution represents a population. The greater the number of respondents in each aviation noise exposure band, the smaller the standard error of the estimate of annoyance levels in that band.
Before we can consider how many respondents we need in a future survey, we need some information about how big of a difference in annoyance we would like a future survey to be able to detect in annoyance between areas with different levels of aviation noise exposure. The stakeholder workshops held as part of WP1 suggested that some key policy decisions revolve around estimates of annoyance between the <51 dB band and 51-53 dB band and the 51-53 dB band and 54-56 dB band.
To help determine likely levels of annoyance by aviation noise exposure, we draw on data from SoNA 2014 on the proportion of the population in different Summer LAeq,16h bands to ascertain likely levels of annoyance caused by aviation noise. Table 1.3.8a uses the SoNA 2014 variable CAN1_i to divide the population into those very or extremely annoyed. Here, we use a different and unweighted definition of ‘highly annoyed’ to that used in the CAP 1506 report, as we are interested in the sample sizes needed for precision of estimates rather than summarising the relationship between annoyance and exposure.
Table 1.3.8a: Proportion of population very or extremely annoyed by aviation noise during the summer (SoNA 2014 data)
LAeq,16h % very or extremely annoyed
48-50 dB 8%
51-53 dB 11%
54-56 dB 23%
57-59 dB 30%
60-62 dB 22%
63+ dB 41%
Power calculations are estimates of the number of respondents a future survey will need, to be able to detect statistically significant differences in annoyance levels by exposure band. For a more detailed description of power calculations, see the WP2A&B report. We present results of power calculations in Table 1.3.8b. The Table 1.3.8b illustrates the sample sizes required across all airports to detect a difference of a certain number of percentage points around the 11% mark (the 51-53 dB estimate from Table 1.3.8a) with 80% power (a type two error rate of 20%) and a type
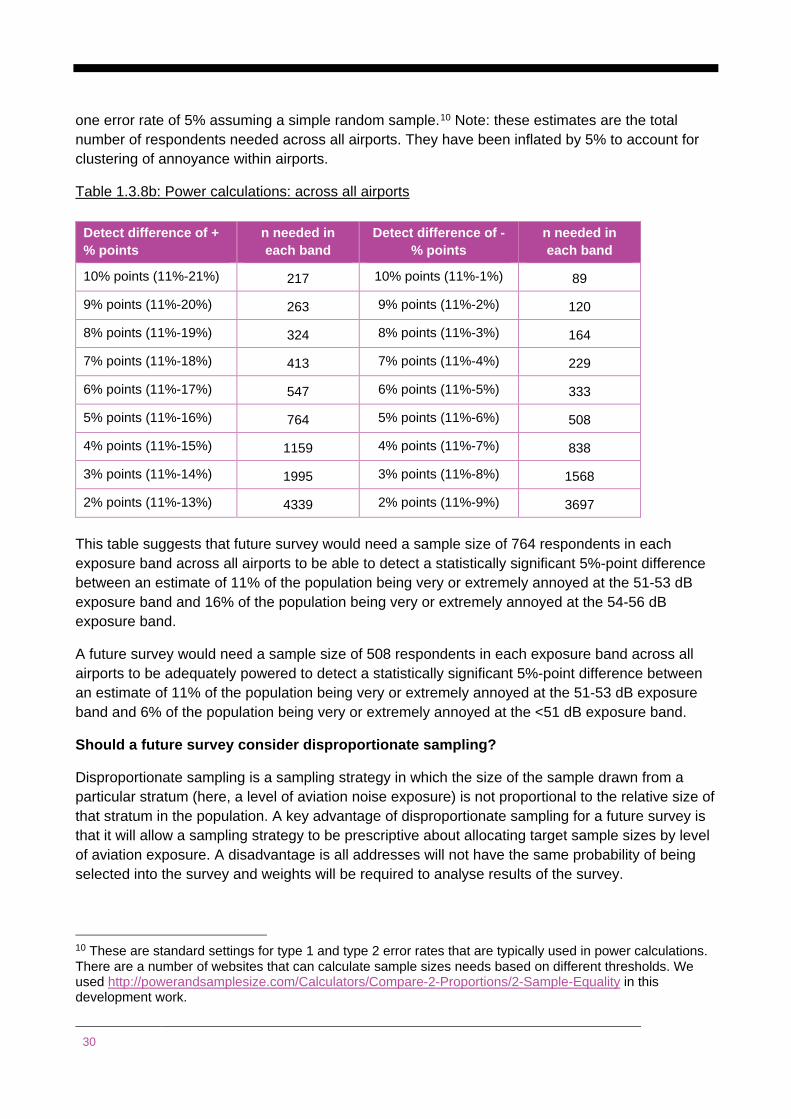
30
one error rate of 5% assuming a simple random sample.10 Note: these estimates are the total number of respondents needed across all airports. They have been inflated by 5% to account for clustering of annoyance within airports.
Table 1.3.8b: Power calculations: across all airports
Detect difference of + % points
n needed in each band
Detect difference of - % points
n needed in each band
10% points (11%-21%) 217 10% points (11%-1%) 89
9% points (11%-20%) 263 9% points (11%-2%) 120
8% points (11%-19%) 324 8% points (11%-3%) 164
7% points (11%-18%) 413 7% points (11%-4%) 229
6% points (11%-17%) 547 6% points (11%-5%) 333
5% points (11%-16%) 764 5% points (11%-6%) 508
4% points (11%-15%) 1159 4% points (11%-7%) 838
3% points (11%-14%) 1995 3% points (11%-8%) 1568
2% points (11%-13%) 4339 2% points (11%-9%) 3697 This table suggests that future survey would need a sample size of 764 respondents in each exposure band across all airports to be able to detect a statistically significant 5%-point difference between an estimate of 11% of the population being very or extremely annoyed at the 51-53 dB exposure band and 16% of the population being very or extremely annoyed at the 54-56 dB exposure band.
A future survey would need a sample size of 508 respondents in each exposure band across all airports to be adequately powered to detect a statistically significant 5%-point difference between an estimate of 11% of the population being very or extremely annoyed at the 51-53 dB exposure band and 6% of the population being very or extremely annoyed at the <51 dB exposure band.
Should a future survey consider disproportionate sampling?
Disproportionate sampling is a sampling strategy in which the size of the sample drawn from a particular stratum (here, a level of aviation noise exposure) is not proportional to the relative size of that stratum in the population. A key advantage of disproportionate sampling for a future survey is that it will allow a sampling strategy to be prescriptive about allocating target sample sizes by level of aviation exposure. A disadvantage is all addresses will not have the same probability of being selected into the survey and weights will be required to analyse results of the survey.
10 These are standard settings for type 1 and type 2 error rates that are typically used in power calculations. There are a number of websites that can calculate sample sizes needs based on different thresholds. We used http://powerandsamplesize.com/Calculators/Compare-2-Proportions/2-Sample-Equality in this development work.

When deciding on target sample sizes there are a few issues to keep in mind. First, the greater the number of respondents in a given exposure band, the more precise any results on annoyance will be in that band. Additionally, the greater the target sample size in an exposure band, the more likely a future survey will be to detect within-band differences among alternative metrics. To give the best chance of being able to detect important differences in annoyance, a future survey should allocate target sample sizes according to analysis priorities. ICCAN will need to consider analysis priorities before we can suggest a detailed sampling strategy. However, based on the results of the stakeholder workshops, we recommend that a future survey should concentrate most of the target sample in the 45-50 dB, 51-53 dB, and 54-56 dB bands.
What is the optimal size of a future survey?
Here, again, the optimal size of a future survey depends on how large of a difference in annoyance ICCAN wishes to detect between residents living in different exposure bands. As a starting point for discussions, we consider a small, medium and large scenario in Table 1.3.8c. We chose 2,500 as the target sample size of a ‘small’ survey as this is roughly equivalent to the achieved sample sizes in previous SoNA surveys. We chose 6,500 as the ‘large’ target sample size, as power calculations in WP2A&B suggest that this sample size is large enough to detect granular differences in annoyance between residents exposed to different levels of aviation noise. The ‘medium’ target sample size of 4,000 provides a halfway point between a small and large survey. Table 1.3.8c assumes that 25% of the sample in concentrated in 45-50 dB band; 25% of the sample is concentrated in a 51-53 dB band; 25% of the sample is concentrated in the 54-56 dB band; and 25% of the sample is concentrated in the 57+ dB band. In reality, analysis priorities may suggest a difference optimal allocation of target sample sizes.
Table 1.3.8c Power calculations of survey scenarios: across all airports
Survey Scenario
Achieved Sample Size
Able to detect a difference of x% points in annoyance between <45-50 dB residents and 51-54 dB residents
Able to detect a difference of x% points in annoyance between 51-53 dB residents and 54-56 dB residents
Small 2,500 5% points 6% points
Medium 4,000 4% points 5% points
Large 6,500 3% points 4% points
The table illustrates how large of a difference each survey scenario would be able to detect in the proportion of residents who report being highly or extremely annoyed by level of aviation noise exposure, after accounting for any potential clustering of annoyance within airport, based on the likely estimates proportion of residents highly or extremely annoyed in Table 1.3.8a.11 We can be
11 Similar to the power calculations in the WP2A&B report, these calculations assume 80% power and a 5% type 1 error rate. They also assume that the percentage of residents highly or extremely annoyed in 51-54 dB areas is 11% (based on calculations of SoNA 2014 data - see WP2A&B report).

32
reasonably confident that differences found in the survey that are this size or larger are the result of real differences in annoyance in the population, rather than chance.
These calculations suggest that a small survey, for instance, would be able to detect a difference of 5% points or more in the proportion of residents highly or extremely annoyed by aviation noise who live in areas with less than 51 dB LAeq,16h compared to residents who live in areas with 51-54 dB LAeq,16h. A large survey would be able to detect a difference of 3% points or more in the proportion of residents highly or extremely annoyed by aviation noise who live in areas with less than 51 dB LAeq,16h, compared to residents who live in areas with 51-54 dB LAeq,16h. To determine the optimal overall sample size for a future survey, ICCAN will again need to consider the analysis priorities for a future survey. Based on our discussion with stakeholders (which identified annoyance differences between 45-50 and 51-53; and 51-53 and 54-56 as analysis priorities for a future survey), we suggest a large survey option of approximately 6,500 respondents should be large enough to identify key differences in annoyance by aviation noise exposure band with adequate precision. If ICCAN identifies different analysis priorities, overall sample sizes will need to be reconsidered.
2.4 Mode, timing and frequency This section provides a summary of the work undertaken regarding the mode of the new survey and considerations relating to timing. This section also includes considerations around the survey’s frequency and how/whether it could collect information to take into account seasonal differences in annoyance.
2.4.1 Survey mode Survey mode refers to the way in which a survey is administered to participants. The various options for survey administration can be broadly divided into three categories: interviewer-administered modes, in which an interviewer is responsible for recruiting participants and obtaining answers to the questions, self-completion modes, in which participants complete a questionnaire without an interviewer assisting them, and mixed modes, which offer a combination of the methods.
A range of possible modes were considered for the new survey including:
● Face-to-face surveys administered by Computer Assisted Personal Interviews (CAPI). Participants would be recruited via door-knocking at the selected address. Some questions can be interviewer administered (i.e. with interviewers reading out the questions and recording responses). Some questions can be self-administered (i.e. questions of a more personal or sensitive nature can be completed by the respondent privately).
● Computer Assisted Telephone Interviewing (CATI) via a ‘push-to-telephone’ approach. Participants would be recruited via writing to the selected address and asking people to provide their telephone numbers online or via calling a telephone number.
● Video Assisted Personal Interviewing (VAPI). This is a new mode that has started to be trialled due to COVID-19. After making contact on the doorstep or via mail, interviewers
arrange to interview people using video-conferencing software. It should be noted that this mode is still in its infancy and there are currently no data available on its efficacy.
● Postal questionnaire. This involves sending paper self-completion questionnaires to sampled addresses.
● Online via a ‘push-to-web approach’. Participants would be recruited via writing to the selected address and asking people to log in to the survey with a unique ID number.
● Web-CAPI. Participants are invited, via a mailing, to complete an online survey. Non-responders are followed up by interviewer home visits.
● Web-CATI. Participants are first approached to take part using a push-to-web approach. Non-responding households are contacted again by letter reiterating the offer to take part online but also providing the option of a telephone interview.
● Web-postal. Participants are first approached to take part using a push-to-web approach. People who do not have access to the internet are told they can call a number to request a postal (paper) version of the questionnaire.
Some mode options were rejected after an initial expert panel on mode was convened. For example, we recommend that the postal option is not considered further as this option would impose more severe limitations on questionnaire length and complexity. It is thought that response bias (driven by interest in the topic) could potentially be higher for the postal option, given that participants would be able to preview all the questionnaire content in advance of taking part.
Mode options involving telephone administration have also been rejected. Telephone surveys tend to have better response rates where a sample frame of telephone numbers is available (which is not the case for our population of interest). There is no option for self-completion elements in CATI, so socially desirable reporting bias may be higher in this mode compared to other modes. Finally, there are several questions from SoNA 2014 that we may wish to re-use in the new survey (see Section 1.5 for details). However, these would require substantial adaptation to be fit for telephone administration, as many items used involve a visual component (for example, grids or longer lists of response options).
Face-to-face modes remain the gold standard for prevalence surveys such as the one ICCAN wishes to conduct. The most important advantage of using interviewers is that, in any survey regardless of the subject matter, selected sample members are consistently more likely to take part if they are recruited via face-to-face contact. Surveys that rely on recruitment solely by mass mailings (whether they are push-to-web, push-to-telephone or postal surveys) consistently have significantly lower response rates. High response rates reduce the risk of non-response biases occurring (i.e. where non-responders are substantially different from responders across the key factors you wish to measure). These biases are generally considered to be the biggest risk when it comes to survey data quality. This is the reason why face-to-face methods continue to dominate the generation of official statistics in the UK. Having interviewers present also has some secondary advantages. For example, questionnaires can be longer and more detailed, and complex data can be collected. We would also expect to see some increases in data quality if interviewers are present, for example, fewer partial completions and reduced item non-response.
34
The main disadvantage of face-to-face interviewing is cost. The cost per interview is much higher in face-to-face modes compared to all other modes of administration. These costs are incurred because of interviewer pay and travel expenses. Therefore, if cost-efficiency is a key factor (or could become a factor for future waves), other modes should be considered. Online modes would deliver substantial savings per respondent, but with that there would be an increased risk of bias in the data collected. Chapter 2 provides some more information on the short-listed modes of data collection for the new survey, focusing on CAPI, web-CAPI, online only and setting up a longitudinal web panel.
2.4.2 Survey frequency There was a high degree of consistency in what stakeholders felt about survey frequency. There was a consensus that any new survey should aim to capture data on annoyance every five years as a minimum. Some stakeholders felt that data collection could occur more often, e.g. every three years. However, it was felt that, in practice, it takes time for both policymakers and airports to implement policies based on data collected. Therefore, there would be limited benefit in repeating the survey more frequently than every three years.
Community group representatives also felt that affected communities should not be burdened with over-frequent surveying. They emphasised that it can feel frustrating to give feedback on an issue and to feel the results are not being acted on.
Although stakeholders described how surveying every three to five years seems sufficient, it was also acknowledged more frequent data collection would be beneficial in order to look at specific local airport changes that may arise. However, it is our recommendation that the new survey should not focus on these specific local interventions as its primary aim. Without knowing the details of interventions in advance, it will not be possible to guarantee that the sample design for a pre and post-test is representative of those who are impacted by a change. Specific site-level interventions are best evaluated when specifically set up to monitor the impacted groups.
We recommend that data is collected every three to five years, depending on funding resources available for subsequent waves of data collected. It is anticipated that fieldwork itself for this project would be rolling over a 12-month period, due to the sample sizes recommended. After data collection, there will also need to be time for analysis, reporting and policy implementation. Given this, the longer gaps between fieldwork, may be more practical (four to five years). If there is a trade-off to be made between frequency and granularity (i.e. with more airports, more localised data), stakeholder preference was for granularity.
2.4.3 Fieldwork timings and seasonality There was a relatively high degree of consensus among stakeholders and experts that quantifying levels of ‘high-season’ community annoyance should be the priority for the new survey. In the UK, policy decisions are based on a summer reference period. Understanding seasonal fluctuations in annoyance levels was not raised as the priority area of interest in terms of policy making, although understanding these fluctuations in more detail could help inform future survey design. This initially suggested that fieldwork for the new survey should also be seasonal, with fieldwork being concentrated in the summer, e.g. from June to September.
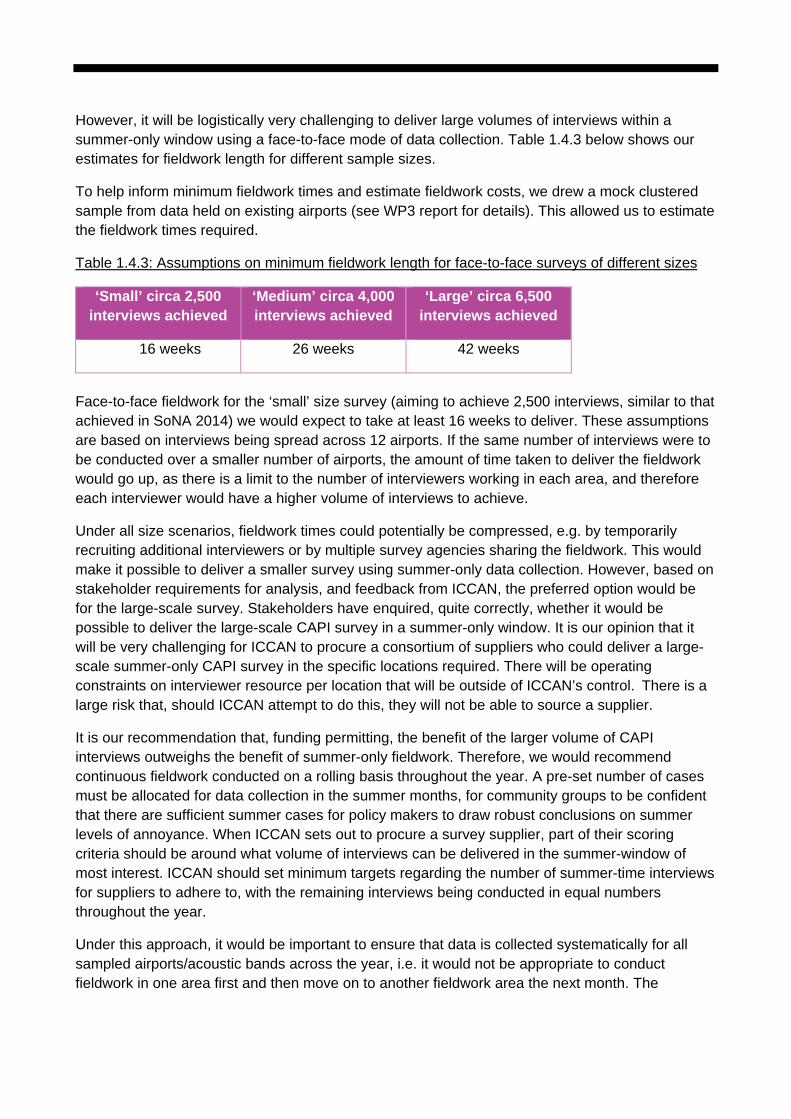
However, it will be logistically very challenging to deliver large volumes of interviews within a summer-only window using a face-to-face mode of data collection. Table 1.4.3 below shows our estimates for fieldwork length for different sample sizes.
To help inform minimum fieldwork times and estimate fieldwork costs, we drew a mock clustered sample from data held on existing airports (see WP3 report for details). This allowed us to estimate the fieldwork times required.
Table 1.4.3: Assumptions on minimum fieldwork length for face-to-face surveys of different sizes
‘Small’ circa 2,500 interviews achieved
‘Medium’ circa 4,000 interviews achieved
‘Large’ circa 6,500 interviews achieved
16 weeks 26 weeks 42 weeks
Face-to-face fieldwork for the ‘small’ size survey (aiming to achieve 2,500 interviews, similar to that achieved in SoNA 2014) we would expect to take at least 16 weeks to deliver. These assumptions are based on interviews being spread across 12 airports. If the same number of interviews were to be conducted over a smaller number of airports, the amount of time taken to deliver the fieldwork would go up, as there is a limit to the number of interviewers working in each area, and therefore each interviewer would have a higher volume of interviews to achieve.
Under all size scenarios, fieldwork times could potentially be compressed, e.g. by temporarily recruiting additional interviewers or by multiple survey agencies sharing the fieldwork. This would make it possible to deliver a smaller survey using summer-only data collection. However, based on stakeholder requirements for analysis, and feedback from ICCAN, the preferred option would be for the large-scale survey. Stakeholders have enquired, quite correctly, whether it would be possible to deliver the large-scale CAPI survey in a summer-only window. It is our opinion that it will be very challenging for ICCAN to procure a consortium of suppliers who could deliver a large-scale summer-only CAPI survey in the specific locations required. There will be operating constraints on interviewer resource per location that will be outside of ICCAN’s control. There is a large risk that, should ICCAN attempt to do this, they will not be able to source a supplier.
It is our recommendation that, funding permitting, the benefit of the larger volume of CAPI interviews outweighs the benefit of summer-only fieldwork. Therefore, we would recommend continuous fieldwork conducted on a rolling basis throughout the year. A pre-set number of cases must be allocated for data collection in the summer months, for community groups to be confident that there are sufficient summer cases for policy makers to draw robust conclusions on summer levels of annoyance. When ICCAN sets out to procure a survey supplier, part of their scoring criteria should be around what volume of interviews can be delivered in the summer-window of most interest. ICCAN should set minimum targets regarding the number of summer-time interviews for suppliers to adhere to, with the remaining interviews being conducted in equal numbers throughout the year.
Under this approach, it would be important to ensure that data is collected systematically for all sampled airports/acoustic bands across the year, i.e. it would not be appropriate to conduct fieldwork in one area first and then move on to another fieldwork area the next month. The
36
sampling design would have to stipulate who is to be interviewed in which period using randomisation principles. Within each airport, sampled addresses (or clusters of sampled addresses in areas of <54 dB LAeq,16h) would be stratified by the same noise exposure variables used in the sampling stratification before allocation to waves. This ensures that areas in every LAeq,16h band will be interviewed in each wave. This will produce representative data for each wave which can be analysed separately.
There are advantages of this rolling approach. By having rolling fieldwork more data will become available on peak periods for reporting summer level annoyance (e.g. by looking at when annoyance levels may start to dip and using these markers to make evidence-based decisions on appropriate dates for fieldwork in later waves). For example, it is possible that recall of summer-levels of annoyance is perfectly good in autumn but less good in the following spring. As described in Chapter 1.5.2, regardless of when participants are interviewed, questions on both annoyance in the last 12 months and summer annoyance (in a specified 92-day summer period) will be asked.
It is acknowledged that not being able to do summer-only fieldwork presents some additional complications for analysts, namely inconsistencies in the periods in which annoyance data are collected and what acoustic measures are available for analysis. It should be noted that many of the acoustic measures described in Section 1.3.2 are averages calculated over the 92-day summer period. We acknowledge that there may be some recall error asking about summer levels of annoyance in the winter (this criticism was also applied to SoNA 2014). However, we believe the risk of recall error in part of the sample is outweighed by the benefits of a larger sample size and the higher response rates achieved in face-to-face data collection. Furthermore, within the rolling fieldwork model (with a specified number of summer-only cases) the survey will be able to compare annoyance levels in summer cases against acoustic measures generated from the 92-day summer period. Thus, there are two ways analysts will be able to look at annoyance levels in summer, the first using recall data from the whole sample (interviewed throughout the year) and the second through the examination of summer fieldwork cases.
2.4.4 Cross-sectional vs. longitudinal data collection One area of interest to ICCAN is whether the new survey should be longitudinal (where the same individuals are interviewed more than once, to see how their experiences change over time) or whether repeated cross-sectional methods of data collection are more appropriate.
Repeated cross-sectional surveys would be more appropriate for looking at how community-level exposure-annoyance curves change over time. This is because, in longitudinal research, once participants have taken part in one wave of the survey, they will know what the focus of the study is. Over time, attrition may be higher amongst groups who are not impacted and so are less engaged. This can partially be corrected for in the analysis (by weighting based on annoyance reported at wave one). However, such adjustments would add complexity to analysis and may be misinterpreted by non-technical audiences. A cross-sectional design, where the same airports are included in each wave of data collection, would provide more robust evidence on how community annoyance levels are changing over time.
From a policy perspective, understanding community-level drivers of annoyance is likely to be more important than more detailed understanding of individual drivers of annoyance. This is
because policy decisions are targeted at communities rather than at the individual level. One criticism of a cross-sectional approach is that it does not capture information on people who have moved out of an area because of the noise, as they would no longer be included in the sample frame. A panel design would potentially allow ICCAN to conduct research with ‘movers’, i.e. people who move out of an area impacted by aviation noise. However, it is unclear the extent to which a panel could collect data regarding movers, as the prevalence of this behaviour is unknown.
Longitudinal data could look at whether noise exposure and annoyance translate into changes in health status and the development of health conditions over time. However, this assumes sample sizes are large enough to detect differences once attrition over time is taken into account. As described in Section 1.2, many health conditions take years to develop and they will only manifest in a subset of the surveyed population. A longitudinal survey is not necessarily the best method to investigate the impact of aviation noise on long term health outcomes. These questions would be better addressed with epidemiological research methods.
A different benefit of longitudinal data collection relates to cost. If a panel of participants is set up, after the initial investment in the first wave, subsequent waves of data collection can be conducted more cost-effectively. This is because, for the first wave of data collection, optimum face-to-face modes could be utilised (including checks to verify people live in the selected addresses). For subsequent waves, data can be collected online or via telephone. Higher quality online follow-ups are possible once a sample frame (that includes contact details) has been set up. The more waves of data collection, the greater the potential for this cost saving.
If ICCAN developed a longitudinal panel, it would allow more flexibility in addressing research questions that may arise in the future. With a panel, there would be more possibility to conduct rapid-turnaround surveys based on current research priorities. This could include localised surveys that look at specific airport-level issues or further surveying of subgroups who may be of interest. Investment in a panel infrastructure could also potentially help ICCAN conduct pre and post surveys to test specific airport-level interventions. However, there is no way to guarantee the panel sample composition will be optimal for all future research projects. Whether or not a panel is appropriate will depend on the specifics of the intervention being assessed, particularly how many panel participants are exposed to the intervention under investigation.
It is worth noting that participants who take part in a cross-sectional study can be re-contacted to take part in future research (if their permission has been granted) even if a formal longitudinal panel is not set up. Sub-studies will be possible off the back of cross-sectional research without ICCAN committing to a longitudinal design.
2.4.5 Recommendations All of the main research questions identified for this project can be addressed using repeated cross-sectional methods. In the case of the main aim (understanding the relationship between aviation noise at difference exposures and annoyance), there are good methodological reasons why repeated cross-sectional data collection would be preferable to using a longitudinal panel. The primary reason for this is that it is anticipated that people who are highly annoyed are more likely to be retained in a longitudinal panel as the subject matter being researched is more salient to them. This means that data will become more biased in favour of these groups over time. Over time, a
38
longitudinal study on aviation noise may become less representative of the communities it is meant to represent. For this reason, we recommend that ICCAN make use of a repeated cross-sectional design going forward.
That said, we are mindful that longitudinal data collection could offer substantial potential cost-efficiencies for future waves of data collection, and this may be a priority for ICCAN in the medium to longer term. Funding permitting, it may also be possible for ICCAN to develop a panel infrastructure in addition to the cross-sectional work required to monitor overall levels of annoyance. This could enable ICCAN to conduct fast turnaround research within impacted communities at reduced cost. For this reason, the option of setting up a longitudinal panel was presented as an option for ICCAN to consider. Further details are presented in Chapter 2 on short-listed options.
2.5 Questionnaire review and outcome measures The following chapter describes what types of questions should be included in the new survey of aviation noise. The recommendations are based on feedback from stakeholders, a review of the SoNA 2014 questionnaire, a review of alternative sources of measures and an expert panel event. For full details of the methods employed in this review see our report entitled: Questionnaire Scoping for a new survey of Aviation Noise: Findings from WP2d and WP2e.
2.5.1 Overview of measures As described in Section 1.2.2, stakeholders, together with ICCAN, identified five research areas that are a priority for the new survey on aviation noise. Tables 1.5.1a – 1.5.1d summarise what information should be collected to address each research question and whether this information should be collected using a questionnaire.
One aim of the questionnaire review was to establish which existing questionnaires, if any, could form the basis of the new survey. In many cases there are advantages of using existing survey questions where possible, as this allows for comparisons to be made with earlier UK surveys or other surveys that are conducted internationally.
The review of SoNA 2014 indicated that most topic areas important to stakeholders were asked about in SoNA 2014. We were mindful of the criticisms made regarding SoNA 2014 when we conducted our questionnaire review. However, it became apparent through our discussion with stakeholders, that most of the criticisms levelled at SoNA 2014 were regarding its sample design and how data were subsequently used. The criticisms did not tend to focus on questionnaire design. Therefore, it would be appropriate to re-use some of the questions included in SoNA 2014 in the new survey, provided they capture information of interest to stakeholders and that they pass the set quality criteria.
The rest of this report provides an overview of our recommendations on what questions should be included to address each research aim, whether existing SoNA 2014 questions meet the specified objectives or whether new questions need to be developed.
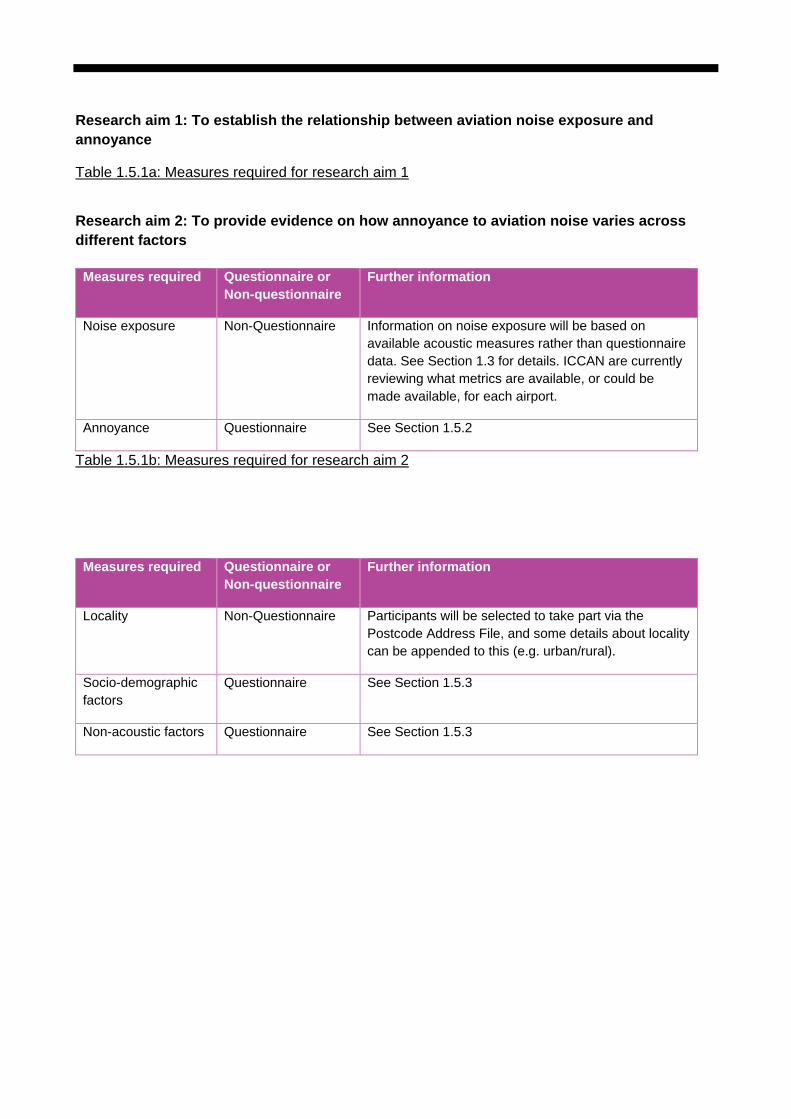
Research aim 1: To establish the relationship between aviation noise exposure and annoyance
Table 1.5.1a: Measures required for research aim 1
Research aim 2: To provide evidence on how annoyance to aviation noise varies across different factors
Table 1.5.1b: Measures required for research aim 2
Measures required Questionnaire or Non-questionnaire
Further information
Noise exposure Non-Questionnaire Information on noise exposure will be based on available acoustic measures rather than questionnaire data. See Section 1.3 for details. ICCAN are currently reviewing what metrics are available, or could be made available, for each airport.
Annoyance Questionnaire See Section 1.5.2
Measures required Questionnaire or Non-questionnaire
Further information
Locality Non-Questionnaire Participants will be selected to take part via the Postcode Address File, and some details about locality can be appended to this (e.g. urban/rural).
Socio-demographic factors
Questionnaire See Section 1.5.3
Non-acoustic factors Questionnaire See Section 1.5.3
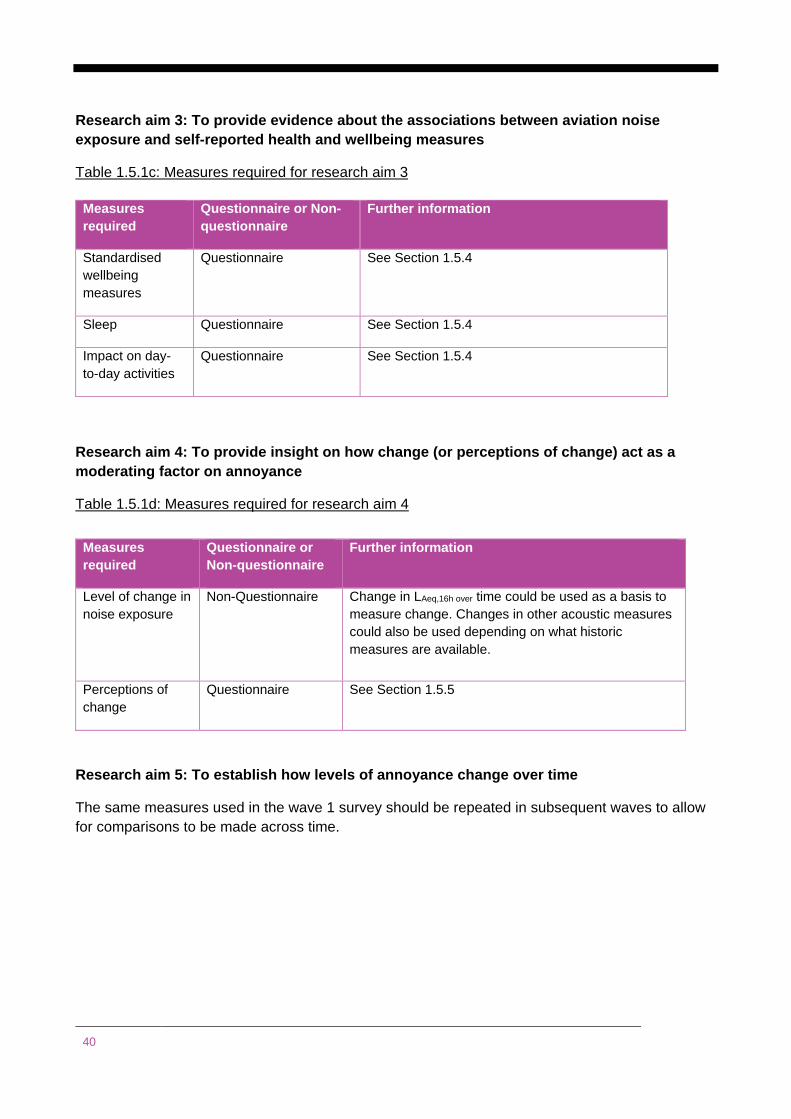
40
Research aim 3: To provide evidence about the associations between aviation noise exposure and self-reported health and wellbeing measures
Table 1.5.1c: Measures required for research aim 3
Research aim 4: To provide insight on how change (or perceptions of change) act as a moderating factor on annoyance
Table 1.5.1d: Measures required for research aim 4
Research aim 5: To establish how levels of annoyance change over time
The same measures used in the wave 1 survey should be repeated in subsequent waves to allow for comparisons to be made across time.
Measures required
Questionnaire or Non-questionnaire
Further information
Standardised wellbeing measures
Questionnaire See Section 1.5.4
Sleep Questionnaire See Section 1.5.4
Impact on day-to-day activities
Questionnaire See Section 1.5.4
Measures required
Questionnaire or Non-questionnaire
Further information
Level of change in noise exposure
Non-Questionnaire Change in LAeq,16h over time could be used as a basis to measure change. Changes in other acoustic measures could also be used depending on what historic measures are available.
Perceptions of change
Questionnaire See Section 1.5.5
41
2.5.2 Annoyance questions
The main aim of the new survey is to establish what the relationship is between noise exposure and annoyance. Analysts will need to examine the relationship between different noise exposure metrics and self-reported annoyance to define an exposure annoyance function.
The new survey requires robust measures of self-reported annoyance that can be used to compare people who live in areas with varying levels of noise exposure. It is unlikely that a single question on annoyance will be appropriate for meeting the analytical needs of all stakeholders. Instead we recommend that a bank of annoyance questions should be used. Within this bank of questions there should be:
1. Standardised measures of annoyance: Multiple stakeholders described the importance of using the standardised annoyance measures recommended by the International Commission on Biological Effects of Noise (ICBEN) and ISO standards (TS 15666). These questions asked about annoyance over the last 12 months.
2. A summer reference period measure of annoyance: Whereas ICBEN annoyance measures ask about an average annoyance over 12 months, UK policy is based on reported annoyance over the summer period. Community groups therefore expect the questions should ascertain information on annoyance experienced during the summer period.
3. Measures on annoyance at different times of the day: SoNA 2014 included questions on both annoyance from aeroplane noise during the day (7 am - 11 pm) and during the night (11 pm - 7 am). Stakeholders felt it was important to include this distinction. It was suggested additional measures using different times of day may also be beneficial, for example to look at annoyance during ‘shoulder periods’ where more flights are allowed, and different periods of the night. In SoNA 2014 these questions were asked using a summer reference period. However, given the suggested move to rolling fieldwork, and given that we are interested in comparing annoyance at night with a standardised sleep measure, we recommend amending these items to have a one-month reference period. This should improve recall and make figures more robust.
4. Measures on annoyance related to different periods of flight: SoNA 2014 included questions regarding annoyance of aeroplanes in flight, versus aeroplanes that are descending, versus aeroplanes that are ascending. In SoNA 2014, these questions were asked using a summer reference period. However, given the suggested move to rolling fieldwork throughout the year we recommend amending this to one-month reference period. This should improve recall and make figures more robust.
The SoNA 2014 questions on annoyance varied in terms of whether they used 5-point fully labelled scales or 11-point end-labelled scales. In latest version of the ICBEN standard recommendations (yet to be ratified) the 11-point scale is preferred. However, it is our recommendation that the 5-point version is continued to be used to compare to the 11-point scale. This will allow for comparison with SoNA 2014 measures. Table

42
1.5.2 below gives our recommendations on the number of points that should be used for each annoyance scale: Table 1.5.2: Annoyance question and type of scale Question Type of scale Rationale ICBEN Standards 11-point (revised/ under ratification)
11-point end labelled To comply with new revised standards. To allow comparison with future international surveys and SoNA 2014
Summer reference period
11-point end labelled To allow comparison with SoNA 2014
ICBEN Standards 5 point (as used in SoNA 2014)
5-point end labelled To allow comparison with below items and SoNA 2014
Annoyance at different times of the day and different periods of flight
5-point end labelled To allow comparison with SoNA 2014
We recommend key questions on annoyance and wellbeing are asked early in the questionnaire. It was suggested the ICBEN measures should be asked in the questionnaire as early on as possible, certainly before any detailed questions on the impact of the noise of day-to-day activities. Having the annoyance questions first means there can be no inadvertent context effect from preceding items. The latest version of the ICBEN standards (currently undergoing ratification) should be reviewed for clarity regarding rules on positioning.
2.5.3 Influencing factors: sociodemographic variables and non-acoustic factors
A secondary aim of the new survey is to collect evidence on how annoyance to aviation noise may vary by locality, socio-demographic factors and non-acoustic factors. Data on participant locality typically does not need to be collected via questionnaires if we sample people to take part based on their address. The following sections focus on what questions should be included on socio-economic variables and non-acoustic factors.
Socio-demographic factors
Stakeholders discussed the importance of examining the impact of aviation noise on specific population groups. Some of the groups of special interest included:
● Older people,
● People with young children, and
● People with pre-existing physical or mental health conditions.
Standardised classification questions should be asked about all of the above.
43
It was noted that it may be important to monitor the impact of aviation noise on populations based on their legally protected characteristics. The current list of protected characteristics is as follows:
● Age,
● Disability,
● Gender reassignment,
● Race,
● Religion or belief,
● Sex,
● Sexual orientation,
● Marriage and civil partnership status and
● Pregnancy and maternity status.
However, it was also noted that some questions on protected characteristics may be more sensitive to collect than others (e.g. sexual orientation and gender reassignment). Likewise, it is unclear what mechanism would be to link these factors to annoyance. Therefore, we leave it to ICCAN’s discretion as to whether questions on these areas should be included in the new survey.
As the survey aims to collect information on wellbeing it will be important to include socio-demographic variables that are known to predict wellbeing. Excluding the characteristics mentioned above these would include:
● Employment status,
● Income,
● Highest level of education, and
● Caring responsibilities.
Information on home-type, tenure and length of residence should also be collected.
Finally, it was noted that some information should be collected on occupation. It will be important to ascertain whether participants are working for the aviation industry, whether they feel their household income is dependent on the airport or whether they have a job that may be affected by aviation noise. For example, it will be useful to ascertain whether people work night shifts (in order to examine the effects of sleep) and potentially whether people regularly work from home.
We recommend the new survey contains items to measure each of the above socio-demographic characteristics.
Other non-acoustic factors
Stakeholders were interested in determining the relative influence of a variety of non-acoustic factors in explaining differences in annoyance. By ‘non-acoustic factors’ we broadly mean any factor (excluding socio-demographics) that may influence the
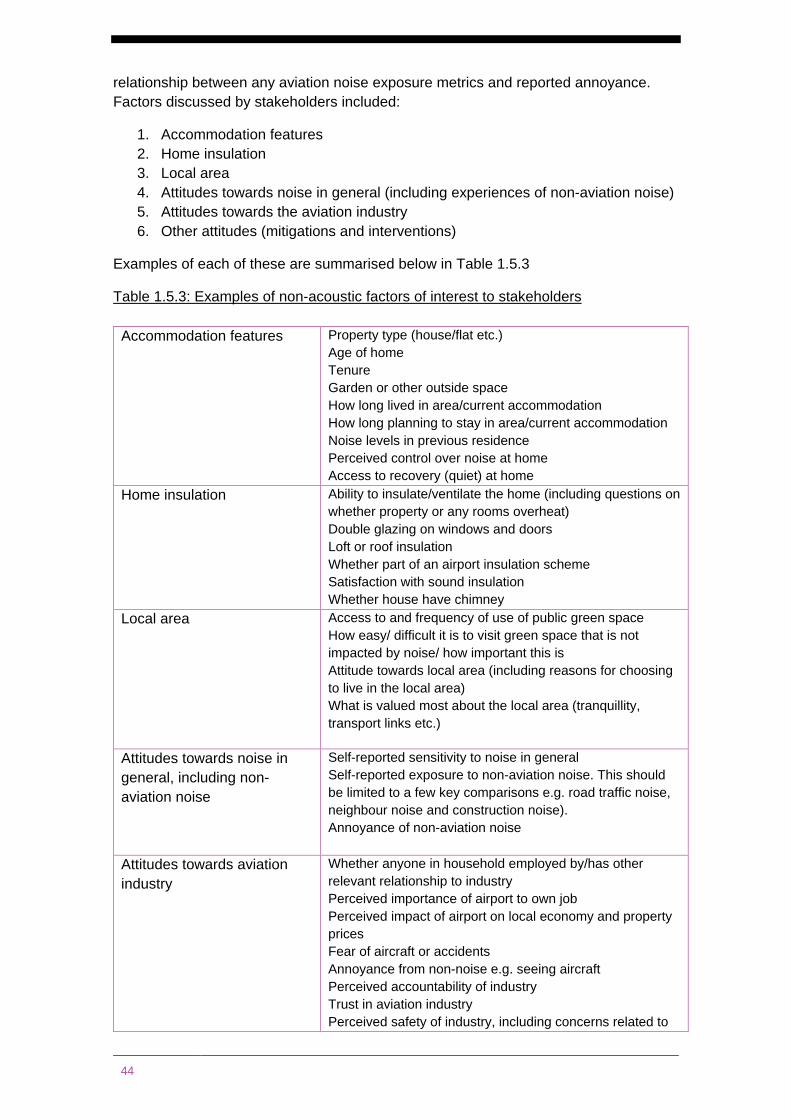
44
relationship between any aviation noise exposure metrics and reported annoyance. Factors discussed by stakeholders included:
1. Accommodation features 2. Home insulation 3. Local area 4. Attitudes towards noise in general (including experiences of non-aviation noise) 5. Attitudes towards the aviation industry 6. Other attitudes (mitigations and interventions)
Examples of each of these are summarised below in Table 1.5.3
Table 1.5.3: Examples of non-acoustic factors of interest to stakeholders Accommodation features Property type (house/flat etc.)
Age of home Tenure Garden or other outside space How long lived in area/current accommodation How long planning to stay in area/current accommodation Noise levels in previous residence Perceived control over noise at home Access to recovery (quiet) at home
Home insulation
Ability to insulate/ventilate the home (including questions on whether property or any rooms overheat) Double glazing on windows and doors Loft or roof insulation Whether part of an airport insulation scheme Satisfaction with sound insulation Whether house have chimney
Local area Access to and frequency of use of public green space How easy/ difficult it is to visit green space that is not impacted by noise/ how important this is Attitude towards local area (including reasons for choosing to live in the local area) What is valued most about the local area (tranquillity, transport links etc.)
Attitudes towards noise in general, including non-aviation noise
Self-reported sensitivity to noise in general Self-reported exposure to non-aviation noise. This should be limited to a few key comparisons e.g. road traffic noise, neighbour noise and construction noise). Annoyance of non-aviation noise
Attitudes towards aviation industry
Whether anyone in household employed by/has other relevant relationship to industry Perceived importance of airport to own job Perceived impact of airport on local economy and property prices Fear of aircraft or accidents Annoyance from non-noise e.g. seeing aircraft Perceived accountability of industry Trust in aviation industry Perceived safety of industry, including concerns related to
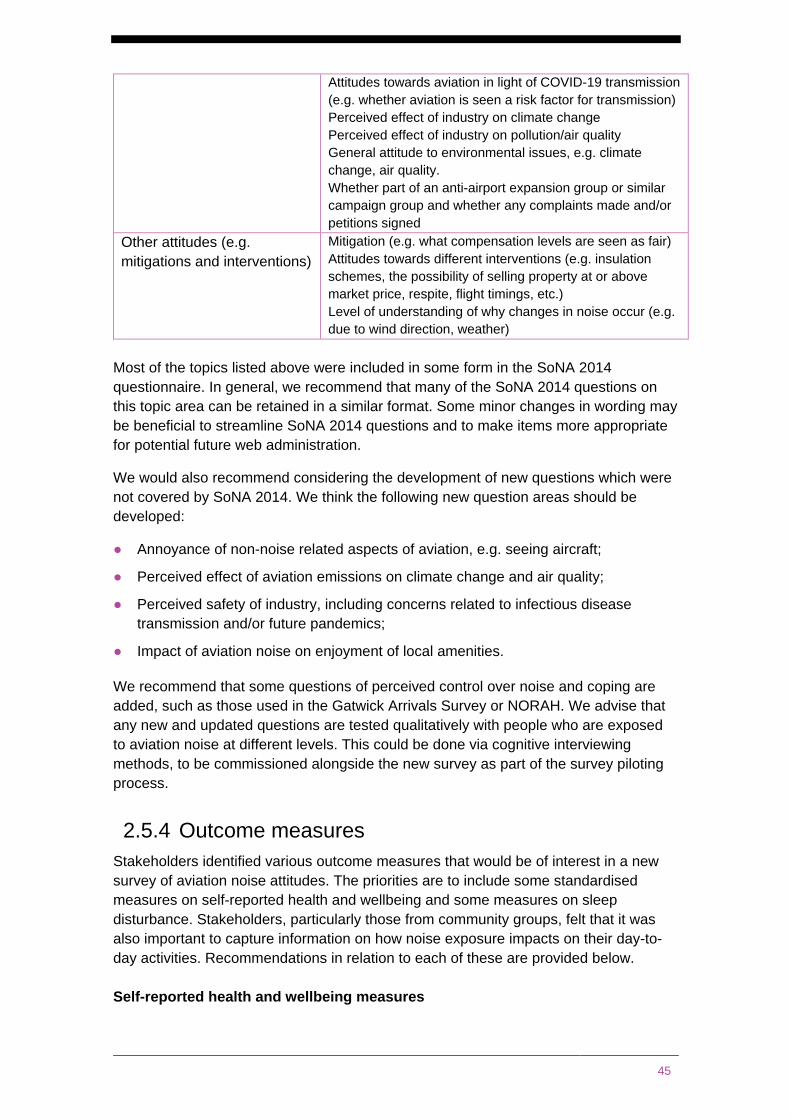
45
Attitudes towards aviation in light of COVID-19 transmission (e.g. whether aviation is seen a risk factor for transmission) Perceived effect of industry on climate change Perceived effect of industry on pollution/air quality General attitude to environmental issues, e.g. climate change, air quality. Whether part of an anti-airport expansion group or similar campaign group and whether any complaints made and/or petitions signed
Other attitudes (e.g. mitigations and interventions)
Mitigation (e.g. what compensation levels are seen as fair) Attitudes towards different interventions (e.g. insulation schemes, the possibility of selling property at or above market price, respite, flight timings, etc.) Level of understanding of why changes in noise occur (e.g. due to wind direction, weather)
Most of the topics listed above were included in some form in the SoNA 2014 questionnaire. In general, we recommend that many of the SoNA 2014 questions on this topic area can be retained in a similar format. Some minor changes in wording may be beneficial to streamline SoNA 2014 questions and to make items more appropriate for potential future web administration.
We would also recommend considering the development of new questions which were not covered by SoNA 2014. We think the following new question areas should be developed:
● Annoyance of non-noise related aspects of aviation, e.g. seeing aircraft;
● Perceived effect of aviation emissions on climate change and air quality;
● Perceived safety of industry, including concerns related to infectious disease transmission and/or future pandemics;
● Impact of aviation noise on enjoyment of local amenities.
We recommend that some questions of perceived control over noise and coping are added, such as those used in the Gatwick Arrivals Survey or NORAH. We advise that any new and updated questions are tested qualitatively with people who are exposed to aviation noise at different levels. This could be done via cognitive interviewing methods, to be commissioned alongside the new survey as part of the survey piloting process.
2.5.4 Outcome measures Stakeholders identified various outcome measures that would be of interest in a new survey of aviation noise attitudes. The priorities are to include some standardised measures on self-reported health and wellbeing and some measures on sleep disturbance. Stakeholders, particularly those from community groups, felt that it was also important to capture information on how noise exposure impacts on their day-to-day activities. Recommendations in relation to each of these are provided below. Self-reported health and wellbeing measures
46
We recommend that the short form version of the Warwick Edinburgh Mental Well-Being Scale (SWEMWBS) is used in the new survey. The full scale (WEMWBS) is the key mental wellbeing outcome measure used in the UK. It is used in the Health Survey for England so comparisons between the survey population and the general population would be possible during analysis. As SWEMWBS was used in SoNA 2014 comparisons with the previous study will also be possible.
We recommend some measure of evaluative wellbeing should be added to the survey.
For this we recommend that the life satisfaction item from the ONS4 should be included on the new survey. Recent baseline data on life satisfaction is available for subgroups and at the local, regional and national level, so again comparisons for other datasets. It was noted that this measure may be of use to economists to use in cross-sector comparisons. For example, in this analysis ‘life satisfaction’ is used to generate ‘wellbeing years’ (WELLBYs) related to different interventions and policy changes across different sectors (Ref 4). Therefore, it could be useful on this basis.
We also recommend that the GHQ12 is considered as a measure of mental distress or disorder. The GHQ12 includes items on both positive and negative mental wellbeing and comparison data is available from within the UK. It is acknowledged that a license fee for the GHQ12 applies (the fee for usage is per person so the larger the survey the greater the cost of usage, with discounted fees sometimes available). The fee associated for this has not been included in our costs presented to ICCAN to date We recommend that a quote for this element should be presented to ICCAN at the point at which the survey is commissioned.
Alternatives to the GHQ12 could be Patient Health Questionnaire (PHQ-9), which looks at depressive symptoms, and the Generalised Anxiety Disorder (GAD-7), which examines anxiety. Both of these also have short form (two-item) variants. The main issue with these options is that in the UK there is a lack of population normative data against which to benchmark results. More detailed psychiatric assessments were discussed as an option for this survey, but it was felt these went beyond the scope of a general-purpose survey of aviation noise.
In addition to the above wellbeing measures we recommend standardised questions on pre-existing health conditions, self-rated general health and disability status are included in the new survey. ICCAN may also wish to consider some specific check questions to ensure conditions such as migraines and tinnitus are captured in the survey.
Sleep measures
We recommend that a questionnaire approach is the primary data collection method for measuring sleep disturbance. Although diaries and objective measures (such as actigraphy and polysomnography) theoretically should lead to more granular detail of sleep quality in practice they add to participant burden and there are resultant data quality issues because of this. The most notable complication is that more burdensome tasks are often only undertaken by self-selecting sub-samples.
We recommend that a standardised measure, the Pittsburgh Sleep Quality Index (PSQI), is used in the new survey to measure sleep disturbance. The PSQI covers a
47
range of different dimensions of sleep quality and can be used to generate a sleep quality score. The new survey could look at how PSQI scores vary at different noise level exposures. There are no official population estimates of sleep quality in the UK. However, the UK Household Longitudinal Survey (Understanding Society) included the PSQI in 2009-2010 wave, and data from this are publicly available (Ref 5). Therefore, some comparisons with population norms could be made if PSQI questions are used.
In addition, we recommend that that the new survey includes some questions specifically related to sleep disturbance perceived to be attributable to aviation noise. The questions CAN7a, CAN7b and CAN8 from SoNA 2014 would be suitable for this purpose. It was noted that these questions should come after the PSQI measures. It was also noted that the reference period used in CAN7 (last summer) should be updated to be about the ‘last month.’ This is to provide consistency between the PSQI and CAN7, and to acknowledge that under the new survey design, rolling fieldwork is recommended with interviews being conducted across the year (see Section 1.4.3).
We recommend that new items should be included in the survey that look at sleep disturbance at different times of the night. Some information on shift work and the presence of young children in the household should also be collected, as these could be confounding factors when measuring sleep disturbance.
Impact on day-to-day activities
We recommend that the new survey includes questions on the impact of noise on day-to-day activities. This is in order to build up an overall picture of how respondents experience noise and annoyance in their daily lives. We recommend that questions should be prioritised if there is a clear theoretical link between the impacted activity and health or mental wellbeing. For example:
● Impacts on use of outdoor space could affect ability to exercise plus general mental wellbeing;
● Impacts on work, education and leisure could lead to stress and anxiety that impact on mental wellbeing;
● Impacts on having friends around could have an impact on wellbeing through social isolation;
● Impacts on window opening activity could affect health due to over-heating or poor ventilation;
The questionnaire review conducted identified various SoNA 2014 questions on these topics. However, there is scope for the SoNA 2014 questions to be streamlined. Currently, most questions rely on long ‘check-all that apply’ lists. These are likely to contribute to participant burden and may be less well suited to mixed modes of survey administration (should these be adopted in future survey waves). Furthermore, in SoNA 2014 there is no way that participants can rate the relative severity of each impact. Moving away from a ‘check all that apply’ format to a rating task could help provide more nuanced data on what day-to-day impacts cause the most distress, which could in turn provide insight into why aviation noise affects some people more than others.
We recommend that questions on complaint-making are retained and that some questions on coping capacity, such as those in the multi-item annoyance scale developed by Schreckenberg et al. (Ref 6) are considered.
48
We recommend that any new and updated questions on impacts on day-to-day activities are tested qualitatively with people who are exposed to aviation noise at different levels. This could be done via cognitive interviewing methods. The aim of the cognitive interviews would be to make sure new questions are understood and that all the main impacts of noise identified match on to the experiences of impacted communities. We also recommend that some testing of the translated Schreckenberg questions would be beneficial, to confirm that they work well with an English-speaking audience.
2.5.5 Measuring change and perceptions of change Change (and individuals’ perceptions of change) were raised as important topic areas during the stakeholder engagement phase. It was felt that the new survey should help build on existing understanding of the change effect. The change effect is when reported annoyance about noise is higher in communities who have experienced a change in noise levels compared to communities who have longer-term exposure to equivalent noise levels.
One criticism of SoNA 2014 was that, as a cross-sectional survey, the data collected offered a ‘snapshot’ of annoyance levels at one particular time. It has been suggested that the data collected in SoNA 2014 occurred when seven of the sampled airport vicinities were undergoing consultation or actual changes in noise exposure during the survey’s reference period. Therefore, critics claim that data on annoyance levels collected in SoNA 2014 may have been inflated by change effects (Ref 7).
Stakeholders were interested in a range of different changes to aviation noise exposure, and how they may influence annoyance. The main types of changes discussed were:
● Whether respondents were newly or recently overflown. ● Changes in flight paths. ● Changes in flight times (including introduction of respite periods). ● Changes in flight concentration. ● Changes in types of aircraft or refits to existing aircraft design. ● Any other changes in noise level, type, frequency, timing and tone. ● Impact of and attitudes towards perceived changes.
We recommend that the best way to examine the extent to which change is a driver of annoyance is to compare participants from higher-change areas and lower-change areas during analysis. For this reason, it is recommended that past changes in exposure are considered in the survey sampling stage, to ensure both high-change and low-change areas are included in the survey sample (see Section 1.3.7 on the design of a stratification scheme).
Another way of ensuring change effects can be examined is to compare annoyance around high and low change airports. Janssen and Guski (Ref 8) call airports “low-rate change airports” if there is no indication of a sustained, abrupt change of aircraft movements, or the published intention of the airport to change the number of movements, within three years before and after the annoyance study (i.e. a six-year window of change). “High-rate change” airports, by contrast, are those with a significant
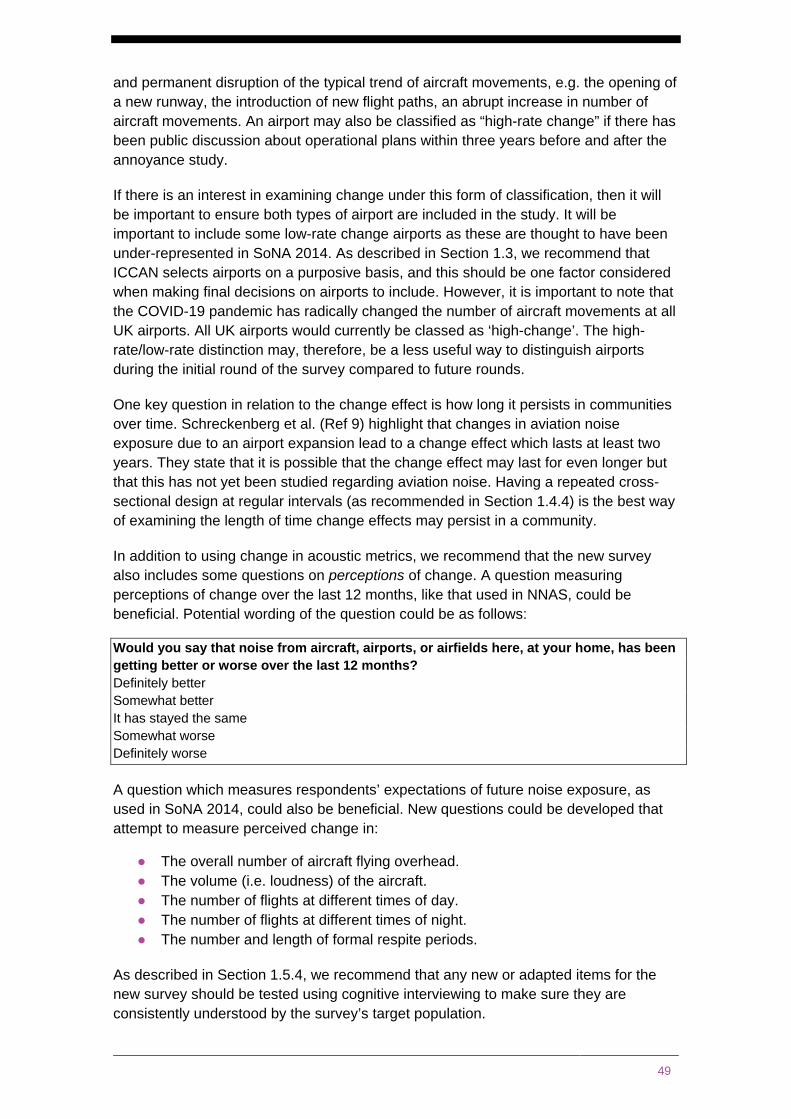
49
and permanent disruption of the typical trend of aircraft movements, e.g. the opening of a new runway, the introduction of new flight paths, an abrupt increase in number of aircraft movements. An airport may also be classified as “high-rate change” if there has been public discussion about operational plans within three years before and after the annoyance study.
If there is an interest in examining change under this form of classification, then it will be important to ensure both types of airport are included in the study. It will be important to include some low-rate change airports as these are thought to have been under-represented in SoNA 2014. As described in Section 1.3, we recommend that ICCAN selects airports on a purposive basis, and this should be one factor considered when making final decisions on airports to include. However, it is important to note that the COVID-19 pandemic has radically changed the number of aircraft movements at all UK airports. All UK airports would currently be classed as ‘high-change’. The high-rate/low-rate distinction may, therefore, be a less useful way to distinguish airports during the initial round of the survey compared to future rounds.
One key question in relation to the change effect is how long it persists in communities over time. Schreckenberg et al. (Ref 9) highlight that changes in aviation noise exposure due to an airport expansion lead to a change effect which lasts at least two years. They state that it is possible that the change effect may last for even longer but that this has not yet been studied regarding aviation noise. Having a repeated cross-sectional design at regular intervals (as recommended in Section 1.4.4) is the best way of examining the length of time change effects may persist in a community.
In addition to using change in acoustic metrics, we recommend that the new survey also includes some questions on perceptions of change. A question measuring perceptions of change over the last 12 months, like that used in NNAS, could be beneficial. Potential wording of the question could be as follows:
Would you say that noise from aircraft, airports, or airfields here, at your home, has been getting better or worse over the last 12 months? Definitely better Somewhat better It has stayed the same Somewhat worse Definitely worse
A question which measures respondents’ expectations of future noise exposure, as used in SoNA 2014, could also be beneficial. New questions could be developed that attempt to measure perceived change in:
● The overall number of aircraft flying overhead. ● The volume (i.e. loudness) of the aircraft. ● The number of flights at different times of day. ● The number of flights at different times of night. ● The number and length of formal respite periods.
As described in Section 1.5.4, we recommend that any new or adapted items for the new survey should be tested using cognitive interviewing to make sure they are consistently understood by the survey’s target population.
50
3 Shortlisted options Based on the information collated at WP2, NatCen presented four options for survey designs in a workshop to ICCAN. Indicative costs for each option were also presented, to enable ICCAN to make informed decisions whilst considering the relative price differences. The four options under consideration were:
1. A repeated cross-sectional survey using face-to-face methods (CAPI);
2. A repeated cross-sectional survey combining first web and then face-to-face methods (web-CAPI);
3. A repeated cross-sectional web survey;
4. A longitudinal survey with a face-to-face first wave, and subsequent surveys being conducted online.
These options are briefly summarised in this chapter, with an explanation of whether options were accepted or rejected, and the basis for these decisions. As a result of this workshop ICCAN also requested an additional sub-study was developed. This element was a web experiment to run in parallel with face-to-face data collection. This new element is described in Section 3.3.
3.1 Option one: A repeated cross-sectional survey using face-to-face methods
The first option presented for consideration is a face-to-face survey administered by means of Computer Assisted Personal Interviews (CAPI). A random sample of addresses would be approached to take part in the survey. The Postcode Address File (PAF) database would be used as the sample frame. Selected addresses would all be in the vicinity of a selected airport and would be stratified by multiple aviation noise exposure variables (see Section 1.3).
Participants would be sent an invitation letter in advance of the study. After this, interviewers would contact the selected addresses and conduct interviews with randomly selected householders. It should be noted that invitations, and interviewers, will not specifically mention that the new survey is about aviation noise. This is to ensure that the survey meets ISO and ICBEN standards; explicit information on the survey’s focus on aviation noise could potentially bias results in terms of which households respond. Invitations will give some information about the survey (e.g. it is a survey on important local issues to help inform future public policy) but they will not mention aviation noise. An unconditional PO Payout Incentive of £10 would be given as a way of maximising response rates across all groups.
In order to collect information on changes in community attitudes over time, the same survey would need to be repeated at regular intervals, with a random selection at each wave (i.e. different people being interviewed at each wave). This is what is known as a ‘repeated cross-sectional’ design.
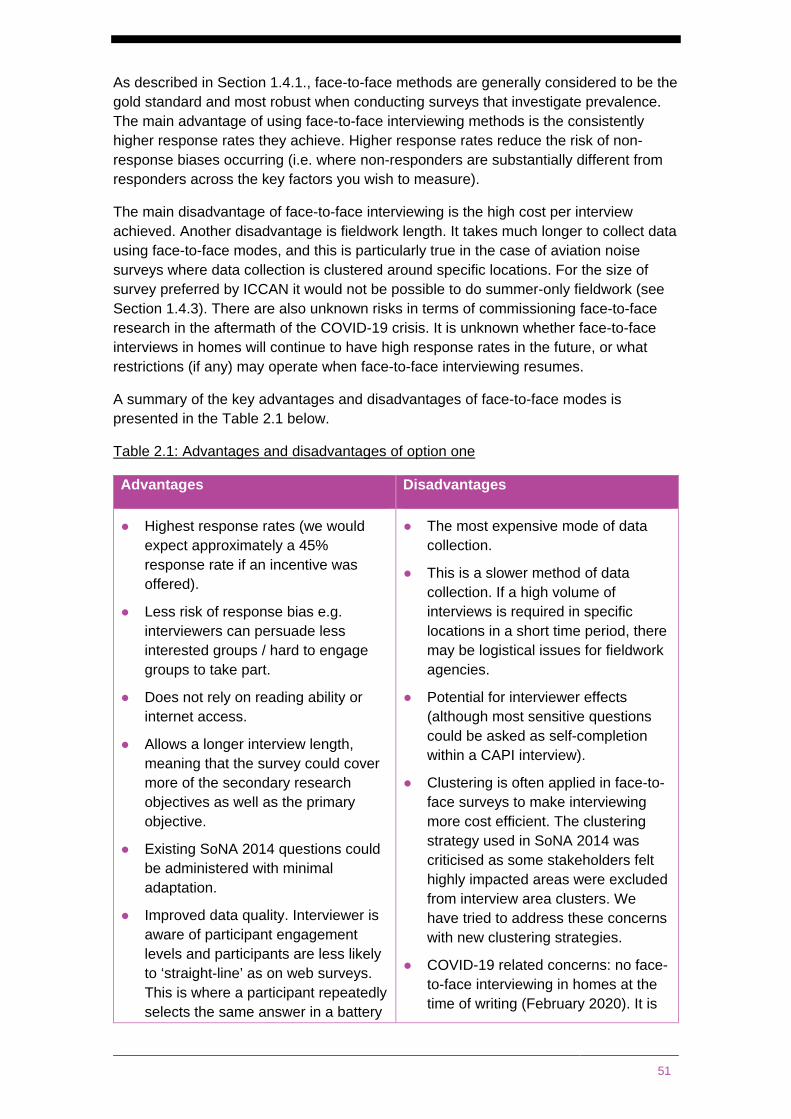
51
As described in Section 1.4.1., face-to-face methods are generally considered to be the gold standard and most robust when conducting surveys that investigate prevalence. The main advantage of using face-to-face interviewing methods is the consistently higher response rates they achieve. Higher response rates reduce the risk of non-response biases occurring (i.e. where non-responders are substantially different from responders across the key factors you wish to measure).
The main disadvantage of face-to-face interviewing is the high cost per interview achieved. Another disadvantage is fieldwork length. It takes much longer to collect data using face-to-face modes, and this is particularly true in the case of aviation noise surveys where data collection is clustered around specific locations. For the size of survey preferred by ICCAN it would not be possible to do summer-only fieldwork (see Section 1.4.3). There are also unknown risks in terms of commissioning face-to-face research in the aftermath of the COVID-19 crisis. It is unknown whether face-to-face interviews in homes will continue to have high response rates in the future, or what restrictions (if any) may operate when face-to-face interviewing resumes.
A summary of the key advantages and disadvantages of face-to-face modes is presented in the Table 2.1 below.
Table 2.1: Advantages and disadvantages of option one
Advantages Disadvantages
● Highest response rates (we would expect approximately a 45% response rate if an incentive was offered).
● Less risk of response bias e.g. interviewers can persuade less interested groups / hard to engage groups to take part.
● Does not rely on reading ability or internet access.
● Allows a longer interview length, meaning that the survey could cover more of the secondary research objectives as well as the primary objective.
● Existing SoNA 2014 questions could be administered with minimal adaptation.
● Improved data quality. Interviewer is aware of participant engagement levels and participants are less likely to ‘straight-line’ as on web surveys. This is where a participant repeatedly selects the same answer in a battery
● The most expensive mode of data collection.
● This is a slower method of data collection. If a high volume of interviews is required in specific locations in a short time period, there may be logistical issues for fieldwork agencies.
● Potential for interviewer effects (although most sensitive questions could be asked as self-completion within a CAPI interview).
● Clustering is often applied in face-to-face surveys to make interviewing more cost efficient. The clustering strategy used in SoNA 2014 was criticised as some stakeholders felt highly impacted areas were excluded from interview area clusters. We have tried to address these concerns with new clustering strategies.
● COVID-19 related concerns: no face-to-face interviewing in homes at the time of writing (February 2020). It is

52
of questions arranged in a grid format. Participants can seek clarification if needs be.
● Flexibility to add on additional elements of data collection e.g. administering noise detection equipment, sleep measurement devices, diaries etc.
unknown how response to face-to-face interviews may be affected going forward.
3.1.1 Reactions to option one ICCAN’s main priority is to design a survey that will produce robust data. Option one was held in high regard due to using a methodology that is seen to yield high data quality.
During the workshop, a concern was raised about whether purely face-to-face surveys could be considered somewhat ‘old-fashioned’ and not sustainable cost wise in the long term. However, it was highlighted that face-to-face surveys are still very much the gold standard approach in survey design, chiefly due to the high response rates they achieve. It was emphasised that nearly all government studies used to produce official UK statistics rely on random probability sampling using a face-to-face approach.
A further concern with a purely face-to-face approach was raised in light of the COVID-19 pandemic. It is not yet known whether face-to-face surveys will continue to be affected by the time the new survey will be run. With that in mind, it was discussed whether a mixed approach in the form of option two (a web-CAPI) would provide some contingency, if face-to-face response rates remain affected in the wake of the pandemic.
As a result of the workshop it was recommended that the face-to-face mode should be the preferred mode for wave one of the new survey of aviation noise. Longer term, the feasibility of an online mode should also be investigated. Prior to deciding on modes for further waves tests should be conducted looking at the impact of mode on the key metrics of interest (e.g. annoyance and wellbeing). Options for doing this could include either a web-CAPI option or a web-only experiment to be run in parallel to CAPI only fieldwork.
3.2 Option two: A repeated cross-sectional web-CAPI survey
The second design presented is a web-CAPI survey. In this scenario, participants would be invited (via a letter) to complete an online survey, with non-responders being followed up by interviewers to boost response rates to a higher level. An invitation letter with access codes to a web survey would be sent to all selected addresses, and one reminder letter be sent to try and maximise responses to the web element. A £10 conditional incentive would be provided to people who respond, either to the web invitation or to a face-to-face interview. The sampling strategy for selecting addresses

53
would be the same as described for option one (a random selection of addresses around selected airports, with addresses stratified by noise exposure variables). The same survey process would be repeated every three to five years.
The main advantage of the web-CAPI approach is that some cost saving can be made compared to the CAPI approach, assuming uptake to the web component is reasonable. After initial set up costs have been accounted for each web response is a cost-saving. The CAPI component is used to boost overall response rates and to reduce the risk of non-response bias. Several major surveys have started to investigate the possibility of a web-CAPI future.
Web and CAPI combinations are relatively straightforward to implement in terms of questionnaire design. If a web-CAPI approach is adopted, we recommend that key metrics (for example, annoyance items and wellbeing items) are always asked as a self-completion regardless of mode. This will reduce the risk of mode effects occurring. We would also recommend that the overall questionnaire length is kept to around 20-25 minutes to minimise the risk of break-off online.
Another advantage of a web-CAPI approach is that it would allow ICCAN to gain an understanding of how well a web-only approach would work in future waves of the survey, as it would be possible to compare data collected from the web component with data collected overall from the web-CAPI. Response rates between the web element and the web-CAPI could be compared to see how they vary across different demographic groups of interest. Data could be examined to see if key statistics vary between the web data and the combined web-CAPI data. If there are only limited differences across the key metrics (e.g. annoyance) after survey weights have been applied, this would be evidence that a web-only approach could be suitable for future waves of data collection. However, if there are significant differences in key metrics once face-to-face data are added this would be evidence to suggest that the investment in a CAPI component remains important for data quality reasons.
The disadvantage of a web-CAPI mode is cost; this approach is still more expensive than a web-only method. There are cost savings compared to CAPI, but these are dependent on the uptake to the web completion option, which is difficult to predict. There may also be some reductions in data quality for the part of the sample that opts to take online. Using online surveys, we would anticipate increased levels of survey break-off and item non-response for online responders.
It should also be noted there are more unknowns about web-CAPI designs as they are not yet widely used. The Office for National Statistics (ONS) has been spent some years trialling a web-CAPI alternative to their Labour Force Survey (LFS). The web-CAPI tests have yielded some very promising results in terms of achieving similar profile of respondents compared to traditional CAPI modes (Ref 10). However, tests have also revealed significant difference in data collected across some (but not all) measures within sub-groups, and the drivers of these differences have yet to be established (Ref 11). At the time of writing ONS are still planning on conducting further web-CAPI tests rather than moving away from CAPI modes. Understanding Society (the UK’s largest longitudinal panel survey) have also been trialling a web-CAPI approach. Again, results are promising in terms of sample composition achieved but, as there are risks regarding mode effects a proportion of the Understanding Society
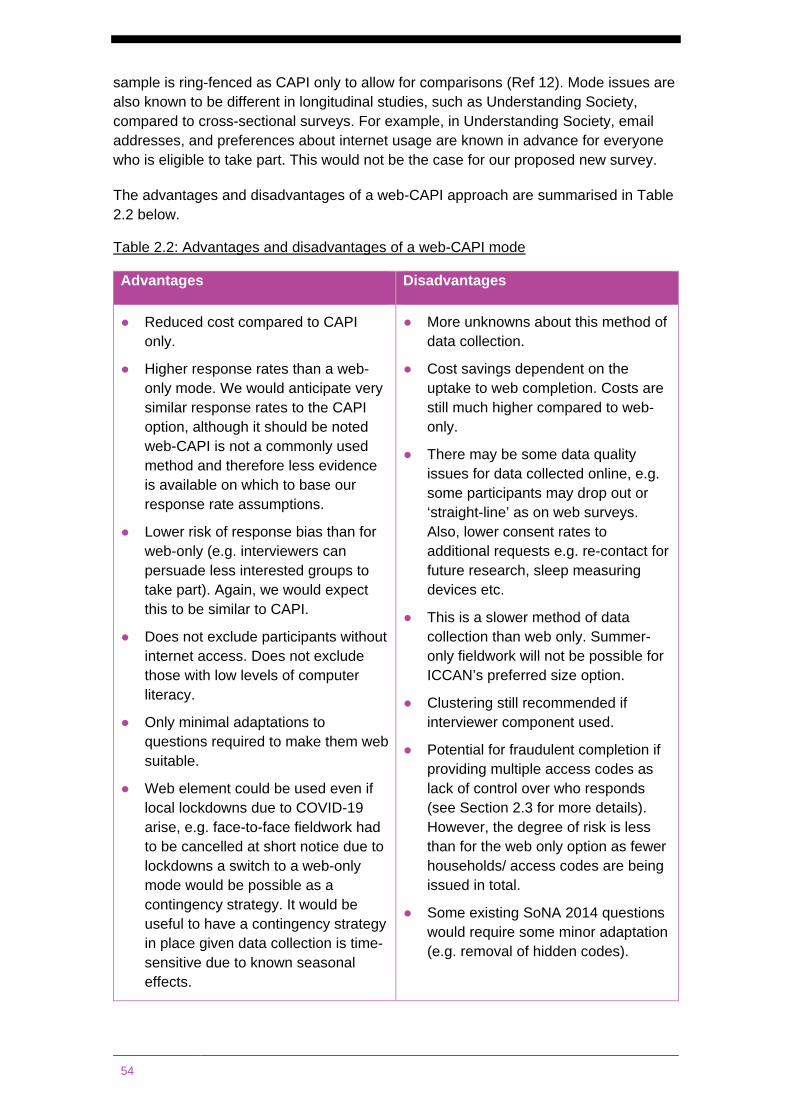
54
sample is ring-fenced as CAPI only to allow for comparisons (Ref 12). Mode issues are also known to be different in longitudinal studies, such as Understanding Society, compared to cross-sectional surveys. For example, in Understanding Society, email addresses, and preferences about internet usage are known in advance for everyone who is eligible to take part. This would not be the case for our proposed new survey.
The advantages and disadvantages of a web-CAPI approach are summarised in Table 2.2 below.
Table 2.2: Advantages and disadvantages of a web-CAPI mode
Advantages Disadvantages
● Reduced cost compared to CAPI only.
● Higher response rates than a web-only mode. We would anticipate very similar response rates to the CAPI option, although it should be noted web-CAPI is not a commonly used method and therefore less evidence is available on which to base our response rate assumptions.
● Lower risk of response bias than for web-only (e.g. interviewers can persuade less interested groups to take part). Again, we would expect this to be similar to CAPI.
● Does not exclude participants without internet access. Does not exclude those with low levels of computer literacy.
● Only minimal adaptations to questions required to make them web suitable.
● Web element could be used even if local lockdowns due to COVID-19 arise, e.g. face-to-face fieldwork had to be cancelled at short notice due to lockdowns a switch to a web-only mode would be possible as a contingency strategy. It would be useful to have a contingency strategy in place given data collection is time-sensitive due to known seasonal effects.
● More unknowns about this method of data collection.
● Cost savings dependent on the uptake to web completion. Costs are still much higher compared to web-only.
● There may be some data quality issues for data collected online, e.g. some participants may drop out or ‘straight-line’ as on web surveys. Also, lower consent rates to additional requests e.g. re-contact for future research, sleep measuring devices etc.
● This is a slower method of data collection than web only. Summer-only fieldwork will not be possible for ICCAN’s preferred size option.
● Clustering still recommended if interviewer component used.
● Potential for fraudulent completion if providing multiple access codes as lack of control over who responds (see Section 2.3 for more details). However, the degree of risk is less than for the web only option as fewer households/ access codes are being issued in total.
● Some existing SoNA 2014 questions would require some minor adaptation (e.g. removal of hidden codes).

55
● Allows ICCAN to test a web mode at first wave without compromising much on response rates.
3.2.1 Reactions to option two During the workshop it was stated that a mixed-mode design could, potentially, offer a marginally less robust approach than a purely face-to-face survey. It is anticipated that data generated online would have reduced quality in some areas, for example with more partial completions and higher levels of item non-response. It was discussed there may be unique selection effects and measurement effects in mixed-mode design. For example, some groups may attempt then terminate a web survey and then refuse to complete an interview (groups who would have otherwise taken part in CAPI). It was also discussed how people may respond in a different way to questions if an interviewer is present. Some steps can be taken in order to minimise the likelihood of measurement effects e.g. through considered questionnaire design. For instance, interviewer effects can be mitigated against through using self-completion elements. However, as web-CAPI modes are relatively new it may not be possible to mitigate against all effects. A purely face-to-face design would avoid the potential risks of combining modes.
The next point discussed in the workshop was cost. It was asserted that, overall, the predicted difference in the cost between CAPI and web-CAPI is proportionally small. However, looking into the future the savings each wave could contribute to larger savings over time. It was highlighted that there is more potential for cost savings than indicated in the costing report, for example, if there is a greater uptake to the online mode than was predicted. As there is quite a large variation in uptake of web surveys it is difficult to predict cost-savings without running a pilot to test web uptake.
Among the main advantages of option two discussed in the workshop, the flexibility of option two was viewed very favourably, alongside the fact that it could help to future-proof the survey in the wake of the COVID-19 pandemic. It was stated that option two seemed like a good opportunity to test out a web approach for the survey. However, it was also highlighted that this could also be explored via a separate web pilot or a web experiment. This would be a way of answering some of the questions about data quality online without jeopardising the quality of the wave one data. As a result of these discussions NatCen were asked to design a web-only experiment to run alongside the wave one CAPI option. This experiment is described in Chapter 3.
A query was raised during the workshop as to whether it would be feasible to adopt option one at wave one of the survey, and then transition to option two for future waves. It was stated that in terms of sampling and questionnaire design, this would be relatively unproblematic. The sampling approach would be largely the same, and the questions could be designed with this approach in mind so that the risk of mode effects is minimal. However, there were some concerns raised about the comparability of the data collected, in that it would be difficult to determine whether any change in attitudes observed were genuine or due to the switch in method. It was suggested that a parallel run could be conducted to understand the impact of the method switch.
56
A further item for discussion during the workshop was the fact that additional elements that may want to be added on to the survey, such as the administration of sleep diaries or monitoring equipment, would be best placed in option one rather than in option two. This is because the likelihood of uptake of these additional elements by participants is far lower if the questionnaire is completed via web.
Additionally, it was discussed that for option two it may be desirable to have a slightly shorter questionnaire length than option one to reduce the risk of drop-out. A query was raised about whether a shorter questionnaire length could be advantageous in terms of response rates, but it was stated that response rates are unlikely to be impacted if the two lengths are similar, e.g. 35 minutes and 25 minutes. Response rates would only be expected to be impacted if the questionnaire length were considerably shorter, e.g. a 10-minute questionnaire.
In sum, it was stated that – if cost is not the main factor – option one is potentially a cleaner and less complicated approach. The main advantage of option two would be that it could future-proof the survey against certain scenarios (for example, if in the future cost-savings are required). For this reason, option two was seen as a contingency option for cost savings in later waves rather than improvement on option one.
3.3 Option three: A repeated cross-sectional web survey
The main advantage of using an online mode is price. It is significantly cheaper to run a survey online than in an interviewer-administered mode. Therefore, more web ‘interviews’ can be conducted for the same amount of capital invested. Assuming that only a fixed amount of funding will be available (regardless of what the size of that investment is), there are trade-offs to be made in terms of whether funding is best invested in obtaining higher response rates (with less associated bias but less granular detail) or higher numbers of interviews achieved (which would allow for more granular analyses but with the risk that data are biased). Higher numbers of interviews achieved means that data could be collected from more airports, there can be more people interviewed per airport and/or there is more sample size to power comparisons of narrower acoustic bands. Online modes also allow for relatively fast data collection. Regardless of the size of the survey, it would be possible for all data to be collected in the summer period.
The main disadvantage of using an online mode is that response rates would be expected to be much lower than in an interviewer-administered mode. Response rates vary considerably between surveys depending on a variety of factors. Based on our prior experience, we would anticipate a push-to-web survey of this kind (with the offer of a £10 incentive) to have a household response rate of around 10%. For an interviewer administered survey the response rate would increase to around 45%.
Lower response rates increase the risk of non-response biases occurring (i.e. where non-responders are substantially different from responders across the key factors you wish to measure). Therefore, using online modes there is an increased risk that the survey results are not representative of the actual population of interest.
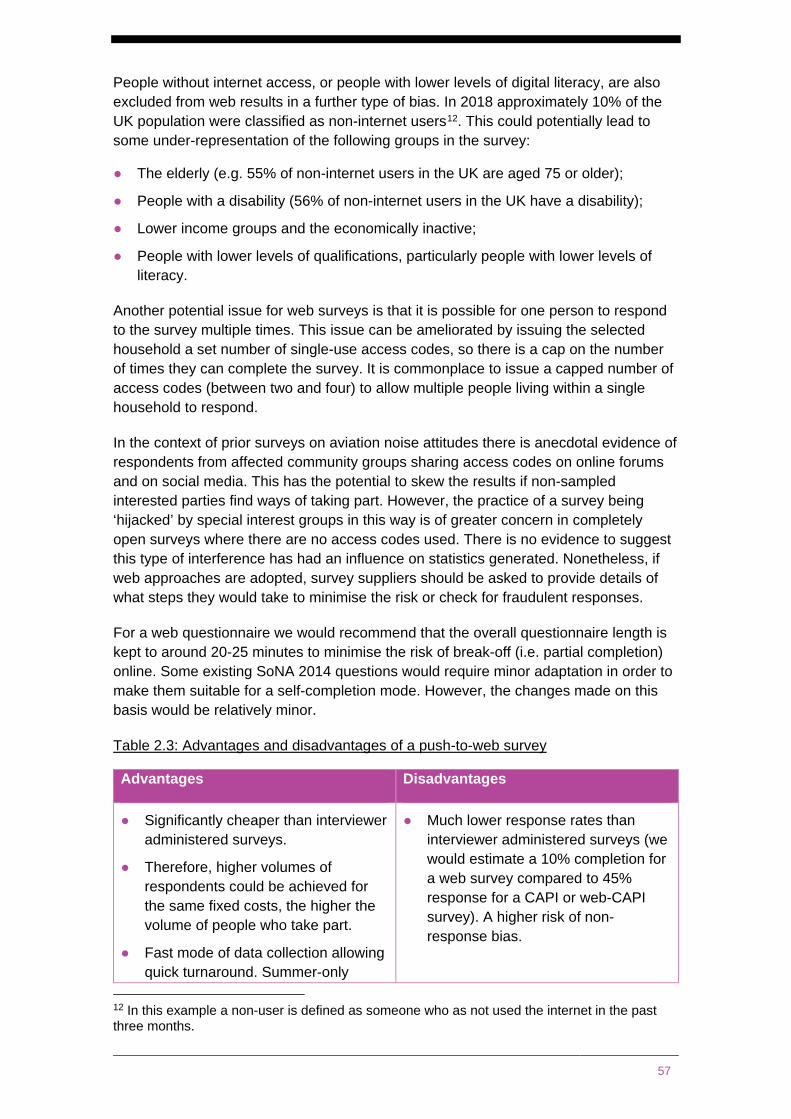
57
People without internet access, or people with lower levels of digital literacy, are also excluded from web results in a further type of bias. In 2018 approximately 10% of the UK population were classified as non-internet users12. This could potentially lead to some under-representation of the following groups in the survey:
● The elderly (e.g. 55% of non-internet users in the UK are aged 75 or older);
● People with a disability (56% of non-internet users in the UK have a disability);
● Lower income groups and the economically inactive;
● People with lower levels of qualifications, particularly people with lower levels of literacy.
Another potential issue for web surveys is that it is possible for one person to respond to the survey multiple times. This issue can be ameliorated by issuing the selected household a set number of single-use access codes, so there is a cap on the number of times they can complete the survey. It is commonplace to issue a capped number of access codes (between two and four) to allow multiple people living within a single household to respond.
In the context of prior surveys on aviation noise attitudes there is anecdotal evidence of respondents from affected community groups sharing access codes on online forums and on social media. This has the potential to skew the results if non-sampled interested parties find ways of taking part. However, the practice of a survey being ‘hijacked’ by special interest groups in this way is of greater concern in completely open surveys where there are no access codes used. There is no evidence to suggest this type of interference has had an influence on statistics generated. Nonetheless, if web approaches are adopted, survey suppliers should be asked to provide details of what steps they would take to minimise the risk or check for fraudulent responses.
For a web questionnaire we would recommend that the overall questionnaire length is kept to around 20-25 minutes to minimise the risk of break-off (i.e. partial completion) online. Some existing SoNA 2014 questions would require minor adaptation in order to make them suitable for a self-completion mode. However, the changes made on this basis would be relatively minor.
Table 2.3: Advantages and disadvantages of a push-to-web survey
Advantages Disadvantages
● Significantly cheaper than interviewer administered surveys.
● Therefore, higher volumes of respondents could be achieved for the same fixed costs, the higher the volume of people who take part.
● Fast mode of data collection allowing quick turnaround. Summer-only
● Much lower response rates than interviewer administered surveys (we would estimate a 10% completion for a web survey compared to 45% response for a CAPI or web-CAPI survey). A higher risk of non-response bias.
12 In this example a non-user is defined as someone who as not used the internet in the past three months.
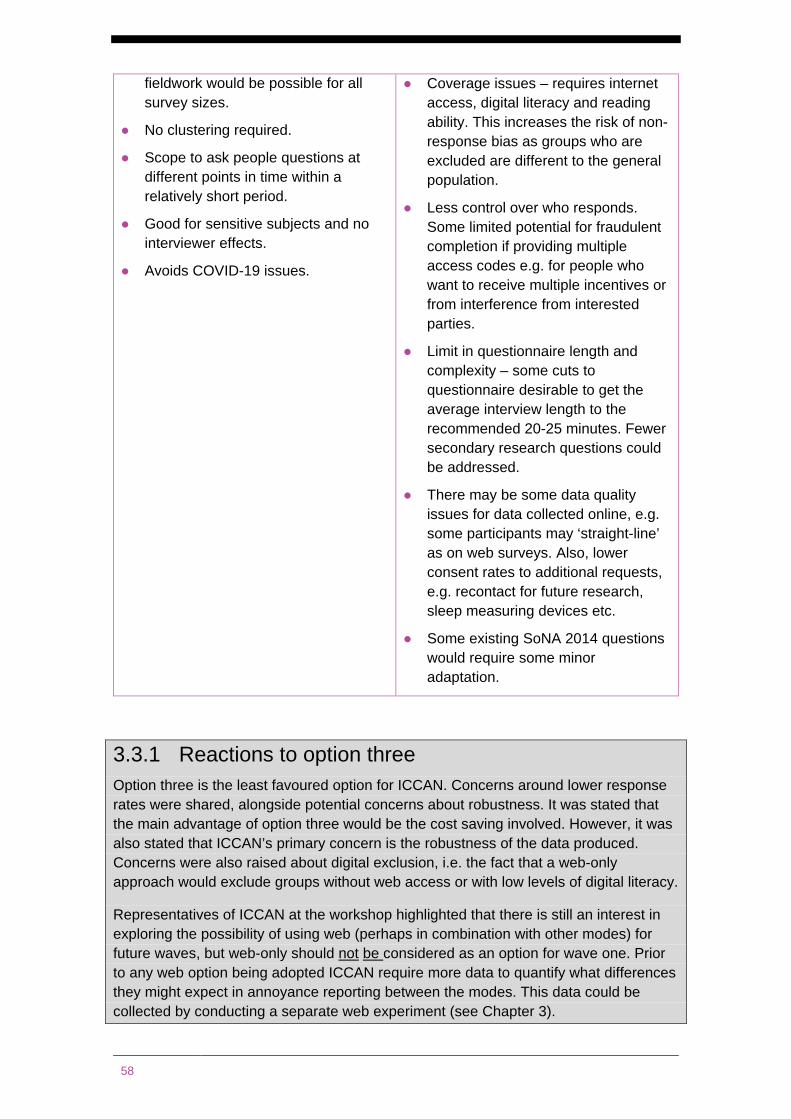
58
fieldwork would be possible for all survey sizes.
● No clustering required.
● Scope to ask people questions at different points in time within a relatively short period.
● Good for sensitive subjects and no interviewer effects.
● Avoids COVID-19 issues.
● Coverage issues – requires internet access, digital literacy and reading ability. This increases the risk of non-response bias as groups who are excluded are different to the general population.
● Less control over who responds. Some limited potential for fraudulent completion if providing multiple access codes e.g. for people who want to receive multiple incentives or from interference from interested parties.
● Limit in questionnaire length and complexity – some cuts to questionnaire desirable to get the average interview length to the recommended 20-25 minutes. Fewer secondary research questions could be addressed.
● There may be some data quality issues for data collected online, e.g. some participants may ‘straight-line’ as on web surveys. Also, lower consent rates to additional requests, e.g. recontact for future research, sleep measuring devices etc.
● Some existing SoNA 2014 questions would require some minor adaptation.
3.3.1 Reactions to option three Option three is the least favoured option for ICCAN. Concerns around lower response rates were shared, alongside potential concerns about robustness. It was stated that the main advantage of option three would be the cost saving involved. However, it was also stated that ICCAN’s primary concern is the robustness of the data produced. Concerns were also raised about digital exclusion, i.e. the fact that a web-only approach would exclude groups without web access or with low levels of digital literacy.
Representatives of ICCAN at the workshop highlighted that there is still an interest in exploring the possibility of using web (perhaps in combination with other modes) for future waves, but web-only should not be considered as an option for wave one. Prior to any web option being adopted ICCAN require more data to quantify what differences they might expect in annoyance reporting between the modes. This data could be collected by conducting a separate web experiment (see Chapter 3).
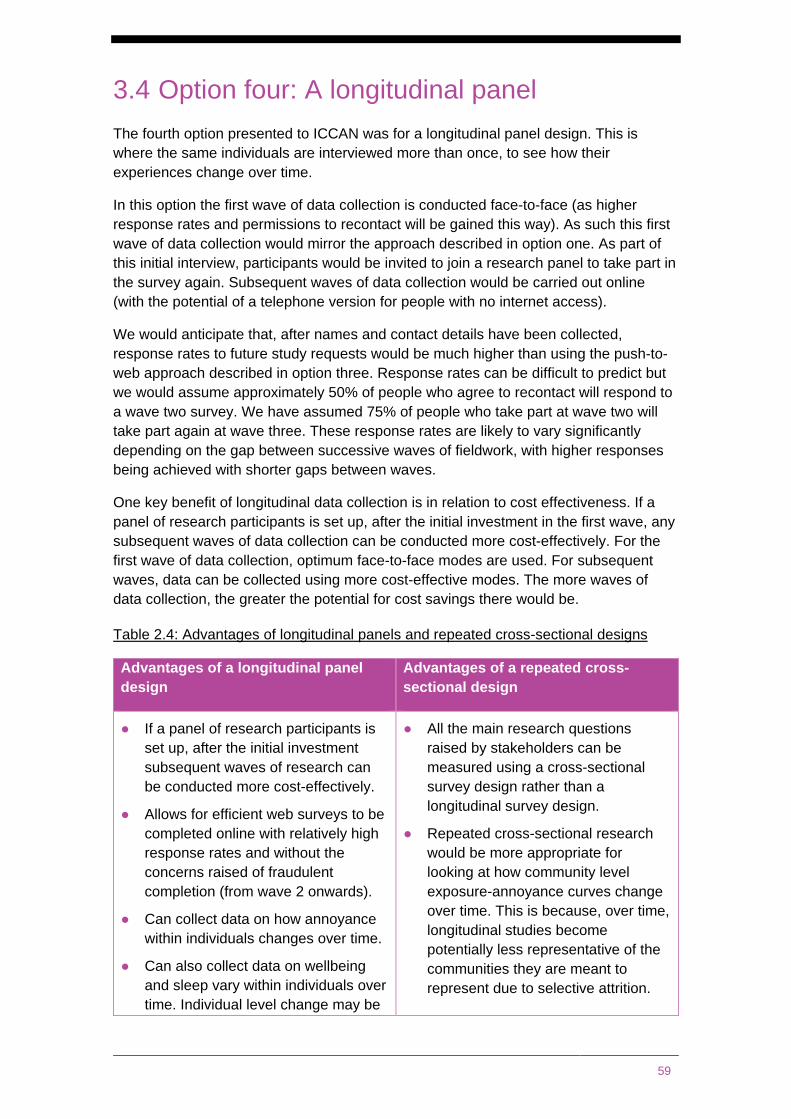
59
3.4 Option four: A longitudinal panel The fourth option presented to ICCAN was for a longitudinal panel design. This is where the same individuals are interviewed more than once, to see how their experiences change over time.
In this option the first wave of data collection is conducted face-to-face (as higher response rates and permissions to recontact will be gained this way). As such this first wave of data collection would mirror the approach described in option one. As part of this initial interview, participants would be invited to join a research panel to take part in the survey again. Subsequent waves of data collection would be carried out online (with the potential of a telephone version for people with no internet access).
We would anticipate that, after names and contact details have been collected, response rates to future study requests would be much higher than using the push-to-web approach described in option three. Response rates can be difficult to predict but we would assume approximately 50% of people who agree to recontact will respond to a wave two survey. We have assumed 75% of people who take part at wave two will take part again at wave three. These response rates are likely to vary significantly depending on the gap between successive waves of fieldwork, with higher responses being achieved with shorter gaps between waves.
One key benefit of longitudinal data collection is in relation to cost effectiveness. If a panel of research participants is set up, after the initial investment in the first wave, any subsequent waves of data collection can be conducted more cost-effectively. For the first wave of data collection, optimum face-to-face modes are used. For subsequent waves, data can be collected using more cost-effective modes. The more waves of data collection, the greater the potential for cost savings there would be.
Table 2.4: Advantages of longitudinal panels and repeated cross-sectional designs
Advantages of a longitudinal panel design
Advantages of a repeated cross-sectional design
● If a panel of research participants is set up, after the initial investment subsequent waves of research can be conducted more cost-effectively.
● Allows for efficient web surveys to be completed online with relatively high response rates and without the concerns raised of fraudulent completion (from wave 2 onwards).
● Can collect data on how annoyance within individuals changes over time.
● Can also collect data on wellbeing and sleep vary within individuals over time. Individual level change may be
● All the main research questions raised by stakeholders can be measured using a cross-sectional survey design rather than a longitudinal survey design.
● Repeated cross-sectional research would be more appropriate for looking at how community level exposure-annoyance curves change over time. This is because, over time, longitudinal studies become potentially less representative of the communities they are meant to represent due to selective attrition.
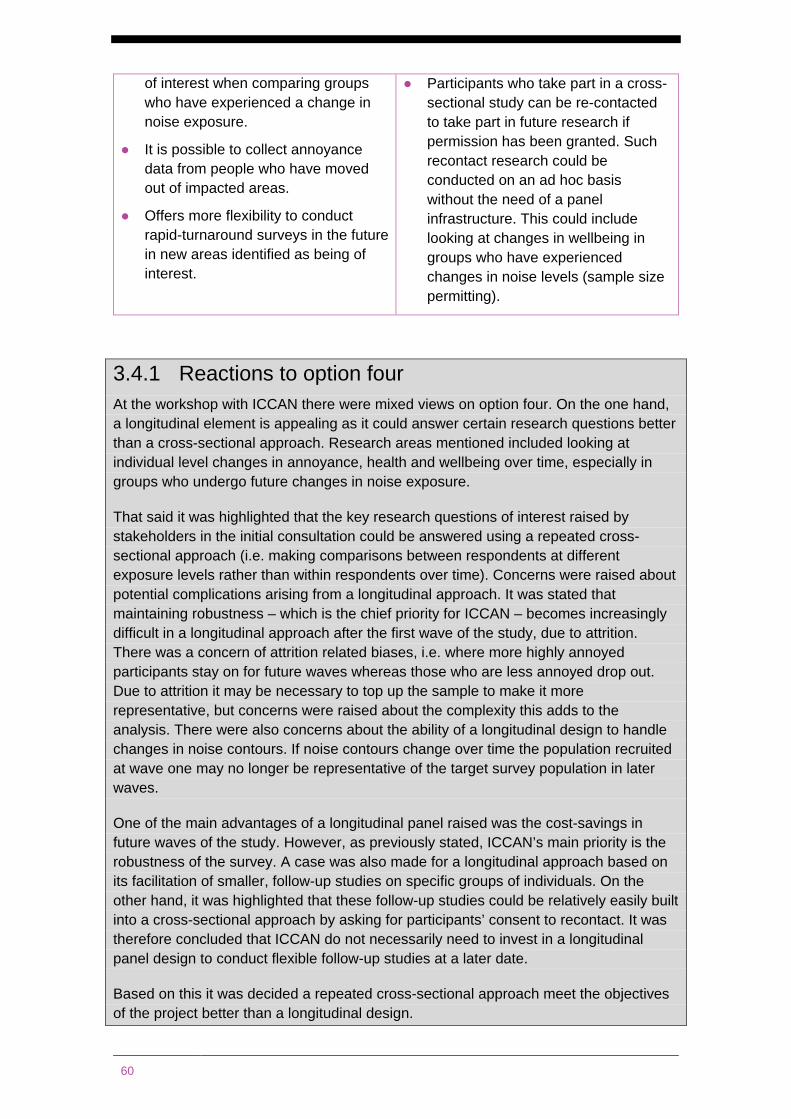
60
of interest when comparing groups who have experienced a change in noise exposure.
● It is possible to collect annoyance data from people who have moved out of impacted areas.
● Offers more flexibility to conduct rapid-turnaround surveys in the future in new areas identified as being of interest.
● Participants who take part in a cross-sectional study can be re-contacted to take part in future research if permission has been granted. Such recontact research could be conducted on an ad hoc basis without the need of a panel infrastructure. This could include looking at changes in wellbeing in groups who have experienced changes in noise levels (sample size permitting).
3.4.1 Reactions to option four At the workshop with ICCAN there were mixed views on option four. On the one hand, a longitudinal element is appealing as it could answer certain research questions better than a cross-sectional approach. Research areas mentioned included looking at individual level changes in annoyance, health and wellbeing over time, especially in groups who undergo future changes in noise exposure.
That said it was highlighted that the key research questions of interest raised by stakeholders in the initial consultation could be answered using a repeated cross-sectional approach (i.e. making comparisons between respondents at different exposure levels rather than within respondents over time). Concerns were raised about potential complications arising from a longitudinal approach. It was stated that maintaining robustness – which is the chief priority for ICCAN – becomes increasingly difficult in a longitudinal approach after the first wave of the study, due to attrition. There was a concern of attrition related biases, i.e. where more highly annoyed participants stay on for future waves whereas those who are less annoyed drop out. Due to attrition it may be necessary to top up the sample to make it more representative, but concerns were raised about the complexity this adds to the analysis. There were also concerns about the ability of a longitudinal design to handle changes in noise contours. If noise contours change over time the population recruited at wave one may no longer be representative of the target survey population in later waves.
One of the main advantages of a longitudinal panel raised was the cost-savings in future waves of the study. However, as previously stated, ICCAN’s main priority is the robustness of the survey. A case was also made for a longitudinal approach based on its facilitation of smaller, follow-up studies on specific groups of individuals. On the other hand, it was highlighted that these follow-up studies could be relatively easily built into a cross-sectional approach by asking for participants’ consent to recontact. It was therefore concluded that ICCAN do not necessarily need to invest in a longitudinal panel design to conduct flexible follow-up studies at a later date.
Based on this it was decided a repeated cross-sectional approach meet the objectives of the project better than a longitudinal design.
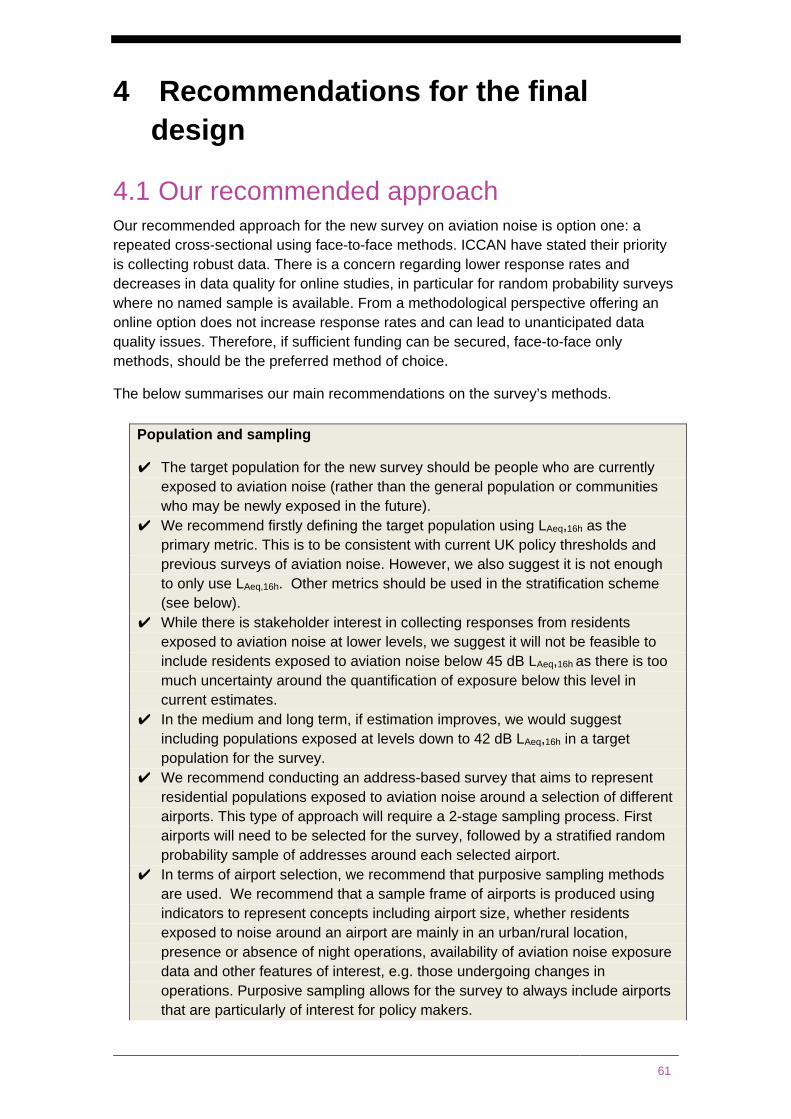
61
4 Recommendations for the final design
4.1 Our recommended approach Our recommended approach for the new survey on aviation noise is option one: a repeated cross-sectional using face-to-face methods. ICCAN have stated their priority is collecting robust data. There is a concern regarding lower response rates and decreases in data quality for online studies, in particular for random probability surveys where no named sample is available. From a methodological perspective offering an online option does not increase response rates and can lead to unanticipated data quality issues. Therefore, if sufficient funding can be secured, face-to-face only methods, should be the preferred method of choice.
The below summarises our main recommendations on the survey’s methods.
Population and sampling
✔ The target population for the new survey should be people who are currently exposed to aviation noise (rather than the general population or communities who may be newly exposed in the future).
✔ We recommend firstly defining the target population using LAeq,16h as the primary metric. This is to be consistent with current UK policy thresholds and previous surveys of aviation noise. However, we also suggest it is not enough to only use LAeq,16h. Other metrics should be used in the stratification scheme (see below).
✔ While there is stakeholder interest in collecting responses from residents exposed to aviation noise at lower levels, we suggest it will not be feasible to include residents exposed to aviation noise below 45 dB LAeq,16h as there is too much uncertainty around the quantification of exposure below this level in current estimates.
✔ In the medium and long term, if estimation improves, we would suggest including populations exposed at levels down to 42 dB LAeq,16h in a target population for the survey.
✔ We recommend conducting an address-based survey that aims to represent residential populations exposed to aviation noise around a selection of different airports. This type of approach will require a 2-stage sampling process. First airports will need to be selected for the survey, followed by a stratified random probability sample of addresses around each selected airport.
✔ In terms of airport selection, we recommend that purposive sampling methods are used. We recommend that a sample frame of airports is produced using indicators to represent concepts including airport size, whether residents exposed to noise around an airport are mainly in an urban/rural location, presence or absence of night operations, availability of aviation noise exposure data and other features of interest, e.g. those undergoing changes in operations. Purposive sampling allows for the survey to always include airports that are particularly of interest for policy makers.

62
✔ The costings we have presented to ICCAN are based on a 12-airport selection UK wide model. That said, the number of airports for inclusion remains open to discussion. For a given sample size of a future survey, there is a trade-off between ensuring estimates of annoyance are robust at the airport level (and having a larger sample size per airport) and including more airports (with smaller target sample sizes per airport). ICCAN will need to decide whether inclusivity or robustness of estimates should be prioritised for a future survey.
✔ After stratifying by airport and LAeq,16h additional stratifiers should be applied. Stratifiers should include LAeq,8h (to ensure variance in night noise exposure), N65day (to ensure variance in the number of 65 dB or greater events), and change in LAeq,16h over time.
✔ The order of the stratification variables after LAeq,16h, should depend on the theoretical relative importance of the other metrics. This could vary between airports. For example, LAeq,8h is a higher order stratifier for airports that run night-time operations. Therefore, stratification schemes should vary on an airport-by-airport basis and will be partially dependent on what metrics and acoustic measures are available for each site.
✔ Additional stratification principles should be applied to addresses that are exposed to levels of aviation noise 45-50 dB LAeq,16h. For this sub-sample we recommend combining acoustic measures with overflight metrics, i.e. so that households with a range of overflight metrics are included in the survey sample.
✔ If CAPI only or web-CAPI methods are chosen as the mode of data collection we suggest clustering of addresses at <54 dB LAeq,16h will be necessary. We recommend stratifying clusters by population weighted averages of other exposure metrics (such as LAeq,8h or N65day or other metrics chosen) or overflight metrics where appropriate before clusters are selected to ensure a range of experiences are included in the survey. We also recommend comparing chosen clusters to a map of areas reporting large numbers of complaints to ensure some areas where residents have complained are included.
✔ Based on our discussion with stakeholders (which identified annoyance differences between 45-50 and 51-53; and 51-53 and 54-56 as analysis priorities for a future survey), we recommend a survey option of approximately 6,500 respondents should be large enough to identify key differences in annoyance by aviation noise exposure band with adequate precision.
Mode, timing and frequency
✔ CAPI-only is the most robust data collection method for the research questions this survey aims to address. CAPI-only methods achieve consistently higher response rates and present the smallest risks of non-response biases. We therefore recommend CAPI-only as the data collection method for the first round of this survey if robustness is the priority and cost is no object.
✔ Web-CAPI has some advantages for this survey (in particular, high response rates with some cost-savings). Given the new survey should be repeated at regular intervals, this mode would offer small-moderate savings per wave that could become more substantial cost savings across time. Web-CAPI methods may also allow the survey to be more flexible in the future if CAPI is not possible or CAPI-only response rates decline.
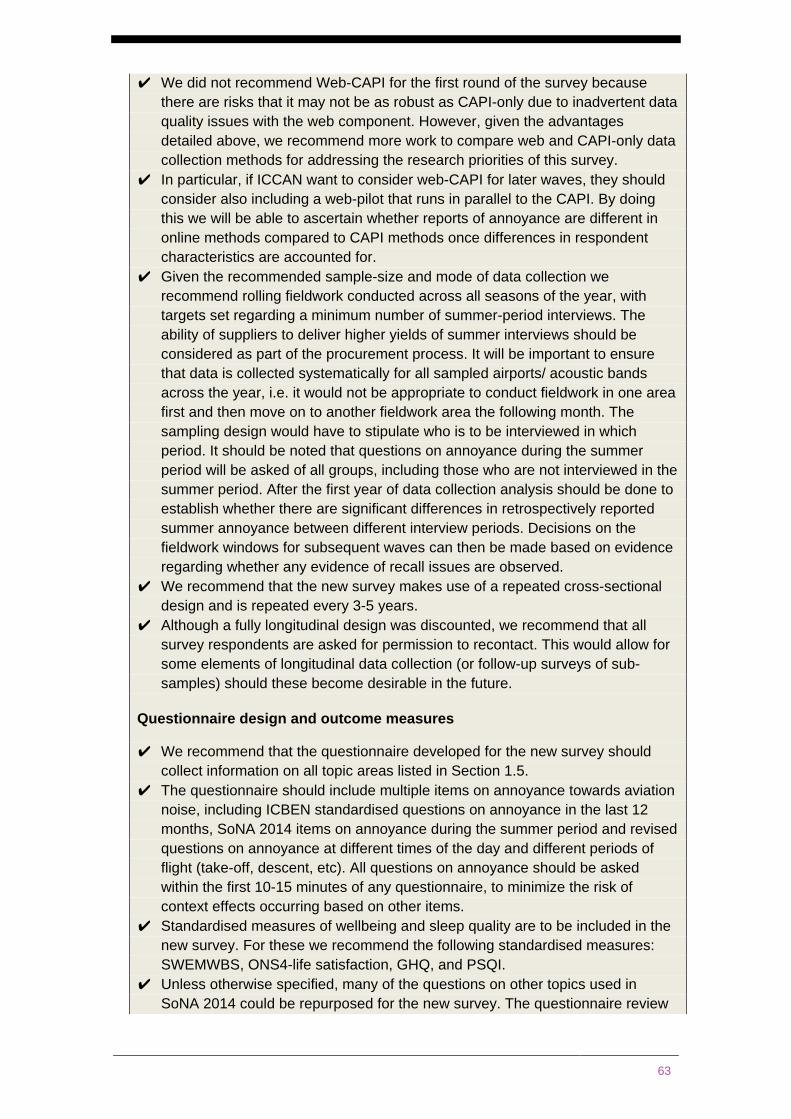
63
✔ We did not recommend Web-CAPI for the first round of the survey because there are risks that it may not be as robust as CAPI-only due to inadvertent data quality issues with the web component. However, given the advantages detailed above, we recommend more work to compare web and CAPI-only data collection methods for addressing the research priorities of this survey.
✔ In particular, if ICCAN want to consider web-CAPI for later waves, they should consider also including a web-pilot that runs in parallel to the CAPI. By doing this we will be able to ascertain whether reports of annoyance are different in online methods compared to CAPI methods once differences in respondent characteristics are accounted for.
✔ Given the recommended sample-size and mode of data collection we recommend rolling fieldwork conducted across all seasons of the year, with targets set regarding a minimum number of summer-period interviews. The ability of suppliers to deliver higher yields of summer interviews should be considered as part of the procurement process. It will be important to ensure that data is collected systematically for all sampled airports/ acoustic bands across the year, i.e. it would not be appropriate to conduct fieldwork in one area first and then move on to another fieldwork area the following month. The sampling design would have to stipulate who is to be interviewed in which period. It should be noted that questions on annoyance during the summer period will be asked of all groups, including those who are not interviewed in the summer period. After the first year of data collection analysis should be done to establish whether there are significant differences in retrospectively reported summer annoyance between different interview periods. Decisions on the fieldwork windows for subsequent waves can then be made based on evidence regarding whether any evidence of recall issues are observed.
✔ We recommend that the new survey makes use of a repeated cross-sectional design and is repeated every 3-5 years.
✔ Although a fully longitudinal design was discounted, we recommend that all survey respondents are asked for permission to recontact. This would allow for some elements of longitudinal data collection (or follow-up surveys of sub-samples) should these become desirable in the future.
Questionnaire design and outcome measures
✔ We recommend that the questionnaire developed for the new survey should collect information on all topic areas listed in Section 1.5.
✔ The questionnaire should include multiple items on annoyance towards aviation noise, including ICBEN standardised questions on annoyance in the last 12 months, SoNA 2014 items on annoyance during the summer period and revised questions on annoyance at different times of the day and different periods of flight (take-off, descent, etc). All questions on annoyance should be asked within the first 10-15 minutes of any questionnaire, to minimize the risk of context effects occurring based on other items.
✔ Standardised measures of wellbeing and sleep quality are to be included in the new survey. For these we recommend the following standardised measures: SWEMWBS, ONS4-life satisfaction, GHQ, and PSQI.
✔ Unless otherwise specified, many of the questions on other topics used in SoNA 2014 could be repurposed for the new survey. The questionnaire review
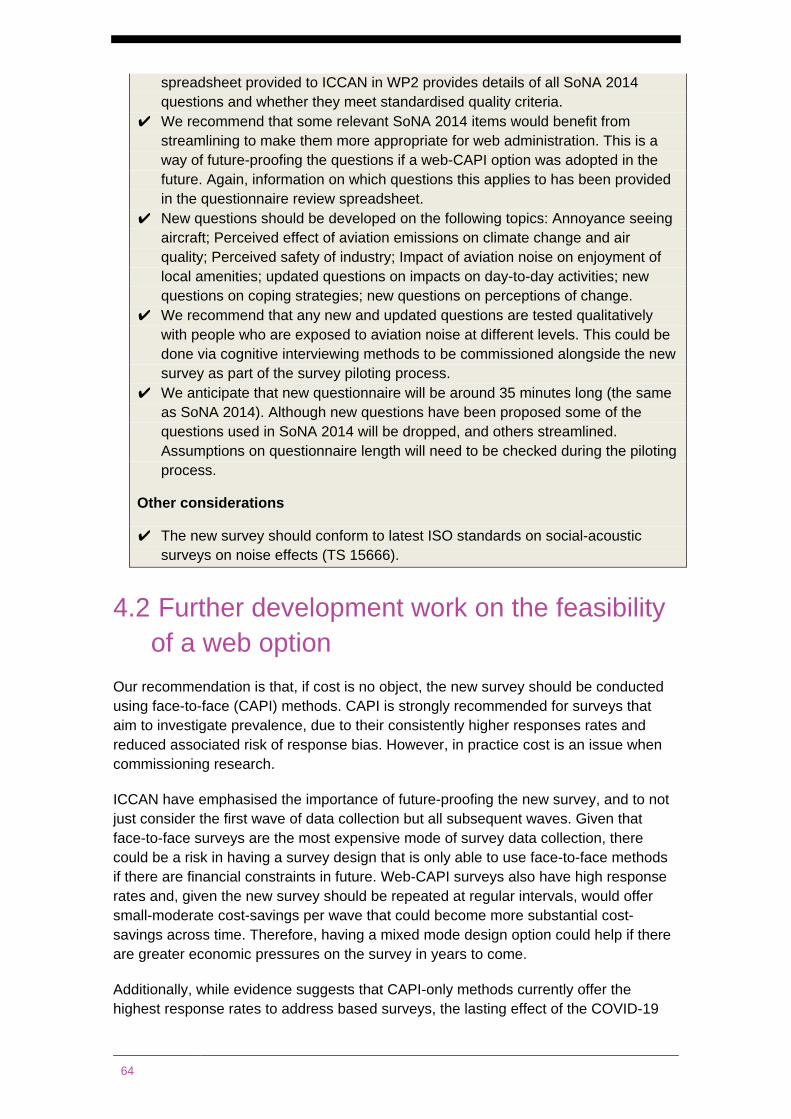
64
spreadsheet provided to ICCAN in WP2 provides details of all SoNA 2014 questions and whether they meet standardised quality criteria.
✔ We recommend that some relevant SoNA 2014 items would benefit from streamlining to make them more appropriate for web administration. This is a way of future-proofing the questions if a web-CAPI option was adopted in the future. Again, information on which questions this applies to has been provided in the questionnaire review spreadsheet.
✔ New questions should be developed on the following topics: Annoyance seeing aircraft; Perceived effect of aviation emissions on climate change and air quality; Perceived safety of industry; Impact of aviation noise on enjoyment of local amenities; updated questions on impacts on day-to-day activities; new questions on coping strategies; new questions on perceptions of change.
✔ We recommend that any new and updated questions are tested qualitatively with people who are exposed to aviation noise at different levels. This could be done via cognitive interviewing methods to be commissioned alongside the new survey as part of the survey piloting process.
✔ We anticipate that new questionnaire will be around 35 minutes long (the same as SoNA 2014). Although new questions have been proposed some of the questions used in SoNA 2014 will be dropped, and others streamlined. Assumptions on questionnaire length will need to be checked during the piloting process.
Other considerations
✔ The new survey should conform to latest ISO standards on social-acoustic surveys on noise effects (TS 15666).
4.2 Further development work on the feasibility of a web option
Our recommendation is that, if cost is no object, the new survey should be conducted using face-to-face (CAPI) methods. CAPI is strongly recommended for surveys that aim to investigate prevalence, due to their consistently higher responses rates and reduced associated risk of response bias. However, in practice cost is an issue when commissioning research.
ICCAN have emphasised the importance of future-proofing the new survey, and to not just consider the first wave of data collection but all subsequent waves. Given that face-to-face surveys are the most expensive mode of survey data collection, there could be a risk in having a survey design that is only able to use face-to-face methods if there are financial constraints in future. Web-CAPI surveys also have high response rates and, given the new survey should be repeated at regular intervals, would offer small-moderate cost-savings per wave that could become more substantial cost-savings across time. Therefore, having a mixed mode design option could help if there are greater economic pressures on the survey in years to come.
Additionally, while evidence suggests that CAPI-only methods currently offer the highest response rates to address based surveys, the lasting effect of the COVID-19
65
pandemic on face-to-face survey methods is unknown. It is possible that this pandemic or future pandemics may change CAPI-only response rates or the profile of people who respond to CAPI-only surveys.
For this reason, we recommend that ICCAN take the following steps to future-proof the new survey so that it doesn’t need to be solely reliant on CAPI if circumstances change:
1. ICCAN should consider commissioning some further development work regarding the feasibility of online data collection and how this might impact on results.
2. The wave one questionnaire should be designed so it is suitable for both web and CAPI administration (in case a mode switch becomes more attractive at a later date without core questions needing to be altered).
It should be stressed that web-only should not be the default mode choice for the first wave of data collection. However, web-CAPI or web-only modes could be considered for future waves of data collection once more evidence is available on how a web-mode impacts reports of annoyance. If ICCAN opt for the CAPI-only design at wave one, they should consider also including a web-test that runs in parallel to the CAPI. This would allow ICCAN to collect more information on whether any mode-effects can be observed between CAPI and web modes. This web-pilot will allow ICCAN to make informed decisions about whether to transition to a web-CAPI mode (or even a full web mode) in future waves. The design and costs for this activity are shown in the following section (3.3).
A secondary disadvantage of face-to-face interviewing is uncertainty stemming from the COVID-19 crisis. Since the onset of this crisis, surveys involving face-to-face interviewing have largely been suspended. Currently, it is unclear what the long-term impact of the pandemic will be on social surveys. Hopefully, by the time ICCAN hope to launch the survey, face-to-face fieldwork will have resumed in much the same way as before the outbreak. However, there is a risk that the pandemic could decrease CAPI response rates, for example if potential respondents remain concerned about letting interviewers into their homes. There may also be logistical issues if fieldwork agencies are working at full capacity filling data gaps from government surveys paused in 2020 and 2021.
Therefore, with COVID-19 as a potential barrier to CAPI-only modes we recommend that ICCAN ask potential contractors for contingencies plans for mode of data collection should response rates to CAPI decrease once interviewers are allowed back into the field. These contingencies are likely to be largely dependent on a range of factors, e.g. whether declines in response are regional or national, whether they apply to any particular sub-groups and whether any localised lockdowns are still being enforced. At this stage these issues are purely speculative, and decisions related to post-COVID response-rate boosting should be made once more data on the situation become available.
4.3 An experimental web pilot alongside CAPI data collection
66
4.3.1 Aims The following section gives recommendations on the design of a web pilot to run alongside the first wave of CAPI data collection. The main purpose of a web pilot experiment would be to explore mode effects between collecting data on aviation noise attitudes using face-to-face CAPI methods compared with online push-to-web methods. If the experiment finds only minor differences in key annoyance measures by mode, ICCAN could confidently use web or web-CAPI methods in future rounds of the survey, without the worry of mode impacting the robustness of the results. Conducting an experiment would allow ICCAN to have a more thorough understanding of the likely response rate to a web-only survey, including response amongst different exposure levels and different demographic groups. It would also allow ICCAN to have some insight into data quality issues between modes, for example item non-response, questionnaire breakoffs and so on.
To run the parallel web survey, we need to assume that ICCAN has decided to commission a face-to-face survey that uses the methods outlined in option one (see Section 2.1). A separate push-to-web survey would be run in parallel with the face-to-face survey. This web survey would be designed to run under the same timeframes as the CAPI survey and would use the same questionnaire. Participants would be invited (via a letter) to complete an online survey. The information in this invitation would mirror that given in the CAPI survey. An additional postal reminder for the web version of the test would be sent to increase response. A £10 conditional incentive would also be offered.
4.3.2 Sampling Strategy We recommend that the sampling strategy of the web experiment should mirror the sampling strategy for the face-to-face survey given in option one. Even though web survey designs do not require this we would recommend clustering is used at the lower levels of aviation noise exposure so the population for the experiment matches that being used in CAPI. Having a consistent sampling strategy will help to isolate mode effects in the experiment, as we can be confident that any differences in outcomes are not due to differences in sampling strategy. If ICCAN is considering moving to a web-CAPI in future rounds of the survey, it may also provide a useful baseline for exploring what the additional CAPI element of a web-CAPI survey brings.
A key constraint in designing a web survey to run alongside a face-to-face survey is the limited number of addresses exposed to high levels of aviation noise. For instance, our analyses of 8 airports indicated that only a small proportion of addresses are exposed to levels of noise greater than 66 dB Summer 2018 LAeq,16h (see Work Package 2A&B report for more information). Relatively low response rates in web surveys suggest that a very large number of addresses will need to be issued to achieve a useful number of responses. Given that many addresses around airports will already be issued into the face-to-face survey (and we can’t approach households to take part in the same survey twice in different modes) we suggest a comparison of face-to-face data and web data would only be feasible around Heathrow airport. Heathrow has the largest number of addresses exposed to aviation noise around any airport, and in this area there would be enough addresses to run both the large scale CAPI survey and a web test survey concurrently.
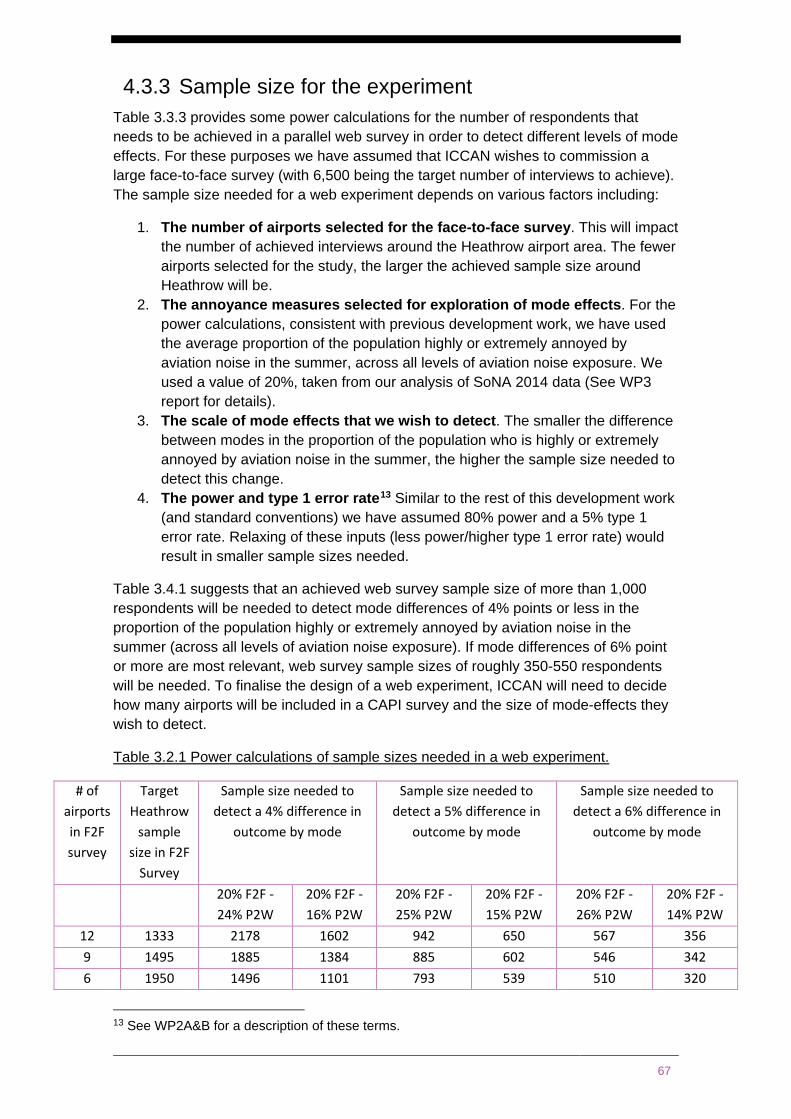
67
4.3.3 Sample size for the experiment Table 3.3.3 provides some power calculations for the number of respondents that needs to be achieved in a parallel web survey in order to detect different levels of mode effects. For these purposes we have assumed that ICCAN wishes to commission a large face-to-face survey (with 6,500 being the target number of interviews to achieve). The sample size needed for a web experiment depends on various factors including:
1. The number of airports selected for the face-to-face survey. This will impact the number of achieved interviews around the Heathrow airport area. The fewer airports selected for the study, the larger the achieved sample size around Heathrow will be.
2. The annoyance measures selected for exploration of mode effects. For the power calculations, consistent with previous development work, we have used the average proportion of the population highly or extremely annoyed by aviation noise in the summer, across all levels of aviation noise exposure. We used a value of 20%, taken from our analysis of SoNA 2014 data (See WP3 report for details).
3. The scale of mode effects that we wish to detect. The smaller the difference between modes in the proportion of the population who is highly or extremely annoyed by aviation noise in the summer, the higher the sample size needed to detect this change.
4. The power and type 1 error rate13 Similar to the rest of this development work (and standard conventions) we have assumed 80% power and a 5% type 1 error rate. Relaxing of these inputs (less power/higher type 1 error rate) would result in smaller sample sizes needed.
Table 3.4.1 suggests that an achieved web survey sample size of more than 1,000 respondents will be needed to detect mode differences of 4% points or less in the proportion of the population highly or extremely annoyed by aviation noise in the summer (across all levels of aviation noise exposure). If mode differences of 6% point or more are most relevant, web survey sample sizes of roughly 350-550 respondents will be needed. To finalise the design of a web experiment, ICCAN will need to decide how many airports will be included in a CAPI survey and the size of mode-effects they wish to detect.
Table 3.2.1 Power calculations of sample sizes needed in a web experiment.
# of airports in F2F survey
Target Heathrow
sample size in F2F
Survey
Sample size needed to detect a 4% difference in
outcome by mode
Sample size needed to detect a 5% difference in
outcome by mode
Sample size needed to detect a 6% difference in
outcome by mode
20% F2F - 24% P2W
20% F2F - 16% P2W
20% F2F - 25% P2W
20% F2F -15% P2W
20% F2F - 26% P2W
20% F2F - 14% P2W
12 1333 2178 1602 942 650 567 356 9 1495 1885 1384 885 602 546 342 6 1950 1496 1101 793 539 510 320
13 See WP2A&B for a description of these terms.
68
References 1. Ipsos MORI (2015). CAP 1506a: The 2014 Survey of Noise Attitudes (SoNA)
Technical Report. 2. Willis, G., and J. T. Lessler. (1999). Question Appraisal System: QAS-99.
Rockville: Research Triangle Institute. 3. ICCAN. Review of the Survey of Noise Attitudes 2014. December 2019.
https://iccan.gov.uk/wp-content/uploads/2019_12_18_ICCAN_Review_of_Survey_of_Noise_Attitudes.pdf
4. Layard, R., Clark, A. E., De Neve, J., Krekel, C., Fancourt, D., Hey, N. and O'Donnell, G. (2020). When to release the lockdown: a wellbeing framework for analysing costs and benefits. CEP Occasional Papers (49). London School of Economics and Political Science, London, UK. http://eprints.lse.ac.uk/104276/1/Layard_when_to_release_the_lockdown_published.pdf
5. Understanding Society. Data and Documentation. [https://www.understandingsociety.ac.uk/documentation]
6. Schreckenberg, D.; Belke, C.; Spilski, J. (2018). The Development of a Multiple-Item Annoyance Scale (MIAS) for Transportation Noise Annoyance. Int. J. Environ. Res. Public Health, 15, 971.
7. ICCAN’s Review of the Survey of Noise Attitudes (SoNA) 2014 (https://iccan.gov.uk/iccan-survey-of-noise-attitudes-2014 review/)
8. Janssen, S.; Guski, R. Chapter 7: Aircraft noise annoyance. In Evidence Review on Aircraft Noise and Health; Stansfeld, S.A., Ed.; DG-JRC and DG-Env, European Union: Brussels, Belgium, 2017; In Press.
9. Schreckenberg, Dirk & Belke, Christin & Faulbaum, Frank & Guski, Rainer & Moehler, Ulrich & Spilski, Jan. (2016). Effects of aircraft noise on annoyance and sleep disturbances before and after expansion of Frankfurt Airport – results of the NORAH study, WP 1 'Annoyance and quality of life'.
10. Labour Market Survey: characteristics report - Office for National Statistics (2020). https://www.ons.gov.uk/employmentandlabourmarket/peopleinwork/employmentandemployeetypes/methodologies/labourmarketsurveycharacteristicsreport
11. Labour Market Survey: comparative estimates report - Office for National Statistics (2020). https://www.ons.gov.uk/employmentandlabourmarket/peopleinwork/employmentandemployeetypes/methodologies/labourmarketsurveycomparativeestimatesreport
12. Institute for Social and Economic Research (2020), Understanding Society: Waves 1-9, 2009-2018 and Harmonised BHPS: Waves 1-18, 1991-2009, User Guide, 12 August 2020, Colchester: University of Essex