Embed Size (px)
Citation preview

Income Standards, Inequality and Income Standards, Inequality and PovertyPoverty
James E. FosterJames E. Foster

IntroductionIntroduction
QuestionsQuestionsWhat is inequality?What is inequality?
What is poverty?What is poverty?
How communicate concepts?How communicate concepts?To policymakers, publicTo policymakers, public
Ex/ Miguel Székely (2006),“Números que Mueven al Mundo: La Medición de la Pobreza en México”
This PaperThis PaperUnifying frameworkUnifying framework

IntroductionIntroduction
Key ConceptKey ConceptIncome StandardIncome StandardSummarizes distribution into a single incomeSummarizes distribution into a single income
Ex/ Ex/ Mean, median, income at 90th percentile, mean Mean, median, income at 90th percentile, mean of top 40%, Sen’s mean, Atkinson’s ede income...of top 40%, Sen’s mean, Atkinson’s ede income...
Related papersRelated papers“Inequality Measurement” in The Elgar Companion to
Development Studies (David Clark, Ed.), Cheltenham: Edward Elgar 2006
“Poverty Measurement” in Poverty, Inequality and Development: Essays in Honor of Erik Thorbecke (Alain de Janvry and Ravi Kanbur, eds.), Amsterdam: Kluwer Academic Publishers, 2005

Income StandardsIncome Standards
NotationNotation
Income distributionIncome distribution x = (x1,…,xn)
xi > 0 income of the ith person
n population size
Dn = R++n set of all n-person income distributions
D = Dn set of all income distributions
s: D R income standard

Income StandardsIncome Standards
PropertiesPropertiesSymmetrySymmetry If x is a permutation of y, then s(x) = s(y).
Replication InvarianceReplication Invariance If x is a replication of y, then s(x) = s(y).
Linear HomogeneityLinear Homogeneity If x = ky for some scalar k > 0, then s(x) = ks(y).
NormalizationNormalization If x is completely equal, then s(x) = x1.
ContinuityContinuity s is continuous on each Dn.
Weak MonotonicityWeak Monotonicity If x > y, then s(x) > s(y).
NoteNoteSatisfied by all examples given above and below.Satisfied by all examples given above and below.

Income StandardsIncome Standards
ExamplesExamplesMeanMean s(x) =s(x) = (x) = (x1+...+xn)/n

Income StandardsIncome Standards
ExamplesExamplesMeanMean s(x) =s(x) = (x) = (x1+...+xn)/n
x1
x2same

Income StandardsIncome Standards
ExamplesExamplesMeanMean s(x) =s(x) = (x) = (x1+...+xn)/n
F = cdf
income
freq

Income StandardsIncome Standards
ExamplesExamplesMedian Median x = (3, 8, 9, 10, 20), s(x)s(x) = 9= 9
F = cdf
income
freq
0.5
median
Income StandardsIncome Standards
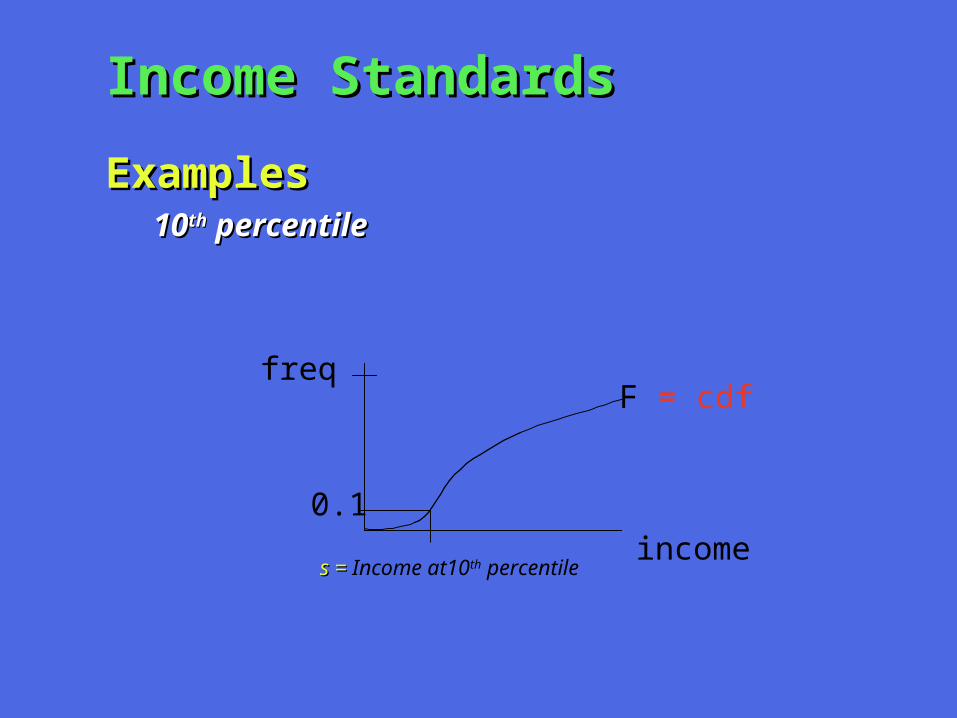
ExamplesExamples1010thth percentile percentile
F = cdf
income
freq
0.1
s =s = Income at10th percentile

Income StandardsIncome Standards
ExamplesExamplesMean of bottom fifth Mean of bottom fifth
x = (3, 5, 6, 6, 8, 9, 15, 17, 23, 25)
s(x) = 4s(x) = 4

Income StandardsIncome Standards
ExamplesExamplesMean of top 40% Mean of top 40%
x = (3, 5, 6, 6, 8, 9, 15, 17, 23, 25)
s(x) = 20s(x) = 20

Income StandardsIncome Standards
ExamplesExamplesSen Mean or Welfare Function Sen Mean or Welfare Function S(x) = E min(a,b)

Income StandardsIncome Standards
ExamplesExamplesSen Mean or Welfare Function Sen Mean or Welfare Function S(x) = E min(a,b)
Ex/ x = (1,2,3,4)

Income StandardsIncome Standards
ExamplesExamplesSen Mean or Welfare Function Sen Mean or Welfare Function S(x) = E min(a,b)
Ex/ x = (1,2,3,4)
s(x) = s(x) = = 30/16= 30/16
1 1 1 1
1 2 2 2
1 2 3 3
1 2 3 4

Income StandardsIncome Standards
ExamplesExamplesSen Mean or Welfare Function Sen Mean or Welfare Function S(x) = E min(a,b)
Ex/ x = (1,2,3,4)
s(x) = s(x) = = 30/16= 30/16 < < (1,2,3,4) = 40/16(1,2,3,4) = 40/16
1 1 1 1
1 2 2 2
1 2 3 3
1 2 3 4

Income StandardsIncome Standards
ExamplesExamplesSen Mean or Welfare Function Sen Mean or Welfare Function S(x) = E min(a,b)
Another view

Income StandardsIncome Standards
ExamplesExamplesSen Mean or Welfare Function Sen Mean or Welfare Function S(x) = E min(a,b)
F = cdf
income
freq
p

Income StandardsIncome Standards
ExamplesExamplesSen Mean or Welfare Function Sen Mean or Welfare Function S(x) = E min(a,b)
F = cdf
income
freq
pA

Income StandardsIncome Standards
ExamplesExamplesSen Mean or Welfare Function Sen Mean or Welfare Function S(x) = E min(a,b)
F = cdf
income
freq
pA
p
A

Income StandardsIncome Standards
ExamplesExamplesSen Mean or Welfare Function Sen Mean or Welfare Function S(x) = E min(a,b)
F = cdf
income
freq
pA
p
A
Generalized LorenzGeneralized Lorenz

Income StandardsIncome Standards
ExamplesExamplesSen Mean or Welfare Function Sen Mean or Welfare Function S(x) = E min(a,b)
Generalize Lorenz CurveGeneralize Lorenz Curve
cumulative pop share
cum
ula
tive
inco
me

Income StandardsIncome Standards
ExamplesExamplesSen Mean or Welfare Function Sen Mean or Welfare Function S(x) = E min(a,b)
Generalize Lorenz CurveGeneralize Lorenz Curve
cumulative pop share
cum
ula
tive
inco
me
s =s = S = 2 x Areabelow curve

Income StandardsIncome Standards
ExamplesExamplesGeometric MeanGeometric Mean s(x) =s(x) = 0(x) = (x1x2...xn)1/n

Income StandardsIncome Standards
ExamplesExamplesGeometric MeanGeometric Mean s(x) =s(x) = 0(x) = (x1x2...xn)1/n
x1
x2same same 00

Income StandardsIncome Standards
ExamplesExamplesGeometric MeanGeometric Mean s(x) =s(x) = 0(x) = (x1x2...xn)1/n
x1
x2same 0
x.1(x)0(x)

Income StandardsIncome Standards
ExamplesExamplesGeometric MeanGeometric Mean s(x) =s(x) = 0(x) = (x1x2...xn)1/n
ThusThus s(x) = s(x) = 0
- emphasizes lower incomes
- is lower than the usual mean Unless distribution is completely equalUnless distribution is completely equal
x1
x2same 0
x.1(x)0(x)
Income StandardsIncome Standards
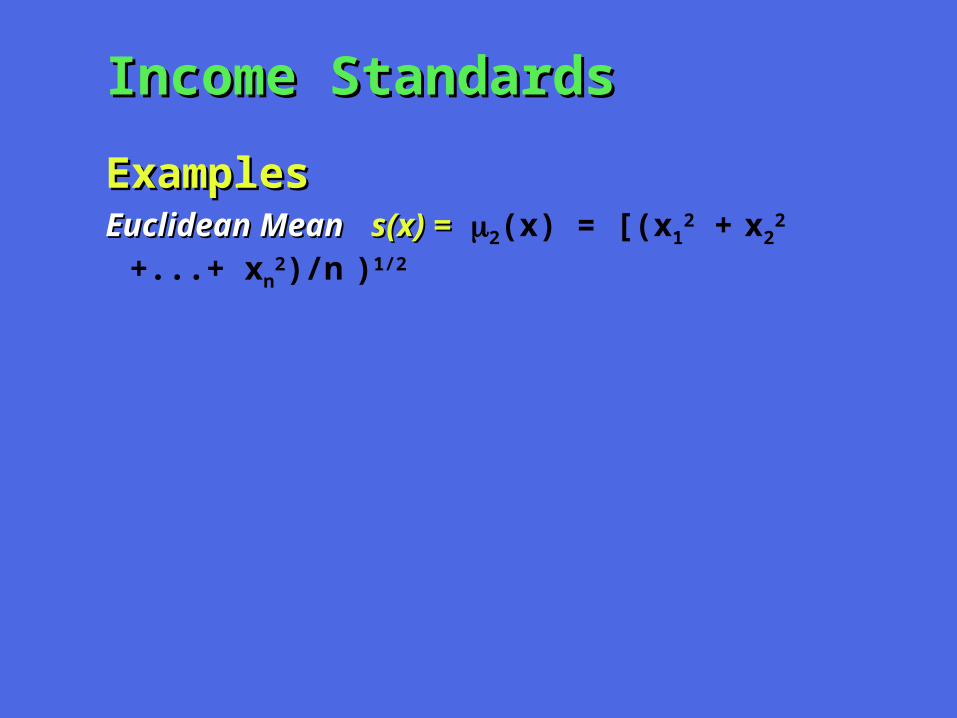
ExamplesExamplesEuclidean MeanEuclidean Mean s(x) =s(x) = 2(x) = [(x1
2 + x22 +...+ xn
2)/n )1/2
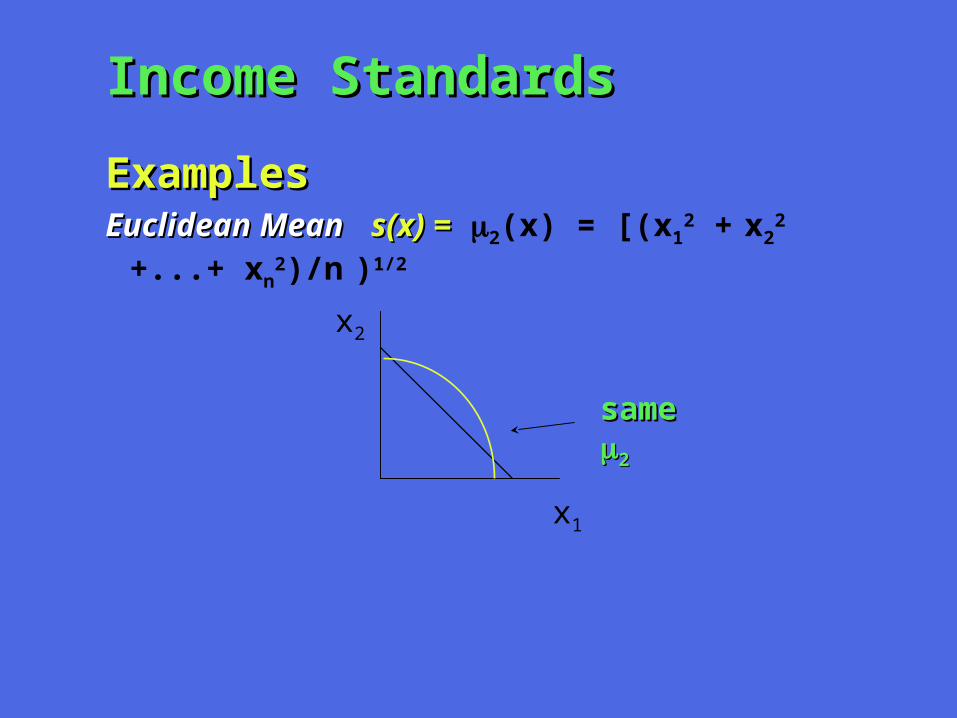
Income StandardsIncome Standards
ExamplesExamplesEuclidean MeanEuclidean Mean s(x) =s(x) = 2(x) = [(x1
2 + x22 +...+ xn
2)/n )1/2
x1
x2
same same 22

Income StandardsIncome Standards
ExamplesExamplesEuclidean MeanEuclidean Mean s(x) =s(x) = 2(x) = [(x1
2 + x22 +...+ xn
2)/n )1/2
x1
x2
same 2
1(x) 2(x)

Income StandardsIncome Standards
ExamplesExamplesEuclidean MeanEuclidean Mean s(x) =s(x) = 2(x) = [(x1
2 + x22 +...+ xn
2)/n )1/2
ThusThus s(x) = s(x) = 2 - emphasizes higher incomes- is higher than the usual mean Unless distribution is completely equalUnless distribution is completely equal
x1
x2
same 2
1(x) 2(x)

Income StandardsIncome Standards
Examples Examples General MeansGeneral Means
[(x1 + … + xn
)/n] 1/ for all 0
(x) = (x1
…xn)1/n for = 0
Hardy Littlewood Polya 1952; Kolm 1969; Atkinson 1970Hardy Littlewood Polya 1952; Kolm 1969; Atkinson 1970
= 1 = 1 arithmetic meanarithmetic mean
= 0 = 0 geometric meangeometric mean = 2= 2 Euclidean meanEuclidean mean = -1= -1 harmonic meanharmonic mean
For For < 1: Distribution sensitive < 1: Distribution sensitiveLowerLower implies greatergreater emphasis on lowerlower incomes

InequalityInequality
QuestionQuestion
What is inequality?What is inequality?
Universal framework for inequalityUniversal framework for inequalityTwo dimensions for evaluationTwo dimensions for evaluation
Reduces to discussion of twin “income standards”Reduces to discussion of twin “income standards”
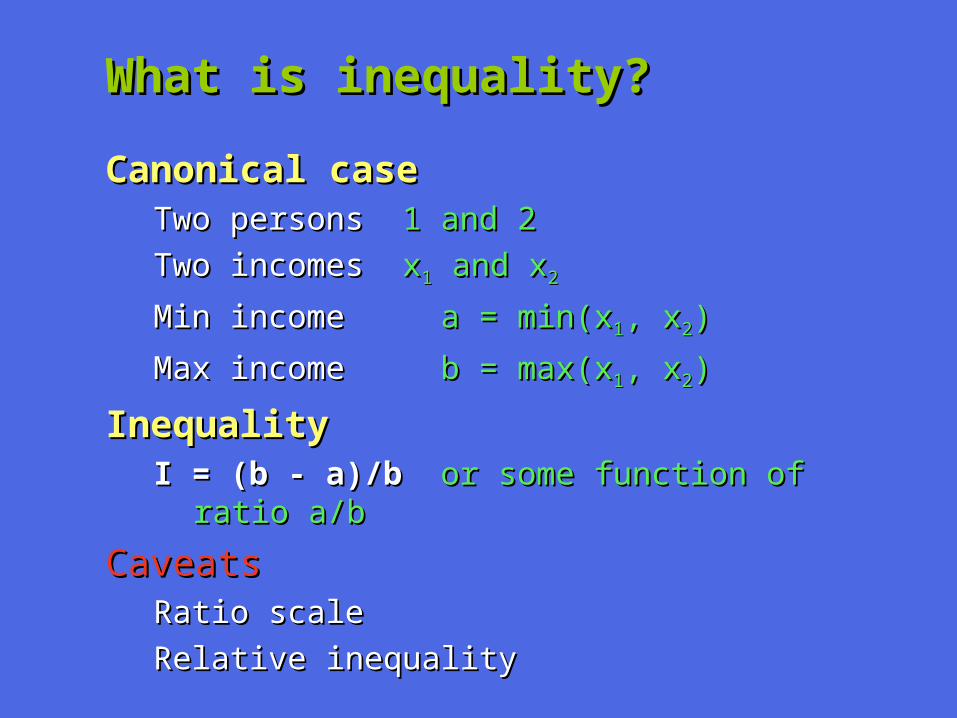
What is inequality?What is inequality?
Canonical caseCanonical caseTwo persons Two persons 1 and 21 and 2
Two incomes Two incomes xx11 and x and x22
Min income Min income a = min(xa = min(x11, x, x22))
Max income Max income b = max(xb = max(x11, x, x22))
InequalityInequalityI = (b - a)/bI = (b - a)/b or some function of ratio a/bor some function of ratio a/b
CaveatsCaveatsRatio scale Ratio scale
Relative inequality Relative inequality

Inequality between GroupsInequality between Groups
Group Based InequalityGroup Based InequalityTwo groups Two groups 1 and 21 and 2Two income distributions Two income distributions xx11 and x and x22
Income standard Income standard s(x) “rs(x) “representative income”epresentative income”Lower income standard Lower income standard a = min(s(xa = min(s(x11), s(x), s(x22))))Upper income standard Upper income standard b = max(s(xb = max(s(x11), s(x), s(x22))))
InequalityInequalityI = (b - a)/bI = (b - a)/b or some function of ratio a/bor some function of ratio a/b
CaveatsCaveatsWhat about group size?What about group size?
Not relevant if group is unit of analysisNot relevant if group is unit of analysisRelevant if individual is unit of analysisRelevant if individual is unit of analysis

Inequality between GroupsInequality between Groups
Group Based Inequality - ExamplesGroup Based Inequality - ExamplesSpatial disparities Spatial disparities geographically determinedgeographically determinedGender inequality Gender inequality male/femalemale/femaleGrowthGrowth two points in timetwo points in time
Example: Racial Health Disparities in USExample: Racial Health Disparities in USTwo groups Two groups Black and WhiteBlack and WhiteTwo distributions Two distributions xx11 and x and x2 2 each with 1 = alive, 0 = noteach with 1 = alive, 0 = notIncome standard Income standard s(x) = s(x) = “1 - mortality rate”“1 - mortality rate”Lower income standard Lower income standard a = min(s(xa = min(s(x11), s(x), s(x22))))Upper income standard Upper income standard b = max(s(xb = max(s(x11), s(x), s(x22))))
InequalityInequalityI = (b - a)/bI = (b - a)/b or some function of ratio a/b, or some function of ratio a/b, Next graph uses ratios of mortality rates in log terms

Inequality between Races in USInequality between Races in US
Black/White Age Adjusted Mortality
0.00
0.50
1.00
1.50
2.00
2.50
3.00
3.50
4.00
1 6 11 16 21 26 31 36 41 46 51 56 61 66 71 76 81 86 91 96
Year
Source:CDC and Levine, Foster, et al Public Health Reports (2001)
Log Mortality
Inequality between GroupsInequality between Groups
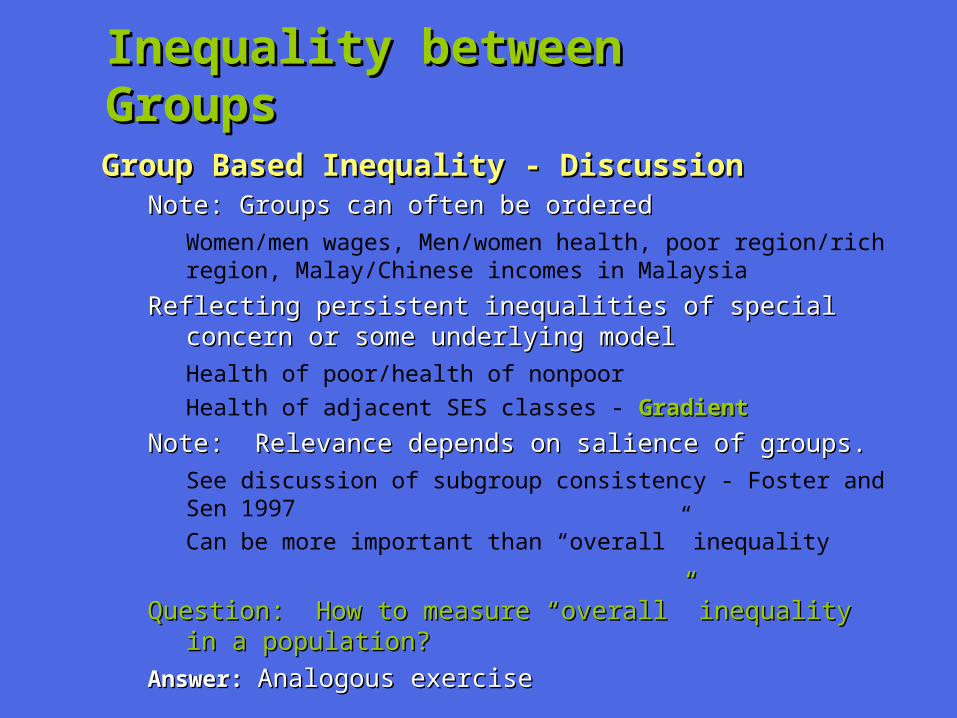
Group Based Inequality - DiscussionGroup Based Inequality - DiscussionNote: Groups can often be orderedNote: Groups can often be ordered
Women/men wages, Men/women health, poor region/rich region, Malay/Chinese incomes in Malaysia
Reflecting persistent inequalities of special concern or some Reflecting persistent inequalities of special concern or some underlying model underlying model
Health of poor/health of nonpoor
Health of adjacent SES classes - GradientGradient
Note: Relevance depends on salience of groups.Note: Relevance depends on salience of groups.
See discussion of subgroup consistency - Foster and Sen 1997
Can be more important than “overall” inequality
Question: How to measure “overall” inequality in a population?Question: How to measure “overall” inequality in a population?
Answer: Answer: Analogous exerciseAnalogous exercise

Inequality in a PopulationInequality in a Population
Population Inequality - DiscussionPopulation Inequality - DiscussionA wide array of measures (yawn)A wide array of measures (yawn)
Gini Coefficient Gini Coefficient
Coefficient of VariationCoefficient of Variation
Mean Log DeviationMean Log Deviation
Variance of logarithmsVariance of logarithms
Generalized Entropy FamilyGeneralized Entropy Family
90/10 ratio90/10 ratio
Decile RatioDecile Ratio
Atkinson FamilyAtkinson Family

Inequality in a PopulationInequality in a Population
Population Inequality - DiscussionPopulation Inequality - Discussion
Criteria for selectionCriteria for selection
Axiomatic BasisAxiomatic Basis - Lorenz consistent, subgroup consistent, decomposable, decomposable by ordered subgroupsUnderstandableUnderstandable. - Welfare basis, intuitive graphData AvailabilityData Availability - Historical studiesEasy to UseEasy to Use. - Is it in your software package?
What do the measures have in common?What do the measures have in common?

Inequality as Twin StandardsInequality as Twin Standards
Framework for Population InequalityFramework for Population InequalityOne income distribution One income distribution xxTwo income standards:Two income standards:
Lower income standard Lower income standard a = sa = sLL(x)(x)
Upper income standard Upper income standard b = sb = sUU(x)(x)
Note: Note: ssLL(x) (x) << s sUU(x) (x) for all xfor all x
InequalityInequalityI = (b - a)/bI = (b - a)/b or some function of ratio a/bor some function of ratio a/b
ObservationObservationFramework encompasses all common inequality Framework encompasses all common inequality
measuresmeasures Theil, variance of logs Theil, variance of logs in limitin limit

Inequality as Twin StandardsInequality as Twin Standards
Population Inequality - DiscussionPopulation Inequality - DiscussionIncome StandardsIncome Standards ssLL ssUU
Gini CoefficientGini Coefficient Sen mean
Coefficient of VariationCoefficient of Variation mean euclidean mean
Mean Log DeviationMean Log Deviation geometric mean mean
Generalized Entropy FamilyGeneralized Entropy Family general mean mean
or mean general mean
90/10 ratio90/10 ratio income at 10th pc income at 90th pc
Decile RatioDecile Ratio mean mean of upper 10%
Atkinson Family Atkinson Family general mean mean

Inequality as Twin StandardsInequality as Twin Standards
Population Inequality -Population Inequality - SummarySummaryInequality measures create Inequality measures create twin dimensionstwin dimensions of income of income
standardsstandardsCharacteristics of inequality measure depend on Characteristics of inequality measure depend on
characteristics of the characteristics of the standardsstandardsCan reverse process to Can reverse process to assembleassemble new measures of new measures of
inequality, well being, povertyinequality, well being, poverty (where poverty line (where poverty line plays role of one of the income standards).plays role of one of the income standards).

Poverty in a PopulationPoverty in a Population
Poverty in a Population - DiscussionPoverty in a Population - DiscussionA wide array of measures (yawn)A wide array of measures (yawn)
Sen Sen
Thon/Sen/ShorrocksThon/Sen/Shorrocks
Clark, Hemming, Ulph/Chakravarty (CHU)Clark, Hemming, Ulph/Chakravarty (CHU)
Headcount RatioHeadcount Ratio
Per Capita Poverty GapPer Capita Poverty Gap
Watts IndexWatts Index
FGTFGT
What do they have in common? What do they have in common?
Poverty as Twin Income StandardsPoverty as Twin Income Standards
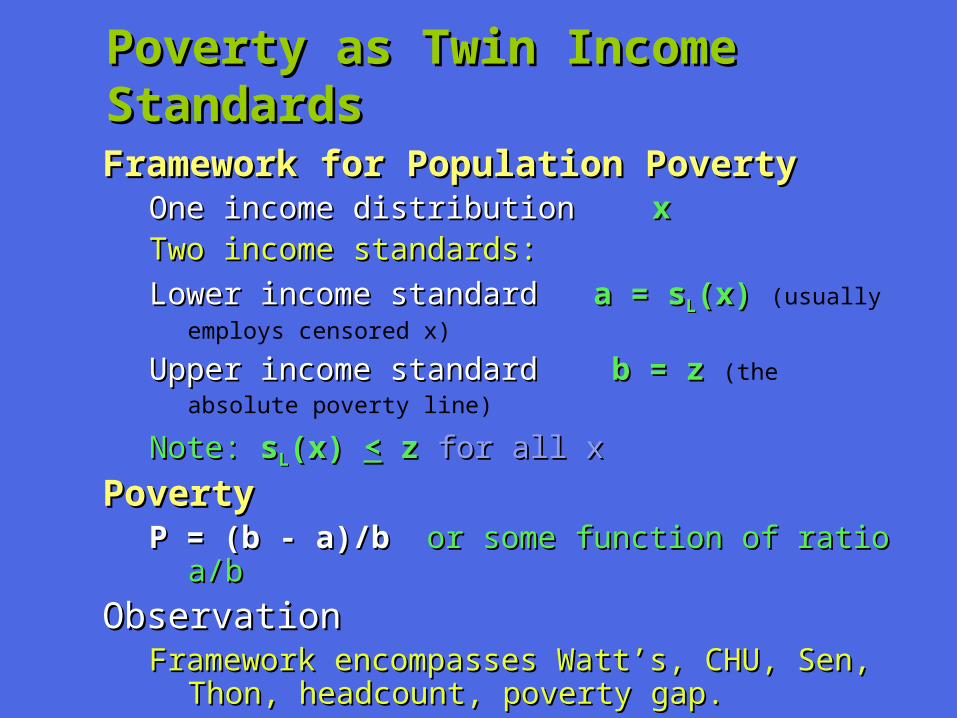
Framework for Population PovertyFramework for Population PovertyOne income distribution One income distribution xxTwo income standards:Two income standards:
Lower income standard Lower income standard a = sa = sLL(x) (x) (usually employs censored x)
Upper income standard Upper income standard b = z b = z (the absolute poverty line)
Note: Note: ssLL(x) (x) << z z for all xfor all x
PovertyPovertyP = (b - a)/bP = (b - a)/b or some function of ratio a/bor some function of ratio a/b
ObservationObservationFramework encompasses Watt’s, CHU, Sen, Thon, Framework encompasses Watt’s, CHU, Sen, Thon,
headcount, poverty gap. headcount, poverty gap.

Poverty as Twin Gap StandardsPoverty as Twin Gap Standards
Framework for Population PovertyFramework for Population PovertyOne gap distribution One gap distribution g g (positive entries are z - xi )
Two gap standards:Two gap standards:
Lower gap standard Lower gap standard a = sa = sLL(g)(g)
Upper gap standard Upper gap standard b = z b = z (the absolute poverty line)
Note: Note: ssLL(g) (g) << z z for all xfor all x
PovertyPovertyP = a/bP = a/b or some function of ratio a/bor some function of ratio a/b
ObservationObservationFramework encompasses FGT, Sen, Thon, headcount, Framework encompasses FGT, Sen, Thon, headcount,
poverty gap. poverty gap.

Application of the MethodologiesApplication of the Methodologies
Growth and InequalityGrowth and InequalityTo see how inequality changes over timeTo see how inequality changes over time
Calculate growth rate for sCalculate growth rate for sLL
Calculate growth rate for sCalculate growth rate for sUU
Note: One of these is usually the meanNote: One of these is usually the meanCompare!Compare!
Poverty and TimePoverty and TimeCalculate growth rate for respective standard.Calculate growth rate for respective standard.
RobustnessRobustnessCalculate growth rates for several standards at onceCalculate growth rates for several standards at once

General Means are UniqueGeneral Means are Unique
Q/ Why general means?Q/ Why general means?A/ Satisfy Properties for an Income StandardA/ Satisfy Properties for an Income Standard
Symmetry, replication invariance, linear homogeneity, normalization, continuity andand
Subgroup consistency Subgroup consistency (see Foster and Sen, 1997)
Suppose that s(x') > s(x) and s(y') = s(y), where x' has the same population size as x, and y' has the same population size as y.
Then s(x', y') > s(x, y).
IdeaIdea Otherwise decentralized policy is impossible.
Th An income standard satisfies all the above properties if and only if it is a general meangeneral mean
Foster and Székely (2006)

Application: Growth and Inequality over Time Application: Growth and Inequality over Time Growth in for Mexico vs. Costa Rica
-100
-80
-60
-40
-20
0
20
40
60
80
100
120
140
160
180
200
% C
hang
e in
inco
me
stan
dar
d
Costa Rica
1985-1995
Mexico1984-1996
Foster and Szekely (2006)

General Means and AtkinsonGeneral Means and Atkinson
Application: Atkinson’s FamilyApplication: Atkinson’s Family
I = (I = ( - - ) / ) / < 1 < 1
Atkinson 1970Atkinson 1970
Welfare interpretation of general mean and hence Welfare interpretation of general mean and hence inequality measureinequality measurePercentage welfare loss due to inequality

General Means and AtkinsonGeneral Means and Atkinson
InterpretationInterpretation
I = (I = ( - - ) / ) / < 1 < 1
x1
x2
x.

General MeansGeneral Means
Application: Assembling Decomposable Application: Assembling Decomposable Inequality MeasuresInequality Measures
Define Define Icq(x) =
1
1
1
1
1
c(c - q)[(
(x)
(x)) - 1], c 0, q c
1
q n
x
(x)ln(
x
(x)), c 0, q c
(x) c 0, q c
2V (x), c 0, q = c
c
q
c
i
q
q
i
qi
n
q
L
q g xln(
( ))
Foster Shneyerov 1999Foster Shneyerov 1999
IIcqcq is a function of a ratio of two general means, or the limit of such functions is a function of a ratio of two general means, or the limit of such functions Atkinson, Theil, coeff of variation, generalized entropy, var of logs (not Gini)

A Class of Distribution Sensitive HDI’sA Class of Distribution Sensitive HDI’s
H(D) = [(x), (y), (z)] for = 1- > 0
= 0 = 0 HH00 = = [(x), (y), (z)] usual HDI usual HDI
= 1 = 1 HH11 = = 0[0(x), 0(y), 0(z)] based on geometric meanbased on geometric mean
sensitive to inequalitysensitive to inequality
= 2= 2 HH22 = = [(x), (y), (z)] based on harmonic mean based on harmonic mean
even more sensitiveeven more sensitiveFoster, Lopez-Calva, and Szekely (2005, 2006)

SummarySummary
Income standards provide Income standards provide unifying frameworkunifying framework for measuring inequality, poverty and well for measuring inequality, poverty and well beingbeing
Income standards should receive more direct Income standards should receive more direct empiricalempirical attention attention
Plan to explore more thoroughly the Plan to explore more thoroughly the theoretical theoretical linklink between the properties of income standards between the properties of income standards and associated measuresand associated measures
Thank you!Thank you!