Embed Size (px)
Citation preview


Inbound Innovation
Best Practices for Inbound Quality Management

Poll Question
Data collection 1
Collaboration with partners 2
Data analytics/benchmarking 3
Other 4
Nothing ~ we have it figured out 5
3
What is Missing
to Significantly
Reduce
Unsaleables?

4
• Mission driven, values-based, family company since 1916
• Led by the third and fourth generation of the Wegman family
• $8 billion in sales
• 92 store locations with 47,000 employees across six states
• 100 Best Company to Work For 20 straight years

Who Is Inmar?
• 4,600 employees across 30+ North American locations
• Clients served in 30 countries
• 36+ years of experience
• Process more than 650 terabytes of data, annually
• Manage over $73 billion a year in commerce value
• Focus areas: Supply Chain, Health Care, Promotions
5
A trusted intermediary between retailers, manufacturers, health systems and consumers

• Family owned, 25+ years, based in North Carolina
• 2,000+ associates across 50+ facilities nationwide
• Entrusted daily to make a memorable and measurable difference
• Focus areas: supply chain, retail, logistics
• Efficient, seamless transitions
• Multiplying customer value through execution, expertise and continuous improvement
6
Who is FHI?
7
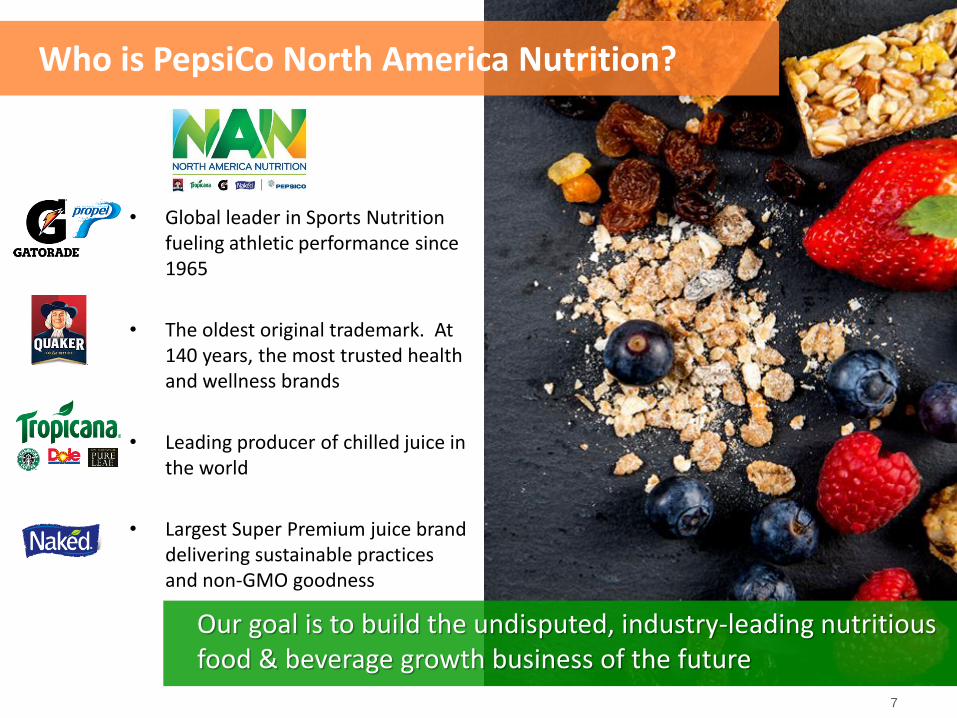
Who is PepsiCo North America Nutrition?
Our goal is to build the undisputed, industry-leading nutritious food & beverage growth business of the future
• Global leader in Sports Nutrition fueling athletic performance since 1965
• The oldest original trademark. At 140 years, the most trusted health and wellness brands
• Leading producer of chilled juice in the world
• Largest Super Premium juice brand delivering sustainable practices and non-GMO goodness

How do we drive costs out of the
supply chain?
8
How does Wegmans
perform in the area of
Unsaleables?
Right case, right time
AND in the right
condition critical with
lower days of supply Our Journey…

We Do it Together
We COLLABORATE
with those who have
a stake in
unsaleables
9
GROUP
COLLABORATION
We COLLECT DATA
from the right parts
and in the right times
within the supply
chain
DATA
COLLECTION
We IDENTIFY the
issues that need to
be solved
ROOT CAUSE
ANALYSIS

Background
10
Upward trend in returns
related to damaged &
expired products
Damage accounted for
61% of unsaleables and
was 59% higher than
benchmark

Inmar confidential – do not copy, distribute or use without Inmar written permission, 2017
Focus on Damage Reduction
Opportunities
• The failure rate on pallets evaluated at the Wegmans DCs was significantly
higher than the Inmar-Tracked National Benchmark.
• The rate of shipper damage for product on poor pallets was 40% higher
than for product on good pallets.
• Case damage rates for some suppliers and categories were as much as 7x
benchmark, and often exhibited damage related to unit load build and
handling.
DC Focus:
Shipper damage
rates 3x and
consumer units
6x benchmark
11

Retail Shelf: Consumer unit damage rates 59% higher than Benchmark, lower
inventory levels magnify issue
Opportunities exist to reduce overall damage significantly through training and
collaboration
Focus on Upstream approach to reduce flow of damage into network
Focus on Damage Reduction
Opportunities
12

PepsiCo Manufacturing
1 2 3
PepsiCo DC
Wegmans DC Retail Store
7 6
Warehouse Delivery Product Flow
4 5
• PepsiCo DC & Wegmans DC key data collection points
• Shared responsibility in data collection (manufacturer & customer)
• Retail damage data lagging indicator of upstream issues
Multiple product
“touch” points
throughout
Supply Chain
13

Inbound Inspection
Wegmans employs the
use of a professional
dock handling service.
Wegmans has engaged
FHI to:
• Perform visual inspection
• Remove obvious damage
• Align with FSMA
regulations
14

Data Collection
Quantity UPC Vendor PO#
Pallet Type Pallet Quality Reason Codes for
Damage
15

Damage Codes
Crushed Horizontal Crushed Vertical Stretchwrap
Torn (bag or case) Overhang Dented (cans/cases)
Leakage Infestation Damaged during
unloading
16

Each pallet raised &
thoroughly inspected 40% The rate of shipper
damage for product on
poor pallets was 40%
higher than for product
on good pallets.
Automated environment
where systems rely on quality
platforms to function
efficiently & without
interruption
17

Dashboard DAMAGE/VENDORS/ITEMS
Top 10 Vendors - Last 6 Weeks
Top Level
761
933
578
373
263 276
0
200
400
600
800
1000Total Damages - Last 6 Weeks
1488 1542
1258
1945
2681
852
0
500
1000
1500
2000
2500
3000
October November December January February March
Total Damages - Last 6 Months Vendor 2/11/17 2/18/17 2/25/17 3/4/17 3/11/17 3/18/17 Total
Vendor ABC 407 238 32 64 0 32 773
Vendor DEF 41 70 217 75 33 47 483
Vendor GHI 41 136 60 55 0 56 348
Vendor JKL 132 0 21 11 50 42 256
Vendor MNO 4 203 4 12 7 3 233
Vendor PQR 0 85 49 0 0 0 134
Vendor STU 0 64 38 2 0 0 104
Vendor VWX 3 4 5 5 25 12 54
Vendor YZA 2 3 9 11 2 11 38
Vendor ZZZ 0 2 2 22 11 1 38
UPC Scan Description Vendor Quantity
12345678910 GROCERY ITEM, 10 OZ Vendor ABC 186
24681024681 GROCERY ITEM, 20 OZ Vendor GHI 120
03333333333 GROCERY ITEM, 2LB Vendor DEF 110
00044455522 GROCERY ITEM, LG Vendor ABC 108
00007777777 GROCERY ITEM, 8.2 OZ Vendor DEF 104
11109876543 GROCERY ITEM, MED Vendor MNO 78
24242424242 GROCERY ITEM, 10 " Vendor STU 67
01234543210 GROCERY ITEM, 100 CT Vendor ABC 58
98765432109 GROCERY ITEM, 16 OZ Vendor GHI 50
12131415161 GROCERY ITEM, 5 LB Vendor ABC 47
Top 10 Items - Last 6 Weeks
18

Scorecarding DAMAGE/VENDORS/REASON
Top 10 Vendor Items – Last 6 Weeks
Vendor Level – Quaker VID 31994
41
136
60 55
0
56
0
20
40
60
80
100
120
140
160
02/11/17 02/18/17 02/25/17 03/04/17 03/11/17 03/18/17
Total Damages - Last 6 Weeks
Scanned Code Description Total
03000006083 NQKR LIFE CINN CEREAL 42
03000032122 NQUAK POPPED CHEDDAR 34
03000056084 NQKR LIFE VANILLA CEREAL 27
03000006211 NQKR CAP'N CRUNCH PEANUTBU 19
03000056084 NQKR LIFE VANILLA CEREAL 16
03000032160 NQKR INST OATMEAL FRUIT MX 15
01530044032 NPASTA RONI SHELLS/CHEDDR 11
03000044061 NQUAKER OAT SQUARES CL PK 11
03000006119 NQKR LIFE REG CEREAL 10
03000016954 NQUAKER POPPED RANCH 7
0
20
40
60
80
100
120
140
CrushedHorizontal
CrushedVertical
Dented(cans/cases)
Torn(bag or case)
Leakage
Dmgs by Reason Code - Last 6 Weeks
0.00%
0.50%
1.00%
1.50%
2.00%
2.50%
3.00%
02/11/17 02/18/17 02/25/17 03/04/17 03/11/17 03/18/17
Damage % vs Industry Trend - Last 6 Weeks
Dmg % Industry Standard
19

PepsiCo Manufacturing
2
PepsiCo DC
3 4
Wegmans DC
5
6
Retail Store
7
Data Collection Overview
1
• PepsiCo
o Initiate data collection of inbound (PepsiCo) DC damage
o Implement consistent platform audit & compliance data
collection at DCs
o Alignment to review and respond to new Wegmans
scorecarding
• Wegmans
o Partner with FHI to collect inbound (Wegmans) DC
damage
o Share inbound damage scorecards with vendor partners
Commitment to Correlate Data throughout Supply Chain
PepsiCo DC -> Wegmans DC (inbound) -> Reclaim
20

21
Poll Results
21

Inmar confidential – do not copy, distribute or use without Inmar written permission, 2017 22

CALL TO ACTION
Search out and raise awareness for the wealth of
actionable data available to address unsaleables
Partner with suppliers and third parties to identify
opportunities and address together
Measure results continuously
Commit and sustain – it’s an ongoing process,
not an event
1
2
3
4
23

24
Questions


![INBOUND RECRUITING Inbound Recruiting...30 Observat ecurso INBOUND RECRUITING EL ORIGEN DE LA METODOLOGÍA INBOUND RECRUITING ] C omo empresa referente en Inbound Marketing y único](https://img.dokumen.tips/doc/110x75/5ea56d76204e4a35f27950c9/inbound-recruiting-inbound-recruiting-30-observat-ecurso-inbound-recruiting.jpg)


![INTERVIEWING FOR THE INBOUND SALES ROLE [INBOUND 2014]](https://img.dokumen.tips/doc/110x75/55a445781a28abe92b8b46a5/interviewing-for-the-inbound-sales-role-inbound-2014.jpg)