Embed Size (px)
Citation preview

In vivo promoter analysis on refeedingresponse of hepatic sterol regulatoryelement-binding protein-1c expression
著者 Takeuchi Yoshinori, Yahagi Naoya, NakagawaYoshimi, Matsuzaka Takashi, Shimizu Ritsuko,Sekiya Motohiro, Iizuka Yoko, Ohashi Ken,Gotoda Takanari, Yamamoto Masayuki, NagaiRyozo, Kadowaki Takashi, Yamada Nobuhiro,Osuga Jun-ichi, Shimano Hitoshi
journal orpublication title
Biochemical and Biophysical ResearchCommunications
volume 363number 2page range 329-335year 2007-11権利 (C) 2007 Elsevier Inc.URL http://hdl.handle.net/2241/98007
doi: 10.1016/j.bbrc.2007.08.165
- 1 -
in vivo promoter analysis on refeeding response of hepatic sterol
regulatory element-binding protein-1c expression.
Yoshinori Takeuchi,1,2 Naoya Yahagi,1,3 Yoshimi Nakagawa,2,3 Takashi
Matsuzaka,2,3 Ritsuko Shimizu,3 Motohiro Sekiya,1 Yoko Iizuka,1 Ken Ohashi,1
Takanari Gotoda,1 Masayuki Yamamoto,3 Ryozo Nagai,1 Takashi Kadowaki,1
Nobuhiro Yamada,2 Jun-ichi Osuga,1 and Hitoshi Shimano.2,3
Department of Internal Medicine, Graduate School of Medicine, University of
Tokyo, Tokyo 113-8655,1 and Advanced Biomedical Applications, Graduate
School of Comprehensive Human Sciences2 and Center for Tsukuba Advance
Research Alliance3, University of Tsukuba, Ibaraki 305-8575,2 Japan
Correspondence should be addressed to Hitoshi Shimano, MD., PhD.
Advanced Biomedical Applications, Graduate School of Comprehensive Human Sciences,
University of Tsukuba, 1-1-1 Tennodai, Tsukuba, Ibaraki 305-8575, Japan
Fax: 81-29-853-3174
E-mail: [email protected]
* Manuscript
- 2 -
Abstract
Sterol regulatory element-binding protein (SREBP)-1c is the master regulator
of lipogenic gene expression in liver. The mRNA abundance of SREBP-1c is
markedly induced when animals are refed after starvation, although the regulatory
mechanism is so far unknown. To investigate the mechanism of refeeding response of
SREBP-1c gene expression in vivo, we generated a transgenic mouse model that carries
2.2kb promoter region fused to the luciferase reporter gene. These transgenic mice
exhibited refeeding responses of the reporter in liver and adipose tissues with extents
essentially identical to those of endogenous SREBP-1c mRNA. The same results were
obtained from experiments using adenovirus-mediated SREBP-1c-promoter-luciferase
fusion gene transduction to liver. These data demonstrate that the regulation of
SREBP-1c gene expression is at the transcription level, and that the 2.2kb 5’-flanking
region is sufficient for this regulation. Moreover, when these transgenic or
adenovirus-infected mice were placed on insulin-depleted state by streptozotocin
treatment, the reporter expression was upregulated as strongly as in control mice,
demonstrating that this regulation is not dominated by serum insulin level. These mice

- 3 -
are the first models to provide the mechanistic insight into the transcriptional regulation
of SREBP-1c gene in vivo.
Key words
lipogenesis, promoter analysis, insulin, transcription, liver, adipose tissue, transgenic
mouse, adenovirus

- 4 -
Introduction
The conversion of carbohydrate into fat is known as de novo lipogenesis,
which is catalyzed by series of lipogenic enzymes such as acetyl-CoA carboxylase and
fatty acid synthase [1]. The activities of these enzymes are nutritionally regulated, i.e.
downregulated when animals are starved and upregulated when they are refed. This
regulation of these lipogenic enzymes has two remarkable features. First, their overall
enzymatic activities largely depend on the amount of expressed protein that is primarily
controlled at the transcriptional level. Second, their rates of transcription are
coordinately regulated [2]. Therefore, it has been postulated that these genes share a
regulatory sequence in their promoters that interacts with common trans-acting factors.
In the liver, the most likely factor conducting this coordinate transcriptional regulation
has been revealed to be sterol regulatory element-binding protein (SREBP) -1 [3, 4].
SREBPs are transcription factors that belong to the
basic-helix-loop-helix-leucine zipper (bHLH-Zip) family and are considered to be
profoundly involved in the transcriptional regulation of cholesterogenic and lipogenic

- 5 -
enzymes [5, 6]. The role of SREBP-1 in the regulation of lipogenesis in the liver has
been well established by several lines of evidence, especially from transgenic and
knockout mouse models [4, 7-9]. In these models, hepatic SREBP-1 protein levels
dominate the mRNA expression levels for a battery of lipogenic genes. Thus,
SREBP-1 is now well established as the key transcription factor for the regulation of
lipogenic gene expression and by extension triglyceride storage in liver [10, 11].
It has been well known that the mRNA and nuclear protein abundance of
SREBP-1c, the main isoform of SREBP-1 in lipogenic organs such as liver and adipose
tissue, is physiologically regulated by nutrient availability, i.e. it is downregulated when
animals are starved and upregulated when they are refed, thereby adjusting lipogenic
gene expression levels to the nutritional conditions [12]. Because the quantity of
mRNA and nuclear protein of SREBP-1c goes up and down in parallel depending on
dietary condition, the control at the mRNA expression level is considered primary at
least in regard to refeeding response. However, the mechanism of this regulation is yet
to be clarified, including the point whether this regulation is at the transcription level or
not.

- 6 -
It has been reported that elevated concentrations of glucose and insulin mimic
the refeeding state in vivo and upregulate SREBP-1 expression in cultured hepatocytes
[13, 14]. However, these responses induced by high dosage of glucose and insulin are
within two to three-fold changes at best, and far weaker than the refeeding response
observed in the in vivo liver. Therefore, to elucidate the precise mechanism of
SREBP-1 regulation by nutrient availability, it is inevitable for one to study the in vivo
mouse model.
These situations prompted us to generate transgenic mice that carry
SREBP-1c-promoter-driven reporter gene cassette to investigate the nutritional
regulation of the promoter activities in vivo. Moreover, based on the results from these
experiments, we further assessed the promoter activities using adenovirus-mediated
gene delivery to the liver, which complemented the data from transgenic mice by
excluding the potential possibility of positional effects in transgenic mouse model.
- 7 -
Materials and Methods
Animals and treatment — Seven- to nine-week-old ICR and C57BL/6J male mice
were purchased from CLEA (Tokyo, Japan). All animals were housed in a
temperature-controlled environment with a 12h-light / dark cycle and free access to
standard laboratory diet (MF from Oriental Yeast, Tokyo, Japan, composed of 60%
carbohydrate, 13% fat and 27% protein on a caloric basis) and water. The protocol of
dietary manipulation was as follows: for the fasting group, animals were starved 24h,
and for the refeeding group, they were refed at 16h after a 24h starvation. To make
insulin-depleted states, streptozotocin (100 mg/kg body weight, Sigma) was
administered by two intraperitoneal injections with 1-day interval following an
overnight fasting period as described previously [15]. Streptozotocin was dissolved in
50 mM sodium citrate buffer (pH 4.5) immediately before administration. Mice were
considered diabetic when tail vain blood glucose levels exceeded 350 mg/dl, and
euthanized within 8 days from the first injection. All the experiments were repeated
more than twice and reproducibility was confirmed.

- 8 -
Production of Transgenic Mice — pBP1c2600Luc plasmid was constructed into pGL2
basic vector (Promega) as previously described [16]. The SmaI-SalI fragment of this
plasmid spanning -2.2k to +40 bp of the mouse SREBP-1c promoter fused to luciferase
gene was microinjected into BDF1 eggs. Among the 55 offsprings, eight mice had the
integrated transgene as determined by Southern blot hybridization of the tail DNA after
digestion with BamHI or NheI. The cDNA probe for luciferase gene was the 0.54kb
XbaI-EcoRI fragment of pGL2-basic plasmid and the cDNA probe for mouse
SREBP-1c promoter was the 1.1kb NheI fragment of SREBP-1c promoter cut out of the
pBP1c2600Luc plasmid. Among eight founder mice, two were crossbred to C57BL/6J
background more than 5 times, and thus two lines of –2.2kb-SREBP-1c-promoter-Luc
transgenic mice were established. The other founder mice were not bred and could not
be analyzed.
Generation of recombinant adenovirus — The SmaI-BglII fragment of
pBP1c2600bp-Luc containing -2.2k to +40 bp of the mouse SREBP-1c promoter was
subcloned into the pGL3 basic vector (Promega) at SmaI and BglII sites. Then the
SREBP-1c promoter-luciferase gene cassette was cut out of the vector by NotI and SalI,

- 9 -
and after both ends were blunted with klenow DNA polymerase, it was subcloned into
the pENTR4 vector (Invitrogen) at the EcoRI site (blunted). Then,
-2.2kb-SREBP-1c-promoter-Luc adenoviral plasmid was generated by homologous
recombination between the subcloned pENTR4 plasmid and pAd promoterless vector
using Clonase recombinase (Gateway system, Invitrogen). Similarly,
SV40-promoter-Luc control adenoviral plasmid was generated from pGL3 promoter
vector (Promega). After the transfection of the plasmid into 293A cells, recombinant
adenoviruses were collected by CsCl gradient centrifugation according to the
manufacturer’s instructions. Following titer determination by limiting dilution,
adenoviruses were injected intravenously into ICR male mice at the dose of 6.0 x 10⁶
P.F.U./body unless otherwise indicated.
RNA isolation and Northern blotting — Total RNA from liver and subctaneous fat
pad was isolated with Trizol Reagent (Invitrogen), and 7.5g RNA sample equally
pooled among each group was run on a 1% agarose gel containing formaldehyde and
transferred to a nylon membrane. cDNA probes were cloned as previously described
[4, 17, 18]. The probes were labeled with [-32P]dCTP using Megaprime DNA

- 10 -
Labelling System (Amersham Biosciences). The membranes were hybridized with the
radiolabeled probe in Rapid-hyb Buffer (Amersham Biosciences) at 65C and washed in
0.1x SSC buffer with 0.1% SDS at 65C. Blots were exposed to imaging plate for
BAS2000 BIO IMAGING ANALYZER (Fuji Photo Film, Tokyo, Japan).
Luciferase assays — Tissue samples (app. 50mg) were homogenized with a Polytron in
300l of Reporter Lysis Buffer (Promega) and centrifuged at 15000 rpm for 15min, and
luciferase activity in the supernatant was measured by standard kits (Promega) on a
luminometer. The luciferase activity was expressed as relative light units (RLU) / mg
of used sample weight.
Adenoviral DNA isolation and quantification by real-time PCR — The pellets
obtained in the process described above were digested in SNET buffer (1% SDS, 400
mM NaCl, 5 mM EDTA and 20 mM Tris-HCl at pH 8.0) containing proteinase K (0.01
mg/ml). After extraction with phenol / chloroform and RNase treatment, the pellets
were dissolved in TE buffer and DNA concentrations were measured. The amount of
adenovirus DNA in liver was determined with Sybr-Green Dye (ABgene) -based
real-time PCR, the protocol of which was 50C for 2 min and 95C for 10 min,

- 11 -
followed by 60 cycles of 95C for 15 sec and 60C for 1 min using 50ng genomic DNA
as a template on an ABI 7000 PCR instrument (Applied Biosystems). The primers
used for the quantification of luciferase gene were
5’-GTCCGGTTATGTAAACAATCC-3’ and 5’-ATGAAGAAGTGTTCGTCTTCG-3’.

- 12 -
Results and Discussion
Generation of transgenic mice carrying SREBP-1c promoter-luciferase fusion gene.
To examine the transcriptional regulation of SREBP-1c gene in vivo, we have
generated transgenic mice carrying the luciferase reporter gene driven by the 2.2kb
SREBP-1c 5’-flanking sequence that we have studied in vitro previously [16, 19]. The
genomic structure of SREBP-1 gene has been previously clarified in detail [20], and the
SREBP-1c promoter is located at 10kb downstream of the SREBP-1a promoter.
Because refeeding manipulation selectively upregulates SREBP-1c rather than
SREBP-1a [21], the responsible element was expected to be within the SREBP-1c
5’-flanking region. Since expression of reporter genes in transgenic animals might be
affected by the location of genomic integration, we analyzed two independent founder
lines, designated as line A and B. From Southern blotting analyses of genomic DNA
(Fig. 1B), line A and B mice were estimated to harbor 2 and 6 copies of transgene per
allele, respectively.

- 13 -
Transcriptional activation of the SREBP-1c promoter-driven transgene by
refeeding.
For these lines of transgenic mice, the expression of reporter gene in liver and
white adipose tissue was assessed by luciferase activity. As shown in Fig. 2, the
luciferase activities in the livers of both lines were markedly upregulated by refeeding
manipulation, which paralleled the responses of endogenous SREBP-1c expression.
This result means that the SREBP-1c expression is regulated at the transcription level in
this situation, rather than through the variable stability of mRNA, which is reported to
be involved in the regulation by polyunsaturated fatty acids [22].
The response of reporter gene in adipose tissue was apparently weaker than that
of intrinsic gene. This might result from weaker expression of transgene and relatively
higher background level in adipose tissue compared to liver.
SREBP-1c induction by refeeding without insulin.
We have previously reported that the refeeding response of SREBP-1c does not
require insulin [15]. To examine the role of insulin in this transcriptional upregulation

- 14 -
of the SREBP-1c by refeeding, we placed the transgenic mice on insulin-depleted state
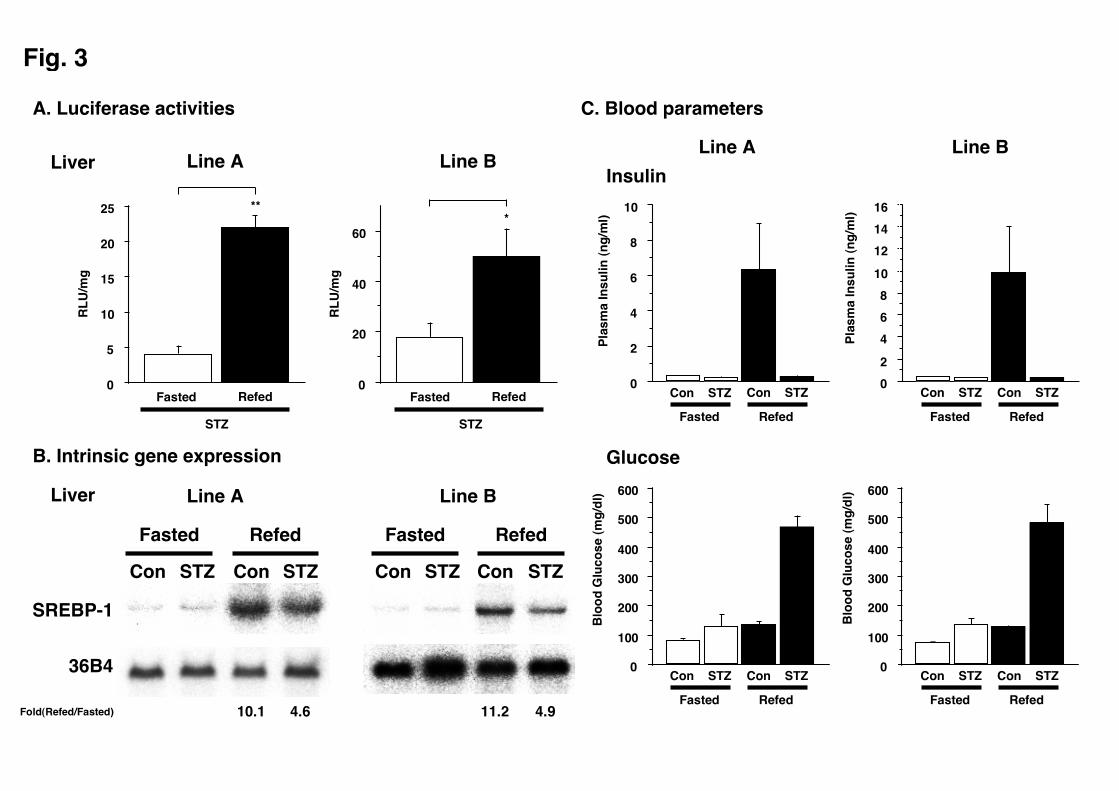
with streptozotocin treatment. As shown in Fig. 3, increase in plasma insulin by
refeeding was essentially abolished, but the SREBP-1c promoter activities as assessed
by luciferase reporter expression were vigorously induced in the liver accompanied by
elevation in blood glucose levels. This result indicates that insulin is not inevitable for
the upregulation of SREBP-1c gene transcription by refeeding, consistent with our
previous report [15].
Adenovirus-mediated transduction of SREBP-1c promoter-luciferase fusion gene
into the mouse liver and assessment of refeeding response.
We further took another strategy for in vivo assay of SREBP-1c promoter
activity using an adenovirus vector for introduction of the reporter gene into the liver.
We generated an adenovirus harboring the 2.2kb promoter region of SREBP-1c fused to
the luciferase reporter gene, and validated that intravenously administered adenoviruses
are uniformly introduced into the mouse liver as shown in Fig. 4A. Next we examined
the refeeding responses of these adenovirus-infected mice expressing

- 15 -
SREBP-1c-promoter-luciferase fusion gene in the liver. At the initial estimation, the
absolute luciferase activities observed varied among individual mice in a wide range
despite the same number of adenovirus particles for injection. As shown in Fig. 4A, it
was indicated that the variation among different portions of one liver was negligibly
small, thus most of the variation in measured luciferase activities was considered to
originate from inter-mouse variation in viral transduction efficiency. Two approaches
were taken to cancel this dispersion: 1. The amount of transducted adenoviral DNA was
quantified by real-time PCR technique on each mouse and luciferase activity was
adjusted based on this quantification (Fig.4B). 2. Liver samples on fasted and refed
states were taken from the same mouse by biopsy under brief anesthesia and data of
fasting and refeeding conditions from one mouse are analyzed consecutively (Fig.4C).
Both approaches produced essentially the same results, and refeeding responses of
twenty to thirty-fold increase in luciferase activities were consistently observed in a
dose-independent way, which paralleled the increases in the endogenous SREBP-1c
mRNA (Fig. 4E, F). In contrast, when SV40-promoter-Luc adenovirus was used as a
negative control instead of -2.2kb-SREBP-1c-promoter-Luc adenovirus, no refeeding

- 16 -
responses were observed (Fig. 4D).
These results are in complete accordance with those from transgenic mouse
model described above. Moreover, the adenoviral approach can avoid the potential
involvement of positional effects that might influence transgenic mouse data. It is
intriguing that whether the promoter-reporter fusion gene is inserted in the genome (i.e.
in the case of transgenic mouse) or not (i.e. in the case of adenovirus-mediated gene
transfer) does not affect the regulation of the SREBP-1c promoter activity.
Evaluation of insulin involvement based on adenovirus-mediated reporter gene
transfer technique.
The involvement of insulin was also evaluated using this adenovirus-mediated
introduction of SREBP-1c-promoter-luciferase fusion gene into the liver. As shown in
Fig. 4G, streptozotocin-treated diabetic mice exhibited strong refeeding responses of
luciferase reporter activities in a similar manner to the responses of intrinsic SREBP-1c
mRNA, fully consistent with the data from transgenic mice.
Regarding the role of insulin in the upregulation of lipogenesis, many previous

- 17 -
reports indicate that insulin increases the expression of SREBP-1c and thereby
upregulates lipogenesis [23-31]. However, our present methods clearly support that
insulin signaling pathway does not directly control SREBP-1c expression. This
suggests that the insulin response in vitro might not be identical to the refeeding
response in vivo, thus previous knowledge on in vitro promoter analyses of SREBP-1c
regulation by insulin might not fully hold true of in vivo regulation. For better
understanding of the in vivo physiology, further studies of in vivo promoter analyses
based on our reporter gene transfer technique utilizing adenovirus vector are currently
ongoing.
In summary, we generated two in vivo systems to estimate the SREBP-1c
promoter activity. It was demonstrated that the fasting-refeeding regulation of
SREBP-1c expression in the liver is exerted at the transcription level, and that 2.2kb of
the 5’-flanking sequence is sufficient for this regulation. Our adenoviral strategy
provides a feasible approach to identify the promoter regions responsible for refeeding
response of SREBP-1c expression, which is currently under going.

- 18 -
Acknowledgments and notice of grant support
This work was supported by grants-in-aid from the Ministry of Science,
Education, Culture and Technology of Japan, and by grants for the 21st Century COE
Program from the Ministry of Education, Culture, Sports, Science, and Technology of
Japan. It was also supported by research grants from the Uehara Memorial Foundation,
ONO Medical Research Foundation, Takeda Science Foundation, Suzuken Memorial
Foundation, Japan Heart Foundation, Kanae Foundation for the Promotion of Medical
Science, Senri Life Science Foundation, and Okinaka Memorial Institute for Medical
Research.

- 19 -
References
[1] A. G. Goodridge, Fatty acid synthesis in eucaryotes, ed., Elsevier Science,
Amsterdam 1991.
[2] A. G. Goodridge, Dietary regulation of gene expression: enzymes involved in
carbohydrate and lipid metabolism, Annu Rev Nutr 7 (1987) 157-185.
[3] I. Shimomura, H. Shimano, B. S. Korn, Y. Bashmakov, and J. D. Horton, Nuclear
Sterol Regulatory Element-binding Proteins Activate Genes Responsible for the Entire
Program of Unsaturated Fatty Acid Biosynthesis in Transgenic Mouse Liver, J Biol
Chem 273 (1998) 35299-35306.
[4] H. Shimano, N. Yahagi, M. Amemiya-Kudo, A. H. Hasty, J. Osuga, Y. Tamura, F.
Shionoiri, Y. Iizuka, K. Ohashi, K. Harada, T. Gotoda, S. Ishibashi, and N. Yamada,
Sterol regulatory element-binding protein-1 as a key transcription factor for nutritional
induction of lipogenic enzyme genes, J Biol Chem 274 (1999) 35832-35839.
[5] C. Yokoyama, X. Wang, M. R. Briggs, A. Admon, J. Wu, X. Hua, J. L. Goldstein,
and M. S. Brown, SREBP-1, a basic-helix-loop-helix-leucine zipper protein that

- 20 -
controls transcription of the low density lipoprotein receptor gene, Cell 75 (1993)
187-197.
[6] M. S. Brown, and J. L. Goldstein, The SREBP pathway: regulation of cholesterol
metabolism by proteolysis of a membrane-bound transcription factor, Cell 89 (1997)
331-340.
[7] H. Shimano, J. D. Horton, I. Shimomura, R. E. Hammer, M. S. Brown, and J. L.
Goldstein, Isoform 1c of sterol regulatory element binding protein is less active than
isoform 1a in livers of transgenic mice and in cultured cells, J Clin Invest 99 (1997)
846-854.
[8] N. Yahagi, and H. Shimano, Microarray analyses of SREBP-1 target genes., in
Unraveling Lipid Metabolism with Microarrays, in Berger, A., and Roberts, M., (Eds.),
CRC Press, New York, 2005, pp. 237-248.
[9] M. Sekiya, N. Yahagi, T. Matsuzaka, Y. Takeuchi, Y. Nakagawa, H. Takahashi, H.
Okazaki, Y. Iizuka, K. Ohashi, T. Gotoda, S. Ishibashi, R. Nagai, T. Yamazaki, T.
Kadowaki, N. Yamada, J.-i. Osuga, and H. Shimano, SREBP-1-independent regulation
of lipogenic gene expression in adipocytes, J. Lipid Res. 48 (2007) 1581-1591.

- 21 -
[10] N. Yahagi, H. Shimano, A. H. Hasty, T. Matsuzaka, T. Ide, T. Yoshikawa, M.
Amemiya-Kudo, S. Tomita, H. Okazaki, Y. Tamura, Y. Iizuka, K. Ohashi, J. Osuga, K.
Harada, T. Gotoda, R. Nagai, S. Ishibashi, and N. Yamada, Absence of sterol regulatory
element-binding protein-1 (SREBP-1) ameliorates fatty livers but not obesity or insulin
resistance in Lep(ob)/Lep(ob) mice, J Biol Chem 277 (2002) 19353-19357.
[11] M. Sekiya, N. Yahagi, T. Matsuzaka, Y. Najima, M. Nakakuki, R. Nagai, S.
Ishibashi, J. Osuga, N. Yamada, and H. Shimano, Polyunsaturated fatty acids ameliorate
hepatic steatosis in obese mice by SREBP-1 suppression, Hepatology 38 (2003)
1529-1539.
[12] J. D. Horton, I. Shimomura, M. S. Brown, R. E. Hammer, J. L. Goldstein, and H.
Shimano, Activation of cholesterol synthesis in preference to fatty acid synthesis in
liver and adipose tissue of transgenic mice overproducing sterol regulatory
element-binding protein-2, J Clin Invest 101 (1998) 2331-2339.
[13] M. Foretz, C. Pacot, I. Dugail, P. Lemarchand, C. Guichard, X. le Liepvre, C.
Berthelier-Lubrano, B. Spiegelman, J. B. Kim, P. Ferre, and F. Foufelle,
ADD1/SREBP-1c Is Required in the Activation of Hepatic Lipogenic Gene Expression

- 22 -
by Glucose, Mol. Cell. Biol. 19 (1999) 3760-3768.
[14] A. H. Hasty, H. Shimano, N. Yahagi, M. Amemiya-Kudo, S. Perrey, T. Yoshikawa,
J. Osuga, H. Okazaki, Y. Tamura, Y. Iizuka, F. Shionoiri, K. Ohashi, K. Harada, T.
Gotoda, R. Nagai, S. Ishibashi, and N. Yamada, Sterol regulatory element-binding
protein-1 is regulated by glucose at the transcriptional level, J Biol Chem 275 (2000)
31069-31077.
[15] T. Matsuzaka, H. Shimano, N. Yahagi, M. Amemiya-Kudo, H. Okazaki, Y.
Tamura, Y. Iizuka, K. Ohashi, S. Tomita, M. Sekiya, A. Hasty, Y. Nakagawa, H. Sone,
H. Toyoshima, S. Ishibashi, J. Osuga, and N. Yamada, Insulin-independent induction of
sterol regulatory element-binding protein-1c expression in the livers of
streptozotocin-treated mice, Diabetes 53 (2004) 560-569.
[16] M. Amemiya-Kudo, H. Shimano, T. Yoshikawa, N. Yahagi, A. H. Hasty, H.
Okazaki, Y. Tamura, F. Shionoiri, Y. Iizuka, K. Ohashi, J. Osuga, K. Harada, T. Gotoda,
R. Sato, S. Kimura, S. Ishibashi, and N. Yamada, Promoter analysis of the mouse sterol
regulatory element-binding protein-1c gene, J Biol Chem 275 (2000) 31078-31085.
[17] H. Shimano, J. D. Horton, R. E. Hammer, I. Shimomura, M. S. Brown, and J. L.
- 23 -
Goldstein, Overproduction of cholesterol and fatty acids causes massive liver
enlargement in transgenic mice expressing truncated SREBP-1a, J Clin Invest 98 (1996)
1575-1584.
[18] N. Yahagi, H. Shimano, A. H. Hasty, M. Amemiya-Kudo, H. Okazaki, Y. Tamura,
Y. Iizuka, F. Shionoiri, K. Ohashi, J. Osuga, K. Harada, T. Gotoda, R. Nagai, S.
Ishibashi, and N. Yamada, A crucial role of sterol regulatory element-binding protein-1
in the regulation of lipogenic gene expression by polyunsaturated fatty acids, J Biol
Chem 274 (1999) 35840-35844.
[19] T. Yoshikawa, H. Shimano, M. Amemiya-Kudo, N. Yahagi, A. H. Hasty, T.
Matsuzaka, H. Okazaki, Y. Tamura, Y. Iizuka, K. Ohashi, J. Osuga, K. Harada, T.
Gotoda, S. Kimura, S. Ishibashi, and N. Yamada, Identification of liver X
receptor-retinoid X receptor as an activator of the sterol regulatory element-binding
protein 1c gene promoter, Mol Cell Biol 21 (2001) 2991-3000.
[20] X. Hua, J. Wu, J. L. Goldstein, M. S. Brown, and H. H. Hobbs, Structure of the
human gene encoding sterol regulatory element binding protein-1 (SREBF1) and
localization of SREBF1 and SREBF2 to chromosomes 17p11.2 and 22q13, Genomics

- 24 -
25 (1995) 667-673.
[21] J. D. Horton, Y. Bashmakov, I. Shimomura, and H. Shimano, Regulation of sterol
regulatory element binding proteins in livers of fasted and refed mice, Proc Natl Acad
Sci U S A 95 (1998) 5987-5992.
[22] J. Xu, M. Teran-Garcia, J. H. Park, M. T. Nakamura, and S. D. Clarke,
Polyunsaturated fatty acids suppress hepatic sterol regulatory element-binding protein-1
expression by accelerating transcript decay, J Biol Chem 276 (2001) 9800-9807.
[23] J. B. Kim, P. Sarraf, M. Wright, K. M. Yao, E. Mueller, G. Solanes, B. B. Lowell,
and B. M. Spiegelman, Nutritional and insulin regulation of fatty acid synthetase and
leptin gene expression through ADD1/SREBP1, J Clin Invest 101 (1998) 1-9.
[24] M. Foretz, C. Guichard, P. Ferre, and F. Foufelle, Sterol regulatory element
binding protein-1c is a major mediator of insulin action on the hepatic expression of
glucokinase and lipogenesis-related genes, Proc Natl Acad Sci U S A 96 (1999)
12737-12742.
[25] I. Shimomura, Y. Bashmakov, S. Ikemoto, J. D. Horton, M. S. Brown, and J. L.
Goldstein, Insulin selectively increases SREBP-1c mRNA in the livers of rats with
- 25 -
streptozotocin-induced diabetes, Proc Natl Acad Sci U S A 96 (1999) 13656-13661.
[26] M. Fleischmann, and P. B. Iynedjian, Regulation of sterol regulatory-element
binding protein 1 gene expression in liver: role of insulin and protein kinase B/cAkt,
Biochem J 349 (2000) 13-17.
[27] S. H. Koo, A. K. Dutcher, and H. C. Towle, Glucose and insulin function through
two distinct transcription factors to stimulate expression of lipogenic enzyme genes in
liver, J Biol Chem 276 (2001) 9437-9445.
[28] M. Matsumoto, W. Ogawa, K. Teshigawara, H. Inoue, K. Miyake, H. Sakaue, and
M. Kasuga, Role of the insulin receptor substrate 1 and phosphatidylinositol 3-kinase
signaling pathway in insulin-induced expression of sterol regulatory element binding
protein 1c and glucokinase genes in rat hepatocytes, Diabetes 51 (2002) 1672-1680.
[29] Y. Zhang, L. Yin, and F. B. Hillgartner, SREBP-1 integrates the actions of thyroid
hormone, insulin, cAMP, and medium-chain fatty acids on ACCalpha transcription in
hepatocytes, J Lipid Res 44 (2003) 356-368.
[30] G. Chen, G. Liang, J. Ou, J. L. Goldstein, and M. S. Brown, Central role for liver X
receptor in insulin-mediated activation of Srebp-1c transcription and stimulation of fatty
- 26 -
acid synthesis in liver, Proc Natl Acad Sci U S A 101 (2004) 11245-11250.
[31] X. Deng, C. Yellaturu, L. Cagen, H. G. Wilcox, E. A. Park, R. Raghow, and M. B.
Elam, Expression of the Rat Sterol Regulatory Element-binding Protein-1c Gene in
Response to Insulin Is Mediated by Increased Transactivating Capacity of Specificity
Protein 1 (Sp1), J Biol Chem 282 (2007) 17517-17529.

- 27 -
Figure legends
Fig. 1 Transgene construct and Southern blot. A. Construct used to generate
-2.2kb-SREBP-1c-promoter-Luc transgenic mice. The mouse SREBP-1c promoter
region spanning -2.2k to +40bp was fused to a luciferase reporter gene and SV40 late
polyadenylation sequence. B. Southern blotting of genomic DNA from transgenic
mice. Genomic DNA prepared from tail samples of wild-type (WT) controls and two
lines (line A and B) of transgenic mice were analyzed by Southern blotting using two
distinct probes. For probe 1 (shown in upper panel), a cDNA probe for luciferase gene
was used. DNA samples were digested with BamHI. For probe 2 (shown in lower
panel), a cDNA probe for mouse SREBP-1c promoter region was used to determine the
copy number of transgene. DNA samples were digested with NheI.
Fig. 2 Refeeding response of transgenic mice. A. Transgene expression as
assessed by luciferase activities of liver and white adipose tissue (WAT) from two lines
of transgenic mice. Transgenic mice were either fasted for 24 h or refed for 16 h after
- 28 -
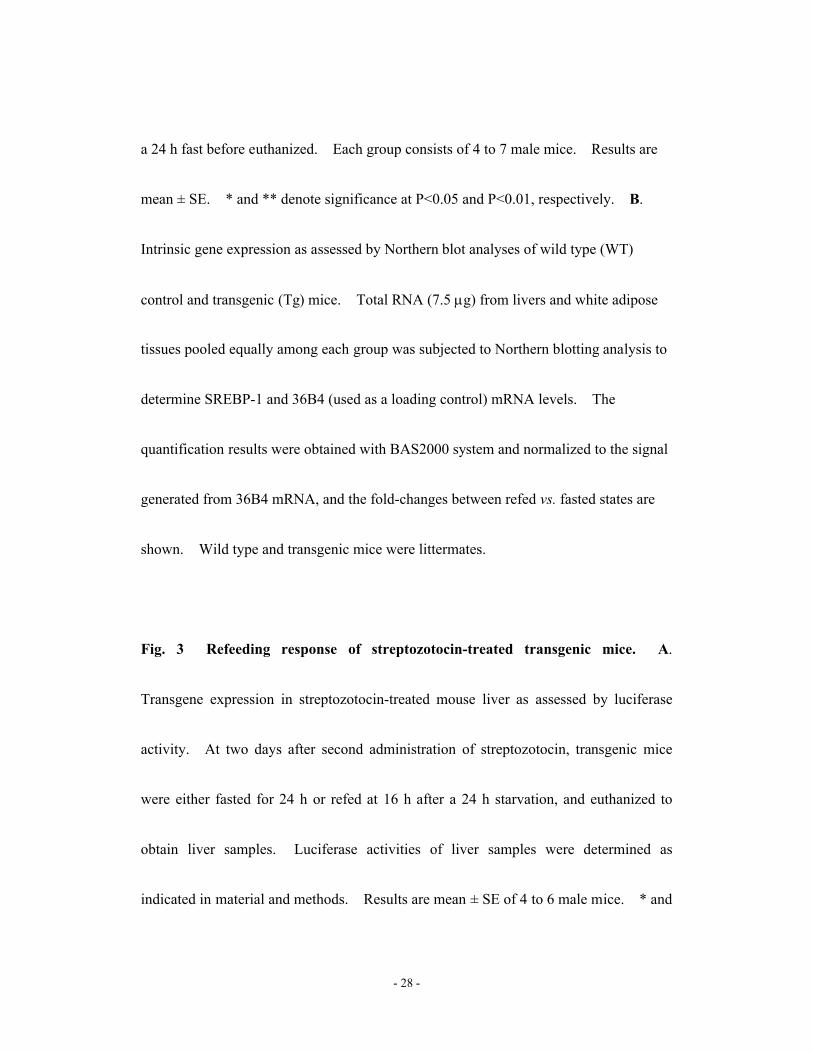
a 24 h fast before euthanized. Each group consists of 4 to 7 male mice. Results are
mean ± SE. * and ** denote significance at P<0.05 and P<0.01, respectively. B.
Intrinsic gene expression as assessed by Northern blot analyses of wild type (WT)
control and transgenic (Tg) mice. Total RNA (7.5 g) from livers and white adipose
tissues pooled equally among each group was subjected to Northern blotting analysis to
determine SREBP-1 and 36B4 (used as a loading control) mRNA levels. The
quantification results were obtained with BAS2000 system and normalized to the signal
generated from 36B4 mRNA, and the fold-changes between refed vs. fasted states are
shown. Wild type and transgenic mice were littermates.
Fig. 3 Refeeding response of streptozotocin-treated transgenic mice. A.
Transgene expression in streptozotocin-treated mouse liver as assessed by luciferase
activity. At two days after second administration of streptozotocin, transgenic mice
were either fasted for 24 h or refed at 16 h after a 24 h starvation, and euthanized to
obtain liver samples. Luciferase activities of liver samples were determined as
indicated in material and methods. Results are mean ± SE of 4 to 6 male mice. * and

- 29 -
** denote significance at P<0.05 and P<0.01, respectively. B. Northern blot analyses
visualizing endogenous SREBP-1 mRNA expression pattern in streptozotocin-treated
mouse liver. Total RNA (7.5 g) from livers pooled equally among each group was
subjected to Northern blotting to determine SREBP-1 and 36B4 (used as a loading
control) mRNA levels. The quantification results were obtained with BAS2000
system and normalized to the signal generated from 36B4 mRNA, and the fold-changes
between refed vs. fasted states are shown. C. Blood insulin and glucose levels of
streptozotocin-treated transgenic mice are shown.
Fig. 4 Adenovirus-mediated transduction of -2.2kb-SREBP-1c-promoter-Luc
into liver and assessment of refeeding response. A. Validation of homogenous
transfer of reporter gene into various portions of liver. Variation within a mouse liver
was estimated by sampling 5 pieces of liver from distinct lobes after three days of
-2.2kb-SREBP-1c-promoter-Luc adenovirus injection (6.0 x 10⁶ P.F.U./body).
Adenoviruses were intravenously injected into ICR male mouse. B. Estimation of
refeeding response of luciferase activity adjusted by real-time PCR. Three days after

- 30 -
the administration of -2.2kb-SREBP-1c-promoter-Luc adenovirus, luciferase activities
were measured and at the same time, the amount of transducted adenoviral DNA was
quantified by real-time PCR technique on each mouse of fasting and refeeding group
and luciferase activities per transducted adenoviral DNA were calculated based on this
quantification. 50 ng genomic DNA was used as templates for real-time PCR.
Results are mean ± SE of 4 to 5 mice. ** denotes significance at P<0.01. C.
Pairwise estimation of refeeding response using biopsy method.
-2.2kb-SREBP-1c-promoter-Luc adenovirus-administered mice were fasted for 24 h and
then liver samples were taken by biopsy under inhalation anesthesia. After refed for
16 h, mice were euthanized to obtain refed liver samples. Luciferase activities were
determined and fold changes of luciferase activities were calculated by dividing data on
a refed state by those of the same mouse on a fasted state. Results are mean ± SE of 5
mice. ** denotes significance at P<0.01. D. Negative control for data shown in C.
SV40-promoter-Luc control adenovirus was used instead of
-2.2kb-SREBP-1c-promoter-Luc adenovirus. Results are mean ± SE of 4 mice. E.
Dose independence of refeeding response. Indicated amounts of

- 31 -
-2.2kb-SREBP-1c-promoter-Luc adenoviruses were intravenously injected into ICR
male mice, and refeeding responses were assessed by pairwise method. F, fasted; R,
refed. Results are mean ± SE of 3 mice. F. Endogenous SREBP-1 expression is not
affected by adenovirus administration. Total RNA (7.5 g) from livers pooled equally
from each group (n=3) was subjected to Northern blotting analysis to determine
SREBP-1 and 36B4 (used as a loading control) mRNA levels. G. Refeeding response
of luciferase reporter activity in adenovirus-infected and streptozotocin-treated mouse
liver. At two days after second administration of streptozotocin,
-2.2kb-SREBP-1c-promoter-Luc adenovirus (6.0 x 10⁶ P.F.U./body) was intravenously
injected into ICR male mice. Three days thereafter, mice were fasted for 24 h and then
liver biopsies were performed under inhalation anesthesia. After refed for 16 h, mice
were euthanized to obtain liver sample. Luciferase activities were measured and
refeeding responses were determined pairwise. Results are mean ± SE of 4 to 5 mice.
** denotes significance at P<0.01. H. Refeeding responses of endogenous SREBP-1
mRNA expression in streptozotocin-treated mice. Total RNA (7.5 g) from livers
pooled equally among each group was subjected to Northern blotting analysis to

- 32 -
determine SREBP-1 and 36B4 (used as a loading control) mRNA levels. I. Blood
insulin and glucose levels of the control and streptozotocin-administered mice are
shown.

A. Transgene construct
F
i
g
.
1
WT T
g
Line A
WT T
g
Line B
W
T Line A L
i
n
e
B
T
g
1.0 2 .
1 3.9
B
.
S
o
u
t
h
e
r
n
b
l
o
t
p
r
o
b
e
2
probe 1
+
4
0
Luciferase gene
m
o
u
s
e
S
R
E
B
P
-
1
c
p
r
o
m
o
t
e
r
2
.
2
k
b
- 2
.
2
k
S
m
a
I
SV40 Late Poly(A) Signal
BamHIN
h
e
I N
h
e
I
p
r
o
b
e
2 probe1
SalI
BamHI
3.3kb
1.1kb
Figure 1

Liver
WAT
Fasted R
e
f
e
d0
100
2
0
0
3
0
0
R
L
U
/
m
g
*
0
5
1
0
1
5
20
R
L
U
/
m
g
Fasted Refed
*
L
i
n
e
BL
i
n
e
A
0
5
1
0
1
5
R
L
U
/
m
g
F
a
s
t
e
d R
e
f
e
d
* *
0
2
4
6
8
10
R
L
U
/
m
g
Fasted Refed
*
F
i
g
.
2
A
.
L
u
c
i
f
e
r
a
s
e
a
c
t
i
v
i
t
i
e
s B.
I
n
t
r
i
n
s
i
c
g
e
n
e
e
x
p
r
e
s
s
i
o
n
L
i
v
e
r
WAT
S
R
E
B
P
-
1
3 6
B
4
SREBP-1
3 6
B
4
Line BLine A
L
i
n
e
A
W
T
F
a
s
t
e
d R
e
f
e
d
L
i
n
e
A
T
g
F
a
s
t
e
d R
e
f
e
d
L
i
n
e
B
W
T
F
a
s
t
e
d R
e
f
e
d
L
i
n
e
B
T
g
F
a
s
t
e
d R
e
f
e
d
L
i
n
e
A
W
T
F
a
s
t
e
d R
e
f
e
d
L
i
n
e
A
T
g
F
a
s
t
e
d R
e
f
e
d
L
i
n
e
B
W
T
F
a
s
t
e
d R
e
f
e
d
L
i
n
e
B
T
g
F
a
s
t
e
d R
e
f
e
d
9.2 8.6Fold(Refed/Fasted) 8 .
9 1
0
.
3
Fold(Refed/Fasted) 1 0
.
9 8.6 1
0
.
5 1
0
.
3
Figure 2
F
i
g
.
3
A
.
L
u
c
i
f
e
r
a
s
e
a
c
t
i
v
i
t
i
e
s
B. Intrinsic gene expression
L
i
v
e
r Line B
0
20
40
60
R
L
U
/
m
g
*
L
i
n
e
A
0
5
1
0
1
5
2
0
2
5
R
L
U
/
m
g
* *
L
i
v
e
r
S
R
E
B
P
-
1
36B4
C
o
n S
T
Z
F
a
s
t
e
d
C
o
n S
T
Z
R
e
f
e
d
L
i
n
e
A
Con STZ
Fasted
C
o
n S
T
Z
Refed
Line B
0
2
4
6
8
10
12
14
16
P l
a
s
m
a
I
n
s
u
l
i
n
(
n
g
/
m
l
)
0
100
200
300
400
500
600
B l
o
o
d
G
l
u
c
o
s
e
(
m
g
/
d
l
)
0
2
4
6
8
1
0
P l
a
s
m
a
I
n
s
u
l
i
n
(
n
g
/
m
l
)
0
1
0
0
2
0
0
3
0
0
4
0
0
5
0
0
6
0
0
B l
o
o
d
G
l
u
c
o
s
e
(
m
g
/
d
l
)
C.
B
l
o
o
d
p
a
r
a
m
e
t
e
r
s
Line A L
i
n
e
B
Con STZ
Fasted Refed
Con STZ Con STZ
Fasted Refed
Con STZ
Con STZ
Fasted Refed
Con STZ Con STZ
Fasted Refed
Con STZ
Fasted Refed
STZ
Fasted Refed
STZ
I n
s
u
l
i
n
Glucose
Fold(Refed/Fasted) 10.1 4.6 11.2 4.9
Figure 3

F
i
g
.
4
A
R L
U
/
m
g
0
2
0
4
0
6
0
8
0
1
0
0
a
v
e
r
a
g
e1 2 3 4 5
0
2
4
6
8
F o
l
d
(
R
e
f
e
d
/
F
a
s
t
e
d
)
F
a
s
t
e
d R
e
f
e
d
* *
I n
s
u
l
i
n G
l
u
c
o
s
e
S
R
E
B
P
-
1
3 6
B
4
C
o
n S
T
Z
F
a
s
t
e
d
C
o
n S
T
Z
R
e
f
e
d
F
G H
0
2
4
6
8
1
0
1
2
1
4
1
6
P l
a
s
m
a
I
n
s
u
l
i
n
(
n
g
/
m
l
)
C
o
n S
T
Z C
o
n S
T
Z
F
a
s
t
e
d R
e
f
e
d
0
1
0
0
2
0
0
3
0
0
4
0
0
5
0
0
6
0
0
B l
o
o
d
G
l
u
c
o
s
e
(
m
g
/
d
l
)
C
o
n S
T
Z C
o
n S
T
Z
F
a
s
t
e
d R
e
f
e
d
S
R
E
B
P
-
1
3
6
B
4
F R F R F R F R F R F R0 2 6 2
0 6
0 2
0
0
x 1
06
P
.
F
.
U
.
/
b
o
d
y
B
R L
U
/
m
g
/
A
d
e
n
o
v
i
r
a
l
d
o
s
a
g
e
0
2
0
0
0
4
0
0
0
6
0
0
0
8
0
0
0
1
0
0
0
0
1
2
0
0
0
1
4
0
0
0
F
a
s
t
e
d R
e
f
e
d
* *
C
F o
l
d
(
R
e
f
e
d
/
F
a
s
t
e
d
)
0
1
0
2
0
3
0
F
a
s
t
e
d R
e
f
e
d
* *
4
0
0
1
0
2
0
3
0
F o
l
d
(
R
e
f
e
d
/
F
a
s
t
e
d
)
F R F R F R F R F R
2 6 2 0 6
0 2
0
0 x
1
06
P
.
F
.
U
.
/
b
o
d
y
D E
0
1
0
2
0
3
0
F
a
s
t
e
d R
e
f
e
d
F o
l
d
(
R
e
f
e
d
/
F
a
s
t
e
d
)
I
F
o
l
d
(
R
e
f
e
d
/
F
a
s
t
e
d
) 6 .
2 2
.
8
F
o
l
d
(
R
e
f
e
d
/
F
a
s
t
e
d
) 9 .
4 6
.
7 7
.
9 7
.
8 7
.
2 7
.
3
Figure 4