Embed Size (px)
Citation preview

Development of a P2X7R PET Tracer: [18F]JNJ-64413739
Hartmuth Kolb, Katrin Szardenings, Greg Chen, Wei Zhang, Anna Xia, Tamara Berdyyeva, Chaofeng Huang Anindya Bhattacharya, Nicholas Carruthers, Michael Letavic, Gilles Tamagnan (MNI), Guy Bormans (KU Leuven)
In Vivo Imaging of Neuroinflammation
Pictured above: Nerve Cell

2
In Vivo Imaging of Human Neuroinflammation
Neuroimaging Targets for Neuroinflammation (1) Activation of CNS immunocompetent cells (microglia, astrocytes), (2) disruption of BBB, (3) infiltration of peripheral immune cells, and (4) consequences of neuroinflammation (e.g., demyelination, cell death)
D.S. Albrecht, C. Granziera, J.M. Hooker, M.L. Loggia ACS Chemical Neuroscience 2016

Session 3: Neuroimaging Biomarkers, Current Initiatives and Opportunities
• HARTMUTH KOLB, KATRIN SZARDENINGS Johnson and Johnson
• ROBERT INNIS, National Institute of Mental Health
• MARTINA ABSINTA, National Institute of Neurological Disorders and Stroke
• KATERINA AKASSOGLOU, Gladstone Institute of Neurological Disease
• In vivo imaging of Neuroinflammation: P2X7R PET
• Positron Emission Tomography of Translocator Protein 18 kDa (TSPO) as a Biomarker of Neuroinflammation in Dementia and in Depression
• MR imaging of chronic inflammation in multiple sclerosis
• Fibrin in Neurologic Diseases: Mechanisms, Imaging, Therapeutics

4
Potential Targets for Neuroimmune PET Imaging
Target Distribution in healthy brain
Expression in Neuroinflammation model PET Ligands Key References
TSPO Not in neurons; micro- and macroglial cells
Upregulated w/ microglial & astrocyte activation. High levels of non-specific binding, poor S/N, Ki influenced by polymorphism
11C-PK11195, 11C-PBR28, 18F-PBR06, 18F-GE-180, 18F-DPA-714 etc.
L. Vivash, T.J. O’Brien JNM 2016, 57, 165-168 (review); Hannestad, J. et al. NeuroImage 2012, 63 (1), 232–239 (LPS model); W.C. Kreisl, R.B. Innis et al. Brain 2013 (AD).
COX1 Neurons, endothelium, and microglia but not astrocytes
Upregulated primarily in microglia by neuroinflammaton
11C-ketoprofen methyl ester - Shukuri; 11C-PS13 & 18F-PS2
Depboylu, Neurobio Disease 2011; Shukuri JNM 2011; Innis, Pike JNM 2015
COX2 Neurons Markedly upregulated by inflammation in microglia and probably other cells
11C-Ibuprofen, Celecoxib; 11-C-GW406381x; 11C-MC1 & 18F-MC8
Depboylu, Neurobio Disease 2011; Pulli, J Clin Cell Immunol 2014; Yiangou BMC Neurol. 2006, Gunn, J Cer Blood Flow Metab 2012; Innis and Pike JNM 2015
P2X7R Widely expressed in microglia, astrocytes
2-5x increased expression in astrocytes and microglia in LPS rat model; 70% increased expression in AD microglia. Increased P2X7 expression drives microglial activation, rather than P2X7 overexpression being a consequence of microglial activation
[18F]JNJ-64413739 [11C]GSK1482160; [11C]A-740003
H.B. Choi et al. J. Neuroscience 2007, 27, 4957; S.D. Skaper et al FASEB 2010, 24, 337-345; Y. Yiangou et al. BMC Neurol. 2006, 6. A.D. Michel et al. British J. Pharmacol. 2007, 151, 84; M. Gao et al. Bioorg. & Med. Chem Letters 2015, 25, 1965-1970
CB2R Microglia, astrocytes, neurons - low expression
Up to 10x higher expression in activated microglia; seen in AD, ALS, AIDS dementia
11C-A-836339, 18F-29, 18F-SAR343680; 11C-NE40
R-P Moldovan, M.G. Pomper, A.G. Horti et al. J.Med.Chem. 2016, 59, 7840; C. Benito et al. British J. Pharmacol. 2008, 153, 277-285; Y. Yiangou et al. BMC Neurol. 2006, 6.
CD11b/CD18 (Mac-1)
Microglia, (monocytes, macrophages)
Strong induction of CD11b expression in models of cortical impact and LPS.
Mostly mAbs; Leukadherins; 18F-VHH7 (mAB fragment)
D. Maiguel et al. Science Signalling 2013, 4(189); J.C. d'Avila et al. J. Neuroinfl. 2012, 9(31); R. Weissleder et al. PNAS 2015, 112(19)
5
P2X7 receptor expression in the brain P2X7: ATP gated ion channel
Rat Hippocampus CA1
Mic
rogl
ia (I
ba1)
P2X7
rece
p tor
Ove
rlay
Expressed throughout the brain & predominantly in microglia Similar expression observed with PET ligands in NHP no reference region

Coronal brain section of a mouse injected with Saline.
Neuroimmune Imaging - P2X7 LPS injection (IP with saline or 5 mg/kg LPS) causes increased Iba1 immunoreactivity and increased P2X7 expression
Iba1 IHC on coronal brain section of a mouse injected with Saline.
Iba1 IHC on brain section of a mouse injected with LPS @ 72h.
20X magnification 20X magnification
Iba1 IHC staining intensity in Saline (open) vs. LPS (filled) treated mice
P2X7 expression levels ratioed to ß-Actin in Saline (open) vs. LPS (filled)
treated mice.
Western blot of P2X7 protein expression in the cortex of LPS
treated mice after 72 hrs.
11C-GSK1482160 PET total volumes of distribution (VT) for saline (open), LPS (black), and LPS+Block (grey)
Paul R Territo, Jill A Meyer et al. J Nucl Med. 2016

7
Profile of JNJ-64413739 Feature / Test JNJ-64413739
M.W./clogP/TPSA 407/1.3/85
IC50 P2X7 h/r (nM) 1.0/1.9
Ki P2X7 h/r (nM) 15/2.7
Plasma Protein Bdg (h/r, free-%) 63/67
Brain Tissue Bdg (rar, free-%) 18.7
MDCK ratio 13.8
ex-vivo ARG occupancy (rat, i.v., 1 mg/kg) 92% (@ 5min), 92% (@ 30min), 87% (@ 60min)
Brain/Plasma (rat, i.v.) by LC-MS/MS 0.81 (@ 5min), 0.91 (@ 30min)
IV PK rat T1/2 0.5h; CI 36.6 (mL/min/kg)
Liver microsome r: t1/2 66min, ER 0.53; monkey: t1/2 27.5 min, ER 0.61; h: t1/2 180min, ER 0.16
Cerep off-target panel (@ 1 µM) 52 targets clean
Microdosing blocking rats (30 min uptake) 42%
Microdosing ko versus wt mice (30min uptake; 100 µg/kg) 38% reduction ko vs wt
Monkey PET blocking with JNJ 57.5% receptor occupancy @ 2.5 mg/kg
JNJ-64413739

Average (± SD), n=6
Starting activity (mCi) 1227 (± 505)
[18F]MNI-920 activity (mCi) 23.2 (± 8.9)
Decay-corrected yield (%) 3.3 (± 2.0)
Production time (min) 61 (± 11)
Radionuclidic identity Pass -
pH 6.0 (± 0.0)
Kryptofix content (≤ 50 µg/mL) Pass -
Radiochemical purity (%) 99.9 (± 0.2)
Identity Pass -
MNI-920 assay (µg/mL) 0.56 (± 0.36)
Total impurity assay (µg/mL) 2.96 (± 2.16)
Specific activity (mCi/µmol) 1371 (± 632)
Residual solvent content (< 410 ppm MeCN, < 5000 ppm DMSO) Pass -
Pyrogen content (<17.5 EU/mL) Pass -

Compound levels in cerebrum are reduced by 38% for JNJ-64413739 in knockout mice compared with wild type (n=4, at 30 min after 100 µg/kg iv injection). Analyzed by LC-MS/MS.
9
Brain uptake/retention of JNJ-64413739 in wild type and knockout mice (n=4)
0
20
40
60
80
100
120
140
160
180
200
Wild Type Knockout
Com
poun
d le
vel i
n Ce
rebr
um (n
g/g
prot
ein)
Brain uptake/retenton of JNJ-64413739 in wt and ko mice (n=4)
P=0.02
38%

0
50
100
150
200
250
300
350
400
450
15 min 30 min
Com
poun
d le
vel i
n ra
t bra
in (n
g/g
prot
ein)
In vivo Rat Blocking Experiments (n=3)
42.3% 42.7%
Baseline
Pre-treat
Baseline
Pre-treat
JNJ-55308942 (5 mg/kg, p.o. dose for 1hr) blocks JNJ-64413739 (30 µg/kg, iv) binding in rat brains (n= 3). The blocking effects are expressed as % reduction of baseline signal. Analysis by LC-MS/MS.
JNJ-64413739 shows high brain uptake in rats and exhibits a blocking effect with JNJ-55308942.
10
In vivo Rat Blocking Experiments with JNJ-64413739 (n=3)

Rat 2 Rat 1
Rat 1: [18F]JNJ-739 + 10 µM JNJ-739
Rat 2: [18F]JNJ-739 + 10 µM JNJ-739
11
Humanized P2X7R Rat Model – in vitro ARG with [18F]JNJ-64413739
2 brain slices per slide Slices of two different rats Higher binding to injected striatum Complete blocking with 10 µM cold JNJ-64413739
Human P2X7R vector implanted in the rat right striatium
hP2X7R expression monitored by Western Blot
KU Leuven Rat Model: D. Ory et al. J Nucl Med. 2016 Sep; 57(9):1436-41

[18F]JNJ-739 SUV Thalamus [18F]JNJ-739 SUV Cerebellar lobes
12
[18F]JNJ-64413739 Rhesus Monkey PET imaging: Blocking with “JNJ (= DD-106)”
[18F]JNJ-739 SUV Hippocampus
Wilma
13
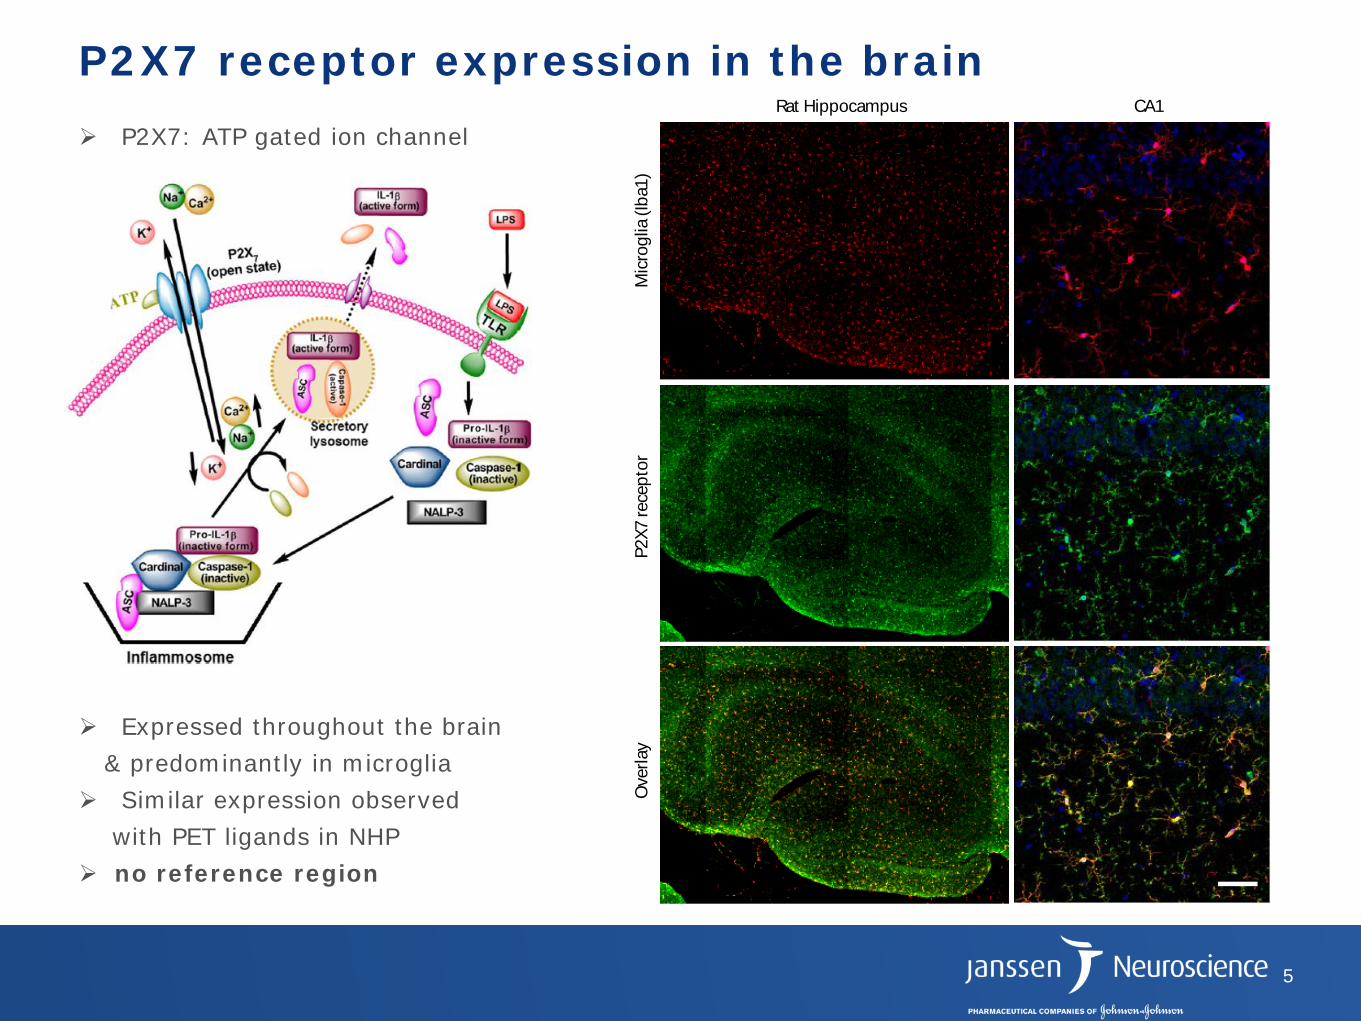
[18F]JNJ-64413739 Monkey PET: Blocking with a P2X7 inhibitor “JNJ”: Summed images 30-120 min
Baseline (vehicle)
0.1 mg/kg JNJ
2.5 mg/kg JNJ
SU
V
Wilma

Dose(mg/kg) AUC %RO monkey 5.3 132470 52 #1 2.5 42315* 57.5 #1 + #2 0.377 5750 52 #1 0.1 2094 17.6 #2 0 0 0 #1 + #2
14
[18F]JNJ-64413739 Rhesus Monkey PET: Dose dependent target occupancy
Target occupancy and blood levels of JNJ (AUC)
0
18
52
58
52
0
15
30
45
60
75
Vehicle 0.1 mg/kg(Wilma)
0.377 mg/kg(Ole)
2.5 mg/kg(Ole+Wil)
5.3 mg/kg(Ole)
Target Occupancy vs. Dose of JNJ
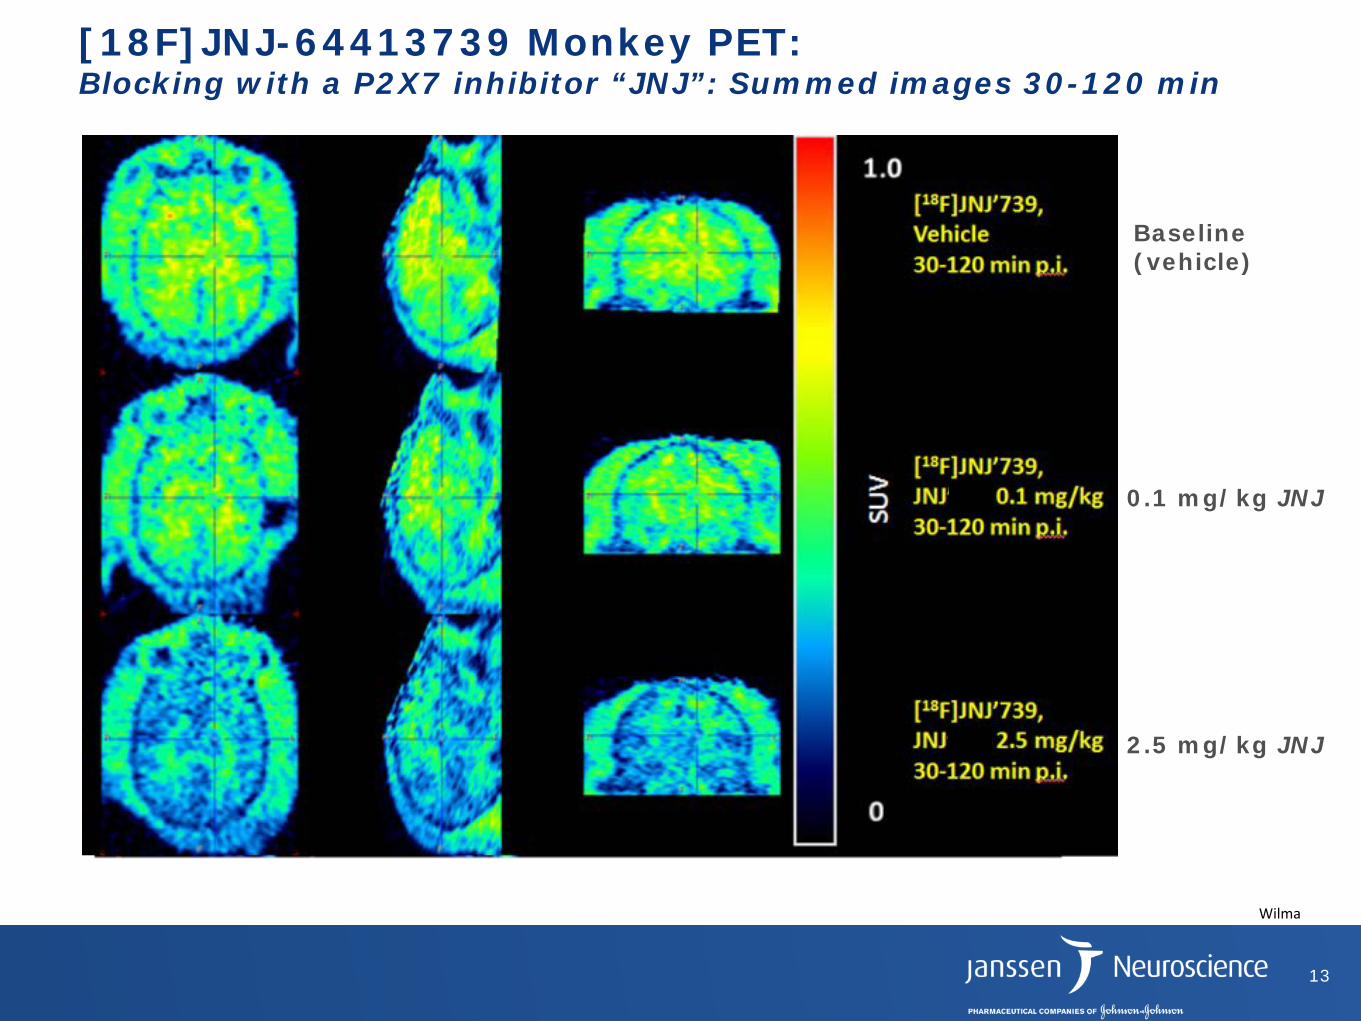
PET images from day 2 with [18F]JNJ-64413739 Animals were PET imaged on day 2 and brains harvested/frozen after scan. Images are summed 10-60 min.
PBS (control, rat #11)
LPS (rat #6)
SUV 2
0
SUV 2
0
P2X7 (PET, VOI 6x4.5x4.5 mm)
17
Control Side
Injected Side
Cerebellum
Shading = s.e.m
LPS injected rats, n = 5
SUV
0 20 40 60 0
0.5
1
1.5
TIME (minutes)
SUV
TIME (minutes)
PBS injected rats, n = 5
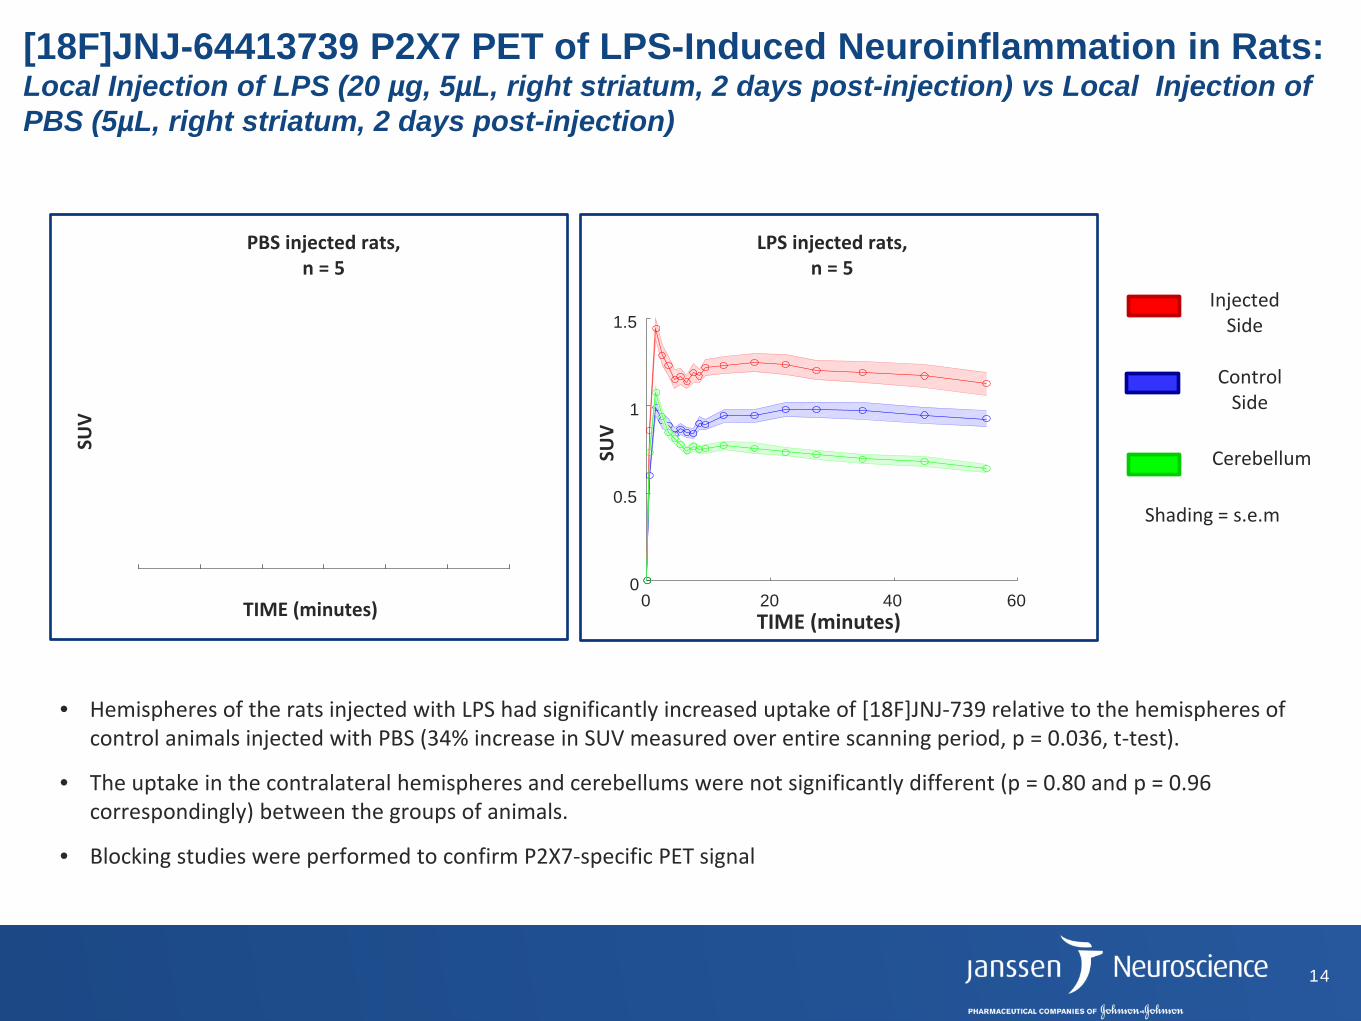
• Hemispheres of the rats injected with LPS had significantly increased uptake of [18F]JNJ-739 relative to the hemispheres of control animals injected with PBS (34% increase in SUV measured over entire scanning period, p = 0.036, t-test).
• The uptake in the contralateral hemispheres and cerebellums were not significantly different (p = 0.80 and p = 0.96 correspondingly) between the groups of animals.
• Blocking studies were performed to confirm P2X7-specific PET signal
[18F]JNJ-64413739 P2X7 PET of LPS-Induced Neuroinflammation in Rats: Local Injection of LPS (20 µg, 5µL, right striatum, 2 days post-injection) vs Local Injection of PBS (5µL, right striatum, 2 days post-injection)
14

17
P2X7R PET imaging with [18F]JNJ-64413739 after PBS (control, 5 µL) versus 20 µg LPS (in 5 µL PBS) local injection into striatum
PBS Rat 1, control
Day 1
Day 2
Day 3
LPS Rat 2 LPS Rat 3
1.0 SUV 0

18
P2X7R PET imaging with [18F]JNJ-64413739 after PBS (control, 5 µL) versus 20 µg LPS (in 5 µL PBS) local injection into striatum
PBS Rat 1, control
Day 1
Day 2
Day 3
LPS Rat 2 LPS Rat 3
1.0 SUV 0
0.90
0.95
1.00
1.05
1.10
1.15
1.20
1.25
1.30
Day 1 Day 2 Day 3
SUVR
(inj
ecte
d st
riatu
m /
cont
rol s
tria
tum
)
Day post injection
P2X7R PET [18F]JNJ-739 (20 µg LPS vs PBS)
SUVR Rat 2 LPS SUVR Rat 3 LPS SUVR Rat 1 PBS
16

LPS Rat5, Day 2 (baseline) LPS Rat1, Day 2 (JNJ, 2.25 mg/kg, 10 min
pretreatment) 2.0 SUV
0
Images: Sum from 10 to 60 min
TIME (minutes)
Vehicle; N=5; 2 days post-LPS (20 µg) injection pre-treated 10 min w/ vehicle
SUV
TIME (minutes)
SUV
Blocking; N=5; 2 days post-LPS (20 µg) injection pre-treated 10 min w/ JNJ (2.25 mg/kg)
[18F]JNJ-64413739 P2X7R PET Blocking Experiments: LPS Rat Model (20 µg, 2 days post-injection), baseline (left) vs. blocking (right) with JNJ (2.25 mg/kg, 10 min pre-treat)
18

0 20 40 600
0.5
1
1.5
TIME (minutes)
Vehicle; N=5; 2 days post-LPS (20 µg) injection pre-treated 10 min w/ vehicle
SUV
0 20 40 600
0.5
1
1.5
TIME (minutes)
SUV
Blocking; N=5; 2 days post-LPS (20 µg) injection pre-treated 10 min w/ JNJ (2.25 mg/kg)
Control Side
JNJ “blocking” Vehicle
Injected Side Control Side Injected Side
p = 0.06
* p = 0.04
SUVR
(ref
: cer
ebel
lum
)
[18F]JNJ-64413739 P2X7R PET Blocking Experiments: LPS Rat Model (20 µg, 2 days post-injection), baseline (left) vs. blocking (right) with JNJ (2.25 mg/kg, 10 min pre-treat)
19

0 20 40 600
0.5
1
1.5
SUV
Chasing w/ JNJ (2.25 mg/kg); N=5; LPS (20 µg), 2 days post-injection
TIME (minutes)
JNJ, 2.25 mg/kg
0 20 40 600
0.5
1
1.5
TIME (minutes)
SUV
Chasing w/ Vehicle; N=5; LPS (20 µg), 2 days post-injection
Vehicle
[18F]JNJ-64413739 P2X7R PET Blocking Experiments: Chasing with JNJ (2.25 mg/kg); 2 days post LPS injection (20 µg)
Chasing (25 min p.i.) with JNJ (2.25 mg/kg):
• Reduced tracer retention relative to vehicle chase.
• “Relative SUV drop” = SUV (25min) – SUV (60min), normalized to SUV (25min); Significantly higher drop in “chase” vs vehicle (injected side: 30% vs 10%, p = 0.002, t-test; control side: 26% vs 4%, p = 0.003).
20

22
Summary: [18F]JNJ-64413739 for P2X7 PET Imaging
• Non-Human Primate Results: • No “true” reference region (devoid of P2X7) in the brain could be identified, but a
blood input function can be used to quantify the signal.
• Target occupancy is reproducible in 2 different NHPs: Monkeys showed very similar tracer uptake at baseline and the 2.5 mg/kg dose level.
• Non-specific binding in healthy NHP is approx. 40-45% (as estimated by the receptor occupancy plateau of 55-60%); this matches rodent data.
• Neuroinflammation Rat Imaging Results: • Time dependent [18F]JNJ-64413739 PET signal: strongest on day 2 post injection,
20% higher in LPS versus PBS control.
• Statistically significant blocking of [18F]JNJ-64413739 PET signal by cold JNJ on the LPS side, but not the contralateral side.
• Agreement with IBA1 immunostaining.
• Summary P2X7R PET: • [18F]JNJ-64413739 PET shows promise as an imaging agent for measuring target
engagement of P2X7R therapeutics.
• [18F]JNJ-64413739 may be useful to image neuroinflammation, but the lack of a reference region hampers image analysis (similar to TSPO).

23
Acknowledgements
Biology Anindya Bhattacharya Brian Lord Hong Ao Qi Wang Lawrence Fourgeaud
Chemistry Nicholas Carruthers Michael Letavic Christa Chrovian Xiaohu Deng
CDT Marc Ceusters Mark Schmidt Anja Kimpe Peter De Boer Kristof Dubois
KULeuven Guy Bormans Joost Verbeek Michel Koole Sofie Celen
NS Biomarker Hartmuth Kolb Tamara Berdyyeva Anna Xia Greg Chen Wei Zhang Chaofeng Huang Katrin Szardenings MNI
Gilles Tamagnan Oliver Barret Cristian Constantinescu Discovery Sciences Ignacio Andres