Embed Size (px)
Citation preview
Derek J. QuadeGlenn Research Center, Cleveland, Ohio
Sadhan C. JanaThe University of Akron, Akron, Ohio
Linda S. McCorkleOhio Aerospace Institute, Brook Park, Ohio
Infl uence of Thin-Film Adhesives in Pullout Tests Between Nickel-Titanium Shape MemoryAlloy and Carbon Fiber-Reinforced PolymerMatrix Composites
NASA/TM—2018-219747
February 2018
https://ntrs.nasa.gov/search.jsp?R=20180001850 2018-06-23T11:11:35+00:00Z
NASA STI Program . . . in Profi le
Since its founding, NASA has been dedicated to the advancement of aeronautics and space science. The NASA Scientifi c and Technical Information (STI) Program plays a key part in helping NASA maintain this important role.
The NASA STI Program operates under the auspices of the Agency Chief Information Offi cer. It collects, organizes, provides for archiving, and disseminates NASA’s STI. The NASA STI Program provides access to the NASA Technical Report Server—Registered (NTRS Reg) and NASA Technical Report Server—Public (NTRS) thus providing one of the largest collections of aeronautical and space science STI in the world. Results are published in both non-NASA channels and by NASA in the NASA STI Report Series, which includes the following report types: • TECHNICAL PUBLICATION. Reports of
completed research or a major signifi cant phase of research that present the results of NASA programs and include extensive data or theoretical analysis. Includes compilations of signifi cant scientifi c and technical data and information deemed to be of continuing reference value. NASA counter-part of peer-reviewed formal professional papers, but has less stringent limitations on manuscript length and extent of graphic presentations.
• TECHNICAL MEMORANDUM. Scientifi c
and technical fi ndings that are preliminary or of specialized interest, e.g., “quick-release” reports, working papers, and bibliographies that contain minimal annotation. Does not contain extensive analysis.
• CONTRACTOR REPORT. Scientifi c and technical fi ndings by NASA-sponsored contractors and grantees.
• CONFERENCE PUBLICATION. Collected papers from scientifi c and technical conferences, symposia, seminars, or other meetings sponsored or co-sponsored by NASA.
• SPECIAL PUBLICATION. Scientifi c,
technical, or historical information from NASA programs, projects, and missions, often concerned with subjects having substantial public interest.
• TECHNICAL TRANSLATION. English-
language translations of foreign scientifi c and technical material pertinent to NASA’s mission.
For more information about the NASA STI program, see the following:
• Access the NASA STI program home page at http://www.sti.nasa.gov
• E-mail your question to [email protected] • Fax your question to the NASA STI
Information Desk at 757-864-6500
• Telephone the NASA STI Information Desk at 757-864-9658 • Write to:
NASA STI Program Mail Stop 148 NASA Langley Research Center Hampton, VA 23681-2199

Derek J. QuadeGlenn Research Center, Cleveland, Ohio
Sadhan C. JanaThe University of Akron, Akron, Ohio
Linda S. McCorkleOhio Aerospace Institute, Brook Park, Ohio
Infl uence of Thin-Film Adhesives in Pullout Tests Between Nickel-Titanium Shape MemoryAlloy and Carbon Fiber-Reinforced PolymerMatrix Composites
NASA/TM—2018-219747
February 2018
National Aeronautics andSpace Administration
Glenn Research CenterCleveland, Ohio 44135

Acknowledgments
Special thanks go out to Dr. Othmane Benefan of the NASA Glenn Research Center for assistance with NiTi shape memory alloys, Dr. Paria Naghipour Ghezeljeh of the Ohio Aerospace Institute for assistance in implementation of the Isobaric NiTi SMA UMAT, as well as Dr. James Wu of Dassault Systemes Simulia Corp for assistance in constructing the models for pullout testing within ABAQUS.
Available from
Trade names and trademarks are used in this report for identifi cation only. Their usage does not constitute an offi cial endorsement, either expressed or implied, by the National Aeronautics and
Space Administration.
Level of Review: This material has been technically reviewed by technical management.
NASA STI ProgramMail Stop 148NASA Langley Research CenterHampton, VA 23681-2199
National Technical Information Service5285 Port Royal RoadSpringfi eld, VA 22161
703-605-6000
This report is available in electronic form at http://www.sti.nasa.gov/ and http://ntrs.nasa.gov/
This work was sponsored by the Integrated Aviation Systems Program at the NASA Glenn Research Center.

NASA/TM—2018-219747 1
Influence of Thin-Film Adhesives in Pullout Tests Between Nickel-Titanium Shape Memory Alloy and Carbon
Fiber-Reinforced Polymer Matrix Composites
Derek J. Quade National Aeronautics and Space Administration
Glenn Research Center Cleveland, Ohio 44135
Sadhan C. Jana
The University of Akron Akron, Ohio 44325
Linda S. McCorkle
Ohio Aerospace Institute Brook Park, Ohio 44142
Summary Strips of nickel-titanium (NiTi) shape memory alloy (SMA) and carbon fiber-reinforced polymer
matrix composite (PMC) were bonded together using multiple thin-film adhesives and their mechanical strengths were evaluated under the pullout test configuration. Tensile and lap shear tests were conducted to confirm the deformation of SMAs at room temperature and to evaluate the adhesive strength between the NiTi strips and the PMC. Optical and scanning electron microscopy (SEM) techniques were used to examine the interfacial bonding after failure. Simple equations on composite tensile elongation were used to fit the experimental data on tensile properties. ABAQUS models were generated to show the effects of enhanced bond strength and the distribution of stress in the SMA and PMC. The results revealed that the addition of thin-film adhesives increased the average adhesive strength between the SMA and PMC while halting the room temperature shape memory effect (SME) within the pullout specimen.
1.0 Introduction Polymeric materials embedded with shape memory alloys (SMAs) have been an active branch of
materials research in the past several years. This is due to the SMAs ability to actively produce stresses in response to changes in thermal or resistive input while embedded within composite structures. Fundamental investigations in this area began with characterization of nickel-titanium (NiTi) wires and strips within a multitude of composites during activation (Refs. 1 to 4). Further studies looked at the dynamics of SMA activation within composites, including three-point-bend and beam analysis (Ref. 5) and debonding during activation (Ref. 6), along with twisting and bending in simple and advanced composite structures (Refs. 7 to 9). The ability to change shape due to resistive or thermal stimuli has also opened up new areas of research due to their immediate applications as hybrid actuators or adjustable composites (Refs. 9 to 11). It is imperative that the adhesive strengths between the SMA and the polymer matrix are optimized before these types of hybrid composites are fabricated and deployed.
The chemical incompatibility of SMAs and polymers warrants special consideration when evaluating adhesion properties. Neuking (Ref. 12) focused on a variety of elementary surface treatments of SMA and polyamide-type polymers to obtain the desired strength of adhesion. For example, NiTi strips were subjected to cleaning and interlayer surface modification processes via mechanical, chemical, and physical means before embedding the treated strips within the injection molded polyamide coupons. The results showed that combinations of sequential mechanical treatments by grinding and polishing, chemical treatments by electropolishing and application of coupling agents, and physical plasma

NASA/TM—2018-219747 2
treatments prepare surfaces well and can significantly improve the adhesive strength. Pullout tests with optimized surface treatments produced adhesive strengths of approximately 9 MPa, while inferior surface treatment techniques produced adhesive strengths well below 0.5 MPa.
Smith (Ref. 13) established chemical bonds between the metal and polymer parts using silane coupling agents and obtained improved adhesion between NiTi and polymethyl methacrylate (PMMA). For this purpose, NiTi wires were treated with three separate silane coupling agents, 3-acryloxypropyltrichlorosilane (APTS), trimethoxysylylpropylmethacrylate (MPS) and n-octyltrichlorosilane (OTS) in the hopes of producing a chemical bond between NiTi and PMMA. X-ray photoelectron spectroscopy and pullout tests were performed in order to determine the bond strength between NiTi and PMMA. The above work showed that the use of silane coupling agents increased adhesion between NiTi and the polymer matrix by 100 percent. Calcagno (Ref. 14) evaluated the bonding of Ti and NiTi strips within a variety of polymers using pullout tests. Titanium and NiTi strips were embedded within polycarbonate, polypropylene, and high-density polyethylene. Results showed that bond strengths between polycarbonate and NiTi or Ti were similar, while the bond strength was higher between polypropylene and Ti and between high-density polyethylene and NiTi.
It is noted that prior research looked at the optimization of adhesion in a set of specific systems and that a general understanding of the adhesive bonding is not available. In this context, an average adhesive strength can be defined as the amount of force necessary to debond a unit area between two dissimilar materials. This general definition allows the use of a variety of different geometries and materials. The base case, although not standardized, usually consists of a NiTi wire or a strip typically adhesively bonded to a polymeric material and subjected to pullout tests.
The goal of the present research was to develop better understanding of how the addition of thin-film adhesives affects the deformation behavior of SMAs within the composites and how such deformation behavior influences the pullout strength. Another objective was to determine an effective adhesive that can increase the strength of the bond between NiTi and a carbon fiber-based polymer matrix composite (PMC). The composites were evaluated via tensile, pullout, and lap shear tests. Pullout tests consisted of a thin strip of NiTi placed between the layers of PMC composite materials. The lap shear tests consisted of thin strips of NiTi and PMC material bonded together with and without the adhesives. The tensile tests considered strips of SMA or PMC of the same size as was used in pullout and lap shear tests. The pullout and lap shear tests were conducted with three groups of composite materials. In the first group, the specimens were fabricated without an adhesive while the epoxy phase within the PMC provided bonding. In the second and third groups, thin-film adhesives of two different kinds were used to obtain enhanced bonding between the SMA and PMC.
2.0 Experimental Techniques 2.1 Bonding Scenarios
Different bonding scenarios were pursued in this study for the pullout and lap shear tests. First, the bonding between the NiTi strip and epoxy matrix within the PMC was evaluated as baseline data. Next, two different adhesives were used in order to enhance the bonding between the NiTi strip and the epoxy matrix within the PMC.
2.2 Materials and Fabrication
Flat, annealed, untrained NiTi sheets with an adhesive film (AF) > 95 °C were supplied by Johnson Matthey, measuring 457.2 mm long by 101.6 mm wide by 0.127 mm thick. Individual strips were cut from the stock materials into strips 152.4 mm long by 6.35 mm wide, wiped with acetone, and dried before deployment within the PMC. The PMC used for this purpose was a HexPly® 8552/IM7 epoxy prepreg (Hexcel®) (Ref. 15). A schematic of the pullout and lap shear layups is presented in Figure 1. For pullout tests, five plies of 0° PMC material were used, with the third internal ply having a section

NASA/TM—2018-219747 3
removed for insertion of the NiTi strip. For Specimen A (Table I), no adhesive was placed between the NiTi strip and PMC while Specimens B and C contained Hysol® EA9696 (Henkel Corporation Aerospace Group) (Ref. 16) and FM® 377U adhesives (Cytec Solvay Group), respectively (Ref. 17). Once the specimens were assembled, the parts were cured in an autoclave according to the conditions set by Hexcel® for 8552/IM7 epoxy matrix materials (Ref. 15). The 176 °C cure of the PMC material also allowed for simultaneous curing of the Hysol® EA9696 adhesive (121 °C) and FM® 377U adhesive (176 °C). For each group of materials, five separate specimens were fabricated so that mean values and standard deviations could be reported.
Figure 1.—Specimen configuration for (a)
pullout and (b) lap shear tests. PMC, polymer matrix composite; SMA, shape memory alloy.
TABLE II.—TEST MATRIX
Test Adhesive First adherend Second adherend
Sample name
Tensile Lap shear
Pullout PMCa epoxy phase
Hysol® EA9696
FM® 377U
N/A SMAb PMC SMA PMC
A --------- ------- X X ---------- ------ ------ X ------ ------ X B --------- ------- X ------- X ------ ------ X ------ ------ X C --------- ------- X ------- ---------- X ------ X ------ ------ X D X ------- -------- ------- ---------- ------ X X ------ ------ ------ E --------- X -------- ------- X ------ ------ X ------ X ------ F --------- X -------- ------- ---------- X ------ X ------ X ------ G --------- X -------- ------- X ------ ------ X ------ ------ X H --------- X -------- ------- ---------- X ------ X ------ ------ X I --------- X -------- X ---------- ------ ------ X ------ ------ X L X ------- -------- ------- ---------- ------ X -------- X ------ ------ M --------- X -------- ------- ---------- X ------ -------- X ------ X N --------- X -------- ------- X ------ ------ -------- X ------ X
aPolymer matrix composite. bShape memory alloy.
NASA/TM—2018-219747 4
Samples were fabricated in a similar fashion for a single lap shear test. In order to compare the data between pullout and lap shear tests, the same size NiTi strips were used to fabricate lap shear test specimens. NiTi strips were adhered to two plies of HexPly® 8552/IM7 prepreg layed up in the [0] configuration. Once the specimens were assembled, the parts were co-cured in an autoclave according to the conditions set by Hexcel® for 8552/IM7 epoxy matrix materials (Ref. 15). The layout of different components, such as SMA and PMC, in test specimens is shown in Figure 1. In each case, five test specimens were fabricated to obtain mean values and standard deviations of the properties measured.
The NiTi strips were wiped with acetone and dried. The PMC strips used for tensile testing had dimensions similar to the strips used to fabricate lap shear test specimens. The data from five different strips were taken into account to obtain mean and standard deviation values. Before mechanical testing, all specimens were tabbed with E-glass tab material attached via 3M™ Scotch-Weld™ Structural Adhesive Film AF 163-2M film adhesive (3M™) (Ref. 18) for gripping purposes. Tabs were 25.4 by 25.4 mm and attached to the outer edges of NiTi strip and the PMC for pullout and lap shear tests.
2.3 Mechanical Testing
The adhesive bond strength between the NiTi strip and the PMC was evaluated by conducting tensile pullout tests and lap shear tests. Tensile tests were conducted on the SMA and PMC without any film adhesive for baseline data. For adhesively bonded materials, the adhesive force was determined by recording the force per unit area required to fully debond the NiTi strip from PMC.
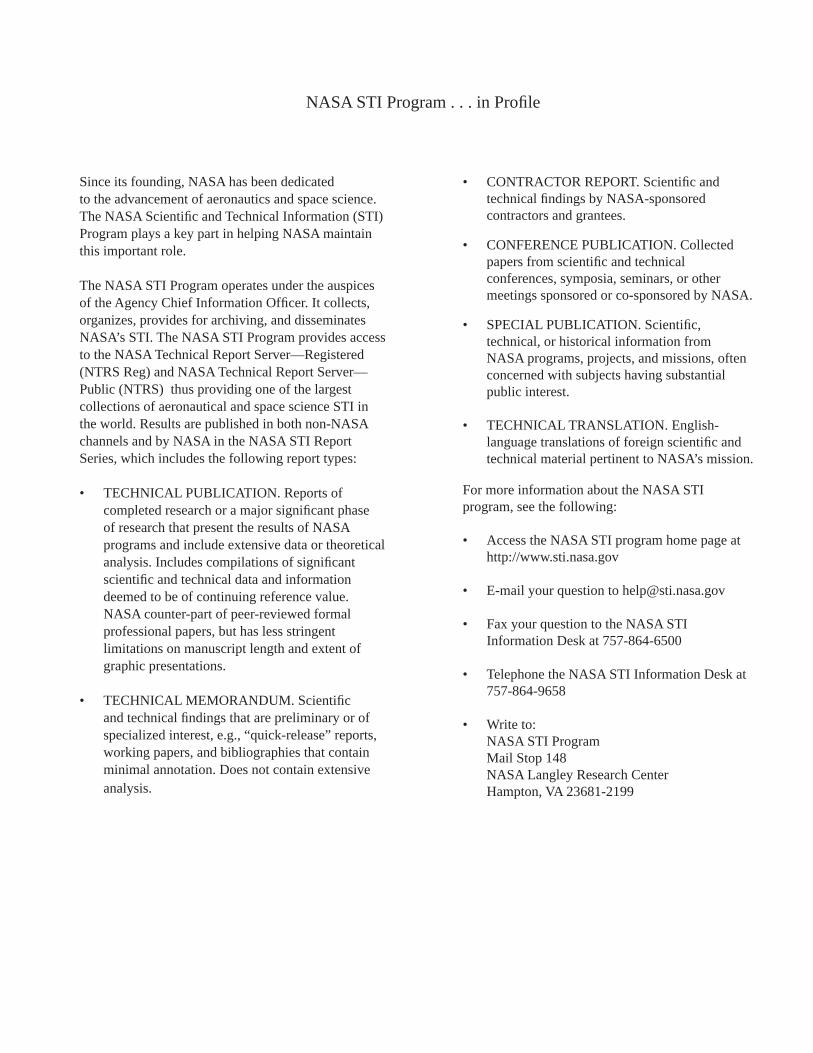
The E-glass tabs were gripped in an Instron® 4505 (Instron® Corporation) testing system running the MTS Testworks® (MTS Systems Corporation) software suite. Samples were pulled apart at a constant rate of 5 mm/min until failure occurred, as shown in Figure 2. The data acquisition rate within the Testworks® software was kept at 10 Hz. After mechanical testing, all samples were examined via optical and scanning electron microscopy (SEM). Optical microscopy was performed on an Olympus Macroscope DFC295 utilizing the Leica Application Suite Software, while SEM was performed on a Hitachi S-4700. SEM specimens were platinum coated, with imagery conducted at a working distance of approximately 11 mm and voltages of 6 kV.
Figure 2.—Test setup.

NASA/TM—2018-219747 5
3.0 Results 3.1 Results of Mechanical Testing
A test matrix of all specimens for tensile, pullout, and lap shear tests is shown in Table II. Samples A to C in Table II correspond to pullout tests while sample D represents the tensile test data of the SMA. Samples E to I consisted of lap shear tests for samples prepared with the adhesives. Sample L consisted of PMC tensile test specimens. Samples M and N consisted of lap shear tests utilizing PMC for both adherends. Figure 3 shows the results of pullout tests between the NiTi and PMC, along with the tensile test data of the SMA.
The pullout test data in Figure 3 indicate three regimes: the first between 0 to 0.5 mm of pullout length, the second between 0.5 and 2.5 mm of pullout length, and the third above 2.5 mm of pullout length. Each regime corresponds to different modulus values. The tensile tests performed with NiTi strips using the same form factor also revealed the same three regimes of modulus. Incidentally, triple moduli results were also apparent from the lap shear tests based on specimens NiTi-NiTi and NiTi-PMC. To confirm that this behavior was solely due to the deformation of NiTi and not from other materials, tensile and lap shear tests of PMC material were also performed. It was found that the triple modulus behavior was absent in specimens that did not contain SMAs.
Figure 3.—Effect of adhesive material on bond strength between the nickel-titanium (NiTi) and polymer matrix
composite. A-1, control (pullout). B-3, Hysol® EA9696 film adhesive (pullout). C-5, FM® 377U film adhesive (pullout). D-1, shape memory alloy tensile.

NASA/TM—2018-219747 6
3.2 Adhesive Bond Strength
The average interfacial strength was calculated in order to compare the data of bonded specimens. This calculation was based on Equation (1)
Yield strengthAverage interfacial strength =Bond area
(1)
Apparent bond strength results are shown in Figure 4. Bond strengths are normalized between different test types due to analysis of the total bonded area within each specimen (with larger bond areas within pullout samples compared to bond areas within lap shear samples).
3.3 Microscopy Results
The effects of various adhesive treatments on the surface morphology of NiTi strips in pullout and lap shear tests were examined via optical and SEM. The specimen sections that underwent failure were examined. Nonbonded sections of NiTi and PMC are labeled clean, while the bonded sections are labeled bonded.
Figure 4.—Average interfacial strength of bonded samples. A series, shape memory alloy-polymer
matrix composite (SMA–PMC) pullout; B series, SMA–PMC Hysol® EA9696 pullout; C series, SMA–PMC FM® 377U pullout; E series, SMA–SMA Hysol® EA9696 lap shear; F series, SMA–SMA FM® 377U lap shear; G series, SMA–PMC Hysol® EA9696 lap shear; H series, SMA–PMC FM® 377U lap shear; I series, SMA–PMC control lap shear; M series, PMC–PMC FM® 377U lap shear; and N series, PMC–PMC Hysol® EA9696 lap shear.

NASA/TM—2018-219747 7
3.3.1 Optical Microscopy Figure 5 shows the state of specimens in bonded areas. Images (a) and (b) present a magnified view
of the bonded area of an SMA–SMA lap shear specimen bonded with Hysol® EA9696 and FM® 377U adhesives, respectively. Images in Figure 5(c) and (d) correspond to the bonded area between the SMA–PMC lap shear specimen bonded with Hysol® EA9696 adhesive, while images in Figure 5(e) and (f) represent the bonded area between the SMA–PMC lap shear bonded with FM® 377U adhesive. Images in Figure 5(g), (h), and (i) present magnified views of the pullout areas for specimens A-1, B-1, and C-3.
Figures 5(a) and (b) show the results of lap shear bonding between two strips of SMA; the majority of adhesive remains on one section of SMA while cleanly breaking from the opposing SMA strip. There was little difference in the bond preference whether Hysol® EA9696 or FM® 377U adhesive was the bonding agent. Images in Figure 5(c) and (d) show that the inner section of Hysol® EA9696 adhesive remained attached to the SMA, while the outer bond area remained attached to the PMC material in a lap shear test specimen. Images in Figure 5(e) and (f) show an opposing effect; the majority of FM® 377U adhesive remains attached to the PMC strip while cleanly breaking from the SMA strip in a lap shear test. Images in Figure 5(g), (h), and (i) show the exposed areas of SMA when pulled out of the PMC section. In each specimen, the SMA revealed very little adhesive material left when pulled out of the PMC. This indicates a strong preference for bonding with the PMC material in a pullout test no matter which adhesive was used.
Figure 5.—Optical microscopy of bonded areas. (a) Shape memory alloy (SMA)–SMA Hysol® EA9696 lap shear.
(b) SMA–SMA FM® 377U lap shear. (c) SMA-polymer matrix composite (PMC) Hysol® EA9696 lap shear. (d) SMA–PMC Hysol® EA9696 lap shear. (e) SMA–PMC FM® 377U lap shear. (f) SMA–PMC FM® 377U lap shear. (g) Control pullout. (h) Hysol® EA9696 pullout. (i) FM® 377U pullout.

NASA/TM—2018-219747 8
3.3.2 Scanning Electron Microscopy (SEM) Figure 6 shows a set of SEM images of clean (unbonded) and bonded specimens from the pullout
tests (A to C).
Figure 6.—Scanning electron microscopy. (a) Clean shape memory alloy (SMA) area from
pullout test A. (b) Bonded SMA area from pullout test A. (c) Clean SMA area from pullout test B. (c) Bonded SMA area from pullout test B. (e) Clean SMA area from pullout test C. (f) Bonded SMA area from pullout test C.

NASA/TM—2018-219747 9
Figure 7 shows comparative SEM images of clean and bonded SMA samples from the lap shear tests (G to I).
Figure 7.—Scanning electron microscopy. (a) Clean shape memory alloy (SMA) area from lap
shear test G. (b) Bonded SMA area from lap shear test G. (c) Clean SMA area from lap shear test H. (d) Bonded SMA area from lap shear test H. (e) Clean SMA area from lap shear test I. (f) Bonded SMA area from lap shear test I.
NASA/TM—2018-219747 10
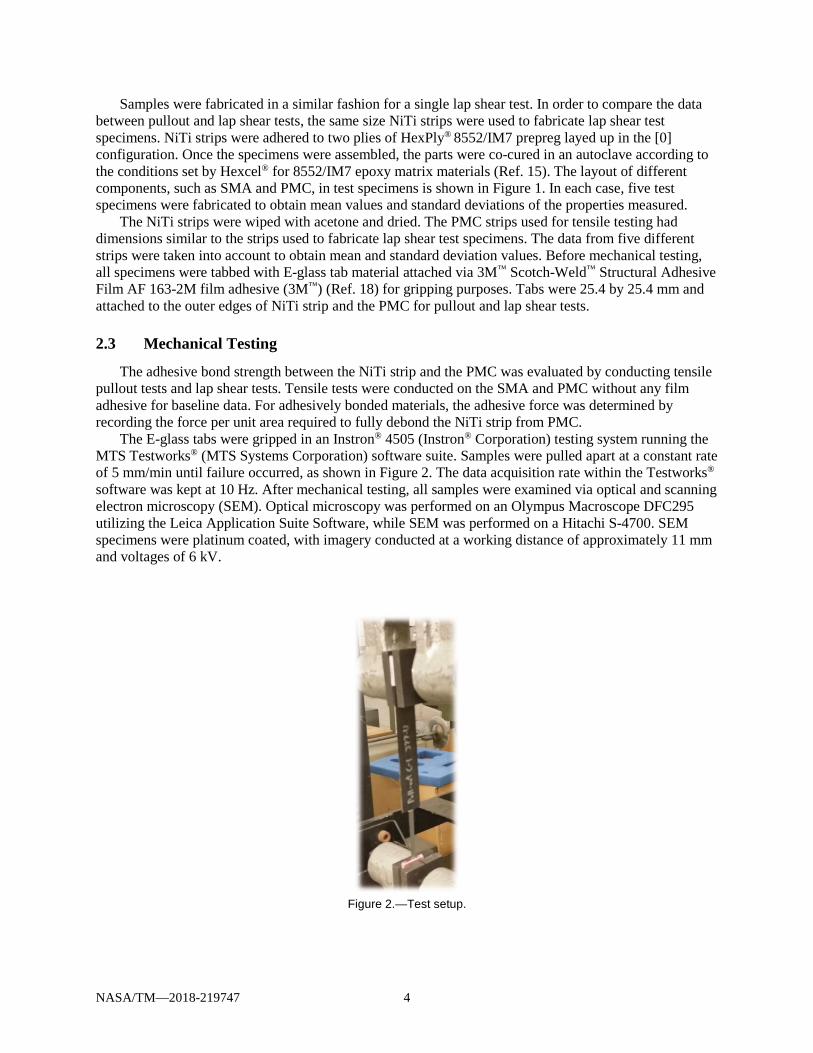
Figure 8 shows a comparison of SEM images of clean and bonded PMC samples from the lap shear tests (G to I).
Figure 8.—Scanning electron microscopy. (a) Clean polymer matrix composite (PMC) area from
lap shear test G. (b) Bonded PMC area from lap shear test G. (c) Clean PMC area from lap shear test H. (d) Bonded PMC area from lap shear test H. (e) Clean PMC area from lap shear test I. (f) Bonded PMC area from lap shear test I.

NASA/TM—2018-219747 11
4.0 Analysis The mechanical test data were analyzed using a simple composite model.
4.1 Equation Modification
A theoretical model was developed based on the work done by Xiao, Foss, and Schroeder (Ref. 19) in order to see the effect of multiple materials on the overall moduli of the composite specimens. In the research of Xiao, Foss, and Schroeder (Ref. 19), the stiffness of double lap shear joints was analyzed computationally and via finite element modeling (FEM). While the samples fabricated for pullout testing in this study were not simple lap shear joints, the model of Xiao, Foss, and Schroeder can still be used due to a minimal difference in the bonding area (less than 2.2 percent).
4.2 Specimen Section Analysis
The analysis of double lap shear specimens starts with the constituent individual layers and the adhesive material. This includes the NiTi, PMC, and the epoxy phase of PMC as well as Hysol® EA9696 and FM® 377U adhesives. Figure 9 shows a sketch of the double lap shear test specimen with respective specimen dimensions.
The central and outer adherends have width (b), thickness (t), and Young’s modulus in the axial (x) direction (E). The central adhesive has thickness (ta) and adhesive shear modulus (G). The total axial force acting on the pullout specimen is F, while the total axial displacement of the pullout specimen is Δu. The total axial displacement (Δu) can be broken down into three parts: displacement Δu1 represents the motion of the central adherend (NiTi), displacement Δu2 represents the motion of the dual “outer” adherend material (PMC), and displacement Δu3 represents the motion of the adhesive material used for bonding by epoxy or Hysol® EA9696 or FM® 377U adhesive.
Figure 9.—Double lap shear test model used for numerical analysis. Copyright 2003
Elsevier Ltd. Used with permission.
NASA/TM—2018-219747 12
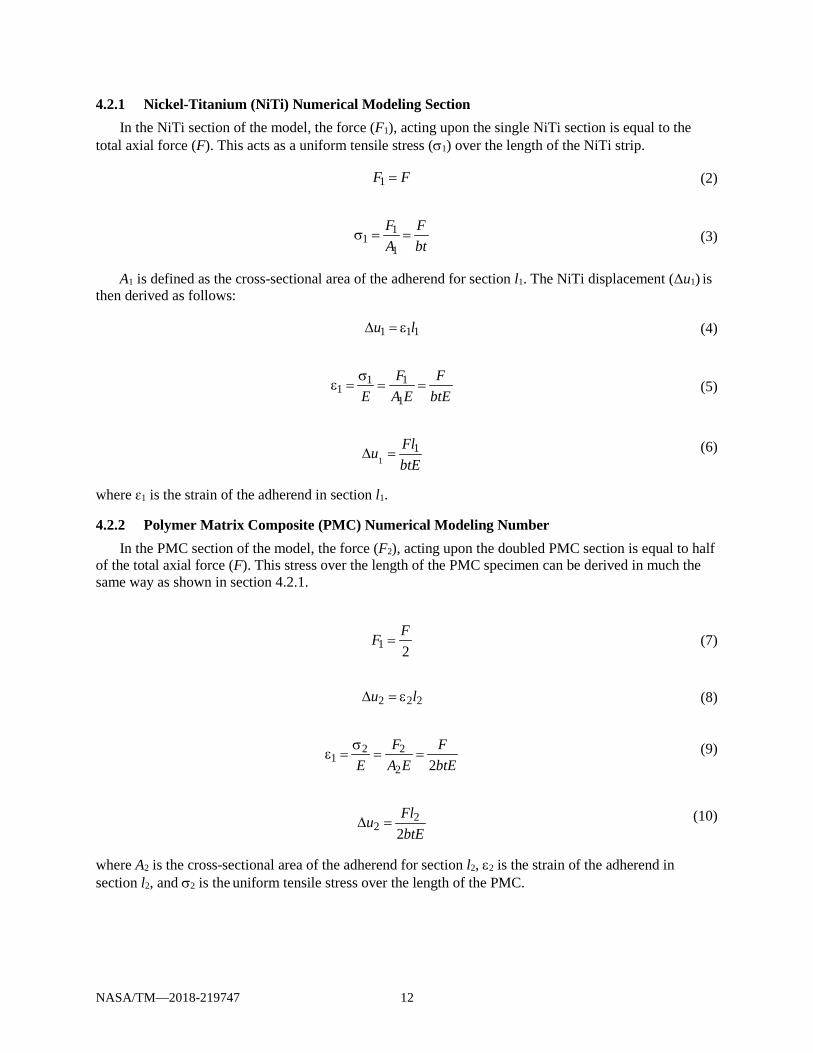
4.2.1 Nickel-Titanium (NiTi) Numerical Modeling Section In the NiTi section of the model, the force (F1), acting upon the single NiTi section is equal to the
total axial force (F). This acts as a uniform tensile stress (σ1) over the length of the NiTi strip.
1F F= (2)
11
1
F FA bt
σ = = (3)
A1 is defined as the cross-sectional area of the adherend for section l1. The NiTi displacement (Δu1) is then derived as follows:
1 1 1u l∆ = ε (4)
1 11
1
F FE A E btEσ
ε = = = (5)
11Flu
btE∆ = (6)
where ɛ1 is the strain of the adherend in section l1.
4.2.2 Polymer Matrix Composite (PMC) Numerical Modeling Number In the PMC section of the model, the force (F2), acting upon the doubled PMC section is equal to half
of the total axial force (F). This stress over the length of the PMC specimen can be derived in much the same way as shown in section 4.2.1.
1 2FF = (7)
2 2 2u l∆ = ε (8)
2 21
2 2F F
E A E btEσ
ε = = = (9)
22 2
FlubtE
∆ = (10)
where A2 is the cross-sectional area of the adherend for section l2, ε2 is the strain of the adherend in section l2, and σ2 is the uniform tensile stress over the length of the PMC.

NASA/TM—2018-219747 13
4.2.3 Adhesive Numerical Modeling Section In the adhesive section of the pullout model, the force (F3) acting upon the pullout sample can be
divided into the tensile deformation of the adhesive along with the shear deformation of the adhesive. Xiao, Foss, and Schroeder (Ref. 19) utilized the average shear stress (τave) for the first part of the adhesive section analysis shown below.
3 2FF = (11)
3ave
3 32F FA bl
τ = = (12)
where A3 is the cross-sectional area of the adhesive for section l3. The axial displacement of the adhesive (∆u3s) due to shear deformation is presented in Equation (13).
3s au t∆ = γ (13)
ave 3
3 32F F
G A G bl Gτ
γ = = = (14)
332saFtu
bl G∆ = (15)
where γ is the shear strain of the adhesive. Next is the deformation of the substrates due to tensile forces. In the overlap section, the force applied
to the substrate pieces is simplified by using an average force as presented in Equation (16).
3 2FF = (16)
The overall displacement due to tensile force in a single leg section (∆u3t) is shown in Equation (17).
33 2t
FlubtE
∆ = (17)
This leads to Equations (18) and (19), thus describing the total axial displacement (∆u) due to total axial force (F).
1 2 3 3s tu u u u u∆ = ∆ + ∆ + ∆ + ∆ (18)
1 2 3
32 2 2aFl Fl Ft Flu
btE btE bl G btE∆ = + + + (19)

NASA/TM—2018-219747 14
From this point forward, the derivation of the displacement deviates from that of Xiao, Foss, and Schroeder (Ref. 19). In the paper of Xiao, Foss, and Schroeder (Ref. 19), the only simplifications made are in the length sections (i.e., 1 2l l= ). The following assumptions are made for the present study:
sma pmcE E≠ (20)
1 2 3l l l L= = = (21)
at t T= (22)
where Esma is the modulus of the SMA and Epmc is the modulus of the PMC. That is, the modulus of the NiTi is not equal to the modulus of the PMC, all three lengths used for
this study are the same, and the thickness of the adhesive and the adherends utilized in this study are nearly identical. This simplifies the final displacement equation to the form presented in Equation (23).
2
2sma pmc adh
3 12FL TubT E E L G
∆ = + +
(23)
where Gadh is the adhesive shear modulus of either the epoxy or Hysol® EA9696 or FM® 377U adhesive. A linear elastic model is used for this work; like the research of Xiao, Foss, and Schroeder (Ref. 19) research, the focus of this analysis is on how failure occurs within the adhered region of the specimen. A simplified linear elastic model allows a view of how the adhesive affects the bond strength and failure, as opposed to more complex forces within the PMC or SMA sections.
Equation (23) will be used for curve fitting of the mechanical test data. Similar derivation can be made for the single lap shear model, resulting in a final equation as presented in Equation (24).
2
2sma pmc adh
2 1FL TubT E E L G
∆ = + +
(24)
As was seen in experimental data presented in Figure 3, the triple moduli effect attributed to the change in the modulus of the NiTi at different strains would influence the above analysis. The value of Esma will be substituted at appropriate sections in order to better match the experimental test data.
4.3 Curve Fitting
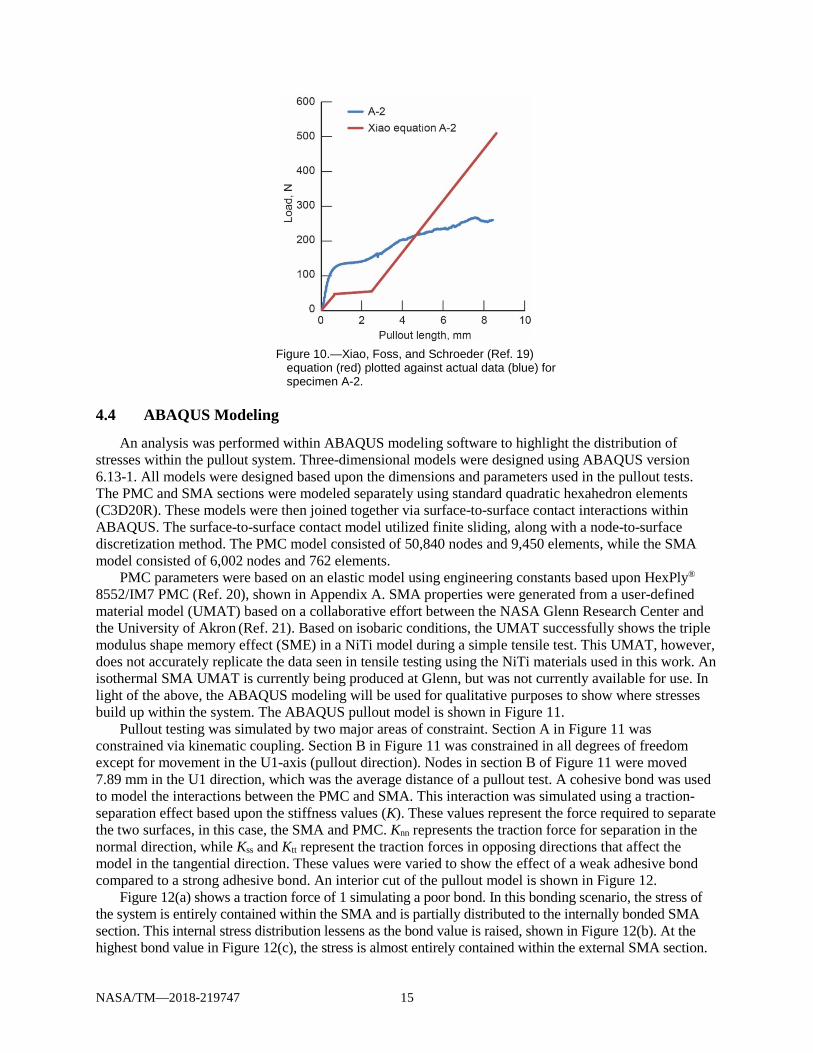
The data for specimens that utilized both PMC and NiTi as the adherends were plotted against curve-fitted data based the calculations of Xiao, Foss, and Schroeder (Ref. 19), specimen A-2 is shown in Figure 10. The line in blue is the original mechanical test data previously shown in Figure 3, while the line in red is the modified displacement equation based on Equation (23).
Figure 10 shows that the equations of Xiao, Foss, and Schroeder (Ref. 19) are inadequate for prediction of the pullout tests conducted in this study.
NASA/TM—2018-219747 15
Figure 10.—Xiao, Foss, and Schroeder (Ref. 19)
equation (red) plotted against actual data (blue) for specimen A-2.
4.4 ABAQUS Modeling
An analysis was performed within ABAQUS modeling software to highlight the distribution of stresses within the pullout system. Three-dimensional models were designed using ABAQUS version 6.13-1. All models were designed based upon the dimensions and parameters used in the pullout tests. The PMC and SMA sections were modeled separately using standard quadratic hexahedron elements (C3D20R). These models were then joined together via surface-to-surface contact interactions within ABAQUS. The surface-to-surface contact model utilized finite sliding, along with a node-to-surface discretization method. The PMC model consisted of 50,840 nodes and 9,450 elements, while the SMA model consisted of 6,002 nodes and 762 elements.
PMC parameters were based on an elastic model using engineering constants based upon HexPly® 8552/IM7 PMC (Ref. 20), shown in Appendix A. SMA properties were generated from a user-defined material model (UMAT) based on a collaborative effort between the NASA Glenn Research Center and the University of Akron (Ref. 21). Based on isobaric conditions, the UMAT successfully shows the triple modulus shape memory effect (SME) in a NiTi model during a simple tensile test. This UMAT, however, does not accurately replicate the data seen in tensile testing using the NiTi materials used in this work. An isothermal SMA UMAT is currently being produced at Glenn, but was not currently available for use. In light of the above, the ABAQUS modeling will be used for qualitative purposes to show where stresses build up within the system. The ABAQUS pullout model is shown in Figure 11.
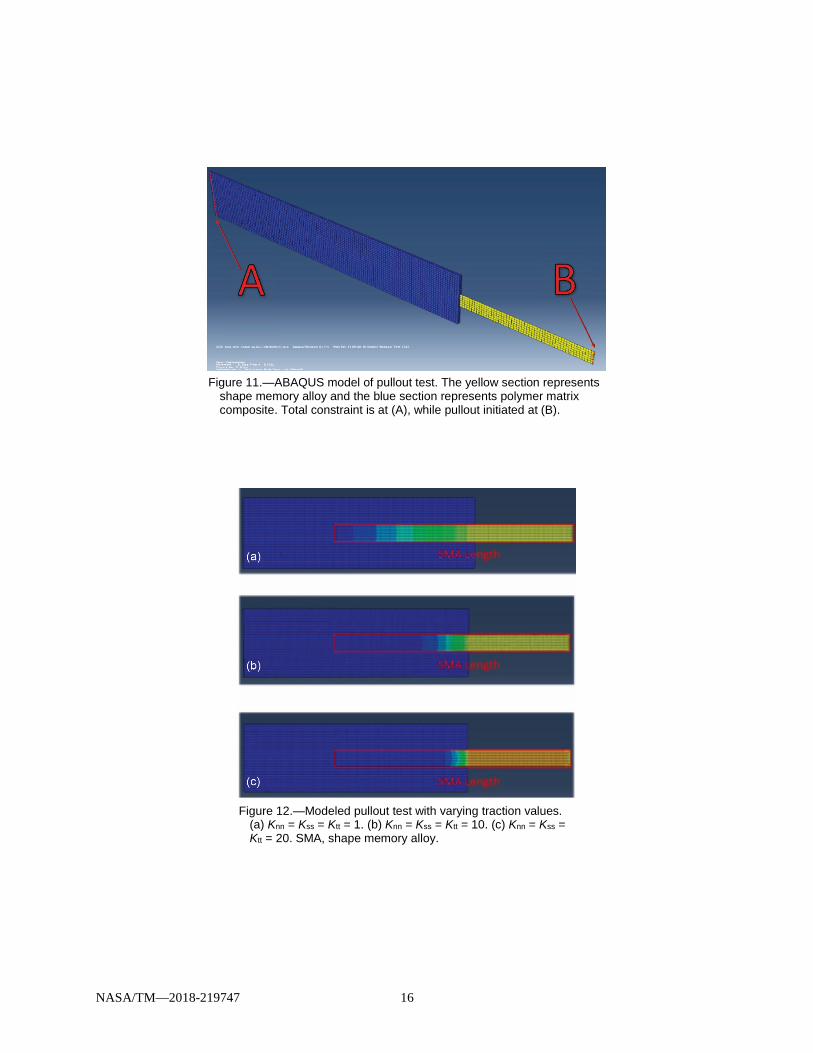
Pullout testing was simulated by two major areas of constraint. Section A in Figure 11 was constrained via kinematic coupling. Section B in Figure 11 was constrained in all degrees of freedom except for movement in the U1-axis (pullout direction). Nodes in section B of Figure 11 were moved 7.89 mm in the U1 direction, which was the average distance of a pullout test. A cohesive bond was used to model the interactions between the PMC and SMA. This interaction was simulated using a traction-separation effect based upon the stiffness values (K). These values represent the force required to separate the two surfaces, in this case, the SMA and PMC. Knn represents the traction force for separation in the normal direction, while Kss and Ktt represent the traction forces in opposing directions that affect the model in the tangential direction. These values were varied to show the effect of a weak adhesive bond compared to a strong adhesive bond. An interior cut of the pullout model is shown in Figure 12.
Figure 12(a) shows a traction force of 1 simulating a poor bond. In this bonding scenario, the stress of the system is entirely contained within the SMA and is partially distributed to the internally bonded SMA section. This internal stress distribution lessens as the bond value is raised, shown in Figure 12(b). At the highest bond value in Figure 12(c), the stress is almost entirely contained within the external SMA section.
NASA/TM—2018-219747 16
Figure 11.—ABAQUS model of pullout test. The yellow section represents
shape memory alloy and the blue section represents polymer matrix composite. Total constraint is at (A), while pullout initiated at (B).
Figure 12.—Modeled pullout test with varying traction values.
(a) Knn = Kss = Ktt = 1. (b) Knn = Kss = Ktt = 10. (c) Knn = Kss = Ktt = 20. SMA, shape memory alloy.

NASA/TM—2018-219747 17
5.0 Discussion The intent of this research was to better understand the bond between the SMA and PMC in a pullout
test along with how the addition of thin-film adhesives can improve that bond. The results from this testing did not match typical results reported in prior research (Refs. 1 to 11). Instead of adhesive failure between the NiTi and PMC, the pullout tests in this research showed that the SMA itself contributed to the varied modulus as function of pullout strains. The triple modulus is a product of the SME within a typical NiTi SMA (Ref. 22). An example of this process is shown in Figure 13, inspired by Saleeb, Padula, and Kumar (Ref. 21).
Starting from the initial phase (point A), the stress-free cooling of NiTi austenite below the forward transformation temperatures (As and Af) results in the formation of twinned martensite at point B. When the applied stress exceeds the start stress level (σs), a reorientation or detwinning process is initiated. In this process, the growth of favorably oriented martensitic variants increases, resulting in a stress level that is far lower than the permanent plastic yield stress of martensite. This detwinning process completes itself at a final stress level (σf), signaling the end of the plateau of the martensitic reorientation process. Any deformation past the final stress level is retained in the detwinned martensitic state. Heating the NiTi without added stress above As (point E, Figure 13) will result in reverse transformation, and eventually the NiTi will return to the original state. This process explains the triple moduli effect seen in the pullout tests performed in this study. However, comparison of the pullout loading results with a tensile test data of the NiTi shows considerable differences. These results are shown in Figure 3.
In comparing the SMA tensile curve to the pullout and lap shear test curves, two differences are observed. First, the detwinning plateau for the tensile curve is much longer than those observed in the pullout tests involving specimens containing an adhesive. Second, the third modulus signaling the end of the reorientation process is vastly different in all of the graphs. A review of the data presented in this paper is shown in order to explain these differences.
The first objective of this research after the pullout tests was to determine if the triple modulus effect was due solely to the first stage SME seen in Figure 13. This was replicated by tensile and lap shear tests, while also compared to pullout data from numerical analysis of expected bond failure via the equations of Xiao, Foss, and Schroeder (Ref. 19).
Figure 13.—Stress-strain-temperature data exhibiting the
shape memory effect for a typical nickel-titanium (NiTi) shape memory alloy.

NASA/TM—2018-219747 18
Tensile test data showed that the triple modulus effect was coming solely from the SMA. This is again shown in the case of lap shear tests, where the PMC bonded to PMC with the two adhesives did not produce the triple modulus effect. The triple modulus was later replicated in lap shear tests involving specimens obtained by bonding SMA with SMA. The numerical analysis via the method of Xiao, Foss, and Schroeder (Ref. 19) shows how adhesive bond failure would typically appear. This data is further modified to match test conditions by applying a variable SMA modulus.
While pullout samples replicated the triple modulus effect, the length of the detwinning plateau (second modulus) is far longer in the tensile test. While the two sets of specimens have the same SMA dimensions, approximately 76.2 mm of the pullout sample SMA is bonded within the PMC. A 25.4-mm tab at the top of the pullout sample attached to the SMA gives a total external SMA length of 50.8 mm, compared to 101.6 mm of SMA for the tensile test. As more material is pulled in tension, a larger number of martensitic variants needed to reorient themselves. This difference in the detwinning plateau length shows that the adhesively bonded SMA and PMC pullout tests were strong enough to halt the martensitic detwinning plateau for all interior SMAs. In contrast, the control pullout test never shows a third modulus. This is explained by analyzing qualitative modeling data alongside load versus displacement graphs.
Figure 14 shows the qualitative poor bond model alongside the nonadhesive pullout test. The bond that develops between the SMA and PMC is strong enough to incur the first and second moduli SME within the SMA. There is a gradual failure between the SMA and PMC before the third modulus can appear. As the SMA material leaves the detwinning stage, the material hardens, resulting in the final modulus seen in the first stage of the SME. As this stage begins, the bond gradually fails throughout the interior bond. This onset of stress within the bond is highlighted by ABAQUS modeling and is the reason for the jagged loading before eventual failure of the pullout specimen.
Figure 14.—Qualitative modeling and load data for nonadhesive pullout test.
PMC, polymer matrix composite; SMA, shape memory alloy.

NASA/TM—2018-219747 19
Figure 15 and Figure 16 show the comparison of the data obtained from qualitative good bond models alongside the adhesive pullout tests.
Figure 15.—Qualitative modeling and load data for B pullout series using Hysol®
EA9696 adhesive.
Figure 16.—Qualitative modeling and load data for C pullout series using FM® 377U
adhesive.

NASA/TM—2018-219747 20
As the detwinning process finalizes and the SMA hardens via the third modulus, the final moduli of the Hysol® EA9696, FM® 377U, and tensile tests all vary dramatically. The good bond ABAQUS model shows that the majority of the stress is carried within the external SMA. When the SMA material is hard enough (after detwinning), the test begins to show failure as is found in a typical pullout test. The failure mode then depends on the shear stress of the adhesive. This behavior is the reason for the steeper slope of the Hysol® EA9696 pullout test (Gadh~43 MPa) (Ref. 16) compared to the FM® 377U pullout test (Gadh~20 MPa) (Ref. 17). This also shows that the addition of the adhesive strengthens the bond between the SMA and PMC, as well as halting the detwinning process within the interior bonded portion of the SMA.
6.0 Conclusion A series of pullout tests using nickel-titanium (NiTi) strips and HexPly® 8552/IM7 polymer matrix
composite (PMC) were fabricated and tested using multiple thin-film adhesives. Tensile and lap shear tests were performed to confirm the NiTi triple modulus shape memory effect (SME) and the increase in adhesive strength. Optical and scanning electron microscopy (SEM) were utilized to view the bond areas after testing. Axial displacement equations from prior work were utilized for curve fitting against mechanical data. These graphs showed that an inherent SME effect was observed within the samples before failure. Qualitative ABAQUS models showed that without adhesive, the SME within the shape memory alloy (SMA) spreads from the external SMA to the internally bonded SMA.

NASA/TM—2018-219747 21
Appendix A.—Material Properties of 8552/IM7 Composite Laminates
HexPly® 8552/IM7 elastic properties for ABAQUS
modeling (Ref. 20) E11T ................................................................................................................................... 165 GPa E11C ................................................................................................................................... 145 GPa E22T ...............................................................................................................................11.38 GPa E22C ...............................................................................................................................10.20 GPa E33T ...............................................................................................................................11.38 GPa E33C ...............................................................................................................................10.20 GPa G12 ................................................................................................................................... 5.12 GPa G23 ................................................................................................................................... 5.12 GPa G13 ................................................................................................................................... 3.92 GPa v12 ................................................................................................................................................... 0.3 v23 ............................................................................................................................................. 0.487 v13 ................................................................................................................................................... 0.3
HexPly® 8552/IM7 neat epoxy elastic properties (Ref. 20)
E ....................................................................................................................................... 4.67 GPa v12 ................................................................................................................................................ 0.35
HexPly® 8552/IM7 failure properties (Ref. 20)
Longitudinal tensile strength (S11T) ......................................... 2.6 Gpa Longitudinal compressive strength (S11C) ................................ 1.5 GPa Transverse tensile strength (S22T) ............................................. 60 MPa Transverse compressive strength (S22C) ................................. 290 MPa Shear strength (SS) ................................................................... 90 MPa


NASA/TM—2018-219747 23
Appendix B.—Nomenclature and Symbols
Nomenclature AF adhesive film APTS 3-acryloxypropyltrichlorosilane FEM finite element modeling MPS trimethoxysylylpropylmethacrylate NiTi nickel-titanium OTS n-octyltrichlorosilane PMC polymer matrix composite PMMA polymethyl methacrylate SEM scanning electron microscopy SMA shape memory alloy SME shape memory effect UMAT user-defined material model
Symbols A1 cross-sectional area of adherend for section l1
A2 cross-sectional area of adherend for section l2 A3 cross-sectional area of adhesive for section l3 b width E Young’s modulus in the axial direction Epmc modulus of the polymer matrix composite Esma modulus of the shape memory alloy F total axial force F1 force acting upon single nickel-titanium section F2 force acting upon doubled polymer matrix composite section F3 force acting upon pullout sample G adhesive shear modulus Gadh adhesive shear modulus of either epoxy or Hysol EA9696 or FM® 377U adhesive K stiffness value Knn traction force for separation in the normal direction Kss traction force in opposing direction (from Ktt) Ktt traction force in opposing direction (from Kss) L generic term for section length l1 length section 1 l2 length section 2 l3 length section 3 t central and outer adherend thickness T total thickness ta central adhesive thickness x axial direction γ shear strain of the adhesive ∆u total axial displacement ∆u1 motion of central adherend (nickel-titanium) ∆u2 motion of dual outer adherend (polymer matrix composite) ∆u3 motion of adhesive material used for bonding by epoxy, Hysol EA9696, or FM® 377U ∆u3s axial displacement of adhesive

NASA/TM—2018-219747 24
∆u3t single leg section tensile force ε1 strain of the adherend ε2 strain of the adherend in section l2 σ1 uniform tensile stress over the length of the nickel-titanium strip σ2 uniform tensile stress over the length of the polymer matrix composite τave average shear stress

NASA/TM—2018-219747 25
References 1. Ostachowicz, W.; Krawcuk, M.; and Zak, A.: Dynamics and Buckling of a Multilayer Composite
Plate With Embedded SMA Wires. Compos. Struct., vol. 48, 2000, pp. 163–167. 2. Schrooten, Jan, et al.: Progress on Composites With Embedded Shape Memory Alloy Wires. Mater.
Trans., vol. 43, no. 5, 2002, pp. 961–973. 3. Kim, Cheol; Park, Bum-Sik; and Goo, Nam-Seo: Shape Changes by Coupled Bending and Twisting
of Shape-Memory-Alloy-Embedded Composite Beams. Smart Mater. Struct., vol. 11, 2002, pp. 519–526.
4. Turner, Travis, et al.: Modeling, Fabrication, and Testing of a SMA Hybrid Composite Jet Engine Chevron Concept. J. Intell. Material Syst. Struct., vol. 17, no. 6, 2006, pp. 483–497.
5. Parthenios, J.; Psarras, G.C.; and Galiotis, C.: Adaptive Composites Incorporating Shape Memory Alloy Wires. Part 2: Development of Internal Recovery Stresses as a Function of Activation Temperature. Composites, Part A, vol. 32, 2001, pp. 1735–1747.
6. Turner, Travis L.; Lach, Cynthia L.; and Cano, Roberto J.: Fabrication and Characterization of SMA Hybrid Composites. SPIE 4333–60, 2001.
7. Bollas, D., et al.: Stress Generation by Shape Memory Alloy Wires Embedded in Polymer Composites. Acta Mater., vol. 55, 2007, pp. 5489–5499.
8. de Araujo, C.J.: Fabrication and Static Characterization of Carbon-Fiber-Reinforced Polymers With Embedded NiTi Shape Memory Wire Actuators. Smart Mater. Struct., vol. 17, no. 065004, 2008.
9. Shu, Steven G., et al.: Modeling of a Flexible Beam Actuated by Shape Memory Alloy Wires. Smart Mater. Struct., vol. 6, no. 3, 1997, pp. 265–277.
10. Song, Gangbing, et al.: Application of Shape Memory Alloy Wire Actuator for Precision Position Control of a Composite Beam. J. Mater. Eng. Perform., vol. 9, no. 3, 2000, pp. 330–333.
11. Hebda, Derek A.; and White, Scott R.: Structural Behavior of SMA Composite Beams. American Society of Mechanical Engineers, vol. 206, 1995, pp. 111–119.
12. Neuking, K.; Abu-Zarifa, A.; and Eggeler, G.: Surface Engineering of Shape Memory Alloy/Polymer-Composites: Improvement of the Adhesion Between Polymers and Pseudoelastic Shape Memory Alloys. Mater. Sci. Eng. A, vol. 481–482, 2008, pp. 606–611.
13. Smith, N.A., et al.: Improved Adhesion Between Nickel-Titanium Shape Memory Alloy and a Polymer Matrix via Silane Coupling Agents. Composites Part A, vol. 35, 2004, pp. 1307–1312.
14. Calcagno, Barbara O.; Hart, Kevin R.; and Crone, Wendy C.: Adhesion Strength in Metal/Polymer Composites. Experimental and Applied Mechanics, Proceedings of the Society for Experimental Mechanics Series, vol. 6, 2011, pp. 149–155.
15. Hexcel Corporation: Hexply 8552. MSDS No. FTA 072e, Hexcel Product Data Sheet, 2013. www.hexcel.com/user_area/content_media/raw/HexPly_8552_eu_DataSheet.pdf Accessed Jan. 26, 2018.
16. Henkel Corporation: Loctite EA 9696 15UNS AERO. Item no. AF9118512, Revision No. 001.1, 2015. http://hybris.cms.henkel.com/henkel/msdspdf?matnr=698917&country=US&language=EN Accessed Jan. 26, 2018.
17. Cytec Engineered Materials: FM 377U Adhesive Film. ID No. AEAD–00014, 2010. http://www.cytec.com/sites/default/files/datasheets/FM_377_040710.pdf Accessed May 2015.
18. 3M: Scotch-Weld Structural Adhesive Film. AF 163−2, 2009. http://multimedia.3m.com/mws/media/282041O/3m-scotch-weld-structural-adhesive-film-af-163-2-af-163-3.pdf Accessed May 2015.
19. Xiao, Xinran (Sharon); Foss, Peter J.; and Schroeder, Jessica A.: Stiffness Prediction of the Double Lap Shear Joint. Int. J. Adhes. Adhes., vol. 24, 2004, pp. 229−237.
20. Jumbo, F., et al.: Experimental and Numerical Investigation of Mechanical and Thermal Residual Strains in Adhesively Bonded Joints. Strain, vol. 43, 2007, pp. 319−331.

NASA/TM—2018-219747 26
21. Saleeb, A.F.; Padula II, S.A.; and Kumar, A.: A Multi-Axial, Multimechanism Based Constitutive Model for the Comprehensive Representation of the Evolutionary Response of SMAs Under General Thermomechanical Loading Conditions. Int. J. Plast., vol. 27, 2010, pp. 655−687.
22. Lagoudas, Dimitris C., ed.: Shape Memory Alloys: Modeling and Engineering Applications. Springer, New York, NY, 2008.