Embed Size (px)
Citation preview

In situ observations of the “preexisting auroral arc” by THEMISall sky imagers and the FAST spacecraft
Feifei Jiang,1 Robert J. Strangeway,1 Margaret G. Kivelson,1,2 James M. Weygand,1
Raymond J. Walker,1 Krishan K. Khurana,1 Yukitoshi Nishimura,3 Vassilis Angelopoulos,1
and Eric Donovan4
Received 6 September 2011; revised 25 January 2012; accepted 6 March 2012; published 5 May 2012.
[1] Auroral substorms were first described more than 40 years ago, and their atmosphericand magnetospheric signatures have been investigated extensively. However, becausemagnetic mapping from the ionosphere to the equator is uncertain especially during activetimes, the magnetospheric source regions of the substorm-associated features in theupper atmosphere remain poorly understood. In optical images, auroral substorms alwaysinvolve brightening followed by poleward expansion of a discrete auroral arc. The arcthat brightens is usually the most equatorward of several auroral arcs that remain quiescentfor �30 min or more before the break-up commences. In order to identify themagnetospheric region that is magnetically conjugate to this preexisting arc, wecombine auroral images from ground-based imagers, magnetic field and particle data fromlow-altitude spacecraft, and maps of field-aligned currents based on ground magnetometerarrays. We surveyed data from the THEMIS all sky imager (ASI) array and the FASTspacecraft from 2007 to April 2009 and obtained 5 events in which the low altitude FASTspacecraft crossed magnetic flux tubes linked to a preexisting auroral arc imaged byTHEMIS ASI prior to substorm onset. The observations show that, in each of the fivecases: 1) the precipitating electrons associated with the preexisting arc are acceleratedby a field-aligned potential drop, with characteristic energy ranging from a few hundred eVto a few keV. 2) The preexisting arc is located 1��2� poleward of the equatorward edge ofthe 1 keV electron plasma sheet in the ionosphere, and it maps to equatorial locationswithin the electron plasma sheet and tailward of its inner edge. 3) The preexisting arc islocated at or very near the boundary between the Region 1 and Region 2 field-alignedcurrents. The localization relative to the Region 1/Region 2 current is confirmed bycomparison with maps of field-aligned currents inferred from ground magnetometer data.
Citation: Jiang, F., R. J. Strangeway, M. G. Kivelson, J. M. Weygand, R. J. Walker, K. K. Khurana, Y. Nishimura,V. Angelopoulos, and E. Donovan (2012), In situ observations of the “preexisting auroral arc” by THEMIS all sky imagersand the FAST spacecraft, J. Geophys. Res., 117, A05211, doi:10.1029/2011JA017128.
1. Introduction
[2] Active auroras are the most spectacular phenomena seenin the polar skies. Although very dynamic, auroral emissionscommonly evolve in a predictable manner. In describing thetemporal evolution of the aurora, Akasofu [1964] introducedthe concepts of an auroral substorm and of the substorm
expansion phase, which has come to be understood as theauroral signature corresponding to the release of free energy ina magnetotail instability. Akasofu noted that prior to the startof the substorm, quiescent discrete arcs, narrow in latitude andextended in longitude, appear in the night sky. This quiescentphase terminates at the onset of the expansion phase, which ischaracterized by a sudden brightening of one of the longitu-dinally extended quiet arcs, followed by rapid poleward andlongitudinal expansion of the region of bright emissions.Furthermore, Akasofu noted that the most equatorward quietarc is often the first to brighten and expand poleward, west-ward and eastward. In contrast to Akasofu [1964], Lyons et al.[2002] found that sometimes, auroral break-up occurs along anew arc that forms equatorward of all preexisting growthphase arcs in the last few minutes prior to the beginning of theexpansion phase.[3] Further insight into the auroral substorm was added
by McPherron [1970], who introduced the idea that the
1Department of Earth and Space Sciences, University of California,Los Angeles, California, USA.
2Department of Atmospheres, Oceans and Space Sciences, Universityof Michigan, Ann Arbor, Michigan, USA.
3Department of Atmospheric and Oceanic Sciences, University ofCalifornia, Los Angeles, California, USA.
4Department of Physics and Astronomy, University of Calgary,Calgary, Alberta, Canada.
Copyright 2012 by the American Geophysical Union.0148-0227/12/2011JA017128
JOURNAL OF GEOPHYSICAL RESEARCH, VOL. 117, A05211, doi:10.1029/2011JA017128, 2012
A05211 1 of 17
quiescent period preceding the expansion phase is actuallyan integral part of the substorm with characteristic evolu-tion of the magnetospheric and ionospheric currents. Henamed this precursor interval the growth phase. During thegrowth phase the preexisting arc is often observed to moveslowly equatorward.[4] Both before and during a substorm, emissions from
auroral arcs are stimulated by precipitating electrons. Althoughit is widely accepted that the brightening of a preexistingquiet arc is a direct signature of the onset of the expansionphase of an auroral substorm, the magnetospheric source ofthe electrons that excite both the preexisting arc and thebrightened arc is not well understood. The magnetosphericcounterpart of the arc remains enigmatic largely because ofthe uncertainty of mapping along the magnetic field linesfrom the ionosphere to the magnetotail. Low-altitude space-craft and ground optical observations have provided insightinto the source region and particle properties of the pre-existing arc. Lui and Burrows [1978] argued that the arcthat brightens at onset is magnetically conjugate to thetransition region between dipolar and highly stretchedtopologies (a region they termed the “night side cusp”).Using the CANOPUS array of scanning photometers andprecipitating ion and electron data from DMSP, Samsonet al. [1992] showed that the arc that brightens formswithin the region of bright proton aurora. Voronkov et al.[2000], Deehr and Lummerzheim [2001], and others haveused ground-based optical data to show that the arc thatbrightens is on field lines poleward of the peak in bright-ness of the proton aurora, but in most if not all cases iswithin the bright proton aurora. Yahnin et al. [1997] pro-posed that the most equatorward discrete arc is on fieldlines that map to the earthward edge of a region of weakneutral sheet Bz, or equivalently, to a region in the centerof the plasma sheet where the radius of curvature offield lines is so small that 30 keV electrons behave non-adiabatically. Donovan et al. [2008] studied ground-basedand in situ data of one substorm event and argued that inthat case the onset arc mapped to a region between 7 and8 RE in the magnetotail. Combining CANOPUS with insitu FAST measurements, Lessard et al. [2007] showed thatin a number of events, the arc that brightens (which theytermed “the growth phase arc”) is excited by inverted-Velectron precipitation [Frank and Ackerson, 1971].[5] Because the magnetospheric source region of the pre-
existing arc remains uncertain, with links to several differentlocations having been proposed, it is the objective of thisstudy to constrain to some degree the region of the magne-tosphere to which it links. Previous studies have proven thatauroral studies benefit from combining ground opticalobservations with in situ data from low-altitude spacecraftflybys. Fortunately, the THEMIS mission [Angelopoulos,2008, and references therein] has provided greatly enhancedoptical imagery of the auroral ionosphere in conjunction withsimultaneous nighttime satellite observations in the near-Earth equatorial plasma sheet. Furthermore, during the earlyportion of the THEMIS mission the FAST spacecraft wasproviding low altitude data. Consequently, in this study, wesurvey data from the THEMIS All Sky Imager (ASI) andselect intervals during which the FAST spacecraft crosses themagnetic shell of the preexisting arc. We have examined datafrom 11/2007 to 03/2008 and 11/2008 to 03/2009, when the
orbit of FAST was favorable for conjunctions with theTHEMIS ground array, selecting passes during which FASTcrossed a quiet arc shortly before it brightened at the start ofan auroral substorm. The FAST measurements reveal thelocation of the arc relative to large scale field-aligned currents(FACs) flowing between the magnetosphere and the iono-sphere and identify the characteristics of the electrons thatexcite the arc. Ground magnetometer arrays can be used tomap the distribution of FACs over a large part of the auroralzone [Weygand et al., 2011] and enables us to infer thelocation of the preexisting arc relative to Region 1 andRegion 2 currents.[6] In the next section, the data and methods used in this
study are introduced. Five events in which FAST crossed themagnetic shell of a quiet arc were identified. In section 3, wedescribe in detail three events in which FAST crossed apreexisting arc before a substorm onset near local midnight,in the pre-midnight sector and in the post-midnight sector,respectively. Observational results for all five cases aresummarized. Section 4 discusses the implication of ourresults and compares our work with previous studies.
2. Data and Event Selection
[7] The THEMIS ground-based imager array consists of20 all-sky white light imagers distributed across NorthAmerica from Greenland to Alaska. Each imager has a fieldof view (FOV) of 9 latitudinal degrees at 110 km altitudeand takes auroral images every 3 s [Donovan et al., 2006;Mende et al., 2006]. The imagers cover a large section of theauroral zone with roughly one-kilometer resolution at zenith,providing global auroral observations and broad coverage ofthe ionospheric footprint of the night-side magnetosphere.[8] The FAST satellite was launched in 1996 and operated
until March 2009 [Pfaff et al., 2001; Harvey et al., 2001]. Itcarried a fluxgate magnetometer and 4 electrostatic analy-zers that measure particles of energies from a few eV to�30 keV, with the highest time resolution of �0.5 s. Thehigh-resolution optical data from ASI enable us to pin downthe ionospheric location of the preexisting arc and FASTmeasurements provide the properties of the precipitatingparticles that cause the auroral emissions. The insight gainedby combining the two data sets is considerably enhanced byusing ground magnetometer array to characterize the FACstructure not only along the FAST trajectory but also acrossa large part of the auroral region.[9] We surveyed THEMIS ASI and FAST data from
11/2007 to 03/2008 and from 11/2008 to 03/2009, lookingfor events in which FAST crossed a preexisting arc in thefield of view of the THEMIS ASIs. We verified that the arcselected as the preexisting arc was the one that brightenedand expanded poleward within �5 to �50 min following theFAST crossing. Events were retained in the data set only ifthere was extensive enough coverage of the preexisting arc(i.e., we required the arc to have been imaged by severalimagers) and FAST measurements were available during thetime of the arc crossing. In addition, we required the FASTcrossings to occur during geomagnetically quiet times priorto substorm onset or during a substorm growth phase. Geo-magnetic conditions were characterized by the AL index.For quiet times AL was required to be small in magnitude(AL > �50 nT), whereas for a substorm growth phase, AL
JIANG ET AL.: THE PREEXISTING AURORAL ARC A05211A05211
2 of 17
was required to decrease gradually before reaching a mini-mum or starting to drop sharply. We required the preexistingarc of interest to remain undisturbed without visible changesin morphology till the auroral brightening began. We foundfive events in total, and they are listed in Table 1. The UT,magnetic local time and characteristic energy of the electronprecipitation associated with the arc are listed for each event.[10] To link FAST to the auroral features observed con-
currently, we used the Tsyganenko 96 magnetic field model[Tsyganenko, 1995] with solar wind data input to map theFAST spacecraft to the ionosphere (taken to lie on a shell120 km above the ground, around 1.02 RE). The solar winddata are from the ACE satellite, appropriately time shiftedto the nose of the magnetopause [Weimer et al., 2003]. Thisis unnecessary (we could have just used the IGRF) for ourevents where FAST was located in the northern hemi-sphere as its apogee was at an altitude of 4200 km, but isessential when FAST was located in the southern hemi-sphere. Uncertainty of mapping from the T96 model ariseswhen FAST was located in the southern hemisphere, but itis small at the magnetic latitude of the preexisting arc. Inthe five cases we studied, even when FAST was locatedin the conjugate (southern) hemisphere, its mapped iono-spheric footprint crossed the relevant auroral arc signaturesin the white light images within a few seconds before/afterits detector recorded signatures of precipitating electrons,thereby confirming the validity of the magnetic mapping.[11] In addition to THEMIS ASI and the FAST spacecraft,
we used ground magnetometer data to calculate currentsvertical to the earth’s surface in the ionosphere [Weygandet al., 2011]. The ground magnetometer stations analyzedare spread across North America and Greenland and includethe THEMIS, CANMOS, CARISMA, MACCS, and Green-land arrays. The approach to measuring vertical currents byusing ground magnetometer arrays is known as the sphericalelementary current system (SECS) method and is described byAmm and Viljanen [1999] and Weygand et al. [2011]. Essen-tially, the technique applies the Biot-Savart law to calculate thevertical current at each grid point of an ionospheric grid fromthe horizontal magnetic perturbations measured at the array ofground stations, and assume that the vertical currents representFACs. In the latitudinal range of interest in the ionosphere(e.g., from �50� to �70� in geographic latitude), the anglebetween the earth’s main field and the direction normal tothe earth’s surface ranges from �15� to �5�. Therefore, theassumption that the vertical currents represent FACs is valid.With 81 ground magnetometer stations and �1000 gridpoints and assuming uniform conductivity, the relationshipbetween the vertical current and magnetic field can bewritten in the form AI = B, where I is the amplitude of thevertical current at individual grid points, B is the horizontal
vector of magnetic field perturbations at individual stations,and A is a matrix containing the magnetic field resultingfrom placing a unit vertical current at each grid point. Theproblem requires solving underdetermined linear equations.Applying a singular value decomposition (SVD) technique,I can be solved for given A and B. The computation isperformed in the spherical coordinate system. The SECSmethod used in this study for determining ionospheric cur-rents has been widely used. Pulkkinen et al. [2003] testedthis method for the BEAR and IMAGE magnetometer arraysby investigating the differences between the modeled andmeasured magnetic fields at various stations. Their testdemonstrated that the SECS method applied with SVD isreliable and stable and is not highly sensitive to relativelylarge gaps in magnetometer arrays. Thus, this method servesas an effective tool for characterizing the ionospheric FACdistribution over a large portion of the auroral ionosphere.It is of particular value in placing the inferred currents alongthe track of the FAST spacecraft into a global context.
3. Event Study
3.1. 31 January 2009
[12] Figures 1a–1e are five consecutive images of anauroral substorm acquired by four THEMIS ground imagersbetween 06:31:00 UT and 07:13:00 UT on 31 January 2009.From left to right, the respective ground stations (circles) areInuvik (top), Whitehorse, Gillam and Sanikiluaq. Imagingfrom the stations in between was obscured by clouds. FASTflew through the southern auroral zone during this con-junction. Its trajectory as mapped to the northern hemisphereis indicated by the yellow dashed line and its footprints at theUTs of Figures 1a and 1b are indicated by yellow crosses.The wiggling of FAST trajectory results from the variationof solar wind quantities that are input parameters of theT96 model. The footprints of the THEMIS spacecraft A, Dand E, also mapped to the ionosphere using the T96 model,are indicated by the blue, orange and red squares respec-tively. The THEMIS spacecraft data and the mapping of thefootprints will be discussed in section 4. Prior to the auroralbreakup, a diffuse band of aurora and multiple arcs werepresent in the FOV of the imagers. A thin, faint arc located atthe poleward edge of the diffuse aurora was the preexistingarc of interest (Figure 1b). It was also the most equatorwardarc and it extended across �30� in longitude from Gillam toSanikiluaq (The latitudinal extent corresponds to 2 h ofMLT). The preexisting arc is identified by the three redasterisks in Figures 1b–1d. FAST encountered the preexist-ing arc at 06:33:36 UT (in Figure 1b, the footprint of FASTfrom the T96 mapping is located 0.5� poleward of the arc).The arc gradually intensified and began to brighten at
Table 1. List of Observations of a Preexisting Arc by FAST and THEMIS All Sky Imagersa
Case DateTime of
Conjunction (UT)Time of AuroralBreakup (UT) FAST Orbit FAST MLT
Characteristic Energy of theElectron Precipitation
1 31 Jan 2009 06:33:36 06:56:00 S, 50311 0.1 �300 eV2 14 Feb 2008 05:56:36 06:04:24 N, 46351 21 �500 eV3 27 Feb 2009 05:15:06 05:27:00 N, 50615 21.5 �1 keV4 2 Feb 2008 06:50:48 07:40:00 S, 46216 1.7 �800 eV5 19 Dec 2008 08:21:03 08:26:30 S, 49828 3.4 �7 keV
aThe event selection criteria are described in section 2.
JIANG ET AL.: THE PREEXISTING AURORAL ARC A05211A05211
3 of 17

06:55:30 UT (Figure 1d), and thereafter expanded (Figure 1e).An animation of ASI data for this event is shown inAnimation S1 in the auxiliary material.1 The track of theFAST spacecraft, mapped to the northern hemisphere, isshown moving equatorward and crossing the arc. The timeevolution of the auroral substorm, including the gradualintensification and brightening of the preexisting arc, can beseen clearly in the animation.[13] Figure 2 shows auroral indices versus UT from three
hours before to two hours after the auroral brightening.The two vertical lines mark the time that FAST crossed thepreexisting arc and the time of auroral brightening respec-tively. The first vertical line is located at a time when
AL was �10 nT before it sharply dropped to �100 nT at06:55 UT. It shows that FAST passed the preexisting arcduring a geomagnetically quiescent time.[14] Figure 3a shows the FAST data for a few minutes that
include its passage across field lines that map to the pre-existing arc. Panels from top to bottom are: energy fluxspectrum versus energy (ranging from 4 eV to 30 keV) forelectrons with a pitch angle range from 0� to 30�; energyflux spectrum versus energy for electrons with a pitch anglerange from 60� to 120�; energy flux spectrum versus energyfor electrons with a pitch angle range from 150� to 180�;ions omni-directional energy flux spectrum over an energyrange from 4 eV to 25 keV; ions energy flux spectrum versuspitch angle for all energies; field-aligned ion fluxes inte-grated over an energy range from 1 keV to 25 keV; three
Figure 1. Snapshots of an auroral substorm on 31 January 2009 from THEMIS ASI. (a–e) The UTs areindicated at the bottom of the images. A substorm onset occurred at 06:55:30 UT. The trajectory and foot-print of FAST are indicated by a yellow dotted line and a yellow cross, respectively on each image.In Figures 1b–1d, the preexisting arc is identified by red asterisks, and the footprints of THEMIS spacecraftA, D and E in the ionosphere are the blue, red and orange squares respectively.
1Animations are available in the HTML.
JIANG ET AL.: THE PREEXISTING AURORAL ARC A05211A05211
4 of 17

components of the perturbed magnetic field in a field-aligned coordinate system; and amplitude of FAC densityderived from magnetic field perturbations using Ampere’slaw (approximating curl-B by the change of cross-trackperturbation with along-track distance). In the 6th panel, anegative value of the field-aligned ion flux indicates that it isanti-parallel to the background magnetic field and hencedirected into the ionosphere in the southern hemisphere. Inthe 7th panel, the blue trace is the perturbed magnetic fieldcomponent along the magnetic field (i.e., away from theearth for the southern hemisphere), the green trace is theeast-west component of the perturbed magnetic field withpositive direction to the east, and the red trace is the pole-ward component, with positive direction to the south in thesouthern hemisphere. The background magnetic field isgiven by the International Geophysical Reference Field(IGRF). The FAC density plotted in the 8th panel is calcu-lated every 0.25 s (black trace), and the red trace is a 20-srunning average of the black trace. A positive value of theFAC density indicates that it is parallel to the backgroundmagnetic field. In the southern hemisphere, positive FAC is
out of the ionosphere, while negative FAC is into the iono-sphere. The altitude, magnetic local time and invariant lati-tude of FAST are indicated at the bottom of the panels.[15] Figure 3b illustrates the statistical distribution of large
scale FACs in the ionosphere during weakly disturbed con-ditions [Iijima and Potemra, 1976, Figure 6]. The polewardportion of the large scale FACs are Region 1 currents, whichflow into the ionosphere on the dawn side and out of theionosphere on the dusk side. The Region 1 current system isbelieved to be associated with flow shear in the magneto-pause boundary layers [Lotko et al., 1987]. The large scaleFACs equatorward of the Region 1 currents are Region 2currents, which flow into the ionosphere on the dusk sideand out of the ionosphere on the dawn side. The Region 2current system is believed to be generated where the gradientof flux tube volume is not parallel to the gradient ofplasma thermal pressure [Vasyliunas, 1972]. The red arrowin Figure 3b indicates the trajectory of FAST for this event,which flew through the auroral zone from pole to equatornear local midnight, where the current configuration takes amore complicated three-sheet form. In individual cases, theactual distribution of large-scale field aligned currents islikely to differ from the statistical pattern in Figure 3b.[16] In Figure 3a, the dashed magenta rectangle identi-
fies the interval during which FAST observed precipitatingelectrons associated with the crossing of the preexisting arcshown in Figure 1b at 06:33:36 UT. At this time, the particledetector on FAST measured enhanced precipitating electronflux (3rd panel) which we take as the source of brighteningeven thought the T96 model, located the ionospheric foot-print of FAST 0.5� north of the preexisting arc of interest(Figure 1b). The top panels show that the electron flux near180� (3rd panel) at energies of a few hundred eV exceeds theflux at other pitch angles (1st and 2nd panels) in the sameenergy band, i.e., electrons are being accelerated into thesouthern ionosphere where FAST is located, evidence of afield-aligned potential drop. Within the FOV of the imagers,the arc marked by the asterisks is the only isolated discreteauroral arc that corresponds to the isolated electron pre-cipitation structure at 06:33:36 UT. Therefore, it is theonly plausible source of the preexisting arc. The narrowarc is excited by precipitating electrons accelerated by afield-aligned potential drop with a characteristic energy of�300 eV. The equatorward boundary of the trapped electronflux (the gradual slope encountered almost a minute laterfrom 06:34:30 UT to 06:35:00 UT in the 2nd panel ofFigure 3a) is the inner edge of the trapped electron plasma
Figure 2. Auroral indices from 04:00 to 09:00 UT on31 January 2009. AE, AL and AU are represented by blue,green and red respectively. The black vertical line near06:30 UT indicates the time when FAST crossed the preex-isting arc, and the black line near 07:00 UT indicates thetime of auroral brightening.
Figure 3. (a) FAST data including the arc crossing on 31 January 2009. Panels from top to bottom are: energy flux spec-trum versus energy (ranging from 4 eV to 30 keV) for electrons with a pitch angle range from 0� to 30�; energy flux spec-trum versus energy for electrons with a pitch angle range from 60� to 120�; energy flux spectrum versus energy for electronswith a pitch angle range from 150� to 180�; omni-directional ions energy flux spectrum; ions energy flux spectrum versuspitch angle for all energies; integrated field-aligned fluxes of ions over an energy range from 1 keV to 25 keV (black) and theaverage fluxes (red); components of the magnetic field perturbations in the field-aligned coordinate system: the blue trace isthe perturbed magnetic field component along the magnetic field (away from the earth for the southern hemisphere), thegreen trace is the east-west component of the perturbed magnetic field with positive direction to the east, and the red traceis the poleward component, with positive direction to the south; FAC density derived from magnetic field perturbations(black) and averaged current density (red). The preexisting arc corresponds to the magenta dashed rectangle. (b) Illustrationof the distribution of large-scale FACs in the ionosphere during weekly disturbed conditions [Iijima and Potemra, 1976,Figure 6]. The red arrow illustrates the trajectory of FAST for the pass shown in Figure 3a.
JIANG ET AL.: THE PREEXISTING AURORAL ARC A05211A05211
5 of 17

sheet. The energy-dependence of the inner edge can beunderstood as follows: In the equatorial plane, the inner edgeof high energy plasma sheet electrons (�10 keV) lies outsideof (at a larger radial distance) the inner edge of low energyplasma sheet electrons (�1 keV). Consequently, the equa-torward boundary of �10 keV plasma sheet electronsmaps to a higher latitude than that of �1 keV electrons.In Figure 3a, the preexisting arc is roughly 2� poleward of
the inner edge of 1 keV electron plasma sheet, which mapsto a source �3 RE displaced at the equator using the T96model with real-time solar wind input. (We return to thisargument in section 4.) The energy flux of �1 keV – �20 keVions intensifies between �68� and �65� magnetic latitude(4th panel of Figure 3a), and the pitch angle distribu-tion (5th panel) shows that the ions are precipitating. Thisenhanced ion precipitation is sometimes called the “proton
Figure 3
JIANG ET AL.: THE PREEXISTING AURORAL ARC A05211A05211
6 of 17

aurora.” The peak of the precipitating ion fluxes is located at�66� in invariant latitude and the preexisting electron arc isembedded within the “proton aurora,” poleward of the peakprecipitating fluxes. In the 7th panel, the east-west compo-nent of the perturbed magnetic field (green), is the dominantcomponent of the magnetic perturbation measured by aspacecraft making a north-south cut through FAC sheetsextended in longitude. The ascending slope of the eastwardcomponent of the magnetic field between 06:31:00 UT and06:31:50 UT implies a region of downward FAC with mag-nitude of �2 uA/m2. The descending slope of the eastwardcomponent between 06:31:50 UT and 06:33:30 UT implies aregion of upward FAC with amplitude around 1 uA/m2. Themuch weaker ascending slope between 06:33:40 UT and06:34:40 UT implies a region of downward FAC withamplitude around 0.5 uA/m2. The jiggling in the east-westcomponent of the magnetic field (green trace in the 7th panel)reflects localized structure in the FACs, as shown by theblack trace in the 8th panel. Although multiple localizedFAC structures exist, the overall trend of the magnetic fieldand the smoothed FAC density clearly show a net upwardcurrent embedded between two downward currents. Thepreexisting arc of interest is located at the boundary betweenthe low-latitude Region 1 and Region 2 currents, appearingright after the westward component of the magnetic fieldreached a minimum.[17] To further illustrate the relationship between the pre-
existing arc and the Region 1/Region 2 current system, weplot (Figure 4) the distribution of vertical currents in thenorthern ionosphere at 06:33:40 UT on 31 January 2009, thetime FAST moved across the preexisting arc. The methodused to make this plot was introduced in section 2. InFigure 4, the black stars represent ground magnetometerstations with good data. The blue squares and red “+”symbols are the current amplitudes calculated using the
SECS method. The values are given in Figure 4 in units ofamps and the direction is up or down with respect to theionosphere. To get a good estimate of the FAC density fromthe SEC method the ionospheric electric field and height-integrated Hall and Pedersen conductivities are required.However, we can get a very rough estimate of the currentdensity amplitude by dividing by the area (0.75 degreesgeographic latitude by 1.75 degrees geographic longitude)surrounding the grid. The amplitude of the current rangesfrom �20000 to 20000 Ampere, implying that the currentdensity is of order of 1 mA/m2, a typical value for Region 1and Region 2 FAC density. The larger the dot size, the largerthe amplitude of current density. Magnetic midnight ismarked by the black line. The distribution of the verticalcurrents is consistent with the statistical picture of theRegion 1 and Region 2 FAC system (Figure 3b): in the pre-midnight sector, Region 1 currents are upward and Region 2currents are downward; in the post-midnight sector,Region 1 currents are downward and Region 2 currents areupward. At midnight, the vertical current system becomesmore complicated – an upward current sheet is locatedbetween two downward current sheets. The location of FASTat this time is marked by the green dot. Consistent with FASTdata, the preexisting arc is located at the low-latitude edge ofthe outward field-aligned current produced by overlap of thepre-midnight and post-midnight R1/R2 current system. Ananimation of the distribution of the vertical currents plottedon top of the ASI for this event is shown in Animation S2.The red line indicates magnetic midnight, and the yellow starrepresents the footprint of FAST. The distribution of theupward and downward vertical currents remains relativelystable with time, and the preexisting arc is aligned with theboundary between the low-latitude pair of upward anddownward FAC near local midnight (�58� in geographiclatitude). The intensity of a pair of upward and downward
Figure 4. Distribution of vertical currents in the northern ionosphere at 06:33:40 on 31 January 2009, thetime FAST encountered the preexisting arc. The vertical currents are determined from ground magnetom-eter data. Blue dots are downward vertical currents and red dots are upward vertical currents. The blackline indicates magnetic midnight. The footprint of FAST at this time is marked by the green dot.
JIANG ET AL.: THE PREEXISTING AURORAL ARC A05211A05211
7 of 17
currents near the preexisting arc increased at the substormonset (06:55 UT).
3.2. 14 February 2008
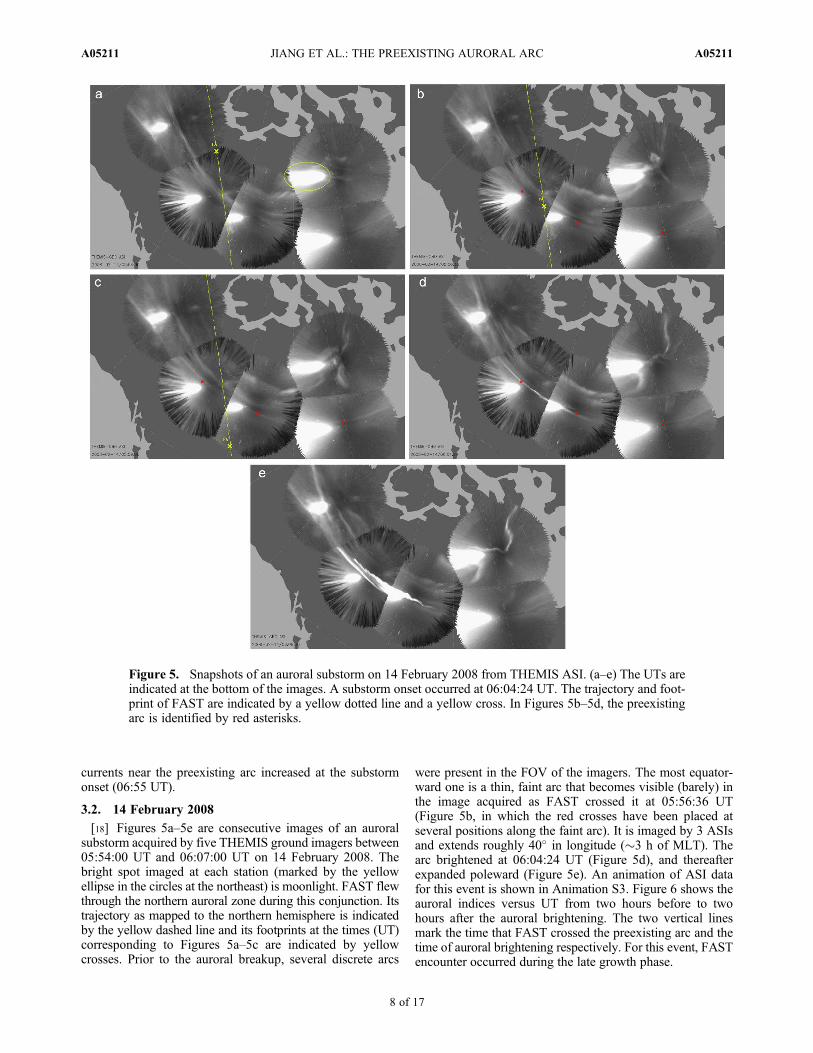
[18] Figures 5a–5e are consecutive images of an auroralsubstorm acquired by five THEMIS ground imagers between05:54:00 UT and 06:07:00 UT on 14 February 2008. Thebright spot imaged at each station (marked by the yellowellipse in the circles at the northeast) is moonlight. FAST flewthrough the northern auroral zone during this conjunction. Itstrajectory as mapped to the northern hemisphere is indicatedby the yellow dashed line and its footprints at the times (UT)corresponding to Figures 5a–5c are indicated by yellowcrosses. Prior to the auroral breakup, several discrete arcs
were present in the FOV of the imagers. The most equator-ward one is a thin, faint arc that becomes visible (barely) inthe image acquired as FAST crossed it at 05:56:36 UT(Figure 5b, in which the red crosses have been placed atseveral positions along the faint arc). It is imaged by 3 ASIsand extends roughly 40� in longitude (�3 h of MLT). Thearc brightened at 06:04:24 UT (Figure 5d), and thereafterexpanded poleward (Figure 5e). An animation of ASI datafor this event is shown in Animation S3. Figure 6 shows theauroral indices versus UT from two hours before to twohours after the auroral brightening. The two vertical linesmark the time that FAST crossed the preexisting arc and thetime of auroral brightening respectively. For this event, FASTencounter occurred during the late growth phase.
Figure 5. Snapshots of an auroral substorm on 14 February 2008 from THEMIS ASI. (a–e) The UTs areindicated at the bottom of the images. A substorm onset occurred at 06:04:24 UT. The trajectory and foot-print of FAST are indicated by a yellow dotted line and a yellow cross. In Figures 5b–5d, the preexistingarc is identified by red asterisks.
JIANG ET AL.: THE PREEXISTING AURORAL ARC A05211A05211
8 of 17

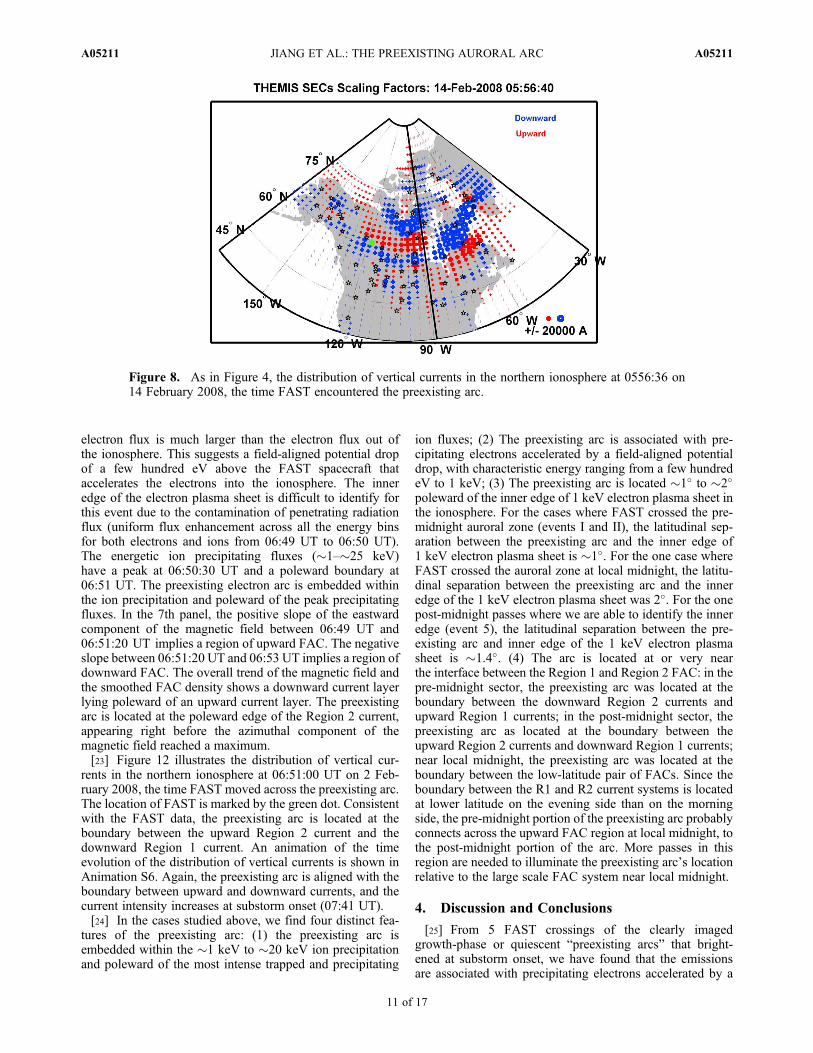
[19] Figure 7a shows the FAST data for this event. Panelsfrom top to bottom are the same as in Figure 3a. Figure 7billustrates the trajectory of FAST relative to the large-scaleFAC distribution. It shows that FAST flew through a two-sheet FAC layer in the pre-midnight sector (�2100 MLT)moving equatorward from high latitude. The dashed magentarectangle in Figure 7a identifies the interval during whichFAST, this time moving equatorward in the northern hemi-sphere, observed precipitating electrons associated with thecrossing of the preexisting arc shown in Figure 5b at05:56:36 UT. The flux of electrons with energy around a fewhundred eV is greatly enhanced near 0� in pitch angle com-pared with that near 180� in pitch angle (1st and 3rd panel).This is indicative of a field-aligned potential drop of a fewhundred eV that accelerates the electrons into the northernhemisphere. The arc is located 1� poleward of the inner edgeof the 1 keV electron plasma sheet, which maps to a source�1.5 RE displaced at the equator using T96 model with con-current solar wind input. Similar to event 1, the preexistingelectron arc is embeddedwithin the 1–20 keV ion precipitationand lies poleward of the peak precipitation. In the 7th panel,the positive slope of the eastward component of the magneticfield between 05:55 UT and 05:56:30 UT implies a region ofupward FAC with magnitude of �0.3 uA/m2. The negativeslope between 05:56:30 UT and 05:57:30 UT implies a regionof downward FAC with amplitude of�0.3 uA/m2. Consistentwith the statistical FAC distribution in the evening sector, theoverall trend of the magnetic field and the smoothed FACdensity shows an upward current layer lying poleward of adownward current layer. The preexisting arc of interest islocated at the poleward edge of the Region 2 current, appear-ing right after the azimuthal component of the magnetic fieldreached a maximum.[20] Figure 8 illustrates the distribution of vertical currents
in the northern ionosphere at 05:56:36 UT on 14 February
2008, the time FAST moved across the preexisting arc.Magnetic midnight is marked by the black line. The locationof FAST at this time is marked by the green dot. Consistentwith the FAST data, the preexisting arc is located at theboundary between the upward Region 1 current and thedownward Region 2 current. An animation of the time evo-lution of the distribution of the vertical currents for this eventis shown in Animation S4. The red line indicates magneticmidnight, and the yellow star represents the FAST foot-print. Once again in this event, the distribution of upwardand downward currents remains relatively stable, and thepreexisting arc is well aligned with the boundary betweenupward currents and downward currents in the pre-midnightsector. A slight increase in current density is seen at thepreexisting arc (near 60�N) at substorm onset (06:04 UT).
3.3. 2 February 2008
[21] Figures 9a–9d are consecutive images of an auroralsubstorm acquired by 6 THEMIS ground imagers between06:48:00 UT and 07:45:00 UT on 2 February 2008. FASTflew through the southern auroral zone during this con-junction. Its trajectory as mapped to the northern hemisphereis indicated by the yellow dashed line and its footprints at thetimes (UT) of Figures 9a and 9b are indicated by the yellowcrosses. The ground station beneath the FAST footprint(SNKQ) was obscured by clouds and did not provide auroralimages. However, the auroral features near the FAST foot-print can be inferred from neighboring stations – GILL (the2nd one on the right at the bottom) on the left of FAST andKUUJ (the 1st one on the right) on the right. Prior to theauroral breakup, multiple discrete arcs were present in theFOV of the imagers. At GILL, a bright discrete arc waslocated across the center of the image whereas at KUUJ,three discrete arcs were seen (Figure 9b). The bright discretearc at GILL corresponds to the most poleward of the three(lowest latitude) discrete arcs at KUUJ and it brightensat substorm onset (Figure 9c) and expands afterwards.In this event, the quiet preexisting arc that brightened atsubstorm onset was not the most equatorward arc in the post-midnight sector (evident from KUUJ), but the most pole-ward one of the low-latitude arcs. The preexisting arcextends roughly 45� in longitude (3 h of MLT). Figure 9eplots the auroral intensity versus magnetic latitude at thecentral right meridian of GILL (�267� geographic longi-tude) at 06:51 UT. The highest peak at 66.7� corresponds tothe brightest of the low-latitude preexisting arcs, whereas thetwo dashed magenta lines, marking local intensity peaks,correspond to the two arcs equatorward of the preexistingarc as seen at KUUJ. The time evolution of the auroralsubstorm for this event is shown in Animation S5. Figure 10shows the auroral indices versus UT from two hours beforeto two hours after the auroral brightening. For this event,FAST crossed the arc during the early substorm growthphase.[22] Figure 11a shows the FAST data for this event.
Panels from top to bottom are the same as in Figure 3a.Figure 11b, analogous to Figure 3b, shows that FASTflew through a two-sheet FAC layer in the morning sector(0200 MLT) from the equator to the pole. The dashedmagenta rectangle in Figure 11a identifies the interval duringwhich FAST observed precipitating electrons (characteristic
Figure 6. As for Figure 2, auroral indices from 04:00 to08:00 UT on 14 February 2008. The black vertical line at05:56 UT indicates the time FAST crossed the preexistingarc, and the black line at 06:04 UT indicates the time ofauroral brightening.
JIANG ET AL.: THE PREEXISTING AURORAL ARC A05211A05211
9 of 17

energy slightly less than 1 keV) associated with the crossingof the preexisting arc shown in Figure 9b at 06:51:12 UT.This enhanced electron precipitation (centered at �66.5�)is very close in invariant latitude to the intensity peak atGILL (66.7�) and it is poleward of the energetic electron
precipitation located from �65� to�66� (which correspondsto the diffused aurora equatorward of the preexisting arcat GILL). At about 06:51 UT, the electron energy spectrumnear 180� in pitch angle shows enhanced fluxes with char-acteristic energy of�800 eV (3rd panel) and the precipitating
Figure 7. (a) FAST data including the arc crossing on 14 February 2008. Panels from top to bottom arethe same as those in Figure 3a. (b) Illustration of the distribution of large-scale FACs in the ionosphereduring weekly disturbed conditions. The red arrow illustrates the trajectory of FAST for the pass shownin Figure 7a.
JIANG ET AL.: THE PREEXISTING AURORAL ARC A05211A05211
10 of 17
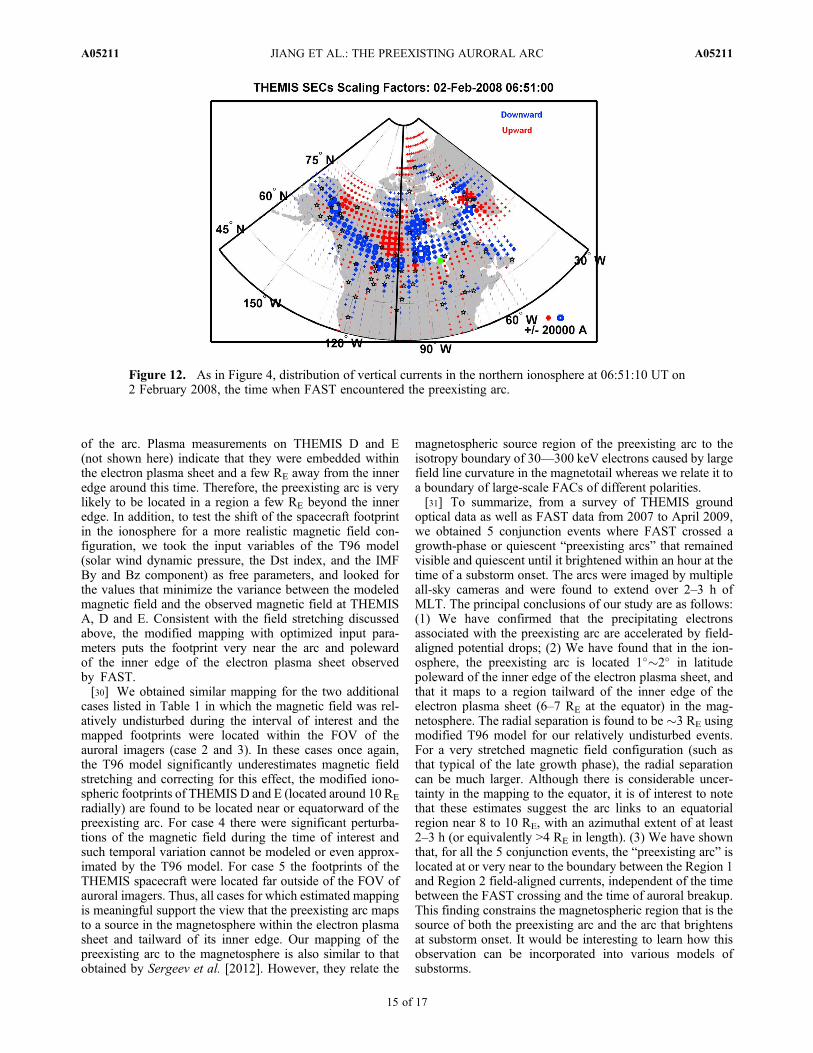
electron flux is much larger than the electron flux out ofthe ionosphere. This suggests a field-aligned potential dropof a few hundred eV above the FAST spacecraft thataccelerates the electrons into the ionosphere. The inneredge of the electron plasma sheet is difficult to identify forthis event due to the contamination of penetrating radiationflux (uniform flux enhancement across all the energy binsfor both electrons and ions from 06:49 UT to 06:50 UT).The energetic ion precipitating fluxes (�1–�25 keV)have a peak at 06:50:30 UT and a poleward boundary at06:51 UT. The preexisting electron arc is embedded withinthe ion precipitation and poleward of the peak precipitatingfluxes. In the 7th panel, the positive slope of the eastwardcomponent of the magnetic field between 06:49 UT and06:51:20 UT implies a region of upward FAC. The negativeslope between 06:51:20 UT and 06:53 UT implies a region ofdownward FAC. The overall trend of the magnetic field andthe smoothed FAC density shows a downward current layerlying poleward of an upward current layer. The preexistingarc is located at the poleward edge of the Region 2 current,appearing right before the azimuthal component of themagnetic field reached a maximum.[23] Figure 12 illustrates the distribution of vertical cur-
rents in the northern ionosphere at 06:51:00 UT on 2 Feb-ruary 2008, the time FAST moved across the preexisting arc.The location of FAST is marked by the green dot. Consistentwith the FAST data, the preexisting arc is located at theboundary between the upward Region 2 current and thedownward Region 1 current. An animation of the timeevolution of the distribution of vertical currents is shown inAnimation S6. Again, the preexisting arc is aligned with theboundary between upward and downward currents, and thecurrent intensity increases at substorm onset (07:41 UT).[24] In the cases studied above, we find four distinct fea-
tures of the preexisting arc: (1) the preexisting arc isembedded within the �1 keV to �20 keV ion precipitationand poleward of the most intense trapped and precipitating
ion fluxes; (2) The preexisting arc is associated with pre-cipitating electrons accelerated by a field-aligned potentialdrop, with characteristic energy ranging from a few hundredeV to 1 keV; (3) The preexisting arc is located �1� to �2�poleward of the inner edge of 1 keV electron plasma sheet inthe ionosphere. For the cases where FAST crossed the pre-midnight auroral zone (events I and II), the latitudinal sep-aration between the preexisting arc and the inner edge of1 keV electron plasma sheet is �1�. For the one case whereFAST crossed the auroral zone at local midnight, the latitu-dinal separation between the preexisting arc and the inneredge of the 1 keV electron plasma sheet was 2�. For the onepost-midnight passes where we are able to identify the inneredge (event 5), the latitudinal separation between the pre-existing arc and inner edge of the 1 keV electron plasmasheet is �1.4�. (4) The arc is located at or very nearthe interface between the Region 1 and Region 2 FAC: in thepre-midnight sector, the preexisting arc was located at theboundary between the downward Region 2 currents andupward Region 1 currents; in the post-midnight sector, thepreexisting arc as located at the boundary between theupward Region 2 currents and downward Region 1 currents;near local midnight, the preexisting arc was located at theboundary between the low-latitude pair of FACs. Since theboundary between the R1 and R2 current systems is locatedat lower latitude on the evening side than on the morningside, the pre-midnight portion of the preexisting arc probablyconnects across the upward FAC region at local midnight, tothe post-midnight portion of the arc. More passes in thisregion are needed to illuminate the preexisting arc’s locationrelative to the large scale FAC system near local midnight.
4. Discussion and Conclusions
[25] From 5 FAST crossings of the clearly imagedgrowth-phase or quiescent “preexisting arcs” that bright-ened at substorm onset, we have found that the emissionsare associated with precipitating electrons accelerated by a
Figure 8. As in Figure 4, the distribution of vertical currents in the northern ionosphere at 0556:36 on14 February 2008, the time FAST encountered the preexisting arc.
JIANG ET AL.: THE PREEXISTING AURORAL ARC A05211A05211
11 of 17

Figure 9. (a–d) Snapshots of an auroral substorm on 2 February 2008 from THEMIS ASI. The UTs ofFigures 5a–5d are indicated at the bottom of the images. A substorm onset occurred at 07:40 UT. The tra-jectory and footprint of FAST are indicated by a yellow dotted line and a yellow cross. (e) Latitudinal pro-file of the auroral intensity in the meridian at �267� in geographic longitude at GILL.
JIANG ET AL.: THE PREEXISTING AURORAL ARC A05211A05211
12 of 17

field-aligned potential drop and are embedded within theenergetic ion precipitation but poleward of the mostintense ion precipitation. This result confirms previousstudies regarding the location of the arc [e.g., Jones et al.,1985; Samson et al., 1992] and that the preexisting arcassociated with precipitating electrons accelerated by field-aligned potential drops [Lessard et al., 2007].[26] Ohtani et al. [2010] used DMSP data to establish
the location of various precipitation boundaries relative toRegion 1 and Region 2 currents. They have found that inthe dusk-to-midnight sector, the most equatorward “elec-tron acceleration event” is often at the boundary betweenthe Region 1 and Region 2 currents [Ohtani et al., 2010,Figure 8]. Although Ohtani et al. [2010] did not survey anyauroral image data in combination with DMSP and there-fore could not distinguish “the preexisting arc” from anarbitrary electron acceleration event in the electron energyspectrum, their results are consistent with ours, in that thepreexisting arc is often the equator-most discrete arc. In themidnight-to-dawn sector, however, our result differs fromOhtani et al. [2010]. They found that the most equatorwardelectron acceleration is in general within the Region 2current [Ohtani et al., 2010, Figure 8b] in the post-midnightregion whereas in our event, the preexisting arc is located atthe poleward boundary of the Region 2 currents.[27] It is also of great interest to compare the character-
istics of the “pre-existing arc” we found with those found forbrightened onset arcs. Shiokawa et al. [2005] studied anevent where the FAST spacecraft crossed several brightenedauroral arcs after onset, and found that the most equatorwardarc was located very near the equatorward boundary of theRegion 1 current system. This is consistent with our obser-vation and implied that the auroral arc remains at theboundary between the Region 1 and Region 2 FAC after thesubstorm onset is initiated. In addition, Yago et al. [2005]
found that precipitating electrons associated with a pseudo-breakup arc corresponded to an electron inverted-V structurenear the equatorward edge of the electron precipitation region,whereas Mende et al. [2003] examined FAST crossing of asubstorm breakup arc one minute after onset and found thatthe onset arc was associated with highly intense wave-accelerated electrons. A statistical study by Newell et al.[2010] shows that precipitating power of broadband elec-tron acceleration increases twice as much as that of mono-energetic electron acceleration after substorm onset. Theseresults, in conjunction with our data, suggest that the pre-cipitating electrons associated with the preexisting arc aremainly accelerated by field-aligned potential drops beforeonset, but that after the onset, both waves and field-alignedpotential drops play a role in accelerating electrons into theionosphere.[28] The location of the preexisting arc relative to the inner
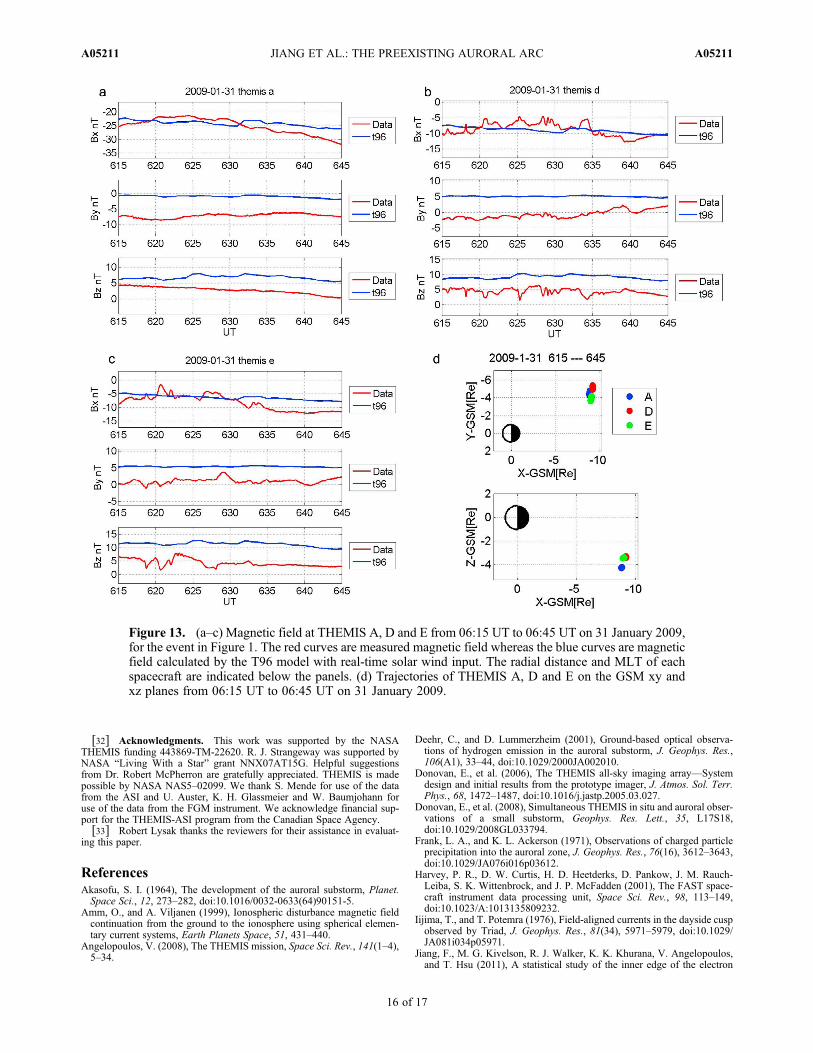
edge of the electron plasma sheet in the ionosphere providesinsight into its location in the magnetosphere. Since we haveobserved that the latitudinal separation between the pre-existing arc and the inner edge is �1� to �2� at low altitudeabove the ionosphere from 2100 MLT to 0300 MLT, thepreexisting arc map to a region a few RE beyond the inneredge of the plasma sheet in this sector. The precise mappinginto the magnetosphere is, however, quite uncertain, andhere the concurrent THEMIS measurements can providesome constraints that we will next consider.[29] Jiang et al. [2011] showed that the inner edge of the
trapped electron plasma sheet is located in a dipolar regionin the inner magnetosphere, at radial distances of 6–7 RE
from the Earth between 2200 and 0600 MLT during geo-magnetically quiet times. This suggests that the preexistingarc could map to a radial distance of �10 RE (�3 RE awayfrom the inner edge) or further tailward as a result of thestretched magnetic field configuration characteristic ofthe growth phase of a substorm. Figures 13a–13c show themagnetic field measured by THEMIS A, D and E located atradial distances of 10�11 RE between 06:15 and 06:45 UTon 31 January 2009, for the event in Figure 1. The red curvesrepresent the observed magnetic field whereas the bluecurves represent the magnetic field calculated from the T96model with solar wind input. Figure 13d displays the pathsof THEMIS A, D and E in the GSM xy and xz planes duringthe half hour of interest. Around the time when FASTencountered the preexisting arc (�06:33 UT), the Bx com-ponent of the T96 modeled magnetic field was very closeto that measured at THEMIS A, D and E, whereas the Byand Bz components were off by a few nT. The discrepancyin the By component mainly shifts the footprint along theazimuthal direction whereas the discrepancy in theBz component, which indicates that the model under-estimates the field stretching, shifts the latitude of the foot-print. In Figures 13a–13c, the modeled Bz component of themagnetic field is �5 nT larger than measured Bz compo-nent, almost a factor of 2 larger, indicating that the realmagnetic field is much more stretched than predicted by theT96 model. This means that the ionospheric footprints of allthree spacecraft must map to lower latitudes than thosefound using the T96 model. Since footprints of the THEMISspacecraft obtained from the T96 model are located �1�poleward of the preexisting arc (Figure 1b), the actual foot-prints must be located very close to or even equatorward
Figure 10. As for Figure 2, auroral indices from 05:00 to09:00 UT on 2 February 2008. The black vertical line at06:51 UT indicates the time FAST crossed the preexistingarc, and the black line at 07:40 UT indicates the time ofauroral brightening.
JIANG ET AL.: THE PREEXISTING AURORAL ARC A05211A05211
13 of 17

Figure 11. (a) FAST data including the arc crossing on 2 February 2008. Panels from top to bottom arethe same as those in Figure 3a. (b) Illustration of the distribution of large-scale FACs in the ionosphereduring weekly disturbed conditions. The red arrow illustrates the trajectory of FAST for the pass shownin Figure 11a.
JIANG ET AL.: THE PREEXISTING AURORAL ARC A05211A05211
14 of 17
of the arc. Plasma measurements on THEMIS D and E(not shown here) indicate that they were embedded withinthe electron plasma sheet and a few RE away from the inneredge around this time. Therefore, the preexisting arc is verylikely to be located in a region a few RE beyond the inneredge. In addition, to test the shift of the spacecraft footprintin the ionosphere for a more realistic magnetic field con-figuration, we took the input variables of the T96 model(solar wind dynamic pressure, the Dst index, and the IMFBy and Bz component) as free parameters, and looked forthe values that minimize the variance between the modeledmagnetic field and the observed magnetic field at THEMISA, D and E. Consistent with the field stretching discussedabove, the modified mapping with optimized input para-meters puts the footprint very near the arc and polewardof the inner edge of the electron plasma sheet observedby FAST.[30] We obtained similar mapping for the two additional
cases listed in Table 1 in which the magnetic field was rel-atively undisturbed during the interval of interest and themapped footprints were located within the FOV of theauroral imagers (case 2 and 3). In these cases once again,the T96 model significantly underestimates magnetic fieldstretching and correcting for this effect, the modified iono-spheric footprints of THEMIS D and E (located around 10 RE
radially) are found to be located near or equatorward of thepreexisting arc. For case 4 there were significant perturba-tions of the magnetic field during the time of interest andsuch temporal variation cannot be modeled or even approx-imated by the T96 model. For case 5 the footprints of theTHEMIS spacecraft were located far outside of the FOV ofauroral imagers. Thus, all cases for which estimated mappingis meaningful support the view that the preexisting arc mapsto a source in the magnetosphere within the electron plasmasheet and tailward of its inner edge. Our mapping of thepreexisting arc to the magnetosphere is also similar to thatobtained by Sergeev et al. [2012]. However, they relate the
magnetospheric source region of the preexisting arc to theisotropy boundary of 30—300 keV electrons caused by largefield line curvature in the magnetotail whereas we relate it toa boundary of large-scale FACs of different polarities.[31] To summarize, from a survey of THEMIS ground
optical data as well as FAST data from 2007 to April 2009,we obtained 5 conjunction events where FAST crossed agrowth-phase or quiescent “preexisting arcs” that remainedvisible and quiescent until it brightened within an hour at thetime of a substorm onset. The arcs were imaged by multipleall-sky cameras and were found to extend over 2–3 h ofMLT. The principal conclusions of our study are as follows:(1) We have confirmed that the precipitating electronsassociated with the preexisting arc are accelerated by field-aligned potential drops; (2) We have found that in the ion-osphere, the preexisting arc is located 1��2� in latitudepoleward of the inner edge of the electron plasma sheet, andthat it maps to a region tailward of the inner edge of theelectron plasma sheet (6–7 RE at the equator) in the mag-netosphere. The radial separation is found to be �3 RE usingmodified T96 model for our relatively undisturbed events.For a very stretched magnetic field configuration (such asthat typical of the late growth phase), the radial separationcan be much larger. Although there is considerable uncer-tainty in the mapping to the equator, it is of interest to notethat these estimates suggest the arc links to an equatorialregion near 8 to 10 RE, with an azimuthal extent of at least2–3 h (or equivalently >4 RE in length). (3) We have shownthat, for all the 5 conjunction events, the “preexisting arc” islocated at or very near to the boundary between the Region 1and Region 2 field-aligned currents, independent of the timebetween the FAST crossing and the time of auroral breakup.This finding constrains the magnetospheric region that is thesource of both the preexisting arc and the arc that brightensat substorm onset. It would be interesting to learn how thisobservation can be incorporated into various models ofsubstorms.
Figure 12. As in Figure 4, distribution of vertical currents in the northern ionosphere at 06:51:10 UT on2 February 2008, the time when FAST encountered the preexisting arc.
JIANG ET AL.: THE PREEXISTING AURORAL ARC A05211A05211
15 of 17
[32] Acknowledgments. This work was supported by the NASATHEMIS funding 443869-TM-22620. R. J. Strangeway was supported byNASA “Living With a Star” grant NNX07AT15G. Helpful suggestionsfrom Dr. Robert McPherron are gratefully appreciated. THEMIS is madepossible by NASA NAS5–02099. We thank S. Mende for use of the datafrom the ASI and U. Auster, K. H. Glassmeier and W. Baumjohann foruse of the data from the FGM instrument. We acknowledge financial sup-port for the THEMIS-ASI program from the Canadian Space Agency.[33] Robert Lysak thanks the reviewers for their assistance in evaluat-
ing this paper.
ReferencesAkasofu, S. I. (1964), The development of the auroral substorm, Planet.Space Sci., 12, 273–282, doi:10.1016/0032-0633(64)90151-5.
Amm, O., and A. Viljanen (1999), Ionospheric disturbance magnetic fieldcontinuation from the ground to the ionosphere using spherical elemen-tary current systems, Earth Planets Space, 51, 431–440.
Angelopoulos, V. (2008), The THEMIS mission, Space Sci. Rev., 141(1–4),5–34.
Deehr, C., and D. Lummerzheim (2001), Ground-based optical observa-tions of hydrogen emission in the auroral substorm, J. Geophys. Res.,106(A1), 33–44, doi:10.1029/2000JA002010.
Donovan, E., et al. (2006), The THEMIS all-sky imaging array—Systemdesign and initial results from the prototype imager, J. Atmos. Sol. Terr.Phys., 68, 1472–1487, doi:10.1016/j.jastp.2005.03.027.
Donovan, E., et al. (2008), Simultaneous THEMIS in situ and auroral obser-vations of a small substorm, Geophys. Res. Lett., 35, L17S18,doi:10.1029/2008GL033794.
Frank, L. A., and K. L. Ackerson (1971), Observations of charged particleprecipitation into the auroral zone, J. Geophys. Res., 76(16), 3612–3643,doi:10.1029/JA076i016p03612.
Harvey, P. R., D. W. Curtis, H. D. Heetderks, D. Pankow, J. M. Rauch-Leiba, S. K. Wittenbrock, and J. P. McFadden (2001), The FAST space-craft instrument data processing unit, Space Sci. Rev., 98, 113–149,doi:10.1023/A:1013135809232.
Iijima, T., and T. Potemra (1976), Field-aligned currents in the dayside cuspobserved by Triad, J. Geophys. Res., 81(34), 5971–5979, doi:10.1029/JA081i034p05971.
Jiang, F., M. G. Kivelson, R. J. Walker, K. K. Khurana, V. Angelopoulos,and T. Hsu (2011), A statistical study of the inner edge of the electron
Figure 13. (a–c) Magnetic field at THEMIS A, D and E from 06:15 UT to 06:45 UT on 31 January 2009,for the event in Figure 1. The red curves are measured magnetic field whereas the blue curves are magneticfield calculated by the T96 model with real-time solar wind input. The radial distance and MLT of eachspacecraft are indicated below the panels. (d) Trajectories of THEMIS A, D and E on the GSM xy andxz planes from 06:15 UT to 06:45 UT on 31 January 2009.
JIANG ET AL.: THE PREEXISTING AURORAL ARC A05211A05211
16 of 17
plasma sheet and the net convection potential as a function of geomagneticactivity, J. Geophys. Res., 116, A06215, doi:10.1029/2010JA016179.
Jones, V., F. Creutzberg, R. L. Gattinger, and F. R. Harris (1985), Auroralstudies with a chain of meridian scanning photometers 1. Observations ofproton and electron aurora in magnetospheric substorms, J. Geophys.Res., 87(A6), 4489–4503, doi:10.1029/JA087iA06p04489.
Lessard, M. R., W. Lotko, J. LaBelle, W. Peria, C. W. Carlson, F. Creutzberg,and D. D. Wallis (2007), Ground and satellite observations of the evolutionof growth phase auroral arcs, J. Geophys. Res., 112, A09304, doi:10.1029/2006JA011794.
Lotko, W., B. U. Ö. Sonnerup, and R. L. Lysak (1987), Nonsteady bound-ary layer flow including ionospheric drag and parallel electric fields,J. Geophys. Res., 92(A8), 8635–8648, doi:10.1029/JA092iA08p08635.
Lui, A. T. Y., and J. R. Burrows (1978), On the location of auroral arcs nearsubstorm onsets, J. Geophys. Res., 83(A7), 3342–3348, doi:10.1029/JA083iA07p03342.
Lyons, L. R., I. O. Voronkov, E. F. Donovan, and E. Zesta (2002), Relationof substorm breakup arc to other growth-phase auroral arcs, J. Geophys.Res., 107(A11), 1390, doi:10.1029/2002JA009317.
McPherron, R. (1970), Growth phase of magnetospheric substorms,J. Geophys. Res., 75(28), 5592–5599, doi:10.1029/JA075i028p05592.
Mende, S. B., C. W. Carlson, H. U. Frey, L. M. Peticolas, and N. Østgaard(2003), FAST and IMAGE-FUV observations of a substorm onset,J. Geophys. Res., 108(A9), 1344, doi:10.1029/2002JA009787.
Mende, S. B., S. E. Harris, H. U. Frey, V. Angelopoulos, C. T. Russell,E. Donovan, B. Jackel, M. Greffen, and L. M. Peticolas (2006), TheTHEMIS array of ground-based observatories for the study of auroralsubstorms, Space Sci. Rev., 141(1–4), 357–387.
Newell, P. T., A. R. Lee, K. Liou, S.-I. Ohtani, T. Sotirelis, and S. Wing(2010), Substorm cycle dependence of various types of aurora, J. Geophys.Res., 115, A09226, doi:10.1029/2010JA015331.
Ohtani, S., S. Wing, P. T. Newell, and T. Higuchi (2010), Locationsof night-side precipitation boundaries relative to R2 and R1 currents,J. Geophys. Res., 115, A10233, doi:10.1029/2010JA015444.
Pfaff, R., C. Carlson, J. Watzin, D. Everett, and T. Gruner (2001), An over-view of the fast auroral snapshot (FAST) satellite, Space Sci. Rev., 98(1–2),1–32, doi:10.1023/A:1013187826070.
Pulkkinen, A., O. Amm, and A. Viljanen (2003), Ionospheric equivalentcurrent distributions determined with the method of spherical elementarycurrent systems, J.Geophys. Res., 108(A2), 1053, doi:10.1029/2001JA005085.
Samson, J. C., L. R. Lyons, P. T. Newell, F. Creutzberg, and B. Xu (1992),Proton aurora and substorm intensifications, Geophys. Res. Lett., 19(21),2167–2170, doi:10.1029/92GL02184.
Sergeev, V., Y. Nishimura, M. Kubyshkina, V. Angelopoulos, R. Nakamura,and H. Singer (2012), Magnetospheric location of the equatorward pre-breakup arc, J. Geophys. Res., 117, A01212, doi:10.1029/2011JA017154.
Shiokawa, K., K. Yago, K. Yumoto, D. G. Baishev, S. I. Solovyev, F. J.Rich, and S. B.Mende (2005), Ground and satellite observations of substormonset arcs, J. Geophys. Res., 110, A12225, doi:10.1029/2005JA011281.
Tsyganenko, N. (1995), Modeling the Earth’s magnetospheric magneticfield confined within a realistic magnetopause, J. Geophys. Res., 100(A4),5599–5612, doi:10.1029/94JA03193.
Vasyliunas, V. M. (1972), The interrelationship of magnetospheric pro-cesses, in Earth’s Magnetospheric Processes, edited by B. M. McCormac,pp. 29–38, D. Reidel, Hingham, Mass., doi:10.1007/978-94-010-2896-7_3.
Voronkov, I., E. Donovan, B. Jackel, and J. Samson (2000), Large-scalevortex dynamics in the evening and midnight auroral zone: Observationsand simulations, J. Geophys. Res., 105(A8), 18,505–18,518, doi:10.1029/1999JA000442.
Weimer, D. R., D. M. Ober, N. C. Maynard, M. R. Collier, D. J. McComas,N. F. Ness, C. W. Smith, and J. Watermann (2003), Predicting interplan-etary magnetic field (IMF) propagation delay times using the minimumvariance technique, J. Geophys. Res., 108(A1), 1026, doi:10.1029/2002JA009405.
Weygand, J. M., O. Amm, A. Viljanen, V. Angelopoulos, D. Murr, M. J.Engebretson, H. Gleisner, and I. Mann (2011), Application and validation ofthe spherical elementary currents systems technique for deriving ionosphericequivalent currents with the North American and Greenland ground magne-tometer arrays, J. Geophys. Res., 116, A03305, doi:10.1029/2010JA016177.
Yago, K., K. Shiokawa, K. Hayashi, and K. Yumoto (2005), Auroral parti-cles associated with a substorm brightening arc, Geophys. Res. Lett., 32,L06104, doi:10.1029/2004GL021894.
Yahnin, A. G., V. A. Sergeev, B. B. Gvozdevsky, and S. Vennerstrom(1997), Magnetospheric source region of discrete auroras inferred fromtheir relationship with isotropy boundaries of energetic particles, Ann.Geophys., 15, 943–958, doi:10.1007/s00585-997-0943-z.
V. Angelopoulos, F. Jiang, K. K. Khurana, M. G. Kivelson, R. J.Strangeway, R. J. Walker, and J. M. Weygand, Department of Earth andSpace Sciences, University of California, Los Angeles, CA 90095, USA.([email protected])E. Donovan, Department of Physics and Astronomy, University of
Calgary, Calgary, AB T2N 1N4, Canada.Y. Nishimura, Department of Atmospheric and Oceanic Sciences,
University of California, 405 Hilgard Ave., Los Angeles, CA 90095, USA.
JIANG ET AL.: THE PREEXISTING AURORAL ARC A05211A05211
17 of 17