Embed Size (px)
Citation preview
Instructions for use
Title In-Situ Observations of Growth Process of Clathrate Air-Hydrates Under Hydrostatic Pressure
Author(s) Uchida, Tsutomu; Hondoh, Takeo; Mae, Shinji; Duval, Paul; Lipenkov, Volodia Ya.
Citation Physics and chemistry of ice. Edited by Norikazu Maeno, Takeo Hondoh. pp.121-125
Issue Date 1992
Doc URL http://hdl.handle.net/2115/35632
Type proceedings
Note 7th International Symposium on the Physics and Chemistry of Ice. 1-6 September 1991. Sapporo, Japan
File Information uchida.pdf
Hokkaido University Collection of Scholarly and Academic Papers : HUSCAP

In-Situ Observations of Growth Process of Clathrate Air- Hydrates Under Hydrostatic Pressure Tsutomu Uchida*, Takeo Hondoh* , Shinji Mae* , Paul Duval** and Volodia Ya. Lipenkov***
* Dept. of Applied Physics, Hokkaido Uni v., Sapporo, Hokkaido 060, Japan * * Laboratoire de Glaciologie et Geophysique de l'Environnement, 38402 St Martin d ' Heres Cedex, France
* * * Arctic and Antarctic Research Institute, Leningrad 199226 U. S. S. R.
ABSTRACT: The optical microscopic observations of the growth processes of air-hydrate crystals from air bubbles included in deep ice cores were carried out under high hydrostatic pressure. The transformation from a bubble to an air-hydrate crystal occurred when the annealing pressure was higher than the theoretical one of the airhydrate dissociation. The growth patterns of the crystal could be classified into two types .
The crystal growth rates were measured using the microscopic images and they related linearly to the excess pressure over the dissociation one at each annealing temperature. The relation indicates that the rate-determining process of the crystal growth is mainly the flux of air and water molecules to the crystal surface. The observed t wo different growth patterns can be explained in terms of the supply processes of water molecules to the surface .
1 . INTRODUCTION
Air bubbles in polar glacier ice are formed during the densification process of firn into ice. The composition of gas in the ice is essentially the same as that of the atmosphere at the time of the bubble formation, thus the analyses of the gas in the ice allow us to investigate the past atmospheric conditions. Air bubbles, however, disappear at several hundreds meter depth of ice sheet because of the high hydrostatic pressure, and translate into clathrate air-hydrate crystals. The crystal had been predicted by Miller(l) to exist in deep ice sheet, and was discovered in fresh deep ice core drilled at Dye-3 station, Greenland(2). The depth distributions of air-hydrate crystals were studied in Vostok deep ice cores(3). It was observed that there were certain relations between the variations of the mean volume or the number concentration of air-hydrates and the climatic change. The air-hydrate crystal is, therefore, the important substance for the storage of the past atmospheric gas and for the indicator of the climatic changes . Moreover, the formation of air-hydrate crystals in the ice sheet changes the ice densification rate and affects appreciably on the depthdensit y profile in the transition zone,
Physics and Chemistry of Ice Edited by N . maeno and T. Hondoh Hokkaido University Press, 1992, Sapporo 121
where air bubbles disappear while airhydrates are for~ed. So three stages of the ice densification below the pore close-off could be distinguished(4). The experimental studies of the growth processes of air-hydrate crystals are, therefore, necessary for studying the past atmospheric conditions from the gas analyses of ice core and the ice densification processes in the transition zone. However, the physical interpretations of the growth processes of airhydrates in ice have not been revealed.
In the present study, the in-situ observation of a bubble included in Vostok ice core was performed under high hydrostatic pressure using an optical micro-scope to study the growth processes of air-hydrate crystals. The results showed that an air-hydrate crystal was transformed from the bubble under higher pressure than that of the air-hydrate dissociation predicted by Miller(l) and that the crystal growth patterns classified into two types . For the physical analyses of the growth processes, the crystal growth rates under var ious annealing conditions have been measured. It was found that the growth rates increased with increasing the excess pressures over the dissociation one. Two growth patterns and the linear relation

I between the growth rate and the excess pressure are discussed by assuming two rate-determining processes ; the flux and the supply of air and water molecules to the crystal surface.
2. EXPERIMENTAL METHODS
3 Specimens (about 20x20x5 mm) were prepared from Vostok ice core (1514m), which included some air bubbles. These bubbles are presumed to have been formed by the air- hydrate dissociation after the ice recovery from ice sheet because no bubble was observed in the fresh Vostok ice core deeper than 1250m(5). The bubble was expected to have kept the structures of clathrate hydrate yet and, therefore, to be recomposed easily under high hydrostatic pressure. The surfaces of the specimen were planed to diminish the light scattering and to give clear images of the bubbles in it. Then the specimen was set in the high pressure vessel (HPV) equipped with plastic glass windows (see Fig . 1). The vessel was filled with silicone oil, and was pressurized by an oil pump. The growth process of an air-hydrate was observed under an optical microscope (OMS) and each figure of the crystal during the experiment was recorded by photographs or video tapes. Experiments were conducted at the temperature range from 265 to 270K over the pressure range from 10 to 20MPa. The excess pressure of each experimen t over the dissociation pressure of airhydrate calculated by Miller(l) are ranged from a bout 3 to 9MPa. The pressure condition was kept within ±lMPa during each experiment which had continued for more than a week.
5
Fig. 1: A schematic diagram of the in- situ observation system. (S: sample, HPV: high pressure vessel, OMS: optical microscope, LC: load cell, TC: CC thermocouple, V: value, Ins.: insulation, and REC.: r ecorder)
122
3. RESULTS
Fig. 2 shows the typical transforming process of an air bubble (opaque) into an air-hydrate (transparent) at 269.9K and 18MPa. The r apid shrinkage of the bubble started just after the pressurizat ion (Figs. 2a to b), and it went on for several hours. This rapid process was caused by the plastic deformation of the s urrounding ice driven by the difference between the bubble pressure and the applied one. Subsequently, the air-hydrate crystal began to grow from the ice/bubble interface to the inside of the bubble as shown in Figs. 2c to d. This took more than a week to complete.
The microscopic observations revealed that the growth processes of the airhydrate crystals were classified into two types illustrated in Figs. 3(A) and (B). Type (A): The air-hydrate crystal
started to grow from the boundary between bubble and ice, and progressed
. ' • .. 300.um •
©
Fig. 2: Transforming process of an air bubble into an air-hydrate at 269.9K and 18MPa. (a) Before pressurization;
bubbles were opaque, (b) 1 hour after pressurization, (c) 78 hours, air-hydrate crystal growing
(transparent), (d) 164 hours, the bubble changed to air
hydrate completely.
I·
0.05 (oJ ' (b) 0.--0--
EO,04! ~ .§: O~v
V1 0.03 j O~ ~ 002 0,....0--
~ oJ i 0.01 O-tL-'"-ZO~-'-7.I,Q:--'--::60~"-;8:;;0-'-~I;;!;OO;--'"'
TIMEIHJ\RJ CAl
0.03 0 40 80 120 160 200 [ B 1 TIME (HOUR1
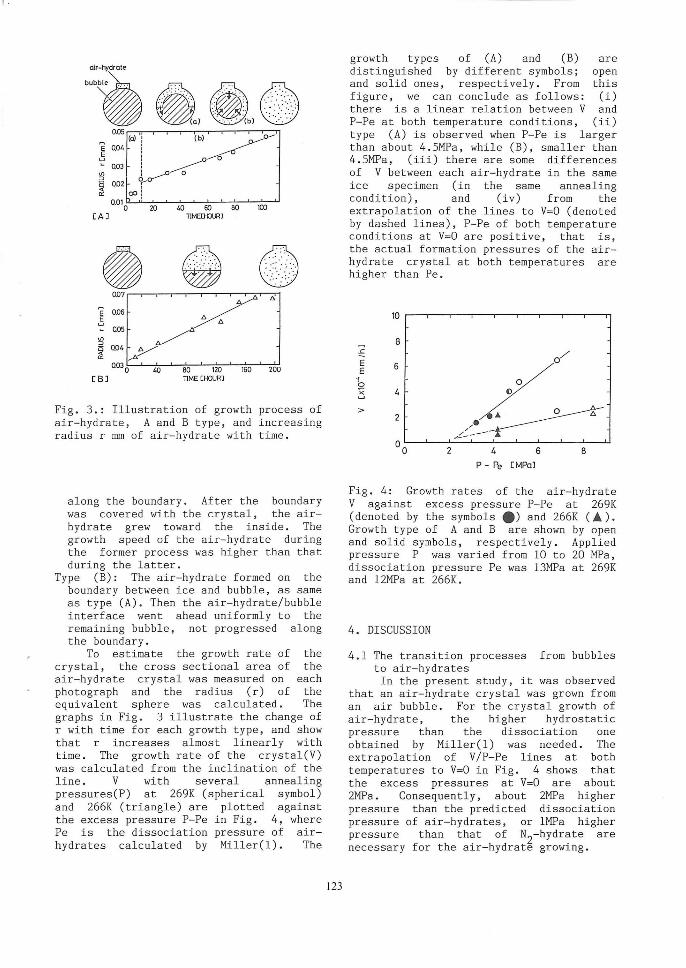
Fig. 3. : Illustration of growth process of air-hydrate, A and B type, and increasing radius r mm of air-hydrate with time.
along the boundary. After the boundary was covered with the crystal, the airhydrate grew toward the inside. The growth speed of the air-hydrate during the former process was higher than that during the latter.
Type (B): The air-hydrate formed on the boundary between ice and bubble, as same as type (A). Then the air-hydrate/bubble interface went ahead uniformly to the remaining bubble, not progressed along the boundary.
To estimate the growth rate of the crystal, the cross sectional area of the air- hydrate crystal was measured on each photograph and the radius (r) of the equivalent spher e was calculated. The graphs in Fig. 3 illustrate the change of r with time for each growth type, and show that r increases almost linearly with time. The growth rate of the crystal(V) was calculated from the inclination of the line. V with several annealing pressures(P) at 269K (spherical symbol) and 266K (triangle) are plotted against the excess pressure P- Pe in Fig. 4, where Pe is the dissociation pressure of airhydrates calcul ated by Mil l er(l). The
123
growth types of (A) and (B) are distinguished by different symbols; open and solid ones, r espectively. From this figure, we can conclude as follows: (i) there is a linear relation between V and P-Pe at both temperature conditions, (ii) type (A) is observed when P- Pe is larger than about 4.5MPa, while (B), smaller than 4.5MPa, (iii) there are some differences of V between each air-hydrate in the same ice specimen (in the same annealing condition), and (iv) from the extrapolation of the lines to V=O (denoted by dashed lines), P-Pe of both temperature conditions at V=O are positive, that is, the actual formation pressures of the airhydrate crystal at both temperatures are higher than Pe.
10
a ~
,.£~-E 6 E
b S 4
> 2
/~.:::----t 0
0 2 4 6 B
P - Pe 0-1Pal
Fig. 4: Growth rates of the air- hydrate V against excess pressure P-Pe at 269K (denoted by the symbols .) and 266K (A). Growth type of A and B are shown by open and solid symbols, respectivel y. Applied pressure P was varied from 10 to 20 MPa, dissociation pressure Pe was 13MPa at 269K and 12MPa at 266K.
4. DISCUSSION
4.1 The transition processes from bubbles to air- hydrates In the present stud y, it was obser ved
that an air-hydrate crystal was grown from an air bubble. For the crystal growth of air-hydrate, the higher hydrostatic pressure than the dissociation one obtained by Miller(l) was needed. The extrapolation of V/P-Pe lines at both temperatures to V=O i n Fig. 4 shows that the excess pressures at V=O are about 2MPa. Consequently, about 2MPa higher pressure than the predicted dissociation pressur e of air-hydrates, or 1MPa higher pressure than that of N2- hydrate are necessary for the air- hydrate growing.

Shoji and Langway(6) observed that the shallowest depth at which air-hydrate crystals appeared was close to the N2-hydrate line at the drilling sites of Dye-3 and Camp Century, Greenland. Comparing these results with the present study, the transition from a bubble to an air- hydrate seems to need the higher pressure than the dissociation pressure of N
2- hydrate.
However, because the reaction tlme scale of the present study is extremely shorter than that in ice sheet, the larger excess pressure may be required for the observation. On the other hand, the real excess pressures in bubbles may be different from the experimental ones because the pressurization process of the bubbles depends on the plastic deformation of the surrounding ice. This assumption is supported by the variation of V for each air- hydrate crystal in the same ice as described in results. We can, therefore, conclude experimentally that a higher pressure than the theoretical one of the air-hydrate dissociation is necessary for the transition from a bubble to an airhydrate.
The shapes of the experimental crystal were mostly irregular. In the ice sheet, there are many polyhedral airhydrates (2, 3). The polyhedral crystal is thought to be formed after the changing to the air- hydrate and it takes a long time because it is caused by the diffusion of air molecules through the ice lattice. The observed growth rates of the air- hydrates were, however, very high compared with the time scale of the ice sheet f l ow under the same conditions. The reaction time might be too short to form the polyhedral crystal in the present study. It can be considered that the air molecule diffusion through the ice lattice did not occur during these experiments because airhydrates had the irregular shapes and their volumes were the same as those of bubbles after their rapid shrinkage.
It is concluded, therefore, that in the present study an air-hydrate crystal was formed from an air bubble, and the crystal was constructed by using the air molecules contained initially in the bubble.
4.2 Qualitative interpretations of the transition processes Air and water molecules are necessary
for the air-hydrate construction. In the previous section, it is considered that air molecules for composing the airhydrate crystal have existed only inside of the bubble. Water molecules, however, are expected to be supplied from the
124
surrounding ice matrix because the partial pressure of water in the air bubble is too small to construct the air-hydrate crystal. If enough number of molecules existed in the bubble, the air- hydra'te crystal would be formed under a suitable condition, and its growth rate would be controlled by the formation process of the clathrate structure. The crystal growth rate depends on the flux of the components to the crystal surface, which is interpreted by the Hertz- Knudsen's equation:
K.v V (P- Pe) (I)
where m is the mean weight of air molecules, k is constant, v is the mean volume of an air molecule in the crystal, T and P- Pe is temperature and the excess pressure of the experiment, respectively, and K is the reaction rate constant(7). Eq. (I) shows that V depends linearly on the excess pressure. This corresponds to
the linear relation between V and P- Pe at a certain temperature, shown in Fig . 4.
The temperature dependence of V, which is shown as the gradient of the line in the same figure, appears to be large, considering the small temperature difference of two experiments. Shoji and Langway(6) observed that the phase boundary energy between the air-hydrate and surrounding ice is much higher than the grain boundary energy. This high phase boundary energy would cause the large temperature dependence of the crystal formation.
Consequently, the growth processes of air- hydrate crystals from bubbles depend on both the reaction process of the crystal formation at the surface and the supply process of water molecules to the crystal surface . Then both (A) and (B) growth types can be explained in terms of the alternative process discussed above . (A) type, which is observed at the condition of higher excess pressure , would be affected by the supply pr'ocess of water molecules because higher excess pressure gives the larger flux of the components to the interface. Water molecules which are supplied from the surrounding ice are spent rapidly for constructing the airhydrate crystal, so the crystal is formed along the boundary of ice and bubble. After the boundary covered with the crystal, water molecules have to be supplied to the bubble/air- hydrate boundary through the air-hydrate crystal . So the growth rate of the crystal

decreases at the boundary between (a) and (b) in Fig. 3(A). On the other hand, (B) type may be controlled mainly by the reaction process of the clathrate structure formation. If the reaction rate is low, enough water molecules would be supplied to the boundary to compose the crystal. The uniform advance of the boundary between the air-hydrate crystal and the bubble supports this assumption.
5. CONCLUSION
In-situ observations of the growth processes of the air-hydrate crystal in the ice were performed under high hydrostatic pressure using an optical microscope. The air-hydrate crystal was formed only when the annealing pressure was higher than the dissociation one calculated by Miller(l). The growth rate of the crystal linearly depended on the excess pressure over the dissociation pressure of air-hydrate. Two transition types from an air bubble to an air-hydrate were observed under the different annealing conditions. These results showed that the growth processes of the airhydrate crystal in ice were interpreted by assuming two rate- determining processes, that is, the construction of the clathrate structure on the crystal surface and the supply of water molecules to the interface between the bubble and the air-hydrate.
125
Acknowledgment
The authors would like to acknowledge all Soviet and French participants for the drilling, the field work, and the ice sampling of the Vostok ice core. We are grateful to the late Professor T. Kuroda and Dr. J. Ocampo for helpful discussions. The present work was supported financially by the Asahi Glass Foundation and the Science and Technology Agency.
REFERENCES
1. S. L. Miller, 1969, Science 165, 489. 2. H. Shoji and C. C. Langway, Jr., 1982,
Nature, 298(5874), 548. 3. T. Uchida, T. Hondoh, S. Mae, V. Ya.
Lipenkov, and P. Duval, to be published. 4. V. Ya. Lipenkov, A. N. Salamatin and
Yu. A. Grigoryeva, 1989, Materialy Glyasiologicheskikh Issledovaniy, 65, 49, (in Russian).
5. N. I. Barkov and V. Ya. Lipenkov, 1985, Materialy Glyasiologicheskikh Issledovaniy, 21, 178, (in Russian).
6. H. Shoji and C. C. Langway, Jr., 1987, J. Phys. 48, Colloq. C1, 551.
7. T. Kobayashi and T. Kuroda, "Morphology of Crystals", edited Sunagawa (TERRAPUB, Tokyo, 1987),
in by I. 645.