Embed Size (px)
Citation preview

In-service emissions performance of Euro 6/VI vehicles. A summary of testing using London drive cycles.

2
Contents
Background........................................................................................................................ 3
1. The Legislation ........................................................................................................... 3
2. The change in emissions requirements from Euro 5/V to Euro 6/VI ............................. 4
3. Euro 6 for Light Duty Vehicles .................................................................................... 5
3.1 Real Driving Emissions ............................................................................................. 6
3.2 Technical solutions for Light Duty Vehicles ............................................................. 7
4. Euro VI for Heavy Duty Vehicles ................................................................................. 7
4.1 Technical Solutions for heavy duty vehicles ............................................................ 8
5. The NOx problem ....................................................................................................... 9
6. Likely effectiveness of Euro VI .................................................................................. 10
7. A programme of testing ............................................................................................ 11
8. Test results – passenger car ...................................................................................... 12
9. Test results – light & heavy goods vehicles................................................................ 15
10. Conclusions .......................................................................................................... 18

3
Background
In Europe, all new vehicles must go through a process of type-approval to ensure that they
conform to common standards. Part of this process includes standards for the control of
emissions from the vehicle. The Euro 1 standard for light duty vehicles, and heavy duty
engines, became mandatory for new vehicles in 1993. Since then a series of progressively
tighter Euro emissions standards have required vehicle manufacturers to incorporate new
technology to control exhaust emissions from road vehicles.
This paper firstly considers the legislative and technical background to the more recent Euro
emissions standards. It then summarises initial results from a programme of TfL testing of
the newest (Euro 6) vehicles. These tests show that, under London driving conditions,
emissions of the key pollutant, NOx, are reduced from those of vehicles certified to Euro 4/5
in broad proportion to the reductions expected on examination of the COPERT 4 emissions
functions. This is important because the COPERT 4 functions are designed to represent ‘real’
driving conditions and are widely accepted for emissions modelling purposes.
1. The Legislation
Originally founded in EC directive 70/220/EEC, subsequently replaced by directive 717/2007
for Light Duty vehicles (cars and vans) and 88/77/EEC, later replaced by 05/55/EC for Heavy
Duty vehicles (HGVs and buses - HDVs), the Euro standards are a range of successively
tightening emissions limits for petrol, gas and diesel engines. Compliance with these
emissions limits must be demonstrated as part of the European type-approval process for
new vehicles and road vehicle engines. There are also ‘durability’ requirements to
demonstrate continued in-service compliance.
Light Duty vehicles (cars and vans) are subject to whole-vehicle emissions testing, whilst
Heavy Duty engines are emissions tested and approved using an engine dynamometer
‘bench’ test. The limit values are different for each vehicle type, and to indicate which is
being discussed, there is a convention that suggests that Euro 6 refers to cars and vans
(whole vehicle emission testing), whilst Euro VI refers to Heavy Duty Vehicles (HDVs) and
buses (engine only emissions testing).
In each case, the Euro standards set out emissions limits for type approval testing that
control four ‘legislated’ emissions, carbon monoxide (CO), hydrocarbons (HC), oxides of
nitrogen (NOx) and particulate matter (PM). The use of ‘bench’ testing for Heavy Duty
engines, with emissions measured in grammes per kilowatt-hour (g/KWh) mean that the type
approval levels cannot readily be compared with on-highway emissions measurements.
The latest iteration of these standards, Euro VI, has been mandatory for all new heavy duty
engines for HDVs and buses since January 2014 , whilst Euro 6 will be mandatory from

4
September 2015 for cars and light vans, and September 2016 for larger vans up to 3500 kg
gross vehicle weight.
Euro standards for motorcycles, mopeds, tricycles and quadricycles (collectively category L
vehicles) were instigated later than for larger vehicles. The current standard, being Euro 3, has
a NOx limit of 0.15 g/km, which is the same value as a Euro 3 passenger car. Euro 4 for
category L vehicles comes into force in 2017.
2. The change in emissions requirements from Euro 5/V to Euro 6/VI
The Euro 6 standard for emissions from light duty cars and vans was defined in UN ECE
Regulation 715/2007. The main change is a reduction in the limit for NOx from diesel engines
of 55 percent. For diesel cars at Euro 6, the NOx limit reduces from 0.18g/km to 0.08g/km,
whilst the other legislated emissions remain unchanged from the previous standard, which
was Euro 5b. Euro 5b has been mandatory for new cars since January 2013 and introduced a
particle number limit for diesel engines, the first time that a count of particles, rather than a
total mass, has been regulated.
Euro 6 petrol engine emissions limits are unchanged from Euro 5, except for the introduction
of a particle number limit, in line with that of diesel engines. Passenger cars sold after
September 2015 must conform to this limit, although early versions are available sooner.
These early examples are approved over the existing New European Drive Cycle (NEDC), but
in 2017, a new World Light-duty Test Procedure (WLTP) will be introduced along with a
requirement to verify the emissions performance in on-highway driving, known as Real
Driving Emissions (RDE). Details of the WLTP and RDE are yet to be finalised by the
Commission and interested parties. For larger vans (N1 class 2 and N1 class 3), the diesel
engine NOx limit is similarly decreased by 55 percent.
European Regulation UN ECE 595/2009 , introduces the Euro VI standard for heavy duty
diesel engines. It reduces the limit for NOx emissions by 77 percent, whilst continuing to set
demanding limits for control of particulates and other gases. In addition, the test protocol
has been changed to broaden the range of speed/load conditions over which the engine must
meet the emissions limits.
Additionally, for Heavy Duty diesel engines, an ammonia (NH3) concentration limit of 10 ppm
applies to diesel (WHSC + WHTC) and gas (WHTC) engines. This has been introduced to
control ammonia slip from Selective Catalytic Reduction systems used to control NOx
emissions. A further proposed measure to limit the NO2 component of NOx emissions
(known as primary NO2) may be defined at a later stage.
Some Euro VI provisions, including an extended on-board diagnosis (OBD) and certain testing
requirements are to be phased-in by 2016 for new types and 2017 for all new vehicles,
although this is yet to be confirmed by the European Commission.

5
3. Euro 6 for Light Duty Vehicles
Emissions are currently tested over the New European Drive Cycle (NEDC) chassis
dynamometer procedure. The whole vehicle is tested and all emissions are expressed in
g/km. Much has been written (including in the popular press) about the extent to which the
NEDC fails to represent the real-world driving characteristics of light-duty cars and vansi.
This has led to, inter alia, a discrepancy between published fuel consumption (and CO2
emissions) for new cars and their in-service performance. Figure 1 below shows the generic
nature of the existing New European Drive Cycle.
Figure 1 New European Drive Cycle (NEDC).
In comparison, the new World-Harmonised Light-duty Test Cycle (WLTC) is shown below. In
fact there are three cycles for cars and light vans. The appropriate cycle is chosen according
to the power-to-weight ratio of the vehicle. The example below is for class 3, the highest
power-to-weight ratio group. The test is 30 percent longer in duration and more transient in
nature than the NEDC. The test average speed is 46.5 km/h. (NEDC = 40.65 km/h). This new
suite of light duty test cycles should better represent real driving conditions. The new WLTC
is expected to be introduced in 2017.
0.0
20.0
40.0
60.0
80.0
100.0
120.0
140.0
0 200 400 600 800 1000 1200 Time (Seconds)
Phase 1 - ECE Cycle
Phase 2 - EUDC Cycle
Sp
eed
(km
/h)

6
Figure 2 World Light-Duty Test Cycle (WLTC).
3.1 Real Driving Emissions
A further requirement for Euro 6 is for manufacturers to verify the emissions performance of
their vehicles in on-highway driving, using portable emissions measurement equipment
(PEMS). This process is known as Real Driving Emissions (RDE). It is not possible for a vehicle
to meet the Euro 6 type approval emissions limits under all driving conditions that may be
encountered, since the duty cycle that the vehicle is operated over may be more demanding
than the test cycles. Therefore a ‘conformity factor’ must be agreed by all parties and
applied to the on-highway measurements. This would take the form of a multiplication
factor. If, for example, the conformity factor were set at 1.5, then the measured on-highway
emissions would be allowed to be up to 1.5 times the type approval limit value. At the time
of writing, there is no agreement between motor manufacturers and the European
Commission on the appropriate level for this conformity factor for Euro 6/VI, nor the date of
implementation.
There are certain other detail matters to be agreed regarding RDE. These include the test
protocol with regard to altitude and extremes of temperature.
The proposed implementation dates for RDE for light duty vehicles are 2016 for new types
and 2017 for existing model ranges, at which time data will be collected to inform the
‘conformity factor’ debate. It is proposed that vehicle types already type approved at Euro 6
will have to demonstrate compliance with the RDE requirements by 2018. However, since
these dates are yet to be agreed between motor manufacturers and the European

7
Commission any further delay will reduce the efficacy of Euro 6 as a number of vehicles may
require some recalibration to meet RDE. Table 1 sets out the implementation dates for Euro
6/VI.
Table 1 Euro 6/VI implementation dates.
Standard Test protocol New
heavy
duty
engines
All heavy
duty
engines
new cars
& car
derived
vans
All cars &
car
derived
vans
New
larger
vans up
to 3500kg
gvw
All larger
vans up
to 3500kg
gvw
Euro VI On-highway
verification Jan-13 Jan-14
Euro 6a NEDC test cycle
Sep-14 Sep-15 Sep-15 Sep-16
Euro 6 b WLTP test cycle
2016 2017 2016 2017
Euro 6c RDE verification
provisionally
2017
provisionally
2018
provisionally
2017
provisionally
2018
3.2 Technical solutions for Light Duty Vehicles
Euro 5 for light duty diesel vehicles required an 80 percent reduction in particulate matter, to
0.005g/km (from Euro 4). This effectively mandated diesel particulate filters on new cars and
vans. At the same time NOx emissions limits were reduced by 28 percent. For Euro 6, the
particulate limit stays the same, but NOx is further reduced by 65 per cent. Achieving such a
reduction will require sophisticated after-treatment, such as advanced exhaust gas
recirculation (EGR), Lean NOx Traps (LNT) or, selective catalytic reduction (SCR), to reduce
NOx levels. Use of SCR has the advantage that diesel engine manufacturers can use levels of
fuel injection timing that will actually increase “’engine-out’ NOx, thus improving power and
fuel consumption, in the knowledge that the SCR system can be calibrated to reduce the
NOx to allowable levels.
For Euro 6 light duty petrol engines, the emission limits are unchanged from those at Euro 5,
so current three-way catalyst technology will continue to be the norm. However, some
recalibration may be necessary for the forthcoming Worldwide Harmonized Light Vehicles
Test Procedure (WLTP).
4. Euro VI for Heavy Duty Vehicles
For Heavy Duty vehicles, the engine is tested in isolation as part of a “bench test”. An
approved engine may then be used in many different vehicle applications, which may lead to
differing fuel consumption and emissions performance. The regulatory emission test cycles
have evolved through a number of stages. With the advent of Euro VI, diesel engines are
tested over the World Harmonised Stationary Cycle (WHSC) and the World Harmonised

8
Transient Cycle (WHTC) tests, while positive ignition (gas) engines are tested over the WHTC
only. These new cycles are designed to overcome some of the problems experienced with
earlier type-approvals whereby an engine passing the type-approval emissions requirements
performed very differently in-service, according to the vehicle application.
One of the key changes is the introduction of off-cycle testing (OCE), as introduced by Euro
VI regulations. OCE measurements, performed during the type approval testing, follow the
NTE (not-to-exceed) limit approach. A control area is defined on the engine fuelling control
map (there are two definitions, one for engines with a rated speed < 3000 rpm, and another
for engines with a rated speed ≥ 3000 rpm). The control area is divided into a grid. The
testing involves random selection of three grid cells and emissions measurement at 5 points
per cell. This is a more exacting requirement than was set by the previous ETC and ESC and
seeks to avoid the situation seen under previous emissions standards where off-cycle
emissions could be higher than anticipated.
Euro VI regulations also introduced in-use testing requirements that involve field
measurements using Portable Emissions Measurement Systems (PEMS). The testing is
conducted over a mix of urban (0-50 km/h), rural (50-75 km/h) and motorway (> 75 km/h)
conditions, with exact percentages of these conditions dependent on the vehicle category.
The first of these in-use tests is conducted at the time of type approval emissions testing.
Further tests are conducted as part of in-service conformity testing.
Effective from 2005 and 2006, manufacturers must also demonstrate that heavy-duty
engines comply with the emission limit values over an extended operating lifespan
dependent on the vehicle category. These durability requirements have been extended for
Euro VI, to 160,000km/5 years for vans and to 700,000km/7 years for the heaviest HGVs and
buses. This requirement, a part of type approval, must demonstrate verification of the
correct operation of the emission control devices during the normal life of the vehicle under
normal conditions of use (“conformity of in-service vehicles properly maintained and used”).
In practice, vehicles are recalled from service to undergo in-service conformity testing.
4.1 Technical Solutions for heavy duty vehicles
For heavy duty diesel engines NOx has been progressively reduced throughout the lifespan
of the Euro standards and this continues at Euro VI. All engine manufacturers have utilised
either EGR or SCR to comply at Euro V. For Euro VI, many use both systems in combination
as the NOx limit is further reduced by 77 per cent on the transient test cycle. Meanwhile
particulate mass limits are reduced by a further 60 per cent, which will necessitate the
fitment of diesel particulate filters as well.
This level of after-treatment equipment will add to the cost, weight and complexity of the
vehicle. For a premium tractor unit, the additional cost is rumoured to be as much as
£10,000, whilst weight penalties may be in the region of eighty kilogrammes, when

9
compared with Euro V. Any theoretical fuel consumption penalty is likely to be mitigated by
developments in engine calibration that increase the fuel injection advance, improving torque
at lower engine speeds and reducing fuel consumption. The sophisticated SCR/EGR
combinations would compensate for the resultant engine-out NOx emissions.
5. The NOx problem
Since the Euro standards first became mandatory for new vehicles in 1993, there have been
successive reductions in the permissible limits for four legislated air quality pollutants;
carbon monoxide (CO), hydrocarbons (HC), oxides of nitrogen (NOx) and particulate matter in
the ten micron size range (PM10). The test procedure has also given rise to the official test of
carbon dioxide (CO2) emissions and fuel consumption used for vehicle excise duty and new
car advertising. Of these, NOx and PM10 are the emissions of greatest interest because of
their effects on human health and EU legislation limiting permissible ambient
concentrations. Particulate emissions from diesel exhaust are increasingly well controlled,
giving rise to new attention on particulate emissions arising from tyre and brake wear.
However, NO2 ambient concentrations, and therefore NOx emissions, remain a significant
challenge.
Despite permissible limits of NOx emissions at type approval reducing significantly, in-
service emissions have, in reality, not reduced by anything approaching that amount. For
example, in 1993 the permissible limit for NOx emissions from a heavy duty diesel engine
was 8 g/KWh. In 2009, Euro V stipulated 2 g/KWh and for Euro VI in 2014, the limit is 0.40
g/KWh. However, emissions measured at the roadside, or in the test laboratory, are
frequently of a much greater magnitude.
This is widely attributed to what are known as ‘off-cycle emissions’. This effect may be
viewed as a failure of the legislation, since the type-approval tests are tightly prescribed and
engine manufacturers are obliged to develop specific control strategies to ensure a
satisfactory test. However, once type-approved, a heavy duty engine (or a complete car or
van in the case of light duty vehicles) may well be operated to different duty cycles to those
of the initial approval. Under these circumstances the engine emissions will be quite
different to those seen at type-approval, frequently resulting in higher emissions of NOx.
This has led to widespread observations of NOx emission levels much greater than the type-
approval legislation would suggest might be expected. This phenomenon has been widely
reported for Euro V heavy duty vehicles.
In drafting the legislation for Euro 6/VI, steps have been taken by the European Commission
to correct this problem. For heavy duty diesel engines, where the approval takes the form of
an engine-dynamometer ‘bench’ test, the engine must conform to the required limits over a
broader window of speed and load settings. This is followed up by a requirement to verify
the emissions performance over a period of on-highway driving with portable emissions
analysis equipment fitted to the complete vehicle. These new measures seem, at this early

10
stage, to be effective in controlling ‘off-cycle emissions’ much more successfully than
before. However, they still do not guarantee universal compliance with the standard under all
driving conditions.
Authorities across Europe have a responsibility to work towards Limit Values for ambient
concentrations of nitrogen dioxide (NO2). A principal source of NO2 is the NOx emitted
from road vehicle exhausts, particularly from diesels. NO2 is, for the most part, formed when
nitric oxide (NO) present within the exhaust gases oxidises within the atmosphere to form
NO2. Thus, one way to control NO2 formation is to reduce emissions of NOx and its
constituent NO.
However, efforts to reduce emissions of particulate by the use of diesel particulate filters on
both light and heavy vehicles, has had the unintended consequence of increasing emissions
of NO2 direct from the vehicle exhaust (known as primary NO2). This is caused by the action
of catalytic coatings within the particulate filter, which are used to cause the filter to
regenerate periodically. This trade-off between effective control of particulate matter and
formation of an increased NO2 fraction within total NOx emissions presents an additional
challenge.
6. Likely effectiveness of Euro VI
Euro V, in particular, has been heavily criticised for failing to reduce NOx emissions from
vehicles in service. This has ultimately led to no significant reduction in roadside
concentration levels for nitrogen dioxide (NO2). This is largely a failing of the regulated test
cycles to simulate real world operating characteristics and the prevalence of so called, ‘off-
cycle emissions’. It seems likely that this situation will be effectively addressed by Euro VI.
The key difference, beside further decreased emissions limits, is the revised test procedure
for heavy duty vehicles. As described above, instead of emissions measurements at specific
speed and load points on the fuel map, this is replaced by a number of zones on the fuel
map, within which measurements may be taken at random. This means that the engine must
be compliant over a broader range of speed and load conditions.
This has been corroborated in initial testing by Transport for London (TfL), which has
indicated a Euro VI bus to have 98 percent lower NOx emissions than Euro V (down from 9
g/km to 0.2 g/km). This indicates, significantly, that Euro VI engined buses and HGVs will
have NOx emissions better than many Euro 5 diesel passenger cars. This improved
effectiveness seems likely to be repeated for diesel vehicles in the light duty classes,
dependent on development of the Worldwide Harmonized Light Vehicles Test Procedure
discussed above.
11
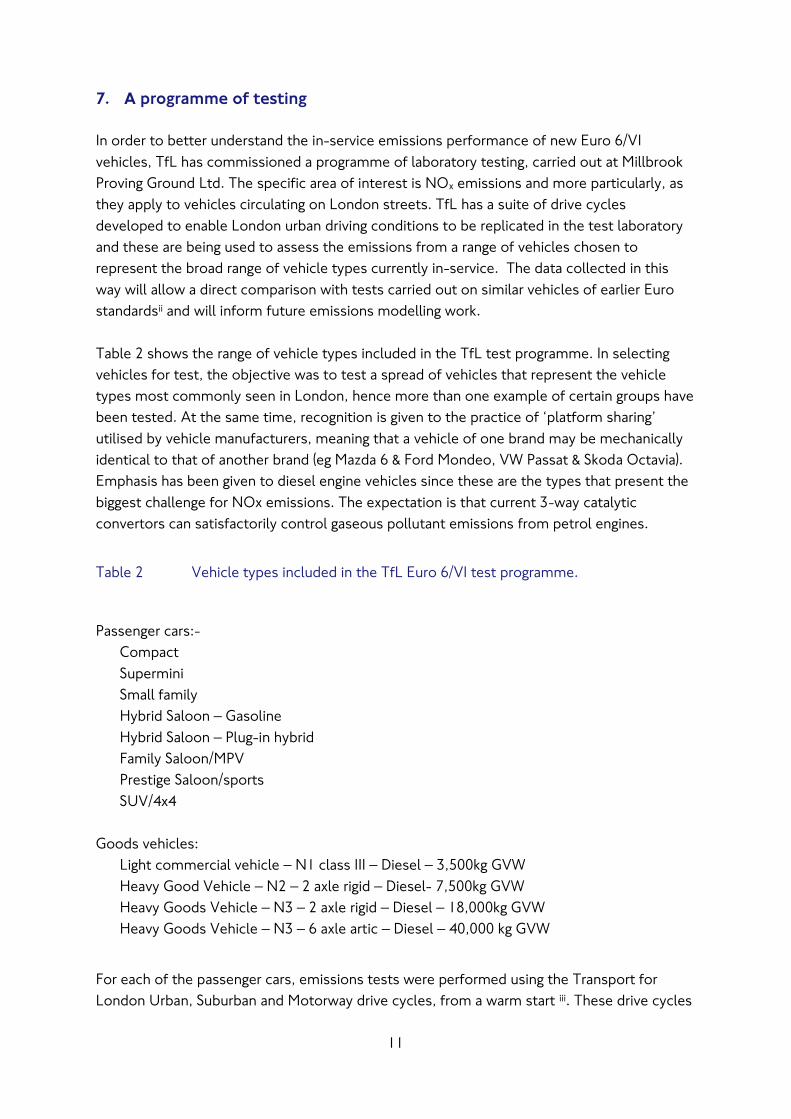
7. A programme of testing
In order to better understand the in-service emissions performance of new Euro 6/VI
vehicles, TfL has commissioned a programme of laboratory testing, carried out at Millbrook
Proving Ground Ltd. The specific area of interest is NOx emissions and more particularly, as
they apply to vehicles circulating on London streets. TfL has a suite of drive cycles
developed to enable London urban driving conditions to be replicated in the test laboratory
and these are being used to assess the emissions from a range of vehicles chosen to
represent the broad range of vehicle types currently in-service. The data collected in this
way will allow a direct comparison with tests carried out on similar vehicles of earlier Euro
standardsii and will inform future emissions modelling work.
Table 2 shows the range of vehicle types included in the TfL test programme. In selecting
vehicles for test, the objective was to test a spread of vehicles that represent the vehicle
types most commonly seen in London, hence more than one example of certain groups have
been tested. At the same time, recognition is given to the practice of ‘platform sharing’
utilised by vehicle manufacturers, meaning that a vehicle of one brand may be mechanically
identical to that of another brand (eg Mazda 6 & Ford Mondeo, VW Passat & Skoda Octavia).
Emphasis has been given to diesel engine vehicles since these are the types that present the
biggest challenge for NOx emissions. The expectation is that current 3-way catalytic
convertors can satisfactorily control gaseous pollutant emissions from petrol engines.
Table 2 Vehicle types included in the TfL Euro 6/VI test programme.
Passenger cars:-
Compact
Supermini
Small family
Hybrid Saloon – Gasoline
Hybrid Saloon – Plug-in hybrid
Family Saloon/MPV
Prestige Saloon/sports
SUV/4x4
Goods vehicles:
Light commercial vehicle – N1 class III – Diesel – 3,500kg GVW
Heavy Good Vehicle – N2 – 2 axle rigid – Diesel- 7,500kg GVW
Heavy Goods Vehicle – N3 – 2 axle rigid – Diesel – 18,000kg GVW
Heavy Goods Vehicle – N3 – 6 axle artic – Diesel – 40,000 kg GVW
For each of the passenger cars, emissions tests were performed using the Transport for
London Urban, Suburban and Motorway drive cycles, from a warm start iii. These drive cycles

12
representing three differing road types are further divided to represent three differing traffic
conditions (Free-flow, AM Peak and Inter-peak). For the goods vehicles, only the Suburban
drive cycle was used, but in both un-laden and laden condition. Emissions are sampled over
the entirety of the drive cycle and on a second-by-second (1Hz) basis, allowing detailed
analysis to be carried out.
There are nine TfL cycles relevant to suburban and urban driving. Table 3 shows the cycle
average speeds for each. Urban Inter peak average speed (13.9km/h) is close to the central
London average speed of 14.5 km/hr.
Table 3 Cycle average speeds for London drive cycles.
Cycle name Cycle average
speed
Urban free flow 26.7
Urban AM peak 15.7
Urban interpeak 13.9
Suburban free flow 49.3
Suburban AM peak 25.3
Suburban interpeak 30.2
Motorway free flow 87.2
Motorway AM peak 47.1
Motorway interpeak 86.1
8. Test results – Passenger car
Table 4 shows cycle average emissions of NOx, PM and CO2 measured in grammes/km and
compared against the Type Approval limit for each respective light-duty vehicle. The results
shown here represent the average emissions measured over all nine TFL drive cycles.
What is clear from the test results is that the particulate mass limit is comfortably met by all
vehicles, given the widespread use of exhaust particulate filters. However, emissions of NOx
are significantly higher than the type approval limits, as has been seen with previous Euro
standards. This may be regarded as an effect of differing drive cycle characteristics on the
actual emissions performance of diesel engines, although petrol engine vehicles still beat the
emissions limits by a healthy margin owing to three-way catalytic convertor technology.

13
Table 4 Drive cycle average emissions from light-duty Euro 6 passenger cars.
Market segment
Fuel NOx PM CO2
Total approval
limit (g/km)
Test average
(g/km)
Total approval
limit (g/km)
Test average
(g/km)
Test average
(g/km)
Compact Petrol 0.06 0.018 0.005 0.001 149.9
Supermini Diesel 0.08 1.173 0.005 0.001 146.3
Small family 1 Diesel 0.08 0.316 0.005 0.002 165.8
Small family 2 Diesel 0.08 0.445 0.005 0.002 133.1
Small family 3 Diesel 0.08 0.433 0.005 0.001 145.3
Family/MPV 1 Diesel 0.08 0.422 0.005 0.003 148.2
Family/MPV 2 Diesel 0.08 0.096 0.005 0.0003 150.6
Family/MPV 3 Diesel 0.08 0.264 0.005 0.002 142.1
Prestige/sports 1 Petrol 0.06 0.007 0.005 0.002 291.2
Prestige/sports 2 Diesel 0.08 0.287 0.005 0.002 157.1
SUV/4x4 Diesel 0.08 0.361 0.005 0.001 181.6
Hybrid HEV Petrol 0.06 0.001 0.005 0.000 116.6
Hybrid REEV Petrol 0.06 0.001 0.005 N/A 102.5
It is important to note that comparison of “real-world” emissions test results with the type
approval limits is of limited value. TfL and other authorities carry out emissions and air
quality modelling using emissions factors that reflect not just the emissions performance of
a given category of vehicle, but also the age of that vehicle, the proportion of the overall
vehicle parc made up by that vehicle type, and the annual distances covered by vehicles of
that type. The widely recognised COPERT 4 factors, published by the European Environment
Agency and the Joint Research Council of the European Commission, are used by Transport
for London, so the purpose of this test programme was to assess any variance that may exist
between speed/emissions factors derived from the TfL testing and those incorporated within
COPERT 4.
The vehicle emissions have also been measured on a second-by-second (1Hz) basis allowing
for the emissions to be plotted and compared at a range of speeds. From the passenger cars
tested, the emissions of the petrol cars have been averaged for each 1km/h speed
increment. This allows the data to be compared with similar data collected previously for
Euro 4 cars ii. The same process has been carried out for the diesel cars tested. In the case of
both the petrol and the diesel car charts, the emissions for three differing types of car have
been used. The measured emissions are averaged at each speed increment. The results have
been weighted according to the relative size of the market segment for each of the test

14
vehicles. Finally, a polynomial curve has been plotted to allow comparison between Euro 4
and Euro 6 emissions and against the relevant COPERT 4 emissions curve
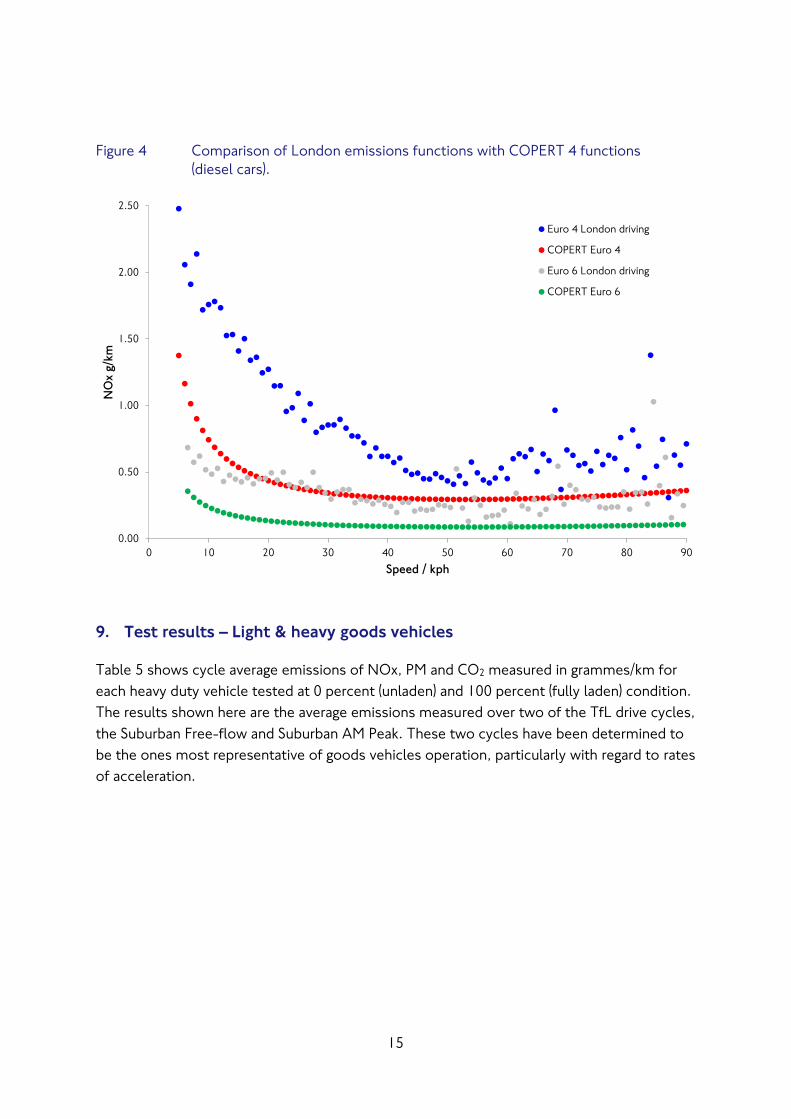
Figure 3 & figure 4 show the comparison between average emissions at a given speed for
Euro 4 versus Euro 6 passenger cars. These indicate that the NOx emissions are substantially
reduced at Euro 6. In the case of petrol cars, the measured emissions of NOx are lower than
those shown by the COPERT 4 functions. For diesel cars, the real-world NOx emission is
consistently higher than the COPERT 4 functions, but are reduced compared to the Euro 4
emissions by a similar margin to that predicted by COPERT 4, indicating that a substantial
reduction in NOx emissions can be anticipated. COPERT 4 reflects the fact that vehicles may
not achieve the legislated emissions reductions under real-world driving conditions. From an
emissions inventories perspective, therefore, it is the relative reduction achieved by Euro 6
against previous Euro standards that is of primary importance.
Figure 3 Comparison of London emissions functions with COPERT 4 functions
(petrol cars).
0.00
0.02
0.04
0.06
0.08
0.10
0.12
0.14
0.16
0.18
0.20
0 10 20 30 40 50 60 70 80 90
NO
x g
/km
Speed / kph
Euro 4 London driving
COPERT Euro 4
Euro 6 London driving
COPERT Euro 6
15
Figure 4 Comparison of London emissions functions with COPERT 4 functions
(diesel cars).
9. Test results – Light & heavy goods vehicles
Table 5 shows cycle average emissions of NOx, PM and CO2 measured in grammes/km for
each heavy duty vehicle tested at 0 percent (unladen) and 100 percent (fully laden) condition.
The results shown here are the average emissions measured over two of the TfL drive cycles,
the Suburban Free-flow and Suburban AM Peak. These two cycles have been determined to
be the ones most representative of goods vehicles operation, particularly with regard to rates
of acceleration.
0.00
0.50
1.00
1.50
2.00
2.50
0 10 20 30 40 50 60 70 80 90
NO
x g
/km
Speed / kph
Euro 4 London driving
COPERT Euro 4
Euro 6 London driving
COPERT Euro 6

16
Table 5 Drive cycle average emissions from heavy-duty Euro 6 vehicles un-
laden and fully laden.
Fuel NOx PM CO2
Market
segment
Gross
vehicle
weight
(kg)
Test
average
0%
payload
(g/km)
Test
average
100%
payload
(g/km)
Test
average
0%
payload
(g/km)
Test
average
100%
payload
(g/km)
Test
average
0%
payload
(g/km)
Test
average
100%
payload
(g/km)
N1 class iii LGV Diesel 3500 0.494 0.682 0.002 0.001 256.9 290.1
N2 rigid HGV Diesel 7500 0.71 0.357 0.003 0.003 315.1 470.85
N3 rigid HGV Diesel 18000 2.714 0.511 0.006 0.007 672.45 921
N3 artic HGV Diesel 40000 1.407 1.188 0.007 0.007 872.05 1797.45
Whilst levels of PM emission remain consistent regardless of payload, controlled by the
diesel particulate filter (DPF), it is interesting to note that the NOx emissions are considerably
lower in the fully loaded condition for each vehicle type. This may be attributed to the
increased engine exhaust temperatures on the laden vehicle allowing for more effective
dosing of the SCR catalyst. In a number of cases, these cycle average emission levels are
almost as low as those of diesel passenger cars, indicating the effectiveness of Euro VI at
controlling NOx from heavy-duty engines, under the right conditions.
For the HGVs, the emissions have been plotted in 5km/h speed increments allowing
comparison with earlier data measured over the same drive cycles for Euro V vehicles. The
vehicles chosen represent some of the most common HGV vehicles in use, an 18 tonne
two-axle rigid truck and a 40 tonne 6-axle articulated truck. In both cases the results shown
are for a fully laden vehicle, demonstrating emissions measured under the conditions that
the HGV might be used. As with the cars, the measured emissions have been plotted using a
polynomial curve to allow comparison. Figure 5 (18 tone rigid) and Figure 6 (40 tonne artic)
illustrate a significant reduction in emissions from Euro V to Euro VI, particularly at the lower
speeds seen in urban driving. This gives some indication of the reduction in emissions of NOx
that are being achieved by Euro VI heavy-duty vehicles compared with Euro V and earlier
standards. It should be noted that the data plotted here is the result of just one vehicle in
each case, albeit examples of some of the most popular models of HGV on UK roads.

17
Figure 5 Comparison of Euro V versus Euro VI NOx emissions over a range of road
speeds: 18 tonne rigid HGV 100% payload
Figure 6 Comparison of Euro V versus Euro VI NOx emissions over a range of road
speeds: 40 tonne articulated HGV 100% payload.
0
5
10
15
20
25
0 10 20 30 40 50 60 70 80 90
NO
x g
/km
Speed / kph
Euro V rigid 18 tonne HGV London driving
Euro VI rigid 18 tonne HGV London driving
0
5
10
15
20
25
0 10 20 30 40 50 60 70 80 90
NO
x g
/km
Speed / kph
Euro V articulated 40 tonne HGV London driving
Euro VI articulated 40 tonne HGV London driving

18
10. Conclusions
It can be seen from this analysis of test results that, in urban driving, Euro 6 petrol cars emit
very low levels of NOx, consistently less than would be suggested by the COPERT 4
emissions functions. Diesel cars at Euro 6 also show a significant improvement over those at
Euro 5, although the plotted emissions are higher than the COPERT 4 functions would
suggest. Some models of light-duty diesel vehicles may require re-calibration to satisfy the
RDE protocol for emission verification, depending on the conformity factors that are agreed
with the European Commission. It is therefore extremely important that the level of
conformity factor is set so as to be challenging and that the implementation date is not
allowed to slip beyond the proposed 2017/2018. This is necessary to ensure that NOx
emission reductions are maximised.
TfL has now tested examples of heavy-duty buses (MLTB cycle) and heavy-duty goods
vehicles (TfL Suburban Cycle) at Euro VI. In each case, the results have been impressive, with
emissions of NOx significantly reduced from vehicles at Euro V. This is especially true at
lower road speeds, which is clearly advantageous for urban and suburban areas.
One area of concern, and for possible further research, is that of primary NO2 emissions.
This is the fraction of total NOx which is constituted of NO2 at the point that it leaves the
vehicle tailpipe. There are suggestions from some quarters that this may be more important
when considering human exposure in urban streets than the emissions of NO (which later
oxidise in the atmosphere to form secondary NO2). Some diesel exhaust after-treatment
systems increase the fraction of total NOx which is NO2, despite reducing the total mass
emission of NOx. There are discussions at the European Commission, although nothing is
definite, about a potential primary NO2 limit, which may even constitute a future Euro
standard (Euro VII ?).
Separately, engine manufacturers and European legislators are turning their attention to
reducing carbon emissions from vehicles (CO2). For passenger cars, plug-in vehicles are
starting to achieve wider acceptance, whilst for heavy-duty vehicles, where battery
technology is not yet viable, there is still scope for improvement to diesel engines, through
advanced control of fuel injection and pressure charging.
References
i The Daily Telegraph motoring supplement, Saturday 27th June 2015.
ii TfL; Developing a test programme, analysis of emissions data and an estimate of total emissions of CO2 and
NOx from passenger cars in London iii TfL; A summary of the development of a new drive cycle to characterise emissions from road vehicles in
London