Embed Size (px)
Citation preview

A
DISCUSSION PAPER
IFD41June 2000
Trends in Private Investment inDeveloping Countries
Statistics for 1970-1998
Lawrence BoutonMariusz A. Sumlinski
INTERNATIONALFINANCE
CORPORATION
Pub
lic D
iscl
osur
e A
utho
rized
Pub
lic D
iscl
osur
e A
utho
rized
Pub
lic D
iscl
osur
e A
utho
rized
Pub
lic D
iscl
osur
e A
utho
rized

IFC Discussion Papers
No. 1 Private Business in Developing Countries: Improved Prospects. Guy P. Pfeffermann
No. 2 Debt-Equity Swaps and Foreign Direct Investment in Latin America. Joel Bergsman andWayne Edisis
No. 3 Prospects for the Business Sector in Developing Countries. Economics Department, IFC
No. 4 Strengthening Health Services in Developing Countries through the Private Sector.Charles C. Griffin
No. 5 The Development Contribution of IFC Operations. Economics Department, IFC
No. 6 Trends in Private Investment in Thirty Developing Countries. Guy P. Pfeffermann andAndrea Madarassy
No. 7 Automotive Industry Trends and Prospects for Investment in Developing Countries.Yannis Karmokolias
No. 8 Exporting to Industrial Countries: Prospects for Businesses in Developing Countries.Economics Department, IFC
No. 9 African Entrepreneurs-Pioneers of Development. Keith Marsden
No. 10 Privatizing Telecommunications Systems: Business Opportunities in DevelopingCountries. William W. Ambrose, Paul R. Hennemeyer, and Jean-Paul Chapon
No. 11 Trends in Private Investment in Developing Countries, 1990-91 edition. Guy P.Pfeffermann and Andrea Madarassy
No. 12 Financing Corporate Growth in the Developing World. Economics Department, IFC
No. 13 Venture Capital: Lessons from the Developed World for the Developing Markets. SilviaB. Sagari with Gabriela Guidotti
No. 14 Trends in Private Investment in Developing Countries, 1992 edition. Guy P.Pfeffermann and Andrea Madarassy
No. 15 Private Sector Electricity in Developing Countries: Supply and Demand. Jack D. Glen
No. 16 Trends in Private Investment in Developing Countries 1993: Statistics for 1970-91.Guy P. Pfeffermann and Andrea Madarassy
No. 17 How Firms in Developing Countries Manage Risk. Jack D. Glen
No. 18 Coping with Capitalism: The New Polish Entrepreneurs. Bohdan Wyznikiewicz, BrianPinto, and Maciej Grabowski
No. 19 Intellectual Property Protection, Foreign Direct Investment, and Technology Transfer.Edwin Mansfield
No. 20 Trends in Private Investment in Developing Countries 1994: Statistics for 1970--92.Robert Miller and Mariusz Sumlinski
(Continued on the inside back cover.)

INTERNATIONALFINANCEI BE @ CORPORATION
DISCUSSION PAPER NUMBER 41
rends in Private Investment inDeveloping Countries
Statistics for 1970-1998
Lawrence BoutonMariusz A. Sumlinski
The World BankWashington, D.C.

Copyright © 2000The World Bank and
International Finance Corporation1818 H Street, N.W.Washington, D.C. 20433, U.S.A.
All rights reservedManufactured in the United States of AmericaFirst printing June 2000
The International Finance Corporation (IFC), an affiliate to the World Bank, promotes the economicdevelopment of its member countries through investment in the private sector. It is the world's largest multilateralorganization providing financial assistance directly in the form of loan and equity to private enterprises iUdeveloping countries.
To present the results of research with the least possible delay, the typescript of this paper has not been preparedin accordance with the procedures appropriate to formal printed texts, and the IFC and the World Bank accept noresponsibility for errors. The findings, interpretations, and conclusions expressed in this paper are entirely those ofthe author(s) and should not be attributed in any manner to the IFC or the World Bank or to members of theirBoard of Executive Directors or the countries they represent. The World Bank does not guarantee the accuracy ofthe data included in this publication and accepts no responsibility for any consequence of their use. Some sourcescited in this paper may be informal documents that are not readily available.
The material in this publication is copyrighted. The World Bank encourages dissemination of its work and willnormally grant permission promptly.
Permission to photocopy items for internal or personal use, for the internal or personal use of specific clients, orfor educational classroom use is granted by the World Bank, provided that the appropriate fee is paid directly toCopyright Clearance Center, Inc., 222 Rosewood Drive, Danvers, MA 01923, U.S.A., telephone 978-750-8400, fax978-750-4470. Please contact the Copyright Clearance Center before photocopying items.
For permission to reprint individual articles or chapters, please fax your request with complete inforrmation tothe Republication Department, Copyright Clearance Center, fax 978-750-4470.
All other queries on rights and licenses should be addressed to the World Bank at the address above or faxed to202-522-2422.
ISSN (IFC Discussion Papers): 1012-8069ISBN 0-8213-4785-3
Lawrence Bouton is an economist and Mariusz A. Sumlinski is a research analyst at the International FinanceCorporation.
Library of Congress Cataloging-in-Publication Data has been applied for.

iii
Table of Contents
FOREWORD ......................................................... V
ABSTRACT ......................................................... VII
CHAPTER 1 - PRIVATE INVESTMENT AND ECONOMIC GROWTH ............................................ 1
RECENT EVIDENCE .......................................................... 2EXISTING EMPIRICAL LITERATURE ......................................................... 3INTERPRETING THE RESULTS. .......... ............................................... 6ANNEX: EXPLAINING ECONOMIC GROWTH ......................................................... 8A. HARROD-DOMAR ......................................................... 8B. SOLOW AND THE NEOCLASSICAL GROWTH MODEL . ......................................................... 0
C. ENDOGENOUS GROWTH ....... .................................................. 13REFERENCES .......................................................... 16
CHAPTER 2 - PRIVATE AND PUBLIC INVESTMENT TRENDS .................................................... 21
APPENDIX 1: METHODS AND SOURCES ......................................................... 25
APPENDIX 2 - COUNTRY CHARTS ......................................................... 27
Sub - Saharan Africa ............... ., 29Latin America and the Caribbean ....................... 33Middle East, and North Africa .................... ,... 37Transition Countries ............. 39,,,,....,,,,,,,,........,, 39East Asia .... 1..... ............ ............ .. , , , . ................... ,,,,,,,,,....,, 41South Asia.45 ......... ........... , , , , , ,,,,,., . 45


v
Foreword
This eleventh annual edition of Trends in Private Investment in DevelopingCountries provides private and public investment data through 1998. Information on thebreakdown of total investment into its public and private components is not readilyavailable from standard national account statistics. Where it may be available, theconcept of public investment is not always precise. Most standard measures classifycapital expenditures of state owned enterprises as private investment. Pulling togetherinformation provided by national organizations, the World Bank and IMF, thispublication defines public investment in a consistent manner across all included countriesto ensure that data on private investment represent only the capital expenditure decisionsof the private sector.
}Guy geffermannDirec or, Economics Department
& Economic Adviser of the Corporation


vii
Abstract
The first part of the discussion paper examines the role of private investment ineconomic growth. While theoretical growth models developed in the economicsliterature make no distinction between private and public components of investment,there is an emerging appreciation that private investment is more efficient and productivethan public investment. Results from the recent empirical literature, updated here withthe recent data on private investment, suggest that private investment has a strongerassociation with long run economic growth than public investment.
The second part shows trends in private and public fixed investment in fiftydeveloping countries. On average, the ratio of private investment to GDP continued itsupward trend reaching record levels in 1998, the most recent year for which comparabledata exist. That year average private investment reached 14.3 percent of GDP, but publicinvestment, fell to only 7.0 percent of GDP, its lowest level since 1974.


I
Chapter I - Private Investment and Economic Growth
One of the indisputable stylized facts of economic development has been the widedisparity in economic performance across countries of the world. Over the past 40 years,economic performance of a small number of countries has been remarkable, with percapita GDP increasing fivefold if not more. At the same time, a number of countries haveexperienced a startling decline in per capita GDP.
Attempts to explain these divergent outcomes have generated a voluminoustheoretical and empirical literature. A key element in this literature has been the debateover the role of capital accumulation. As summarized in the Annex, the relativeimportance this literature places on the role of investment in the economic growthprocess has gone through several phases. Theoretical work of the mid-1950s, forexample, suggested that growth in per capita income was ultimately driven bytechnological progress and was independent of the rate of physical capital accumulation.The more recent endogenous or "new" growth literature has refined our understanding ofthe sources of economic growth. In addition to expanding the concept of capital toinclude knowledge, human skills and technology, this literature has emphasized thatphysical capital itself is not homogeneous. This latter finding has led some researchers toexplore in greater detail various definitions of capital. Some researchers haveconcentrated on the potentially different impact of capital depending on its use, such asmanufacturing plant and equipment. A more general distinction, however, is the onebetween public and private capital.
The theoretical growth models developed by the economics literature make nodistinction between the private and public components of investment. Given the widelydifferent incentives faced by private and public agents, there is an emerging appreciation(driven largely by the recent work on privatization) that private investment is in generalmore efficient and productive than public investment. As a result, there has been anincreased recognition that private and public investment might have different roles in thegrowth process. This chapter examines some of the recent findings of this empiricalliterature, updates some of the results with the recent data on private investmentcontained in this publication and presents some possible explanations for the results.Chapter 2 presents updated statistics about trends in private and public investment.
I Perhaps the best known of these research efforts is the work by De Long and Summers (1991). Theyargue that countries with the fastest growth rates are those in which plant and equipment investment is thehighest.

2
Recent Evidence
Information on the breakdown of total investment into its private and publiccomponents is not readily available from the standard national account statistics. Whereit may be available, the concept of public investment is not always precise. Moststandard measures classify capital expenditures of state owned enterprises as privateinvestment. An effort is made in this publication to define public investment in aconsistent manner across all countries. In particular, the investment of public enterprisesis consolidated with those of general government. This effort is made to ensure that thedata on private investment represents only the capital expenditure decisions of the privatesector.
Using the latest data on private and public investment, a quick examination of thedata suggests that private and public investment have different associations witheconomic growth. Table 1 shows the relationship between private and public investment(as a share of GDP) and growth rates and income levels in the fifty developing countriescontained in our investment data set.
Table 1. Investment, Growth and Income in Developing Countries
Average Annual Growth Rates, 1970-98Average Annual Share of High Middle Low
GDP, 1970-98 (greater than 5% pa) (between 3% and 5%) (Less than 3%)
Total Investment 24.6 19.9 18.3Private Investment 15.0 11.9 9.9Public Investment 9.5 8.0 8.4
Per Capita Income Levels, 1998*Upper Middle Lower Middle Low($3,031-$9,360) ($761-$3,030) ($0-$160)
Total Investment 21.6 21.4 19.0Private Investment 14.1 12.8 9.7Public Investment 7.5 8.6 9.3
Source: World Bank Data.* Income classification is from World Development Report, 1998
Based on average annual growth rates over the period 1970-1998, the 50 countriesare divided into three groups - high, middle and low growth countries. Those countriesthat have, on average, grown faster over this period also have a higher average share oftotal investment to GDP. Looking at the two components of investment, it is readilyapparent that differences in the overall investment ratios are driven largely by thedifference in private investment ratios. Further, statistical tests indicate that thesedifferences are statistically significant.2 The average ratio of public investment, on the
2 The hypothesis that there is no difference in the sample means across the various groups is tested using at-test at the 5% level of significance.

3
other hand, does not vary appreciably across these three groups of countries and, in anycase, are not statistically different from one another.
Similarly, using the classifications found in the World Development Report, thesample of countries is divided according to 1998 income levels into three groups - uppermiddle, lower middle and low income countries. As can be seen from the table, higherincome countries tend to have higher average private investment ratios than lower incomecountries. The average ratio of private investment between the three income categoriesare also significantly different. In contrast, public investment ratios appear to move inthe opposite direction. That is, these ratios are higher, though not significantly, in lowerincome countries than in higher income ones.
As shown in Table 2, the differences in investment ratios across growth andincome categories are even more pronounced during the period 1990-1998. As can beseen in the various country charts in Appendix 2, during the 1990s private investmentwas accelerating in many countries around the world as a result of liberalization andmarket reform efforts, while public investment was declining as a result of privatizationefforts and tighter budgetary constraints.
Table 2. Investment, Growth and Income in Developing Countries
Average Annual Growth Rates, 1990-98Average Annual Share of High Middle Low
GDP, 1990-98 (greater than 5% pa) (between 3% and 5%) (Less than 3%)
Total Investment 25.3 19.9 18.0Private Investment 17.5 12.2 9.2Public Investment 7.8 7.8 8.7
Per Capita Income Levels, 1998*Upper Middle LowerMiddle Low($3,031-59,360) ($76 1-53,030) ($O-$760)
Total Investment 22.6 22.0 19.4Private Investment 16.3 14.0 10.3Public Investment 6.3 8.0 9.1
Source: World Bank Data.* Income classification is from World Development Report, 1998
Existing Empirical Literature
While such casual evidence on the relationship between private investment andgrowth is suggestive, the more appropriate method of empirical research has been cross-section growth regressions. The explosion of recent empirical research has been madefeasible by the availability of suitable data sets - due largely to the work of Summers andHeston (1988 and 1991) - that make analysis of growth rates across a large number ofcountries possible. For its part, this publication was the first to make private and publicinvestment data available on a consistent basis.

4
The typical empirical paper regresses average long run growth rates against a setof variables that is expected to determine those growth rates. Economists have employeda tremendous number of variables in their quests to explain cross-country growthdifferences. While theory does offer some advice, the choice of variables to include inthese regressions has largely been ad hoc, determined to a significant extent by thespecification of earlier econometric results in the literature. For the most part, this bodyof empirical work has concentrated on the role of aggregate investment in economicgrowth. Levine and Renelt (1992) examined a large number of these studies todetermine the robustness of the statistical relationship between growth and a wide arrayof other variables. They found that total investment is one of the few variables thatremains statistically significant (and with a positive impact) across the various growthequations.
With the appearance of the first Trends in Private Investment in DevelopingCountries, published in 1989, researchers have begun to explore the respective roles ofprivate and public investment in the growth process of developing countries using cross-country growth regressions. The volume of studies on this topic, however, is still ratherlimited. Using relatively small sample sizes and narrower time periods, a number ofstudies [Khan and Reinhart (1990), Coutinho and Gallo (1991) and Serven and Solimano(1990)] have concluded that private investment has a larger positive impact on growththan public investment.
A more recent study by Khan and Kumar (1997) substantially broadened therange of sample countries examined and looked across a relatively long time period.Their results are reported in the first column of Table 3. For the period 1970-1990 bothprivate and public investment have a positive association with growth and are statisticallysignificant. The magnitude of these two types of investment, however, differ considerablywith private investment having a much stronger impact than public investment. Theestimated coefficient on private investment suggests that a one-percentage point higheraverage private investment ratio over the 1970-90 periods associated with an increase inthe per capita growth rate of four-tenths of a percentage point.
The study by Khan and Kumar included data on ninety-five countries, many ofwhich are not found in our data set. As the various editions of this publication haveemphasized over the years, it is difficult to obtain private and public investment data thatmaintains a consistent definition across countries. Since our data strives to maintain thatprecision, we have re-estimated their regression equation using only the smaller sub-sample of countries that have data in this publication to see if their results still hold.
3 See Temple (1999).

5
Table 3. Determinants of Per Capita Growth RatesKhan &Kumar Restimated Results(1997)
1970-90 1970-90 1970-98Number of observations 95 41 42Constant -1.72 -0.16 0.06
(0.83) (0.68) (0.72)Private Investment (Percent of GDP) 0.40 0.56 0.71
(0.09) (0.17) (0.18)Public Investment (Percent of GDP) 0.29 0.15 0.13
(0.09) (0.14) (0.15)Initial per capita GDP (1970) -0.23 -0.27 -0.31
(0.06) (0.07) (0.07)Population Growth -0.79 -0.36 -0.70
(0.39) (0.18) (0.20)Average years of schooling (secondary) 0.02 0.27 0.23
(0.01) 0.12 0.13Fiscal balance 0.03
(0.01)
B? 0.44 0.45 0.61
Using the same time period for comparative purposes, the re-estimated regressionequation is shown in the second column of Table 3.4 The results are qualitatively similar- private investment has a greater impact on growth than public investment. In the re-estimated equation, however, the coefficient on private investment is larger and thecoefficient on public investment is smaller. The results indicate, for example, that overthe 1970 to 1998 period, those countries with a private investment to GDP ratio whichwas 1% point higher (average, over 1970-98), had a GDP growth rate which was 0.71%point higher. Over the 28 year period, this 0.71% higher growth rate translates into a percapita GDP which is 22% higher than it otherwise would have been. In contrast, if theresources had gone into 1% point higher public investment, the GDP growth rate wouldhave been just 0.13% higher (as a best estimate, but in fact the difference with zero is notstatistically significant). A 0.13% higher growth rate accumulates into a per capita GDPwhich is just 3.7% higher than otherwise after 28 years.
The final column in Table 3 expands the time period to include the newer data forthe 1990s. Inclusion of the more recent 1990s data results in a further increase in thecoefficient on private investment. As with other researchers, such as Ram (1996), Khanand Kumar found that the distinction between private and public investment varied acrossvarious sub-periods. During the 1970s, for example, the coefficient on the two types ofinvestment was very similar. The authors suggest that, given the lower public stock ofcapital during the 1970s, the returns to public investment were higher during that period.It is also likely that the returns to private investment were lower as a result of the more
4Kahn and Kumar include a fiscal variable in their regression equation. These authors note that theinclusion of this variable, along with human capital (proxied by average years of schooling) led to only aslight decline in the coefficient on private investment. Data on fiscal balances was not available for manyof the countries in our sample and hence was not included in our regression results.

6
distorted policy environment found in many countries of the world during that timeperiod.
Interpreting the Results
The results presented here are consistent with the notion that private investmenthas a stronger role than public investment in long-run economic growth. As the annexattempts to show, however, there remains considerable controversy over the role ofcapital accumulation in economic growth. The essential question remains whether theseresults reflect a higher level of efficiency on the part of the private sector or if theycapture some other factors not included in the analysis. In particular, is the improvedbusiness environment that tends to promote higher private investment itself generatinghigher economic growth.5 The "new" growth literature tends to highlight the role ofknowledge and innovation in the growth process. One conceivable explanation for thestronger role of private investment in the empirical literature is the possibility that privateinvestment tends to embody newer technologies and that it has a newer "vintage" ofcapital. Public investment, for its part, tends to be in projects that have longer gestationperiods, such as infrastructure and basic education.
Specific to the work that focuses on the private/public dichotomy, there has alsobeen a debate about whether public investment raises or lowers the efficiency of privateinvestment. Some components of public investment, for example, may be complementaryto private investment and, insofar as private investment has a positive impact on growth,would be beneficial to growth. This complementarity is likely to arise in the case ofpublic investment in infrastructure and education. It is generally acknowledged,however, that not all public investment in infrastructure has a beneficial impact on privateinvestment and growth. In the past, many infrastructure projects in developing countrieswere of dubious quality.6 Further, since public investment utilizes scarce resources -
physical and financial - or produces output that competes directly with the private sector,it can also "crowd out" private investment. An increase in public investment in thesecircumstances may have adverse consequences for private investment and growth.
It his much cited work, Aschauer (1989) found that for industrial countries publicsector investment in infrastructure has had a very strong positive effect on private sectorproductivity. Focusing on developing countries, a recent study by Odedokun (1997)finds that public investment in infrastructure facilitates private investment and growthwhereas non-infrastructural public investment does the reverse. With liberalization,increased globalization and the changing nature of the regulatory environment indeveloping countries, it is no longer the case that that only the public sector undertakesinfrastructure investments. In many countries, such investment is now being done by theprivate sector. IFC has helped finance many private investments in roads, ports,
5 One of the frequently cited concerns about the empirical growth literature is the probable endogeneity ofsome regressors. Do our results suggest that investment causes growth, that growth causes investment orthat some other variable causes both?6 See Krueger and Orsmond (1990).

7
telecommunications, and electricity generation and transmission. As the work onprivatization suggests, the competitive business environment of most market economiessubjects private investors to very different incentives than those of the public sector.
Last year's Trends in Private Investment (Pfeffermann, Kisunko and Sumlinski(1999)) showed there is a link between private investment and the various obstacles todoing business encountered in developing countries (i.e., unpredictability of the judiciary,tax and labor regulations, etc.). Not surprisingly, those countries in which these obstacleswere less onerous had higher levels of private investment. That a better businessenvironment leads to higher private investment relative to public investment could beamong the factors explaining the empirical results cited above. Clearly, more work isneeded linking the analysis of the business environment with that of the growth literature.
In addition, one can hypothesize that a more favorable and competitive businessenvironment will lead firms to invest in new technologies, ideas and innovations thatallows them to retain their competitive edge. 7 It has long been understood and acceptedthat "vicious" forces of competition brought on by a dynamic private sector improve theallocative efficiency of a market economy - resources are channeled to thosesectors/industries/firms that can use them in the most productive manner. Theendogenous growth literature suggests that there is a relationship between investment ininnovation and knowledge, technological progress and economic growth.
Finally, the level of private investment in an economy can be viewed as a proxyfor a dynamic private sector and hence for the extent of technology progress in aneconomy. In a competitive environment, a higher level of private investment, therefore,not only represents the increased accumulation of physical capital, it also represents thereplacement of old inferior technologies with newer more efficient technologies - not justmore capital but a newer "vintage" of capital. Insofar as private investment embodiesnewer technology, it captures two things: capital accumulation and the effects oftechnological progress. Technological innovation increases the productivity of capitaland hence alters an economy's underlying long run growth rate.
7The public sector, on the other hand, doesn't often face these competitive pressures and hence doesn'tneed to continuously update its capital stock.

8
ANNEX: EXPLAINING ECONOMIC GROWTH
Our understanding of economic growth has been shaped to a large extent by keyworks in the literature. Each of these works has brought about a new phase in thetheoretical understanding of economic growth. As is usually the case, it takes someadditional time for economic practitioners to digest the implications of these advances.
A. Harrod-Domar
Economists have been trying to explain the sources of economic growth since thedays of Adam Smith. It wasn't, however, until the work of Harrod (1939 and 1948) andDomar (1947) that the economics profession began to formalize its understanding ofeconomic growth. The work of Harrod-Domar summarized the essence of almost 200years of theorizing about economic growth. 8
At the heart of this view of economic growth is the very intuitive notion that thesteady accumulation of physical capital through saving and investment translates directlyinto higher levels of production. Termed capital "fundamentalism" for the central roleplayed by investment, this view of economic growth was widely held by economicpractitioners for most of the 1950s and 1960s.
Under this framework, the level of output is directly related to the size of thecapital stock. If a firm, or more broadly, an economy, wants to produce more output, it
. . . ~~~needs to acquire more capital. The amount ofFigure 1. Impact of an increase in investmentshare of GDP in the Harrod-Domar capital relative to the level of output, theframework. capital-output ratio, can be viewed in this
simple framework as a measure of therate efficiency of capital. Since the historical
evidence of the time suggested that this ratioLong Run Growxth Path was relatively constant, it was assumed in
.nitial long this framework that the capital-output ratio isInitial long rungrowth rate fixed. Thus, for any initial level of capital
and any given capital-output ratio, the rate ofgrowth of the capital stock (investment) is the
i_____________________ crucial determinant of the rate of outputT- change in Time growth. For example, with a capital-outputinvestment rate
ratio of 4 and a net investment rate (afterdepreciation) of 8 percent of GDP, the economy would grow at 3.2 percent (4 x 0.08) perannum. If the net investment rate is somehow increased to 10 percent of GDP, growth inthe economy will accelerate to 4.0 percent (4 x 0.10) per annum.
With this framework in hand, economic practitioners focused on the policy question ofhow to raise the level of investment in developing countries to bring them closer to the
8 See Easterly (1999) for a fuller discussion of Harrod-Domar's place in the growth literature.

9
stage of development achieved by industrial countries. Since these countries wereconsidered too poor to finance the level of investment required for high growth ratesthemselves, it was felt that positive per capita growth would only materialize if westerndonors filled the "financing gap" with foreign aid. The famous "two gap" model ofHollis Chenery (1966) became the standard model in the World Bank when Chenerybecame its Chief Economist (although, as applied by the World Bank, only one gap wasutilized in the analysis). The principal use of this model has been to determine thefinancing needs of member countries in order for them to achieve a target growth rate(the desired growth rate times the capital output ratio give the investment requirement).Measuring the capital-output ratio became a most important exercise because its valuedictated the size of the effect of the rate of investment on economic growth. The fastereconomic growth brought on by this larger investment effort would allow the standard ofliving of the developing world to converge with that of the industrialized world. 9
Even while the Harrod-Domar model wasg- 2 -tnt d GDP - 19703199gaining popularity arnong economic practitioners
as an elegant formalization of growth theory, it wascoming under attack. From a theoretical point of
i-no *' . ; view, the model did not leave much room for otherfactors of production, such as labor. Under theassumption that developing countries had surpluslabor (unemployment), the model focused on the
ID DI DI ] , ~ assumed scarce resource in these countries,physical capital. The simple relationship between
capital and growth breaks down, however, when output growth is constrained by theavailability of labor (called, not surprisingly, the Harrod-Domar inconsistency condition).Many economists found the ad hoc assumption that the capital/output ratio wasexogenous (i.e. determined outside the model) and constant equally troubling. Onempirical grounds, as larger and more diverse data sets became available, the simplelinear relationship between investment and growth proved to have very limitedjustification. 10
9 The most influential textbook on economics by Paul Samuelson featured a diagram extrapolating Sovietand American growth into the future. Given its level of investment, it was surmised that GNP in the SovietUnion was quite capable of overtaking that of the United States by the year 2005. Similar comparisonswere made for North and South Korea. It is clear now that centrally planned investments of these countriesdid not result in the build-up of productive capital.10 See King and Levine (1994), Easterly (1999), and Easterly and Levine (2000) for summaries of thisempirical work.

l0
B. Solow and the Neoclassical Growth Model
While many economic practitioners continued to employ the Harrod-Domarframework, a famous article by Solow (1956) led growth theoreticians to abandon thisframework in favor of what has been called the neoclassical growth model. This modelhas served as the central building block for the very large subsequent theoretical andempirical literature on economic growth. Solow's work ushered in a new phase of thegrowth literature and introduced a different perspective on the role of investment ingrowth.
Rather than assuming a constant capital/output ratio, as did Harrod-Domar, Solowassumed that it was determined endogenously (i.e., resulting from the internal conditionsof the model). Solow's model featured a production function that allowed for smoothsubstitution between the various factor inputs. The production function he postulatedhad a long tradition in economics - output is produced by combining capital and laborunder constant returns to scale (doubling both inputs will double output)'1. Equallycomforting to economists, the model postulated that the equilibrium between supply anddemand is determined by competitive markets. Competition will insure that factors ofproduction will be employed up to the point that the additional value of output producedby a factor is equal to its market price (i.e., the wage rate or rental rate of capital).Importantly, each factor of production is assumed to exhibit diminishing marginalproductivity - as more and more of an input is added (all else constant), it produces lessand less additional units of output.
Most interest in this model centers on its long run or steady state (the path whereevery variable grows at the same rate) implications. The model's internal adjustmentmechanism keeps the stock of capital (measure always relative to labor) at, or at leastmoving towards, it's long-run equilibrium value. If the ratio of capital to labor is eithertoo small or too large relative to its competitive equilibrium value, this disequilibriumwill set in motion an adjustment mechanism. For example, if for some reason thecapital/labor ratio is smaller than its implied equilibrium value, this indicates thatprofitable gains in output can be achieved by investing in more capital. The assumptionof diminishing returns implies that further investment in capital will yield smaller andsmaller gains in output and at some point these gains cease altogether. Conversely, if thecapital/labor ratio is too large, then the marginal return on capital is negative and areduction in capital relative to labor is warranted.
Under Solow's framework, the adjustment mechanism implies that the long run(steady state) stock of capital per worker is constant - that is, the capital stock grows atthe same rate as labor force. Since the growth in the labor force is assumed to be anexogenous demographic phenomenon, it follows that economic growth in the long run isalso exogenous. While total output is growing (at the same rate as labor
" It also assumed constant, and unit, elasticities of substitution so that the shares of capital and labor intotal income were constant.

I1
force/population) in the long run equilibrium, there can be no growth in per capitaoutput!
Solow's initial growth model, therefore, failed to predict a very important stylizedfact: most economies tend to exhibit sustained growth in per capita income over the longrun. In order to address this shortcoming, Solow (1957) introduced the notion oftechnical progress to the model. An important assumption of this "augmented" growthmodel is that technological progress is exogenous. As it is commonly described,technology is like "manna from heaven", it descends upon the economy automaticallyand irrespective of what else is going on in the economy (relaxing this assumption is oneof the major efforts of the "new" growth theory discussed below).
While the introduction of technological change allowed Solow's growth model todisplay the important property of sustained per capita growth, such growth remainedexogenously determined. In the long run, capital and output grow at the same rate as thelabor force and the rate of technological progress (Growth in per capita income willdepend uniquely on technological growth).
What role does investment play in this model? Some positive level of investment,of course, is needed to replace capital as it depreciates and to maintain the size of thecapital stock constant relative to the labor force. Countries with higher levels ofinvestment and therefore higher level of capital per worker will, as can been seen fromthe use of the production function, have higher levels of per capita output. A conclusionfrom this model, therefore, is that countries are rich because they have a lot of capital.
Having a lot of capital, however, doesn't mean that these countries will grow anyfaster in the long run. As population and technological progress are assumed to bebeyond the influence of economic factors, long run economic growth in this frameworkcan be seen as immune to economic policy, good or bad. The basic proposition inSolow's growth model, that a steady-state growth rate is independent of the investmentrate, still comes as a surprise to most economists.
In his second article, Solow performed a simple accounting exercise (known asgrowth accounting) to explain output growth in terms of growth in capital, growth inlabor and growth in technological progress. What can't be explained by growth in factorinputs (labor and capital) is captured by technology, commonly referred to as total factorproductivity growth. Because of the way it is calculated, as a residual, and because itrepresents that portion of growth that could not be explained by factor inputs, manyeconomists have referred to it as a "measure of our ignorance". Solow and subsequentresearchers found that most economic growth of the United States is explained bytechnical progress with capital accumulation playing a much more limited role. Theseearly estimates, quickly extended to other industrialized countries, found that total factorproductivity accounted for more than half of growth while capital accumulationaccounted for only one-eighth to one-fourth of growth.

12
The slowdown in economic growth that occurred in the United States and otheradvanced industrial countries in the late 1 960s and 1 970s generated a tremendous amountof empirical work using this growth accounting framework. The bulk of the slowdown, itwas discovered, was due to a decline in total factor productivity (and not from adiminution of investment efforts). Considerable research effort was expended trying tounderstand why productivity declined. Explanations ranged from the effects of oil priceshocks, the shift towards a service economy, increased regulation of the economy and aslowdown in research and development efforts. Some economists also questioned themeaningfulness of capital stock measurements. They argued that since portions of thecapital stock had, as a result of changes in relative prices and government regulation,become obsolete, growth accounting would give a misleading estimate of the impact oftechnological progress on growth. By looking for explanations based on changes intechnological progress, these research efforts presaged much of the endogenous growthliterature by more than a decade.
With the increased availability of comparable data, growth accounting has beenextended to a range of developing countries. Among the better-known applications isAlwyn Young's (1995) use of this framework to explain economic growth in East Asian"miracle" economies. Using standard measures of output, his much-debated workshowed that the rapid growth of these Asian economies stemmed primarily from rapidfactor accumulation. Work by Klenow and Rodriguez-Clare (1997), among others,however, disputes Young's finding and shows that in none of East Asian countries doesfactor accumulation play a dominant role in accounting for their growth. They find thatmost of East Asian growth is explained by that great unknown - total factor productivity.The disparity in results stems from the fact that the latter two authors utilized a measureof growth in terms of output per worker. They also use an "adjusted" measure of totalfactor productivity to account for the impact of capital growth (i.e., adjusting for newvintages of capital) on total factor productivity itself. Their conclusion is that theperformance of East Asian economies is consistent with technological accumulation (or a"catch-up" by those countries that began with a lower stock of technology) and not withfactor accumulation.
While one could rely on differences inFigure 3. Impact of an increase in investment technological accumulation to explainin the Solow framework (with "transition divergent growth patterns, a more subtledynamics")Growth explanation appeals to "transition dynamics"
rate (see Figure 3). As noted earlier, in the long
run the Solow model predicts that per capitagrowth will be determined solely by
Long__ lnotPh technological change. In the short run,Long Run Gm Path however, it is quite possible that countries can
be off their "long-run growth paths".Recovery from wars and other economic
T- change in Time shocks, for example, could lead to stages ofiinvestment rate rapid capital accumulation and economic
growth. Under such circumstances, the Solow

13
model suggests that countries will be able to realize positive growth rate gains frominvestment in physical capital and always gain in absolute output. Assuming that thesegrowth paths are not stochastic (ever changing), however, the diminishing returns tocapital implies that growth rate gains will decline and eventually disappear altogetheronce an economy reaches long run equilibrium. Under this hypothesis, growth of"miracle" Asian economies was associated with a boom period that could not besustained.
C. Endogenous growth
By the 1980s, economists became increasingly frustrated over the inability of theneoclassical growth model to address adequately some burning questions about economicgrowth. The model had little to say on why, for example, if economic growth isexogenous, depending solely on technological change, per capita growth performnance ofcountries is so radically and persistently different over long periods? Can the rate oftechnological progress differ so greatly across countries?
More fundamentally, however, there was great dissatisfaction with the assumptionthat long run growth rates are determined outside the model and independently ofsavings/investment preferences and, most importantly, policy behavior. At the end of theday, the Solow model explains the mystery of economic growth simply by assuming thatthere are exogenous factors, such as population growth, that determine growth.Increasingly it was felt that the pace of technological progress, the determinant ofeconomic growth in the neoclassical framework, must have some economic explanations.Towards the end of the 1980s, this dissatisfaction gave rise to a body of literature, duelargely to the work of Romer (1986, 1987), that is commonly known as the "new" growthor endogenous growth literature.12
The term endogenous growth, like so much else in the economics literature, is amisnomer. All other models of growth also consider growth to be endogenous. What isdifferent in this "new" literature, however, is that technological progress is alsoconsidered endogenous. This literature recognized that innovations or technologicalprogress do not fall like manna from heaven but instead are created by profit-seekinghuman beings subject to a variety of constraints and policy incentives.
Several different modeling approaches have been applied by this "new" approach,each sharing the central conceptual issue - the extent to which technological progress, andultimately economic growth, is endogenous. While different strands of this literature usedifferent mechanisms to sustain growth, they all introduce some type of capital whoseaccumulation is not subject to the assumption of diminishing returns. One strandbroadens the definition of capital to include human capital accumulation (Lucas (1988),Rebelo (1991) and Stokey (1991)). Another strand incorporates the accumulation of
12 An article by Nelson (1997) suggests that most of the basic premises of the "new" growth theory werewell known more than a generation ago.

'4
knowledge, either through learning by doing (Romer (1986)) or through R&D (Romer(1990), Grossman and Helphman (1991), and Aghion and Howitt (1992)).
Rather than model this broader view of technology as just another input to theproduction function, the endogenous growth literature recognizes that ideas, knowledgeor innovations are different from other inputs. Once invented, the knowledge embodied innew ideas or innovations becomes a "public good" available to all. Unlike physicalinputs, however, knowledge is nonrivalrous, meaning that it can't be used up. Indeed,investments in new knowledge (including formal schooling) by any one agent willspillover and benefit everyone in the economy (they have externalities). Another way ofputting this is that the development of new ideas requires a fixed cost of production butonce produced their use has zero marginal cost.
If the benefits of new ideas can't be captured by the inventor, however, there islittle reason to believe that innovation will take place. To encourage innovation and thedevelopment and introduction of new ideas, firms need an environment that limitsbusiness uncertainty and offers the appropriate incentives to adopt or implementtechnological changes.'3 Hostility to innovation and investment can show in a variety ofways. For example, Parente and Prescott (1999) show that established factor supplierswho are earning monopoly rents with old technology (protected via governmentregulation) can inhibit entry by firms wanting to use better and newer technologies.Given the nonrivalrous nature of new ideas and knowledge, societies have adoptedinstitutions, such as copyrights and patents, that grant the inventor the exclusive use orthe right to charge for their new ideas. A number of economic historians, such as DouglasNorth, have postulated that the development of property rights is responsible for moderneconomic growth. Indeed, the industrial revolution - the beginning of the first sustainedeconomic growth in world history - only occurred once the institutions to protectintellectual property were sufficiently well developed.
The introduction of the "economics of ideas" leads one to abandon someimportant assumptions of the neoclassical model. The spillover effect of new ideas andthe institutions put in place to encourage them leads one to contemplate the presence ofincreasing returns to scale (i.e. doubling all inputs more than doubles the output) andimperfect competition.'4 Recent work in the endogenous growth literature has offeredmore explicit descriptions of how, for example, investment in R&D and the externalitiesinherent in the accumulation of knowledge leads to economic growth. These effortsgenerally start with a more microeconomic understanding of the decisions behind theresearch and development process and end up by melding the theory of monopolisticcompetition to the theory of economic growth.
13 Brunetti and Weder (1997) argue that the irreversibility of investment magnifies the effect of uncertaintyon investment decisions. They present an analysis of the effect of 24 uncertainty variables on investment ina set of 60 countries. They find that various measures of uncertainty are important in explaining cross-country differences in aggregate investment rates. (See www.ifc.org/economics/pubs/techpap4'tp4.pdf)14 In these models the production function exhibits constant returns to scale with respect to the capital andlabor input, but increasing returns to scale with respect to all three inputs. Doubling labor, capital and thestock of knowledge will more than double output.

15
This literature demonstrates that simple changes to the production function or thedefinition of capital (to include, for example, "human" capital or knowledge) candramatically alter the predictions about the relationship between investment andeconomic growth. By assuming, for example, that the accumulation of knowledge hasspillover effects or results in learning by doing, then investment in capital (broadlydefined) can itself result in new technology and knowledge. With capital exhibiting suchincreasing returns to scale, changes in the investment rate can have long-run implicationsfor economic growth.

16
REFERENCES
Aghion, Philippe and Peter Howitt, "A Model of Growth through Creative Destruction," Econometrica,Vol. 60, pp. 323-51, 1992.
Aghion, Philippe and Peter Howitt, Endogenous Growth Theory, MIT Press, 1998.
Aschauer, D.A., "Does Public Capital Crowd Out Private Capital?", Journal of Monetary Economics,Vol. 24, pp. 171-88, 1989.
Barro, Robert J., "Economic Growth in a Cross Section of Countries", Quarterly Journal of Economics,Vol. 106, Issue 2, pp. 407-443, May 1991.
Barro, Robert J., "Determinants of Economic Growth: A Cross-Country Empirical Study", NBERWorking Paper No. 5698, August 1996.
Barro, Robert J, and Xavier Sala-i-Martin, "Empirical Analysis of a Cross-Section of Countries",Chapter 12, Economic Growth, McGraw-Hill, New York, 1995.
Blomstrom, Magnus, Robert E. Lipsey and Mario Zejan, "What Explains Developing Country Growth?".NBER Working Paper No. 4132, August 1992.
Blomstrom, Magnus, Robert E. Lipsey and Mario Zejan, "Is Fixed Investment the Key to EconomicGrowth?" Quarterly Journal of Economics, Vol. 111, pp.269-76, February 1996.
Brander, James A., "Comparative Economic Growth: Evidence and Interpretation", CanadianJournal of Economics, XXV, No. 4, November 1992, pp 793-818.
Brunetti, Aymo and Beatrice Weder, "Investment and Institutional Uncertainty: A Comparative Study ofDifferent Uncertainty Measures", IFC Technical Paper No. 4, December 1997.
Chenery, Hollis B. and Alan M. Strout, "Foreign Assistance and Economic Development", The AmericanEconomic Review, Vol. 61, No. 4, Part 1, September 1966.
Coutinho, Rui and G. Gallo, "Do Public and Private Investment Stand in Each Other's Way", WDRBackground Paper, World Bank, October 1991.
De Long, Bradford and Lawrence Summers, "How Strongly Do Developing Economies Benefit FromEquipment Investment?", Journal of Monetary Economics, Vol. 32, pp. 395-415, December 1993.
Devarajan, Shantayanan, William R. Easterly and Howard Pack, "Is Investment in Africa Too Highor Too Low? Macro and Micro Evidence", forthcoming Working Paper, November 1999.
Domar, Evsey D., "Capital Expansion, Rate of Growth and Employment", Econometrica, Vol. 14, 1946.
Durlauf, Steven N., and Danny T. Quah, "The New Empirics of Economic Growth", Discussion Paper No.384, Centre for Economic Performance, January 1998.
Easterly, William, "The Ghost of Financing Gap: Testing the Growth Model Used in the InternationalFinancial Institutions", Journal of Development Economics, Vol. 60, No. 2, pp. 423-438,December 1999.
Easterly, William, "The Lost Decades: Explaining Developing Countries' Stagnation 1980-1998",forthcoming Working Paper, World Bank, January 2000.

17
Easterly, William, Michael Kremer, Lant Pritchett, and Lawrence H. Summers, "Good Policy or GoodLuck? Country Growth Performance and Temporary Shocks." Journal of Monetary Economics,Vol. 32, No. 3, pp. 459-83, 1993.
Easterly, William and Ross Levine, "Its Not Factor Accumulation: Stylized Facts and Growth Models",forthcoming Working Paper, World Bank, January 2000.
Economic Planning Advisory Council, "Investment for growth" Australian Government PublishingService, Background Paper No. 39, pp 1-145, April 1994.
Gort, Michael, Saqib Jafarey and Peter Rupert, "Defining Capital in Growth Models", Federal ReserveBank of Cleveland Economic Review, Vol. 35, No. 2, pp. 19-23, 1999.
Gundlach, Erich, "On the Empirics of Capital Accumulation and Economic Growth", Kiel Working PaperNo. 577, May 1993.
Grossman, G.M. and E. Helpman, "Trade, Knowledge Spillovers and Growth", European EconomicReview, Vol. 35, pp. 517-526, 1991.
Gylfason, Thorvaldur, Principles of Economic Growth, Oxford University Press, 1999.
Harrod, Roy "An Essay in Dynamic Theory", Economic Joumal, Vol. 49, No. 193, pp. 14-33, 1939.
Harrod, Roy, Towards a Dynamic Economics, Macmillan, London, 1948.
Homstein, Andreas, "Growth Accounting with Technological Revolutions", Federal Reserve Bank ofRichmond Economic Quarterly, Vol. 85, No. 3, pp. 1-22, Summer 1999.
Howitt, Peter, and Philippe Aghion, "Capital Accumulation and Innovation as Complementary Factors inLong-Run Growth", Journal of Economic Growth, Vol. 3, pp. 111- 130, June 1998.
Jones, Charles I., Introduction to Economic Growth, W.W. Norton & Company, New York, 1997.
Jones, Larry E. and Rodolfo E. Manuelli, "Endogenous Growth Theory: A Midterm Report", Journal ofEconomic Dynamics and Control, Vol. 21, No. 1, January 1997.
Jovanovic, Boyan, "Growth Theory", NBER Working Paper No. 7468, January 2000.
Kahn, Mohsin S., and Carmen M. Reinhart, "Private Investment and Economic Growth in DevelopingCountries", World Development, Vol. 18, No. 1, pp. 19-27, January 1990.
Kahn, Mohsin S., and Manmohan S. Kumar, "Public and Private Investment and The Growth Process inDeveloping Countries", Oxford Bulletin of Economics and Statistics, Vol. 59, No. 1, pp. 69-88,1997.
King, Robert G. and Ross Levine, "Capital fundamentalism, economic development, and economicgrowth" Policy research working paper No.1285, World Bank, April 1994.
Klenow, Peter J., and Andres Rodriguez-Clare, "Economic Growth: A Review Essay", Joumal ofMonetary Economic, Vol. 40, pp. 597-617, 1997.
Klenow, Peter J., and Andres Rodriguez-Clare, "The Neoclassical Revival in Growth Economics: Has itGone Too Far?", NBER Macroeconomics Annual 1997.

18
Krueger, A. and D. Orsmond, "Impact of Government on Growth and Trade", unpublished, DukeUniversity, November 1990.
Knight, Malcolm, Normand Loayza and Delano Villanueva, "Testing the Neoclassical Theory of EconomicGrowth: A Panel Data Approach", IMF Staff Papers, Vol. 40, No. 3, pp. 512-541,September 1993.
Krugman, Paul, "The Myth of Asia's Miracle", Foreign Affairs, Nov.-Dec. 1994.
Kwan, Andy C.C., Yangru Wu, and Junxi Zhang, "Fixed Investment and Economic Growth in China",Economics of Planning, Vol. 32, pp.67-79, 1999.
Levine, Ross and David Renelt, "Cross-Country Studies of Growth and Policy: Methodological,Conceptual and Statistical Problems", Policy, Research, and External Affairs Working PaperNo. 608, World Bank, March 1991.
Levine, Ross and David Renelt, "A Sensitivity Analysis of Cross-Country Growth Regressions",American Economic Review, Vol. 82, No. 4, September 1992, pp. 942-63.
Lucas, R. E. Jr, "On the Mechanics of Economic Development", Journal of Monetary Economics,Vol. 42, 1988
Mankiw, N. Gregory, David Romer, and David N. Weil, "A Contribution to the Empirics of EconomicGrowth", Quarterly Journal of Economics, Vol. 107, No. 2, pp. 407-437.
Mankiw, N. Gregory, "The Growth of Nations", Brookings Papers on Economic Activity, No. 1,pp. 275-326, 1995.
McCallum, Bennett T., "Neoclassical vs. Endogenous Growth Analysis: An Overview", Federal ReserveBank of Richmond Economic Quarterly, Vol. 82, No. 4, pp. 41-71, Fall 1996.
McGrattan, Ellen R., "A Defense of AK Growth Models", Federal Reserve Bank of Minneapolis QuarterlyReview, Vol. 22, No. 4, pp. 13-27, Fall 1998.
McGrattan, Ellen R and James A. Schmitz, Jr., "Explaining Cross-Country Income Differences", ResearchDepartment Staff Report No. 250, Federal Reserve Bank of Minneapolis, August 1998.
Nazmi, Nader and Miguel D. Ramirez, "Public and Private Investment and Economic Growth in Mexico",Contemporary Economic Policy, Vol. XV, pp. 65-75, January 1997.
Nelson, Richard, "How New is New Growth Theory?", Challenge, Vol. 40, No. 5, pp. 29-58,September/October 1997.
Odedokun, M.O., "Relative Effects of Public Versus Private Investment Spending on Economic Efficiencyand Growth in Developing Countries", Applied Economics, Vol. 29, pp. 1325-1336, 1997.
Parente, Stephen L., and Edward C. Prescott, "Monopoly Rights: A Barrier to Riches", The AmericanEconomic Review, Vol. 89, No. 5, pp. 1216-1233, December 1999.
Pfeffermann, Guy, Gregory V. Kisunko and Mariusz A. Sumlinski, "Trends in Private Investment inDeveloping Countries: Statistics for 1970-97", IFC Discussion Paper No. 37, May 1999.
Polak, Jacques J., "Investment and Growth", International Economic Insights, Vol. 11, pp. 30-31,May/June 1991.

19
Pritchett, Lant, "Mind Your P's and Q's: the Cost of Public Investment in Not the Value of Public Capital",Working Paper #1660, World Bank, October 1996.
Pritchett, Lant, "The Tyranny of Concepts: CUDIE (Cumulated, Depreciated, Investment Effort) is NotCapital", forthcoming Working Paper, World Bank, November 1999.
Quah, Danny, "Cross-Country Growth Comparison: Theory to Empirics" Discussion Paper No. 2294,Centre for Economic Policy Research, November 1999.
Ram, Rait, "The Productivity of Public and Private Investment in Developing Countries: A BroadInternational Perspective", World Development, Vol. 24, pp.l373-78, August 1996.
Ramirez, Miguel D., "Public and Private Investment in Mexico and Chile: An Empirical Text of theComplementarity Hypothesis" Atlantic Economic Journal, Vol. 24, No. 4, pp. 301-320,December 1996
Romer, Paul, "Increasing Returns and Long Run Growth", Journal of Political Economy,Vol. 94, No. 5, pp. 1002-1037, 1986.
Romer, Paul, "Endogenous Technological Change", Journal of Political Economy,Vol. 98, No. 5, Part 2, pp. 71-102, 1990.
Romer, Paul, "The Origins of Endogenous Growth", The Journal of Economic Perspectives, Vol. 8,Issue 1, pp. 3-22, Winter 1994.
Rebelo, Sergio, "Long-Run Policy Analysis and Long-Run Growth", Journal of Political Economy,Vol. 99, pp. 500-521, 1991.
Rebelo, Sergio, "The Role of Knowledge and Capital in Economic Growth", Northwestern University,September 1998.
Senhadji, Abdelhak, "Sources of Economic Growth: An Extensive Growth Accounting Exercise", IMFWorking Paper WP/99/77, June 1999.
Serven, L. and A. Solimano, "Private Investment and Macroeconomic Adjustment: Theory, CountryExperience and Policy Implications", unpublished, World Bank, 1990.
Solow, Robert, "A Contribution to the Theory of Economic Growth", Quarterly Journal of Economics,Vol. 70, 1956.
Solow, Robert, "Technical Change and the Aggregate Production Function", Review of Economics andStatistics, Vol. 39, 1957.
Solow, Robert, "Perspectives on Growth Theory", The Journal of Economic Perspectives, Vol. 8, No. 1,pp. 45-54, Winter 1994
Stokey, N.L., "Human Capital, Product Quality and Growth", Quarterly Journal of Economics,Vol. 106, No. 2, pp. 587-616, 1991.
Temple, Jonathan, "Equipment Investment and the Solow Model", Oxford Economic Papers,Vol. 50, pp. 39-62, 1998.
Temple, Jonathan, "The New Growth Evidence", Journal of Economic Literature, Vol. XXXVI,pp. 112-156, March 1999.

20
Vanhoudt, Patrick, "The Issue of Public vs. Private Investment in Physical Capital and Knowledge:What is the Relevance for Economic Growth?", Tijdschrift voor Economie en Management, Vol.XLII, No. 1.
Vanhoudt, Patrick, "A Fallacy in Causality Research on Growth and Capital Accumulation", EconomicsLetters, Vol. 60, pp. 77-81, 1998
Young, Alwyn, "Tyranny of numbers: confronting the statistical realities of the East Asian growthexperience", Quarterly Journal Of Economics, Vol. 110, pp. 641-80, August 1995

21
Chapter 2 - Private and Public Investment Trends
In 1998, the latest year for which national accounts data exist, private investmentin the fifty countries included in the data set, continued to rise on average and publicinvestment to decline. Although the increase in private investment was small, it occurreddespite worsened economic conditions in many developing countries.15 The ratio ofaverage private investment to GDP increased slightly to 14.3 percent from 14.1 percent in1997 (see Figure 1). Public investment, on the other hand, fell more sharply as a ratio toGDP, from 7.5 percent in 1997 to 7.0 percent in the most recent year.
Fig. 1. Trends in Private and Public Investment(percent of GDP)
-*- Private investment -Public investment
1614
a.12o 10
06
2
1970 1974 1978 1982 1986 1990 1994 1998
Regional trends mirrored the overall figures, as shown in Figures 2 through 5.Most notably, Latin America has experienced a significant up swing in privateinvestment in the latest three years, while investment in East Asia, affected by a deepfinancial crisis, continued to decline in 1998. South Asia and Africa, both with generallyincreasing trends in private investment, have seen public investment falling.
Latin America was the regional leader in private investment growth (See Figure2), but the ratio of public investment to GDP continued as the lowest among majorregions. Private investment reached 16.2 percent of GDP in 1998, exceeding publicinvestment by a factor of three. Private investment increased in all major countries ofLatin America, but Belize, Colombia, Peru and Uruguay followed flat or declining trends.
15Investrnent refers to gross domestic fixed investment, encompassing both national and foreign directinvestment.

22
Fig. 2. Latin America: Private and Public Investment(percent of GDP)
-Private Investment -Public Investment
20
1 5
Io R 10
5
0 _
1970 1974 1978 1982 1986 1990 1994 1998
In Sub-Saharan Africa (Fig. 3.) in 1998 private investment increased for the thirdyear in a row and reached a ratio of 10.5 percent of GDP. Private investment increased inCote d'Ivoire, Cape Verde, Gambia, Chad and Mauritania. The remaining Africancountries covered in the data set recorded declines in private investment to GDP ratios.Sub-Saharan Africa had the second highest (next to East Asia) public investment to GDPratio among the regions in 1998. Nevertheless, for the second year in the row, privateinvestment exceeded average public investment for the region.
Fig. 3. Sub-Saharan Africa: Private and Public Investment(percent of GDP)
-0-Private Investment -Public Investment
1 61412
o 0
a 0 6
2
1970 1974 1978 1982 1986 1990 1994 1998
Private investment in South Asia (Fig. 4) fell as a proportion of GDP in 1998, butonly slightly. Except for this blip private investment's importance in South Asia hasbeen increasing for 25 years. Private investment increased in Bangladesh, but declined inIndia, and remained nearly flat in Pakistan. Public investment followed a declining trendas well, and remained at a level of about half of private investment.

23
Fig. 4. South Asia: Private and Public Investment(percent of GDP)
-e-Private Investment -Public Investment
161412
o 10
42
1970 1974 1978 1982 1986 1990 1994 1998
East Asia's average private investment ratio declined in 1998 for the second yearin a row to a level last recorded in 1989. Not surprisingly the most pronounced declinesin private investment were registered in the crisis countries: Indonesia, Korea, Malaysia,Thailand and Philippines. Private investment declined as well in Cambodia, remainedflat in China (though at a high level) and increased in Papua New Guinea. Publicinvestment increased only slightly. East Asia has the highest level of public investment toGDP among the regions, exceeding the global average by 1.5 percentage points.
Fig: 5. East Asia: Private and Public Investment(percent of GDP)
-o- Private Investment -Public Investment
30
25
2015
5
1970 1974 1978 1982 1986 1990 1994 1998
Individual country trends as well as the statistics are shown in Appendix 2.
24
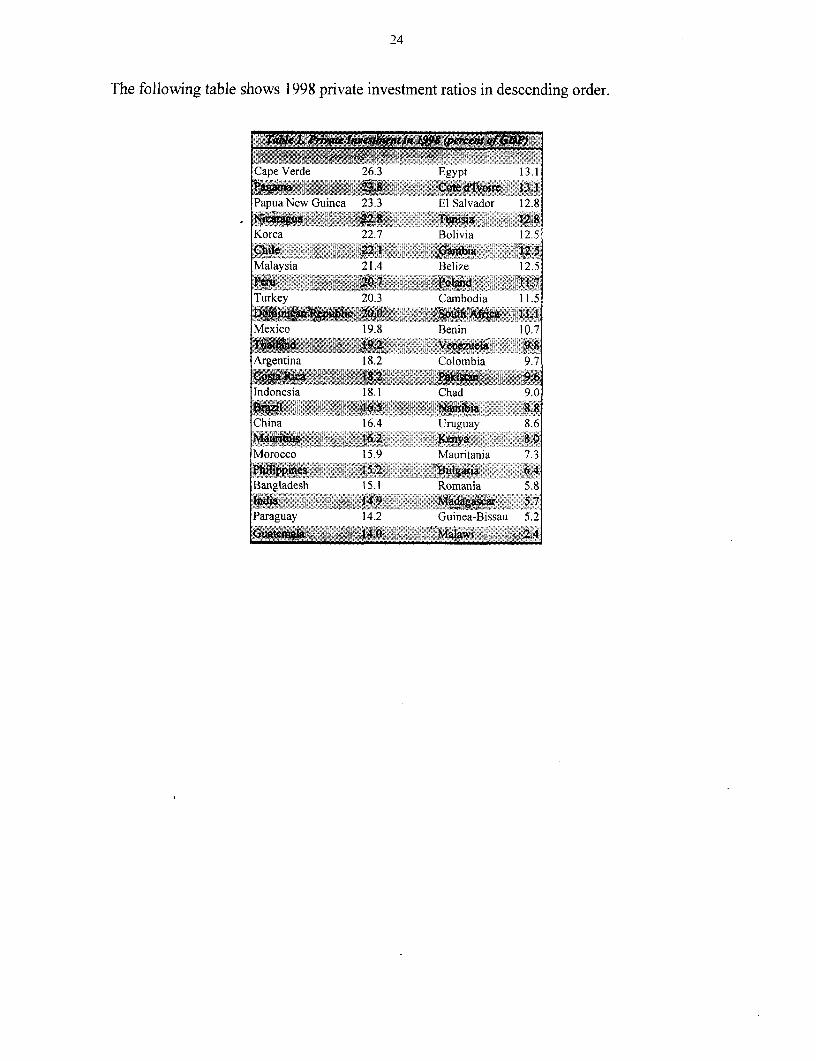
The following table shows 1998 private investment ratios in descending order.
Cape Verde 26.3 Egypt 13.1
Papua New Guinea 23.3 El Salvador 12.8
Korea 22.7 Bolivia 12.5
Malaysia 21.4 Belize 12.5
Turkey 20.3 Cambodia 11.5
Mexico 19.8 Benin 10 .7
Argentina 18.2 Colombia 9.7_~~ .
Indonesia 18.1 Chad 9.0
Z0.7 .3.rgMM .w WiRa
China 16.4 tlruguay 8.6
Morocco 15.9 Mauritania 7.3__0 Z0>$ t3 ~i§ 0A5. ' .'
Bangladesh 15.1 Romania 5.8
Paraguay 14.2 Guinea-Bissau 5.2
i" Orl_S£N

25
Appendix 1: Methods and Sources
1. Fixed Investment Data
National accounts normally do not break down gross domestic investment into its privateand public sector components. Private investment is defined in this publication as the differencebetween total gross domestic investment (from national accounts) and consolidated publicinvestment. Consolidated public investment data for each country were compiled mainly fromWorld Bank Country Economic Memoranda, Public Investment Reviews, Public ExpenditureReviews, and other World Bank country reports. They reflect efforts by World Bank missionsto compile public sector data. Where World Bank data are not available, country data wereused.
The countries included in this edition represent all the developing countries for whichthe relevant data are available. Minor changes were made in the last two or three years for mostcountries as a result of revisions in their national accounts data. Updates are not available (atthe time of this writing) through 1997 for the Republic of Korea.
Table 1 in presents investment figures for each country, including total fixed investment(GDFI/GDP); private fixed investment (PRIVATE I/GDP); and public fixed investment (PublicI/GDP). The ratios are computed using local currency units at current prices.


27
Appendix 2 - Country Charts


29
Sub - Saharan Africa
Benin
Cape Verde
Chad
Cote d'lvoire
Gambia
Guinea-Bissau
Kenya
Madagascar
Malawi
Mauritania
Mauritius
Namibia
Soutlh Africa

30
Benin tZfte d' Ivoire
35 35=
0() ........ ... ... 30. .
25 - 25
25.* . ........ ....... Is..X
7], . .. 1 0 . . . ... ...... . .............. 20
.. ~~~~~~~~~~~~~~~~~~~. .. '................_.i _
1930 1951 9'W 193 1 1955 1995 1996 1997 195 I')% 1997 MS7 1999 193 19X 7 1992 ' 194 1Q55 ['56 !1'? ],
Cape Verde Gambia
30
25.
23
O 0
55' I'M 199 1955 19)1 1992 199.3 1956 1996 556 19197 19% 1997 I99 11~9 195 ) 1993 .1~ >55, R 14A 1427 '30, ['4 '61)
Chad Guinea-Bissau
30
20~~~~~~~~~~~~~~~~~~~~~~~~~I1 . -
3i 2 ,,,,, ,,,.t,,
15.
10
19311 i4~ 19% 1997 199 1987 19 19 '933 1991 21 199 IM 1VW6I-R,' 10 '4"

9S651 5661 K.61 D%t 065 E961 9S61 tfiI Z%I 061 %lal61 E(61 161 &(l S6( E16t
0
ol 01
01.................... ..... , . -----Is , , f;,,,,,,/ ,,,,............ CZS
.......................................... .......... Cc .....................................................' ,i..
dEDt/estl:Bt4io g L~~~~~~~~~~~~~~~~~~~~~~~~~~~~~~~&P'., -1wi 1WU
.1 L~0 0
... .. .. . ~~~~~~~~-==- -iS ......................... ...... -.- -:- ---::-- ----- .......... - SE
u*/otu/.
61 S661 K6i 1 0561 SS 9I j bS1 0961 Slb1 9061 6 1 9 0 1 Z6 l 0061 6 t6 1 6 6 1061 1661 _ 0 61 01951 ,0'
.... .... .. .;. ; ... .s t
'''''''''''''''''''''' ''''' '''''''7g- --- ---- 0sl ........ 0 .
. .......... . . . . .... .....--------- :-- SE .7Pz u
sn!lJneW~~~~~~~~~~~~~~~~~~~~~~~~~~~~~~~~~~~~~11 ...sSee
--- I O -Fw -d - - - --- - CI
,A, . - - f nl C\/\\\ e t ;1 0o
-_ -S ---- ----- --- ----- ---------- ''''''5
0 ~~~~~~~~~~~~~~~~~~~~~~~00
00 00
I >,,,,ual.v3vNo N d¢)v4,SI Si
...... ....... ...... ... : ...: :51 .. .............. .... , CZ1 ..:. S ... ,. p
1S~~~~~~~~~~~~~~~~~~~~~~~0
da)j~~~, q ~,~USE .. ..
dfluu '9nu1

32
South Africa
35 I G- p
5 . ..... .
1970 1973 1976 1979 1982 1985 IYSS 1991 1994 1997

33
Latin America and the Caribbean
Argentina
Belize
Bolivia
Brazil
Chile
Colombia
Costa Rica
Dominican Republic
Ecuador
El Salvador
Guatemala
Mexico
Nicaragua
Panama
Paraguay
Peru
Uruguay
Venezuela

34
Argentina Brazil
35
-3t m h0 ......
30 -c -D.--- Rli.c hr. %.fGDl 30
25 .-- Ri ................. ................. I Z. ........... FP
25
25.20
0~~~~~~~~~~~~~~~~~~~~~~~~~~~I
-- _ _ _ _ ...-.----- sK~~~25 ....... ... .
1970 1974 ['173 1912 1%6 195O 1933 19i8 0
1970 [974 1478 [9 112 9106 193) 136 1 94
Belize Chile
35 R - - ; : - - -35
30 ...... VblcIns:'x,f - - - --- - X 30 ) McImf ' ''
--- 1 .. ... . .., .... , 5 ..25 25.
20 2
1972 1914 1976 19)7!3 I'M80 12 [9934 198.5 1988 1990 9 1992 N4 M6 1998 1970 192T 1976 1979 1912 195 1916 1991 [914 1470
Bolivia Colombia
35 . - -X- -- --- ~ ~ ~ :3 - ft := /.C . .'ii lm%ef3 30 5
30 R-krk %r.f(l-- Rl :%fl ...o....199.. In91C1
25,0.., ;
25,.. . . .
20, .. .... ... .. ..... .. ....~~~~~~~~~~2
5 ~~~~~~~~~~~~~~~~~3 .... .......
20
15~~~~~~~~~~~~~~~~~~~~~~~~~~~~~~~~~~1
IO
5,~~~~~~~~~~~~~~~~~~~~~~~~~~~~~~~~~~
(4 - ... . .. .. O _1970 1974 [978 1982 1986 M9O 1994 I[1
1 *9 1988 [989 1995 [911 [92 I'M1 1-94 [995 1996 I%)7 1918 __ _ _ _ _ _ _ _ _ _ _ _ _ _ _ _ __ _ _ _ _ _ _ _ _ _ _ _ _ _ _ _

35
Costa Rica El Salvador
54~~~~~~~~~~~~~~~~~~~~~~~~3
30
ftik .% CT3 . I-1..tu
21 2
. ...-.-.. .... -. _
0, ...... .... .. ...................... ~~~~~~~~~~~~~~~~~~~~~~~~~..........20
97311 1974 1975 M4 1545 1990 19 'PA 1971in 1974 19751 15431 14 NM3 3954 55
Dominican Republic Guatemala
35 . . . . . 35 | h
3. 305.
r ... ....... .. ... ..... 20~ .dil .9~I /~f25 ~~~~~~~25.
15s 15-
32, .... . ..... 10
5,1 /. .... \ ... .-/' ''-': ~~~~~~~~~~~~~~~~~~.. ...... 5 _ -';.......... ..... ..... . '
9330 3974 '7 12 546 39% 3 54 1958 1970 1974 1938 1943 1946 13 1544 I3918
Ecuador Nicaragua
33,~~~~~~~~~~~~~~~~~~~~~~~335 __ . . ... . ....
R.1h '4faP 35
30
25
2 5 ... .. . ..........................
25~~~~~~~~~~~~~~~~~~~~~~~~~~~~~~
... . .... ..... ,0 .S -; 20I - - - -- -- - / --
(S _-------- __ _______ 5 ____
'433) '473 176 '413 I9 1985 3'S 3943 1994 1957 O . -
1993 1941 19)2 1933 544 1935 1Q% 1947 13893

36
Mexico Peru
R55 35
-30 ..... 30
25 25.
';20 '-- f..D1 ----........... .. .
1a 15
10 ~~~~10.
. X t /~~ . . ~ . _ _ _ _ - . . . 0 - . , _ _ _ _ _. ...-1....... . ..... . 7. : .. ...
I25 I4 19 9 5 191 191 1 92 19399431919 981 1934 1917 1X5 1933 9
Panama Uruguay
30 305.I,
j-Ri 7 'dP25 . . ...... .. 25 .. ..... ... .
30.. 30 .
: 5 2 5 -- . ...... . .. .. . ...... ,
15.
!5 S . /</ vV \/> 15 ..... ......... ..
,. ; X, ' ,,, ; ~~~~........... ..... _.,,. ... .
-E .- - _ _ __ . - __ _0-
'985 I, 1937 1 S V 195 1991 19'7 1993 1934 193 196 19397 1 170 1974 1938 19931 1963 1930 914 1993
Paraguay V enezuela
'9 35-- -- --- - -
35- -- -- - -
* 910z/,30Ci-.D
25.
5 ~~~~~~~~~~~5 ...
157,3 93 1974 9I 19312 1936 1933 196 1916 195 1933 1956 1937 951999 195 I931 19521 91 1934 19-51 19% 19379916

37
Middle East, and North Africa
Egypt
Iran
Morocco
Tunisia
Turkey

38
Egypt Tunisia
35
IS- % 10
so RH~ 1~~ ?Ikf - 3-0 -- __ __L,_ -- 1) 'DP
I0: 10514 1( 18 090 12 199 1 9 10 197 1Ž 4 1970 1 90 eS1 ' A
Iran Turkey
35 35
30 30 -P-dA.I. 97f' -. 0CiDP
2I: -- -.X............. 20 -
58 5--.-- ......... .
o-. - _ ._ ___ _____----- _--- _ -
''.4J i1%4 1953 19)02 19S 1910 1c974 1978 1942 I0b 14): 1Ž10 -'
Morocco
15 -- .... - E .......... . _ .... . .
35
no, ~~~~~~~.. ... ...... . ..........
2'5 - -
15 .- . 1 - .. . ..
'175 15,7:3 1901 1901 1907 1407 1c90 1905

39
Transition Countries
Bulgaria
Poland
Romania

S361 /661 %61 5661 1061 £651 £651 1661
- 01
.... '. .. .. .. .. : .-.-.:;. '0
.............. .............. .. .................. .... --
%
;~~~~~~~~~~~~. . .... ......' '.'. '.'. o z
0£
& % -M, -ld - -
.. .............. ,o
8 651 9 66 1 £651 1661 5610
.... .. ......... ...... 7=........ 5
o.
dOW" %
0O
.......... .......... ~ ~ ~ ~ 0
ot,

41
East Asia
Cambodia
China
Indonesia
Korea
Malaysia
Papua New Guinea
Philippines
Thailand

42
Cambodia Republic of Korea
35 35.
iXbilc Tn.: <> .,-dT ~~~~~~~~~~ ~~30 - W
25.
25 /\ 21. <
O ' . - - -
01513>3 ~ ~~~~~~~~ ~ i9S0 1_ 19_ 19_5 159
I971 1974 1977 10 ii3 198 1979 1%2 i95 19P
China Malaysia
97 ~~~~~~~~~~~~~~~~~~~~~~~~35PniEvalms,e EE Eiinv/
3(, . 30 . ......... ..........
S ~~~~~~~~~~~~~~~~~~~~~~~~~~~---Pbiica.of . I5. --licr'/.f(EPXX25 2
25~~~~~~~~~~~~~~~~~~~~~~~~~~~~~
2 ) ..... D....... ...2_ .. ... .
| O f . .- _ - J .......... .... lo ;,_, .... .............. ............ :. ,! ....~~~~~..... ..... .. .
10
1930 1792 1974 1'. I73 19O0 19D2 1974 1996 19_31970 1974 1979 1952 1292 1990 19S4 192
Indonesia Papua New Guinea
30 30.. Ri 1 W '/ 1CUP
2D~~~~5
15 .... 15
~~~~~~~~~~~~~~~~~...........0 0
1971 i976 1991 192 1971 1974 1977 19112 19731 lOX

43
Philippines
35,
70 .. I±ien 51h" 'd11 ..............
125
o L
20
1975 1977 1979 1981 19X 1I5 1997 1999 1991 1993 1995 197
Thailand
3970 1Q73 19 a 19 19 19 1
20 ; r t/ ~~~~~~~~~~~~~.... ... ....-..........
10~~~~~~~~~~~~~. ..... .-...... _5''.,:.... .....'.__"
1970 ' 197 I76 197 1 9 195 198 1991 1931 199


45
South Asia
Bangladesh
India
Pakistan

46
Bangladesh
30
15
3,51 c0 .. . ..
25,:: .. ::....
20
0 170 19774 l'43 192 11 I-
Pakistain
35 .-° --
30* Ldi,cI .d(.lIF
2D
25
3D-
0 -
I9A 70 lf774 19)73 1'B2- 1'(986 1}1

Table 1. investment as a share of G8DP (in %)Country/Year ~~~~~~~~1970 1971 1972 1973 1974 1975 1976 1977 1978 1979 1980 1981 1982 1983 1984 1985 1986 1987 1988 1989 1990 1991 1992 1993 1994 1995 1996 1997 1998
Argentina GDIIGDP 21 2 20.9 203 18.2 19 3 25.9 26.8 27 2 24.4 22 7 25.3 22.7 21.8 20 9 20.0 17.6 17.5 19.6 18 6 15.5 14.0 14.6 16.7 18.2 19.9 17.9 18 I 19.4 1 99Private IiGDP 13.1 12.8 12.5 11 6 12 5 16.1 15.1 15.0 13.4 14 1 19 2 16.9 16 6 14.8 14.9 12.5 13.2 15.7 14.4 12.2 9.4 12.7 14.9 16.6 18.1 16.4 16.8 17 9 18 2Public 1/GDP 8.1 8.1 8.2 6.6 6.8 9 8 11 7 12.2 11.0 8.6 6.1 5 8 5 2 6.1 5 0 5.1 4.3 3.9 4 3 3.3 4.6 1 9 1.8 1.7 1.8 1.5 1.3 1.4 1.7
Bangladesh GDIIGDP 3.0 7 1 6.3 9.9 11.1 11 8 11 3 15.3 23.5 22 6 19.7 18 1 19 I 18.5 19.0 18.4 19.1 18.9 18.7 18.8 18.9 19 0 20.0 20.8 21 6 22 2PrivatelI/GDP 2.9 4.2 3.4 5 4 4.9 5.6 5.7 8.2 13 6 12 4 10.0 9.6 12.7 1 1.4 11.4 11.5 11.7 11.6 12.0 11.8 12.4 12.3 13.2 14.4 14.5 15.1
Public I/GDP 0.1 2.9 2.9 4.6 6 2 6.2 5 6 7.1 9.9 10 2 9.8 8 4 6.4 7.2 7.7 6.9 7.3 7.3 6.7 7.0 6.5 6.7 6 8 6.4 7 1 7.1Belize GDFI/GDP 26.2 23.5 27.1 25.3 28.7 28 0 28.5 26.6 22.7 24.8 22 5 18.9 20.3 17.4 17.4 21.5 25 7 27.4 25 6 28 5 29.3 29.8 24.1 20.6 18 5 23.3 23.9
Private I/GDP 17.8 15.2 14.8 16.6 18.5 16 1 11.7 9 8 11 1 13 5 9.8 8.5 11 8 8.7 8.4 13 8 17.1 17.4 11.4 8.1 10 0 16.3 13.0 12 7 12.0 12.8 12.5
PubliclI/GDP 8.4 8 3 12.3 8 7 10 2 11.9 16.8 16.8 11.5 11 3 12.7 10.4 8.6 8.7 9.0 7 7 8.6 10.0 14.2 20.4 19.3 13.5 11.1 7.9 6.5 105 11 4Benin GDFI/GDP 13.4 13.6 13.2 15.0 15.5 17.2 16.6 18 5 16.2
Private PGDP ~~~~ ~~~~~~~~ ~~~~~~~~~~~~~~~~6.8 6.1 6.7 7.9 6.2 6.9 9.1 11 0 107
Public I/GDP 7.4 7.4 6.6 7.1 9 3 10.4 7.5 7.5 5.4Bolivia GDFI/GDP 12.1 12.7 12.0 12.6 14.5 16.3 16.7 14.9 15.9 16.4 17.2 18.8
Private I/GDP 5.9 4.0 3.6 5.0 5.8 6 6 7.7 6 4 7 6 8.4 18.0 12.5
Public I/GDP 6.2 8.7 8 4 7.6 8.7 9.7 9.0 8.5 8.3 8.0 7.2 6.3Brazil GDFIIGDP 18.8 19.7 20 2 21 4 22.8 24.4 22.5 21.3 21.8 22.8 23.6 24.3 23.0 19.9 18.9 18.0 28.0 23.2 24.3 26.9 22.9 19.6 19.6 20.4 20.7 20.5 19.1 19.5 19.9
Pnvate I/GDP 12 8 14.2 14.4 16 2 15.8 16 9 14.2 14.7 14.1 12.5 17.0 16 6 16 0 13.8 13.7 12.9 14.4 16.8 17.9 21 1 17.6 14.4 13.9 15 5 15.8 16 8 15.3 15.7 16.5Public I/GDP 1 6.0 5.5 5 8 5.2 7.0 7.5 8.3 6.6 7 7 10.3 6.6 7.7 7.0 6.1 5.2 5.1 5.6 6.4 6.4 5.8 5.3 5.2 5.7 4.9 4.9 3.7 3.9 3.8 3.4
Bulgaria G2DFIIGDP 24.4 18.2 16.2 13.8 13.8 15.3 13.6 10.8 11.6Private l}IDP 0.9 0.5 0.3 2.9 5.4 6.8 5.3 5 5 6 4
Public I/GDP 23.5 17.7 15.9 10.0 8.4 8.5 8.4 5.3 5.2Cambodia GDFI/GDP 9.4 11.0 8.2 9.4 9.8 14.3 18.5 21.8 25.9 19.0 15.0
Private I/GDP 8.0 9.5 7.1 980 9.5 10.0 13.0 14.7 19.5 14.0 11.5____________________Public I/GDP 1.4 1.5 1.2 0.4 0.3 4.3 5.5 7.1 6.4 5.0 3.6
Cape Verde GDFI/GDP 31.3 24.4 26.3 25.5 29.1 37.9 43 6 51.3 49.6 44.8 44.5 45.7Private I/GDP 7.0 7.8 11.9 14.1 15.3 9.0 12.7 13.4 17.9 15.3 23.0 26.3Public 1/I3DP 124 3 16.6 14.4 11.4 13.8 28.9 31 0 37.9 31.7 29.5 21.5 19.4
Chad GDFI/GDP 1 1.8 11.6 11.9 14.4 14.4Private I/GDP 4.4 5.3 5.6 7.8 9.0Public I/GDP 7.4 6 3 6.3 6.6 5.4
Chile GDFIJGDP 16.4 14.5 12.2 7.9 21.2 13.9 12.8 14.5 17.8 17 8 16.6 18.6 14.2 12.0 12.4 16.8 17.1 19.4 20.3 23.0 23.1 19.9 22.4 24.9 23.3 23.9 24.8 25.2 25.2Private IIGDP 9.5 6 5 4.5 0.5 9.2 3.2 4.8 7 6 11.4 12.6 11.2 13.4 9.5 7 4 6.4 14.1 13.6 13.1 14.4 18.2 18.4 13.0 16.7 18 9 18.0 19.9 19 6 20.4 22.1Public I/GDP 6.9 8.8 7.7 7.4 12.0 10.7 8.0 6 9 6.4 5.2 5.4 5.2 4.7 4.7 6.0 2.8 3.5 6.4 5.9 4.8 4 8 4.9 5.8 6.0 5.3 3.9 5.2 4.8 3.1
China GDFI/GDP 20.2 19 8 23.2 24.1 25.6 28.4 30.6 31.7 31.8 26.1 24 4 25 9 30.3 37.7 36.4 34.2 33.8 33 5 35.8Private I/GDP 3.7 6.0 7.3 8.1 9.8 9.6 102 11.2 11.6 9 5 8.3 8.7 9.7 14.9 15.9 15.6 16.1 15.9 16.4Public I/GDP 16.5 13.7 16.0 16.0 16.5 18.7 20.4 20.5 20.2 16.6 16.1 17 2 28.6 22.9 20.6 186 17.7 17.6 19.4
Columbia GDFIIGDP 18.0 17.5 16.1 15.8 16.4 15.3 15.9 14.5 15.4 15.4 16 8 17 7 17.5 17.2 17.0 17.5 17.7 17.4 19.5 16.6 16.6 15.0 15 1 18.9 23.3 22.5 18.5 17.4 16.2Private I/GDP 12.4 11.6 9.8 10.1 11.5 9.9 10 3 7 9 9.9 10.0 9.8 10.3 9.4 9.7 8.5 8.4 9.2 10.2 11.5 9.6 10.2 8 4 8.3 10.8 15.2 14.8 10 4 9.7 9.7
Public IIGDP 5.6 6.0 6.3 5.7 4.9 5.4 5.6 6.6 5.5 5.4 7.0 7.3 8. 1 7.5 8.5 9.2 8.5 7.3 8.0 7.0 6.4 6.5 6.7 8.1 8.1 7.7 8.2 7.7 6.5Costa Rica GDFI/GDP 19.4 22.1 21.9 28.5 21.3 20.7 23.5 22.4 23.0 26.2 23.9 24.1 20 3 18.0 20.0 19.3 18.7 19.8 18.9 20.5 22 4 19.7 20.8 23.2 19.5 18.9 17.1 19.2 23.7
Private IIIDP 15.0 16.4 15.1 14.7 15.8 14.4 15.1 14.2 15 6 17.3 14.7 15.2 13.1 11.6 13 7 12.3 12.9 15.4 14.8 16.0 17.7 15.5 16 6 18.3 14.6 13.8 12.2 14.0 18 2Public I/GDP 4.4 5.7 6.8 5.8 5.5 6 3 8.4 8.2 7.4 8.9 9.2 8.9 7 2 6.4 6.4 7.0 5.8 4.4 4.1 4.5 4.7 4.2 4.1 4 9 4 8 5.1 4.8 5.1 5.5
Cole dIlvoire GDFO/GDP 14.8 14.1 13.8 12.2 8 5 8.6 8.5 7.8 11.1 12.9 13 9 16 0 18.2
Private I/GDP 7.9 6 7 6.8 5.9 4.9 5.1 4.7 4.1 7.0 8.7 9.6 11.2 13.1
Public I/GDP 6.9 7 4 7.0 6.3 3.6 3.4 3.8 3.7 4.1 42 4.3 4.8 51Dominican Republic GDF1IGDP 19.1 17 9 19. 22.2 23.3 24.5 22.3 21 7 21.0 23.9 23.9 22.8 18.7 20.3 21.0 18.3 20.6 26.0 27.1 28 2 24.9 21.6 22.5 26.4 23.6 21 5 21 0 21.9 25.~7
Private I/GDP 14.8 12.4 12.2 15.1 15 9 16.5 16.0 15.6 14 8 18.8 16.3 16.1 14.3 15.6 17.6 12.9 16.0 16.2 16.8 18.1 18.2 15.3 15 4 16.4 13 8 14 1 13.3 16.2 20.0
Public IIGDP 5.1 5 5 7.6 7.1 7.4 8.8 6.3 6 1 6.2 5.1 7.6 6.7 4.4 4.7 3.4 5.4 4.6 9.7 10.3 10.2 6.7 6.3 7.1 10.8 9.8 7 4 7.6 5.7 5.7Ecuador GYDFI/GDP 16.7 21.8 18.0 17.6 18.2 23.2 22.2 23.6 26.2 23.7 23.6 22.3 22.7 16.6 15 4 16.1 18.8 22.7 21.3 20.7 18.4 19.7 19.5 19.9 18.8 18 6 178a 19.0
Private I/GDP 10.0 14.7 11.4 10.8 10.2 14.5 13 0 13.4 16.8 14.5 14.1 11 7 13.0 8.6 9.0 9.5 9 6 13.4 12.7 11.6 12.4 12.6 12.4 13.2 12.8 13.1 11.7 13.3Public IIGDP 6.7 7.1 6.6 6.8 8.0 8.7 -9.2 10 2 9.4 9.2 9.5 10.6 9.7 8.0 6.4 6.6 9.2 9.3 8.6 9.2 6.1 7.0 7.1 6.7 6.0 5 5 6.1 5.7
Egypt G3DFIIGDP 38.1 34.2 32.1 32.1 34.4 27.4 34.5 30.6 26.9 22.2 19.1 16.2 16.6 16.5 16.0 17 6 19.4Private I/GDP 9.1 13.9 13 1 12.7 13.2 10.1 13.3 16.0 16.7 13.1 10.5 9.2 10.5 10.9 10.5 12.1 13.1Public I/GDP 21.0 20.3 19.0 19.4 21.3 17.3 21.2 14.6 10.2 9.2 8.5 7.1 6.1 5.6 5.5 5.6 6.3
El Salvador GDF1/GDP 10.7 11.2 14.1 12.4 14.2 23.0 20.1 21.2 21,4 17.6 13.6 13.6 12.6 11.6 11.5 12.0 13.1 13.6 12.6 13.3 13.7 15.2 17.2 1I7.8 1 -8.6 18.6 15.5 16.0 16.7Private I/GDP 8.4 8.3 10 1 8.8 9.5 15.0 13.9 13.9 15.6 11.5 6.4 6.2 6.5 7.0 7.6 8.7 10.6 10.7 9.5 9.8 11 2 12.3 13.2 13.7 14.7 15.0 11.3 12.3 12.8Public I/GDP 2.3 2.9 4.0 3.6 4 7 8.0 6.2 7.3 5.8 6.1 7.1 7.3 6.1 4.6 3.9 3.3 2.5 2.9 3.1 3.5 2.5 2.8 4.0 4.0 3.8 3.6 4.2 3.7 3.9

_ l0 ~ C - C 'CnO ios i tCll0Cl.CC OCl f s i>r ov OCllll S 00Cx x l'x 00vClClcCCCx oCl0CCllCe-0'C Clen0n Cl00ClClCl'CClCl00-Cl1--0Cl b O _ 4e C'C-CxeCC 00lCC0Cl0Cl00ClC
o~~~~~C - s Nd - - _ C lC -_l Sl C l-< n0 - e C l~ o s_xnS>SMxxv mclCl x>N>Se
_ l0 ' C ClClClClCl _0 _0 -_ 'C o£ eCl-O Cl00 Cl-- >> a£ ClClOCa lC l00 ClCl s £C l >
Cl Cl 00 00 lle e C 'C xC 00 o 0 xl ol - Co x0 _C Cl Cl 'C -s Cl 'C Cl xC Cl Cl s eC l xl l Co l Cl 00 Cl 00 o _l Cl C ol C XC C o__ 1 _ r l - o- -' r _ ClC5 l o o f x V o x o x t v u i x a x N G °
o C'ov C <l0 c 0 IC r r rrV c o_ Oo x_rl0 00 C0 C0 CCCCC0 C'C l0 lC l ClC CCCC l0 l 0 CCCC o x v, cl tcr lOCllC o
Cl jOI ci o OCr i Cl jCt0 vClCl-0 'jXr i R o ci-Cl o i cClot 'C lC lC 00Cai -'C'CCx 00 r i ClCl'Cx lC 0t C o x ClCl a Cl _
al Cll CO l C _C l Cl C Cl xl Cl l Ol Cl xl Cl xl Cl Cl ri o' 0o -e xl ol o o ol 'C Cl j Cl Cl _ o. 0 l 00 ol ol ol -l Cl xl -l x 'C Cl C C x C x
Cl__ __…C l N- ClC - …ClCl _>--¢S __>--N
r~~l ClCl Cl C l ernwen - r rr eee C Sro l-vr-evoCo l…xr sa;o ClaCx
vl C Cl r ' l Cl Cl x l 'C x l Cl C x l r r - l Cl Cl Cl C Cl Cl Cl l Cl 00o C 'C Cl o 00 'C C Cl _ Cl r Cl 'C 00 00 x C 0 Cl Cl o Cl Cl C v x -x x -orl- __ C> l C lCl- C l - Cl _ r - - _ C-C -C l -- …C
ClCl - -_ Cl lClCl_ Cl-…l Cl- -l --- 1 z __ r
OmvteMSvtv!eeeCM lClCl0 0rCxl Cr o x. v CCl''SCe Cv ! ,C rlvClS!eCCC''CCCCCC-Cl0 CCCC' ClCl'rCl'r!CCl Cv CCv! CCvCl - Cl Cl Cl Cl Cl - Cl _l - v-. v 00 00 r - C 00 00 Cl 00 00 Cl Cl Cl xC xl xl a -r Cl vl 6 6 6 6 6 4i S g x a _ C; r a x; C er 00_ le
ClC o - C > l ClCl-r Cl- Cl-m rt n ¢ _ rxxv1 Cl t r rroCl - v > v l l C zxr or >xr lo
> a CC C'C_CClOC lClnV CC-C0_C-CCl0CllC'C lCCl lot ixr wvr> + i xa svrV iclClCl'Cw ClCi .lC lC 'C l-llCe rer0 riC _ rx vv l-r
stC >¢v3>_v 0Or->tnat^rov f n^v vfsr ru zv_wnxtrr x i l vCl ori -- ° ClClCl .Cl .' ' V xr - ClC r o iV xl Vx i - -i Cxl.rz rvx S xx
r _ x xCl'CCrlC r-lr.CloCoClClC Vl'CClCVlCl r _ xClC_lol x oClC o x _r x V _0r r. x C vClCCl S VlrCx r 0 l eel ClCl000_ _ l_ rnCCrCrl 6- 66r6_C_ _ rl rC-_ _6r _CrC_Crl6'_6_0_ C;6-lvC_ _
v0 0
eCrl Cl0lCrClr e -Clr lClCle llx Cl e 9 l , e x r lC ClClClClCCl x el 9 e 9 * r X lC x e a r00e l 00 ox rCa C_CC6e'X0'a.0 Crlx r06r66'r Clr V0llCCC 00ClrlClClrC_ _ r. 0ClCl00C rC r 0' rCl00C rClClC r V r r r Cl r- r r
sxC.'ll Cl - - ClCl imor ov rr Xr - - Cl…VX-sotrt Aw r Drjr N V EE>X;_cClr0E xo -C0 ClllCe ClC l Ce l l0C l--. 00Vr l r -x l00C x lC x_ 00C0 ClC lnCe ll rCClC0 o lClC_lCl00lro VV
00 Cl vl ri Cli Cl Cl Cla ~ ° 6 6i x 4r r r; 4r ri 4 r r ; o< en4C;e en Cl x ri 4 _ ,< ri _ = 6 6v C; Cl Cl clC'CV Cl ' o -Cl Cl… VlC o -. Cl…l -r r-- rr_rmroOtVOk rx nf nor
rC oCeiCrCiailXCC ri- ClClC Vx lv r Cl r vi Cx V xClCC-llll0 lC lC ll0 C0 r Cri_ ir='CC~_X i_rroCt
00 Vl 00 Cl C _l o Cl x. 00 rl 00 'C Cl Cl 00 00 rl Vl C C xl Cl Cl Cl 'C Cl Cl RC xl r r Cl Cl R ' ll l xl x Cl ClCl. CCl _ -_lC r-…C _ rN_ r r l - -r _ _
00 - 00 Cl rl e C r Cr 6 C 6 e Cl Cl Cl0 Cl Vl 00 Cl 'C Cl el 00 6 rr 4n -R 4 6 v0 Cl 'CrC'CCC CC 0 - CCfx CXrxoXl ooc sxox_...............................ovo oacrrx£o s_f r…lC r… -
Cl ail -- CviCrenClrlClCr-ilxlCen 'CClCri lCl - _ ri l_ x Cl= Cri ClCr Cl0 Cdr
00s0 al _CCl.Cl0CClCClla -ClClClC- ri x r ril- C x°K l 9l lCC x'CC l
Sl - -xlC -xC - Clrv-…__o- Wou o
00 'Cl l 666 E0 C 6 4
l -4 ;- l Cll0 llCCCCC aClClCalrer_° j ioreo R r
Cl -- ri Cl -C - Cl-…- xr r=t SSr ms
Cl vCC . CNC Clrr0x 0ClClC_ l0 00llCCC ClCv,CrCvCllrCv Cv'C CCC
sl .0l' 0000 CllC l'C 'C ll4 l Cll0 llllC Cla= Cls=a i '_v
Cl _- _- r Cl -Cl Cl Cl- Cl- - -_
00 0Cl' 'C ClC 'Cll C xl r oCrCvCv ene_ vCl00Cll v CoClCl v CClC riC v olClvriCl xer _lv Cl v0000-r loClenr r r r
el 64 ClC Cm0nCC Cl0eCll 00l -C C ll' rJlC
Cl Cl -- Cl Cl Cl -Cl ClC Cl- l' -.- O E o

a~~~~~~~~ a, a '< a7 a oS^w0 voDs tC -<o >w_ > IO _I. w O_
i _ _ ___ ___ _ 1> _ 9 _
O a C CC O- O -> S 0 l0 v2 W{ DOOOW\
> ~ ~ ~ ~ N -W -W NJ X- 0 C oX-s k_W_h...
-W W -_ - -X W -XJ -- 'a, f > D1 O _ J- <X
°s fa9>9 __ xw9xsv o F = - 1- -w x __ o o ^ 3 2 t oe xs <oo _ : < v Sv > c o > <w s ss tn ou cr oo u <s 4 _Law '
°' 00 2'O La 4..0 NJ w0 oJ NJ <L 0 - 0 4 00 0 4 , 0 ' w L c w0 _ _Lxxa
g~~~~~N La C 4. La Lta oo4 NJ u _4 0 0 N Jw> xw0ow a-4 Jx J -… w ' -- I '04
20 J. N O J % - 4 4 a % , m OoW O _ 0 - a _ _ ° F ' o A = NJW NJO__ 1% _ 1}9 D>D
9 sXov oX|WbXXC
r~~~~~~~ - - - ': C_ 09 0__W<k 8__S..... 0a 00WX
a o i x w oo . Noy 0 0 -a Jo L C - a0 a x J 40 0o-' 0 w_o o NJ'0 -N L NJ L o....a° 4xff ov
00 -4 NJ x'0xx f ...........vxwx=|g_D ow.|xwowoowx
50N rJ 4oPw. . NJ 0 ' C, N 0 4. 4. 00 J0NJ JN La a-N .4.'4.04......... ae xo nxi x_ > 4.La1 -J o
5 r , - x _ NJ xJ x J N NJN - -ooL iS> ......... =|g_9xoxSh. s>
4.00N 4.4 0 N JL L0 XOLA-D__IXVJO> 00 - 0 J 4N JNJ_ '0a% 004._W 0 -- a-J NJ-' - Ci 0s
-N = - NJ g NJ = - NJ oN ~ N x-N -s '0 x x < o w w ww .......
'0NJ Sxxo v NJ NJLax NJ _ 0w L -4 C' 4. ) _ 0v LaN J4_ <<...... ...-No L A 4 0 0 w _ JN
I = -_J 0 N0 4 1 C.0 XX NJDO NOWJ 41 .0 0_NXXJ O O _ NJ.4.00............. I Ja- - XA XW0
ri-c uo D>_>0 XN -D - .J . .N . .. .- O ...... 4'- NJ @°<
1 t x~~~~~~~~~~~~~~ NJ - O O N '.0 wx 00 0 _=O O= t1 1 x w....I1w_O.Iw __a. . N JN 4.0 NJ 00 e -4 x x La 00 a La '- 00JJNL o 0 03 0C 4N 0 .4L wL N . -4ow b 1>- s_
_sL0 aN L _ 40 _0 S4'- _N N L N 0J . % N J _JO _C %_N J 00 _ I __
w~~~~~~~~~~~~~~~~~~~~~~N xJ '0
o~xxox_ l_xs r >w. >
O ~ ~ ~ ~ ~ ~ ~ ~ 0001N00-LNNO _I0L X 4._ O4OLWXOao£s z_WW e<Ss oS <£i
s-0 t .iNJ oiD_XWo - XDo _ i - NJ _l X -o o - oJ o
> 0_ 3' N N 0 " N Js° =00x Ss% 0 -_4c J = _ A-g 04_ _NJ00w00o =--41JNJ-xa o0 0 4NJ 00 _wx9
rr3- x o.La 0% La La _ 4 c J NJ -. '04 NJ _4 NJ4 x0 J- N N w0 0 ON N La 00 NJ _04 XNJo9 x s \o S Ft - o S £ b1 o 9<
a,0 sW_SWW^ 0Oor D_zO>rsON Z-- ooI l_xSo aL ~ °… -…NJ.1 NJ NJ NJ NJ NJ -NJ '0Nwo __s )oosw 4vx<ww>o~owti o>V XWWWgW@-
'0S ,. .J NJ '0 '0 h0 ' [email protected] L O 0,. 0 w 4.-0 ' 0 N L - 0 ,J- 0 4.NJJ.o xx . .w AX
5 3--X . -4X NJ -4 0 . .0 0 4 NJ 0-4_ _ 0- J000 W o Ja 0 = _ g 00 0N JLa00_0W 4 .- J-=
3- -…-NJ h e ' o . . . x s < . A lo ,W O -~ OJN NlN NJ NJN,J'*W0 e i.o o
S r 0_JIJ _00 '0W _ _ mlS __ s _4 NJ 00 '0 '0 00 _ 1a0'0 0 a..J0 , J a4 _. -4 00'_ _ _C3 9 4 - NJ 0% 00 4 NJ -40 -1 as O 0X 4 N JV'C _ N 0 _ - X4 ._O'O X -0 _- ' W0_IW '00
3 0 W S X 8 _1 X .. 0E 0 ( W e i o 1 W N1 A o e toi0 S o i _ m o X -NJNJ NJ NJw x NJN. JO
50 J 00 '0 00 °4 '0 0 0 0 0 S _a 00 N w x =O0,La=-= wO O LaC 0% = S S0 LaN S w J00x % J 00S0
10Y'0x x 4 _ 4NrJ<'0C % _ 00 N00 N 4 J -C -. 4,-60 0 L L N 0 0 -> - X4 Xa -X
4- X0N WJ -- >X '- _ S
r' e -F -xJN -A>OoWOXsOS<g , p NJ -N gN -N -NJ0
o>ws 9<fis D 0 00- -, 0 00 -4 4c La _a 4 00 -0 La NJ 00 0 044 La '0.0 NJ 0 00 J0oN 00 w o u £ v >w < o W w o
00 FNJ'0x>gS> <xsxw NJ__o 000- 0g '0 w s0 a L La a L 4..0 -- N_ wo C '0 4F NJ4.tJC'No 04
O - W0 J 4r yswwOwxcxSos_oxb_s f


IFC Discussion Papers (continued)
No. 21 Radical Reform in the Automotive Industry: Policies in Emerging Markets. PeterO'Brien and Yannis Karmokolias
No. 22 Debt or Equity? How Firms in Developing Countries Choose. Jack Glen and Brian Pinto
No. 23 Financing Private Infrastructure Projects: Emerging Trends from IFCs Experience.Gary Bond and Laurence Carter
No. 24 An Introduction to the Microstructure of Emerging Markets. Jack Glen
No. 25 Trends in Private Investment in Developing Countries 1995: Statistics for 1980-93.Jack D. Glen and Mariusz A. Sumlinski
No. 26 Dividend Policy and Behavior in Emerging Markets: To Pay or Not to Pay. Jack D. Glen,Yannis Karmokolias, Robert R. Miller, and Sanjay Shah
No. 27 Intellectual Property Protection, Direct Investment, and Technology Transfer:Germany, Japan, and the United States. Edwin Mansfield
No. 28 Trends in Private Investment in Developing Countries: Statistics for 1970-94.Frederick Z. Jaspersen, Anthony H. Aylward, and Mariusz A. Sumlinski
No. 29 International Joint Ventures in Developing Countries: Happy Marriages? Robert R.Miller, Jack D. Glen, Frederick Z. Jaspersen, and Yannis Karmokolias
No. 30 Cost Benefit Analysis of Private Sector Environmental Investments: A Case Study of theKunda Cement Factory. Yannis Karmokolias
No. 31 Trends in Private Investment in Developing Countries: Statistics for 1970-95.Lawrence Bouton and Mariusz A. Sumlinski
No. 32 The Business of Education: A Look at Kenya's Private Education Sector. YannisKarmokolias and Jacob van Lutsenburg Maas
No. 33 How Businesses See Government: Responses from Private Sector Surveys in 69Countries. Aymo Brunetti, Gregory Kisunko, and Beatrice Weder
No. 34 Trends in Private Investment in Developing Countries: Statistics for 1970-96. Jack D.Glen and Mariusz A. Sumlinski
No. 35 Corporations' Use of the Internet in Developing Countries. John A. Daly and Robert R.Miller
No. 36 Trends in Venture Capital Finance in Developing Countries. Anthony Aylward
No. 37 Trends in Private Investment in Developing Countries: Statistics for 1970-97. Guy P.Pfeffermann, Gregory V. Kisunko, and Mariusz A. Sumlinski
No. 38 Time to Rethink Privatization in Transition Economies? John Nellis
No. 39 Primary Securities Markets: Cross Country Findings. Anthony Aylward and Jack Glen
No. 40 A Market-Oriented Strategy for Small and Medium Scale Enterprises. Kristin Hallberg

IFCINTERNATIONALFINANCECORPORATION
Headquarters1818 H Street, N.W.Washington, D.C. 20433 U.S.A.
Telephone: (202) 477-1234Telex: RCA 248423
TRT 197688Facsimile: (202) 477-6391Internet: wwwworldbank.orgE-mail: [email protected]
London 4 MillbankLondon SWlP 3JA
Telephone: (71) 222-7711Telex: 919462Facsimile: (71) 976-8323
Paris66, avenue d'Iena75116 Paris, France
Telephone: (1) 40.69.30.00Telex: 640651Facsimile: (1) 47.20.77.71
Tokyo a10th Floor Fukoku Seimei Bldg.2-2-2 Uchisaiwai-choChiyoda-kuTokya 100-0011, Japan
Telephone: (813) 3597-6650Telex: 26838Facsimile: (813) 3597-6695
9 780821 347850
ISBN 0-8213-4785-3 l