Embed Size (px)
Citation preview

DISCUSSION PAPER
Trends in PrivateInvestment in Developing
Countries 1995
Statistics for 1980-93
Jack D. GlenMariusz A. Sumlinski
INTERNATIONALFINANCE
CORPORATION
Pub
lic D
iscl
osur
e A
utho
rized
Pub
lic D
iscl
osur
e A
utho
rized
Pub
lic D
iscl
osur
e A
utho
rized
Pub
lic D
iscl
osur
e A
utho
rized

IFC Discussion Papers
No. I Private Business in Developing Countries: Improved Prospects. Guy P. Pfeffermann
No. 2 Debt-Equity Swaps and Foreign Direct Investment in Latin America. Joel Bergsmanand Wayne Edisis
No. 3 Prospects for the Business Sector in Developing Countries. Economics Department, IFC
No. 4 Strengthening Health Services in Developing Countries through the Private Sector.Charles C. Griffin
No. 5 The Development Contribution of IFC Operations. Economics Department, IFC
No. 6 Trends in Private Investment in Thirty Developing Countries. Guy P. Pfeffermannand Andrea Madarassy
No. 7 Automotive Industry Trends and Prospects for Investment in Developing Countries.Yannis Karmokolias
No. 8 Exporting to Industrial Countries: Prospectsfor Businesses in Developing Countries.Economics Department, [FC
No. 9 AfricanEntrepreneurs-Pioneers ofDevelopment. Keith Marsden
No. 10 Privatizing Telecommunications Systems: Business Opportunities in Developing Countries.William W. Ambrose, Paul R Hennemeyer, andJean-Paul Chapon
No. 11 Trends in Private Investment in Developing Countries, 1990-91 edition. Guy P. Pfeffermannand Andrea Madarassy
No. 12 Financing Corporate Growth in the Deueloping World. Economics Department, IFC
No. 13 Venture Capital: Lessonsfrom the Developed Worldfor the Developing Markets. Silvia B. Sagari withGabriela Guidotti
No. 14 Trends in Private Investment in Deueloping Countries, 1992 edition. Guy P. Pfeffermannand Andrea Madarassy
No. 15 Private SectorElectricity in Developing Countries: Supply and Demand.Jack D. Glen
No. 16 Trends in Private Investment in Developing Countries 1993: Statistics for 1970-91.Guy P. Pfeffermann and Andrea Madarassy
No. 17 How Firms in Developing Countries Manage Risk. Jack D. Glen
No. 18 Coping with Capitalism: The New Polish Entrepreneurs. Bohdan Wyznikiewicz, Brian Pinto,and Maciej Grabowski
No. 19 Intellectual Property Protection, Foreign Direct Investment, and Technology Transfer.Edwin Mansfield
No. 20 Trends in Private Investment in Developing Countries 1994: Statistics for 1970-92. Robert Millerand Mariusz Sumlinski
No. 21 Radical Reform in the Automotive Industry: Policies in Emerging Markets. Peter O'Brienand Yannis Karmokolias
No. 22 Debt orEquity? HowFirmns in Developing Countries Choose.Jack Glen and Brian Pinto
No. 23 FinancingPrivate Infrastructure Projects: Emerging Trends from IFC'sExperience. Gary Bondand Laurence Carter
No. 24 An Introduction to the Microstructure ofnEmerging Markets. Jack Glen
INTERNATIONALFINANCECORPORATION
DISCUSSION PAPER NUMBER 25
Trends in PrivateInvestment in Developing
Countries 1995
Statistics for 1980-93
Jack D. GlenMariusz A. Sumlinski
The World BankWashington, D.C.
Copyright © 1995The World Bank and
International Finance Corporation1818 H Street, N.W.Washington, D.C. 20433, U.S.A.
All rights reservedManufactured in the United States of AmericaFirst printing February 1995
The International Finance Corporation (IFC), an affiliate of the World Bank, promotes the economicdevelopment of its member countries through investment in the private sector. It is the world's largestmultilateral organization providing financial assistance directly in the form of loan and equity to privateenterprises in developing countries.
To present the results of research with the least possible delay, the typescript of this paper has not beenprepared in accordance with the procedures appropriate to formal printed texts, and the IFC and the WorldBank accept no responsibility for errors. The findings, interpretations, and conclusions expressed in thispaper are entirely those of the authors and should not be attributed in any manner to the IFC or the WorldBank or to members of their Board of Executive Directors or the countries they represent. The World Bankdoes not guarantee the accuracy of the data included in this publication and accepts no responsibilitywhatsoever for any consequence of their use. Some sources cited in this paper may be informal documentsthat are not readily available.
The material in this publication is copyrighted. Requests for permission to reproduce portions of it should besent to Director, Economics Department, IFC, at the address shown in the copyright notice above. The IFCencourages dissemination of its work and will normally give permission promptly and, when the reproductionis for noncommercial purposes, without asking a fee. Permission to copy portions for classroom use is grantedthrough the Copyright Clearance Center, Inc., Suite 910, 222 Rosewood Drive, Danvers, Massachusetts 01923,U.S.A.
The complete backlist of publications from the World Bank, including those of the IFC, is shown in theannual Index of Publications, which contains an alphabetical title list (with full ordering information) andindexes of subjects, authors, and countries and regions. The latest edition is available free of charge from theDistribution Unit, Office of the Publisher, The World Bank, 1818 H Street, N.W., Washington, D.C. 20433,U.S.A., or from Publications, The World Bank, 66, avenue d'lna, 75116 Paris, France.
ISSN (IFC Discussion Papers): 1012-8069ISSN (Trends in Private Investment in Developing Countnes): 1018-208XISBN 0-8213-3183-3
Jack D. Glen is a senior economist and Mariusz A. Sumlinski is a research analyst in the EconomicsDepartment of the IFC.
The first edition in this serial publication was cataloged by the Library of Congress as follows:
Library of Congress Cataloging-in-Publication Data
Pfeffermann, Guy Pierre.Trends in private investment in thirty developing countries / Guy
Pfeffermann, Andrea Madarassy.p. cm.-(Discussion paper / International Finance
Corporation; no. 6)Includes bibliographical references.ISBN 0-8213-1352-51. Investments-Developing countries. 1. Madarassy, Andrea,1964- . II. Title. III. Series: Discussion paper (InternationalFinance Corporation); no. 6.HG5993.P48 1989332.6'7314'091724-dc2O 89-22588
CIP

Foreword
The sixth edition of 7rends in Private Investment in Developing Countries provides private andpublic investment data through 1993. This year's edition focuses on foreign sources of financing,i.e. foreign direct investment, international debt issues, new equity capital, international banklending and portfolio equity flows.
Guy P. PfeffermannDirector, Economics Department andEconomic Adviser of the Corporation
iii


Contents
1. Salient Points ............................................. 1
2. Foreign Sources of Capital for Private Investment ....................... 3
Foreign Direct Investment ...................................... 3Other Foreign Sources of Capital .......... ...................... 4Overview ........................................... 5
Notes.6
Appendix 1: Methods and Sources .......... ........................ 7
Appendix 2: Tables ........................................... 9
Table 1: Investment as a Share of GDP ........................... 10Table 2: Gross Domestic Product (Local Currency) .................... 15Table 3: Private Investment as a Share of Total Investment ............... 19Table 4a: Private Investment - Simple Averages ...................... 21Table 4b: Private Investment - Weighted Averages ..................... 21Table 5a: Public Investment - Simple Averages ....................... 22Table 5b: Public Investment - Weighted Averages ..................... 22
Appendix 3: Graphs . ........................................ 23
Sub-Saharan Africa ......................................... 25Latin America and the Caribbean ............................... 29Europe, the Middle East, and North Africa ......................... 33East Asia ............................................. 35South Asia ............................................. 37
v


I
Salient Points
Private investment in developing average developing country. Averagescountries continued its upward trend in weighted by GDP, on the other hand, place1993, reflecting stronger economic growth greater emphasis on the economically largerrates globally and confidence in the renewed countries. Evidently, private investment isemphasis placed on the private sector by stronger in the larger economies than in themany developing country governments. smaller ones; public investment, in contrast,Public investment, in contrast, continued its is marginally lower.decade-long decline reaching levels remini-scent of the early 1970s. Weighted by the * East Asia continued to maintain therespective GDP of each country, the declinein public investment has been offset almost Fig. 2. Public investment share in GDPexactly by the increase in private invest-ment. Evidently, the transfer of much %public investment to the private sector, for [5[I.simpleaveege t Weightedaverge
example through privatization of state-ownedenterprises and infrastructure, has not yet ,0been translated into overall higher levels ofinvestment globally. 5
Figures 1 and 2 provide informnation 1r 1982
on long-term trends in private and public 1970197 1974 19761978 198019821984 1986 19881990I9
investment as a percentage of GDP.' In
Fig.1. Private investment share in GDP highest levels of private investment (18.8%),although this rate declined (on average) for
% the second year in a row. Notable among-5 Simple aver.ge o Weighed averagel countries in the region are Thailand (3 1 .0%)
-- .2 e ° ,_ - , and the Republic of Korea (26.1%), both of10 r *- "'_'t' which experienced marginally lower private
investment rates compared with 1992.2
* Latin America produced the second highest0 7 1 1 1 l rates of private investment (13.9%), rat.1970 1972 1974 1976 1978 1980 1982 1984 1986 1988 19901 that increased for the second consecutive
year. Chile (21.8%) and Panama (20.6%)were the leaders in the region; both
both graphs, simple averages provide a experienced significant increases in theirnotion of what has been happening in the rates of investment in 1993.
1

* Europe, the Middle East, and North Africa * Public investment remained highest in thecontinued to increase private investment countries of Europe, the Middle East, andrates, attaining a level in 1993 unsurpassed North Africa. Even in that region, however,in the period for which data are available. public investment rates have declinedThe increase reflects substantial recoveries relative to the rates achieved in the 1980s.in Turkey and Egypt, and further increases Morocco and Tunisia achieved the highestin Iran over previous years. rates of public investment in the region.
Public investment rates have increased in*Sub-Saharan Africa continues as the region four of the last five years in East Asia,with the lowest rate of private investment, a including 1993. Notable in the region forrate that has declined in each of the last their high rates of public investment werethree years. The leader in the region Korea, Malaysia, and Indonesia. Africacontinues to be Mauritius (20.4%), which maintained its rate of public investmentincreased its investment rate in 1993. In nearly constant over the last decade.contrast, most countries in the region, Nigeria remains the leader in the region,including the two largest economies, Nigeria largely owing to its state-owned petroleumand South Africa, experienced declines in industry. South Asian public investmenttheir already low rates of private investment. rates continued their decline for the seventh
year in a row. Pakistan is notable for its* The ratio of private to public investment, rate of investment above the regionalwhich measures the relative importance of average. Latin America remained the regionthe two types of investment, increased with overall the lowest rate of publicglobally from an average of 1.7 in the 1980s investment, a position maintained throughoutto 2.2 in the first four years of the current the sample period. The rate of publicdecade, a fact which illustrates the investment in that region has been roughlyincreasing importance globally of the private constant since 1984. Venezuela, with itssector. That shift is particularly notable in large state-owned petroleum industry,several countries, including Argentina, remains well above the regional average,where the ratio more than doubled from 2.8 accompanied by Colombia, which isto 6.2; Thailand, which experienced a near developing newly-found oil reserves, and the50 percent increase in the ratio from 3.1 to Dominican Republic.4.5; and Sri Lanka, where the ratio climbedfrom the low level of 0.9 to 2.0.
2

2Foreign Sources of Capital for Private Investment
Even though the bulk of privateinvestment continues to be financed bydomestic savings, access to foreign sources Figure 3. International Sources of Capital.of capital is playing an increasinglyimportant role for the private sector in 120 U.S. S (Wona)
developing countries. The emphasis in this MFDI
year's edition is on foreign sources of 10 kPofolo Flw.
finance. After the isolation experienced SO .UD.during the years following the debt crisis, sothe private sector in many developing 40
countries now has access not only to 20
renewed international bank lending and 0international debt markets, but also to Note: Data pr"nted indud. ony thse ountess covered In telA 1 -3
international equity markets as sources ofnew investment capital. This section looksat foreign direct investment (FDI) and at therole that international investors played in As in all recent years, East Asiafinancing private investment in developing followed as the second largest recipient ofcountries through their participation in FDI, representing 30 percent of the total,domestic and foreign debt and equity but down by nearly 10 percent from themarkets. The discussion centers around the previous year. Within East Asia, Malaysiadata on these sources presented in Table 3. remains the largest recipient, followed by
Indonesia.'Foreign Direct Investment
In the Sub-Saharan African countriesFDI in the developing countries for which data are available, FDI grew more
included in Figure 3 declined marginally in rapidly in 1993 than did that of any other1993 from its 1992 level following region, giving the region nearly 3 percent ofsubstantial increases in each of the previous the global total. That increase, however,two years. Still, new FDI into developing still leaves the region below the levels itcountries reached a level five times that of received in both 1990 and 1989.1987, itself up from the levels of the mid1980s. South Asian FDI grew in 1993 by
more than 40 percent, mostly because of aOnce again, Latin America was by rapid expansion of investment in India, the
far the largest recipient of FDI in 1993, and largest country in the region. Preliminaryaccounted for about half of all FDI received figures for India indicate that FDI increasedin each of the last three years. Unlike most by 75 percent over 1992. European FDIother regions, FDI into Latin America also picked up (22%), while Middle Easternincreased marginally in 1993. Within the FDI fell be 28%.region, Argentina received the most FDI,followed by Mexico.
3
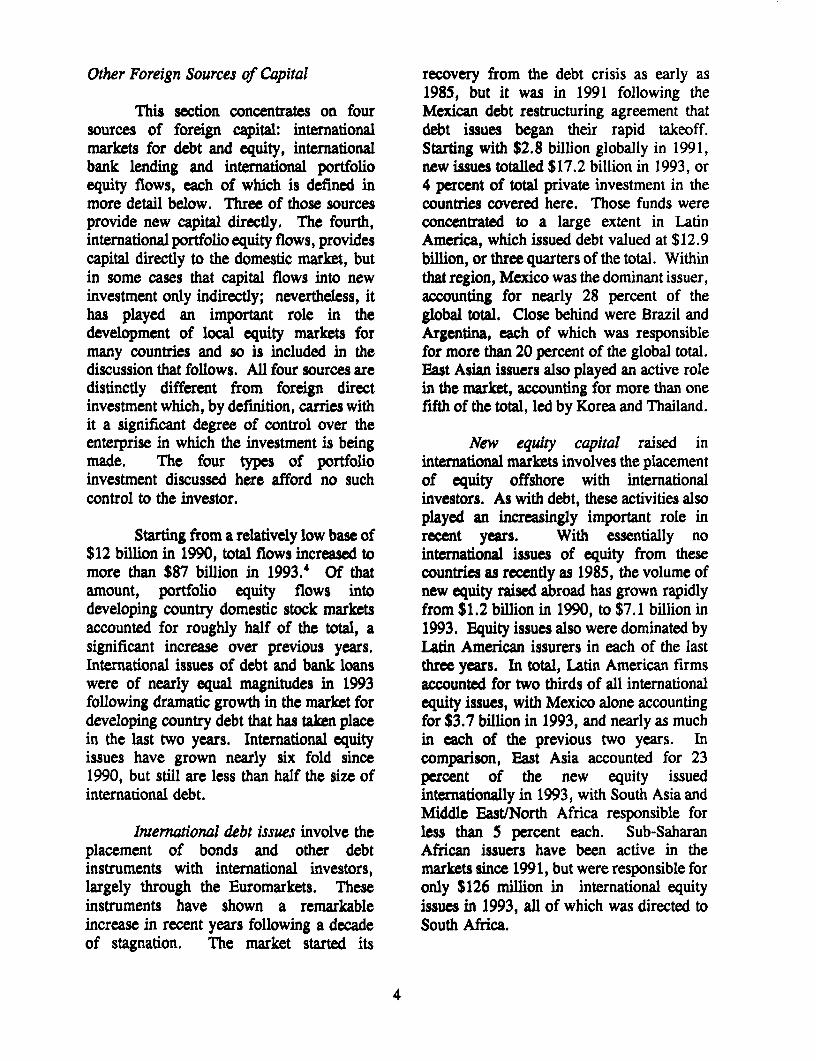
Other Foreign Sources of Capital recovery from the debt crisis as early as1985, but it was in 1991 following the
This section concentrates on four Mexican debt restructuring agreement thatsources of foreign capital: international debt issues began their rapid takeoff.markets for debt and equity, international Starting with $2.8 billion globally in 1991,bank lending and international portfolio new issues totalled $17.2 billion in 1993, orequity flows, each of which is defined in 4 percent of total private investment in themore detail below. Three of those sources countries covered here. Those funds wereprovide new capital directly. The fourth, concentrated to a large extent in Latininternational portfolio equity flows, provides America, which issued debt valued at $12.9capital directly to the domestic market, but billion, or three quarters of the total. Withinin some cases that capital flows into new that region, Mexico was the dominant issuer,investment only indirectly; nevertheless, it accounting for nearly 28 percent of thehas played an important role in the global total. Close behind were Brazil anddevelopment of local equity markets for Argentina, each of which was responsiblemany countries and so is included in the for more than 20 percent of the global total.discussion that follows. All four sources are East Asian issuers also played an active roledistinctly different from foreign direct in the market, accounting for more than oneinvestment which, by definition, carries with fifth of the total, led by Korea and Thailand.it a significant degree of control over theenterprise in which the investment is being New equity capital raised inmade. The four types of portfolio international markets involves the placementinvestment discussed here afford no such of equity offshore with internationalcontrol to the investor. investors. As with debt, these activities also
played an increasingly important role inStarting from a relatively low base of recent years. With essentially no
$12 billion in 1990, total flows increased to international issues of equity from thesemore than $87 billion in 1993.' Of that countries as reently as 1985, the volume ofamount, portfolio equity flows into new equity raised abroad has grown rapidlydeveloping country domestic stock markets from $1.2 billion in 1990, to $7.1 billion inaccounted for roughly half of the total, a 1993. Equity issues also were dominated bysignificant increase over previous years. Latin American issurers in each of the lastInternational issues of debt and bank loans three years. In total, Latin American firmswere of nearly equal magnitudes in 1993 accounted for two thirds of all internationalfollowing dramatic growth in the market for equity issues, with Mexico alone accountingdeveloping country debt that has taken place for $3.7 billion in 1993, and nearly as muchin the last two years. International equity in each of the previous two years. Inissues have grown nearly six fold since comparison, East Asia accounted for 231990, but still are less than half the size of percent of the new equity issuedinternational debt. internationally in 1993, with South Asia and
Middle East/North Africa responsible forInternational debt issues involve the less than 5 percent each. Sub-Saharan
placement of bonds and other debt African issuers have been active in theinstruments with international investors, markets since 1991, but were responsible forlargely through the Euromarkets. These only $126 million in international equityinstruments have shown a remarkable issues in 1993, all of which was directed toincrease in recent years following a decade South Africa.of stagnation. The market started its
4
Net international bank lending has Overviewstrengthened remarkably in the last fouryears. Starting at a level of $9.3 billion in Foreign sources of capital have1990, lending dipped slightly in 1991, but increased not only in absolute value, but alsorebounded sharply and reached $19.7 billion relative to the total value of privatein 1993. Once again, Latin American investment. International debt and equityborrowers lead the pack, absorbing just over issues represented nearly 6 percent of allfifty percent of the total in each of the last private investment in 1993 for the countriestwo years. Although Mexico was a major covered, up from less than one percent inborrower in 1992, it reduced its borrowing 1990. While one should not compare thesubstantially in 1993 and Brazil was by far other foreign sources of capital to totalthe major international borrower in that private investment owing to the governmentyear, accounting for 29 percent of the global and state-owned enterprise participation intotal. Argentina and Chile were also major those flows, indications are that theirborrowers. As with the other financial importance increased in a similar fashion.markets, the East Asian countries were alsosignificant players, absorbing more than one International sources of capital havefourth of total international bank lending, led become an important part of privateby Indonesia and Korea. In the Middle investment in developing countries in recentEast, Turkey was the only major borrower, years. The growth in portfolio equitybut it was responsible for $2.5 billion in investment is particularly noteworthy1993. In South Asian, only India played an because it indicates the willingness ofimportant role in the market, and there were international investors to assume the risksno major Sub-Saharan borrowers. and rewards associated with developing
country investment. Undoubtedly, theInternational portfolio equity flows upward trend witnessed in recent years will
represent equity investments by international not continue uninterrupted, as events ininvestors in equity traded in the issuing Mexico have illustrated. In fact, prelim-firm's domestic equity markets. To the inary estimates for 1994 suggest thatextent that capital flows to existing portfolio equity flows to developing coun-shareholders through purchases of existing tries declined by 16 percent from their 1993shares rather than to firms, its impact on the levels; the shapest drop was in Latinamount of capital available to firms for America which may fallen by 59 percent.investment is only indirect. Regardless, it Still, 1994 international issues of debt andhas played an increasingly important role in equity increased globally by 40 and 70many developing countries in recent years. percent, respectively, over the 1993 figures
and international bank lending also is esti-Starting from very low levels in mated to have increased by nearly a third in
1990, portfolio investment now represents 1994.nearly 40 percent of the five sources ofcapital presented in Figure 3. Importantly,the increased domestic equity market activityassociated with this portfolio investment hasplayed a key role in inducing developingcountry firms to raise public capital, bothdomestically and abroad.
5

Notes
Chapter 1
1. This edition contains investment data for the years 1980-93. For data on the period 1970-79, readers are referred to the previous edition by Robert Miller and Mariusz Sumlinski, Trendsin Private Investment in Developing Countries 1994: Statistics for 1970-92. IFC DiscussionPaper 20, International Finance Corporation.
2. South Asian figures are dominated by India, where 1993 data are not yet available.Regional trends, therefore, are not discussed here.
Chapter 2
3. China received more FDI than any other developing country, but is not included in theuniverse of countries in this edition owing to the difficulties involved with differentiating betweenprivate and public investment there. Singapore and Hong Kong also received substantial amountsof FDI, but are not classified as developing countries.
4a. The totals for each year reflect the four international flow sources defined in the textwhich were directed to the countries covered in this edition of Trends in Private Investment inDeveloping Countries. International debt and equity issues include only flows directed to theprivate sector; the other sources include flows to the private sector, but can also contain flowsdirected to either governments or state-owned enterprises.
6

Appendix IMethods and Sources
National accounts normally do not which the relevant data are available. Sincebreak down gross domestic investment into the previous edition, the following changesits private and public sector components. have been made. Cameroon and TanzaniaPrivate investment is defined in this paper as have been dropped for lack of reliable data.the difference between total gross domestic Namibia and Panama have been added. Mi-investment (from national accounts) and nor changes were made in the last two orconsolidated public investment. Consolida- three years for most countries as a result ofted public investment data for each country revisions in their national accounts data.were found mainly in World Bank Country Updates are not available through 1993 forEconomic Memoranda, Public Investment Ecuador and India.Review, Public Expenditure Reviews, andother World Bank country reports. They These tables present the investmentreflect efforts by World Bank missions to figures in terms of five ratios for eachcompile public sector data. Where World country. Three ratios are shown as percent-Bank data are not available, country data ages of GDP -- gross domestic investmentwere used. (GDI/GDP); private investment (Private
I/GDP); and public investment (PublicAmong the data problems inherent in I/GDP). Appendix 2, Table 1 provides the
this method, the following can be readily ratios and Table 2 the corresponding GDPidentified: figures. Two ratios are expressed as
percentages of gross domestic investment --* The emphasis is on fixed capital for- private investment (Private I/GDI); andmation; wherever possible financial invest- public investment (Public I/GDI). For thesement has been excluded. It is not always ratios, see Appendix 2, Table 3. The ratiosclear from the data, however, whether or are computed using local currency units atnot financial investment is included under current prices, except for Bolivia. For thisconsolidated public investment in a partic- country, constant price ratios are used inular country. order to correct for the effect of past high
inflation.* Changes in inventories are a part ofthe residual private investment in some Weighted averages are calculatedcountries but not in others. Where changes using country GDPs (in U.S. dollars) for in-in inventories are excluded, the total invest- cluded countries in each year as weights.ment figure used is gross domestic fixed These are presented as regional aggregatesinvestment. in Tables 4 and 5 in Appendix 2 for
respectively private and public sectorThe countries included in this edition together with simple averages.
represent all the developing countries for
7


Appendix 2Tables

Table 1. Investment as share of GDP (in %).
Country 1980 1981 1982 1983 1984 1985 1986 1987 1988 1989 1990 1991 1992 1993
Argentina GDFIGDP 25.2 22.6 19.9 20.3 19.2 18.0 17.4 18.9 18.6 15.5 14.0 14.6 16.7 18.4
Private I/GDP 19.1 16.9 14.7 14.3 14.2 13.2 13.4 12.7 13.3 11.6 11.0 12.5 14.8 16.2
Public IIGDP 6.1 5.8 5.2 6.1 5.0 4.8 4.1 6.2 5.3 3.9 3.0 2.1 1.9 2.2
Bangladesh GDIIGDP 15.3 16.2 15.5 13.4 12.3 12.9 12.5 12.9 12.4 12.9 12.8 11.5 12.1 13.3
Private IIGDP 8.2 9.6 9.1 7.2 6.6 7.4 6.3 6.2 6.4 6.5 6.4 5.8 6.6 7.3
Public IGDP 7.1 6.7 6.4 6.2 5.6 5.6 6.3 6.7 6.0 6.4 6.4 5.7 5.5 6.0
Belize GDFIVGDP 22.7 24.8 22.5 18.9 20.3 17.4 17.4 21.5 25.7 27.4 26.2 28.6 29.1 31.3
Private VIGDP 11.1 13.5 9.8 8.5 11.8 8.7 8.4 13.8 16.1 14.3 11.1 7.0 7.3 12.7
Public IIC1DP 11.5 11.3 12.7 10.4 8.6 8.7 9.0 7.7 9.5 13.1 15.1 21.6 21.9 18.6
Bolivia GDFIVGDP 14.3 11.5 11.4 7.0 6.0 4.5 4.9 5.3 5.9 5.6 5.8 6.2 6.9 6.5
Private I/GDP 7.4 4.0 5.7 2.9 2.8 2.3 2.4 2.1 2.0 1.9 1.9 2.1 2.2 2.4
Public /GDP 7.0 7.5 5.7 4.1 3.2 2.2 2.5 3.2 3.9 3.7 3.9 4.1 4.7 4.2
Brazil I) GDFJ/GDP 23.6 24.3 23.0 19.9 18.9 18.0 20.0 23.2 24.3 26.9 22.9 19.6 19.6 20.4
Private /GDP 17.0 16.6 16.0 13.8 13.7 12.9 14.4 16.8 17.9 21.1 17.6 14.4 13.9 15.5
Public I/GDP 6.6 7.7 7.0 6.1 5.2 5.1 5.6 6.4 6.4 5.8 5.3 5.2 5.7 4.9
Chile GDFVIGDP *) 21.0 22.7 11.3 9.8 13.6 17.7 17.1 19.6 20.8 23.5 23.1 21.1 23.9 26.5
Private I/GDP 15.6 17.5 6.5 5.0 7.3 14.8 13.6 13.2 14.7 18.6 19.3 17.0 19.3 21.8
Public I/GDP 5.4 5.2 4.8 4.9 6.4 2.9 3.5 6.4 6.1 4.9 3.8 4.1 4.6 4.7
Colombia GDV/GDP 16.8 17.7 17.5 17.2 17.0 17.5 17.7 17.4 19.5 18.1 16.6 14.2 15.5 18.7
Private }IGDP 9.8 10.3 9.8 7.1 8.2 9.2 11.1 11.1 12.7 11.1 10.2 7.7 8.5 10.1
Public l/GDP 7.0 7.4 7.7 10.1 8.8 8.3 6.7 6.3 6.8 7.0 6.4 6.5 7.0 8.6
Costa Rica GDFI/GDP 23.9 24.1 20.3 18.0 20.0 19.3 18.7 19.8 18.9 20.5 22.4 19.7 20.8 22.1
Private I/GDP 14.7 15.2 13.1 11.6 13.7 12.3 12.8 15.4 14.8 16.0 17.7 15.5 16.7 17.8
Pmblic .l/GDP 9.2 8.9 7.2 6.4 6.4 7.0 5.8 4.4 4.1 4.5 4.7 4.2 4.1 4.3
Cote d'Ivoire GDFZGDP 24.4 24.4 21.7 17.7 12.5 11.5 11.9 11.2 11.0 8.3 8.1 7.4 8.0 7.7
Private IIGDP 13.0 13.9 9.5 7.1 4.6 5.5 5.1 4.5 5.0 4.5 3.9 3.5 4.1 3.7
Public I/GDP 11.4 10.5 12.2 10.6 8.0 6.0 6.8 6.7 6.0 3.9 4.2 3.9 3.9 4.0
Dominican Republic GDFI/GDP 23.9 22.8 18.7 20.3 21.0 20.0 19.2 27.8 28.6 27.1 20.5 16.9 21.0 23.1
Private IIGDP 16.3 16.1 14.3 15.6 17.6 14.0 13.9 16.7 20.6 16.5 14.2 10.8 13.9 14.7
Pmbli IIGDP 7.6 6.7 4.4 4.7 3.4 6.0 5.2 11.1 8.1 10.6 6.3 6.1 7.1 8.4
10

Table 1. Investment as share of GDP (in %).
Country 1980 1981 1982 1983 1984 1985 1986 1987 1988 1989 1990 1991 1992 1993
Ecuador GDF1IGDP 23.6 22.3 22.7 16.6 15.4 16.1 18.8 22.7 21.3 20.7 18.4 19.7 19.5
Private I/GDP 14.1 11.7 13.0 8.6 9.0 9.5 9.6 13.4 12.7 11.6 11.8 13.1 12.0
Pubfic I/GDP 9.5 10.6 9.7 8.0 6.4 6.6 9.2 9.3 8.6 9.2 6.7 6.5 7.5
Egypt GDFI/GDP 30.1 28.7 27.5 26.7 23.7 18.0 24.2 23.3 21.9 20.4 18.2 19.6
Private I/GDP 9.1 6.5 5.8 6.1 6.4 6.0 8.7 10.5 9.1 8.7 7.8 11.6
Public IGDP 21.0 22.2 21.7 20.5 17.3 12.0 15.5 12.7 12.8 11.8 10.4 8.0
El Salvador GDFIIGDP 13.6 13.6 12.6 11.6 11.5 12.0 13.1 13.6 12.6 13.3 11.8 13.5 15.7 16.2
Private IIGDP 6.4 6.2 6.5 7.0 7.6 8.7 10.6 10.7 9.5 9.8 9.5 10.9 12.2 12.9
Public I/GDP 7.1 7.3 6.1 4.6 3.9 3.3 2.5 2.9 3.1 3.5 2.3 2.5 3.4 3.3
Fiji GDFI/GDP 25.4 26.6 23.6 20.9 17.1 18.2 14.7 15.6 12.0 12.5 15.7 12.2 11.8 13.5
Private IIGDP 13.7 12.4 10.2 9.8 10.3 12.2 9.9 9.8 6.8 6.2 5.4 5.5 4.9 4.7
Pablicl/GDP 11.7 14.2 13.4 11.1 6.8 6.0 4.8 5.8 5.2 6.3 10.3 6.8 6.9 8.8
Ghana GDFI/GDP 6.9 9.6 9.4 10.4 11.3 13.2 14.4 15.9 12.8 13.9
Private /GDP 4.4 5.4 2.1 2.5 3.3 5.4 7.6 8.1 4.3 4.0
Public I/GDP 2.5 4.2 7.3 7.9 8.0 7.8 6.8 7.7 8.5 9.9
Guatemala GDFI/GDP 16.4 16.8 15.0 10.5 9.6 11.0 10.1 12.4 13.4 13.7 13.0 12.2 15.6 16.2
Privae /GDP 10.5 8.9 8.9 6.6 6.7 8.8 8.1 9.7 10.5 10.6 10.3 10.0 12.6 13.4
Public LIGDP 5.9 7.8 6.1 3.9 2.9 2.1 1.9 2.7 2.9 3.2 2.7 2.2 3.0 2.7
Guinea GDFItGDP 14.9 16.3 17.1 17.2 17.5 16.5 16.5 15.9
Private I/GDP 8.9 8.9 8.9 8.9 8.3 8.6 9.1 9.2
Public I/GDP 6.0 7.4 8.2 8.3 9.2 7.8 7.4 6.7
India GDFI/GDP 19.3 19.7 20.1 19.3 19.7 20.7 21.2 21.7 21.6 22.6 22.8 22.0 21.3
Privae I/GDP 10.7 10.6 9.6 9.4 9.6 10.2 9.8 11.3 11.5 13.0 13.4 12.4 12.5
Public IIGDP 8.6 9.1 10.4 9.9 10.1 10.5 11.4 10.4 10.1 9.7 9.4 9.5 8.8
Indonesia GDFIJGDP 24.2 30.5 25.1 22.5 23.6 24.2 24.9 26.1 27.3 28.4 28.1 27.3 25.9
Private /GDP 13.7 18.2 13.2 12.5 13.5 16.2 17.3 17.7 18.7 19.2 18.5 17.7 16.1
Public IGDP 10.5 12.3 11.9 9.9 10.1 8.0 7.5 8.4 8.6 9.3 9.6 9.5 9.8
Iran GDFI/GDP 21.7 19.1 17.5 21.5 20.9 17.5 15.4 13.3 13.3 13.3 15.5 21.6 22.0 22.0
Private IIGDP 11.4 9.3 7.4 12.0 12.4 10.6 8.6 7.8 7.9 8.2 8.3 13.2 13.0 13.5
Public IIGDP 10.4 9.8 10.0 9.4 8.5 6.9 6.7 5.5 5.4 5.1 7.1 8.5 9.0 8.5
11

Table 1. Investment as share of GDP (in %).
Country 1980 1981 1982 1983 1984 1985 1986 1987 1988 1989 1990 1991 1992 1993
Kenya GDFL/GDP 23.6 23.4 19.0 18.0 18.1 17.9 19.6 19.6 20.1 19.3 20.7 19.3 17.1 15.4
Private I/GDP 12.9 13.0 10.4 11.1 10.5 10.7 11.5 12.5 11.8 11.2 11.0 10.7 9.6 9.1
Public I/GDP 10.7 10.4 8.6 6.9 7.5 7.2 8.1 7.1 8.3 8.1 9.8 8.6 7.6 6.3
Korea GDFI/GDP 32.1 28.0 28.4 29.2 28.9 28.6 28.2 29.1 29.6 31.9 37.1 38.4 36.6 35.5
Private I/GDP 24.3 20.3 21.2 22.7 22.4 21.3 21.3 23.3 24.1 25.9 29.6 29.5 27.3 26.1
Public VIGDP 7.8 7.7 7.2 6.5 6.5 7.3 6.9 5.7 5.5 6.0 7.4 9.0 9.3 9.4
Madagascar GDFI/GDP *) 8.6 8.5 9.0 10.1 13.3 13.4 14.8 10.6 11.3 15.0
Private I/GDP 2.2 2.6 3.6 3.1 6.4 3.7 6.9 4.6 3.7 6.9
Public I/GDP 6.4 6.0 5.4 7.0 6.9 9.7 7.9 5.9 7.6 8.1
Malawi GDFIIGDP 22.2 15.1 14.6 13.7 13.0 13.3 12.0 13.8 15.3 16.7 16.1 16.9 16.1 10.0
Private IIGDP 4.7 4.9 6.1 5.4 3.3 5.0 2.0 5.9 7.2 9.0 8.4 8.8 6.7 2.6
Public I/GDP 17.5 10.2 8.4 8.3 9.8 8.3 10.0 7.9 8.2 7.6 7.8 8.1 9.4 7.4
Malaysia GDFI/GDP 31.1 36.0 36.4 36.1 31.9 29.8 26.4 23.0 24.1 29.3 32.4 35.5 34.5 31.8
Private I/GDP 19.5 19.9 18.2 17.7 16.8 15.8 14.3 13.8 15.4 18.5 20.9 24.1 23.2 20.6
Public I/GDP 11.6 16.1 18.2 18.4 15.1 14.0 12.1 9.1 8.7 10.8 11.5 11.4 11.3 11.2
Mali GDFI/GDP 20.4 21.0 21.3 22.4 23.1 21.9 21.9
Private I/GDP 10.2 11.6 11.7 12.1 10.8 12.2 12.6
Public I/GDP 10.1 9.4 9.6 10.3 12.3 9.7 9.3
Mauritius GDFI/GDP 23.3 22.0 17.9 18.0 18.0 18.7 19.7 21.6 28.7 26.5 31.2 29.0 29.6 29.1
Private I/GDP 14.9 13.5 11.5 11.6 12.3 12.6 12.8 14.3 16.6 19.5 19.7 20.7 19.9 20.4
Public I/GDP 8.4 8.5 6.4 6.4 5.7 6.0 7.0 7.3 12.2 7.1 11.5 X.2 9.7 8.6
Mexico GDFI/GDP 24.8 26.4 23.0 17.5 17.9 19.1 19.5 18.5 20.3 18.2 18.6 19.4 20.8 20.4
Private LIGDP 13.9 14.3 12.8 11.0 11.3 12.5 12.9 12.9 15.2 13.3 13.7 14.9 16.6 16.4
Public I/GDP 10.9 12.1 10.2 6.6 6.6 6.6 6.5 5.6 5.0 4.8 4.9 4.6 4.2 4.0
Morocco GDFI/GDP 22.2 26.0 27.3 24.4 23.1 23.1 21.3 20.2 20.4 22.8 23.9 22.3 23.0 24.1
Private LIGDP 11.8 11.4 13.4 11.8 11.2 12.1 12.2 11.6 11.8 13.2 14.6 13.2 13.4 13.3
Public I/GDP 10.4 14.5 13.9 12.6 11.9 11.0 9.1 8.6 8.7 9.6 9.3 9.1 9.6 10.9
Namibia GDFTJGDP 27.3 26.8 22.7 18.5 15.0 13.3 12.7 14.3 14.7 15.8 16.9 10.4 12.5 10.6
Private J/GDP 11.1 9.5 6.5 5.9 5.6 4.2 5.1 6.3 7.7 9.9 11.0 5.3 5.4 5.1
Public I/GDP 16.2 17.3 16.2 12.5 9.4 9.1 7.6 8.0 7.1 5.9 5.9 5.1 7.1 5.5
12

Table 1. Investment as share of GDP (in %).
Country 1980 1981 1982 1983 1984 1985 1986 1987 1988 1989 1990 1991 1992 1993
Nepal GDFI/GDP 15.8 15.8 17.6 19.5 17.5 20.1 16.9 18.5 17.4 18.4 16.4 18.9 19.6 20.0
Private I/GDP 9.5 9.1 9.6 10.8 9.6 12.4 9.9 11.1 10.3 9.5 8.7 11.7 12.7 13.0
Public IGDP 6.3 6.7 8.0 8.7 8.0 7.8 7.0 7.4 7.1 8.9 7.7 7.2 6.9 6.9
Nigeria GDFI/GDP 22.2 23.3 20.0 14.7 9.5 8.9 14.9 13.7 13.5 14.1 14.5 16.3 16.4 13.6
Privatel/GDP 6.9 6.5 6.1 4.3 2.3 2.0 3.3 3.9 4.0 4.4 6.1 6.0 4.6 0.3
Public I/GDP 15.4 16.8 13.9 10.5 7.2 6.9 11.6 9.8 9.4 9.7 8.4 10.3 11.9 13.3
Pakistan GDFI/GDP 17.1 16.8 17.5 16.5 16.5 17.0 17.5 16.5 17.3 17.3 17.4 18.6 19.1 18.5
Private I/GDP 7.7 7.2 7.6 7.5 7.6 7.8 7.7 7.7 8.3 8.9 8.9 9.8 10.0 9.8
Public LIGDP 9.4 9.6 9.9 9.0 8.9 9.2 9.7 8.8 9.0 8.4 8.5 8.8 9.1 8.7
Panama GDFIIGDP 17.5 8.9 6.9 9.4 16.8 21.1 24.4
Private LIGDP 14.7 6.6 5.2 8.2 13.6 17.4 20.6
Public I/GDP 2.7 2.3 1.7 1.2 3.2 3.7 3.8
Papua New Guinea GDFI/GDP 26.8 33.0 29.7 23.9 18.4 21.0 19.3 23.3 26.0 25.1 28.0 23.8 20.4
Private IIGDP 18.1 26.1 23.6 17.6 12.1 14.5 14.0 18.3 21.2 20.0 23.3 18.6 14.3
Public V/GDP 8.7 6.9 6.1 6.2 6.3 6.4 5.3 5.0 4.7 5.1 4.7 5.2 6.1
Paraguay GDFI/GDP 27.2 27.4 24.0 20.1 21.6 20.7 23.5 23.7 23.1 22.7 22.0 23.7 22.5 21.5
Private VGDP 22.4 22.6 19.5 13.3 13.2 14.2 18.5 17.6 16.3 16.0 16.3 18.1 16.2 16.2
Public I/GDP 4.9 4.8 4.5 6.9 8.4 6.5 5.1 6.1 6.9 6.7 5.7 5.6 6.3 5.2
Peru GDFIIGDP 28.8 29.5 23.7 20.2 18.2 18.5 17.8 19.7 16.6 14.7 14.3 15.3 16.7
Private IIGDP 21.5 20.8 15.1 12.1 12.0 13.2 13.4 15.5 13.1 12.2 11.8 12.4 13.5
Public LIGDP 7.3 8.7 8.7 8.1 6.1 5.4 4.4 4.2 3.5 2.5 2.5 2.9 3.2
Phillipines GDFI/GDP 27.2 27.8 27.5 29.8 24.5 17.5 16.8 16.5 17.8 20.8 23.1 20.0 20.9 23.8
Privale IIGDP 18.8 16.8 20.0 23.7 19.1 13.7 14.0 13.7 14.9 17.3 18.9 15.9 16.0 18.8
Public IIGDP 8.5 10.9 7.5 6.1 5.4 3.7 2.8 2.8 2.9 3.6 4.2 4.1 4.9 5.0
South Africa GDFIIGDP 26.2 27.8 27.9 26.8 24.4 23.3 20.2 18.5 19.8 20.6 19.6 17.8 16.4 15.2
Private IIGDP 13.3 15.5 15.9 15.6 14.6 13.1 11.6 11.2 13.2 13.2 12.9 11.9 11.3 10.8
Public I/GDP 12.9 12.3 12.0 11.2 9.9 10.2 8.6 7.3 6.7 7.4 6.8 5.9 5.1 4.4
Sri Lanka GDFIIGDP 31.3 27.4 29.6 28.5 25.9 23.3 23.2 22.9 22.0 21.2 21.6 22.4 23.2 24.9
Private IIGDP 12.9 12.7 14.2 14.3 12.3 10.5 10.6 10.5 10.7 10.9 13.8 14.1 16.3 17.5
Public I/GDP 18.4 14.7 15.5 14.2 13.6 12.8 12.6 12.4 11.4 10.4 7.8 8.3 6.9 7.4
13

Table 1. Investment as share of GDP (in %).
Country 1980 1981 1982 1983 1984 1985 1986 1987 1988 1989 1990 1991 1992 1993
Thailand GDFI/GDP 27.8 28.0 26.9 28.5 28.6 27.2 25.8 27.6 30.7 34.7 40.3 41.2 39.1 39.3
Private I/GDP 18.9 19.0 19.1 20.5 20.3 18.5 18.4 21.7 25.6 29.6 34.2 34.0 31.2 31.0
Public IIGDP 8.8 8.9 7.9 8.0 8.3 8.7 7.4 6.0 5.0 5.1 6.1 7.2 7.9 8.3
Tunisia GDFI/GDP 28.3 31.0 34.0 31.8 30.8 26.8 24.0 20.3 19.3 20.7 22.7 22.8 22.9 23.8
Private J/GDP 13.3 14.8 15.4 14.2 13.6 12.3 10.5 9.3 9.7 10.7 10.7 11.5 11.8 11.4
Public bIGDP 15.0 16.2 18.6 17.6 17.1 14.5 13.5 11.0 9.6 10.0 12.0 11.3 11.1 12.4
Turkey GDFI/GDP 20.8 20.3 20.0 18.5 18.0 20.2 23.1 24.1 23.9 22.7 22.7 22.8 22.0 22.7
Private l/GDP 9.5 8.1 8.1 8.3 8.3 8.4 9.8 11.2 12.6 12.4 12.8 12.3 12.0 13.4
Public IIGDP 11.3 12.2 11.9 10.2 9.8 11.7 13.3 12.8 11.4 10.3 9.8 10.5 10.0 9.3
Uruguay GDFI/GDP 16.7 15.7 14.6 13.7 10.9 9.6 9.9 11.4 11.9 11.6 10.8 11.9 13.1 14.2
Private lIGDP 11.4 10.7 7.5 8.6 6.4 6.1 6.2 7.4 7.9 7.2 7.7 7.8 9.4 9.8
Public I/GDP 5.3 5.0 7.2 5.1 4.5 3.5 3.7 4.0 4.0 4.3 3.1 4.1 3.7 4.4
Venezuela GDFI/GDP 16.0 17.8 20.4 21.2 22.8 16.9 14.1 17.8 21.1 19.5
Private IIGDP 10.5 11.0 10.9 12.2 12.4 7.9 4.9 8.2 8.9 9.0
Public IIGDP 5.5 6.8 9.5 9.1 10.5 9.0 9.2 9.6 12.2 10.5
umber of countries 35 38 39 39 42 42 43 45 45 45 45 45 45 43
verage Gross Investment/GDP 22.8 23.0 22.2 20.4 18.5 17.9 17.8 18.4 19.1 19.3 19.6 19.6 19.9 20.1
verage Private I/GDP 13.0 13.0 12.3 11.4 10.5 10.4 10.4 11.2 11.9 12.2 12.5 12.4 12.4 12.8
verage Public /GDP 9.8 9.9 9.8 9.0 7.9 7.6 7.4 7.2 7.2 7.1 7.1 7.2 7.4 7.3
Note: Unless otherwise noted the sources are: National Authorities & World Bank/IMF staff estimates. Data for 1993 are preliminary/estimates.*) Chile 1985-1993 GDFI, Madagascar 1984-89 GDI, 1990-93 GDFI.
1) Source: FIBGE e Centro de Estudos de Economia e Govemo/IBRE/FGV.
14

Table 2. Gross Domestic Product(Local currency, billion unless otherwise noted)
Country 1980 1981 1982 1983 1984 1985 1986 1987 1988Argentina 1) 3.84 7.474 21.9 109.5 790.9 5,305.0 9,984.1 23,332.3 111,062.0
Bangladesh 196.1 231.4 259.0 294.2 355.2 406.9 466.2 539.2 597.1Belize 0.4 0.4 0.4 0.4 0.4 0.4 0.5 0.6 0.6Bolivia 2) 122.9 124.1 118.7 113.4 112.7 111.6 108.8 111.7 115.0
Brazil 1) 12.5 24.0 48.7 109.4 347.9 1,307.7 3,502.6 11,104.0 80,783.0Chile 1,075.3 1,273.1 1,239.1 1,557.7 1,893.4 2,316.8 3,045.4 4,156.2 5,433.3
Colombia 1,579.1 1,982.8 2,497.5 3,054.1 3,856.6 4,965.9 6,788.0 8,824.4 11,731.3Costa Rica 41.4 57.1 97.5 129.3 163.0 197.9 246.6 284.5 349.7Cote d'lvoire 2,149.9 2,291.4 2,486.6 2,605.8 2,883.4 3,136.8 3,244.3 3,117.7 3,067.1
Dominican Republic 6.6 7.3 8.0 8.6 10.3 14.0 15.8 19.5 28.4Ecuador 293.3 348.7 415.7 560.3 812.6 1,109.9 1,383.2 1,794.5 3,019.7Egypt 20.8 24.2 28.5 33.1 38.4 45.3 54.6El Salvador 8.9 8.6 9.0 10.2 11.7 14.3 19.8 23.1 27.4Fiji 1.0 1.1 1.1 1.1 1.3 1.3 1.5 1.5 1.6Ghana 270.6 343.0 511.4 746.0 1,051.2Guatemala 7.9 8.6 8.7 9.1 9.5 11.2 15.8 17.7 20.5Guinea 665.3 874.6 1,131.1India 1,360.1 1,597.6 1,781.3 2,075.9 2,313.4 2,622.4 2,929.5 3,332.0 3,965.9Indonesia 58,436.3 62,669.2 77,676.3 89,750.3 96,850.2 102,465.3 124,508.4 141,137.1Iran 6,632.4 8,009.3 10,539.8 13,376.2 14,803.7 15,775.4 16,226.9 19,949.0 22,304.1Kenya 2.6 3.1 3.5 4.0 4.5 5.0 5.9 6.6 7.6Korea 38,041.0 47,482.0 54,443.0 63,833.0 72,664.3 82,062.0 95,736.0 112,130.0 133,134.0Madagascar 1,695.0 1,893.2 2,203.8 2,743.1 3,436.7Malawi 1.0 l.1 1.2 1.4 1.7 2.0 2.2 2.6 3.4Malaysia 53.3 57.6 62.6 69.9 79.6 77.5 71.6 79.6 90.9
Mali 590.5 590.3Mauritius 8.7 10.2 11.7 12.8 14.4 16.6 19.7 23.6 27.8Mexico 4.5 6.1 9.8 17.9 29.5 47.4 79.2 193.3 390.5Morocco 74.1 79.0 92.9 99.1 112.3 129.5 154.7 156.7 182.2
Namibia 1.6 1.7 1.9 2.0 2.2 2.9 3.3 3.5 4.5Nepal 23.4 27.3 3!.0 33.8 39.4 46.6 55.7 63.9 76.9Nigeria 50.9 50.8 52.0 57.1 63.6 72.4 73.1 108.9 145.2
Pakistan 278.2 324.2 364.3 419.8 472.2 514.5 572.5 675.4 769.7Panama 5.4 4.6
15
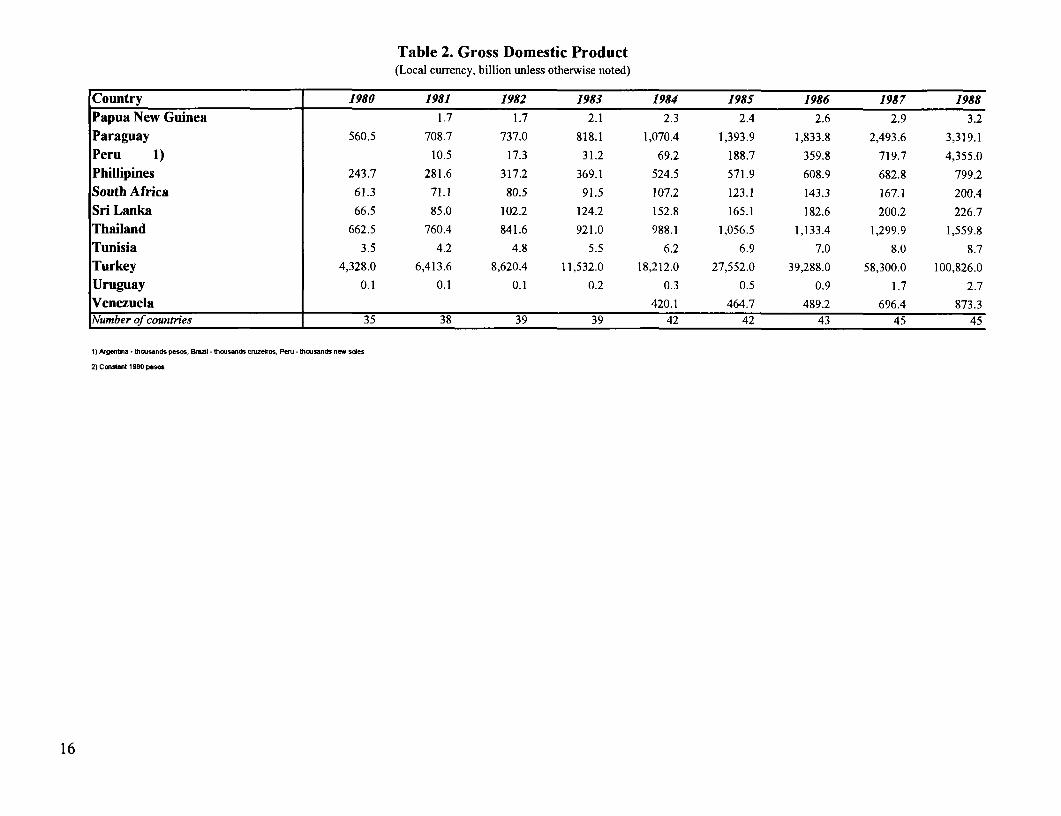
Table 2. Gross Domestic Product(Local currency, billion unless otherwise noted)
Country 1980 1981 1982 1983 1984 1985 1986 1987 1988Papua New Guinea 1.7 1.7 2.1 2.3 2.4 2.6 2.9 3.2
Paraguay 560.5 708.7 737.0 818.1 1,070.4 1,393.9 1,833.8 2,493.6 3,319.1
Peru 1) 10.5 17.3 31.2 69.2 188.7 359.8 719.7 4,355.0
Phillipines 243.7 281.6 317.2 369.1 524.5 571.9 608.9 682.8 799.2
South Africa 61.3 71.1 80.5 91.5 107.2 123.1 143.3 167.1 200.4
Sri Lanka 66.5 85.0 102.2 124.2 152.8 165.1 182.6 200.2 226.7
Thailand 662.5 760.4 841.6 921.0 988.1 1,056.5 1,133.4 1,299.9 1,559.8
Tunisia 3.5 4.2 4.8 5.5 6.2 6.9 7.0 8.0 8.7
Turkey 4,328.0 6,413.6 8,620.4 11,532.0 18,212.0 27,552.0 39,288.0 58,300.0 100,826.0
Uruguay 0.1 0.1 0.1 0.2 0.3 0.5 0.9 1.7 2.7
Venezuela 420.1 464.7 489.2 696.4 873.3Number of countries 35 38 39 39 42 42 43 45 45
1) Argentina - thousands pesos. Brazil - thousands er eiros, Peru P -. thosands nr soles
2) Counstant 1980 pesos
16

Table 2. Gross Domestic Product(Local cwrrency, billion unless otherwise noted)
Country 1989 1990 1991 1992 1993Argentina 1) 3,244,050.0 68,922,300.0 180,898,000.0 226,638,000.0 255,326,365.0Bangladesh 659.6 737.6 834.4 906.5 968.8Belize 0.7 0.8 0.9 1.0 1.0Bolivia 2) 118.2 123.8 130.0 133.2 138.8Brazil 1) 1,170,387.1 29,973,000.0 157,038,000.0 1,701,183,000.0 38.633,616,000.0Chile 6,972.1 8,638.2 11,227.5 14,263.3 17,038.4Colombia 15,126.7 20,228.1 26,240.8 33,064.2 41,724.2Costa Rica 425.9 522.9 690.1 904.6 1,077.3Cote d'lvoire 2,987.5 2,695.1 2,680.9 2,688.8 2,632.8Dominican Republic 42.4 64.9 100.1 112.4 122.0Ecuador 5,170.5 8,204.2 12,296.0 19,413.6Egypt 65.6 78.9 98.7 118.2 131.1El Salvador 32.2 41.1 47.8 54.9 66.2Fiji 1.9 2.0 2.2 2.4 2.5Ghana 1,417.2 2,031.7 2,574.8 3,008.8 3,949.0Guatemala 23.7 34.3 47.3 54.0 63.7Guinea 1,438.9 1,860.5 2,248.0 2,682.7 3,030.5India 4,540.0 5,308.7 6,156.6 7,055.7Indonesia 167,184.4 195,597.2 227,450.2 259,884.5 302,017.8Iran 27,787.1 36,644.6 50,107.4 66,462.5 93,800.6Kenya 8.6 9.8 11.1 12.8 16.1Korea 149,165.0 179,539.0 215,734.0 240,392.0 265,548.0Madagascar 4,005.3 4,601.6 4,906.4 5,579.6 6,416.6Malawi 4.2 5.1 6.1 6.7 8.9Malaysia 102.6 115.8 129.6 147.8 166.8Mali 653.8 674.5 672.3 737.2 753.8Mauritius 32.3 38.0 42.8 47.0 53.0Mexico 507.6 686.4 865.2 1,019.2 1,122.9Morocco 193.9 213.8 241.6 242.5 255.1Namibia 5.2 5.5 6.3 7.3 8.2Nepal 89.3 103.4 120.5 149.5 170.0Nigeria 230.2 285.0 338.1 553.2 770.7Pakistan 855.9 1,020.6 1,211.2 1,342.0 1,554.6Panama 4.6 5.0 5.5 6.0 6.6
17

Table 2. Gross Domestic Product(Local currency, billion unless otherwise noted)
Country 1989 1990 1991 1992 1993Papua New Guinea 3.0 3.1 3.6 4.1 5.0Paraguay 4,608.4 6,474.4 8,280.8 9,670.8 11,905.0Peru 1) 106,372.0 6,416,148.0 32,857,630.0 52.398,235.0 81,640,973.0Phillipines 925.4 1,077.2 1,248.0 1,351.6 1,466.3South Africa 240.6 276.1 310.1 342.4 383.8Sri Lanka 255.8 326.1 376.6 432.1 506.0Thailand 1,857.0 2,191.1 2,505.6 2,808.8 3,131.8Tunisia 9.7 11.0 12.2 14.0 15.2Turkey 167,457.1 283,187.1 448,945.0 787,998.0 1,364,154.0Uruguay 4.8 9.8 20.3 35.3 51.9Venezuela 1 ,510.4 2,279.3 3,036.3 4,131.5 5,449.1NTumber of countries 45 45 45 45 43
1) Argenba - thousanas pesos, BranI - thousands cmzedros, Peru - th
2) Constant 198O pesos
18

Table 3. Private Investment as a share of Total Investment (in %).
Country/Years 1980 1981 1982 1983 1984 1985 1986 1987 1988 1989 1990 1991 1992 1993
Argentina Private I/GDI 75.8 74.5 73.9 70.2 73.8 73.2 76.7 67.2 71.6 74.7 78.8 85.6 88.7 87.9
Bangladesh Pnivate I/GDI 53.4 58.9 58.7 53.7 54.2 56.8 50.0 48.1 51.5 50.3 50.1 50.6 54.7 54.8
Belize Private I/GDI 49.1 54.3 43.4 45.2 57.9 50.2 48.3 64.3 62.9 52.1 42.4 24.4 24.9 40.5
Bolivia Private FGDI 51.3 34.7 50.3 41.6 46.9 51.0 49.4 39.3 34.0 33.6 32.5 33.7 32.5 36.0
Brazil Private l/GDI 72.0 68.2 69.5 69.4 72.5 71.5 72.2 72.6 73.6 78.5 76.7 73.4 71.2 76.2
Chile Private l/GDI 74.3 77.2 57.9 50.4 53.3 83.6 79.5 67.3 70.7 79.1 83.5 80.6 80.8 82.3
Colombia Private I/GDI 58.2 58.3 56.2 41.1 48.3 52.4 62.5 63.7 65.1 61.5 61.6 54.3 55.1 53.8
Costa Rica Private I/GDI 61.3 63.1 64.5 64.7 68.3 63.5 68.8 77.7 78.2 77.9 78.9 78.5 80.1 80.7
Cote d'Ivoire Private I/GDI 53.2 56.9 43.8 40.0 36.5 48.0 43.2 40.2 45.2 53.6 48.7 46.7 50.9 47.9
Dominican Republic Private I/GDi 68.4 70.6 76.5 76.7 83.9 70.0 72.7 59.9 71.9 60.8 69.4 63.8 66.0 63.5
Ecuador Pnivate l/GDI 59.7 52.5 57.4 52.0 58.3 58.9 51.1 59.1 59.4 55.8 63.9 66.8 61.6
Egypt Private L/GDI 30.1 22.8 21.2 23.0 26.9 33.4 35.9 45.3 41.4 42.5 42.9 59.3
El Salvador Private l/GDI 47.5 46.0 51.8 60.7 65.9 72.6 80.6 78.6 75.4 73.8 80.8 81.2 78.1 79.5
Fiji Pnivate l/GDI 53.8 46.5 43.1 46.9 60.0 66.9 67.4 62.6 56.5 49.6 34.5 44.7 41.3 34.9
Ghana Private I/GDI 63.9 56.5 22.3 23.8 28.9 41.2 52.8 51.2 33.6 28.9
Guatemala Private I/GDI 63.8 53.2 59.0 62.6 69.5 80.5 81.0 78.4 78.5 76.8 79.1 82.2 80.8 83.0
Guinea Private I/GDI 59.6 54.7 52.1 51.5 47.4 52.4 55.0 57.9
India Private I/GDI 55.5 53.6 48.0 48.9 48.6 49.3 46.4 52.1 53.5 57.3 58.6 56.6 58.6
Indonesia Private IIGDI 56.5 59.7 52.7 55.7 57.1 66.8 69.7 67.7 68.5 67.4 65.9 65.1 62.2
Iran Private I/GDI 52.3 48.8 42.6 56.0 59.2 60.6 56.1 58.7 59.4 61.6 53.8 60.9 59.0 61.3
Kenya Pnivate l/GDI 54.8 55.5 55.0 61.8 58.3 59.9 58.8 63.7 58.8 58.1 52.9 55.3 55.8 58.9
Korea Private l/GDI 75.7 72.5 74.8 77.7 77.5 74.4 75.7 80.2 81.4 81.2 80.0 76.6 74.7 73.6
Madagascar Private /GDI 25.5 30.2 40.0 30.9 48.1 27.6 46.5 43.8 32.9 46.2
Malawi Private l/GDI 21.4 32.5 42.2 39.3 25.1 38.0 16.8 42.5 46.8 54.2 51.8 52.0 41.6 25.8
Malaysia Private l/GDI 62.6 55.2 50.0 49.0 52.6 53.1 54.2 60.2 63.8 63.1 64.6 68.0 67.3 64.8
Mali Private I/GDI 50.2 55.4 55.0 54.1 46.9 55.7 57.6
Mauritius Private IIGDI 63.9 61.4 64.2 64.4 68.3 67.7 64.7 66.3 57.7 73.3 63.2 71.6 67.2 70.3
Mexico Private I/GDI 56.0 54.2 55.7 62.5 63.2 65.2 66.4 69.9 75.1 73.5 73.8 76.5 79.8 80.4
Morocco Pnivate l/GDI 53.1 44.0 49.0 48.3 48.4 52.5 57.3 57.6 57.5 58.0 61.0 59.1 58.3 55.0
Namibia Private I/GDI 40.7 35.3 28.6 32.2 37.4 31.9 40.4 44.0 52.0 62.4 65.3 51.0 43.4 48.2
Nepal Privae I/GDI 60.1 57.6 54.5 55.3 54.6 61.3 58.6 60.0 59.1 51.8 53.1 61.9 64.7 65.3
19

Table 3. Private Investment as a share of Total Investment (in %).
Country/Years 1980 1981 1982 1983 1984 1985 1986 1987 1988 1989 1990 1991 1992 1993Nigeria Private IFGDI 30.8 28.0 30.7 28.9 24.1 22.3 22.3 28.6 29.9 31.0 41.9 36.7 27.8 2.0Pakistan Private IIGDI 45.0 42.9 43.4 45.4 46.0 45.6 44.3 46.5 48.2 51.7 51.4 52.7 52.5 53.1Panama Privase IFGDI 84.3 74.0 74.9 86.9 81.1 82.4 84.3Papua New Guinea Private IIGDI 67.7 79.2 79.4 73.9 65.8 69.2 72.6 78.6 81.7 79.6 83.2 78.2 70.3Paraguay Pnivafe IIGDI 82.1 82.3 81.2 65.9 61.2 68.7 78.5 74.3 70.3 70.3 74.1 76.4 72.0 75.6Peru Private IIGDI 74.7 70.6 63.5 60.0 66.2 71.1 75.1 78.5 78.9 83.0 82.6 80.8 81.0Phillipines Private IIGDI 68.9 60.7 72.7 79.5 78.1 78.7 83.1 82.9 83.8 82.9 81.7 79.4 76.4 78.9South Africa Private IIGDI 50.8 55.8 57.1 58.4 59.6 56.1 57.3 60.6 66.4 63.9 65.6 66.7 69.0 70.8Sri Lanka Pnivate FGDI 41.2 46.4 47.8 50.1 47.5 45.1 45.6 45.9 48.4 51.2 63.7 63.1 70.3 70.3Thailand Private IIGDI 68.1 68.1 70.7 71.9 71.0 68.0 71.4 78.4 83.6 85.3 84.9 82.5 79.8 78.9Tunisia Private IIGDI 46.9 47.6 45.3 44.7 44.3 45.9 43.8 45.9 50.4 51.6 47.3 50.4 51.5 48.1Turkey Prnvate IUGDI 45.6 40.0 40.7 44.9 45.9 41.8 42.5 46.7 52.6 54.7 56.6 54.1 54.4 58.9Uruguay Private IIGDI 68.2 67.9 51.0 62.7 58.9 63.7 62.9 64.8 66.1 62.6 71.6 65.4 71.9 68.8Venezuela Private I/GDI 65.4 61.7 53.4 57.2 54.1 46.9 34.7 45.9 42.0 46.0
verage 56.7 55.9 55.1 54.9 55.8 57.4 57.2 59.1 60.7 61.1 62.0 61.8 60.7 61.0Number of countries 35 38 39 39 42 42 43 45 45 45 45 45 45 43
20

Table 4a. Private Investment - Simple Averages.
Region 1980 1981 1982 1983 1984 1985 1986 1987 1988 1989 1990 1991 1992 1993
East Asia 19.0 17.2 19.0 18.8 17.0 15.3 15.5 16.2 17.5 19.6 21.2 21.5 19.8 18.8
Latin Americaand Caribbean 13.5 13.7 11.9 9.9 10.4 10.6 11.3 12.6 12.9 12.1 11.6 11.5 12.6 13.9
Europe,MiddleEast,NorthAfrica 11.5 10.9 10.7 10.6 10.3 9.9 9.5 9.2 10.1 11.0 11.1 11.8 11.6 12.6
South Asia 9.8 9.8 10.0 9.8 9.1 9.6 8.9 9.4 9.5 9.8 10.2 10.8 11.6 11.9
Sub-Saharan Africa 11.0 11.0 9.4 8.7 6.6 6.8 6.6 7.6 8.7 9.2 9.8 9.0 8.3 7.7
Table 4b. Private Investment - Weighted Averages
Region 1980 1981 1982 1983 1984 1985 1986 1987 1988 1989 1990 1991 1992 1993
East Asia 21.2 17.2 19.4 19.0 18.0 17.0 18.0 19.7 21.3 23.6 26.6 26.6 24.7 23.8
Latin Americaand Caribbean 16.1 15.5 14.1 12.0 12.0 12.2 13.1 14.2 15.3 16.3 14.4 13.4 14.4 15.4
Europe, Middle East, Norih Africa 10.9 9.4 8.5 10.6 10.6 9.6 8.7 8.5 9.5 10.3 10.6 12.4 12.1 13.1
South Asia 10.2 10.1 9.4 9.2 9.2 9.8 9.4 10.6 10.9 12.1 12.4 11.7 11.8 10.1
Sub-Saharan Africa 10.1 11.1 10.8 9.9 7.7 6.5 7.8 8.9 10.1 10.3 10.6 10.0 9.4 8.2
21

Table 5a. Public Investment - Simple Averages.
Region 1980 1981 1982 1983 1984 1985 1986 1987 1988 1989 1990 1991 1992 1993
East Asia 9.7 11.0 10.5 9.7 8.3 8.0 6.9 6.0 5.8 6.4 7.7 7.5 7.9 8.4
Latin America and Caribbean 7.4 7.7 7.1 6.4 5.8 5.4 5.4 5.8 5.8 5.9 5.1 5.6 6.1 5.8
Europe,MiddleEast,NorthAfrica 11.8 13.2 15.1 14.4 13.8 12.9 12.0 10.0 10.1 9.5 10.2 10.2 10.0 9.8
South Asia 10.0 9.4 10.0 9.6 9.2 9.2 9.4 9.1 8.7 8.7 8.0 7.9 7.4 7.2
Sub-Saharan Africa 13.2 12.3 11.1 9.5 7.4 7.1 7.8 7.9 8.2 7.7 8.0 7.6 8.0 7.6
Table 5b. Public Investment - Weighted Averages
Region 1980 1981 1982 1983 1984 1985 1986 1987 1988 1989 1990 1991 1992 1993
East Asia 8.8 10.1 10.2 9.7 8.7 8.7 7.3 6.2 6.1 6.5 7.6 8.6 8.9 9.1
Latin America and Caribbean 7.6 8.5 7.6 6.5 5.9 5.8 5.8 6.2 6.1 5.5 4.9 4.6 4.7 4.4
Europe, Middle East, North Africa 10.9 11.2 12.4 11.7 11.1 10.3 9.8 8.9 9.7 8.8 9.3 9.6 9.6 9.2
South Asia 8.8 9.1 10.2 9.7 9.8 10.1 10.9 10.0 9.7 9.3 9.1 9.1 8.6 7.8
Sub-SaharanAfrica 13.9 14.2 12.7 10.7 8.1 7.9 9.2 7.8 7.5 7.8 7.3 7.0 6.7 6.6
22

Appendix 3Graphs


Sub-Saharan Africa
Cote d'lvoire
Ghana
Guinea
Kenya
Madagascar
Malawi
Mali
Mauritius
Namibia
Nigeria
South Africa

Cote d'Ivoire Kenya35.0 %35.0 -
3. -Private-Pubic |-3.0-_Priele -Public30.0 30.0
25.0 25.0
20.0 20.0
15.0 15.0
10.0 10.0
5.0 _ _ _ _ _ _ _ _ _ _ _ _ _ _ _ _ _ _ _ _ _ _ _ _ _ 5.0
0.0 19831 19841 1985 1 1986 1981 1988I5 1989 1990 1 991 1992 1993 983 984 1985 986 1 )987 19 881 1989 1990 1991 1992 993
PrivaleL 7.11 4.6 5.5 5.1 4-5 5.0 4.5 3.9 3.5 4.1 3.7 Privaterl.110.5 10.7 1.5 I 12.5 1811.2 11.0 10.7 9.6 9.1Public 10.6| 8.0 610 6.8 6.7 6.0 3.9 4.2 3.9 3.9 4-0 _Public 6.9 7.57.2 8.1 7.1 83J_8.1 9.8 8.6 76 6.3
Ghana Madagascar35.0 35.0
|.-Pr6vaet -Public | Private -Public 30.0 30.0
25.0 25.0
20.0 20.0
15.0 . 15.0
5.0 5.0
0010.01
1903 194 1I 1983 I986 11987 1988 11989 1990 1991 1992 1993 1983 1984 1985 1986 19871 19881 1'89 1990 1991 1992 1993Private n.a 44 54 21 25 33 54 76 81 4.3 4.0 Private n.a. 2.2 2.6 3.6 3.1 6.4t3.7 6.9 4.6 3.7 6.9Public n.a 25 42 7.3 7.9 801 8j68 8.5 9.9 Pbc n.a. 6.4 6.0 5.4 7.0 6.9 9. 7 5.9 7.6.8.1
Guinea Malawi35.0 35.0
| |Prival. -Publlc |*-P|lvals( -PubliC|
30.0 30.0
25.0 25.0
20.0 20.0
15.0 . 15.0
10.0 10.0
5.0 5.0
0 1983 1984 198 8 198 4 1985 11986 1 987 1988 198 990 1991 1992 1993| Private | n.a. |.0. 0.0.| n 8.9 | 8.9 8.9 8.9 8.3 8.6 9.1 9.2 Private 5.4 3.3 50 2. 59 7.2 9.0 8 8 .8 6.7 |2.6LPubli n.a. i n.a. 80 7.4 8.3 9.2 7.8 7.4 67 I LPublic 8.3 9.8 8.3 10.17.91 8.27.6 '7.8 8.1 L94 7.4
26

Mali Nigeria35 0 35.0
35 | P,vale -Pubilc | 3 .0 -Privat. -Pubk |
30.0 30.0
25.0 25.0
20.0 20.0
150 15.0
5 0 5.0
oc0 00-1983 1984 1985 1986 1 19871 1988 1989 1990 1991 1992 1993 1983 1984 1985 9 1 1990 1991 1992 1993
Private n.a. n.a. na. na. 10.2111.617 12.1 10.8 12.2 12.6 iPrivate 4.3 2.3 2.0 3.3 3.9 4.04.416. 6.04.6 0.3
Publc n.a. na.|n.a. n.a. 10.1 9.4 9.6 10.3 12.3 9.7P9.3 Public 10.5 7.2.6.9|11.6 9.8 9.4 9.7 8 103 11.9 13.3
Mauritius South Africa35.0 ata-Public 35.0
30.0 30.0
25.0 25.0
20.0 20.0
15.0 15.0
10.0 100
5.0 50
00 1983 1984 1985 1986 1987 1988 1989 1990 1991 1992 1993 0.0 1983 1984 1985 1986 1987 1988 19|89 1990 1991 1992 1993
Priate 11.6 12.3 12.6 12.8 14.3 16.6 |19.5 19.7 120.7 19.9 20.4 Private 15.6 14.6 13.1 11.6111.2 13.2 113.2 12.9 11.911.3 10.8Public 6.4 0 7.0 7.3 1 7.111.5 8.2 9.7 8.6 Pulic 9.9|108.6 .6 7.3 6.7 7. 6.8 9 59 5.1 44
Namibia
30 0
25.0
20 0
1 5.0
10.0
5.00 1.0 -
_ 1983 1984 1 1985 1986 1987 1988 1989 1990 1991 1992 1993L Private 5.91 5.6 4.2 5.1 16.3 7.7 9.9 11.0 5.3 5.4 5.11Publi2. 9.4 91 .6 8.0 7.1 5.9 5.9 5.1 7.1 5.5
27


Latin America and the Caribbean
Argentina
Belize
Bolivia
Brazil
Chile
Colombia
Costa Rica
Dominican Republic
Ecuador
El Salvador
Guatemala
Mexico
Panama
Paraguay
Peru
Uruguay
Venezuela

Argentina Brazil35.0 35.0
30.0 30.0
25.0 30.0
2D.0 20.0
15.0 ... .. 2 15.0
10.0 . 10.0
5.0 5.0
0-I.0 0.0. 1987 1984 1985 1986 1987 19N8 1989 1990 1991 199I 1993 1983 l984 1985 1986 1 97 198 1989 1990 1991 1992 1 1993
Privalt 14.3 14.2 13.2 13.4 12.7 13.3 11.6 11.0 12.5 14.8 16.2 Private 13.8 13.7 12.9 14.4 16.8 17.9 1 .1 17.6 14.4 13.9 15.5
_ Public 6.1 5.0 4.8 4.1 6.2 5.3 3.9 3.0 2.1 1.9 2.2 Public 6.1 5.2 5.1 5.6 6.4 6.4 5.8 5.3 5.2 5.7 4.9
Belize Chile30.0 35|0
30.0 30.0*
25.0 25.0
20.0 . 20.0 ...
15.0 15.0
10.0 . 10.0
5.0~ 5.0
I 1984 1985 1 1986 1 1987 I 1988 11969 1 1991 1 1921993 I 198 198 | 95 | 196 I 197 | 198 | 1989 I 1990| 1991 I 1
Private 8.5 11.8| 8.7 8.4 13.8 16.1 14.3 11.1 7.0 7.3|12.7 |Private 5.017.3 14.813.6|13.2|14.7|18.6|19.3|17.0|19.3|21.8
Public 10.4 8.6 8.7 9.0 7.7 95|13.1 15.1 21.6|21.9 18.6 ic 4.9 6.4 2.9 3.5 6.4 6.1 4.9 3.8 4.1 46L47
Bolivia . Colombia35.0 35.0|PlU -P0 ubic ||- r -Pubilc|
30.0 ... 30.0
30.0 30.0
15.0 15.0
10.0 10.0
5.0 -- 5.0
0.0 0.01983 1984 1985 1986 1987 1988 1989 1990 1991 | 1992 | 1993 | 1t | 1984 |198 1198 6 1 19B7| 19'88| 1989 |1197 199! 1992 1993
Private| 2.9 1 2.8 | 2.3 | 2.4 | 2.1 2.0 1.9 1.9 2.1 | 2.2 2.4 Private 7.1 8.2 9.2 |11.1 11.1 12.7|11.1|10.21 7.7 8.5 |10.1|P Lublic| 4.1 | 3.2 | 2.2 | 2.5 | 3.2 | 3.9 3.7 3.9 4.1 4.7 4.2 Public 10.1 8.8 8.3 6.7 6.3 6.8 70 6.4 6.5 7.0 8
30

Costa Rica El Salvador36.0. 35.0
7s -Pnvale -Public| :10-Pricasb -PuDlc|
30.0 30.0
26.0 20.0
20.0 20.0
15.0 15.0
10.0 10.0
5.0 5.0
0.0 ~~~ ~~~~~~~~~~~~~0.0 -_ _ _ _ _ _ _ _ _ _ _ _ _ _ _ _ _ _ _ _ _ _ _ _ _o.o____ 19831994 I995 198 1987 | 198 198 98 1990 1991 I 1992 1993 o1983 1904 1985 | 1986 1987 19M8 1989 1990 1991 1992 | 1993
IPrivate 11.6 13.7 12.3 12.8 15.4 14.8 16.0 17.7 15.5 16.7 17.8 Private 7.0 7.6 8.7 10.6 10.7 9.5 9.8 9.5 10.9 12.2 12.9
| Public 6.4__6.4__7.0__5.8__4.4 14.1 4.5 4.7 4.2 4.1 4.3 | Public [4.6 3.9 3.3 2.5 2.9 3.1 3.5 2 .3 25 3.4 3.3
Dominican Republic Guatemala3.0 355.0
30.0 30.0
25.0 25.0
200 20.0
16.0 15.0
10.0 100
5.0 5.05
ox.0 0.01983 1984 1985 1986 1987 11988 1989 I 1990 |,'1 |1992 |1993 1983 1984| 1905 | 1986 | 1987 1988 | 1989 1990 I 1991 1992 1993Private 15.6 17.6 14.0 13.9 16.7 20.6 16.5 14.2 10813.9 14.7 Private 6.6 6.7 8.8 8.1 9.7 10.5 10.6 10.3 10.0 12.6 13.4
|Public 4.7 3.4 6.0 5.2 11.1 8.1 10. 6.3 6.1 7.1 8.4 _Pbic 3.9 2.9 2.1 1.9 2.7 2.9 3.20 2.7
Ecuador Mexico35.0 35.0
| |-Prlvte -Public l |Priva1e -Pubi,c|
30.0 30.0
25.0 25.0
30 0 20.0
15 0 15.0
10. 10.0
5 0 5.0
1983 1984 1985 1986 1987 198' 1989 1990 1991 1992 1993 0 || - 1 1984 5| 1986 1987 1988 1989 140 1 1 | 1 3
FPrivate 8.6 9.0 9.5 9.6 13.4 12.7F11.6 11.8 13.1112.0 na. Private 11.0 11.3 12.5 12.9112.9 15.2 13.3 13.7 14.9|16.6 16.4
L,L8.0 664 66 92 9.3 8.6 92 6.7 65 7.5 n.a Public 6.6 6.6 6.6 6.5 5.6 5.0 4.8 4.9 4.6 4.Z 4.0
31

Panama Uruguay35.0 35.0 %
30.0 p-Pl -Public |00|-Prval. -Publilc|30.0 30.0
25.0 25.0
20.0 20.0
16.0 . 1.0
10.0 *.. 10.0
5.0 . 5.0
0.0 1983 | 1984 1985 1986 1987 | 1988 1989 j1990 j 1991 1992 1993 0.0 1983 1984 1995 1986 1987 1988 1989 1990 1991 1992 1993
Privatc n.a. na. na. n.a. 14.7| 6.6 5.2 8.2 113.6.17.4 20.6 Private 8.6 6.4 61 6.21 7.4 7.9 7.2 7.7 7.8 9.4 9.8
Public na. n.a. n.a. n.a. 2.7 2.3 1.7 1.2 3.2i 3.7 3.8 Pubic 5.1 4.5 3.5 3.7 4.0 4.0 4.3 3.1 4.1 3.7 4.4
Paraguay Venezuela35.0 35.0
|-Pr0uale -PubDc | |PrIya1 -Public|
30.0 . 30.0
25.0 25.0
20.0 20.0
15.0 15.0
10.0 10.0
5.0 5.05
0.0 1933 j 198 j 1985 1986 j 1987 1988 j 1989 1190 j1991 j 1992 1993 0.0 198 984 j 1985 1986 1987 j1988j 1989 1990 1991 1992 1993
|Private |13.3 13.2 14.2 18.5 17.6 16.3 16.0 16.3 18.1 16.2 16.2 | Private n.a. 10.5 11.0110.9 12.2112.41 7.9 4.9 8.2 |18.91 9.0
Public |6.91 8.4 6.5 l 5.1 6.1 6.91 6.7 j 5.7 5.6 6.3 5.2 Public| n.a. 5.5 6.81 9.5 | 9.11|10.5 9.0 9.2 9.6 12.2 10.5|
Peru35.0 -
I|-Prtval -PubDc|30.0
25.0
20.0
is.0
100.0
5.0
0.0 1983 1984 1195 19 9119 87 19 I98 1989 |1990 1991 1992 |1993
Pivate 15.1 12.1 12.0 13.2 13.4 15.5 13.11 12.2 11.8 12.4 13.5
LPubliC__8.7_ 8.1__6.1_ 5.4 4.4 4.2 3.5 2.5 2.5 2.9 3.2
32

Europe, the Middle East, and North Africa
Egypt
Iran
Morocco
Tunisia
Turkey

Egypt Tunisia35.0 35.0
30.0 30.0
25.0 25.0
20.0 30.0
15.0 15.0
10.0 10.0
5.0 8~~~~~~~~~~~~~~~~~~~~~~~~~~~.00.0 193 1984 1985 | 1986 1987 1988 | 1989 |99 1991 | 1992 1993 0.0 1983 1 1984 1 1985 1986 1987 988 1989 1990 1991 992 1993
Private 6.5 5.8 6.1 6.4 6.0 8.7 10.5 9.1 8.7 7.8 11.6 Private 14.2 13.6 12.3 10.5 9 9.7 10.7 1 115118 11.4
Public 122.2 21.7 20.5 17.3 12.0 15.5 12.7 12.8 11.8 10.4 Pbli 17.6 17.1 14.5 13.5 11.0 9.6 100 10 311.1 12.4
Iran Turkey35.0 - 3.0
30.0 ..... 30.0
25.0 25.0
20.0 ...... 20.0
185.0 15.0
10.0 10.0
.0 8.0
1983 | 1984 1985 1986 1987 1988 1989 1990 1991 1992 I 1993 0.0 1983 1984 1985 1986 1987 19988 1989 1990 1991 11992 193
Private 12.0 12.4 10.6l 8.6 7.8 7.9 8.2 8.3 13.21 13.0113.5 |Private 8.3 8.3 18.4 9.8 11.2 12.6 12.4 12.8 12.3|12.0 13.4
Public 9.4 8.5 6.9 6.7 5.5 5.4 5.1 7.1 8.5 9.0 8.5 Public 10.2 9.8 11.8 13.3 12.8 11.4 10.3 9.9L10.5 lO .3
Morocco35.0
I Pr1v8a -PublIcl
30.0.
25.0
20.0
15.0
10.0
5.0.
0.0 191 1 85 6 1 19f87 I 1988 1989 1990 1991 1 1992 1 ,993Private 11.8 11.2 12.1 12.2 11.6|11.8|13.2|14.6|13.2|13.4|13.3
Public 12.6 11.9 11.0 9.1 8.6 8.7 9.6 9.3 9.1 9.6 10.9|
34

East Asia
Fiji
Indonesia
Korea
Malaysia
Papua New Guinea
Phillipines
Thailand

Fiji Papua New Guinea35C0 36.0
30.0 W 30.0
25.0 25.0
20.0 20.0
15.0 150
10.0 o10.0
5.0 .5
0.0 1983 1984 1985 9181 1987 1988 1989 1 1990 1991 1992 1993 0.0 1983 1984 1985 1 1986 1 1987 1988 1989 1990 1991 1992 1993
tPrivate 9.8 10.3 12.2 9.9 9.8 6.8 6.2 15.4 5.5 4.9 4.7 Priv2ate23.6 1761121 145 '40 1 20.0 23.3 18.6 14.3
Public 11.1 6.8 6.0 4.8 95.8 5.2 6.3 10.3 6.8 6.9 8.8 Public 6.1 6.2| 6.31 6.41 5.3I 5.0 4 5.1 4.7 5.2 6.1
Indonesia Philippines35.0 | 35.0 -
-- Prtval. -Public .~~~~~~~~~~~~~IPrIval. -Public]
30.0 30.0
25.0 25.0
20.0 20.0
15.0 = 15.0
10.0 . 10.0
5.0 5.0
0.01983 1984 1989 1987 11988 1989 11990 1991 1992 11993 0.0 1983 1984 l9 1 1986 R17 188 1989 5 1 1 112 13
Private 13.2 12 5 113.5 16.2 17.3 17.7 18.7 19.2 18.5 17.7 16.1 YPrivate 23.7 19.1 13.7 14.0 13.7 14.9 17.3 118.9 15.9 116.0 118.8
Publ 11.99 10. 80 75 8.4 8.61 9.3 9.6 9.5 9.8 Public1 6.1 5.4 3.7 2.8 2.8 2.9 3.6 4.2 4.1 4.9 5.0
Malaysia Thailand35.0 36.0
|-||-vaks-Publlic I P | | l--Public/ 30.0 30.0
25.0 . 25.0
20.0 20.0
15.0 15.0
10.0 | 10.0
5.0D 5.0
0.0 1983 1984 1965 1986 1987 1988 1989 1990 1991 1992 1993 198 165 1 - 986 197 .988 19899 1990 1991 |192 1993
Private 17.7 16.8 15.8 14.3 13.8 15.4 18.5 20.9l24.1123.2120.6 Private 20.5 20.3 18.51 18.4121.725.6 29.6 34.2134.0131.2 31.0
Public 18.4 15.114.0 12.1 9.1 8.7 10.8 11.5 11.4111.3111.21 1 Public 8.01 8.31 8.7i 7.4i 6.0 5.0 5.1 6.11 7.21 7.9 8.3
36
South Asia
Bangladesh
India
Nepal
Pakistan
Sri Lanka

f69 Z' L'L 6' I L O'L SiL 0 |L'S atO lE L'Zr iTt LB S6 COT l Itl 66 tZI 96 S'OT BAIl£661 T661 1661 0661 6961 M6 L61 |961 T61 t61 061
~~~~~~~~~~~~~~~~~~~~.. .. .. ... .. . ooe
ODO
0Ba
I ond - "W!L-J 09£
lrL6H991 8L1 T'lbl t'ZIT911RZl 8I9EI| Z1 ollqnd I BUS'8 IS6 V6 IL6 |T'OI|'Ol|'Tl|S'OI|I'Ol j6'6-Dl| S LIE9 I J:V 18 E 1 1LO I 9ISOIEZ|'l 7A1| SZ t Zl t'El O'El S'11 E'll S'6 Z Ol 9 6 |t6tad
m~ ~ ~ ~~~~~. 56116 6166 T <6l1|9N S 6 9 1 61|t6 951 1161 | 6l MI T R 61 M 1 0161O
I ~~~~~~~~~~~M L86 19'01 ''1 '15 I' 0R1'0L
|~~~~~~~~~~~~~~~~~~~~~~~~~~~~~ O' S 09
1 ~~~~~~~~~~~~~~~~~~~~1oliqnd - MtW4Jd:-] || ow d- ftd-|
I~~~~~~~~~~~~~3u- pso 09cetue llS BI~~~~~~PUI
I I ,-- L 16 8 A8 1- F~TRO6 I 88 I L;61 Z 6 I 6R9 | 06 a !lqnd 0| I I ' 5 L' 5 V91 V9 09 IL-9 IE-9 I9-S I9SI Z-9 olqnd| |
II8'6 10OI 8 616 18 6 I E8~ ILL LL I 8L I9-L ISL |2eIAd | |'L |9'9 | 85 1>9 1 59 1 9 IZ-9 IE-9 I>L I9-9 1Z'L ]1 | |Cd r61t6- 6-6 6R6 -&.Y61 1641E 9B61- S861 j "61 E >61 C 661 Z 661 1 6t' 056161 686 ]61 MI I L81 MI S9111961 Ml C6 S1lOT
11_ -==l~~~~~~~~~~~~~~~~~~~~~~~~~~O'O I 1 1- -- ozo .| _ .*06 . . . . .. .
IO e . . .u .. .. . .. ......... ........ ... .. . .. .... ........... . .......... .. .. .. 0
O S L.. . ..... .......... . .......... ........... .. . . ..... 0 0 6&
0 ,0 9. . .... . ...... ... ... . . . . . . .......... .. .... . . ...... .. ... . .. 0 ..g o
O ' a . . . . .... . . . . ..... .......... . ......... ... . 0 K
o o . ... .. ............... .... ....... ....... ........N0 0
t'i 69 £9 9L VOl ~~~~~~ll~~iTT9~~o c9nT 9PtT d! I !I" r g P 6 6 VO dT-T 0 TOTd6
~i1L9 11 LI U0140 Lt 91-o qO ZTLT 1AQde IZ RTjT C ITL1 6ut 9

Distributors of World Bank PublicationsARGENTINA The Middle East Observer KOREA, REPUBLIC OF SOUTH AFRICA, BOTSWANACarom Hirsch, SRL 41, Sherif Street Pan Korea Book Corporation For single titls:Galeria Guem Cairo P.o Box 101, Kwangwhamun Oxford University PressFlorida 165, 4th Floor-Ofc. 453/465 Seoul Southern Africa1333 Buenos Aires FINLAND P.O. Box 1141
Akateenrinen Kirjakauppa Korean Stock Book Centre Cape Town 8000Oficina del Lbro Internadonal P.O Box 128 P.O. Box 34Alberti 40 SF-00101 Helsinki 10 Yeoe,do For subscnptwoi onren:1082 Buenos Aires Seoul International Subscription ServiceFRANCE P.O. Box 41095AUSTRALIA, PAPUA NEW GUINEA, World Bank Publicatons MALAYSIA CraighallFIJI. SOLOMON ISLANDS, 66. avenue d'dna Unuversity of Malaya Cooperative Johannesburg 2024VANUATU, AND WESTERN SAMOA 75116 Paris Boookshop. LimtedD.A. Wormahon Services P 0 Box 1127, jalan Pantai Baru SPAIN648 Whutehorse Road GERMANY 59700 Koala Lumpur Mundi-Prensa Lbros, S.A.Mitcham 3132 UNO-Verlag Castello 37Victona Poppelsdorfer Allee 55 MEXICO 28001 Madrid
53115 Bonn 1NFOTECAUSTRIA Apartado Postal 22-60 Libreria Internacional AEDOSGerold and Co. GHANA 14060 Tlalpan, Mexico D.F. Consell de Cent, 391Graben 31 Greenwich Mag. and Books 06009 BarcelonaA-lOll Wien Rivera Beach Hotle NETHERLANDS
PO Box 01198 De Lindeboom/InOr-Publikaties SRI LANKA AND THE MALDIVESBANGLADESH Osu-Accra P.O. Box 202 Lake House BookshopMicro Industries Development 7480 AE Haaksbergen P.O Box 244Assistance Society (MIDAS) GREECE 100 Sir Chttampalam A.House 5, Road 16 Papasotiriou S.A. NEW ZEALAND Gardiner MawathaDhanrmondi R/Area 35, Stournara Str. EBSCO NZ Ltd. Colombo 2Dhaka 1209 106 82 Athens Private Mad Bag 99914
New Market SWEDENBELGIUM HONG KONG, MACAO Auckland Fritzes FackboksforetagetJean De Lannoy Asia 2000 Ltd. Regeringsgatan 12. Box 16356Av. du Ros 202 46-48 Wyndhaun Street NIGERIA S-106 47 Stockholm1060 Brussels Winning Centre University Press Limited7th Floor Three Crowns Building Jericho Wennergren-Willams ABBRAZIL Central Hong Kong Private Mad Bag 5095 P. 0. Box 1305Publicacoes Tecricas Lnternadonais Ltda. Ibadan S-171 25 So/naRua Peixoto Gomide, 209 HUNGARY
01409 Sao Paulo, SP Foundation for Market Economy NORWAY SWITERLANDDombovars Ut 17-19 Narvesen Informaton Center Librauie PayotCANADA H-1I17 Budapest Book Department Case postale 3212Le Diffuseur P.O. Box 6125 Etterstad CH 1002 LausanneISIA Boul. de Mortagne INDIA N-0602 Oslo 6Boucherville, Quebec Allied Publishers Private Ltd. Van Dierman Editions Techniques - ADECO14B 5E6 751 Mount Road PAKISTAN P 0. Box 465Madras - 600 002 Mirza Book Agency CH 1211 Geneva 16Renouf Publshing Co. 65, Shahrah-e-Quaid-e-Azam1294 Algotna Road INDONESIA P.O. Box No. 729 TANZANIAOttawa, Ontario Pt. Lndira Linuted Lahore 54000 Oxford University PressKIB 3W8 Jalan Borobudur 20 Maktaba StreetP.O. Box 181 PERU P.O. Box 5299CHINA Jakarta 10320 Editorial Desarrollo SA Dar es SalaamChma Financial & Economic Apartado 3824Publishing House IRAN Lima 1 THAILAND8, Da Fo Si Dong Jie Kowkab Publishers Central Department StoreBeijing P.O. Box 19575-511 PHILIPPINES 306 S/tom RoadTehran Internatonal Book Center BangkokCOLOMBIA Suite 1703, Cityland 10Infoenlace Ltda. IRELAND Condominium Tower I TRINIDAD & TOBAGOApartado Aereo 34270 Government Supplies Agency Ayala Avenue, H.V. dela Systematics Studies UnitBogota D E. 4-5 Harcourt Road Costa Extension #9 Watts Sb-eetDublin 2 Makat, Metro Manila CurepeCOTE D'IVOIRE
Trinidad, West IndiesCentre d'Edihon et de Diffusion ISRAEL POLANDAfricaines (CEDA) Yozmot Literature Ltd. International Publishing Service UGANDA04 B.P. 541 P.O. Box 56055 Ul. Piekna 31/37 Gustro Ltd.Abidjan 04 Plateau Tel Aviv 61560 00-677 Warszawa Ist Floor, Room 4. Geogiadis ChambersP.O. Box 9997CYPRUS R.O.Y. International PORTUGAL Plot (69) KampalaCenter of Applied Research P.O.B. 13056 Livraria PortugalCyprus College Tel Aviv 61130 Rua Do Carmo 70-74 UNITED KINGDOM6. Diogenes Street Engomi 1200 Lisbon Macroinfo Ltd.PO Box 2006 ITALY P.O. Box 3Nicosia Licosa Commissionaria Sansoni SPA SAUDI ARABIA, QATAR Alton. Hampshire GU34 2PGVia Duca Di Calabria, 1/1 Jarcr Book Store EnglandCZECH REPUBLUC Case/la Postale 552 P.O. Box 3196National Inormation Center 50125 Firenze Riyadh 11471 ZAMBIAP.O. Box 668 University of Zambia BookshopCS-11357 Prague I JAMAICA SLOVAK REPUBLIC Great East Road CampusIan Randle Pubibshers Ltd. Slovart G.T G Ltd. P 0. Box 32379DENMARK 206 Old Hope Road Krupinska 4 LusakaSamfundsLitteratur Kingston 6 PO Box 152Rosenoerns Alil 11 852 99 Bratislava S ZIMBABWEDK-1970 Frederiksberg C JAPAN Longman Zimbabwe (Pvt.) Ltd.Eastern Book Service SINGAPORE TAIWAN, Tourle Road, ArdbennieDOMINICAN REPUBLIC Hongo 3-Chome, Bunkyo-ku 113 MYANMAR,BRUNEI P.O. Box ST 125Editora Taller. C. por A. Tokyo Gower Asia Paciic Pte Ltd. SouthertonRestaurci66n e Isabel la Cat6lica 309 Golden Wheel Building HarareApartado de Correos 2190 Z-1 KENYA 41. Kallang Pudding, 804-03Santo Domingo Africa Book Service (E.A.) Ltd. Singapore 1334
Quaran House, Mfangano StreetEGYPT, ARAB REPUBLIC OF PO Box 45245Al Atram NairobiAl Gala. StrretCairo


IFCINTERNATIONALFINANCECORPORATIONHeadtquarer1818 H Street, N.W.Washington, D.C. 20433, U.SA
Telephone: (202) 477-1234Telex: RCA 248423
TRT 197688Cable Address: CORINTFINFacsimile: (202)477-6391
London4 Millbank -London SWIP 3JA
Telephone: (71) 222-7711Telex: 919462Cable Address: CORINTFlNFacsimile: (71) 97&68323
Paris66, avenue d'Iena75116 Paris, France
Telephone: (1) 40.69.30.00Telex: 640651 nCable Address: CORINTFINFacsimile: (1) 47.20.77.71
TokyoKokusai Building, Room 913 t
1-1 Marunouchi 3-chomeChiyoda-kuTokyo 100,Japan
Telephone: (3) 3201-2310Telex: 26838Cable Address: INTBAFRAD 0Facsimile: (3) 3211-2216
00
13183 FID 1000-8213-3183-3
TRENDS IN PRIVATE INVEST
4000000158420
ISBN 0-8213-3183-3