Embed Size (px)
Citation preview

In the format provided by the authors and unedited.
1
Supplementary Information
Tunable Sieving of Ions Using Graphene Oxide Membranes
Jijo Abraham, Kalangi S. Vasu, Christopher D. Williams, Kalon Gopinadhan, Yang Su, Christie T. Cherian, James Dix, Eric Prestat, Sarah J. Haigh, Irina V. Grigorieva, Paola
Carbone, Andre K. Geim & Rahul R. Nair
1. Fabrication of physically confined GO (PCGO) membranes
Supplementary Fig. 1. PCGO membrane fabrication. Figure illustrating step-by-step procedure in the fabrication of PCGO membrane.
2. Experimental set-up for permeation experiments
Supplementary Fig. 2. Permeation set-up. (a) Experimental set-up showing Teflon made feed and permeate compartments used for the ion permeation experiments. Membranes were clamped between two O-rings and then fixed between feed and permeate compartments to provide a leak tight environment for the permeation experiments. (b) Cross-sectional view of the feed/permeate compartment showing O-ring arrangement for sealing the membranes.
Tunable sieving of ions using graphene oxide membranes
© 2017 Macmillan Publishers Limited, part of Springer Nature. All rights reserved.
SUPPLEMENTARY INFORMATIONDOI: 10.1038/NNANO.2017.21
NATURE NANOTECHNOLOGY | www.nature.com/naturenanotechnology 1
2
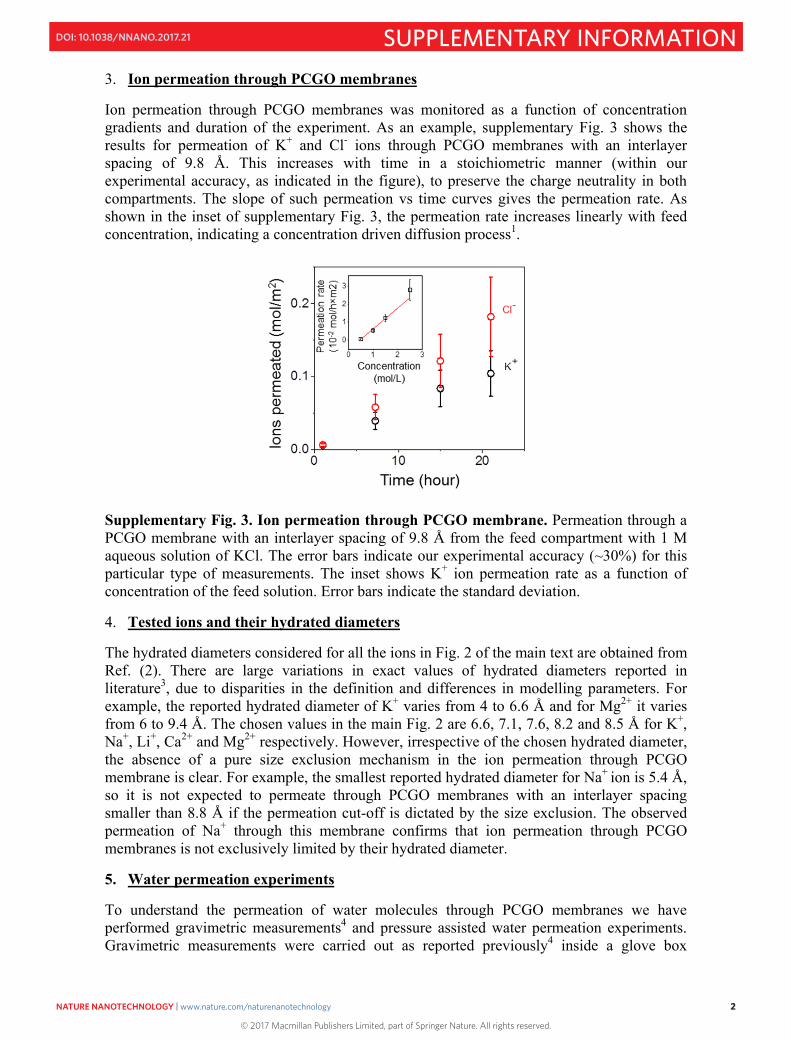
3. Ion permeation through PCGO membranes
Ion permeation through PCGO membranes was monitored as a function of concentration gradients and duration of the experiment. As an example, supplementary Fig. 3 shows the results for permeation of K+ and Cl- ions through PCGO membranes with an interlayer spacing of 9.8 Å. This increases with time in a stoichiometric manner (within our experimental accuracy, as indicated in the figure), to preserve the charge neutrality in both compartments. The slope of such permeation vs time curves gives the permeation rate. As shown in the inset of supplementary Fig. 3, the permeation rate increases linearly with feed concentration, indicating a concentration driven diffusion process1.
Supplementary Fig. 3. Ion permeation through PCGO membrane. Permeation through a PCGO membrane with an interlayer spacing of 9.8 Å from the feed compartment with 1 M aqueous solution of KCl. The error bars indicate our experimental accuracy (~30%) for this particular type of measurements. The inset shows K+ ion permeation rate as a function of concentration of the feed solution. Error bars indicate the standard deviation.
4. Tested ions and their hydrated diameters
The hydrated diameters considered for all the ions in Fig. 2 of the main text are obtained from Ref. (2). There are large variations in exact values of hydrated diameters reported in literature3, due to disparities in the definition and differences in modelling parameters. For example, the reported hydrated diameter of K+ varies from 4 to 6.6 Å and for Mg2+ it varies from 6 to 9.4 Å. The chosen values in the main Fig. 2 are 6.6, 7.1, 7.6, 8.2 and 8.5 Å for K+, Na+, Li+, Ca2+ and Mg2+ respectively. However, irrespective of the chosen hydrated diameter, the absence of a pure size exclusion mechanism in the ion permeation through PCGO membrane is clear. For example, the smallest reported hydrated diameter for Na+ ion is 5.4 Å, so it is not expected to permeate through PCGO membranes with an interlayer spacing smaller than 8.8 Å if the permeation cut-off is dictated by the size exclusion. The observed permeation of Na+ through this membrane confirms that ion permeation through PCGO membranes is not exclusively limited by their hydrated diameter.
5. Water permeation experiments
To understand the permeation of water molecules through PCGO membranes we have performed gravimetric measurements4 and pressure assisted water permeation experiments. Gravimetric measurements were carried out as reported previously4 inside a glove box
© 2017 Macmillan Publishers Limited, part of Springer Nature. All rights reserved.
NATURE NANOTECHNOLOGY | www.nature.com/naturenanotechnology 2
SUPPLEMENTARY INFORMATIONDOI: 10.1038/NNANO.2017.21

3
environment (< 0.5 ppm of H2O) using a stainless steel container sealed with a PCGO membrane. Air-tight sealing was achieved by fixing the PCGO membrane glued plastic plate to a steel container using two rubber O-rings. In a typical experiment, the weight loss of a water filled container sealed with a PCGO membrane was monitored using computer-controlled balance (Denver Instrument SI-203 with a sensitivity of 1 mg). We have performed the weight loss experiments for the PCGO membranes with interlayer spacing, d, of 6.4, 7.4, 7.9, 8.6, 9.0 and 9.8 Å to measure the water permeation rate as a function of interlayer spacing. No noticeable weight loss with an accuracy of 0.2 mg/h×cm2 was observed for the PCGO membranes with 6.4 Å interlayer spacing, indicating that the available free space of ≈ 3 Å is not sufficient for the permeation of water through graphene channels. However, the weight loss rates through PCGO membranes with interlayer spacings of 7.4, 7.9, 8.6, 9.0 and 9.8 Å were measurable and significant: 7.4, 8.8, 10.4, 12.3 and 15.4 mg/h×cm2, giving a water permeance of 3.2, 3.8, 4.5, 5.3 and 6.6 L/h×m2×bar, respectively.
Supplementary Fig. 4. Water permeation through PCGO membrnaes. Weight loss for a container sealed with PCGO membrnaes with different interlayer spacing. Inset shows the PCGO membrane sample used for the pressure filtration experiment (diameter of the disc is 51 mm).
In addition to the gravimetric measurements, we have also estimated the rate of liquid water permeation through PCGO membranes with an interlayer spacing of 7.9 Å using a Sterlitech HP4750 stirred cell. As shown in the inset of supplementary Fig. 4, the area of the membrane available for water permeation was increased by gluing multiple stacks of PCGO samples onto a stainless steel plate to collect a measurable amount of permeated water though PCGO membrane. The typical cross-sectional area and permeation length of the PCGO samples in this experiment was 0.3 cm2 and 3 mm, respectively. The PCGO membranes assembly was then fixed inside the stirred cell using a rubber gasket to avoid any possible leakage in the experiment. We have used pure water as a feed solution and collected the water on other side by applying a pressure of 15 bar using a compressed nitrogen gas cylinder. Water permeance was found to be ≈ 0.5-1.0 L/h×m2×bar, which is roughly in agreement with the value obtained from the gravimetric measurements (≈ 4 times smaller). Due to the difficulties of fabricating samples with such large areas for pressure filtration, systematic filtration experiments with salt water were not performed.
© 2017 Macmillan Publishers Limited, part of Springer Nature. All rights reserved.
NATURE NANOTECHNOLOGY | www.nature.com/naturenanotechnology 3
SUPPLEMENTARY INFORMATIONDOI: 10.1038/NNANO.2017.21
4
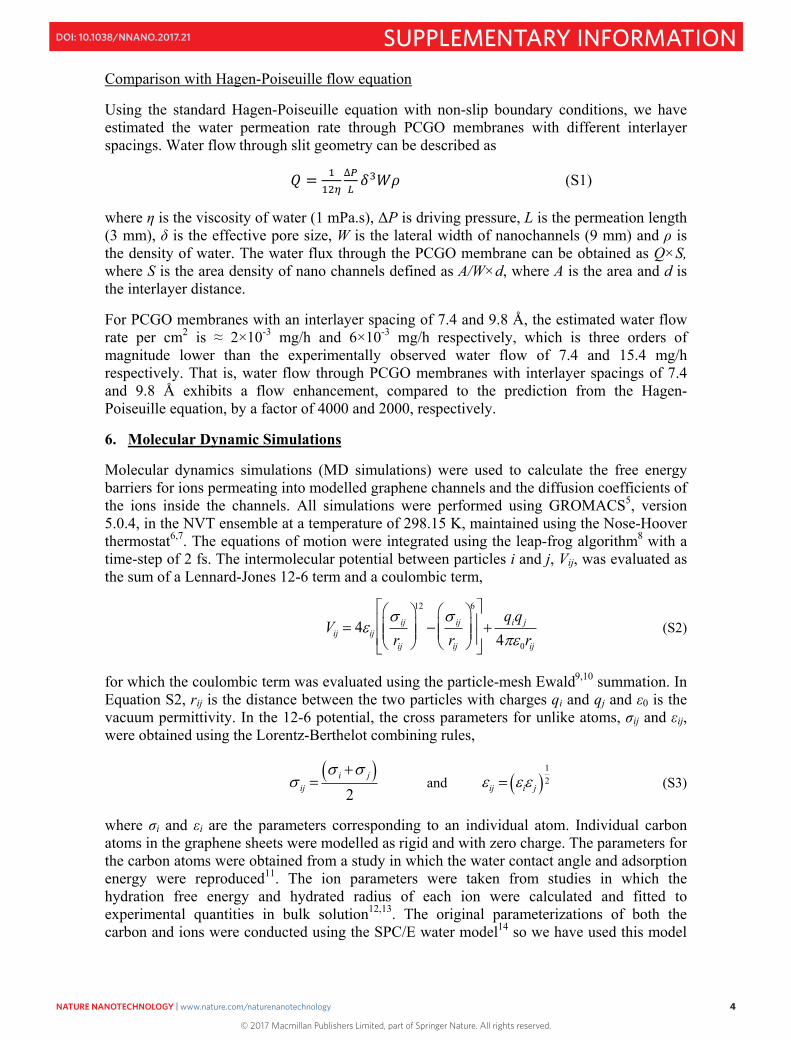
Comparison with Hagen-Poiseuille flow equation
Using the standard Hagen-Poiseuille equation with non-slip boundary conditions, we have estimated the water permeation rate through PCGO membranes with different interlayer spacings. Water flow through slit geometry can be described as
(S1)
where η is the viscosity of water (1 mPa.s), ΔP is driving pressure, L is the permeation length (3 mm), δ is the effective pore size, W is the lateral width of nanochannels (9 mm) and ρ is the density of water. The water flux through the PCGO membrane can be obtained as Q×S, where S is the area density of nano channels defined as A/W×d, where A is the area and d is the interlayer distance.
For PCGO membranes with an interlayer spacing of 7.4 and 9.8 Å, the estimated water flow rate per cm2 is ≈ 2×10⁻³ mg/h and 6×10⁻³ mg/h respectively, which is three orders of magnitude lower than the experimentally observed water flow of 7.4 and 15.4 mg/h respectively. That is, water flow through PCGO membranes with interlayer spacings of 7.4 and 9.8 Å exhibits a flow enhancement, compared to the prediction from the Hagen-Poiseuille equation, by a factor of 4000 and 2000, respectively.
6. Molecular Dynamic Simulations
Molecular dynamics simulations (MD simulations) were used to calculate the free energy barriers for ions permeating into modelled graphene channels and the diffusion coefficients of the ions inside the channels. All simulations were performed using GROMACS5, version 5.0.4, in the NVT ensemble at a temperature of 298.15 K, maintained using the Nose-Hoover thermostat6,7. The equations of motion were integrated using the leap-frog algorithm8 with a time-step of 2 fs. The intermolecular potential between particles i and j, Vij, was evaluated as the sum of a Lennard-Jones 12-6 term and a coulombic term,
(S2)
for which the coulombic term was evaluated using the particle-mesh Ewald9,10 summation. In Equation S2, rij is the distance between the two particles with charges qi and qj and ε0 is the vacuum permittivity. In the 12-6 potential, the cross parameters for unlike atoms, σij and εij, were obtained using the Lorentz-Berthelot combining rules,
and (S3)
where σi and εi are the parameters corresponding to an individual atom. Individual carbon atoms in the graphene sheets were modelled as rigid and with zero charge. The parameters for the carbon atoms were obtained from a study in which the water contact angle and adsorption energy were reproduced11. The ion parameters were taken from studies in which the hydration free energy and hydrated radius of each ion were calculated and fitted to experimental quantities in bulk solution12,13. The original parameterizations of both the carbon and ions were conducted using the SPC/E water model14 so we have used this model
Vij 4ij ij
rij
12
ij
rij
6
qiqj
40rij
ij i j
2ij i j
12
© 2017 Macmillan Publishers Limited, part of Springer Nature. All rights reserved.
NATURE NANOTECHNOLOGY | www.nature.com/naturenanotechnology 4
SUPPLEMENTARY INFORMATIONDOI: 10.1038/NNANO.2017.21

5
in our simulations. Non-bonded interactions were cutoff for rij < 1.0 nm. The full set of non-bonded interaction parameters used in the simulations is given in Table S1.
Supplementary Table 1. Non-bonded interaction parameters used in this work.
i σi (nm) εi (kJ mol−1) qi (e) C 0.3214 0.48990 0.000 K+ 0.4530 0.00061 1.000 Na+ 0.3810 0.00061 1.000 Li+ 0.2870 0.00061 1.000
Ca2+ 0.2410 0.94000 2.000 Mg2+ 0.1630 0.59000 2.000
Free Energy Barriers
The free energy barrier simulations were set up in a similar manner as described in much greater detail in our previous simulations15. Briefly, this consists of five layers of graphene sheets, centered in the x-direction and stacked parallel in the z-direction, with an interlayer spacing of 7, 8, 9, 10 and 11 Å. The interlayer space and adjoining reservoirs were filled with water molecules. A single ion (either Li+, Na+, K+, Mg2+ or Ca2+) was then swapped for one of the water molecules in the left-hand reservoir to generate the initial configuration (Supplementary Fig. 5).
Supplementary Fig. 5. Free energy barrier simulations. A snapshot of the simulation cell used in the free energy barrier simulations. The red sphere, blue spheres, and grey lines represent the ion, carbon atoms and water molecules, respectively. In order to obtain the energy barriers, a potential of mean force (PMF) describing the process of the ion entering the model membrane was generated for every ion and interlayer spacing. This was calculated using an umbrella sampling procedure16,17 involving 50 separate simulations, spanning the distance from the center of the reservoir (x = 0.1 nm) to the center of the channel (x = 2.5 nm), at 0.05 nm intervals. In each simulation, the position of the ion in the x direction was restrained using a harmonic potential with a force constant of 5000 kJ mol−1 nm−2. After an initial equilibration period of 1 ns, the PMF was generated from the force data obtained in a further 4 ns of simulation time, using the weighted histogram analysis method18,19. The maximum energy along the PMF profile is equal to the barrier to permeation. In all cases, the observed barriers are positive, indicating that this process is
© 2017 Macmillan Publishers Limited, part of Springer Nature. All rights reserved.
NATURE NANOTECHNOLOGY | www.nature.com/naturenanotechnology 5
SUPPLEMENTARY INFORMATIONDOI: 10.1038/NNANO.2017.21
6
energetically unfavorable. In general, the barrier height increases as the interlayer spacing decreases and, in the narrowest capillaries, the barriers are considerably larger for divalent ions than monovalent ions. Fig. 3c inset in the main text and supplementary Table 2 show the free energy barriers for every ion obtained for different interlayer spacing. Supplementary Table 2. Free energy barriers to ion permeation into graphene capillaries (kJ mol−1). The number in brackets is the uncertainty in the size of the barrier.
Ion Interlayer Spacing (Å) 7 8 9 10 11
K+ 27.5(0.6) 17.4(0.3) 10.8(0.3) 5.6(0.2) 5.6(0.3) Na+ 22.0(1.1) 15.9(0.3) 5.3(0.4) 5.0(0.3) 5.3(0.3) Li+ 24.7(1.3) 8.5(0.3) 4.5(0.4) 3.2(0.3) 1.8(0.2)
Ca2+ 163.5(1.0) 60.3(0.4) 3.9(0.3) 5.5(0.4) 6.7(0.4) Mg2+ 197.8(2.2) 44.3(0.5) 4.6(0.3) 3.9(0.4) 5.4(0.4)
The observed trends in barrier energy suggest that the size of the barrier is related to the hydration free energy. The higher charge on divalent ions results in stronger electrostatic attraction between the ion and the surrounding water, and the strength of these interactions is reflected in the magnitude of their experimental hydration free energies (see Supplementary Table 3)20,21. Hence, ions with the most negative hydration free energies have the largest barriers to permeation, consistent with permeation data obtained experimentally.
Supplementary Table 3. Experimental hydration free energy of different ions taken from Ref. 2.
Ion Hydration free energy (kJ/mol)
K+
Na+
Li+
Ca2+
-321 -405 -515
-1592 Mg2+ -1922
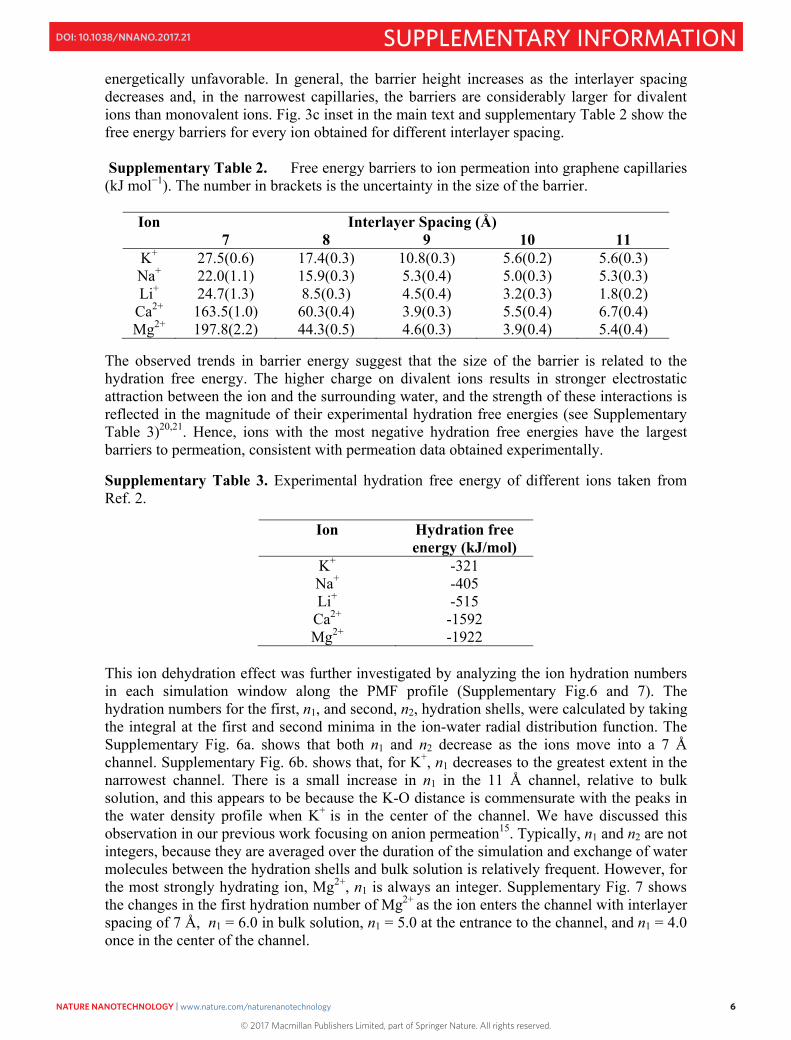
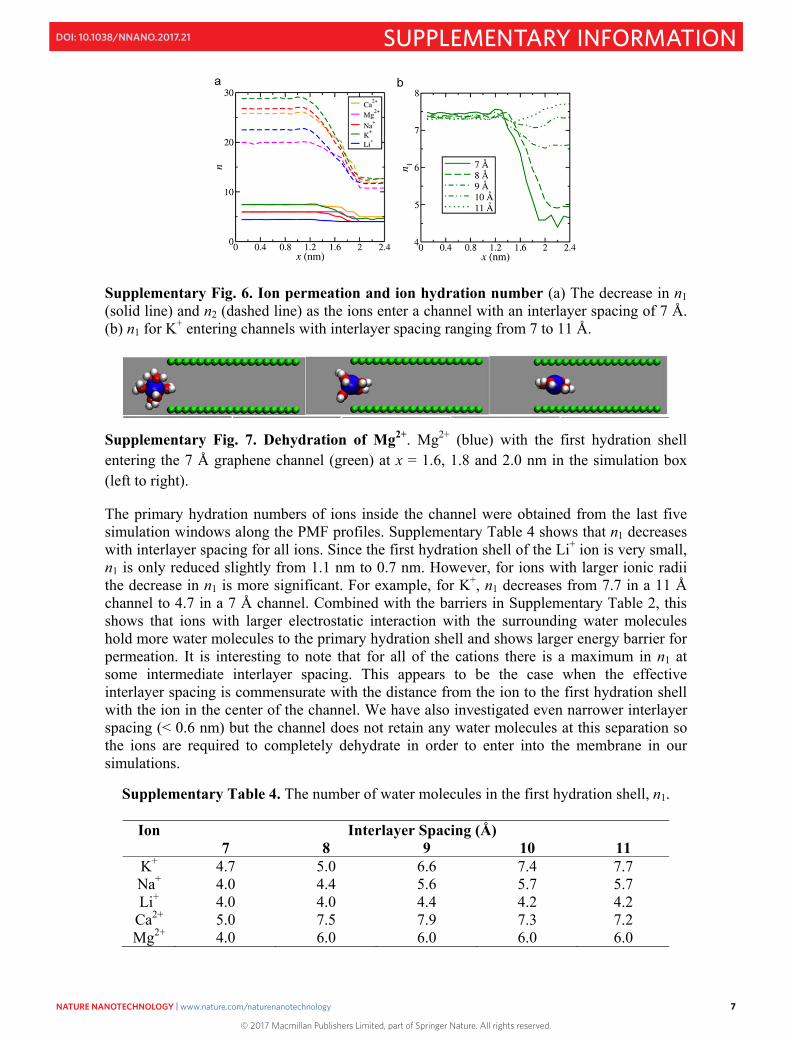
This ion dehydration effect was further investigated by analyzing the ion hydration numbers in each simulation window along the PMF profile (Supplementary Fig.6 and 7). The hydration numbers for the first, n1, and second, n2, hydration shells, were calculated by taking the integral at the first and second minima in the ion-water radial distribution function. The Supplementary Fig. 6a. shows that both n1 and n2 decrease as the ions move into a 7 Å channel. Supplementary Fig. 6b. shows that, for K+, n1 decreases to the greatest extent in the narrowest channel. There is a small increase in n1 in the 11 Å channel, relative to bulk solution, and this appears to be because the K-O distance is commensurate with the peaks in the water density profile when K+ is in the center of the channel. We have discussed this observation in our previous work focusing on anion permeation15. Typically, n1 and n2 are not integers, because they are averaged over the duration of the simulation and exchange of water molecules between the hydration shells and bulk solution is relatively frequent. However, for the most strongly hydrating ion, Mg2+, n1 is always an integer. Supplementary Fig. 7 shows the changes in the first hydration number of Mg2+ as the ion enters the channel with interlayer spacing of 7 Å, n1 = 6.0 in bulk solution, n1 = 5.0 at the entrance to the channel, and n1 = 4.0 once in the center of the channel.
© 2017 Macmillan Publishers Limited, part of Springer Nature. All rights reserved.
NATURE NANOTECHNOLOGY | www.nature.com/naturenanotechnology 6
SUPPLEMENTARY INFORMATIONDOI: 10.1038/NNANO.2017.21
7
Supplementary Fig. 6. Ion permeation and ion hydration number (a) The decrease in n1 (solid line) and n2 (dashed line) as the ions enter a channel with an interlayer spacing of 7 Å. (b) n1 for K+ entering channels with interlayer spacing ranging from 7 to 11 Å.
Supplementary Fig. 7. Dehydration of Mg2+. Mg2+ (blue) with the first hydration shell entering the 7 Å graphene channel (green) at x = 1.6, 1.8 and 2.0 nm in the simulation box (left to right).
The primary hydration numbers of ions inside the channel were obtained from the last five simulation windows along the PMF profiles. Supplementary Table 4 shows that n1 decreases with interlayer spacing for all ions. Since the first hydration shell of the Li+ ion is very small, n1 is only reduced slightly from 1.1 nm to 0.7 nm. However, for ions with larger ionic radii the decrease in n1 is more significant. For example, for K+, n1 decreases from 7.7 in a 11 Å channel to 4.7 in a 7 Å channel. Combined with the barriers in Supplementary Table 2, this shows that ions with larger electrostatic interaction with the surrounding water molecules hold more water molecules to the primary hydration shell and shows larger energy barrier for permeation. It is interesting to note that for all of the cations there is a maximum in n1 at some intermediate interlayer spacing. This appears to be the case when the effective interlayer spacing is commensurate with the distance from the ion to the first hydration shell with the ion in the center of the channel. We have also investigated even narrower interlayer spacing (< 0.6 nm) but the channel does not retain any water molecules at this separation so the ions are required to completely dehydrate in order to enter into the membrane in our simulations.
Supplementary Table 4. The number of water molecules in the first hydration shell, n1.
Ion Interlayer Spacing (Å) 7 8 9 10 11
K+ 4.7 5.0 6.6 7.4 7.7 Na+ 4.0 4.4 5.6 5.7 5.7 Li+ 4.0 4.0 4.4 4.2 4.2
Ca2+ 5.0 7.5 7.9 7.3 7.2 Mg2+ 4.0 6.0 6.0 6.0 6.0
© 2017 Macmillan Publishers Limited, part of Springer Nature. All rights reserved.
NATURE NANOTECHNOLOGY | www.nature.com/naturenanotechnology 7
SUPPLEMENTARY INFORMATIONDOI: 10.1038/NNANO.2017.21

8
All the above calculations have been performed on pristine graphene capillary. Therefore to clarify the role of oxidized regions on the permeation mechanism we have carried out free energy calculations with a deprotonated OH group (the parameters for the oxygen atom, q = -0.6400 C, = 0.307 nm, = 0.65 kJ/mol were taken from Ref. 22) attached to the carbon atom at the center of the nanochannel with an interlayer spacing of 8 Å. The resulting free energy barrier for K+ ions turns out to be ~15 kJ/mol similar to that of the pristine channel (17.4 kJ/mol), confirming the dominant importance of the interlayer spacing rather than the chemical functionality for the proposed dehydration mechanism. Diffusion coefficient of ions inside the sub-nm channels
To calculate the ion’s diffusion coefficient, D, within the capillary, two graphene sheets with dimensions 6.14 nm x 6.14 nm and interlayer spacing ranging from 7 to 11 Å were used. In this case, unlike the free energy barrier calculations, only one periodic channel was set up, providing an effectively infinitely long 2D capillary for ion diffusion. The density of the water inside the capillary was set up equal to the value obtained from the free energy barrier calculations where the water filled the channel and reached different equilibrium densities as a function of interlayer spacing. After a short equilibration simulation, a single water molecule was exchanged for the ion of interest. Extended simulation runs of 100 ns were used to calculate the mean squared displacement of the ion, and this was used to obtain D the from the Einstein relation
Dttrttr ii 6)()( 200 (S4)
where ri is the position of the particle at time t0 + t or t0 and the angled brackets denote ensemble averaging. As well as these simulations, we also calculated the diffusion coefficient of K+ in an unconfined box of water molecules (bulk), in order to validate the employed parameters. In this case, the simulation box was cubic, with a side length of 7.5 nm and the simulation was run for 10 ns, using only the final 9 ns in the calculation of D. In the unconfined system, we obtained D = 1.60 × 10⁻⁵ cm2 s−1, which agrees reasonably well with the experimental bulk diffusion coefficient of 1.96 × 10⁻⁵ cm2 s−1 23. This shows that our choice of interaction parameters for both the water and K+ ions produce diffusion coefficient in reasonable agreement with experiment, despite dynamic properties not featuring in the original parameterization of the ion – water intermolecular potential.
In the channel, D is reduced relative to the bulk simulation (see supplementary Fig. 8). The difference in diffusion coefficient between bulk and the 8 to 11 Å channel is due to the limited diffusion perpendicular to the graphene sheets. Once the interlayer spacing is reduced below 8 Å, diffusion of K+ is further reduced relative to the bulk; K+ is only able to move within the plane of the single water monolayer at these interlayer spacings. The decrease in D is however modest compared to the decrease in permeation rates observed experimentally. Thus the exponential decrease in the experimental permeation rate with interlayer spacing cannot be explained by the diffusion-limited permeation. This further suggests that the free energy barrier associated with dehydration is the dominant parameter for the ion permeation in our sub-nm capillaries.
© 2017 Macmillan Publishers Limited, part of Springer Nature. All rights reserved.
NATURE NANOTECHNOLOGY | www.nature.com/naturenanotechnology 8
SUPPLEMENTARY INFORMATIONDOI: 10.1038/NNANO.2017.21

9
Supplementary Fig. 8. Ion diffusion through sub-nm channels. Diffusion coefficient of K+ ion in water for interlayer spacing ranging from 7 Å to 11 Å. Finally, to completely rule out the diffusion contribution on the experimentally observed ion permeation, we have calculated the capillary diffusion activation energies (Ea) of the K+ ion for interlayer distances of 10, 8 and 7 Å by measuring the ion diffusion coefficient at different temperatures (T). Supplementary Fig. 9 shows that the diffusion process can be described by an Arrhenius relationship from which we can extract Ea. The extracted values of Ea are 15.3 ± 0.4, 12.9 ± 0.3 and 17.7 ± 0.9 kJ mol-1 for the interlayer distance 10, 8, and 7 Å, respectively. These values show that Ea is relatively unchanged with interlayer spacing (while the measured barrier increased significantly with decreasing d), hence diffusion cannot explain the experimentally observed ion selectivity in sub-nm channels in PCGO membranes.
Supplementary Fig. 9. Diffusion activation energy estimation. Temperature dependence of D calculated for K+ inside a channel of 10, 8, and 7 Å interlayer spacing (Y-axis - natural log scale). The dashed lines are the best fit to calculate the activation energy.
Permeation rate calculations To further demonstrate the effect of dehydration on ion permeation rates we have calculated the permeation rate of K+ and Mg2+ through a channel with an interlayer spacing of 8 Å. The simulations followed a similar set-up of that used to calculate the energy barrier for ion entry into the channel (Fig S5), except the reservoir of water was larger to allow a concentration of 0.61 mol dm-3 of KCl and MgCl2. As at such interlayer spacings there is a large energy
© 2017 Macmillan Publishers Limited, part of Springer Nature. All rights reserved.
NATURE NANOTECHNOLOGY | www.nature.com/naturenanotechnology 9
SUPPLEMENTARY INFORMATIONDOI: 10.1038/NNANO.2017.21

10
barrier associated with the entering of the ions into the channel (Table S2), we do not observe ion permeation over the typical timescale of a simulation. Therefore to calculate the ion permeation rates, a pressure difference of 10 MPa was applied across the simulation cell by adding a constant force on all of the atoms in the simulation box along the direction of the channel, except on those belonging to the graphene sheets24-27. During the simulations the temperature was maintained constant at 298.15 K. The interaction parameters for ion, water and graphene atoms were taken the same as the previous simulations. The ion permeation rate was determined by counting the net number of ions that pass from the left to the right reservoir. These simulations were performed for 20 ns, using only the last 15 ns for analysis. The number of K+ and Mg2+ ions permeating through the channel has been plotted against time in Fig. 10. This plot clearly shows that the number of K+ ions that permeate through the channel is more than that of Mg2+ ions and from this, we have calculated a permeation rate for K+ and Mg2+ ions of 1.802(± 0.006) x 109 ions s-1 and 0.286(± 0.002) x 109 ions s-1. Not surprisingly, these calculated rates are much higher than the experimental values due to the pressure difference applied. However, they clearly show that permeation into the channel is easier for ions with smaller free energy barrier.
Supplementary Fig. 10. Estimation of Ion permeation rate. Number of ions permeating through a 8 Å channel during the simulation for Mg2+ and K+ with a 10 MPa driving pressure along the channel. 7. Swelling-controlled graphene oxide-graphene (GO-Gr)membranes
On its own, water is a poor solvent for the exfoliation of graphite, whereas surfactant-water solutions can exfoliate graphite to produce stable aqueous dispersions of graphene28. Graphene oxide (GO) has previously been suggested as a 2D-surfactant to prepare stable dispersions of graphite and carbon nanotubes (CNTs) in water29,30. Here, graphene oxide-graphene (GO-Gr) aqueous dispersions were prepared by exfoliating graphite in water using GO as a surfactant. We have prepared four different concentrations of GO-Gr aqueous dispersions by varying the initial weight of bulk graphite with respect to that of graphite oxide. The graphite oxide to graphite weight ratio was maintained as 1:1, 1:2, 1:5 and 1:9, i.e., four different amounts of graphite (0.175 g, 0.35 g, 0.875 g and 1.575 g) were sonicated for 50 hrs in 120 ml of DI water in the presence of 0.175 g graphite oxide. Resulting GO-Gr dispersion was centrifuged twice for 25 mins at 2500 rpm to remove the unexfoliated graphite and unstable aggregates.
© 2017 Macmillan Publishers Limited, part of Springer Nature. All rights reserved.
NATURE NANOTECHNOLOGY | www.nature.com/naturenanotechnology 10
SUPPLEMENTARY INFORMATIONDOI: 10.1038/NNANO.2017.21
11
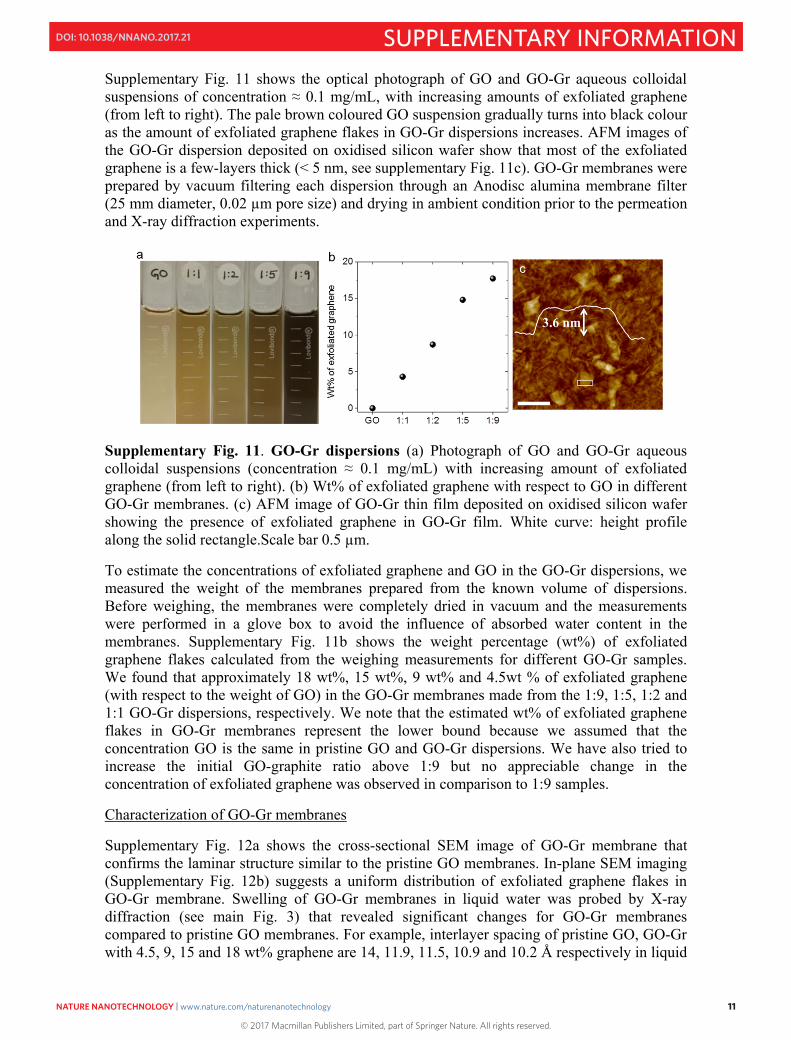
Supplementary Fig. 11 shows the optical photograph of GO and GO-Gr aqueous colloidal suspensions of concentration ≈ 0.1 mg/mL, with increasing amounts of exfoliated graphene (from left to right). The pale brown coloured GO suspension gradually turns into black colour as the amount of exfoliated graphene flakes in GO-Gr dispersions increases. AFM images of the GO-Gr dispersion deposited on oxidised silicon wafer show that most of the exfoliated graphene is a few-layers thick (< 5 nm, see supplementary Fig. 11c). GO-Gr membranes were prepared by vacuum filtering each dispersion through an Anodisc alumina membrane filter (25 mm diameter, 0.02 µm pore size) and drying in ambient condition prior to the permeation and X-ray diffraction experiments.
Supplementary Fig. 11. GO-Gr dispersions (a) Photograph of GO and GO-Gr aqueous colloidal suspensions (concentration ≈ 0.1 mg/mL) with increasing amount of exfoliated graphene (from left to right). (b) Wt% of exfoliated graphene with respect to GO in different GO-Gr membranes. (c) AFM image of GO-Gr thin film deposited on oxidised silicon wafer showing the presence of exfoliated graphene in GO-Gr film. White curve: height profile along the solid rectangle.Scale bar 0.5 µm.
To estimate the concentrations of exfoliated graphene and GO in the GO-Gr dispersions, we measured the weight of the membranes prepared from the known volume of dispersions. Before weighing, the membranes were completely dried in vacuum and the measurements were performed in a glove box to avoid the influence of absorbed water content in the membranes. Supplementary Fig. 11b shows the weight percentage (wt%) of exfoliated graphene flakes calculated from the weighing measurements for different GO-Gr samples. We found that approximately 18 wt%, 15 wt%, 9 wt% and 4.5wt % of exfoliated graphene (with respect to the weight of GO) in the GO-Gr membranes made from the 1:9, 1:5, 1:2 and 1:1 GO-Gr dispersions, respectively. We note that the estimated wt% of exfoliated graphene flakes in GO-Gr membranes represent the lower bound because we assumed that the concentration GO is the same in pristine GO and GO-Gr dispersions. We have also tried to increase the initial GO-graphite ratio above 1:9 but no appreciable change in the concentration of exfoliated graphene was observed in comparison to 1:9 samples.
Characterization of GO-Gr membranes
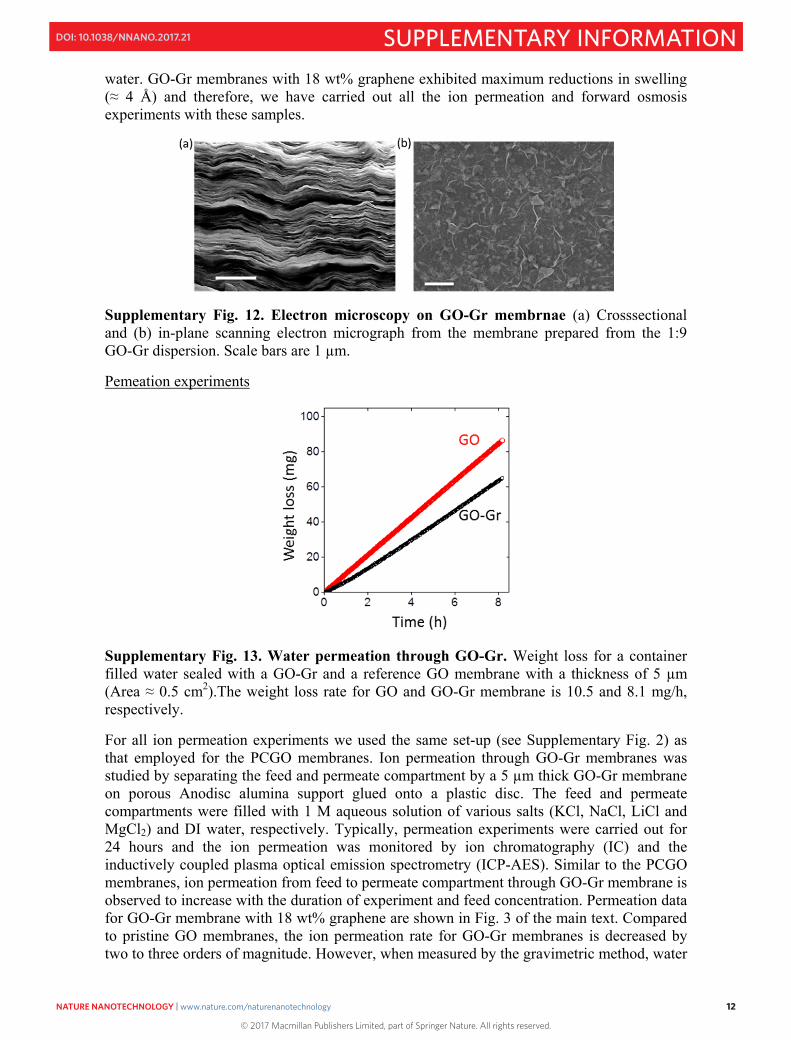
Supplementary Fig. 12a shows the cross-sectional SEM image of GO-Gr membrane that confirms the laminar structure similar to the pristine GO membranes. In-plane SEM imaging (Supplementary Fig. 12b) suggests a uniform distribution of exfoliated graphene flakes in GO-Gr membrane. Swelling of GO-Gr membranes in liquid water was probed by X-ray diffraction (see main Fig. 3) that revealed significant changes for GO-Gr membranes compared to pristine GO membranes. For example, interlayer spacing of pristine GO, GO-Gr with 4.5, 9, 15 and 18 wt% graphene are 14, 11.9, 11.5, 10.9 and 10.2 Å respectively in liquid
© 2017 Macmillan Publishers Limited, part of Springer Nature. All rights reserved.
NATURE NANOTECHNOLOGY | www.nature.com/naturenanotechnology 11
SUPPLEMENTARY INFORMATIONDOI: 10.1038/NNANO.2017.21
12
water. GO-Gr membranes with 18 wt% graphene exhibited maximum reductions in swelling (≈ 4 Å) and therefore, we have carried out all the ion permeation and forward osmosis experiments with these samples.
Supplementary Fig. 12. Electron microscopy on GO-Gr membrnae (a) Crosssectional and (b) in-plane scanning electron micrograph from the membrane prepared from the 1:9 GO-Gr dispersion. Scale bars are 1 µm.
Pemeation experiments
Supplementary Fig. 13. Water permeation through GO-Gr. Weight loss for a container filled water sealed with a GO-Gr and a reference GO membrane with a thickness of 5 µm (Area ≈ 0.5 cm2).The weight loss rate for GO and GO-Gr membrane is 10.5 and 8.1 mg/h, respectively.
For all ion permeation experiments we used the same set-up (see Supplementary Fig. 2) as that employed for the PCGO membranes. Ion permeation through GO-Gr membranes was studied by separating the feed and permeate compartment by a 5 µm thick GO-Gr membrane on porous Anodisc alumina support glued onto a plastic disc. The feed and permeate compartments were filled with 1 M aqueous solution of various salts (KCl, NaCl, LiCl and MgCl2) and DI water, respectively. Typically, permeation experiments were carried out for 24 hours and the ion permeation was monitored by ion chromatography (IC) and the inductively coupled plasma optical emission spectrometry (ICP-AES). Similar to the PCGO membranes, ion permeation from feed to permeate compartment through GO-Gr membrane is observed to increase with the duration of experiment and feed concentration. Permeation data for GO-Gr membrane with 18 wt% graphene are shown in Fig. 3 of the main text. Compared to pristine GO membranes, the ion permeation rate for GO-Gr membranes is decreased by two to three orders of magnitude. However, when measured by the gravimetric method, water
© 2017 Macmillan Publishers Limited, part of Springer Nature. All rights reserved.
NATURE NANOTECHNOLOGY | www.nature.com/naturenanotechnology 12
SUPPLEMENTARY INFORMATIONDOI: 10.1038/NNANO.2017.21

13
permeation (see supplementary section 5) only showed an approximately 20% reduction with respect to that of pristine GO (supplementary Fig. 13). The relatively small decrease in water permeation and the large decrease in ion permeation through GO-Gr compared to pristine GO membrane confirm that the permeation mechanism for both PCGO and GO-Gr membranes are similar.
To further understand the liquid water flux and salt rejection properties of GO-Gr membranes, we have performed forward osmosis (FO)31,32 experiments. FO is relatively a new alternative technology to the conventional pressure-driven reverse osmosis (RO) membrane process, where hydraulic pressure is not required for its operation31,32. In FO, a concentrated solution of a salt or other molecules (draw solution) is used to generate high osmotic pressure, which pulls the water molecules across a semi-permeable membrane from the low-concentration salt solution (feed solution), effectively filtering the feed water. The draw solute can then be separated from the diluted draw solution to produce clean water. FO has many advantages over conventional RO such as high energy efficiency and low fouling and is considered to be an attractive emerging technology for desalination. The absence of hydraulic pressure in FO makes it highly suitable to evaluate GO-Gr membranes as they have relatively weak mechanical strength. Here, we have performed FO by filling equal volumes (25 mL) of 0.1 M NaCl feed solution and 3 M sucrose draw solution in the feed and permeate compartments, respectively, separated by a GO-Gr membrane (5 µm thick and 0.5 cm2 area). Nearly 3 M differential concentration leads to a ≈ 75 bar osmotic pressure gradient, which draws water molecules from the NaCl compartment to the sucrose compartment. The amount of water permeation was reflected in the height of sucrose column in the permeate compartment. The observed 0.8 mL increase in the column height over 30 hours corresponds to a water flux of around 0.5 L/m2×h. Salt rejection for GO-Gr membrane was estimated by measuring the amount of NaCl in the draw solution. The salt rejection rate was estimated as 1-Cd/Cf, where Cd and Cf are the concentrations of NaCl in the draw solution and the feed side, respectively. This yielded a rejection rate of ≈ 97%. For comparison, we have also performed similar FO experiments with pristine GO membranes and the obtained water flux and salt rejection are found to be 0.6 L/m2×h and 60%, respectively. We note that the water flux through GO-Gr membranes is lower than typical FO membranes however it can be improved effectively by decreasing the thickness of GO-Gr membranes. For example, decreasing the GO-Gr membrane thickness from 5 µm to 1 µm yielded the water flux of 2.5 L/m2×h with 94% salt rejection.
Supplementary References
1. Joshi, R. K. et al. Precise and ultrafast molecular sieving through graphene oxide membranes. Science 343, 752-754 (2014).
2. Tansel, B. Significance of thermodynamic and physical characteristics on permeation of ions during membrane separation: Hydrated radius, hydration free energy and viscous effects. Sep. Purif. Technol. 86, 119-126 (2012).
3. Marcus, Y. Ionic-Radii in Aqueous-Solutions. J. Solution Chem. 12, 271-275 (1983). 4. Nair, R. R., Wu, H. A., Jayaram, P. N., Grigorieva, I. V. & Geim, A. K. Unimpeded
permeation of water through helium-leak-tight graphene-based membranes. Science 335, 442-444 (2012).
5. Van der Spoel, D. et al. GROMACS: Fast, flexible, and free. J Comput Chem. 26, 1701-1718 (2005).
6. Nose, S. A molecular-dynamics method for simulations in the canonical ensemble. Mol. Phys. 52, 255-268 (1984).
© 2017 Macmillan Publishers Limited, part of Springer Nature. All rights reserved.
NATURE NANOTECHNOLOGY | www.nature.com/naturenanotechnology 13
SUPPLEMENTARY INFORMATIONDOI: 10.1038/NNANO.2017.21

14
7. Hoover, W. G. Canonical dynamics - equilibrium phase-space distributions. Phys. Rev. A 31, 1695-1697 (1985).
8. Allen, M. P. & Tildesley, D. J. Computer simulation of liquids. (Oxford Univ. Press, Oxford, 1987).
9. Darden, T., York, D. & Pedersen, L. Particle mesh Ewald - an N.Log(N) method for Ewald sums in large systems. J. Chem. Phys. 98, 10089-10092 (1993).
10. Essmann, U. et al. A smooth particle mesh Ewald method. J. Chem. Phys. 103, 8577-8593 (1995).
11. Werder, T., Walther, J. H., Jaffe, R. L., Halicioglu, T. & Koumoutsakos, P. On the water-carbon interaction for use in molecular dynamics simulations of graphite and carbon nanotubes. J. Phys. Chem. B 107, 1345-1352 (2003).
12. Horinek, D., Mamatkulov, S. I. & Netz, R. R. Rational design of ion force fields based on thermodynamic solvation properties. J. Chem. Phys. 130, 124507 (2009).
13. Mamatkulov, S., Fyta, M. & Netz, R. R. Force fields for divalent cations based on single-ion and ion-pair properties. J. Chem. Phys. 138, 024505 (2013).
14. Berendsen, H. J. C., Grigera, J. R. & Straatsma, T. P. The missing term in effective pair potentials. J. Phys. Chem. 91, 6269-6271 (1987).
15. Williams, C. D. & Carbone, P. Selective removal of technetium from water using graphene oxide membranes. Environ. Sci. Technol. 50, 3875-3881 (2016).
16. Torrie, G. M. & Valleau, J. P. Monte-Carlo free-energy estimates using non-Boltzmann sampling - application to subcritical Lennard-Jones fluid. Chem. Phys. Lett. 28, 578-581 (1974).
17. Torrie, G. M. & Valleau, J. P. Non-physical sampling distributions in Monte-Carlo free-energy estimation - umbrella sampling. J. Comput. Phys. 23, 187-199 (1977).
18. Kumar, S., Bouzida, D., Swendsen, R. H., Kollman, P. A. & Rosenberg, J. M. The weighted histogram analysis method for free-energy calculations on biomolecules .1. The method. J. Comput. Chem. 13, 1011-1021 (1992).
19. Hub, J. S., de Groot, B. L. & van der Spoel, D. g_wham-A free weighted histogram analysis implementation including robust error and autocorrelation estimates. J. Chem. Theory Comput. 6, 3713-3720 (2010).
20. Marcus, Y. Thermodynamics of solvation of ions .5. Gibbs free-energy of hydration at 298.15 K. J. Chem. Soc. Faraday T 87, 2995-2999 (1991).
21. Tissandier, M. D. et al. The proton's absolute aqueous enthalpy and Gibbs free energy of solvation from cluster ion solvation data. J. Phys. Chem. A 102, 7787-7794 (1998).
22. Birkett, G. R. & Do, D. D. Simulation study of water adsorption on carbon black: The effect of graphite water interaction strength. J. Phys. Chem. C 111, 5735-5742 (2007).
23. Marcus, Y. Ion properties. (Dekker, 1997). 24. Corry, B. Designing carbon nanotube membranes for efficient water desalination. J.
Phys. Chem. B 112, 1427-1434 (2008). 25. Corry, B. Water and ion transport through functionalised carbon nanotubes:
implications for desalination technology. Energy Environ. Sci.4, 751-759 (2011). 26. Zhu, F.,Tajkhorshid, E. & Schulten, K. Pressure-induced water transport in membrane
channels studied by molecular dynamics. Biophys. J. 83, 154-160 (2002). 27. Zhu, F.,Tajkhorshid, E. & Schulten, K. Theory and simulation of water permeation in
aquaporin-1. Biophys. J. 86, 50-57 (2004). 28. Lotya, M. et al. Liquid phase production of graphene by exfoliation of graphite in
surfactant/water solutions. J. Am. Chem. Soc. 131, 3611-3620 (2009). 29. Kim, J. et al. Graphene oxide sheets at interfaces. J. Am. Chem. Soc. 132, 8180-8186
(2010).
© 2017 Macmillan Publishers Limited, part of Springer Nature. All rights reserved.
NATURE NANOTECHNOLOGY | www.nature.com/naturenanotechnology 14
SUPPLEMENTARY INFORMATIONDOI: 10.1038/NNANO.2017.21
15
30. Luo, J. Y. et al. Graphene oxide nanocolloids. J. Am. Chem. Soc. 132, 17667-17669 (2010).
31. Cath, T. Y., Childress, A. E. & Elimelech, M. Forward osmosis: Principles, applications, and recent developments. J. Membrane Sci. 281, 70-87 (2006).
32. Zhao, S. F., Zou, L., Tang, C. Y. Y. & Mulcahy, D. Recent developments in forward osmosis: Opportunities and challenges. J. Membrane Sci. 396, 1-21 (2012).
© 2017 Macmillan Publishers Limited, part of Springer Nature. All rights reserved.
NATURE NANOTECHNOLOGY | www.nature.com/naturenanotechnology 15
SUPPLEMENTARY INFORMATIONDOI: 10.1038/NNANO.2017.21