Embed Size (px)
Citation preview

Persistent link: http://hdl.handle.net/2345/727
This work is posted on eScholarship@BC,Boston College University Libraries.
Boston College Electronic Thesis or Dissertation, 2009
Copyright is held by the author, with all rights reserved, unless otherwise noted.
Analyzing Turkey's Data from TIMSS2007 to Investigate Regional Disparitiesin Eighth Grade Science Achievement
Author: Ebru Erberber

BOSTON COLLEGE
Lynch School of Education
Department of Educational Research, Measurement, and Evaluation
ANALYZING TURKEY’S DATA FROM TIMSS 2007 TO
INVESTIGATE REGIONAL DISPARITIES
IN EIGHTH GRADE SCIENCE ACHIEVEMENT
Dissertation by
EBRU ERBERBER
submitted in partial fulfillment of the requirements for the degree of
Doctor of Philosophy
August 2009

© Copyright by Ebru Erberber
2009

Abstract
Analyzing Turkey’s Data from TIMSS 2007 to Investigate Regional Disparities in
Eighth Grade Science Achievement
Dissertation by Ebru Erberber
Advisor: Ina V.S. Mullis, Ph.D.
Turkey is expected to be a full member of the European Union (EU) by 2013. In
the course of its integration into the EU, Turkey has been simultaneously facing access,
quality, and equity issues in education. Over the past decade, substantial progress has
been made on increasing the access. However, improving the country’s low level of
education quality and achieving equity in quality education across the regions continue to
be a monumental challenge in Turkey. Most recently, results from the Trends in
International Mathematics and Science Study (TIMSS) 2007 indicated that Turkey’s
educational achievement at the eighth grade, the end of compulsory primary education in
Turkey, was far below that of other countries in the EU. Considering Turkey’s long
standing socioeconomic disparities between the western and eastern parts of the country,
the challenges of improving overall education quality are coupled with the challenges of
achieving equity in learning outcomes for students across the regions.

This dissertation used data from TIMSS 2007 to document the extent of Turkey’s
regional differences in science achievement at the eighth grade and to investigate factors
associated with these differences. Findings from a series of analyses using hierarchical
linear models suggested that attempts to increase Turkish students’ achievement and
close the achievement gaps between regions should target the students in the undeveloped
regions, particularly in Southeastern Anatolia and Eastern Anatolia. Designing
interventions to improve competency in Turkish and to compensate for the shortcomings
of insufficient parental education, limited home educational resources, poor school
climate for academic achievement, and inadequate instructional equipment and facilities
might be expected to close the regional achievement gaps as well as raise the overall
achievement level in Turkey.

To my parents: Ali and Veliye Erberber

Acknowledgements
I owe my gratitude to many people who supported me throughout the process of
this dissertation study. I would like to express my deepest gratitude to my dissertation
advisor, Dr. Ina Mullis, and the readers Dr. Michael Martin and Dr. Mike Barnett for
their continuous encouragement and guidance. I am thankful to both Dr. Mullis and Dr.
Martin for tirelessly reading and commenting on countless revisions of this dissertation.
They challenged me intellectually, never allowed me to get lost in the forest among the
multitude of trees, and helped me to make my research more robust and meaningful —for
this I am truly grateful. Dr. Barnett generously provided his time, expertise, and helpful
comments and suggestions in every step of this endeavor. I am also thankful to Dr. Laura
O'Dwyer for her excellent teaching of Hierarchical Linear Modeling, which was an
essential tool for my research.
Other members of the Boston College community have been incredibly
supportive of me throughout my graduate studies. Very special thanks go to Cengiz
Gulek to whom I will be forever grateful. From the very early stages of my graduate
studies, he opened the doors of his welcoming house and friendship, which was greatly
needed when I first landed in Boston. Also, I greatly value the friendship and the
emotional and intellectual support that Selcuk Sirin and Kathleen O’Connor generously
offered me during this endeavor. I am indebted to my friends Kathy Rhoades and
Gabrielle Stanco for editing my earlier drafts, offering prompt and motivating comments,
conveying their comments in the kindest way possible, and celebrating the completion of
each draft over delicious meals and warm conversation. I also deeply appreciate the
support and encouragement of my fellow graduate students Dana Diaconu and Carolyn
Fidelman. Their friendship has been invaluable.
i

I am fortunate to have had the opportunity to work with my friends and colleagues
at the TIMSS & PIRLS International Study Center while pursuing my doctoral program
at Boston College. I am proud to be a part of these unique international projects and the
amazing research team carrying them out. Kathleen Trong and Ann Kennedy offered
their insightful feedback that kept me on track when there were bumps along the road.
Mario Pita and Isaac Li assisted me whenever I was stuck in formatting my files or
preparing my figures. Corinna Preuschoff, Pierre Foy, and Joe Galia provided me their
inspirational thoughts regarding the methods used for this study. I would like to extend
my thanks to Eugenio Gonzalez from the IEA-ETS Research Institute. Whenever I
requested his expertise, he always made time for me between endless meetings.
Gul Unal, my best friend, has been a gift to me since we met two decades ago. I
am truly grateful for her presence in my life as we shared the joys and pains of going to
college hundreds of miles away from home and pursuing graduate studies thousands of
miles away from home. I would also like to thank my brother, Emre Erberber, my sister-
in-law, Sebnem Erberber, and my wonderful nephew and niece, Kayra and Mina. They
helped me to remain connected with life outside of graduate school and provided the love
and joy that I greatly needed to tackle the challenges of doctoral studies.
This dissertation is dedicated to my parents, Ali and Veliye Erberber, who taught
me that education is the best asset one can attain. It was their unconditional love,
generous care, never-ending confidence in me, and constant prayers that gave me the
courage and strength to find my path, as well as move forward on it. I cannot thank them
enough. In the form of a rough translation of a Turkish expression, “I would forever be
indebted to them even if I carried them on my shoulders for the rest of my life”.
ii

Table of Contents
CHAPTER 1: INTRODUCTION.................................................................................... 1 Description of the Problem ...................................................................................... 2
Status of Quantity, Quality, and Equity of Education in Turkey............................ 2 Status of Regional Socioeconomic Imbalances in Turkey ..................................... 7
Purpose of the Study ................................................................................................. 9 Research Questions............................................................................................... 10
Importance of the Study ......................................................................................... 11 CHAPTER 2: LITERATURE REVIEW...................................................................... 13
Context of Primary Education in Turkey............................................................. 14
Basic Education Program...................................................................................... 19 Results from National and International Studies in Educational Achievement.... 24
Socioeconomic Inequalities Across the Regions in Turkey ................................. 29 Historical and Geographic Background................................................................ 29 Educational Resources .......................................................................................... 35
Research on Factors Associated with Science Achievement ............................... 39 Student Background Factors ................................................................................. 40
Home Background ............................................................................................ 40 Educational Aspirations and Attitudes.............................................................. 47
School Factors....................................................................................................... 52 Resources .......................................................................................................... 53 Instructional Approaches .................................................................................. 55 School Environment.......................................................................................... 58 Community Type .............................................................................................. 60
CHAPTER 3: METHODOLOGY................................................................................. 63
Description of TIMSS 2007 Database ................................................................... 64
Target Population and Sampling Implementation ................................................ 65 Science Test .......................................................................................................... 67 Scaling Method ..................................................................................................... 70 International Benchmarks of Science Achievement ............................................. 72 Background Questionnaires .................................................................................. 73
iii

Methods.................................................................................................................... 74 Phase 1: Investigation of Turkey’s Regional Differences in Achievement .......... 75 Phase 2: Investigation of Factors Contributing to Regional Differences ............. 77
Exploratory Analyses........................................................................................ 78 Constructing Composite Variables ................................................................... 79 Modeling Science Achievement in Turkey....................................................... 82
Unconditional Model .................................................................................... 83 Base Model ................................................................................................... 85 Student Background Models......................................................................... 88 School Context Models................................................................................. 90 Final Model................................................................................................... 94
CHAPTER 4: REGIONAL DIFFERENCES IN SCIENCE ACHIEVEMENT IN TURKEY AND THE INFLUENCES OF STUDENT AND SCHOOL FACTORS . 96
Describing Turkey’s Regional Differences in Science Achievement at the Eighth Grade ........................................................................................................... 97
Differences in Average Achievement................................................................... 97 Differences at the TIMSS 2007 International Benchmarks................................ 100 Comparison of Student and School Variance in Turkey .................................... 103 Regional Differences in School Achievement .................................................... 105
Explaining Turkey’s Regional Differences in Science Achievement at the Eighth Grade ......................................................................................................... 107
Identification of Factors Related to Regional Differences in Science Achievement ....................................................................................................... 108
Regional Differences in Student Background Measures Related to Science Achievement ................................................................................................... 112 Regional Differences in Effective School Contexts for Learning Science..... 126
Investigation of Factors Contributing to Regional Differences in Achievement 133 CHAPTER 5: CONCLUSIONS .................................................................................. 151
Overview of the Study .......................................................................................... 151 Findings of the Study ............................................................................................ 154 Policy Implications of the Study .......................................................................... 157 Limitations of the Study ....................................................................................... 164 Suggestions for Future Research ......................................................................... 165
REFERENCES.............................................................................................................. 168 APPENDIX: INFORMATION ABOUT STUDENT AND SCHOOL BACKGROUND VARIABLES ................................................................................... 179
iv

List of Tables
Table 2.1. Average Percent Correct by Region for Eighth Grade Turkish Students on the Science Test of OBBS 2002 and 2005.............................................................................. 27 Table 3.1. Turkey’s Sample Allocation in TIMSS 2007 at the Eighth Grade .................. 66 Table 4.1. Summary Definitions of the TIMSS 2007 International Benchmarks for Science Achievement...................................................................................................... 100 Table 4.2. Steps Involved in Modeling Regional Differences........................................ 106 Table 4.3. Base Model of TIMSS 2007 Science Achievement in Turkey...................... 107 Table 4.4. Background Factors Explored for Association with Regional Differences in Science Achievement...................................................................................................... 111 Table 4.5. Background Factors Related to Regional Differences in Science Achievement ................................................................................................................... 134 Table 4.6. Student Models of TIMSS 2007 Science Achievement in Turkey................ 137 Table 4.7. School Models of TIMSS 2007 Science Achievement in Turkey................. 139 Table 4.8. Final Model of TIMSS 2007 Science Achievement in Turkey ..................... 143 Table A.1. Information About Student Background Variables ...................................... 180 Table A.2. Information About School Context Variables .............................................. 184
v

List of Figures
Figure 1.1. Geographic Regions of Turkey ........................................................................ 7 Figure 1.2. SEDI Rankings by Regions of Turkey ............................................................. 8 Figure 2.1. Gross Schooling Ratio for Preprimary Education in 2006 in EU Member and Candidate States…………......................................................................................... 18 Figure 2.2. Gross Schooling Ratio for Preprimary Education in 2004 in Turkey and Its Regions………………………. ................................................................................... 18 Figure 2.3. Net Schooling Ratio by Academic Year for Primary Education in Turkey Since Developing the Basic Education Program .............................................................. 21 Figure 2.4. Public Expenditure on Education as a Percentage of GDP in 2004 in EU Member and Candidate States .......................................................................................... 23 Figure 2.5. Turkey’s Human Development Index by Region —1975 and 1997.............. 31 Figure 2.6. SEDI Education Sector Rankings by Regions of Turkey............................... 32 Figure 4.1. TIMSS 2007 Average Science Achievement in Turkey and Its Regions ...... 98 Figure 4.2. Percentages of Students Reaching the TIMSS 2007 International Benchmarks of Science Achievement in Turkey and Its Regions.................................. 102 Figure 4.3. Frequency of Speaking Turkish at Home in Turkey and Its Regions .......... 114 Figure 4.4. Parents’ Highest Education Level in Turkey and Its Regions...................... 116 Figure 4.5. Index of Home Resources in Turkey and Its Regions.................................. 117 Figure 4.6. High Categories of Self-confidence in Learning Science Index, Valuing Science Index, and Positive Affect Toward Science Index in Turkey and Its Regions.. 121
vi

vii
Figure 4.7. Students’ Educational Expectations in Turkey and Its Regions................... 125 Figure 4.8. School Community Type in Turkey and Its Regions ................................... 128 Figure 4.9. Index of Principals’ Reports on Positive School Climate for Academic Achievement in Turkey and Its Regions......................................................................... 130 Figure 4.10. Index of Teachers’ Reports on Adequacy of School Resources in Teaching Science in Turkey and Its Regions.................................................................. 132

Chapter 1 Introduction
Established after World War 1 less than a century ago in 1923, the secular
Turkish Republic has progressed considerably since being founded from the remnants of
the defeated Islamic Ottoman Empire. In particular, Turkey has experienced good
economic growth and currently is a candidate for membership in the European Union
(EU). According to the Ninth Development Plan 2007-2013 prepared by the State
Planning Organization, Turkey seeks to be a country that is part of the “information
society, growing in stability, sharing more equitably, globally competitive and fully
completed her coherence with European Union” by 2013 (DPT, 2006, p.11). However,
results on international assessments such as TIMSS and PISA indicate that Turkey’s
educational achievement is far below that of other countries in the EU.
In the process of reaching its goals, the Turkish government will need to face
quantity, quality, and equity issues in education, and in a simultaneous fashion, not at the
expense of each other. Otherwise, it risks increasing existing socioeconomic disparities
between various groups of society and among the seven regions and as a result, growth
may be impeded. In-depth understanding of the differences across regions in learning
outcomes is essential in developing strategies that will raise the national level of
educational performance as well as close achievement gaps, most notably between the
1
western and eastern regions. This dissertation used data from IEA’s (International
Association for the Evaluation of Educational Achievement) Trends in International
Mathematics and Science Study (TIMSS) 2007 to examine the extent of Turkey’s
regional differences in student achievement for educational policy makers and to
investigate factors associated with the differences.
Description of the Problem
Status of Quantity, Quality, and Equity of Education in Turkey
Turkey’s economic performance is reasonably high by world standards. It is
among the 20 largest economies of the world (World Bank, 2007) and aims to be in the
top 10 economies by 2023, the 100th anniversary of its being founded. However,
economic development alone has not necessarily resulted in higher quality living
standards. The United Nations Development Programme’s (UNDP) Human Development
Index1 (HDI) placed Turkey among “medium level HDI” countries and ranked it 84th
among 177 countries, based on 2005 figures (UNDP, 2007). Turkey has been in the
medium HDI category since 1972 (UNDP, 2001). Currently, the EU has twenty-seven
member nations and three candidates for admission, including Turkey. All of the EU
member and candidate states, except Turkey, are among “high level HDI” countries.
1 The HDI is a composite index based on three basic dimensions of human development: 1) a long and healthy life as measured by life expectancy at birth; 2) educational attainment as measured by combination of the adult (ages 15 and older) literacy rate (two-thirds weight) and the combined gross enrollment ratio (one-third weight) for primary, secondary, and tertiary schools; and 3) a decent standard of living as measured by gross domestic product (GDP) per capita in purchasing power parity terms in US dollars.
2

When education, health, and economic components of the index are examined separately,
it is evident that Turkey’s medium HDI level mainly results from its low level on the
education index (ranking 104th) compared with its life expectancy index and GDP index
(ranking 84th and 67th, respectively).
Turkey, with a population of 70.5 million, has a large proportion of young people.
There are 11 million students in primary education which is comprised of grades
1 through 8 for ages 6-14 (Demirer et al., 2008). Given the size of the student population
in primary school, access and quality in education have always been a challenge for the
Ministry of National Education (MoNE). Prompted by the global call of Education for All
(World Conference on Education for All, 1990), compulsory primary education was
increased from 5 to 8 years in 1997. Over the past decade, in addition to this fundamental
reform, important educational projects targeting school access were successfully
implemented. These initiatives included a girls’ education campaign, distribution of free
textbooks in primary and secondary schools, construction of new classrooms by private
sources, busing students to schools in rural areas, and providing access to free boarding
schools in primary education (Aydagul, 2007). These projects ensured school attendance
of children, especially girls, at least through the end of compulsory education.
In 2007, a decade after the reform, the net enrollment ratio had increased
significantly from 85% to 97% for primary school children and the 11% ratio gap
between girls and boys decreased to 2% (MoNE, 2008). Unfortunately, enrollment ratios
for noncompulsory schooling are still low, especially in preschool. Based on 2005
3

figures, the gross schooling rate for preschool was 20% for the 4-5 age group (DPT,
2006). The government has set targets for increasing the enrollment ratio to 50% in
preschool by 2013 (DPT, 2006), the same year Turkey aims to have a full membership in
the EU.
Besides challenges in improving the quantity of education, both in terms of
enrollment ratios and years of schooling, Turkey also faces issues of improving the
quality of education provided to its children. Students’ low achievement results in both
international and national assessments show that improving student learning clearly
remains a challenge for Turkey. TIMSS 2007 is the most recent study in which Turkey
assessed its mathematics and science achievement in an international context among 49
countries and performance was low in comparison to the 12 EU member countries2 that
participated in the study at the eighth grade. Turkish eighth grade students had
significantly lower average achievement in mathematics than the students in all of the 12
EU countries (Mullis, Martin, & Foy, 2008, chapter 1). On the science test, Turkey’s
average science achievement was similar to three EU countries, namely, Romania, Malta,
and Cyprus and lower than the others (Martin, Mullis, & Foy, 2008, chapter 1).
Even more disturbing than Turkey’s low ranking is the finding that 41% of
Turkish students performed below the Low International Benchmark on the mathematics
scale indicating they did not demonstrate a grasp of even basic computational skills. On
2 These countries included Bulgaria, Cyprus, the Czech Republic, Hungary, Italy, Lithuania, Malta, Romania, Slovenia, and Sweden. England and Scotland participated in TIMSS 2007 as separate entities, thus they were counted as two separate EU states, not as the United Kingdom.
4

the science scale, 29% performed below the Low International Benchmark signifying that
they did not know even basic facts from the life and physical sciences. Only 5% of the
students reached the Advanced International Benchmark in mathematics (Mullis, Martin,
et al., 2008, chapter 2) and 3% in science (Martin et al., 2008, chapter 2). These small
percentages of students demonstrating competence on TIMSS 2007 suggest that high
quality education remains a privilege provided only for a small fraction of Turkish
students.
OECD’s (Organisation for Economic Co-operation and Development)
Programme for International Students Assessment (PISA) 2006 results presented a
similarly dismal picture. PISA 2006 focused on the science literacy of 15-year-olds. Most
of the Turkish students who participated in the assessment were in ninth-grade. Among
30 OECD countries in the study, Turkey ranked at the bottom, above only Mexico.
Almost half of the Turkish students (46.6%) performed at or below the lowest proficiency
level of the science literacy scale (OECD, 2007a).
The grim picture of the results from international assessments corresponds to
national test results. In 2005, the Ministry of National Education sampled primary school
students nation-wide at grades 4 through 8 and tested their achievement in four primary
subjects —mathematics, science, social studies, and Turkish. The results of the test, the
OBBS (Ogrenci Basari Belirleme Sinavi [Student Achievement Determination Test])
revealed that the level of primary curriculum attainment was unsatisfactory across the
country. For all grades and subjects, except Turkish, the average score for correct
5

answers was 50% or less (MoNE, 2007). The 2005 results showed no change from 2002
when OBBS was first conducted, confirming the disappointing picture revealed by the
initial test results.
Mandated by the government’s Urgent Action Plan issued in 2003 (DPT), the
ministry initiated major curriculum reforms to improve the quality of learning and
teaching in the nation. These reforms included development, implementation, and
assessment of new curricula in primary education. The curriculum reforms are expected
to promote constructivist ways of teaching where students’ learning is put at the center of
instruction (MoNE, 2005). Rapid implementation of the new curriculum began after a
year of pilot study. In the 2005/06 academic year, the new curriculum for grades 1 to 5
started to be taught in schools while the curriculum for grade 6 was piloted. During the
following two years, piloting for grades 7 and 8 was finalized. The new curriculum for
grades 6 to 8 was put into practice in the academic years 2006/07, 2007/08, and 2008/09,
respectively. The effects of the new curriculum may be reflected in the TIMSS 2011
results (Demirer et al., 2008).
The national tests of primary curriculum attainment, OBBS, illustrated not only
the low level of average student performance at the national level but also Turkey’s
regional equity issues in learning outcomes (see Figure 1.1 for the map of Turkey). The
results from OBBS showed that students in the least socioeconomically developed
regions, namely the Eastern Anatolia and Southeastern Anatolia regions, performed less
well than their peers in more developed regions (MoNE, 2007).
6

Figure 1.1. Geographic Regions of Turkey
Status of Regional Socioeconomic Imbalances in Turkey
Regional differences in student achievement on the OBBS were only an echo of
disparities in regional development in Turkey. Socioeconomic development inequalities
among the regions of the country have long been a significant national problem. Turkey’s
Human Development Report of 2001 compared 1975 and 1997 scores on the Human
Development Index for regions of the country and stated that “Turkey is progressing, but
with persistent inequality” (UNDP, 2001, p.3). A recent study by the State Planning
Organization revealed that the regional disparities are wide (Dincer, Ozaslan, &
Kavasoglu, 2003). This study used the Socioeconomic Development Index (SEDI), based
on 2003 figures, to measure socioeconomic development status at a national level as well
as a regional level. The SEDI included the three components of the United Nations’ HDI
among other social and economic indicators. In total, the SEDI is based on 58 variables
7

selected from socioeconomic measures including indicators of demography, employment,
education, health, infrastructure, manufacturing, construction, agriculture, and finance.
Figure 1.2 displays average SEDI scores for each region compared to the country
mean of zero. The index figures indicate that the socioeconomic disparities are
particularly pronounced between the west and the east of Turkey. The Marmara region
that includes Istanbul —the demographic and economic heart of the country— had the
highest index score and is the most developed region of the country. The Aegean and
Central Anatolia (including the capital city of Ankara) regions are the next most
developed regions, with very close SEDI scores, above the national average. The index
score for the Mediterranean region is at the country’s average and it is below average for
the Black Sea, Southeastern Anatolia, and Eastern Anatolia regions.
Figure 1.2. SEDI Rankings by Regions of Turkey
Note. Data are from Dincer, Ozaslan, & Kavasoglu (2003).
8

Purpose of the Study
Socioeconomic disparities between the western and eastern parts of Turkey
gained more attention after the start of membership negotiations with the EU in 2005.
One of the important goals of the EU is to reduce regional gaps in order to achieve
economic and social cohesion not only within the EU but also in its territories
(Loewendahl, 2005). OECD’s economic survey of Turkey (2006) suggested that
“improved education quality in the poorest regions would contribute to reducing these
[regional] disparities while also encouraging faster growth of the economy as a whole”
(p.158). OECD’s latest review of educational policies in the country (2007b) also
highlighted the striking socioeconomic disparities among Turkey’s regions. Their report
recommended that Turkey make education a key instrument for socioeconomic cohesion.
To reach this goal, the report also recommended that Turkey strive toward providing
equal educational opportunities for all people, establishing priorities for efficient use of
existing resources, and continuing to narrow socioeconomic gaps among regions.
The aim of this study was to determine the extent to which science achievement
inequalities exist across the seven regions of Turkey and to explore potential reasons for
why such educational inequalities might exist. A better understanding of the differences
in student learning outcomes between developed and undeveloped regions may be useful
to regional policy makers in their efforts to formulate region-specific development
strategies. Identifying constraints and differences in achievement may also inform
educational policy to better allocate available resources.
9

This dissertation study used Turkey’s TIMSS 2007 eighth grade science
achievement data as well as the background data collected from students, teachers, and
school principals about contextual factors that may affect learning outcomes.
Characteristics of the student sample allowed for the investigation of regional disparities
in student outcomes. Turkey’s sample of students from TIMSS 2007 is nationally
representative and stratified by the seven regions of the country (Olson, Martin, & Mullis,
2008, Appendix B). Further, TIMSS 2007 results (Martin et al., 2008, chapter 5)
demonstrated that almost all of the content assessed by the TIMSS 2007 science test was
included in Turkey’s science curriculum and intended to be taught to all students in the
country by the end of eighth grade. In this study, the analytic method of Hierarchical
Linear Modeling (HLM) was employed at the school level and the students-within-school
level to examine the relative effects of home and school factors associated with regional
differences in achievement.
Research Questions
The research questions investigated in this dissertation were as follows:
1. What is the science achievement profile of eighth grade Turkish students across
the seven geographic regions of Turkey?
2. What student background factors contribute to regional disparities in science
achievement in Turkey?
3. What school context factors contribute to regional disparities in science
achievement in Turkey?
10

Importance of the Study
Turkey’s aim to become a member of the EU has led to a series of legal and social
reforms, including major ones in education. These major educational reforms were:
increasing the years of compulsory primary education,
providing greater access to schooling,
narrowing the gender gap in enrollment, and
revising the school curricula.
Even though significant progress has been made in increasing years of schooling and the
enrollments, the quality of education in the country as well as the disparities in
educational quality by region continue to be a concern. To have sustainable human
development and successfully complete its accession process with the EU by 2013,
Turkey needs to simultaneously improve educational quantity, quality, and equity.
The government’s decision to participate in TIMSS 2007 demonstrates its interest
in gathering evidence about students’ achievement in comparison to other nations in the
world. Also, the Ministry of National Education is undertaking national assessments that
measure curriculum attainment every three years to monitor national trends in students’
learning in primary education. The purpose of this dissertation was to contribute to the
discussion in Turkey about the best strategies for improving the overall level of student
performance in compulsory primary education and eliminating the achievement
inequalities among its regions.
11

Studies using nationally representative samples and aiming to understand factors
pertinent to regional student outcome differences are scarce in Turkey, mainly because of
lack of data. The curriculum achievement tests, OBBS, were the first large-scale
assessments in primary education that provided empirical evidence on regional
achievement disparities. However, national reports of OBBS are limited to descriptive
analyses of the data and do not include comprehensive analysis of contextual variables
related to regional disparities in learning outcomes. Further, the data from OBBS are not
readily available for use by researchers.3 Therefore, the little information published about
factors influencing educational achievement in Turkey is based only on small-scale local
studies analyzing a limited number of predictors of student achievement.
Turkey’s nationally representative student sample stratified by region from
TIMSS 2007 provided an important and unique opportunity to conduct research on
Turkey’s education system. This dissertation capitalized on the characteristics of this
sample as well as on the extensive contextual information TIMSS collected. It was the
first attempt using a nationally representative sample to investigate the factors related to
science achievement differences across regions in Turkey. Providing timely empirical
information about the current picture of regional achievement disparities and the factors
that are associated with these disparities could potentially be very helpful to policy
makers, in the course of integration into the EU.
3 Access to the OBBS database may be granted with a special permission from MoNE (S. T. Basaran of MoNE, personal communication, June 23, 2008).
12

Chapter 2 Literature Review
This study was conducted to examine regional disparities in the science
achievement of Turkish students at eighth grade, which is the end of compulsory
education in Turkey. Keeping the focus of the study in mind, the following chapter is
divided into three sections. The first section provides an overview of the historical and
current context of primary education (currently grades 1 to 8) in Turkey, including a
summary of significant reforms in primary education. It also gives a profile of Turkish
eighth grade students’ science achievement drawn from national and international
studies. The second section describes the main characteristics of Turkey’s seven
geographic regions, outlines the past and contemporary human development issues facing
the regions, and explains the origins of the regional disparities. The third and last section
reviews literature on student and school factors related to improved science achievement
for students.
13
Context of Primary Education in Turkey
Turkey is located at the crossroads of two continents between southeastern
Europe and southwestern Asia. It was established in 1923 by Mustafa Kemal Ataturk,
who built on the remains of the Islamic Ottoman Empire. During the decade following its
founding, Turkey underwent radical social and political transformations. These changes
were in the direction of moving from a theocratic monarchy to a secular state and
included abolishing the Islamic caliphate, replacing the Sheria (Islamic law) by the
secular Civil Code (adapted from the Swiss Civil Code), establishing civil rights
including women’s right to vote, adopting the Latin alphabet instead of Arabic script, and
mandating Turkish as the common language in education (Aydagul, 2002). Immediate
educational reforms included unifying the public, private, religious, and minority/foreign
schools under the Ministry of National Education [MoNE] and adopting five years of
compulsory primary education. Although five years of compulsory schooling began in
1924 in many schools, the duration of primary schooling in rural schools was three years
until 1939. Five years of primary schooling was mandated in all schools in 1961
(Eurydice, 2006).
During the initial time of tremendous transformation, MoNE invited John Dewey,
as an influential American philosopher and educator, to observe and give advice on how
to improve the Turkish education system. Dewey compiled his suggestions for improving
Turkey’s education system in a report in 1924. Turan (2000) reviewed the report and
documented that Dewey recommended Turkey implement the following reforms:
14

increase the funding of education,
improve teacher training using progressive pedagogical methods,
enhance the physical conditions of the schools, and
develop schools as community centers connected to local life and adapt
the curriculum to local conditions so that it is connected to students’ life.
Dewey also explained that schools in Turkey should be in service of all citizens in
the state, not only for the elites of the society. To develop a society where individuals had
independence of judgment, the ability to think scientifically, and an understanding of how
to cooperate for the common purposes of the society, he advised that “the mass of
citizens must be educated for intellectual participation in the political, economic, and
cultural growth of the country, and not simply certain leaders” (Turan, 2000, p.550).
Last but not least, Dewey warned about the danger of MoNE becoming rigidly
bureaucratic and tightly centralized, thus neglecting the local dimension of education and
ignoring the issues of remote areas. He pointed out the distinction between unity and
uniformity in education, and advised that MoNE should concentrate its activities to unify
the education system and avoid activities that would prevent local communities from
taking responsibilities in the education system. That is, MoNE should become “the center
to prepare education development plans, the intellectual and moral leader and inspirer of
Turkish education” (p.548). He recommended encouraging diversity in the education
system to allow schools to become adapted to varying local conditions and interests.
15

In 2008, eighty-five years after the founding of the Republic, the total population
in Turkey reached 70 million with almost 90% of its adults (aged 15 and above) being
literate (UNDP, 2007). However, the nation still faces some of the same educational
issues articulated by Dewey, and on an increased scale. In the initial years after its
founding, the total population of Turkey was 13 million (Hosgor, 2004) with a strikingly
low literacy rate —less than 10% at the time (MoNE, 2005). In the academic year
1923/24, when the Republic was founded, the ministry educated less than half a million
primary school students in 5,000 schools with, on average, two teachers per school. In the
2007/08 academic year, the number of students in primary education approached the total
population size of the young Republic with 11 million students in 35,000 schools
(MoNE, 2008).
MoNE, which has a firmly centralized and bureaucratic structure, remains the sole
governing body of the education system (OECD, 2006). MoNE plans, delivers, and
monitors all education services and activities including developing and overseeing the
national curriculum for preschool, primary, and secondary education. The ministry is also
responsible for developing educational policy, opening preprimary, primary, secondary
educational institutions, and providing educational materials. MoNE carries out its
activities centrally in the capital city, Ankara, and at the local level through provincial
and district organizations (MoNE, 2005). Gershberg (2005) documented that, using the
OECD Education Database 1998, 94% of all education decisions in Turkey are made at
the central level and 6% at the school level. He concluded that Turkey’s education system
is “more centralized than all members of the European Union it hopes to join” (p.1).
16

In Turkey, primary education is eight years long, compulsory for children aged
6-14, and free of charge in public schools. Preschool education includes children between
ages 3-6, but unlike primary education it is optional (Demirer et al., 2008). There are
serious concerns about Turkish children’s access to preprimary education, because it
provides the basis for primary education. According to data from the UNESCO Institute
for Statistics (2008), in 2000, the gross enrollment ratio4 for preprimary school was
dramatically low (6%) and, in 2006, it had increased only to 13%. As shown in Figure
2.1, a 13% gross schooling ratio for preprimary schooling is the lowest ratio among the
EU member and candidate states and lags far behind the 85% average.5
In addition to Turkey’s already low enrollment ratio for preprimary school, there
are considerable regional differences in preprimary schooling opportunities. Figure 2.2
presents gross enrollment ratios for preprimary education in Turkey and the regions,
ordered by their socioeconomic development index (SEDI) score that was presented in
Figure 1.2 in Chapter 1. As shown in the figure, schooling rates in preprimary education
for students who are 48-72 months-old range from 22% in the Aegean region (the second
most socioeconomically developed region) to 11% in Eastern Anatolia (the least
socioeconomically developed region).
4 Gross schooling ratio (enrollment rate) is obtained by dividing the total number of students, regardless of age, enrolled in preprimary education by the total population in the theoretical age group (official preprimary school age). By definition, the gross schooling ratio can exceed 100 percent. 5 As of 2008, the EU had 27 member nations and three candidates, including Turkey. UNESCO’s database did not include 2006 figures for four member states (Malta, Ireland, Slovenia, and United Kingdom) and one candidate state, Macedonia. Therefore, the average was calculated for 25 countries.
17

Figure 2.1. Gross Schooling Ratio for Preprimary Education in 2006 in EU Member and
Candidate States
Note. Data are from UNESCO Institute for Statistics database (2008).
Figure 2.2. Gross Schooling Ratio for Preprimary Education in 2004 in Turkey and Its
Regions
0
10
20
30
40
50
60
70
80
90
100
Marmara Aegean Central Med. BlackSea
Southeastern
Eastern TURKEY
Gro
ss S
choolin
g R
atio
-P
repri
mar
y
Note. Data are from MoNE (2005, p. 27-28).
18

Two recent reports prepared for the European Commission highlight the
importance of preprimary education in combating educational disadvantages. As a result,
the Commission identified preprimary education as a priority theme for cooperation
between EU states in 2009-2010 (EACEA, 2009). Wobmann and Schutz (2006) state that
“an extensive system of early education in terms of both duration and universal
enrolment” (p.19) is a promising approach to raise equality of educational opportunity.
Early Childhood Education and Care in Europe (EACEA, 2009) recommends that EU
states invest more in preprimary education as an effective way of establishing the
foundation for increasing equity of student outcomes and overall skill levels.
Basic Education Program
Since the late 1900s, Turkey has made significant progress toward improving
primary schooling access for its students. Even considering the low access ratios in
preprimary school, substantial progress in addressing educational enrollment ratios has
been made after the expansion of compulsory primary education from three to five and
then to eight years. About a decade ago, when the Eight-year Compulsory Basic
Education Law (Law no. 4306) was enacted in 1997, five-year elementary schools were
merged with three-year lower secondary schools and the Basic Education Program was
developed.
19

Two main objectives of the Basic Education Program were expanding primary
education for children aged 6-14 and increasing the quality of their education (MoNE,
2005). A primary goal of the program was to reduce poverty for the poorest portion of the
population; those people in remote rural areas as well as the ones who recently migrated
to urban settings, but have a low standard of living. The government also considered the
Basic Education Program as part of the strategy to improve social cohesion by
diminishing existing socioeconomic disparities. Extending compulsory education to eight
years was thought to enhance equal educational opportunities (Dulger, 2004). MoNE
initiated a series of actions to expand the quantity (i.e., enrollment) and quality of
primary education for all children, including girls and students from low income families.
The projects that targeted expanding primary education coverage included:
constructing new schools and classrooms in rural areas,
expanding busing and boarding school capacities in remote areas without schools,
supplying free education materials such as textbooks and uniforms to poor
students, and
implementing educational campaigns in selected disadvantaged provinces
(e.g., “Haydi Kizlar Okula! [Come on Girls, Let’s go to School!]).
Activities designed to improve the quality of primary schooling included providing
in-service training for teachers and principals, enhancing information and communication
technology (ICT) by providing educational materials and computers to schools in rural
areas, and switching from double-shift to full-day education (UNESCO, 2004).
20

The Basic Education Program resulted in an unprecedented expansion in primary
schooling. The results were remarkable and immediate. Overall, the program
substantially reduced net enrollment disparities between girls and boys in primary school.
As presented in Figure 2.3, the net enrollment ratio6 in primary education in 1997 was
85% and ratio gap between girls and boys was 11% (79% vs. 90%) (MoNE, 2008). In
2007, a decade after the primary education reform, the enrollment ratio had substantially
increased to 97% and the ratio gap between girls and boys had declined to 2% (96% vs.
98%).
Figure 2.3. Net Schooling Ratio by Academic Year for Primary Education in Turkey
Since Developing the Basic Education Program
Note. Data are from MoNE (2008).
6 Net schooling ratio (enrollment rate) is obtained by dividing the total number of students in a theoretical age group (official primary school age which is 6-14) enrolled in primary education by the total population in that theoretical age group.
21

To support the objective of increasing primary education quality, the
government’s Urgent Action Plan 2003 (DPT, 2003) initiated massive and rapid
curriculum revisions and transformation of teaching from teacher-centered practices to
constructivist and student-centered practices (MoNE, 2005). The new primary education
curriculum was developed in all core subjects, including science, piloted for a year in
randomly selected schools, and then put into practice. Specifically, the new curriculum
began to be taught in 2005 for grades 1-5 and began in 2006, 2007, and 2008 for grades
6 through 8, respectively (Demirer et al., 2008).
The development, implementation, and assessment of new science curricula were
included among the curriculum reform efforts. Currently, in grades 1 to 3, science is
taught in combination with social studies under the course name “life study”, while in
grades 4 to 8 science and social studies are taught separately. In 2005, the new science
curriculum was implemented at grades 4 and 5 and then, in the next three years, the new
curriculum was put into practice at grades 6 through 8. Another aspect of the curriculum
reforms was to increase the instructional time intended for science teaching. The teaching
time devoted to science was increased from three lesson hours (40 minutes each) to four
lesson hours per week in order to keep up with global trends in science teaching and to
allocate more time for constructivist ways of teaching. This change meant an increase
from 10% to 13% of total instructional time allocated to science.
22

The Basic Education Program also had a significant impact on public spending on
education. In 1987, a decade before the introduction of the Basic Education Law of 1997,
Turkey’s public spending on primary, secondary, and tertiary education was 1.2% of its
gross domestic product (GDP) (UNESCO Institute for Statistics, 2008). By 2004, the
figure had risen to 4.1%. Turkey’s Defense Minister in 2004 noted that “for the first time,
our defense budget was not the highest but the second highest item. Our national
education budget outnumbered our defense budget.” (“Education Budget”, 2004). Despite
the increase in public spending on education, Turkey’s figure still lags behind most of the
EU member and candidate countries (see Figure 2.4) among which Denmark and Sweden
had the highest figures (8.4% and 7.3%).
Figure 2.4. Public Expenditure on Education as a Percentage of GDP in 2004 in EU
Member and Candidate States
Note. Data are from UNESCO Institute for Statistics database (2008). The database did not include 2004 figures for member state Luxembourg and candidate state Macedonia.
23

Results from National and International Studies in Educational
Achievement
The heart of the UNESCO’s (United Nations Educational, Scientific and Cultural
Organization) Education for All movement, launched in 1990 and restated in 2000, was
to provide not only access to schooling but also school success for all children, regardless
of gender, wealth, location, language, or ethnic origin (UNESCO, 2007). The movement
emphasizes that efforts to improve school access and school success should go hand in
hand. However, in Turkey, progress in school access took priority over the progress in
quality of education. Eliminating illiteracy and raising the number of primary school
graduates were the main goals in Turkey (Dulger, 2004). Consequently, improvement of
school quality remains as a challenge in the country. Despite the government’s
tremendous efforts in increasing both quantity and quality in primary education, only
school access has shown remarkable improvement.
Alarming evidence from international assessments such as TIMSS and PISA as
well as national tests paints a disappointing picture of learning outcomes for Turkish
students at the end of their compulsory education. Turkey participated in TIMSS first in
1999 at the eighth grade, and most recently in 2007. TIMSS 2007 provided information
on Turkish eighth grade students’ science achievement in an international arena (among
49 countries) and relative to the 12 EU countries. On the science test, Turkish students
were outperformed by those in most of the EU countries.
24

Average science achievement of eighth grade students in Turkey was similar to
the performance of their counterparts in Romania, Malta, and Cyprus (Martin et al., 2008,
chapter 1). However, England, the top-performing country among the EU members,
outperformed Turkey by almost one standard deviation7 —542 versus 454 score points.
In comparison to the five middle-income8 EU countries, including Bulgaria, the Czech
Republic, Hungary, Lithuania, and Romania, students in Turkey and Romania had the
lowest achievement. A positive aspect of the results was that Turkish girls and boys
performed similarly on the TIMSS 2007 science test.
On average, only 3% of the Turkish students reached the Advanced International
Benchmark demonstrating a grasp of various complex topics and abstract concepts in
science (Martin et al., 2008, chapter 2). In comparison, almost one third of Turkish
students (29%) performed below the Low International Benchmark. That is, they did not
demonstrate a grasp of even basic facts from the life and physical sciences. By contrast,
in Slovenia and the Czech Republic, almost all students (97%), reached the Low
International Benchmark. In Turkey, the tiny proportion of students showing competence
in science and the high percentage of students lacking a grasp of even basic science facts
documents the existence of severe gaps between Turkey and the EU countries in learning
outcomes at the end of primary education.
7 The TIMSS science scale was constructed to have an average of 500 score points and a standard deviation of 100 score points. 8 GNI (Gross National Income) per capita of US$876-US$10,725 in 2005, based on World Bank classification (effective 1 July 2006).
25

Results from PISA were also disappointing for Turkey. PISA has been carried out
by the OECD every 3 years since 2000. PISA measures 15-year-olds’ literacy in reading,
mathematics, and science. Each PISA cycle assesses one of the three subject domains
in-depth and treats the other two as minor domains. PISA 2006 focused on science
literacy and allowed achievement comparisons among 30 OECD countries. Performance
of Turkish students, who were mostly in the ninth grade, was at the bottom (above only
Mexico) and 76 score points below the mean score9 among OECD countries (OECD,
2007a). Almost half of the Turkish students (46.6%) did not reach PISA’s baseline
proficiency level at which “students begin to demonstrate the science competencies that
will enable them to participate actively in life situations related to science and
technology” (p.52).
Results from the national tests at the end of primary education were just as
unsatisfactory. In 2002, the Ministry of National Education began assessing curriculum
achievement of primary school students nation-wide. The test, known as the OBBS (the
Ogrenci Basari Belirleme Sinavi [Student Achievement Determination Test]), is
administered every 3 years to a random sample of students in each of grades 4 through 8.
It measures students’ achievement in core subjects including science. Results obtained in
2002 and 2005 revealed not only that the science curriculum attainment at the end of
primary education was poor throughout the country but also that student achievement
mirrored the regional disparities in socioeconomic development (MoNE, 2002, 2007).
9 In PISA 2006, the mean score for student performance in science across OECD countries was set at 500 score points and the standard deviation at 100 score points.
26

Table 2.1 presents the average percent correct scores for regions, ordered by their
socioeconomic development index (SEDI) score that was presented in Figure 1.2 in
Chapter 1. As shown in the table, the average science score of eighth grade students in
the country was less than 50%. Moreover, the students in the least developed regions,
namely Eastern Anatolia and Southeastern Anatolia, performed lower than their peers in
more developed regions.
Table 2.1. Average Percent Correct by Region for Eighth Grade Turkish Students on the
Science Test of OBBS 2002 and 2005
Region OBBS 2002 OBBS 2005
1. Marmara 45% 47%
2. Aegean 48% 49%
3. Central Anatolia 46% 47%
4. Mediterranean 45% 49%
5. Black Sea 44% 48%
6. Southeastern Anatolia 42% 40%
7. Eastern Anatolia 43% 42%
TURKEY 45% 46%
Note. Data are from MoNE (2002, 2007). For both tests, two booklets (forms A and B) were administered. Above figures are from Booklet A. Figures from Booklet B were not available in the OBBS 2002 report. Booklet B figures in OBBS 2005 differed from Booklet A figures by 1% or less.
27

Even though the national tests, OBBS, represented a step forward to the goal of
measuring the curriculum attainment of the nation’s primary school students, the tests
had limitations. OBBS administered the science test questions in two different booklets.
Each student took either one form or the other. The booklets had 5 common questions,
with each booklet including 15 multiple-choice questions at grades 4 and 5 and 20 at
grades 6 to 8. No effort was made to equate the difficulty of the two booklets. Basing
OBBS scores on a limited number of questions in a particular test booklet raises concerns
about the coverage of the science subject domain, encompassing life and physical
sciences. Also, only the percent correct metric was used for reporting the OBBS results.
That is, the student achievement score on a specific subject domain was simply the
percent of the number of correct responses to the test items in the domain.
The percent correct metric of the OBBS may seem to be a straightforward way to
increase public understanding of the test results. However, it presents interpretation
problems, because students’ proficiency descriptions (i.e., what students know and are
able to do) were not provided in communicating the test results. In contrast, TIMSS used
Item Response Theory (IRT) scaling to summarize student performance on 214 items on
the TIMSS 2007 science achievement scale and described students’ knowledge and
understandings at four score points on the scale (625, 550, 475, and 400) as the
Advanced, High, Intermediate, and Low International Benchmarks, respectively. The
descriptions of students’ achievement at the international benchmarks help users of the
test results understand the meaning of students’ scores (Mullis, Erberber, & Preuschoff,
2008).
28

Socioeconomic Inequalities Across the Regions in Turkey
Because this dissertation study aimed to illustrate the extent of Turkey’s regional
disparities in learning outcomes as well as to investigate factors related to the differences,
it was important to understand the setting that gave rise to existing and persistent
inequalities in human development. This second section provides a brief description of
the main characteristics of the different regions and summarizes the human development
issues faced within the regions.
Historical and Geographic Background
In 1941, educators and geographers in Turkey met in the First Congress of
Turkish Geography in Ankara (Kocman & Sutgibi, 2004) in order to establish the
objectives of geography education and prepare the content for the geography curriculum
in grades 6 to 11 (Tas, 2005). Further, at the end of the congress, Turkey was divided into
seven regions, based on the geographical characteristics of the regions (TNA, 1999).
Because the country is centrally governed, the regions do not have separate
administrative units. In the division process, factors such as climate, natural plant cover,
and distribution of types of agriculture were considered. Four regions were given the
names of the seas next to them: the Marmara, the Black Sea, the Aegean, and the
Mediterranean. The other three regions were named according to their location in
Anatolia —Central Anatolia, Eastern Anatolia, and Southeastern Anatolia.
29

Over time, geographic diversity translated into differences in socioeconomic
development. Disparities became particularly pronounced between the densely populated
and urbanized west and the rural east of Turkey. That is, the regions in the western part of
the country are more developed compared to the regions in eastern Turkey. The Marmara
region is the most developed region, followed by the Aegean and Central Anatolia.
Development performance of the Mediterranean region is at the country average while
the Eastern and Southeastern regions of Anatolia are the least developed.
Regional disparities in development have long been on the list of issues the
country faces. According to the National Human Development Report 2001 (UNDP,
2001) comparing the regional scores on the United Nations’ Human Development Index
(HDI) for years 1975 and 1997, there was little change over that time. Figure 2.5 shows
that despite the overall increase in the Turkish HDI score between 1975 to1997, regional
inequalities remained and the HDI rank order of the regions had not changed at the end of
those two decades.
The results of National Human Development Report 2001 were echoed in the
results of a recent study by Turkey’s State Planning Organization using figures from
2003 (Dincer et al., 2003). This study showed that large socioeconomic differences
among the regions continued to exist. Dincer and his colleagues calculated the
Socioeconomic Development Index (SEDI) for each of Turkey’s 81 provinces, using more
than 50 social and economic measures including indicators of demography, employment,
education, health, infrastructure, manufacturing, construction, agriculture, and finance.
30

Figure 2.5. Turkey’s Human Development Index by Region —1975 and 1997
Note. Data are from the UNDP Human Development Report Turkey 2001 (UNDP, 2001, Table 2.1, p.21)
The regions’ SEDI ranking (see Figure 1.2 in Chapter 1) mirrored the HDI
ranking. Marmara had the highest SEDI score, 1.702, compared to the country mean of
zero. The next most developed regions, the Aegean and Central Anatolia, were very
similar in terms of socioeconomic development as indicated by their close index scores,
0.483 and 0.481, respectively. The index score of the Mediterranean region reflected the
country average (0.021) while the regions of the Black Sea, Southeastern Anatolia, and
Eastern Anatolia were lagging behind with SEDI scores below the country average
(-0.514, -1.011, and -1.162, respectively).
31
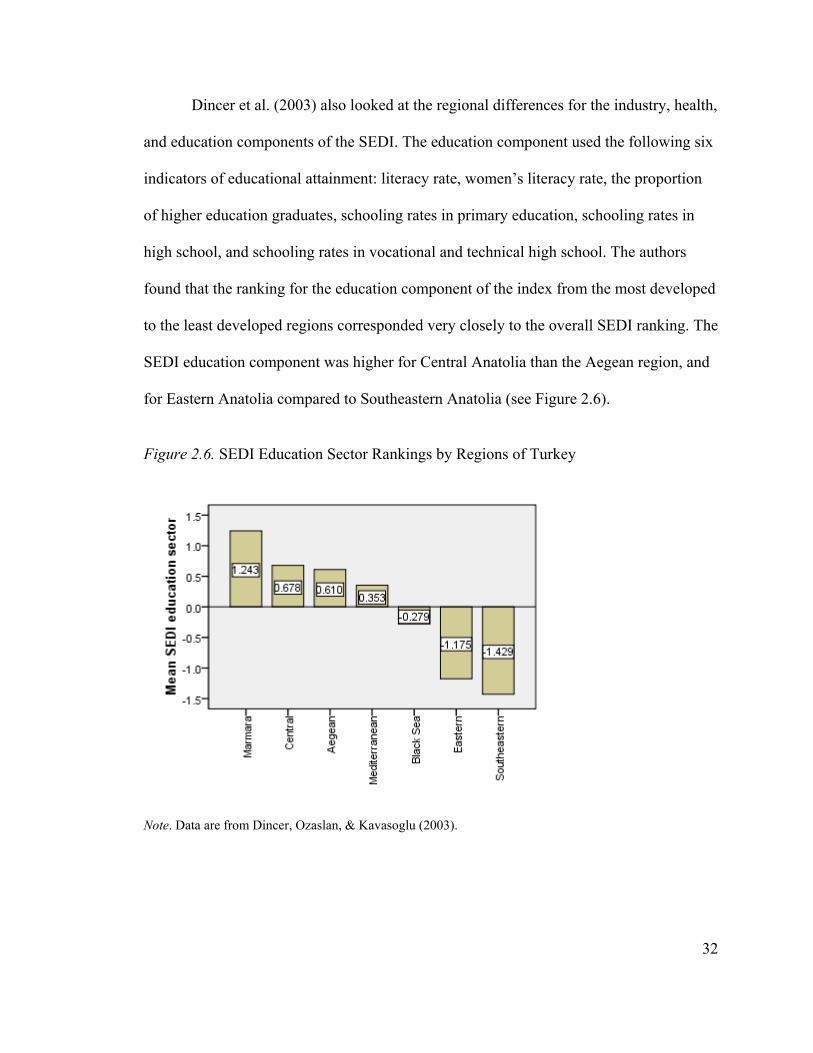
Dincer et al. (2003) also looked at the regional differences for the industry, health,
and education components of the SEDI. The education component used the following six
indicators of educational attainment: literacy rate, women’s literacy rate, the proportion
of higher education graduates, schooling rates in primary education, schooling rates in
high school, and schooling rates in vocational and technical high school. The authors
found that the ranking for the education component of the index from the most developed
to the least developed regions corresponded very closely to the overall SEDI ranking. The
SEDI education component was higher for Central Anatolia than the Aegean region, and
for Eastern Anatolia compared to Southeastern Anatolia (see Figure 2.6).
Figure 2.6. SEDI Education Sector Rankings by Regions of Turkey
Note. Data are from Dincer, Ozaslan, & Kavasoglu (2003).
32

Many factors contribute to Marmara’s robust development. Located in the
northwest of the county bordering Europe, the region bridges two continents, Europe and
Asia. It is the leading region in many industrial and commercial activities: thus, acting as
a magnet for migration from less developed regions. Istanbul, having almost one-fifth of
Turkey’s population, is not only the most important city of the region, but also the
economic, demographic, and cultural center of the entire country.
The Aegean, the second most developed region, lies along the coast of the Aegean
Sea on the west of the country. Agricultural activities are important economically, given
the rich soil and water resources of the region. The portal city, Izmir, is the economic and
touristic center of the region. The Central Anatolia region is in the middle of Turkey and
surrounded by the six other regions. It has the least mountainous topography compared
with the other regions. The capital city, Ankara, is the trade center of the region housing
many governmental activities. Average country development is best mirrored in
Mediterranean region, which is located in the south of Turkey. The economic and
touristic activities are concentrated along the coastline, similar to the Aegean region.
The Black Sea, Eastern Anatolia, and Southeastern Anatolia have the largest
amount of emigration to more developed regions. Weak economic conditions are fostered
by the harsh geography and climate. The Black Sea is located in the north of the country,
where high mountains and forests provide poor conditions for agriculture and industry.
Similarly, the high altitude of Eastern Anatolia does not offer the milder weather
conditions of the coastal regions. Southeastern Anatolia also suffers from the lack of
33

industrialization. Smits and Hosgor (2006) note that “Until recently, an important
characteristic of some of the villages in this region [Southeastern Anatolia] was their
tribal structure, and most people lived under the authority of their religious leaders
(Sheiks)” (p.550). Aside from geographic similarities, these three undeveloped regions
also share some socioeconomic characteristics, including a lack of investment and
infrastructure, high unemployment, low income, high illiteracy rates, and low schooling
rates (TESEV, 2006). This whole series of disadvantages creates a vicious circle with
barriers to human development.
According to the UNDP’s Country Evaluation Report (2004), the roots of these
inequalities between the west and the east of the country are related to several economic,
geographic, and political factors. The disparities are “due to differential natural and
human resource endowments and due to the better access to world and regional markets
of the coastal regions” as well as to “a relative neglect of the Eastern and Southeastern
regions of the country by successive Governments” (chapter 2, p.16).
To better appreciate the political factors underpinning the large regional
disparities, it is important to understand the ethnic differences in the country. Turkey has
a predominantly Muslim population (more than 98%) with small minority groups such as
Christians and Jewish people. Major ethnic minority groups are the Kurds and Arabs,
both of which are concentrated in the eastern part of the country. Besides the Turkish-
speaking majority, researchers estimate that somewhere between 10 and 15 percent of the
population speaks Kurdish as their mother-tongue (Icduygu, Romano, & Sirkeci, 1999).
34

There is not much data on the percent of population whose native language is Arabic as
their mother-tongue, but it is estimated to be much less than the percent of Kurdish
speakers (Smits & Hosgor, 2003).
Educational Resources
In a recent report of the Turkish Economic and Social Studies Foundation, Keyder
and Ustundag (2006) suggest that one commonly shared view in Turkey is that low
education results in these impoverished regions are due to the cultural and ethnic
background of the people living in those regions. However, the authors found that, in
contrast to these prevalent conceptions, the primary educational obstacles in these
deprived regions were poverty and a lack of educational investment. They recommended
that investment in education should be expanded in these regions by means such as
opening new schools, busing students to primary education and boarding them,
distributing free-of-charge textbooks, and providing lunch for students in primary school.
These findings were supported by Cingi, Kadilar, and Kocberber’s (2007) recent
study that investigated district-level disparities in educational opportunities provided in
primary schools in the academic year of 2006/07. The study found that inequalities
existed in the distribution of resources across the regions in Turkey. To construct the
Educational Opportunities Index (EOI), Cingi et al. used 19 educational indicators
including number of teachers, classrooms, and computers per student; number of libraries
and science laboratories per school; and share of household expenditure. The authors then
35

used the EOI figures for each of the 923 districts in Turkey to categorize each district as
being in a good, medium, or poor EOI category. The results of the study confirmed that
the educational opportunities in primary school were poor across the country and that
these opportunities were unequally distributed. On average, only 8% of the districts
provided good educational opportunities. The majority of the districts fell into the
medium and poor categories (47% and 45 %, respectively). The proportion of districts
with a good EOI level was highest in the Marmara region, particularly in Istanbul.
Almost 40% of the districts in Istanbul provided good educational opportunities in
primary education. The results for the districts in the Southeastern Anatolia were dismal.
All of the districts in this socioeconomically least developed region fell into the poor
category of the index.
Substantial differences in resources among primary schools were also
documented in a report on Turkey’s Education Sector Study prepared by the World Bank
(2005). This study documented strong parental concerns about disparities in school
equipment and facilities. In particular, parents with lower incomes or from rural settings
were more concerned about educational conditions than the wealthier or urban parents.
More than half of the rural parents reported problems related to educational facilities in
schools while only one third of urban parents reported this concern. These findings
provide additional evidence of inequities in the distribution of resources across schools as
well as confirm that low-income families have less access to better school services in
Turkey than high-income families.
36

Existing socioeconomic gaps among the regions have led to increasing internal
migration, which has taken “the form of unskilled labor from low-income agricultural
regions moving into wealthier urban areas” (Kirdar & Saracoglu, 2007, p.4). Rapid
movement from villages or poorly developed cities to more developed regions still
continues. Currently, 70% of the population lives in the urban settings (Turkish Statistics
Institution, 2008) and that figure is expected to reach 90% in 2023, by the 100th birthday
of the Republic (DPT, 2001).
Economically rooted rural to urban migration changed its characteristics in the
1990’s. The change began in the mid-eighties in the east and southeast of Turkey as a
result of the conflict between the Turkish military and the PKK (Kurdistan Workers
Party), which lasted fifteen years. As a result of rising security problems in the region
“…over 3,000 villages have been evacuated; more than an estimated 3 million people
have left the region…” (Icduygu et al., 1999, p.1003). More recent research by the
Hacettepe University (in collaboration with Turkey’s State Planning Organization) has
estimated the size of the internally displaced population originating from Eastern and
Southeastern Anatolia due to security related reasons during the twenty years between
1986-2005, as “between 953,680 and 1,201,200” and “80 percent of the security related
migration …is rural originated, and 20 percent is urban originated” (HUIPS, 2006, p.2).
Most of the people who left Eastern and Southeastern Anatolia lacked employable skills
and often spoke very little Turkish (Aydagul, 2007). As a result of this internal migration
process, big cities that received many migrants were negatively affected, because the
37

process gave rise to unemployment, urban poverty, and socioeconomic integration
problems (TESEV, 2006).
The issue of substantial regional and rural-urban inequality in Turkey has been
included in the national development objectives since the 1960s. The major regional
development initiative, the Southeastern Anatolia Project [Guneydogu Anadolu Projesi
—GAP] started in 1977, with an initial focus on infrastructure development and
improvements in agriculture, and has lately evolved into a more comprehensive program
targeting socioeconomic development in the region. To overcome the regional disparities,
development projects for the Eastern Anatolia and Black Sea regions were also initiated
in the 1990’s. They were less ambitious than the GAP, but also were based on the
premise of fighting poverty (UNDP, 2004).
Attention to these regional disparities increased with the start of Turkey’s
accession negotiations with the EU in 2005. A fundamental objective of the EU is
“strengthening economic, social, and territorial cohesion by reducing developmental
disparities between its regions” (EU, 2008, p.1). For the years 2007-2013, more than one-
third of the EU budget is allocated to the EU cohesion policy. The government’s
commitment to diminish the regional disparities is reflected in the latest development
plans. The State Planning Organization’s Ninth Development Plan 2007-2013 (DPT,
2006) included “ensuring regional development” as one of the five axes of
socioeconomic development. The government considers the EU accession process to be
38

“a comprehensive renovation and reform process” and targets an ambitious goal of
“convergence to the economic and social standards of the EU” by the end of 2013 (p.21).
Given the importance of regional cohesion policies in the EU, Turkey’s existing
regional disparities need to be addressed in the move from an EU candidate country to
full membership status by 2013. Therefore, an exploration of factors related to the
existing regional disparities in educational quality is useful and timely. Understanding
and identifying constraints and differences in learning outcomes between the developed
and undeveloped regions will assist in formulating more equitable educational policies,
including how to better prioritize and allocate resources.
Research on Factors Associated with Science Achievement
The overview of research studying the relationships between home and school
factors and science achievement begins with a description of student background
characteristics including family background, educational aspirations, and attitudes toward
science. The discussion of student background factors is followed by a discussion of
school context factors and classroom processes, including educational resources,
instructional approaches, school climate, and community type.
39

Student Background Factors
Home Background
A substantial body of research in the social sciences has shown that family
background is a key factor affecting students’ learning outcomes. The most influential of
such studies, the Equality of Educational Opportunity, known as the Coleman Report
(Coleman et al., 1966) was conducted in the mid-sixties. This landmark study described
the relationship between student and school characteristics and student achievement in
grades 1, 3, 6, 9, and 12 as measured by performances on standardized achievement tests
in reading comprehension and mathematics in the United States. One important finding
of the report was that the students with educated parents and with those greater home
educational resources (e.g., books and dictionaries) performed better than those from
disadvantaged socioeconomic background. Further, the report found that the variance in
student achievement accounted for by family background exceeded the effects of school
resources including student/teacher ratios, number of books in the library, science
laboratory facilities, and teacher characteristics. The conclusion of the report which is
“schools bring little influence to bear on a child’s achievement that is independent of his
background and general social context” (Coleman et al., 1966, p.325) has been heavily
contested ever since.
Heyneman and Loxley (1983) found that effects of student home background
variables are not uniform across countries. This study included the following home
40

background variables: age, sex, mother’s education, father’s education, father’s
occupation, number of books at home, presence of dictionary at home, and a measure of
consumption such as a record player or dishwasher. The authors also found that the
importance of such variables as predictors of student achievement was related to a
country’s economic development. That is, student home background variables, or
“preschool effects” as Heyneman and Loxley called them, were “significantly more
powerful determinants of achievement in high-income countries” (p.1176).
Heyneman and Loxley’s findings were revisited two decades later by Baker,
Goesling, & Letendre (2002) who used the TIMSS 1995 eighth grade data from 36 high-,
middle-, and low-income countries and employed HLM (hierarchical linear models)
which accounts for the hierarchical nature of students nested within schools. The authors
found no “Heyneman-Loxley effect” but found instead what they called a “spreading
Coleman effect”. Their findings showed that student background measured by parents’
education level and number of books in the home had a powerful effect on science
achievement, regardless of national income.
Findings of the Baker et al. (2002) study were consistent with results from TIMSS
school effectiveness study (Martin, Mullis, Gregory, Hoyle, & Shen, 2000), which also
used TIMSS 1995 eighth grade data and employed HLM. This TIMSS 1995 study
revealed that, in almost all countries, students in high-achieving schools had favorable
home background including higher levels of parental education, books in the home, and
other educational aids such as a study desk and computer.
41

Effects of home background were also studied in IEA’s First International
Science Study (FISS) and Second International Science Study (SISS) conducted in
1970/71 and 1983/84, respectively, for students who were 10 years old, 14 years old, and
in the final year of secondary school. One of the key findings of the report (Keeves,
1992) that compiled the results of the 10 countries that took part in both studies of
science education was that there were highly consistent positive relationships across
countries between the science achievement of 14-year-old students (mostly in the eighth
grade) and the students’ home background, which was measured by parents’ education
level, use of dictionary, books in the home, and family size.
An exhaustive review of research conducted in the 1980s about major factors
influencing the outcomes of mathematics and science education was documented in
Indicators for Monitoring Mathematics and Science Education. In her chapter in this
book, “Creating Indicators that Address Policy Problems”, Oakes (1989) identified
students’ socioeconomic background among key variables that are associated with
achievement. She concluded that sources of any inequity in schooling were likely to be
linked to student characteristics as well as school opportunities for teaching and learning.
Oakes also documented that family income, parental education level, parents’ aspirations
for their children, and the encouragement they provide for academic success were closely
connected and interacted with what students experience at school.
42

Buchmann (2002) reviewed twenty-one international studies conducted between
1970 and 1995 that investigated the associations between family background and student
achievement. Of these studies, six used science achievement data from FISS and SISS
—the First International Science Study and Second International Science Study— as the
learning outcome. These six studies measuring the effect of family background on
science achievement used indicators of family socioeconomic status which typically
included parental education, parental occupation, and number of books in the home.
Buchmann’s review of this body of international studies revealed consistent positive
relationships between these family background variables and student achievement in
science.
IEA’s TIMSS assessments conducted after FISS and SISS provided additional
evidence that eighth grade student performance in science is related to home background.
TIMSS 1995, 1999, and 2003 identified the following factors among the important
indicators of a home environment that is likely to support academic achievement:
parents’ education level, number of books in the home, and availability of educational
resources such as a study desk and computer. Results from TIMSS 1995 (Beaton et al.,
1996), TIMSS 1999 (Martin, Mullis, Gonzalez, et al., 2000), and TIMSS 2003 (Martin,
Mullis, Gonzalez, & Chrostowski, 2004) consistently showed that, in almost all countries,
home background as measured by these variables was positively related to eighth grade
students’ science achievement. Higher levels of parents’ education, availability of higher
numbers of books at home, ownership of a study desk, and home possession of a
computer were all associated with higher science achievement.
43

Studies from four EU countries —Slovenia, Finland, Romania, and Bulgaria
(Brecko, 2004; Reinikainen, 2004; Istrate, Noveanu, & Smith, 2006; Bankov, Mikova, &
Smith, 2006, respectively) as well as from Turkey (Aypay, Erdogan, & Sozer, 2007;
Berberoglu, Celebi, Ozdemir, Uysal, & Yayan, 2003; Ozdemir, 2003) used data from one
of the three TIMSS cycles conducted in 1995, 1999, or 2003 and agreed with the
previous findings of positive associations between favorable family background
resources and eighth grade students’ science performance. These studies found that
students whose parents had higher levels of education performed better than those whose
parents had less education. The number of books at home was also shown to be an
important predictor of student achievement, except in Finland where the variable was not
a significant predictor of achievement. Reinikainen (2004) explained the contradictory
finding in relation to reading habits in Finland: “Finnish students are the most active
library book borrowers within OECD countries, thus there is no need for large home-
libraries in Finland” (p.197).
These studies identified two additional predictors of science achievement:
speaking the language of the test at home and home possession of educational items such
as a computer and study desk. Brecko (2004) found that Slovenian eighth grade students
who often spoke the language of the test (Slovene) at home had higher science
achievement than those who spoke it less often. Analyses of TIMSS 2003 data in
Romania (Istrate et al., 2006) and Bulgaria (Bankov et al., 2006) highlighted that the
possession of educational items at home was associated with higher science achievement.
44

To assess the effects of socioeconomic background on student performance, PISA
2006 constructed a composite measure that included various home background variables,
including parents’ occupational status, parents’ education level, access to educational
resources at home (e.g., study desk and Internet connection), and proxies of family
wealth (e.g., ownership of a computer, a dishwasher, or a DVD player). This composite
measure or index was a standardized variable with an OECD mean of zero and a standard
deviation of one. Higher index values corresponded to favorable home backgrounds and
lower values to unfavorable backgrounds (OECD, 2007a). PISA 2006 results showed that
“in all countries, students with more advantaged home backgrounds tend to have higher
PISA scores” (p.182). Turkey’s national report on PISA 2006 documented (EARGED,
2007) that the range of the home background index value for most of the Turkish students
who participated in the study was -2 to -1, indicating that most of Turkish students had
unfavorable home background compared to the students on across OECD countries.
Caliskan (2008) used Turkey’s data from PISA 2006 to study the effects of home
background on science literacy. In this study, indicators of a disadvantageous home
background were low level of parental education, family income, and number of books,
as well as absence of a study desk or a computer at home. The author found that Turkish
15-year-old students (mostly ninth grade students) who came from a disadvantageous
home background were likely to perform lower in science literacy than those from a
favorable home background, which was characterized by a high level of parental
education, family income, number of books, and the presence of a study desk or a
computer.
45

TIMSS 2007, IEA’s most recent international study in science, also found
relationships between student achievement and family background variables. In almost
all of the 49 countries that took part in the study, TIMSS 2007 found higher science
achievement among eighth grade students whose parents had higher educational levels,
that had more books and a computer at home, and that frequently spoke the language of
the test at home (Martin et al., 2008, chapter 4). In Turkey, the association between
parental level of education and science achievement was striking. The average science
achievement score of Turkish students whose parents had a university degree was 135
score points higher (i.e., more than one standard deviation) than students with parents
who had less than lower secondary schooling. This compared to a difference of 85 score
points, on average, across the countries that participated in TIMSS 2007. Also, Turkey,
among all 49 countries, had the lowest percentage of students (7%) with at least one
parent who had graduated from a university.
Other large score differences in achievement results for groups of students
highlighted Turkey’s vast achievement gaps and socioeconomic disparities compared to
other TIMSS 2007 participants, many of them developing countries. For example, only
5% of the Turkish eighth grade students reported having more than 200 books at home.
This group of students scored almost one standard deviation higher than the one fourth of
students (26%) with no more than 10 books. The difference in science achievement was
more than half a standard deviation higher for those Turkish students who spoke Turkish
always or almost always at home (89%) than for their counterparts who spoke Turkish
sometimes or never, those who had computer (43%), and who had an Internet connection
46

(20%) at home. Of the 12 EU countries in TIMSS 2007 at the eighth grade, all had higher
proportions than did Turkey of students with access to more than 200 books, a computer
at home, and an Internet connection at home.
Educational Aspirations and Attitudes
FISS and SISS identified students’ attitudes toward science among the factors that
influence academic achievement (Keeves, 1992). Positive attitudes toward science
developed in the home, the class, and society were found to be positively correlated with
higher science achievement at all three ages tested —10, 14, and 18— in these two
international studies in science. Students who thought science was not a difficult subject,
that the science learned was useful for solving everyday problems, and considered
science lessons to be enjoyable achieved higher scores in science achievement compared
to their peers who held less favorable attitudes toward science. Keeves (1992) argued that
attitudes play an important role in influencing performance in science at two levels —
student and class. At the first level, students with more favorable attitudes relative to
other students in the same class “recognize their higher level of attitude and behave
accordingly to enhance their performance in science” (p.7). At the second level, the
attitudes of the class members “may serve to lift or depress the performance of the group”
(p.7). Therefore, the influence of attitudes at both levels should be considered by teachers
and school administrators.
47

In their chapter in Indicators for Monitoring Mathematics and Science Education
entitled “Outcomes, Achievement, Participation, and Attitudes”, Carey and Shavelson
(1989) argued that students’ attitudes toward science were important because they
predicted student achievement, persistence in attaining goals in science classes, and
students’ decisions about whether to continue taking science courses and to pursue
scientific careers. In particular, they identified the following student attitudes that were
related to achievement: students’ perceived usefulness of learning science, their views
about the capacity of science to help resolving social problems, their self-confidence to
achieve in science, and their interest in and enjoyment of science.
In the TIMSS 1995 school effectiveness study (Martin, Mullis, Gregory, et al.,
2000), students’ aspirations for further education were found to be a strong predictor of
science achievement across 11 countries. Results from both TIMSS 1999 (Martin, Mullis,
Gonzalez, et al., 2000) and TIMSS 2003 (Martin et al., 2004) provided additional
evidence about the positive association in almost every country between science
achievement and students’ educational aspirations in terms of how much they expected to
advance their education. Eighth grade students expecting to finish university had
substantially greater average science achievement than those with less than university-
degree expectations. Data from TIMSS 1999 showed that more than half of Turkish
eighth grade students reported that they expected to finish university and those students
had higher scores in science achievement than those who expected to complete their
education with less than a university degree.
48

Specifically, a study by Tai, Liu, Maltese, and Fan (2006) investigated, using a
nationally representative longitudinal data, whether science-related career expectations of
eighth grade students in the United States predicted the concentrations of their future
college degrees. The authors found that students “who reported that they expected to
enter a science-related career by age 30 obtained baccalaureate degrees in science-related
fields at higher rates than students who did not have this expectation” (p.1143). The
results of the study suggested that educational policies that encourage students’ interest in
science early on in their education may be effective in attracting more students into the
science-related careers.
Eighth grade student achievement in science was also shown to be related to
students’ attitudes in the International Science reports from TIMSS 1995, 1999, and 2003
(Beaton et al., 1996; Martin, Mullis, Gonzalez, et al., 2000; Martin et al., 2004,
respectively). In each assessment, there was an association between science achievement
and students’ positive attitudes toward science. That is, the more the students liked
science, valued science in their life, and felt confident in learning science, the higher
achievement scores they had.
Results from secondary analyses of data from TIMSS 1995, 1999, and 2003 are
consistent with the TIMSS reports’ findings about the relationship between science
achievement and students’ attitudes toward science. Based on TIMSS 1995 data for
Ireland and Hong Kong (House, 2000, 2003) and TIMSS 1999 data for Cyprus (Mettas,
Karmiotis, & Christoforou, 2003), eighth grade performance in science was higher if
49

students reported that they liked science or enjoyed learning it than those who reported
that science is boring. Results of the studies that examined Turkey’s TIMSS 1999 science
achievement were inconclusive. Based on an analysis using Structural Equation
Modeling, Ozdemir (2003) concluded that there was “no or a very low relationship
between students’ science achievement and their perception of enjoyment of science”
(p.56). However, Aypay et al. (2007) found, employing Discriminant Function analysis,
that students in high performing schools in Turkey reported that they liked science or
enjoyed learning it.
For the United States and Korea, House (2006) showed, using data from TIMSS
2003, that eighth grade students performed better in science if they reported that they
learned things quickly in science and usually did well in science compared to their peers
who indicated that science was not one of their strengths. Similarly, Berberoglu et al.
(2003) and Ozdemir (2003) found, using TIMSS 1999 data, that science achievement of
Turkish eighth grade students was lower for those who reported that science was not one
of their strengths or science was more difficult for them than for many of their
classmates.
Also, PISA 2006 examined students’ attitudes and engagement with science in
several areas including students’ appreciation and support for scientific inquiry, students’
value of science in society and in their personal life, students’ confidence as science
learners, and students’ enjoyment in learning science (OECD, 2007a). Results from PISA
2006 found that, in the majority of countries, a strong appreciation of scientific inquiry, a
50

strong value of science, high opinions of abilities in science, and enjoyment of learning
science were associated with better performance in science. In Turkey, Caliskan’s study
(2008) examining the effects of students’ attitudes on science literacy scores from PISA
2006 found attitude-achievement relationship patterns similar to the ones revealed by the
TIMSS assessments. Ninth-grade Turkish students who reported that they learned school
sciences topics quickly and easily performed better than their peers who reported less
self-confidence in learning science.
Most recently, TIMSS 2007 explored eighth grade students’ attitudes toward
science and found that the student’s enjoyment in science, student’s value of science, and
student’s confidence in learning science were all positively associated with science
achievement. Specifically, the more they enjoyed learning science, the more value they
placed on its role in providing advantages to their future, and the more they had self-
confidence in learning it, the higher achievement scores they attained (Martin et al., 2008,
chapter 4).
51

School Factors
The long debate about factors contributing to the differential success of schools
was fueled four decades ago with the controversial conclusion of the Coleman Report
that “schools bring little influence to bear on a child’s achievement that is independent of
his background and general social context” (Coleman et al., 1966, p.325). However, later
studies involving a range of countries with varying levels of economic development have
noted that schools do make a difference in academic achievement, over and above family
background.
A study by Scheerens and Creemers (1989) presented a basic framework of a
model for school effectiveness. The model “includes variables at the levels of the school,
the context of the school, and the classroom, while background variables of pupils are
also taken into account” (p.691). The authors emphasized that the critical element of the
framework is the relationship between levels of the education system, —from higher to
lower, school, classroom, and student levels— and asserted that “higher levels should
provide facilitative conditions for the central processes at lower levels” for school
effectiveness (p.702). That is, supportive conditions of the school should prepare the
medium for effective instruction at the classroom level and the quality of classroom
processes, coupled with the student background characteristics, influence the student
achievement. Scheerens and Creemers concluded that, to enhance understanding of
school effectiveness, research should be based on these cross-level relationships
identified in the framework.
52

Resources
Two decades after the Coleman Report, Heyneman and Loxley’s (1983) study
addressed the power of schools in poor economic conditions. The study found evidence
that schools in developing countries can compensate for the unfavorable effects of
disadvantaged home backgrounds on learning outcomes. The authors explored the effects
of various school variables on the science achievement of eighth grade students across 29
high- and low-income countries from Africa, Asia, Latin America, and the Middle East.
The analysis included “close to 30 school variables at a time in each country’s
regression” (p.1171). Heyneman and Loxley considered the school variables as indicators
of “school and teacher quality” such as number of students in laboratory classes, time
spent on laboratory work, budget for science equipment, science teacher’s age, and
in-service training in science. The authors also found that “the poorer the country, the
greater the impact of school and teacher quality on science achievement” (p.1180) as
evidenced by the greater proportion of variance explained by the school and teacher
quality variables in comparison to the proportion of explained variance by student
background variables.
A review of research about the effects of school resources conducted in the 1980s
(Oakes, 1989) identified two main school factors that are linked to science achievement:
1) the extent to which schools provide students with opportunities to learn science,
including more teaching time and a rigorous curriculum, and 2) the extent to which
53

school conditions provide a positive climate for teaching and learning, including parent
involvement as well as professional development of teachers and school administrators.
The TIMSS 1995 school effectiveness study (Martin, Mullis, Gregory, et al.,
2000) showed that, in some countries, school/classroom-related variables such as school
size and location, school social climate, instructional activities, and amount of daily
homework discriminated between the high- and low-achieving schools and were related
to average school science achievement, even though these school variables were not
consistent predictors of achievement across all countries.
Results from TIMSS 1999, 2003, and 2007 (Martin, Mullis, Gonzalez, et al.,
2000; Martin et al., 2004; Martin et al., 2008, respectively) provided additional evidence
that the availability of school resources for science instruction were related to student
performance in science. The International Science reports of these TIMSS assessments
presented results for an “Index of Availability of School Resources for Science
Instruction” with three levels (high, medium, and low). The index was computed based
on principals’ responses to questions about shortages affecting schools’ capacity to
provide instruction in general (e.g., instructional materials and spaces and budget for
supplies) and science instruction in particular (e.g., science laboratory equipment and
supplies and audio-visual resources). The TIMSS results showed that on average, across
countries, eighth grade students in schools with no or few resource shortages affecting
instructional capacity (i.e., the high level of the index) had higher science achievement
than students in schools with some or a lot resource shortages affecting teaching (i.e., the
54

low level of the index). In Turkey, only 2% of the students were assigned to the high
level of the index in TIMSS 1999 and 7% in TIMSS 2007. In 2007, this was the lowest
proportion of students at this level of the index among the 12 EU countries.
Instructional Approaches
In addition to resources available for science instruction, the ways students are
engaged in science appear to be important in enhancing student learning. Eighth grade
science teaching practices were studied in the TIMSS 1999 Video Study (Roth et al.,
2006). The study was a supplement to the TIMSS 1999 assessment and aimed to
investigate and describe kinds of opportunities provided for students to learn science in
eighth grade classrooms in five countries —Australia, the Czech Republic, Japan,
Netherlands, and the United States.
Based on the analysis of videotaped lessons from the five countries, the study
found that countries implemented different science teaching practices though they also
shared some similarities in the teaching of science. The countries had different content
features and ways in which students were involved in doing science activities in science
lessons. The characteristics of science teaching that were commonly shared and
accounted for at least 70 percent of lessons in all five countries included: whole-class
presentations and/or discussions during the science lessons, development of new science
content, explicit statements of lesson goals, and engaging students in actively doing
science work.
55

Of these five countries, Australia, the Czech Republic, Japan, and the Netherlands
had relatively higher achievement in the TIMSS 1995 and 1999 assessments at the eighth
grade than the other participating countries. Science teaching shared two common
features in these four relatively higher achieving countries:
high content standards and expectations for student learning, though the
definitions of “high content standards” varied across the four countries.
a consistent, commonly shared instructional approach (as opposed to a variety of
instructional approaches) across teachers within a country, though there was no
single science teaching approach shared by the four countries.
Constructivist views of teaching and learning have gained popularity since the
1980’s and, despite some debates and criticism, constructivism is “undoubtedly a major
theoretical influence in contemporary science and mathematics education” (Mathews,
2000, as cited in Guo, 2007, p.232). Wynne (1999) reviewed the literature on effective
science teaching and pointed out that there is a sound base of evidence that students
construct their own ideas and understanding about scientific phenomena even before they
were exposed to teaching about the phenomena. Reynolds (2007) pointed out that the
new perspectives on the process of learning resulted in reconceptualization of teaching as
an active process in which the student plays the active part in construction of knowledge
in contrast to the passive role of being instructed. The author asserted that ideas about
active learning change the role of the teacher: “The teacher is seen as a manager, an
orchestrator of that learning process and is no longer seen as a person who delivers the
56

content and the instruction, but as a supervisor and a counselor” (p.479). Wynne (1999)
concluded that, according to constructivist views of teaching and learning, instruction
should begin with some activities that are designed to allow students to express their
ideas to the teacher, but that there is “less consensus [in the literature] about how to
introduce the scientific view” and “no firm evidence as to the effectiveness of different
approaches to developing pupils’ ideas within a constructivist framework” (p. 40).
As mentioned previously, recent science curriculum reforms in Turkey are
expected to promote constructivist ways of teaching and transform science teaching from
teacher-centered practices to constructivist and student-centered practices (MoNE, 2005).
Studies that used Turkey’s data from TIMSS 1999, however, consistently found that
science achievement had a negative relationship with so called student-centered
classroom activities such as working in small groups, project work, and classroom
discussions (Berberoglu et al., 2003; Ozdemir, 2003). Also, Aypay et al. (2007) found
that some teacher-centered classroom activities were characteristics of the high-
performing schools including demonstrations given by teachers and having students copy
the notes from the board.
These findings might be explained with ineffective implementation of student-
centered classroom activities in eighth grade science classes in Turkey as well as they
might be related to the culture-sensitive nature of teaching and learning. Cobern (1996)
argued that adopting constructivist views of teaching and learning could serve curriculum
development efforts in non-western countries. However, the author cautioned developers
57

of curriculum and other instructional materials that direct adoption of science textbooks
written in western countries or adoption with only minor revisions may not work for
countries in different cultures.
In addition to providing the guidelines on instructional approaches, Turkey’s
science curriculum in primary education also specified the amount of instructional time
that should be devoted to science teaching. TIMSS 2007 International Science Report
(Martin et al., 2008) presented data about the time spent in teaching science. In Turkey,
science is taught as a single, general subject through the eighth grade whereas some other
countries teach the sciences as separate subjects (e.g., biology, chemistry, physics).
Among general science countries, teachers in Turkey reported that 8% of the total
instructional time was devoted to science, which translated to 72 hours of science
instruction per year, compared to the average figures across general science countries,
11% and 110 hours, respectively. These results meant that Turkish eighth grade students
were provided with less time or opportunity to learn science compared to their peers in
other countries.
School Environment
Key school characteristics associated with successful schools were summarized in
the International Handbook of School Effectiveness Research. Among such
characteristics, Reynolds and Teddlie’s chapter (2000) included the following “processes
of effective schools”: teachers’ expectations of high academic performance from all
students (together with the communication of such expectations), increasing students’
58

sense of motivation, and promoting strong parental involvement in schools. The authors
concluded that “high expectations of students have been one of the most consistent of
findings in the literature” (p.148) and “research generally supports the belief that parental
involvement is productive of effective schools” (p.150).
Teachers’ expectations of high student achievement were also identified among
significant determinants of student performance in McKinley (2007). The author argued
that teachers’ low expectations result from “deficit thinking” which manifests itself in
seeing non-mainstream or minority cultures as inferior, believing that student’s
background prevents learning, stereotyping students as not trying hard enough, and not
taking on the responsibility to teach all students.
The TIMSS 2003 International Science Report (Martin et al., 2004) examined the
impacts of “school processes”. To measure the extent to which schools established a
positive climate for learning, TIMSS 2003 created an index measuring principals’
perceptions of school climate. School principals characterized the climate of their school
in relation to the following characteristics of the learning environment: teachers’ job
satisfaction, teachers’ understanding of the school’s curricular goals, teachers’ degree of
success in implementing the school’s curriculum, teachers’ expectations for student
achievement, parental support for student achievement, parental involvement in school
activities, student’s regard for school property, and students’ desire to do well in school.
The index was based on principals’ ratings of these aspects of school climate on a scale
from “very high” to “very low”. Eighth grade students were assigned to the high level of
59

the index if they attended schools where the principal, on average, viewed these
characteristics of school climate “high” or “very high”. Students whose principals rated
the school climate characteristics as “low” or “very low” were placed in the low category
of the index. The results showed that there was strong positive relationship between
principals’ view of school climate and average science achievement at eighth grade.
Results from the TIMSS 2007 International Science Report (Martin et al., 2008)
revealed a similar relationship between perceived school climate and science
achievement. Students at the high level of the “Index of Principals’ Perception of School
Climate” had higher average science achievement, across all countries at eighth grade,
compared to the students at the low level. In Turkey, on average, 8% of students were at
the high level of the school climate index and 36% at the low level. Average science
achievement was higher among students at the high index level and lower among
students at the low level (499 points and 427 points, respectively).
Community Type
A recent review of literature on the “context of effective schools” identified the
type of community, in which the school is located, such as urban or rural, among school
features related to learning outcomes (Teddlie, Stringfield, & Reynolds, 2000). Even
though there was no common definition of rural or urban areas across countries, rural
settings were characterized by their relatively small population size or density as well as
lack or absence of services and activities (Markandey, 2006). Geographical isolation and
restricted access to services was reported to result in rural schools receiving less
60

favorable resource allocations than urban schools, thus leading to lower student
achievements (Webster & Fisher, 2000). However, it has also been suggested that schools
located in smaller communities may generate more community support, thus may
overcome educational obstacles and achieve better than urban schools (Young, 1998).
Results of some educational research have found rural-urban differences in
achievement change from one country to another. For example, in Romania, eighth grade
students in urban settings had higher science scores than their peers attending schools in
rural areas (Istrate et al., 2006). Similarly, the Western Australian School Effectiveness
Study (Young, 1998) revealed that Australian students attending rural schools performed
lower in science than of students from urban schools. Contrary to the findings from
Romania and Australia, Bulgarian students in rural places performed better compared to
those who attended urban schools (Bankov et al., 2006).
Also, Trong (2009) used Progress in International Reading Literacy Study (PIRLS
2006) data from 40 countries to study the relative risk of low reading achievement for
fourth grade students attending rural schools. The author found that there was a
significant risk of low achievement associated with attending a rural school in 14
countries while in 6 countries attending a rural school had a decreased risk of low
achievement. This study concluded that the level of reading achievement in relation to an
urban, suburban, or rural school location is country specific. The results from this study
were consistent with the results from PIRLS 2001 that found “In most countries, reading
achievement is highest for those students in urban schools, lower in suburban schools,
61

and even lower in rural schools” (Mullis, Martin, Gonzalez, & Kennedy, 2003, p.224).
PIRLS 2001 also found that, in Turkey, average achievement of fourth grade students in
urban schools (36%) was 41 points higher than those attending rural schools (25%).
This section reviewed the literature on factors related to science achievement and
identified several home background and school context variables that are associated with
science achievement. These variables consisted of student background characteristics
such as socioeconomic home background, educational aspirations, and attitudes toward
science as well as school factors including educational resources for science teaching,
school climate for academic achievement, and community type. Investigation of Turkey’s
regional differences in achievement will be performed in light of this review.
62
Chapter 3 Methodology
The aim of this dissertation was to examine the extent of Turkey’s regional
differences in student achievement in science and to investigate factors associated with
these differences. To reach this goal, this study used Turkey’s TIMSS 2007 eighth grade
science achievement data as well as background information from the questionnaires
administered by TIMSS to students, science teachers, and school administrators.
This chapter documents the methodological aspects of the study in two main
sections. First, it provides a description of the TIMSS 2007 database, including the
sample design and implementation for Turkey as well as the science test and contextual
background questionnaires, which were the instruments used in this dissertation. The
TIMSS scaling methodology and the TIMSS 2007 international benchmarks in science
are also discussed. The second section describes the methods that were followed in this
study in analyzing the TIMSS 2007 data for Turkey. This section describes the two main
phases of data analysis: first, the investigation of Turkey’s regional differences, and
second, the exploration of home and school factors contributing to the regional
differences. The section on exploration of home and school factors includes procedures
for exploratory analyses, ideas for the construction of composite variables, and plans for
multilevel modeling.
63

Description of TIMSS 2007 Database
In order to work effectively with the TIMSS 2007 data it was important to have
an understanding of the characteristics of this ambitious international assessment,
involving complex procedures for sampling students, measuring students’ achievement,
and analyzing the data. These features of the TIMSS 2007 assessment are described in
detail in the TIMSS 2007 Technical Report (Olson, Martin, & Mullis, 2008). The
achievement data as well as student, teacher, school, and curricular background data for
participant countries comprised the TIMSS 2007 international database, which is
available for public use together with the TIMSS 2007 User Guide (Foy & Olson, 2009).
The User Guide describes the organization, content, and format of the data
collected in TIMSS 2007 and presents methods and examples on how to analyze the data
using various statistical software programs. The guide also provides the following four
supplementary volumes:
international version of TIMSS 2007 background questionnaires,
description of the national adaptations made by specific countries to
particular questions in each questionnaire (e.g., level of parents’
education),
explanation of how TIMSS constructed the derived variables in the
database, and
sampling stratification variables for each country.
64

Target Population and Sampling Implementation
At eighth grade, the TIMSS 2007 target population included all students enrolled
in the eighth year of formal schooling, counting from the first year of primary school as
defined by UNESCO’s International Standard Classification of Education (ISCED)
(Joncas, 2008a). For most countries, including Turkey, the target grade was the eighth
grade.
To draw nationally representative samples of students, TIMSS 2007 used a
two-stage cluster sampling technique (Joncas, 2008a). In this sampling method, the first
stage was to sample schools with probability proportional-to-size (PPS). That is, the
larger the size of a school, the greater the chance of being selected in the sample.
Following the sampling of schools, the second stage was sampling one or more intact
classes from the eighth grade in the sampled schools. Classrooms were selected with
equal probabilities (i.e., random sampling). Typically, approximately 150 schools were
sampled in each participating country, which yielded a representative sample of
approximately 4,500 students in each participant country.
In TIMSS 2007, schools in Turkey with students in the eighth grade were first
stratified by geographic region prior to sampling. The population of schools was split into
seven strata—the Marmara, Aegean, Central Anatolia, Mediterranean, Black Sea,
Southeastern Anatolia, and Eastern Anatolia regions. Following stratification, at the first
stage of sampling 150 schools were selected using a systematic (random start, fixed
65

interval) PPS sampling method from across the seven school sampling frames. This was
intended to provide a school sample distributed across the regions in proportion to the
number of students in each region. Of the 150 sampled schools in Turkey, four of them
were found to contain no eighth grade students and were ineligible for participation in the
test. All of the remaining 146 schools participated in TIMSS 2007 (Olson, Martin, &
Mullis, 2008, Appendix B). At the second sampling stage, all eighth grade classes were
listed within each sampled school and one class was randomly selected from the school.
The students within the sampled classes comprised the TIMSS 2007 student sample for
Turkey. A nationally representative sample of 4,498 Turkish eighth grade students
participated in TIMSS 2007 (Joncas, 2008b).10 Table 3.1 presents details of the regional
sampling implementation in Turkey in TIMSS 2007.
Table 3.1. Turkey’s Sample Allocation in TIMSS 2007 at the Eighth Grade
Region
Number of Schools Participated
Number of Students Participated
Average Age (SE)
Marmara 39 1362 13.96 (0.0)
Aegean 18 505 14.04 (0.0)
Central Anatolia 26 739 13.96 (0.1)
Mediterranean 18 527 14.06 (0.1)
Black Sea 16 442 14.02 (0.1)
Southeastern Anatolia 17 592 14.30 (0.1)
Eastern Anatolia 12 331 14.07 (0.2)
TURKEY 146 4498 14.03 (0.0)
Note. “Number of Schools” from Appendix B of the TIMSS 2007 Technical Report (Olson, Martin, & Mullis, 2008). For computing average age, IEA’s International Database Analyzer (IEA, 2008) was used.
10 Based on this sample, Turkey’s eighth grade student population is estimated to be 1,091,654 (Joncas, 2008b).
66

This study capitalized on two characteristics of Turkey’s student sample from
TIMSS 2007:
the sample was nationally representative, which allowed for
generalizations of the results of this study to the national level, and
region-level stratification, which enabled investigation of the extent of
regional differences in student achievement.
Science Test
As explained in detail in the science framework published in the TIMSS 2007
Assessment Frameworks (Mullis et al., 2005), the science test questions (i.e., items) in the
TIMSS 2007 assessment were developed to measure both content and cognitive
dimensions. The content dimension or domains specified the subject matter that was
assessed in the TIMSS 2007 science test. The cognitive dimension or domains specified
the thinking processes that students were likely to utilize as they responded to the items.
At the eighth grade, all science items were categorized according to one of four content
domains —biology, chemistry, physics, and earth science— and one of three cognitive
domains —knowing, applying, and reasoning. Some of the science items also tested
students’ scientific inquiry skills, which were treated in the TIMSS science framework as
an overarching field of science that encompassed both content and cognitive dimensions.
67

The TIMSS 2007 science test items were developed through a collaborative
process. Item writing and review, field-testing, and revision involved representatives of
the participating countries as well as an international panel of experts in science. This
extensive process ensured content accuracy, grade appropriateness, framework fit, and
sound psychometric characteristics of the items (Ruddock, O’Sullivan, Arora, &
Erberber, 2008). The TIMSS 2007 eighth grade science test included a total of 214
science items. Half of the items were in multiple-choice format and worth one score point
each. The other half consisted of constructed-response items that required students to
write their responses. The constructed-response items were worth either one score point if
a short response was required or two points for items requiring longer explanations. The
total number of score points on the science test was 240.
To ensure reliable scoring of student responses to constructed-response items,
scoring teams in each country went through extensive scoring training using carefully
developed scoring guides and training materials that included sample student responses
and practice papers. Moreover, the scorers’ actual scoring performance was continuously
monitored during the scoring activity. Details of the TIMSS scoring methods and
guidelines, the development of the scoring guides, and the procedures for conducting the
scoring training are explained in Ruddock et al. (2008).
TIMSS 2007 documented the extent to which constructed-response science items
were scored consistently by the scorers in each country. The percentage of exact
agreement between scorers, on average internationally, was 96 percent, and 97 percent
68

for the scorers in Turkey (Olson, Martin, Mullis, Foy, et al., 2008). This high degree of
scoring consistency indicated that the TIMSS 2007 scoring procedures were accurate and
reliable. TIMSS 2007 also documented the reliability of the science test for each country.
Reliability was estimated using the Kuder-Richardson Formula 20 (KR-20). The
coefficient was the median KR-20 reliability across all the 14 booklets in the test.
Reliabilities were generally high. The median of the reliability coefficients across all
countries was 0.84 and the coefficient for Turkey was 0.85 (Martin et al., 2008).
The TIMSS 2007 assessment had very ambitious goals for subject coverage,
resulting in many more items than any one student could be expected to take. In fact, the
TIMSS 2007 eighth grade test, including both science and mathematics items would
require nearly 11 hours of testing time if a single student were to take all of the items
(Mullis et al., 2005). In order not to exceed the individual student testing time of 90
minutes, while keeping the broad framework coverage, TIMSS used a matrix-sampling
approach. Matrix-sampling involves grouping the test items into “test blocks” and
distributing the blocks across a number of test booklets, with each student answering the
science and mathematics items in only one booklet. In TIMSS 2007, the entire set of
mathematics and science items was grouped into 28 blocks, 14 for mathematics and 14
for science. The blocks were distributed according to a rigorous design across 14
booklets, each containing two science blocks and two mathematics blocks.
69

This complex assessment design provided an efficient method of data collection.
That is, data were collected across a broad expanse of science content without
overburdening the students. However, because each student responded only to a single
booklet containing a subset of items and not to the entire set of items in the test, TIMSS
data are not intended for making decisions or statements about individual students.
Rather, the information each sampled student provides is used to make inferences about
the distribution of achievement in the student population (Foy, Galia, & Li, 2008).
Scaling Method
To make inferences about the science achievement of the Turkish eighth grade
student population, this dissertation used TIMSS 2007 science proficiency scores that
were imputed using a sophisticated scaling method. As explained in detail in Foy et al.
(2008), TIMSS used Item Response Theory (IRT) scaling in combination with
conditioning and multiple imputation (“plausible values” methodology) to provide
estimates of student achievement for analysis and reporting purposes.
The IRT scaling produces a score by averaging the responses of each student to
the items, taking into account the difficulty and discriminating power of each item. A
student’s score is an estimate of proficiency on the entire test even though the student
was administered just part of the test. Because the IRT estimate of a student’s score is
based on the student’s responses to the items that the student takes in just one booklet, the
estimated score has relatively larger uncertainty than would an estimate based on the
entire test.
70

To improve reliability of the performance measurement, TIMSS uses an approach
known as “conditioning” which draws on information about students’ background
characteristics, in addition to students’ responses to the items they were administered. In
this procedure, student responses to the items on the test are combined with all available
background information to estimate the distribution of student achievement in the
population, conditional on this background information. Using this achievement
distribution of the student population, for each student in the population a score on the
entire test is imputed based on the student’s item responses as well as his or her
background characteristics. This imputed score is also known as a plausible value.
A plausible value is not a personal test score in the usual sense, but rather an
imputed score conditional on the item responses and background characteristics.
Therefore, there is uncertainty or error inherent in this imputation process. To quantify
the error, TIMSS repeats the imputation process and generates five plausible values for
each student. The variation between the five plausible values allows estimating the
imputation error in the measurement model. Analyses with the TIMSS plausible values,
therefore, should be conducted five times, using a different plausible value each time.
The average of the five sets of results provides the best estimate of the statistic in
question. The difference between the results of the five replicated analyses reflects the
imputation error. In this dissertation, all five plausible values in science were used in the
analyses of Turkey’s data from the TIMSS 2007 International Database (Foy & Olson,
2009).
71

International Benchmarks of Science Achievement
As summarized in the previous section, considerable effort was devoted to
constructing the TIMSS 2007 science achievement scale. To facilitate users of TIMSS
scale scores in interpreting the meaning of the scores, TIMSS 2007 used a scale
anchoring procedure to summarize and describe student achievement at four points on the
scale, selected to represent important benchmarks internationally. Detailed information
about the process of selecting the benchmarks in TIMSS science scale as well as on the
procedure of scaling anchoring is provided in Mullis, Erberber, and Preuschoff (2008).
The TIMSS 2007 International Benchmarks correspond to four points on the
TIMSS achievement scale as follows: Advanced International Benchmark (625), High
International Benchmark (550), Intermediate International Benchmark (475), and Low
International Benchmark (400). The scale anchoring procedure first identified students
who scored at each international benchmark (i.e., within plus or minus 5 scale points of
the benchmark). The next step was determining the science items that anchored at each of
the benchmark points. To do this, criteria were applied to determine the sets of items that
students reaching each international benchmark were likely to answer correctly and that
those at the adjacent lower benchmark point were unlikely to answer correctly. For
example, a multiple-choice item anchored at the Advanced International Benchmark if at
least 65 percent of students scoring at the Advanced International Benchmark answered
the item correctly and less than 50 percent of students scoring at the High International
Benchmark answered it correctly.
72

After determining the items that anchored at each of the benchmarks, an
international panel of experts in science education scrutinized those anchor items and
their scoring guides. The purpose of this process was to describe the knowledge and skills
demonstrated by students correctly answering each item that anchored at each
international benchmark. The experts then synthesized these item descriptions to provide
a general description of student competency at each benchmark. At the eighth grade,
competency in science ranged from demonstrating a grasp of some complex and abstract
concepts in science at the advanced benchmark to simply recognizing some facts from
the life and physical sciences at the low benchmark (Martin, et al., 2008, chapter 2).
Background Questionnaires
In addition to assessing students’ performance in mathematics and science,
TIMSS 2007 collected a wealth of information about the home and school contexts in
which learning takes place. This contextual information is crucial to understanding the
achievement results, because it sheds light on the factors likely to shape students’
outcomes. TIMSS 2007 gathered this contextual information via background
questionnaires. A description of the contextual framework underlying the questionnaires,
the process used to develop them, and the content of the questionnaires is provided in
detail in Erberber, Arora, and Preuschoff (2008).
73

In TIMSS 2007, four different background questionnaires were administered to
gather information from the participating students, the students’ mathematics and science
teachers, their school principals, and curriculum experts in the participating countries.
The Student Questionnaire, completed by the students, collected information about
students’ family background characteristics and resources, their attitudes toward learning
mathematics and science, and their school experiences and instruction. Science teachers
of the students completed the Science Teacher Questionnaire which focused on the
classroom activities for science instruction, the teacher’s background and training, and
instructional approaches and resources for science teaching. The School Questionnaire
gathered information from the school principals about school demographics, facilities
available to support teaching and learning, and the school climate for learning and
teaching. Finally, the Curriculum Questionnaire, completed by curriculum experts in
each country, collected information on the science curriculum and policies of the
participant countries.
Methods
The aim of this dissertation study was two fold: first, to examine the extent of
Turkey’s regional differences in science achievement, and second, to investigate factors
associated with the differences. Consequently, data analysis in this study consisted of two
phases. In the first phase, regional differences in student achievement were investigated.
In the second phase, home and school background factors contributing to the regional
differences were explored using a multilevel statistical model of student achievement.
74

Taken together, the results from the TIMSS contextual questionnaires provided
approximately 400 potential explanatory variables at the eighth grade. This extensive
database provided a solid basis for analyzing factors associated with regional differences
in science achievement in Turkey.
To make inferences about the science achievement of the eighth grade Turkish
student population, this study used data from Turkey’s TIMSS 2007 student sample. In
analyzing the sample data, it was necessary to take the TIMSS sampling design into
account so that sample statistics would accurately reflect population attributes. Therefore,
in all analyses of this study, the student sampling weight (TOTWGT) was used. This
sampling weight was provided for each student in the TIMSS 2007 International
Database (Foy & Olson, 2009) and properly accounts for the sample design, takes the
stratification into account, and includes adjustments for non-response (Joncas, 2008b).
The use of TOTWGT in this dissertation ensured that all subgroups of the sample were
properly represented in the estimation of population parameters.
Phase 1: Investigation of Turkey’s Regional Differences in
Achievement
As presented in Chapter 1 of this dissertation, three research questions were
investigated in this study. The first phase of the data analysis produced statistics to
address the first research question, the investigation of Turkey’s regional differences in
science achievement. The remaining two research questions concerning home and school
75

factors influencing the regional differences were addressed in the second analytic phase
using multilevel modeling as described in a subsequent section of this chapter.
The first phase of the data analysis began with computing average science
achievement for each region as well as for Turkey as a whole. For this computation, the
IEA’s International Database (IDB) Analyzer (IEA, 2008) was used. The IDB Analyzer
was developed by IEA to analyze data from IEA surveys such as TIMSS 2007 that used a
complex sample design and made use of the plausible value methodology. The program
computes achievement means for groups of students using all five plausible values for
each student. That is, it computes a mean using the first plausible value for each student,
a mean using the second plausible value, and so forth through all five plausible values
and averages the results.
The IDB Analyzer computes standard errors for statistics of interest using the
jackknife repeated replication method. The jackknife method provides unbiased estimates
of the standard errors by taking into account the sampling design used in the TIMSS 2007
as well as the variation among the five plausible values generated for each student (Foy et
al., 2008). That is, the jackknife standard errors produced by the IDB Analyzer
incorporate two components: sampling variance (uncertainty due to generalizing from
student samples to entire student population) and imputation variance (uncertainty due to
estimating students’ performance on the entire test based on their performance on the
subset of items they took in the test).
76

Once the estimate of average science achievement (and its standard error) was
computed for Turkey and for each region, the next step in the first phase of the data
analysis was to describe regional achievement differences at the TIMSS International
Benchmarks using the IDB Analyzer. It was important to provide descriptive information
about regional differences in the types of science knowledge, concepts, and methods
represented by the gaps in average achievement between higher and lower performing
regions. For example, students reaching the Advanced International Benchmark
demonstrated a grasp of complex and abstract science concepts, while those reaching the
Low International Benchmark only demonstrated recognition of basic science facts. The
TIMSS 2007 database included five benchmark variables for each student, indicating the
international benchmark each student reached based on his or her five plausible values on
the science scale. The percentages of students meeting the four TIMSS International
Benchmarks for science achievement were computed for Turkey, and separately by
region, using the IDB Analyzer.
Phase 2: Investigation of Factors Contributing to Regional
Differences
The second phase of the data analysis addressed the second and third research
questions of this dissertation, the exploration of home and school background factors
contributing to Turkey’s regional differences in science achievement. To investigate such
factors, the TIMSS 2007 background variables associated with achievement differences
across regions were identified via an exploratory analysis and then examined for their
77

contribution to reducing the regional differences in achievement using a multilevel
modeling technique.
Exploratory Analyses
The wide range of background information collected by TIMSS 2007 from
various levels of the education system —students, teachers, principals— facilitated the
exploration of factors helpful in understanding regional science achievement differences
in Turkey. After exploratory analyses of Turkey’s extensive background questionnaire
data, a number of student background factors and school context factors emerged to be
included in developing a model of regional differences in science achievement in Turkey.
Keeping the review of literature in mind, exploratory analyses of Turkey’s
background questionnaire data began with a review of the data almanacs provided in the
TIMSS 2007 International Database (Foy & Olson, 2009). Background data almanacs
consisted of descriptive statistics for each country and averaged internationally. A variety
of statistics were provided for categorical background variables (e.g., gender), including
the percentage of students in each category and mean science achievement, and for
continuous variables (e.g., total instructional hours in school in a day), including the
minimum, mean, mode, and percentile scores. These statistical summaries of the data for
the hundreds of background variables collected via the student, teacher, and school
questionnaires were reviewed for Turkey and a preliminary set of variables that showed
an association with science achievement were selected for inclusion in developing the
science achievement model. In addition, exploratory analyses were performed to
78

investigate whether the associations identified at the country level were also found at the
region level.
Before proceeding with the inclusion of any selected variables in further analyses,
some of them were recoded to have a better response distribution compared to the
original variables and have the benefit that higher category codes characterize higher
levels of the variables. In addition, original variables were reviewed for national
adaptations that were implemented by Turkey. Supplement 2 of the TIMSS 2007
database provides information on the variables that countries adapted, did not administer,
or modified to suit their national context.
Constructing Composite Variables
The TIMSS 2007 questionnaires often included several questions related to a
single underlying construct. In these cases, responses to the individual questions were
combined to create a derived variable to be used in the eventual multilevel modeling
analysis for Turkey. Derived variables are comprised of various facets of the construct of
interest, and thus provide a more comprehensive picture of the construct than the
individual variables. An individual variable “may not capture the complexity of the
phenomenon of interest” whereas a derived variable consisting of several components
“may capture the essence of such a variable with a degree of precision that a single item
could not attain” (Devellis, 2003, p. 9-10). Therefore, derived variables have an
advantage of providing a more reliable measure of the construct. For example, the student
questionnaire collected data on home resources including the number of books,
79

availability of a computer, an Internet connection, and a study desk for student’s use, as
well as a number of home possessions that was used as a proxy measure of family income
specific to each country. Turkey’s TIMSS 2007 student questionnaire asked about the
availability of a dishwasher, a washing machine, a heating system, and a DVD player.
These individual variables targeting the students’ home resources were used in
constructing a derived variable that became an “Index of Home Resources”.
The procedure for developing the indices involved several steps. First, some
variables needed to be reverse coded so that the scale direction would make more sense
conceptually. For example, the students who responded “Yes” to home possession
variables were expected to have higher science achievement than those with “No”
responses. Originally, home possession variables were coded as “Yes=1” and “No=2” in
the TIMSS 2007 database. For the purposed if this dissertation, these variables were
recoded as “Yes=1” and “No=0” so that the higher values of the variables indicated
presence of the resources at home and the variables had a positive relationship with the
achievement.
Second, principal components analyses were performed to examine the
underlying dimensionality of the indices using different combinations of variables.
Composite variables “capture much of the information originally contained in a larger set
of items” (Devellis, 2003, p.128). The unidimensionality of an index was examined to see
whether there was evidence of one common factor (composite variable) that was
sufficient to account for the pattern of responses to the individual (component) questions.
80

When the emergent factor explained most of the variance among the individual variables,
it was considered that there was evidence that the component questions were measuring
the same construct of interest. The degree of reliability of an index was also assessed.
The variables that lowered the reliability of an index (i.e., the variables that were not
highly correlated with the other individual variables) were dropped from the set of items
that contributed to the construction of the index. After component variables of a construct
were identified, the index scores were computed by averaging the numerical values
associated with each response option.
To provide interpretability of results from this study, as an additional step,
students were assigned to two index levels with substantive meanings. Responses that
were expected to characterize the most supportive learning environment were assigned to
the high category of an index. By contrast, the low category of the index included the
responses that were expected to characterize the least supportive learning environment.
For example, the scores on the “Index of Home Resources” were computed by averaging
the students’ responses to seven source variables (i.e., computer, study desk, Internet
connection, number of book, dishwasher, heating system, and DVD player). Next,
students with access to at least four of the seven home resources (i.e., average index score
above 0.5) were placed in the high category of the index while students with access to
three or less home resources (i.e., average index score below 0.5) were assigned to the
low level of the index.
81

Modeling Science Achievement in Turkey
Following the identification of background variables and development of
composite variables that were associated with regional differences, the next analysis
phase was to use a multilevel modeling technique to investigate the relationship of
student background and school context variables with science achievement in Turkey.
This investigation was designed to increase understanding of the underlying reasons for
the regional achievement differences revealed by the first phase of the data analysis.
In the TIMSS 2007 sampling design, sampled students were clustered within
schools/classes. Due to this nesting, students share the same context (e.g., they might
come from the same neighborhood, they might share the same teachers and classroom
resources), and hence tend to be more like each other in terms of an outcome of interest
than would be students randomly sampled from the entire student population (Snijders &
Bosker, 1999). Hierarchical Linear Modeling (HLM) explicitly accounts for the
multilevel structure of the nested data, thus standard errors of regression coefficients can
be estimated without bias (Raudenbush & Bryk, 2002). Considering the nested structure
of the TIMSS data, in this dissertation study the HLM6 software program (Raudenbush,
Bryk, & Congdon, 2004) was used. This program is designed to carry out the
computations with five plausible values in the TIMSS 2007 dataset and can utilize the
sampling weight variables of the dataset. Moreover, similar to the IDB Analyzer, HLM6
produces unbiased estimates of the standard errors by including two components of
variation: the sampling variance as well as an imputation variance.
82

In TIMSS 2007, because students were nested within classes and classes within
schools, there were three possible sources of variation in student achievement: the
differences between schools, between classrooms within schools, and within classrooms.
However, variance was not separated at the class level, because in TIMSS 2007 in
Turkey only one class was selected from each sampled school. As a result, each school in
the country was represented by one class and the differences between classes were
indistinguishable from the ones between schools. Therefore, “schools” stands for
“schools/classes” in this dissertation.
Unconditional Model
This two-level hierarchical nature of Turkey’s data lent itself to multilevel
modeling at two levels —the school/class level (level-2) and the student-within-
school/class level, also known as the student level (level-1). In modeling science
achievement in Turkey, the preliminary step was estimation of the unconditional model.
It is called unconditional because it examines the achievement variance without
considering any explanatory variables. Two levels of the unconditional model are shown
in Equation 3.1 (level-1 or student-level) and Equation 3.2 (level-2 or school/class level).
The combined or mixed model that analyzed the data simultaneously at two levels of the
educational hierarchy is presented in Equation 3.3
83

Level-1: y ijjij r 0 (3.1)
Level-2: jj u0000 (3.2)
Mixed model for the unconditional model: ijjij ruy 000 (3.3)
Where:
ijy = Science score of student i in school/class j
j0 = Mean science score for j school/class
00 = Grand mean science score
ijr = Random error associated with student i in school/class j
u0j = Random error associated with school/class j
The unconditional model provides decomposition of the total achievement
variance into two components: between-school/class and within-school/class. Between-
school/class variance is the variation in the achievement of students that lies between
schools/classes and within-school/class variance is due to the individual students’
characteristics and home environment. Variables measured at the school/class level, such
as region or rural/urban setting of a school, cannot be used to explain variance at the
student level because such variables are constant for all students within a school/class
(i.e., all students have the same value on school/class level variables).
84
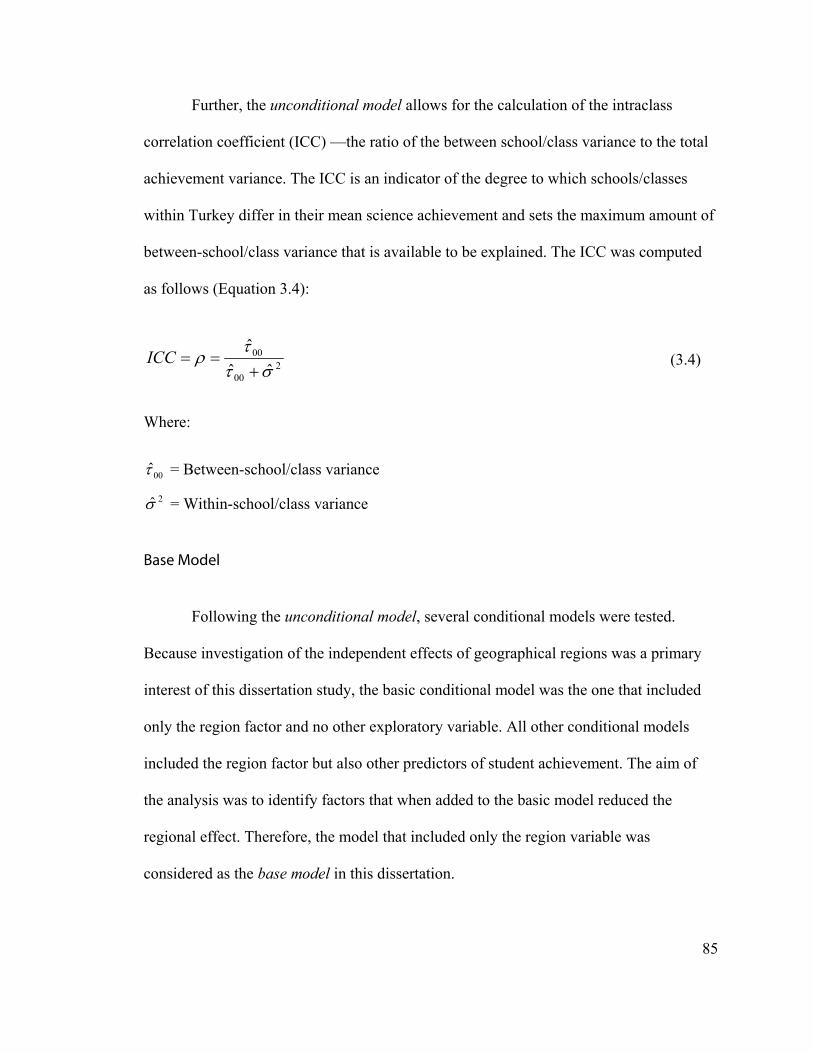
Further, the unconditional model allows for the calculation of the intraclass
correlation coefficient (ICC) —the ratio of the between school/class variance to the total
achievement variance. The ICC is an indicator of the degree to which schools/classes
within Turkey differ in their mean science achievement and sets the maximum amount of
between-school/class variance that is available to be explained. The ICC was computed
as follows (Equation 3.4):
200
00
ˆˆ
ˆ
ICC (3.4)
Where:
00̂ = Between-school/class variance
Base Model
Following the unconditional model, several conditional models were tested.
Becaus ary
considered as the base model in this dissertation.
2̂ = Within-school/class variance
e investigation of the independent effects of geographical regions was a prim
interest of this dissertation study, the basic conditional model was the one that included
only the region factor and no other exploratory variable. All other conditional models
included the region factor but also other predictors of student achievement. The aim of
the analysis was to identify factors that when added to the basic model reduced the
regional effect. Therefore, the model that included only the region variable was
85

As mentioned in the literature review, Turkey has a highly centralized ed
system, including a standardized curriculum in prim
ucation
ary education (grades 1 to 8), which
prescribed the content to be taught and the guidelines to be followed while teaching and
assessing the content. All Turkish students across the country are intended to be provided
with similar learning opportunities in terms of teaching time and content by the end of
primary education. As documented in the TIMSS 2007 International Science Report
(Martin et al., 2008), in Turkey, there was indeed no TIMSS 2007 science topic that was
intended to be taught only to top track students and Turkish science teachers reported that
most of the eighth grade students had been taught the science topics in TIMSS 2007.
cal
location of the schools. Yet, this dissertation study hypothesized that schools in Turkey’s
different regions vary with respect to the achievement of their students and, specifically,
the schools in socioeconomically less developed regions would attain lower science
scores than schools in developed regions. Thus, the base model explored whether the
Turkish educational system performs differently in different regions. The model tested
the effect of attending school in each of the six regions compared to attending school in
the Marmara, the most socioeconomically developed region. Because the base model did
not consist of any predictors at the student level, it had the same level-1 equation of the
unconditional model. At level-2, however, the base model elaborated the intercept
parameter (
In such a centralized system, one would expect that all schools in Turkey would
look similar in terms of their average student achievement, regardless of the geographi
j0 ) of the unconditional model via including six region variables (see
86

Equation 3.5). Thus, the base model, could be represented in a combined or mixed m
as shown in Equation 3.6.
Level-1:
odel
ijjij ry 0 (3.1)
Level-2: eanMediterranAegeanCentral )()()( 030201000 jjjj
uSoutheastEastBlackSea )()()(
jjjj 0060504 (3.5)
Mixed model for the base model:
ijjjjij ruSoutheastCentraly 0060100 )()...( (3.6)
Where:
… 0601 = Main effects for the six region variables
As mentioned previously, all of the other conditional models were built on the
base model n factor but also other
variabl
o
e
uilt
. That is, these models always included the regio
es measured at student-level or school/class-level. The goal was to identify
variables that, if altered, would serve to reduce the magnitude of the region effect. T
explore the individual contribution of each student background variable and school
context variable to the regional achievement differences, each variable was added to th
base model individually. This allowed exploring the extent to which controlling each
variable could be expected to diminish the effect of region. The following sections
present the student background models and then the school context models that were b
on the base model.
87

Student Background Models
As discussed in detail in Chapter 2, the regions in the western part of Turkey lag
s of all socioeconomic indicators,
including educational and wealth factors. As a result, disadvantaged students tend to be
concentrated in the eastern part of the country and enter schools with vast socioeconomic
background differences in terms of their parental education level and home resources.
Turkish students may also vary widely in their attitudes toward science and in terms of
their educational aspirations because these student characteristics are mainly developed
and shaped in the home, school, and society in which they live. As summarized in the
literature review, socioeconomic home background characteristics and students’
individual characteristics were identified as powerful indicators of achievement.
Moreover, a major ethnic group (Kurds) in the country populated the eastern part of
Turkey, speaking mostly their mother-tongue at home. Less fluency in Turkish, the
formal language of instruction in Turkey, may limit the grasp of instruction in class and
influence student achievement.
, several student background models attempted to
discover the effect of student characteristics and socioeconomic background on science
achievement. Each model was built upon the base model (i.e., the region model) and
included only one student-level variable. For example, the parental education model
included only the parental education predictor at level-1 (Equation 3.7). As shown in
far behind the regions in eastern Turkey in term
To explore the contribution of these student background characteristics to the
regional achievement differences
88
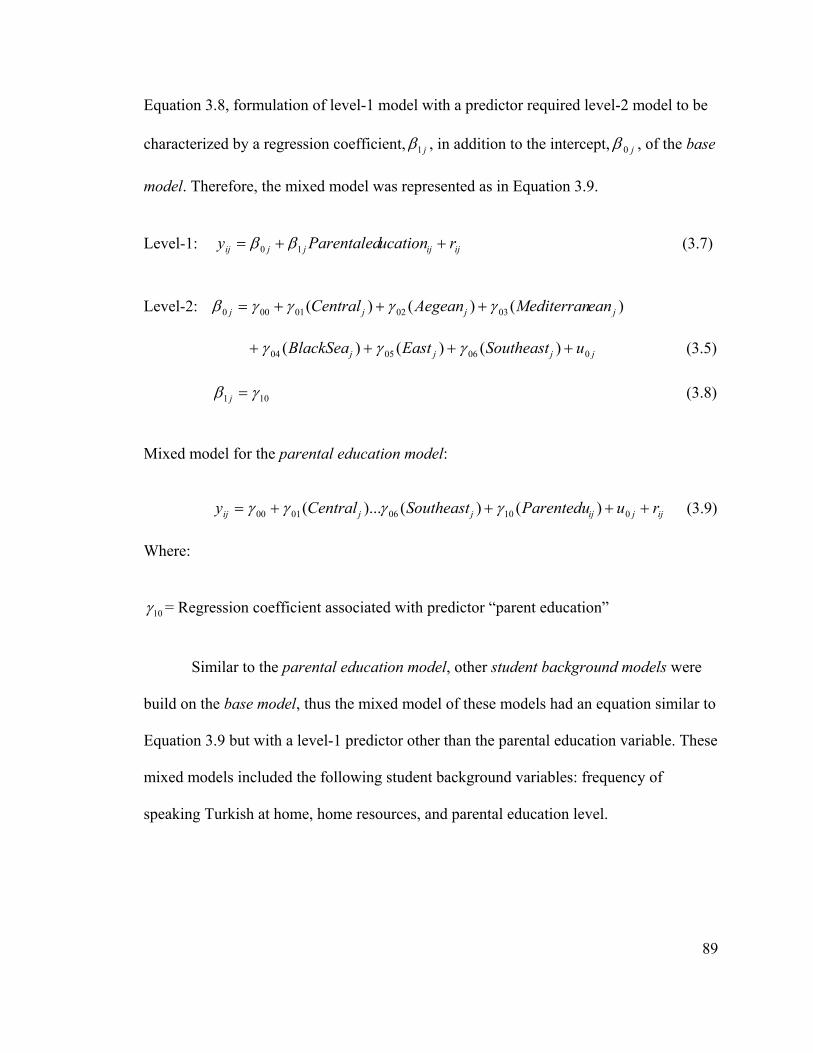
Equation 3.8, formulation of level-1 model with a predictor required level-2 model to
characterized by a regression coefficient, j1
be
, in addition to the intercept, j0 , of the b
model. Therefore, the mixed model was represented as in Equation 3.9.
ijijjjij
ase
Level-1: rucationParentaledy 10 (3.7)
Level-2: j )()()( 030201000 jjj eanMediterranAegeanCentral
uSoutheastEastBlackSea )()()(
jjjj 0060504 (3.5)
101 j (3.8)
Mixed m parental education model:
ruParenteduSoutheastCentraly
odel for the
ijjijjjij 010060100 )()()...( (3.9)
Where:
10 = Regression coefficient associated with predictor “parent education”
were
build on the base model, thus the mixed model of these models had an equation similar to
Equatio e
Similar to the parental education model, other student background models
n 3.9 but with a level-1 predictor other than the parental education variable. Thes
mixed models included the following student background variables: frequency of
speaking Turkish at home, home resources, and parental education level.
89

The final student background model examined the joint effects of all student
background factors on the regional achievement differences. Therefore, the model
included all student-level variables added to the base model. This analysis revealed the
extent to which regional differences in science achievement were related to student
background factors, before taking school factors into account. The mixed model for this
final student background model — overall student background model (Equation 3.10)
had an equation similar to Equation 3.9 of the parental education model but also included
all other student-level variables.
Mixed model for the overall student background model:
ijjijYijjjij ruStdlevelYStdlevelSoutheastCentraly )()...1()()...( 0010060100
(3.10)
Where:
10 … 0Y = Regression coefficients associated with student-level variables
School Context Models
The literature review suggested that several school factors, such as availability of
school resources and positive school climate for academic achievement, can be changed
or improved to create conditions conducive to teaching and learning. Thus, such school
environment variables were considered as potential mechanisms to help alleviate
socioeconomic disadvantage. As documented in Chapter 2, in Turkey, school resources
were distributed unevenly, with inadequacies of resources in some regions, including lack
90

of space, limited budget for supplies, little or no science laboratory equipment, and few
audio-visual resources, all with the potential to negatively affect the quality of science
instruction. Moreover, characteristics of the learning environment in Turkey’s schools,
including the level of teachers’ expectations for student achievement, parental support for
student achievement, parental involvement in school activities, and students’ desire to do
well in school, also differed across regions and varying levels of school climate for
learning were related to the differences in science achievement.
To explore the contribution of school factors to the regional achievement
differences, several school context models attempted to discover the effect of school
factors on science achievement. Each model built upon the base model (i.e., the region
model) and included only one school/class level variable. This allowed investigating the
influence of each school/class factor on regional achievement differences. For example,
the school resources model tested the effects of shortages of school resources available
for science instruction. Because the school resources model did not consist of any
predictor at the student-level, it had the same level-1 equation of the base model.
However, at level-2 (Equation 3.11), the school resources variable was included in the
model in addition to the six region variables of the base model. The combined model for
the school resources model, that analyzed the data simultaneously at two levels, is
represented in Equation 3.12.
91

Level-1: ijjij 0 ry (3.1)
Level-2:
)()()()( 04030201000 jjjjj BlackSeaeanMediterranAegeanCentral
uurcesSchoolresoSoutheastEast )()()(
jjjj 0070605 (3.11)
Mixed model for the school resources model:
ijjjjjij ruurcesSchoolresoSoutheastCentraly )()()...( 007060100 (3.12)
Effects of a school atmosphere that is more conducive to learning may be
investigated in a school climate model which was also build on the base model following
the approach used in the school resources model. The mixed model of the school climate
model would, therefore, have an equation similar to Equation 3.12 but including a school
climate variable instead of a school resources variable.
Turkey’s less developed regions have higher proportions of rural schools
compared to developed regions. Also, isolated or less populated rural schools in Turkey
characterized by scarcer resources compared with urban schools, thus it was anticipated
that they would underachieve compared with urban schools. The literature review
suggested that school community type (i.e., rural or urban) may affect students’ academic
achievement in Turkey. Because of the relationship of the two school/class-level
92

variables —region and community type of the school— with each other as well as with
achievement, there is an interest in attempting to disentangle the independent effects of
region and community type on achievement even though they are highly correlated. The
next school model explored the effects of school community type on the regional
achievement differences. As in the case for the mixed model of the school climate model,
combined equation of the school community model was similar to Equation 3.12 but
included school community as the level-2 predictor rather than the school resources
variable.
The final school context model examined the aggregate effects of all school
context factors on the regional differences in science achievement. Therefore, the model
included all school/class-level variables added to the base model. This analysis revealed
the extent to which regional differences in science achievement were related to school
context factors, before taking student background factors into account.
As shown in Equation 3.13, the mixed model for this final school context model
— overall school context model — had an equation similar to Equation 3.12 of the school
resources model but also included all other school/class-level variables.
Mixed model for the overall school context model:
ijjjXjij ruSchlevelXSchlevely 000100 )()...1( (3.13)
Where: 01 … X0 = Main effects for school-level variables
93

Final Model
The final model builds on the student background and school context models
presented in the previous sections. As discussed earlier, these student background and
school context models aimed to identify the independent or isolated effects of student
background and school context factors on the regional differences in science
achievement. Admittedly, however, the schooling process is a complex dynamic system
in which all student background and school context factors act interdependently in
influencing student outcome. That is, these factors do not operate in isolation but rather
they simultaneously act in an education system. Therefore, Turkey’s regional differences
in student achievement cannot be seen as solely a result of student background
characteristics or of school context factors. To acknowledge the integrated nature of the
education system, where multiple factors at different levels of the system (i.e., student-
level and school/class-level) operate simultaneously, the effects of these factors on the
regional achievement differences were studied by taking one another into account.
To determine the effects of school context factors after taking student background
into account, a final model was developed via combining the overall student background
model (Equation 3.10) and overall school context model (Equation 3.13). The final model
was the most inclusive one consisting of all student-level and school/class-level variables
and building on the base model. The mixed model for the final model is presented in
Equation 3.14.
94

Mixed model for the final model:
ijjijYijjXjij ruStdlevelYStdlevelSchlevelXSchlevely 001000100 )()...1()()...1(
(3.14)
Where:
01 … X0 = Main effects for school-level variables
10 … 0Y = Mean regression coefficients associated with student-level variables
95
Chapter 4 Regional Differences in Science Achievement in Turkey and the Influences of Student and School Factors
Using Turkey’s TIMSS 2007 science achievement data, the first phase of the data
analysis investigated regional differences in student outcomes at the eighth grade which
also is the end of compulsory education in Turkey. The second analytic phase using
multilevel statistical models capitalized on the student and school background data from
TIMSS 2007 to examine the relative impact of home and school factors associated with
regional differences in achievement. Hierarchical Linear Modeling (HLM) was used to
detect potential sources or reasons for the disparities in achievement between higher- and
lower-achieving geographic regions.
This chapter presents the results of each data analysis phase, beginning with a
section that presents the scope of Turkey’s regional disparities in science achievement at
the eighth grade. Possible explanations of the regional differences are presented in a
subsequent section. In all figures and tables, results are shown for the seven geographic
regions (see Figure 1.1 in chapter 1 for the map of Turkey) in descending order of their
Socioeconomic Development Index (SEDI) ranking (see Figure 1.2 in chapter 1).
96

Describing Turkey’s Regional Differences in Science
Achievement at the Eighth Grade
The hypothesis for this dissertation study was that Turkey’s different geographic
regions varied with respect to their student outcomes at the end of primary education
(grades 1 to 8), and specifically, that the socioeconomically less developed eastern part of
Turkey would attain lower science scores than the developed western part of the country.
This is despite the fact that Turkey has a firmly centralized education system and all
students are intended to be provided with similar learning opportunities in terms of
teaching time and content by the end of eighth grade. To examine Turkey’s regional
differences in student outcomes, average science achievement in each region and for the
country as a whole was computed.11
Differences in Average Achievement
Figure 4.1 displays, for each region and for Turkey, the TIMSS 2007 average
(mean) science scale scores (denoted by circles) with their 95 percent confidence
intervals (indicated by the bars extended above and below the circles). To aid in the
interpretation of the results, the percentages of students in the regions, the standard
deviations of the science scores, the SEDI (Socioeconomic Development Index) scores,
and the average age for the students tested are also shown in the table beneath the figure.
11 For this computation, IEA’s International Database Analyzer (IEA, 2008) was used.
97

Figure 4.1. TIMSS 2007 Average Science Achievement in Turkey and its Regions
Number of Cases
Percent of Students (SE)
Average Science Score (SE)
Standard Deviation (SE)
Average Age (SE)
SEDI Score
Marmara 1,362 25 (0.8) 465 (7.6) 92 (2.9) 13.96 (0.0) 1.702
Aegean 505 14 (1.2) 460 (9.7) 97 (4.5) 14.04 (0.0) 0.483
Central 739 19 (0.8) 464 (6.3) 90 (4.2) 13.96 (0.1) 0.481
Mediterranean 527 12 (0.8) 453 (12.8) 92 (3.6) 14.06 (0.1) 0.021
Black Sea 442 12 (0.6) 451 (11.6) 86 (4.6) 14.02 (0.1) -0.514
Southeastern 592 10 (0.6) 419 (9.3) 86 (4.6) 14.30 (0.1) -1.011
Eastern 331 8 (0.6) 437 (12.6) 91 (4.5) 14.07 (0.2) -1.162
TURKEY 4,498 100 (0.0) 454 (3.7) 92 (1.7) 14.03 (0.0) 0.000
Note. Standard errors are computed using jackknife procedure. SEDI scores are from Dincer, Ozaslan, & Kavasoglu (2003).
98

The TIMSS 2007 science scores indicated, in general, that the differences in
student outcomes corresponded to the socioeconomic disparities between the western and
eastern parts of Turkey. As expected, the pattern was that Marmara (the most developed
region with the highest SEDI score) together with the Aegean and Central Anatolia
regions had the highest average achievement. Eastern and, in particular, Southeastern
Anatolia (the two least developed regions with the lowest SEDI scores) were the lowest
achieving regions. Specifically, Marmara’s average score was 46 points above the
average score for Southeastern Anatolia.
The confidence intervals presented in Figure 4.1 may be used as a rough
indication of whether a region’s mean score is different from the mean of another region
or Turkey.12 However, a more sensitive test of statistical significance was performed in
this study as part of the HLM (Hierarchical Linear Modeling) analyses conducted to
examine potential sources of the regional differences. As explained later in the chapter,
the more sophisticated test of significance revealed that achievement differences between
Marmara and the two least developed regions were statistically significant, while the
differences between Marmara and the other four regions —Aegean, Central Anatolia,
Mediterranean, and Black Sea— were not. That is, these four regions and Marmara
performed similarly on the TIMSS 2007 science test. Overall, although a pattern exists,
there was more similarity in educational outcomes than in socioeconomic development
levels. This might be partially explained by Turkey’s common curriculum in primary 12 Confidence intervals allow for an “eyeball” test of significance on whether the differences in the estimates (i.e., means in this case) are statistically significant. If the confidence intervals of two estimates do not overlap, then the two estimates are considered to be statistically different. If the confidence intervals do overlap, then the estimates may or may not be statistically different.
99

schools. The fact all students are intended to be provided with similar learning
opportunities by the end of primary schooling may be helping Turkey’s large
socioeconomic disparities not to mirror precisely in educational achievement.
Differences at the TIMSS 2007 International Benchmarks
How can one interpret Turkey’s regional differences in science achievement in
terms of how much science students know and what they are able to do? What does, for
example, a 46 score point gap between Marmara and Southeastern Anatolia translate into
in terms of the size of student groups with different competency levels? In this study, to
better interpret the meaning of science achievement scores in Turkey and its regions,
student performance is described at the Advanced, High, Intermediate, and Low
International Benchmarks of the TIMSS 2007 science test (see Chapter 3 for a detailed
discussion of the TIMSS 2007 international benchmarks). To aid in interpretation, a short
definition of student competency at each benchmark is presented in Table 4.1.13
Table 4.1. Summary Definitions of the TIMSS 2007 International Benchmarks for
Science Achievement
TIMSS 2007 International Benchmarks of Science Achievement
Summary Definitions
Advanced International Benchmark Apply complex and abstract concepts
High International Benchmark Understand cycles, systems, and principles
Intermediate International Benchmark Communicate basic knowledge
Low International Benchmark Recognize some science facts
13 A general description of student competency at each benchmark is provided in Chapter 2 of the TIMSS 2007 International Science Report (Martin et al., 2008).
100

For Turkey and the regions, the percentages of students that reached each of the
four international benchmarks were computed14 and the results are displayed in Figure
4.2. In general, the higher performing more socioeconomically developed regions had
greater percentages of students reaching each benchmark and the lower performing
undeveloped regions had smaller percentages, though the variation in achievement at the
Advanced International Benchmark was not large. Unfortunately, in all regions, only a
very small percentage of Turkish eighth grade students reached the Advanced
International Benchmark. The hallmark of the Advanced Benchmark was demonstrating
competence on the TIMSS 2007 items concerning complex science concepts and
involving reasoning skills. The finding that only such small percentages of students
reached this level suggests that high quality education is provided for only a small
fraction of students in Turkey.
The distribution of low performers varied across the regions and was in line with
the results in Figure 4.1. That is, Southeastern and Eastern Anatolia had the lowest
percentages of students reaching the Low International Benchmark (57% and 66%,
respectively). This meant that, for example in Southeastern Anatolia, nearly half (43%) of
the students did not reach the lowest benchmark, indicating they did not demonstrate a
grasp of even the most basic facts in science. In contrast, the percentage of those students
who performed below the lowest benchmark was 25% in Marmara and Central Anatolia,
the two best performing regions.
14 For this computation, IEA’s International Database Analyzer (IEA, 2008) was used.
101

Figure 4.2. Percentages of Students Reaching the TIMSS 2007 International Benchmarks
of Science Achievement in Turkey and its Regions
0
10
20
30
40
50
60
70
80
90
100
Marmara Aegean Central Med. Black Sea Southeastern
Eastern TURKEY
Pe
rce
nta
ge
of
Stu
de
nts
Advanced High Intermediate Low
At Advanced or Above
At High or Above
At Intermediate or Above
At Low or Above
Marmara N Percent of Students (SE)
68 5 (1.1)
265 19 (2.6)
589 44 (3.5)
1,004 75 (2.9)
Aegean N Percent of Students (SE)
39 4 (1.0)
122 19 (1.9)
238 43 (4.5)
382 73 (4.3)
Central N Percent of Students (SE)
45 4 (1.5)
157 17 (3.2)
363 44 (3.0)
581 75 (1.8)
Mediterranean N Percent of Students (SE)
18 3 (0.8)
102 16 (3.7)
236 40 (5.1)
394 72 (6.0)
Black Sea N Percent of Students (SE)
10 2 (0.9)
61 13 (3.0)
184 40 (5.7)
325 71 (5.9)
Southeastern N Percent of Students (SE)
11 1 (0.7)
46 6 (2.4)
152 25 (5.5)
328 57 (4.2)
Eastern N Percent of Students (SE)
9 2 (1.0)
42 11 (3.9)
124 34 (5.8)
228 66 (4.8)
TURKEY N Percent of Students (SE)
199 3 (0.5)
795 16 (1.2)
1,885 40 (1.8)
3,242 71 (1.5)
Note. Standard errors are computed using jackknife procedure.
102

Comparison of Student and School Variance in Turkey
To further examine the regional differences in achievement, a series of statistical
analyses were carried out using HLM (Hierarchical Linear Modeling). HLM is a
regression technique for examining data with a hierarchical or nested structure (e.g., data
from schools, where students are nested within classes, and classes are nested within
schools) as in the case of Turkey’s sample in TIMSS 2007, and “at present, the use of
HLM is strongly recommended for nested data” (Braun, Jenkins, & Grigg, 2006a, p.7).
For this dissertation, the HLM analyses were performed using the HLM6 program
(Raudenbush, Bryk, & Congdon, 2004). Results from the HLM analyses of this study are
presented in the following paragraphs.
An analysis based on HLM typically begins with an unconditional model (also
known as the null model), which does not include any explanatory variables (see
Equation 3.3 in Chapter 3). This model decomposes the total achievement variance into
two components: variance between-upper level units (“schools/classes” in this study) and
variance between-lower level units (“students” in this study). As stated by Braun,
Jenkins, and Grigg (2006b), “the results of the variance decomposition enhance the
understanding of the likely sources of heterogeneity in student achievement and,
consequently, of the context in which the HLM analyses take place” (p.13).
103

The unconditional model analysis showed that one-third (34%) of the total
variation in science achievement in Turkey was due to differences among schools and the
remaining two-thirds (66%) of the total variance was attributable to heterogeneity among
students. These results suggest that the variation in Turkish students’ performance might
be related to school characteristics (i.e., factors that are constant for all students within a
school, such as the rural/urban setting of a school) as well as student characteristics (i.e.,
factors that varied for each student within a school, such as parental education).
It can be noted that the unconditional model estimated Turkey’s TIMSS 2007
average science achievement as 452. This estimate by HLM6 (the intercept term in the
unconditional model) was slightly different than the IDB Analyzer’s estimate (454) even
though the analyses with both programs included the same number of students,
incorporated five plausible value estimates of students’ science performance, and took
sampling (design) weights into account when estimating the population parameters
(intercepts and regression coefficients) and their standard errors. The estimates obtained
from the two programs were similar but not identical because the HLM’s multilevel
conceptual approach to parameter estimation differs from the IDB Analyzer’s single-level
approach.15 Therefore, “the model parameter estimated in a student-level analysis is not
generally the same as the model parameter estimated in a multilevel analysis” (Braun,
Jenkins, & Grigg, 2006b, p.37) and the two estimates would only be the same “in simple
situations with equal numbers of students per school and random sampling at both levels” 15 As discussed in detail in Raudenbush and Bryk (2002), a single-level analysis obtains an ordinary least square estimate, while HLM’s multilevel estimate is a precision (reliability) adjusted least square estimate. In HLM, schools with larger numbers of students count more in the estimation process because they are considered to provide more precise estimates compared to schools with small numbers of students.
104

(p.38). The estimate of Turkey’s mean science score obtained by HLM6’s two-level
analysis (school- and student-level) represents the weighted average of school mean
scores using a procedure that weights large schools somewhat more heavily, while the
estimate from the IDB Analyzer’s student-level analysis represents the average of
individual student scores. Because the number of students in Turkey’s sampled
schools/classes varied substantially (from 5 to 67), it was expected that the two estimates
would not be identical.
Regional Differences in School Achievement
Following the unconditional model, the first conditional model of this study tested
the effects of the region factor in order to establish a base model for subsequent
multilevel analyses. Further conditional models investigated student and school
background factors that, if controlled statistically, could be expected to diminish the
magnitude of the region effect. The steps involved in these analyses are summarized in
Table 4.2. The base model included no exploratory variable at the student-level (level-1)
and only region at the school-level (level-2). Subsequently, student models and school
models were built on the base model to show how the inclusion of various student-level
and school-level predictors changes the estimate of the region effects. Lastly, the
predictors that were statistically significant were included together in a final model that
tested the joint effects of those predictors on regional differences in achievement. The
results from the base model are presented in this section. The next section —explaining
regional differences— presents the results from the subsequent statistical models.
105

Table 4.2. Steps Involved in Modeling Regional Differences
Multilevel Model Variables in Student-Level Variables in School-Level Base None Region
Student Important student characteristics Region
School None Region + Important school characteristics
Final Significant student characteristics Region + Significant school characteristics
Table 4.3 displays the results from the base model, which compared average
science achievement (based on the weighted average of school means as described
earlier) in Marmara (the most developed region) to average science achievement in each
of the other six regions.16 The table shows the estimates (regression coefficients) of
regional contrasts that represent the average achievement difference between Marmara
and each region. That is, the base model tested the effect of attending school in each of
the six regions compared to attending school in Marmara. The results revealed that
students in the two least developed regions, Eastern and Southeastern Anatolia,
performed significantly lower, on average, than students in Marmara (pEastern=.020 and
pSoutheastern=.001, respectively). Specifically, the mean TIMSS 2007 science score in
Southeastern Anatolia was estimated to be 47 points lower than the mean score in
Marmara.17
16 Each region was represented with a dummy variable where Marmara was the reference category as presented in Table A.2 of the Appendix A. Base model was represented in Equation 3.6 in Chapter 3. 17 The intercept and regression coefficients of the base model were not identical but very close to the ones presented in Figure 4.1 As explained previously, the differences in the parameter estimates are due to the conceptual differences in parameter estimation techniques between a multilevel and a single-level analysis.
106
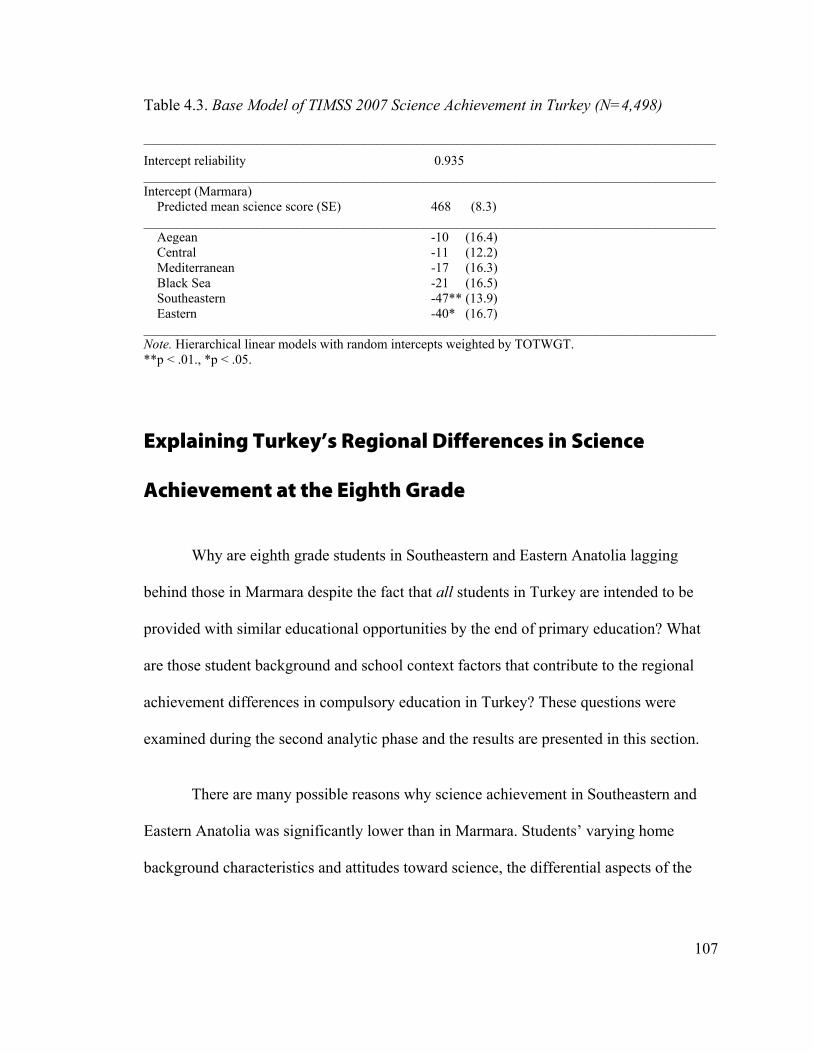
Table 4.3. Base Model of TIMSS 2007 Science Achievement in Turkey (N=4,498)
______________________________________________________________________________________
Intercept reliability 0.935 ______________________________________________________________________________________ Intercept (Marmara) Predicted mean science score (SE) 468 (8.3) ______________________________________________________________________________________ Aegean -10 (16.4) Central -11 (12.2) Mediterranean -17 (16.3) Black Sea -21 (16.5) Southeastern -47** (13.9) Eastern -40* (16.7) ______________________________________________________________________________________ Note. Hierarchical linear models with random intercepts weighted by TOTWGT. **p < .01., *p < .05.
Explaining Turkey’s Regional Differences in Science
Achievement at the Eighth Grade
Why are eighth grade students in Southeastern and Eastern Anatolia lagging
behind those in Marmara despite the fact that all students in Turkey are intended to be
provided with similar educational opportunities by the end of primary education? What
are those student background and school context factors that contribute to the regional
achievement differences in compulsory education in Turkey? These questions were
examined during the second analytic phase and the results are presented in this section.
There are many possible reasons why science achievement in Southeastern and
Eastern Anatolia was significantly lower than in Marmara. Students’ varying home
background characteristics and attitudes toward science, the differential aspects of the
107

schools they attend, or various combinations of student and school factors might all be
playing significant roles in Turkey’s regional differences in student outcomes. This
section presents the results from a series of multilevel analyses that were conducted to
explore factors that contributed to Turkey’s regional disparities in achievement.
Statistical modeling was carried out in two steps. First, a lengthy process was used to
screen and identify background variables for inclusion in the multilevel modeling. Next,
those variables that were selected in the screening process were included in the statistical
models to identify factors that, if altered, could serve to reduce the magnitude of the
region effect.
Identification of Factors Related to Regional Differences in Science
Achievement
This study used two criteria to identify background factors to be included in the
multilevel models of regional achievement. Background variables that satisfied these
criteria were included in the student and school models in order to test whether the
variables accounted for regional differences in science achievement:
1. The variable was positively associated with achievement both at the country and
the regional level. That is, achievement was higher for students in some categories
of the variable than others (e.g., for the parental education variable, students
whose parents had university or higher education had higher achievement than
students whose parents had lower levels of education).
108

2. The percentages of students in various categories of the variable differed among
regions, particularly between the developed and undeveloped regions. For
example, Marmara (and/or other developed regions) had higher percentages of
students in the favorable categories of the variable (e.g., parents with university
degree) or, Southeastern and Eastern Anatolia had higher percentages of students
in the unfavorable categories of the variable (e.g., parents with less than primary
education).
As noted earlier, the aim of this study was to develop an explanatory model of
Turkey’s regional achievement differences and not simply a model of student
achievement differences in Turkey. In the case of the latter model, it would have been
sufficient to identify those variables that would explain the most variation in student
achievement. Even though the first criterion is important and a prerequisite for explaining
regional differences in achievement, it does not mean that those factors that are
associated with higher student achievement overall necessarily contribute to regional
disparities. In addition to satisfying the first criterion, for a variable to help explain the
relatively higher performance of the developed regions, it needed to vary between
developed and undeveloped regions in such a way that it had favorable values for
developed regions. Similarly, to help explain the low performance of undeveloped
regions, a variable needed to vary in such a way that it had unfavorable values for
undeveloped regions.
109

The literature review (Chapter 2) established the theoretical base for exploration
of those background variables that satisfied the above two criteria and the background
data almanacs in the TIMSS 2007 International Database (Foy & Olson, 2009) provided
the empirical basis. For each country, these data almanacs provided statistical summaries
of the data collected from students, teachers, and schools. First, based on the literature
review, the almanacs for Turkey were reviewed to identify those factors that showed an
association with science achievement. In addition, the IDB Analyzer was used to perform
a similar review at the region level. As a result of this exploratory analysis, more than 30
variables were identified that satisfied the first criterion of being associated with science
achievement in Turkey and its seven regions.
Because some of these initial variables were related to a single underlying
construct, responses to the individual variables were combined to create an index that
would summarize the information from the component variables in a concise manner (see
Chapter 3 for a discussion of constructing the indices). Thus, a total of 10 background
measures —based on four single variables and six indices— were examined at the initial
exploratory data analysis stage. As shown in Table 4.4, these included a range of seven
student background measures and three school background measures.
110

Table 4.4. Background Factors Explored for Association with Regional Differences in
Science Achievement
Student Background Measure School Background Measure
1. Frequency of speaking Turkish at home 1. School community type (based on principals’ reports)
2. Parents’ highest education level 2. Index of principals’ reports on positive school climate for academic achievement
3. Index of home resources 3. Index of teachers’ reports on adequacy of school resources in teaching science
4. Index of self-confidence in learning science
5. Index of valuing science
6. Index of positive affect toward science
7. Students’ educational aspirations
Detailed information about these student and school background measures are
provided in the Appendix, in Tables A.1 and A.2, respectively. This information includes
the source of the data (i.e., whether the data were collected from students, teachers, or
schools), the text of the questions together with their response categories, and how
missing data were handled.18 The appendix tables also include information about recoded
or collapsed response categories. For example, the question about school community type
originally had six response options and was recoded for the purposes of this study into
two categories —rural and urban. Finally, the appendix also provides an explanation of
how each index was computed along with the reliability of the underlying scale and the
total scale variance accounted for by the component variables of the index.
18 Response rates for the variables under exploration were high (98% or above). Therefore, missing data did not pose any problem in general. However, HLM6 requires complete data at level-2 of the analysis, hence missing data were replaced prior to the multilevel analysis using the conditional mean imputation method.
111
The 10 variables meeting the first criteria of being related to science achievement
were then further examined to determine whether or not they satisfied the second
criterion of differing among regions. For each of the 10 background measures, the
weighted percentages of students (together with the average science achievement) in
different categories of the variables were computed19 for Turkey and the regions. Results
for the seven student indicators are shown in Figures 4.3 to 4.7 and for the three school
indicators in Figures 4.8 to 4.10. These results essentially formed the basis for judging
whether any of the 10 variables also satisfied the second criteria for inclusion in the
multilevel models —that higher performing regions would have higher percentages of
students in the more favorable categories and lower percentages in less favorable
categories.
Regional Differences in Student Background Measures Related to Science
Achievement
Figures 4.3 to 4.7 present the extent to which the students across the regions
differed from each other regarding the seven student background measures. In summary,
among the seven background measures, three met both criteria of inclusion in the
multilevel models. These measures consisted of frequency of speaking Turkish (the
language of the test) at home, parents’ highest education level, and index of home
resources. The remaining four factors related to students’ attitudes, including the index of
self-confidence in learning science, index of valuing science, index of positive affect
19 For this computation, IEA’s International Database Analyzer (IEA, 2008) was used.
112

toward science, and students’ educational aspirations did not show that regional
differences in higher or lower levels of science achievement were systematically related
to more or less positive attitudes in the regions.
Figure 4.3 summarizes students’ reports of how frequently they spoke Turkish at
home, together with average science achievement. On average in the country, a large
majority of students (89%) reported always or almost always speaking Turkish at home
and these students had higher average science achievement than those who reported
speaking Turkish less frequently (sometimes or never) —461 points and 396 points,
respectively. That is, student achievement increased as the fluency in Turkish, the
language of instruction, increased. This finding is consistent with the language situation
in Turkey. As mentioned in the literature review (Chapter 2), Turkish is the formal
language of instruction in Turkey, but a major ethnic group (Kurds) with a mother-tongue
other than Turkish populates the eastern part of the country.
The overall national result between language spoken at home and science
achievement was also evident at the regional level. In all regions, there was a positive
relationship between the frequency of speaking Turkish at home and science
achievement. The two lowest performing regions, Southeastern and Eastern Anatolia, had
the highest percentages of students from homes where Turkish is not often spoken (41%
and 22%, respectively), while in the higher performing regions, the percentages of
students in this category were less than 10 percent. Clearly, students in Southeastern and
Eastern Anatolia may be disadvantaged in terms of their fluency speaking Turkish
113

Figure 4.3. Frequency of Speaking Turkish at Home in Turkey and Its Regions
0
10
20
30
40
50
60
70
80
90
100
Marmara Aegean Central Med. BlackSea
Southeastern
Eastern TURKEY
Per
cen
tag
e o
f S
tud
ents
Alw ays or almost alw ays Sometimes or never
Always or almost always Sometimes or never
Marmara N % of Students (SE) Mean Score (SE)
1,287 95 (0.7) 468 (7.6)
75 5 (0.7) 424 (13.9)
Aegean N % of Students (SE) Mean Score (SE)
477 94 (2.4) 464 (8.9)
27 6 (2.4) 382 (11.7)
Central N % of Students (SE) Mean Score (SE)
702 92 (4.8) 470 (7.5)
36 8 (4.8) 393 (14.3)
Mediterranean N % of Students (SE) Mean Score (SE)
495 94 (1.8) 458 (12.4)
31 6 (1.8) 383 (21.2)
Black Sea N % of Students (SE) Mean Score (SE)
418 95 (0.8) 454 (12.2)
22 5 (0.8) 396 (19.1)
Southeastern N % of Students (SE) Mean Score (SE)
364 59 (6.7) 436 (10.6)
226 41 (6.7) 396 (7.9)
Eastern N % of Students (SE) Mean Score (SE)
260 78 (3.9) 451 (11.6)
67 22 (3.9) 387 (14.9)
TURKEY N % of Students (SE) Mean Score (SE)
4,003 89 (1.2) 461 (3.8)
484 11 (1.2) 396 (5.1)
Note. Standard errors are computed using jackknife procedure.
114

(the medium of instruction) and their understanding of what is spoken in class. These
unfavorable conditions may in turn hinder students’ capacity to grasp content of the
instruction and develop cognitive skills.
Also discussed in Chapter 2, socioeconomically disadvantaged students tend to be
concentrated in the eastern part of Turkey and attend schools with large differences on all
socioeconomic indicators, including parental education level and home resources. The
scope of the regional differences in parental education and home resources are depicted
in Figures 4.4 and 4.5, respectively. Figure 4.4 presents students’ reports of the highest
level of education attained by their parents. For each region and for Turkey as a whole,
the percentage of students in each of the six categories of parents’ educational level is
shown, together with average science achievement. The education level of the parent with
more education was used in assigning students to categories.20 The sixth category —“I do
not know” — was also included even though, in Turkey, only one percent of students
reported not being certain about their parents’ level of educational attainment.
Perhaps most striking, Figure 4.4 reveals a grim picture of the level of parental
education in Turkey. For two-thirds of the Turkish eighth grade students (68%), the
highest level of education for either (or both) parents was very minimal (i.e., either with a
primary school education or did not finish primary school or go to school at all). Twenty
percent had at least one parent with high school education, and only 10 percent had at
least one parent who completed a degree beyond high school. Consistent with the
20 This essentially meant in Turkey that fathers’ education level was used when assigning students to categories because only 6% of the students had a mother with more education than the father.
115

Figure 4.4. Parents’ Highest Education Level in Turkey and Its Regions
0
10
20
30
40
50
60
70
80
90
100
Marmara Aegean Central Med. Black Sea Southeastern
Eastern TURKEY
Per
cen
tag
e o
f S
tud
ents
Univ. or more Higher than HS but no univ. HS PS Less than PS Do not know
University or higher
Higher than high school but not univ.
High school Primary school
Less than primary school
Do not know
Marmara N % of Students (SE) Mean Score (SE)
97 6 (1.1) 570 (13.2)
42 3 (0.7) 511 (18.2)
286 22 (2.1) 490 (7.3)
726 55 (2.0) 453 (7.3)
191 14 (1.8) 427 (9.4)
13 1 (0.3) 387 (32.2)
Aegean N % of Students (SE) Mean Score (SE)
65 9 (2.7) 567 (13.9)
22 4 (0.8) 550 (14.4)
106 21 (4.1) 485 (8.9)
240 51 (3.7) 441 (11.7)
63 14 (3.8) 409 (10.9)
5 1 (0.5) 384 (46.0)
Central N % of Students (SE) Mean Score (SE)
120 12 (3.3) 560 (13.8)
41 5 (0.7) 520 (15.8)
164 20 (2.1) 490 (8.1)
334 51 (3.2) 435 (3.8)
67 11 (2.1) 428 (8.4)
8 1 (0.7) 411 (37.8)
Mediterranean N % of Students (SE) Mean Score (SE)
44 7 (1.4) 550 (16.1)
16 3 (0.9) 528 (14.5)
119 20 (2.8) 493 (7.2)
255 52 (2.8) 436 (14.1)
87 18 (2.1) 417 (11.6)
6 1 (0.6) 390 (39.2)
Black Sea N % of Students (SE) Mean Score (SE)
15 3 (1.5) 525 (17.6)
15 3 (1.1) 491 (15.5)
94 20 (5.1) 486 (18.7)
248 60 (6.0) 438 (14.2)
54 13 (2.3) 434 (14.3)
2 0 (0.3) 408 (49.1)
Southeastern N % of Students (SE) Mean Score (SE)
20 3 (0.8) 486 (32.4)
19 3 (1.1) 490 (20.2)
95 15 (3.1) 452 (17.4)
288 51 (3.9) 416 (8.0)
145 25 (2.3) 404 (8.2)
17 3 (1.3) 326 (22.6)
Eastern N % of Students (SE) Mean Score (SE)
25 7 (2.8) 516 (28.1)
10 2 (1.0) 461 (25.4)
81 23 (5.0) 472 (12.9)
122 40 (3.6) 427 (15.9)
78 26 (4.1) 418 (9.0)
7 2 (1.0) 347 (45.4)
TURKEY N % of Students (SE) Mean Score (SE)
386 7 (0.8) 554 (7.0)
165 3 (0.3) 513 (8.0)
945 20 (1.2) 485 (4.0)
2,213 52 (1.3) 439 (4.0)
685 16 (1.0) 420 (4.8)
58 1 (0.2) 373 (15.9)
Note. Standard errors are computed using jackknife procedure.
116

Figure 4.5. Index of Home Resources in Turkey and Its Regions
0
10
20
30
40
50
60
70
80
90
100
Marmara Aegean Central Med. BlackSea
Southeastern
Eastern TURKEY
Per
cen
tag
e o
f S
tud
ents
High home resources Low home resources
High home resources Low home resources
Marmara N % of Students (SE) Mean Score (SE)
602 41 (4.1) 497 (7.6)
760 59 (4.1) 443 (6.7)
Aegean N % of Students (SE) Mean Score (SE)
221 38 (5.7) 515 (8.9)
284 62 (5.7) 426 (10.4)
Central N % of Students (SE) Mean Score (SE)
395 46 (4.3) 501 (12.1)
344 54 (4.3) 433 (3.7)
Mediterranean N % of Students (SE) Mean Score (SE)
161 26 (5.1) 508 (9.9)
366 74 (5.1) 435 (12.6)
Black Sea N % of Students (SE) Mean Score (SE)
111 23 (5.4) 490 (14.1)
331 77 (5.4) 440 (13.1)
Southeastern N % of Students (SE) Mean Score (SE)
138 20 (3.4) 460 (21.8)
454 80 (3.4) 409 (6.4)
Eastern N % of Students (SE) Mean Score (SE)
116 31 (6.9) 491 (16.3)
215 69 (6.9) 413 (9.9)
TURKEY N % of Students (SE) Mean Score (SE)
1,744 34 (1.9) 498 (4.5)
2,754 66 (1.9) 430 (3.6)
Note. Standard errors are computed using jackknife procedure.
117

disparities in socioeconomic development, parents’ education level differed across the
regions. Central Anatolia (it includes the capital city, Ankara), one of the most developed
and high performing regions, had the highest percentage of students (17%) with parents
who finished a degree beyond high school. Regarding the least educated parents, the
students in Southeastern and Eastern Anatolia were in the most disadvantaged home
environments with a quarter of the students having neither parent finish even primary
schooling.
As shown in Figure 4.4, higher levels of parents’ education are associated with
higher average achievement in all regions and in Turkey as a whole. The pattern of
association between parental education and student outcomes was most evident in the
Aegean region where average science achievement of eighth grade students with
university (or advanced degrees) educated parents was 158 points greater than the
average of students whose parents had less than primary schooling.
Figure 4.5 presents, for Turkey and the regions, the percentages of students at the
high compared to the low level of the index of home resources, together with the
students’ average science achievement. The “Home Resources Index” was developed
based on students’ reports of the following variables: number of books in the home;
presence in the home of three educational aids, including a computer, study desk for
118

student’s own use, and Internet connection in the home; 21 and having three home
possessions (a dishwasher, a heating system with radiator, and a DVD/CD player). This
index was used as a proxy measure of family income specific to Turkey. 22 Students
assigned to the high level of this index came from homes with four or more of these
seven resources.23 Students assigned to the low level had three or fewer home resources.
On average in Turkey, one-third of students were at the high level of the “Home
Resources Index”, although the distribution varied from region to region. Central
Anatolia had the highest proportion of students from well-resourced homes (almost half
of them were at the high index level). In comparison, Southeastern Anatolia had the
lowest proportion of students (20%) at the high level. In all regions, students at the high
level of the index had higher average achievement compared with those at the low level.
Figures 4.3 to 4.5 show clearly that disadvantaged students in Turkey tended to be
concentrated in the eastern part of the country and had vast home background
disadvantages compared to the high performing regions in terms of frequency of speaking
the language of instruction, parental education level, and home resources. These three
home background measures satisfied both criteria for inclusion in the multilevel
modeling.
21 Having a dictionary at home was not included in the index because almost all Turkish eighth grade students (94%) had a dictionary at home. As to the calculator variable, despite some observed variability (84% of the students had a calculator at home) it was omitted from the index because it did not help increasing the index reliability. 22 Almost all students (94%) came from homes with a washer, thus the variable was not among the selected proxy measures of family income in Turkey. 23 Presence of books at home corresponded to having more than 25 books and absence of books was defined as having 25 or fewer books at home.
119

As discussed in the literature review, students with positive attitudes toward
science may be more motivated to learn, which in turn is likely to increase achievement
in science. In addition to home background factors, this study also examined students
across the regions in terms of the following four attitudinal dimensions: how they
perceived their abilities in learning science (i.e., whether they were self-confident in
learning science), the value they placed on science (i.e., whether they thought that it was
advantageous in life to learn science well), how much they liked science (i.e., whether
they liked science and enjoyed learning it), and their expectations for further education.
Figure 4.6 shows the extent to which Turkish students across the regions differed
from each other in relation to the following three measures of students’ attitudes: index of
self-confidence in learning science, index of valuing science, and index of positive affect
toward science.24 In Turkey and in all the regions, there was a positive association
between science achievement and self-confidence in learning science —the first
attitudinal dimension shown in Figure 4.6. Students at the high level of the index (i.e.,
students who are confident about their science ability, including those who reported that
they learn things quickly in science and perform well in science) had higher average
science achievement than those at the low level (484 points and 424 points, respectively).
However, the percentages of students at the levels of the index did not vary across the
regions. In all regions, while half of the students expressed high confidence levels about
24 Table A.1 provides detailed information about component variables that were combined to construct these three student attitude indices. Bars on the figure represent the percentage of students in the high category of the three indices. The percentage of students in the low category may simply be calculated by subtracting the percentage of students in the high category from 100. The table beneath the figure presents, for Turkey and the regions, the percentage of students at both levels of the indices, together with the average science achievement for the students.
120

Figure 4.6. High Categories of Self-confidence in Learning Science Index, Valuing Science Index, and Positive Affect Toward Science Index in Turkey and Its Regions
0
10
20
30
40
50
60
70
80
90
100
Marmara Aegean Central Med. Black Sea Southeastern
Eastern TURKEY
Perc
en
tag
e o
f S
tud
en
ts
High self-confidence High valuing Science High positive Affect
High self-confidence
Low self-confidence
High valuing science
Low valuing science
High positive affect
Low positive affect
Marmara N % of Students (SE) Mean Score (SE)
668 50 (2.6) 501 (8.5)
684 50 (2.6) 431 (7.1)
874 65 (1.7) 469 (7.9)
478 35 (1.7) 459 (7.9)
1,023 76 (2.0) 472 (7.7)
327 24 (2.0) 447 (8.6)
Aegean N % of Students (SE) Mean Score (SE)
252 49 (3.8) 497 (9.0)
248 51 (3.8) 425 (10.2)
320 64 (3.9) 467 (9.4)
181 36 (3.9) 449 (13.6)
133 73 (5.0) 473 (8.2)
370 27 (5.0) 426 (16.8)
Central N % of Students (SE) Mean Score (SE)
381 53 (3.1) 491 (9.5)
350 47 (3.1) 435 (6.4)
509 72 (2.4) 468 (7.3)
221 28 (2.4) 456 (8.0)
186 76 (2.7) 474 (7.2)
547 24 (2.7) 434 (11.4)
Mediterranean N % of Students (SE) Mean Score (SE)
279 53 (5.0) 478 (12.5)
234 47 (5.0) 431 (13.9)
370 72 (2.2) 455 (13.9)
145 28 (2.2) 457 (10.3)
427 84 (1.8) 457 (11.8)
87 16 (1.8) 444 (20.3)
Black Sea N % of Students (SE) Mean Score (SE)
243 53 (2.8) 477 (11.8)
192 47 (2.8) 422 (13.7)
310 70 (1.7) 458 (12.5)
128 30 (1.7) 437 (14.2)
335 74 (2.7) 459 (12.0)
104 26 (2.7) 429 (13.4)
Southeastern N % of Students (SE) Mean Score (SE)
299 51 (2.9) 441 (9.3)
283 49 (2.9) 400 (9.4)
416 72 (2.8) 423 (8.8)
163 28 (2.8) 415 (10.6)
448 76 (2.9) 424 (8.8)
135 24 (2.9) 409 (12.7)
Eastern N % of Students (SE) Mean Score (SE)
174 52 (3.9) 473 (11.5)
149 48 (3.9) 403 (14.0)
256 78 (2.8) 441 (12.6)
72 22 (2.8) 429 (16.9)
278 86 (1.4) 441 (12.9)
48 14 (1.4) 423 (16.4)
TURKEY N % of Students (SE) Mean Score (SE)
2,296 51 (1.3) 484 (4.0)
2,140 49 (1.3) 424 (3.9)
3,055 69 (1.0) 458 (3.9)
1,388 31 (1.0) 448 (4.4)
3,428 77 (1.1) 462 (3.7)
1,020 23 (1.1) 433 (5.2)
Note. Standard errors are computed using jackknife procedure.
121

their science ability, the other half did not. Stated differently, no region was in a
comparatively favorable or unfavorable situation in terms of students’ self-confidence in
science. That Turkish students’ perceived level of difficulty in science was similar from
one region to another may partially be explained by Turkey’s common science
curriculum in primary education across the country.
The second attitudinal dimension shown in Figure 4.6 is the index of valuing
science. This index measured the value students placed on science in their lives. Students
in the high level of the index showed that they placed a high value on science by agreeing
with statements that learning science would help them in their daily life, learn other
school subjects, get a university education, and the job they desired. Students who
disagreed with these statements were assigned to the low level. Even though Turkish
eighth grade students generally placed a high value on learning science (69% of students
on average) there was no or little association between valuing science learning and
average science achievement across the regions.
As indicated by the results for the third dimension presented in Figure 4.6,
Turkish eighth grade students also had very positive attitudes toward science, generally.
In Turkey, 77 percent of students were in the high category of the “Positive Affect
Toward Science Index”, agreeing to statements indicating that they liked science and
enjoyed learning it. Students in the high category of the index performed moderately
higher in science compared with students who were placed in the low index level (462
122

and 433 points, respectively). However, three-fourths or more of the students were at the
high level in all regions.
In addition to the limited variability across regions in the three attitudinal
dimensions, was the unexpected finding that more students in Eastern Anatolia than other
regions reported positive attitude toward science. Eastern Anatolia, the least
socioeconomically developed region and one of the two lowest performing regions, had
the highest percentage of students at the high levels of the index of valuing science and
the index of positive affect toward science (78% and 86%, respectively). Because it is
widely believed that positive attitudes motivate students to learn and this in turn enhances
achievement, the findings in Eastern Anatolia might seem counterintuitive. Nevertheless,
low-achieving students reporting very positive attitudes has occurred before. For
example, most recently in TIMSS 2007 (Martin et al., 2008), the highest percentage
(92%) of eighth grade students who placed a high value on science (i.e., agreed to
statements that learning science would help them in their daily life, learn other school
subjects, and get the university education and the job they want) was reported by students
in Ghana, the least performing and the least developed nation among 49 participating
countries. Also in Ghana, 80 percent of eighth grade students highly endorsed statements
such as “I like science” and “I enjoy learning science”.
Consistent findings have emerged from another international study —ROSE
(Relevance of Science Education), which investigated 15-year-old students’ attitudes
toward science and technology. Sjoberg and Schreiner (2006) found that most students
123

(aged 14 to 16) in 25 participating countries agreed to statements valuing science (e.g.,
science is important for society) but students in developing countries, such as Uganda and
Bangladesh responded more positively than students in developed countries including
England, Japan, and Norway. The authors also found that “In general, students in
developing countries like school science very much, whereas students in richer parts of
the world are more negative” (p.68). It is unclear why students in less developed areas
provide socially desirable responses to attitudinal statements. Various psychological,
social, and economic factors may play a role in responding in a socially desirable manner.
Because an expectation to pursue further education may motivate students to put
more effort into learning and this could result in higher levels of performance, regional
differences in students’ educational aspirations are presented in Figure 4.7. There was a
positive association between Turkish eighth grade students’ educational expectations and
science achievement. That is, the more schooling they expected to pursue, the higher their
science achievement on TIMSS 2007. However, as shown in the figure, Turkish students
across the regions had similar educational expectations. In general, approximately 20% of
eighth grade students did not know how far they might advance in their education, about
30% reported plans to complete high school and perhaps some further vocational
training, and almost half of the students said that they expected to finish university or
receive advanced degrees including master’s and doctoral degrees. Considering that only
seven percent of the students had parents who completed a university or higher degree
(see Figure 4.4), at the very least the results suggest that Turkish students expect to
receive more education than their parents.
124

Figure 4.7. Students’ Educational Expectations in Turkey and Its Regions
0
10
20
30
40
50
60
70
80
90
100
Marmara Aegean Central Med. Black Sea Southeastern
Eastern TURKEY
Per
centa
ge
of S
tuden
ts
HS Higher than HS but no univ. Univ. Higher than univ. Do not know
High school Higher than high school but not univ.
University Higher than univ.
Do not know
Marmara N % of Students (SE) Mean Score (SE)
233 17 (1.7) 404 (7.8)
247 19 (1.3) 444 (7.9)
382 29 (1.4) 497 (6.4)
247 18 (1.7) 546 (7.2)
243 17 (2.0) 417 (9.1)
Aegean N % of Students (SE) Mean Score (SE)
69 16 (2.2) 394 (7.5)
76 15 (2.6) 443 (11.2)
127 26 (3.4) 492 (9.7)
139 24 (2.6) 539 (9.2)
87 19 (4.1) 393 (11.0)
Central N % of Students (SE) Mean Score (SE)
105 17 (1.6) 393 (7.9)
133 19 (2.2) 450 (5.0)
211 28 (2.0) 489 (8.6)
195 23 (2.4) 536 (13.5)
91 14 (1.4) 404 (7.5)
Mediterranean N % of Students (SE) Mean Score (SE)
65 14 (3.0) 395 (15.6)
73 13 (3.3) 438 (15.2)
149 29 (2.9) 483 (8.0)
117 20 (3.3) 523 (14.4)
121 24 (2.5) 405 (13.2)
Black Sea N % of Students (SE) Mean Score (SE)
71 17 (2.7) 396 (11.7)
90 21 (2.4) 443 (7.3)
117 26 (4.2) 495 (9.3)
79 17 (3.9) 512 (13.4)
72 19 (4.4) 409 (22.1)
Southeastern N % of Students (SE) Mean Score (SE)
88 15 (2.1) 379 (8.7)
87 16 (1.9) 416 (11.2)
127 21 (2.7) 459 (8.5)
121 19 (2.8) 476 (19.3)
161 29 (3.7) 379 (4.0)
Eastern N % of Students (SE) Mean Score (SE)
37 12 (3.1) 369 (15.4)
33 9 (2.1) 425 (19.3)
70 21 (3.8) 460 (15.4)
124 38 (4.9) 476 (14.8)
62 20 (3.6) 391 (13.3)
TURKEY N % of Students (SE) Mean Score (SE)
668 16 (0.9) 394 (4.1)
739 17 (0.9) 441 (3.7)
1,183 27 (1.0) 487 (3.7)
1,022 21 (1.1) 521 (4.8)
837 19 (1.1) 401 (4.2)
Note. Standard errors are computed using jackknife procedure.
125

Consistent with the high percentages of students valuing science and having a
positive affect toward science, Eastern Anatolia had the highest percentage of students
with the most ambitious educational aspirations. That is, 38 percent of the students in the
region reported that they expected to get a master’s or doctoral degree. The other two
regions with relatively high percentages of students within the most favorable category
were the relatively higher performing Aegean and Central Anatolia regions (24% and
23%, respectively). As shown in Figure 4.4, students in these three regions also had the
highest percentages of students in the most favorable parental education category (i.e.,
finished university or master’s or doctoral degree), suggesting that a high level of
parental education may be a motivating factor in students’ aspirations for further
education.
Regional Differences in Effective School Contexts for Learning Science
In addition to students’ characteristics, the learning environments that schools
provide are critical in enhancing student achievement. Figures 4.8 to 4.10 show the extent
to which schools across the regions differed from each other in regard to three school
background measures including school community type (i.e., whether schools are located
in rural or urban settings), the index of principals’ reports on positive school climate for
academic achievement, and the index of teachers’ reports on adequacy of school
resources in teaching science. In summary, all three school context factors identified in
the exploratory analysis as being positively associated with higher science achievement
in Turkey overall and regionally also met the criteria for inclusion in the multilevel
126

models. That is, higher performing regions also had higher percentages of students in
effective school contexts.
The community contexts in which the Turkish schools operate may vary from
region to region. Considerable research has shown that for Turkey, schools in urban
settings are more likely to have access to school resources while schools in rural areas
may lack such resources. Figure 4.8 presents, for Turkey and its regions, the percentages
of eighth grade students in schools located either in an urban or rural setting. 25 In
Turkey, two-thirds of eighth grade students (66%) were enrolled in schools in urban ar
and one-third in rural areas. Three-fourths of students (74%) in Marmara (the most
developed region) attended urban schools. From the opposite perspective, in Marmara,
one-fourth of the students attended rural schools, whereas almost half of the students
attended rural schools in Southeastern and Eastern Anatolia (45% and 46%, r
eas
espectively).
In Turkey, average science achievement in rural schools was lower than in urban
schools (430 points and 468 points, respectively). Although this pattern of achievement
was apparent in all regions in the country, it was more evident in Eastern Anatolia (the
least urbanized region) with a 73 point difference in favor of those attending urban
schools. The pattern was less evident in Marmara (the most urbanized region) where the
average achievement difference was 8 points between students attending rural schools
and those attending urban schools.
25 Urban areas are defined in this study as areas where population is greater than 50,000.
127

Figure 4.8. School Community Type in Turkey and Its Regions
0
10
20
30
40
50
60
70
80
90
100
Marmara Aegean Central Med. BlackSea
Southeastern
Eastern TURKEY
Per
centa
ge
of
Stu
den
ts
Rural
Urban
Urban Rural
Marmara N % of Students (SE) Mean Score (SE)
1,076 74 (5.5) 467 (10.0)
286 26 (5.5) 461 (10.2)
Aegean N % of Students (SE) Mean Score (SE)
348 66 (5.0) 483 (13.5)
130 34 (5.0) 413 (12.8)
Central N % of Students (SE) Mean Score (SE)
545 70 (9.2) 482 (8.9)
169 30 (9.2) 434 (8.1)
Mediterranean N % of Students (SE) Mean Score (SE)
357 63 (4.8) 472 (11.7)
140 37 (4.8) 430 (23.6)
Black Sea N % of Students (SE) Mean Score (SE)
302 69 (11.3) 452 (13.5)
140 31 (11.3) 450 (20.3)
Southeastern N % of Students (SE) Mean Score (SE)
345 55 (12.1) 433 (13.0)
247 45 (12.1) 404 (9.2)
Eastern N % of Students (SE) Mean Score (SE)
195 54 (14.0) 471 (16.3)
136 46 (14.0) 398 (9.3)
TURKEY N % of Students (SE) Mean Score (SE)
3,168 66 (3.2) 468 (4.6)
1,248 34 (3.2) 430 (5.6)
Note. Standard errors are computed using jackknife procedure.
128

Figure 4.9 presents, for Turkey and each region, the percentage of students at
two levels of the index of principals’ reports on positive school climate for academic
achievement, together with average science achievement. Students were placed in the
high category of the index if they attended schools where the principals responded, on
average, that the following aspects of school climate were high or very high: teachers’
expectations for student achievement, parental support for student achievement, parental
involvement in school activities, and students’ desire to do well in school. Students in the
other category of the index were those who attended schools for which principals
characterized the elements of school climate, on average, as less than positive (i.e.,
medium, low, or very low).
In Turkey, only 37 percent of the students attended schools where the principal
rated the school climate favorably. In terms of attending a school environment supportive
of learning, the principal’s ratings were the most positive in Central Anatolia (one of the
most developed and higher performing regions), where about half of the students (55%)
attended schools with positive climates. In contrast, only a quarter of students (27%) in
Southeastern and Eastern Anatolia attended such schools. Across all regions, but
particularly in Eastern Anatolia, students who attended schools with a positive school
climate performed higher than those in schools where the environment for enhancing
learning was rated poorly by principals (512 points and 409 points, respectively).
129

Figure 4.9. Index of Principals’ Reports on Positive School Climate for Academic Achievement in Turkey and Its Regions
0
10
20
30
40
50
60
70
80
90
100
Marmara Aegean Central Med. Black Sea Southeastern
Eastern TURKEY
Per
centa
ge
of
Stu
den
ts
High Positive School Climate Low or Medium Positive School Climate
High Positive School Climate
Low or Medium Positive School Climate
Marmara N % of Students (SE) Mean Score (SE)
530 40 (8.1) 496 (10.7)
832 60 (8.1) 446 (8.3)
Aegean N % of Students (SE) Mean Score (SE)
243 39 (10.7) 508 (13.0)
262 61 (10.7) 430 (14.9)
Central N % of Students (SE) Mean Score (SE)
482 55 (7.3) 479 (14.7)
257 45 (7.3) 445 (9.0)
Mediterranean N % of Students (SE) Mean Score (SE)
128 21 (10.9) 485 (49.3)
399 79 (10.9) 445 (14.5)
Black Sea N % of Students (SE) Mean Score (SE)
145 32 (12.2) 462 (16.4)
297 68 (12.2) 446 (17.4)
Southeastern N % of Students (SE) Mean Score (SE)
159 27 (12.8) 441 (17.1)
433 73 (12.8) 411 (10.3)
Eastern N % of Students (SE) Mean Score (SE)
111 27 (8.8) 512 (10.0)
220 73 (8.8) 409 (10.4)
TURKEY N % of Students (SE) Mean Score (SE)
1,798 37 (3.8) 485 (6.7)
2,700 63 (3.8) 436 (4.8)
Note. Standard errors are computed using jackknife procedure.
130

Shortages in school resources for teaching science may affect the quality of
science teaching, which in turn may influence student’s science achievement. It may be
that students in the eastern part of Turkey attended schools where science instruction was
affected by resource inadequacies. To explore the extent to which regions differed in
terms of availability of school resources for science instruction, an index of teachers’
reports on adequacy of school resources in teaching science was constructed. The index
was based on science teachers’ perceptions of the extent to which inadequacies of the
following resources limited science instruction: physical facilities, equipment for teacher
use in demonstrations, computer hardware, computer software, support for using
computers, and other instructional equipment for student’s use. Students were assigned to
the high level of the index if their science teachers’ average rating for school resources
available for science instruction was positive (i.e., the shortage of those resources had, on
average, little or no impact on science instruction). If their science teachers’ rating was
poor (i.e., the shortage of resources resulted in, on average, some or a lot of limitations to
science instruction), then students were assigned to the low level of the index. Figure
4.10 displays, for Turkey and each region, the percentage of students at the high and low
levels of the index, together with average science achievement.
On average in Turkey, students were split almost evenly into the two categories of
the index and those at the high level performed higher than those at the low level (470
points and 440 points, respectively). Although almost half of the students (46%) in
Turkey were at the high category of the index, there was considerable variation among
131

Figure 4.10. Index of Teachers’ Reports on Adequacy of School Resources in Teaching Science in Turkey and Its Regions
0
10
20
30
40
50
60
70
80
90
100
Marmara Aegean Central Med. Black Sea Southeastern
Eastern TURKEY
Per
cen
tag
e o
f S
tud
ents
High Adequacy of Instructional Resources Low Adequacy of Instructional Resources
High Adequacy of Instructional Resources
Low Adequacy of Instructional Resources
Marmara N % of Students (SE) Mean Score (SE)
637 47 (9.0) 484 (12.5)
725 53 (9.0) 450 (9.1)
Aegean N % of Students (SE) Mean Score (SE)
272 52 (14.1) 491 (13.0)
233 48 (14.1) 425 (19.1)
Central N % of Students (SE) Mean Score (SE)
468 63 (10.5) 467 (12.4)
271 37 (10.5) 459 (13.7)
Mediterranean N % of Students (SE) Mean Score (SE)
162 35 (14.5) 458 (23.9)
365 65 (14.5) 451 (14.0)
Black Sea N % of Students (SE) Mean Score (SE)
225 50 (13.9) 466 (17.4)
217 50 (13.9) 437 (19.7)
Southeastern N % of Students (SE) Mean Score (SE)
173 27 (13.1) 420 (22.1)
419 73 (13.1) 419 (11.6)
Eastern N % of Students (SE) Mean Score (SE)
120 30 (15.4) 454 (25.6)
211 70 (15.4) 430 (18.5)
TURKEY N % of Students (SE) Mean Score (SE)
2,057 46 (4.7) 470 (6.2)
2,441 54 (4.7) 440 (5.4)
Note. Standard errors are computed using jackknife procedure.
132
regions. On the basis of science teachers’ reports, in Central Anatolia (a higher
performing region), the majority of students (63%) attended schools where shortages of
school resources for science instruction were, on average, not a problem. In contrast, a
considerably lower percentage of students had the advantage of attending such schools in
Southeastern and Eastern Anatolia (27% and 30%, respectively).
Investigation of Factors Contributing to Regional Differences in
Achievement
The exploratory analysis of Turkey’s extensive array of TIMSS 2007 background
data revealed six key indicators that were related to higher science achievement in
Turkey, overall and regionally. The analysis also showed that there are regional gaps in
these key indicators. More specifically, students in Southeastern and Eastern Anatolia
—the two lowest performing regions— had less favorable conditions in these key
variables compared with students in the higher performing regions. The six indicators
meeting the criteria for inclusion in a series of multilevel models, which include three
student background measures and three school context measures, are listed in Table 4.5.
The six selected variables were examined in a series of multilevel models to
explore their possible contribution to reducing the Turkish region effect (i.e., the negative
effect of attending schools in Southeastern or Eastern Anatolia on student outcomes).
133

Table 4.5. Background Factors Related to Regional Differences in Science Achievement
Student Background Measure School Background Measure
1. Frequency of speaking Turkish at home 1. School community type
2. Parents’ highest education level 2. Index of principals’ reports on positive school climate for academic achievement
3. Index of home resources 3. Index of teachers’ reports on adequacy of school resources in teaching science
This section presents results from the statistical models, which were built to explore
whether altering these variables would serve to reduce the magnitude of the region effect.
As summarized previously in Table 4.2, several steps were involved in the
multilevel statistical analyses. First, several student models and school models were built
from the base model (see Equation 3.6). Each student or school variable was first added
separately to the base model to examine independent effects of the variables on the
regional achievement differences. Next, to investigate the overall effect of student
background, student variables that were significantly related to achievement were added
as a group to the base model in an overall student model (see Equation 3.10). This model
provided an estimate of what the average achievement difference between Marmara and
Southeastern Anatolia, as well as between Marmara and Eastern Anatolia could be
expected to be, if all regions had the similar distributions on selected home background
variables. That is, if differential student characteristics between the regions were
controlled statistically, would regional achievement differences be expected to disappear?
The impact of home environment was investigated via the overall student model.
134

Similarly, an overall school model (see Equation 3.13) was built by adding all
significant school context variables to the base model. The overall school model allowed
for exploration of what the average achievement difference between Marmara and
Southeastern Anatolia and also between Marmara and Eastern Anatolia would be, if all
regions had the similar distributions in terms of the selected school context variables. In
other words, school models explored whether regional differences may be expected to
disappear or continue once differential school characteristics were controlled. These
questions were addressed via the overall school model. Lastly, all of the significant
variables were added to the base model in a final model (see Equation 3.14) to test the
joint effect of selected predictors on regional differences.
In this dissertation study, to aid the interpretation of results, variables included in
the multilevel models were dummy coded with values of 0 and 1. The favorable category
of the explanatory variables (e.g., the high level of an index) was coded 0 while the
unfavorable category (e.g., the low level of an index) was set to 1. This way of coding
allowed the regression coefficient values from each model to have substantial meaning to
increase understanding, and thus facilitate the interpretation of results from the statistical
analyses. Following this coding scheme, the regression coefficients of the explanatory
variables were interpreted as the estimated change in science score associated with
moving from the favorable category of the variable to the unfavorable level (e.g., moving
from the high level of the index to the low level).
135

136
Student models analyzed the extent to which Turkey’s regional differences in
science achievement were related to the following three student home background
variables: frequency of speaking Turkish at home, parents’ education level, and index of
home resources. As shown in Table 4.6, results from the individual models for each
student variable revealed that all three variables had a highly significant relationship with
science achievement (phomeresources< .0005, planguage< .0005, pparentedu< .0005) when added to
the base model —the model of regional achievement differences only. For example, the
individual model for parental education variable estimated Marmara’s average science
score as 491 points when the predictor was favorable; that is, students had parents with
more than a primary school education. Average achievement was predicted to be 33 score
points lower for the unfavorable condition, which is when students had parents who at
best completed primary school.
When the three student variables were taken into account together with region in
the overall student model (see Table 4.6), the effect of each one on science achievement
was reduced due to intercorrelations among these three variables (e.g., it is likely that as
parental education level increases, level of resources available at home also increases).
For example, the 33 score point effect of the individual parental education variable was
reduced to a 28 point effect in the overall student model. Nevertheless, the three student
home background variables were all shown to be significant predictors of science
achievement when they were included with region in the overall student model
(phomeresources< .0005, planguage< .0005, pparentedu< .0005).

137
Table 4.6. Student Models of TIMSS 2007 Science Achievement in Turkey (N=4,498)
Base Model Index of Home Speaking Parental Overall Student
Resources Turkish at Home Education Model __________________________________________________________________________________________________________________________
Intercept reliability 0.934 0.921 0.932 0.919 0.906 __________________________________________________________________________________________________________________________ Intercept (Marmara) Predicted mean science score (SE) 468 (8.3) 484 (7.7) 470 (8.2) 491 (7.9) 500 (7.5) __________________________________________________________________________________________________________________________ School-level variables Aegean -10 (16.4) -9 (14.6) -10 (16.0) -10 (14.5) -9 (13.3) Central -11 (12.2) -11 (10.6) -9 (11.8) -11 (10.5) -10 (9.4) Mediterranean -17 (16.3) -12 (14.8) -17 (16.1) -16 (14.6) -12 (13.8) Black Sea -21 (16.5) -16 (15.3) -21 (16.3) -19 (15.0) -16 (14.4) Southeastern -47** (13.9) -42** (12.8) -34* (13.2) -44** (12.5) -29* (11.8) Eastern -40* (16.7) -36* (15.0) -33* (15.7) -38* (15.2) -30* (13.5) Student-level variables Index of Home Resources (High=0, Low=1) -27** (3.2) -18** (3.3) Speaking Turkish at Home (Always or almost always=0, Sometimes or never=1) -35** (5.8) -32** (5.7) Parental Education (Higher than primary school=0, Primary school or less=1) -33** (3.4) -28** (3.6) __________________________________________________________________________________________________________________________ Note. Hierarchical linear models with random intercepts weighted by TOTWGT. **p < .01., *p < .05.

Results from the individual student models also showed that controlling for each
student factor might be expected to reduce the Turkish region effect (i.e., the negative
effect of attending schools in Southeastern or Eastern Anatolia on student outcomes)
though the region effect remains statistically significant (see Table 4.6). For example, the
individual model for the parental education variable estimated that, if all regions had the
same distributions on this factor, the initial 47 score point gap in average science
achievement between Marmara and Southeastern Anatolia (estimated by the base model)
would reduce to 44 points, but this reduced achievement difference was still significant
(psoutheastern= .001). As estimated by the overall student model, the initial 47 score point
gap would be decreased to 29 points if all regions had similar distributions on all three
student variables. However, achievement differences between Marmara and Southeastern
Anatolia and also between Marmara and Eastern Anatolia were still significant
(psoutheastern= .015, peastern= .030).
The school models examined the extent to which Turkey’s regional differences in
science achievement were related to three school background measures including the
community type of school (i.e., rural/urban), the index of positive school climate for
academic achievement, and the index of adequacy of school resources in teaching
science. As shown in Table 4.7, results from the individual models for each school
variable revealed that all three school variables had a highly significant relationship with
science achievement (pcommunitytype< .0005, pschoolclimate< .0005, pinstructionalresources= .002)
when added to the base model. For example, the individual model for the index of
positive school climate for academic achievement estimated Marmara’s average science
138

139
Table 4.7. School Models of TIMSS 2007 Science Achievement in Turkey (N=4,498)
Base Model Community Index of Index of Overall Type Positive School Adequacy of School Climate Instructional Resources Model __________________________________________________________________________________________________________________________ Intercept reliability 0.935 0.929 0.921 0.931 0.913 __________________________________________________________________________________________________________________________ Intercept (Marmara) Predicted mean science score (SE) 468 (8.3) 479 (9.1) 497 (9.6) 484 (9.6) 511 (10.0) __________________________________________________________________________________________________________________________ School-level variables Aegean -10 (16.4) -10 (15.2) -7 (14.1) -11 (15.0) -9 (12.8) Central -11 (12.2) -9 (11.8) -13 (11.4) -15 (12.4) -15 (10.9) Mediterranean -17 (16.3) -14 (15.6) -7 (15.5) -14 (15.7) -5 (15.0) Black Sea -21 (16.5) -20 (17.4) -15 (15.7) -22 (15.3) -15 (15.2) Southeastern -47** (13.9) -40** (13.2) -39** (13.3) -40** (13.9) -30* (13.8) Eastern -40* (16.7) -32* (14.6) -29* (13.1) -33* (16.2) -21 (11.4) Community Type (Urban=0, Rural=1) -35** (8.1) -24** (7.6) Index of Positive School Climate (High=0, Low or medium=1) -49** (9.0) -41** (8.9) Index of Adequacy of Instructional Resources (High=0, Low=1) -30** (9.0) -23** (8.3) __________________________________________________________________________________________________________________________ Note. Hierarchical linear models with random intercepts weighted by TOTWGT. **p < .01., *p < .05.

140
score as 497 score points when the variable was favorable; that is, students attended
schools where principals perceived high positive school climate for student achievement
(e.g., high level of teachers’ expectations and parental support for student achievement).
Average achievement was predicted to be 49 score points lower for the unfavorable
condition, where principals perceived low positive school climate for academic
achievement.
When the three school variables were taken into account together with region in
the overall school model (see Table 4.7), the effect of the variables on science
achievement was reduced because it is likely that these three school variables are
intercorrelated (e.g., the level of school resources available for teaching are likely to be
lower in rural schools compared with schools that are located in urban settings in
Turkey). For example, the 49 score point effect of the index of positive school climate for
academic achievement was reduced to a 41 point effect in the overall school model.
However, based on the results from the overall school model which included region, all
three school context variables were still significantly related to science achievement
(pcommunitytype= .003, pschoolclimate< .0005, pinstructionalresources= .008).
Results from the individual school models also showed that controlling for each
school factor might be expected to reduce the negative effect on achievement of attending
schools in Southeastern or Eastern Anatolia even though the region effect remains
significant (see Table 4.7). For example, the individual model for the index of positive
school climate for academic achievement estimated that, if all regions had the same
distributions on this variable, the initial 47 score point difference in average science

141
achievement between Marmara and Southeastern Anatolia would reduce to 39 points, but
this reduced achievement gap remains statistically significant (psoutheastern= .004).
Controlling for the three school context factors (i.e., if all regions had the same
distributions on these three school factors) resulted in insignificant achievement
differences between Marmara and Eastern Anatolia. Specifically, the initial 40 score
point gap between Marmara and Eastern Anatolia was reduced to 21. However, the
negative effect of Southeastern Anatolia on science achievement was still statistically
significant (psoutheastern= .029).
As previously mentioned, the individual student background and school context
models aimed to identify the independent effects of the three factors at student level and
three factors at school level on the regional differences in science achievement. The
overall student model and overall school model examined the aggregate effects of the
student level factors and school level factors, respectively. However, these factors do not
operate in isolation in the schooling process. That is, they are interconnected—both
within and among the different levels— in influencing student outcomes. For example, it
is likely that as parental education level (a student level factor) increases, both home
resources level (a student level factor) and parental support for student achievement (a
factor contributing to positive school climate —a school level factor) increases.
Considering the complex nature of the education system, the final model built on
the student background and school context models and included six significant student
and school variables in addition to region. As shown in Table 4.8, when added together
with region, these six variables are significant predictors of science achievement

142
(phomeresources< .0005, planguage< .0005, pparentedu< .0005, pcommunitytype< .023,
pschoolclimate< .0005, pinstructionalresources= .006). Among the student background variables
examined, speaking Turkish —medium of instruction in Turkey— was the strongest
predictor of science achievement, followed by parental education level, and home
resources (blanguage= -31, bparentedu= -27, bhomeresources= -17, respectively).26 As to the school
background variables, positive school climate for achievement was the strongest
predictor of achievement (bschoolclimate= -29), followed by adequacy of school resources in
teaching science (binstructionalresources= -20) and school community type (bcommunitytype= -15).
Due to intercorrelations among the six variables of the final model, the
independent effects of each variable on science achievement were reduced as the
variables were clustered either in the overall student model or overall school model and
eventually added together in the final model. For example, the 49 score point effect of the
index of positive school climate for achievement was reduced to 41 in the overall school
model and eventually 29 in the final model (see Table 4.8). However, as mentioned
previously, the index of positive school climate for achievement and the other five
variables included in the final model are significant predictors of science achievement.
Results of the final model suggest that controlling statistically for the differences
in the six student and school factors examined would be expected to greatly reduce the
magnitude of the region effect. Specifically, the final model estimated Marmara’s average
26 The regression coefficients of the final model were interpreted as the estimated change in achievement associated with moving from the favorable category of the predictors to the unfavorable level, thus the regression coefficients had negative values.

143
Table 4.8. Final Model of TIMSS 2007 Science Achievement in Turkey (N=4,498)
Base Model Final Model ______________________________________________________________________________________ Intercept reliability 0.935 0.930 ______________________________________________________________________________________ Intercept (Marmara) Predicted mean science score (SE) 468 (8.3) 530 (8.7) ______________________________________________________________________________________ School-level variables Aegean -10 (16.4) -9 (10.8) Central -11 (12.2) -14 (8.6) Mediterranean -17 (16.3) -4 (13.0) Black Sea -21 (16.5) -12 (13.4) Southeastern -47** (13.9) -17 (12.7) Eastern -40* (16.7) -16 (9.9) Community Type (Urban=0, Rural=1) -15* (6.6) Index of Positive School Climate (High=0, Low or medium=1) -29** (7.5) Index of Adequacy of Instructional Resources (High=0, Low=1) -20** (7.1) Student-level variables Index of Home Resources (High=0, Low=1) -17** (3.3) Speaking Turkish at Home (Always or almost always=0, Sometimes or never=1) -31** (5.8) Parental Education (Higher than primary school=0, Primary school or less=1) -27** (3.6) ______________________________________________________________________________________ Note. Hierarchical linear models with random intercepts weighted by TOTWGT. **p < .01., *p < .05.

144
science score as 530 points when the six predictors were optimal; that is, the students
attended schools where principals perceived high positive school climate for student
achievement (e.g., high level of teachers’ expectations and parental support for student
achievement), the science teachers rated the level of school resources available for
teaching science as high, and the schools were located in urban areas as well as the
students came from home environments where they had high levels of home resources
(e.g., access to computer, Internet connection, and study desk), often spoke Turkish at
home, and had parents with more than a primary school education.
Under the same optimal conditions, the model estimated the average science
achievement only 17 points lower for Southeastern Anatolia (i.e. 513 score points) and 16
points lower for Eastern Anatolia (i.e. 514 score points), and these achievement
differences were not statistically significant (see Table 4.8). That is, initial significant
difference estimates —47 points lower for Southeastern Anatolia and 40 points lower for
Eastern Anatolia— were reduced to the extent that the initial achievement differences
were no longer statistically significant. These findings suggest that, if all regions had the
same distributions in terms of the six student and school variables, the average
achievement difference between Marmara and Southeastern Anatolia and also between
Marmara and Eastern Anatolia could be greatly reduced.
Under the least favorable conditions, the final model estimated Marmara’s
average science score 139 points lower (i.e. 391 score points). The least favorable
conditions were when students attended schools where principals perceived low positive
school climate for academic achievement, where science teachers rated the level of

145
school resources available for teaching science as low, and schools were located in rural
areas as well as where students had low levels of home resources, infrequently (i.e.,
sometimes or never) spoke Turkish at home, and had parents who at best had only
completed primary school.
As presented previously, the results of the unconditional model (that included no
explanatory variables) showed that 34 percent of the total variation in science
achievement in Turkey was due to differences among schools/classes and 66 percent of
the total variance was attributable to differences among students. When selected student
and school variables were included in the final model, a small fraction of the between-
student variance was accounted for (4% of the 66%) compared to the between-school
component (51% of the 34%). This meant that 20 percent of the total variance in
achievement was accounted for by the student and school variables included in the final
model. This relatively low percentage of total variation accounted for stems from the fact
that the primary interest of this study was to develop an explanatory model of Turkey’s
regional achievement differences and not a model of student achievement differences in
Turkey. That is, the purpose was to explain the variation among regions as opposed to
variation in student achievement. The purpose of this study drove the selection of
variables included in the final model. Therefore, even though several student attitude
variables associated with student achievement were identified at the exploratory stage
(e.g., self-confidence in learning science), they were not included in the final model
because they did not vary across the regions, suggesting that they would not have
necessarily contributed to the regional disparities.

In regard to the findings of this study, previous studies have also found that eighth
grade students in Turkey whose parents had higher levels of education performed better
in science than those whose parents had lower levels of education (Aypay, et al., 2007;
Berberoglu, et al., 2003; Ozdemir, 2003). These studies also have shown that the number
of books at home as well as home possession of other educational items such as a
computer and study desk are among the important predictors of student achievement.
This dissertation study identified an additional predictor of science achievement in
Turkey: speaking the language of the test at home. This finding, however, is not
consistent with the results reported by Caliskan (2008), who found, using Turkey’s
science literacy data from PISA 2006, that speaking Turkish most of the time at home
“was not significant for Turkish [15-year-old] students” (p.157).
The inconsistency between the findings from this dissertation study and
Caliskan’s study (2008) may stem from the differences in the student sample used in each
study. This study used Turkey’s TIMSS 2007 data, which was collected from eighth
grade students who were, on average, 14 years old at the time of testing. In comparison,
the latter study used Turkey’s data from PISA 2006, which tested 15-year-old students
who were mostly ninth grade students in Turkey. In Turkey, eighth grade is the final
grade of compulsory primary education and has a high enrollment ratio, while ninth grade
is the beginning of noncompulsory secondary education and has a substantially lower
enrollment ratio.
146

In Turkey, at the time of the TIMSS 2007 testing, the net enrollment ratio for
primary school was 97 percent, whereas at the time of PISA 2006 testing, the ratio was
57 percent for secondary education (MoNE, 2008). Therefore, when evaluating data from
Turkish ninth grade students, it should be noted that almost half of the secondary school
age children were excluded from the picture, simply because they were no longer
enrolled in school. Unfortunately, the high percent of dropouts in Turkey (i.e., students
who do not continue their schooling after compulsory education) are usually low
performing students who come from disadvantaged home backgrounds. Therefore, it is
reasonable to assume that students who continue their education after compulsory
schooling are, to a large extent, relatively high performing students who probably come
from affluent homes.
This means that PISA’s Turkish ninth grade student sample may underestimate
the distribution of disadvantaged background characteristics, while overestimating the
achievement of 15 year olds in Turkey. In fact, based on PISA 2006 data, essentially all
students (98%) spoke Turkish most of the time at home (Caliskan, 2008). Consequently,
the language variable did not vary among the PISA ninth grade students and thus could
not be related with achievement. Based on TIMSS 2007, however, a somewhat smaller
percentage of students (89%) reported speaking Turkish always or almost always at
home, and this factor was shown in this study to be a significant predictor of
achievement.
147

In summary, the results of the final model suggest that low performing students in
the Southeastern and Eastern Anatolia regions would have performed much more like the
students in Marmara (i.e., there would not be any statistically significant differences in
achievement) if students across the regions were provided with similar resources and
opportunities in terms of the characteristics of the schools they attended and their home
backgrounds. The school context characteristics that contributed to the regional
disparities in achievement included the level of positive school climate for academic
achievement, availability of school resources for teaching science, and school community
type. Characteristics of student home background that contributed to the regional
achievement differences included the level of fluency in Turkish, availability of home
resources, and parental education.
The findings of this study suggest that improving the conditions for school factors
would serve to reduce the magnitude of the Turkish region effect on student outcomes.
However, it would be very difficult to this in isolation, since the school factors are
intercorrelated with the student factors and, therefore, partly a reflection of the student
factors. For this reason, in order to overcome low student achievement in the
Southeastern and Eastern Anatolia regions, all factors contributing to the region effect
need to be eventually addressed. That is, for all students to succeed in Turkey, efforts to
improve each factor should not be isolated from each other, instead a strategic
comprehensive approach that connect and integrate all efforts should be in place.
148

However, the relative effects of the particular home background and school
context factors estimated in this study should be interpreted with caution. This is despite
the fact that the findings of this study are based on sophisticated statistical analyses and
similar to other findings in the literature reporting associations between achievement and
home and school background factors. Even though TIMSS collected hundreds of
background variables from students, teachers, and school principals, it is virtually
impossible, due to cost and practicality reasons, to collect all information that might be
related to student achievement. Also, due to the crossectional and nonexperimental nature
of the data, it is not possible to make definitive statements about cause and effect.
Despite the inherent limitations of using data from a cross-sectional study, the
results of this dissertation study provide preliminary supportive evidence for policy
makers to establish targeted educational policies in order to combat low levels of
educational outcomes in Turkey in general and achievement disparities between its
regions in particular. For example, the findings of this study may serve as a basis for
some small-scale studies or programs in Turkey. A possible intervention for students in
eastern Turkey may be a Turkish language program to compensate students who do not
frequently speak Turkish at home. If new programs provide empirical evidence about the
effects of the intervention on student achievement, a broad-scale implementation of the
intervention could then be launched.
149

Also, it is recognized that these results primarily serve to underscore the
enormous challenge facing Turkey in improving educational outcomes nationally and
equitably across all regions. Addressing inequities in both home and school learning
contexts is a monumental undertaking. The challenge of mitigating the effects of
disadvantageous home backgrounds while enhancing the desirable characteristics of
school context may be overwhelming in practice and would require dramatic changes in
educational policies and practices.
Nevertheless, these enormous challenges are among other monumental
socioeconomic challenges that Turkey faces as it seeks to be a part of the European
Union by 2013. The challenges of substantially raising educational achievement in
Turkey overall and especially in the lower performing regions would require political
determination. The government’s strong will, the Ministry of National Education’s
leadership, and ongoing commitment from various stakeholders is crucial for crafting
specific educational policies aimed at mediating deeply-rooted interregional disparities in
achievement, and thereby improving overall levels of student proficiency in Turkey.
150
Chapter 5 Conclusions
This final chapter begins with an overview of the research conducted in this study
to investigate regional differences in science achievement in Turkey, and identify factors
related to higher relative performance. The TIMSS 2007 data were analyzed using
Hierarchical Linear Modeling (HLM), and differences in key educational resources were
found between the highest and lowest performing regions. The main findings are
summarized, and the policy implications of these findings are discussed. Finally, the
limitations of the study and suggestions for future research are presented.
Overview of the Study
Despite being among the 20 largest economies of the world, Turkey has yet to
provide its citizens with high quality living standards. According to the United Nations
Development Programme’s Human Development Report 2007/2008, Turkey is among the
“medium level” countries in terms of the Human Development Index (HDI). By contrast,
the 27 member states of the European Union (EU), of which Turkey seeks membership,
are all considered “high level” HDI countries. When education, health, and economic
components of the index are examined separately, it is evident that Turkey’s medium
HDI level mainly results from its low level on the education index (ranking 104th)
compared with its life expectancy index and GDP index (ranking 84th and 67th,
151

respectively). For example, consistent with Turkey’s place in the human development
rankings for education, TIMSS 2007 results showed that, of the 49 countries that
participated in the study, Turkey had the lowest percentage of eighth grade students (7%)
with at least one parent who had graduated from a university.
Issues of access, quality, and equity in education have been a challenge for
Turkey since its founding less than a century ago in 1923. Because it is in the process of
working towards incorporation into the EU by 2013, Turkey’s existing educational issues
have gained even greater significance and urgency. Turkey has worked steadily to
improve access to education and in 1997 extended compulsory primary education from 5
to 8 years. With 11 million students in primary education (grades 1 to 8), remarkable
progress has been made in terms of increasing access to primary schooling. The net
enrollment ratio had increased to 97% in 2007 (MoNE, 2008). However, Turkey still
faces enrollment deficits before and after the years of compulsory schooling. For
example, the gross schooling rate for preschool was only 20 percent in 2005 (DPT, 2006)
and the net enrollment ratio for secondary school was only 57 percent in 2007 (MoNE,
2008).
Despite the substantial progress in increasing access to primary schooling,
improving the quality of primary education is still a source of considerable concern in
Turkey. Low student achievement results in both international and national assessments
show that improving student outcomes remains a challenge for Turkey. Most recently,
Turkish eighth grade students had significantly lower average achievement in
152

mathematics than students in all of the 12 EU countries that participated in TIMSS 2007,
and although Turkey’s average science achievement was similar to three EU countries
(Romania, Malta, and Cyprus), it was lower than all the other EU countries. The eighth
grade is an important educational milestone in Turkey because it is the end of primary
education and the last grade of compulsory education.
The TIMSS 2007 results showed that, even at the eighth grade with nearly all
students still enrolled in school, high quality education remains a privilege provided only
for a small fraction of Turkish students. Only 5% of eighth grade students reached the
TIMSS 2007 Advanced International Benchmark in mathematics and 3% in science,
demonstrating competency in complex concepts and reasoning tasks. By contrast, an
alarming 41% of Turkish students performed below the Low International Benchmark in
mathematics, signifying they did not demonstrate a grasp of even basic computational
skills. In science, 29% performed below the Low International Benchmark, indicating
little knowledge of even basic facts from the life and physical sciences. These results
suggest that, in addition to the challenge of maintaining high enrollment in grades 1-8,
Turkey also faces the enormous challenge of providing quality education to all children
in the nation.
Beyond the overarching concerns of access and quality, another aspect of
Turkey’s educational challenge relates to the persistent disparities in human development
among its seven geographic regions. The urbanized west of Turkey is socioeconomically
more developed than the rural east and apparently better educated. An in-depth
153

understanding of regional inequalities in relation to educational outcomes is central to
establishing strategies for reducing regional gaps. In particular, identifying the factors
influencing regional inequalities in student learning is crucial for developing policies that
will help raise the educational performance at the national level as well as close regional
gaps in student achievement.
The overarching aim of this dissertation was to provide empirical information
about the current picture of regional achievement disparities and the factors that are
pertinent to reducing them. The unification process with the EU involves the immense
tasks of supporting a globally competitive and sustainable economy as well as sharing an
equitable social structure. As Turkey pursues full membership in the EU, the process
presents a unique opportunity for socioeconomic reforms that are necessary to help
improve conditions in the regions that are lagging behind the national average in human
development.
Findings of the Study
To contribute to the discussion in Turkey about the best strategies for improving
the overall level of student outcomes in primary education and eliminating the
achievement inequalities among its regions, this dissertation analyzed eighth grade
science achievement data from TIMSS 2007. The study began with an examination of the
extent of Turkey’s regional differences in science achievement at eighth grade.
154

Considering Turkey’s persistent regional disparities in human development, the
results of the initial analysis of achievement differences across regions were not overly
surprising, but nevertheless disappointing. The study revealed that in general, the
socioeconomic differences between the western and eastern parts of Turkey corresponded
to the differences in student achievement at the end of compulsory primary education.
Marmara, Aegean, and Central Anatolia —the most socioeconomically developed
regions— were the highest performing regions. Eastern Anatolia and, in particular,
Southeastern Anatolia —the two least developed regions— had the lowest science
achievement in TIMSS 2007 at the eighth grade.
These inequalities in science achievement at the eighth grade occurred despite the
fact that all students in Turkey are intended to be provided with similar teaching time and
content by the end of primary school. In addition to the overall low performance at the
national level, these findings highlighted yet another challenge for the Turkish
educational system. That is, the already low educational quality is not distributed evenly
across the country.
To identify factors associated with regional differences in educational
achievement, this study involved extensive exploratory data analysis of the hundreds of
background variables collected by TIMSS 2007 via student, teacher, and school
questionnaires. The analyses revealed that, compared with students in high performing
regions, the students in the two lowest performing regions had disadvantageous
background on several key home background and school context variables associated
155

with student achievement. In comparison to the students in the highest performing
regions, the students in Southeastern and Eastern Anatolia came from homes with fewer
educational resources (e.g., books, computer, Internet connection, and study desk), had
parents with less education, and spoke Turkish less frequently at home. These students
also attended schools with characteristics associated with low achievement, including
being located in rural areas, not adequately equipped with instructional resources (e.g.,
physical facilities, equipment for teacher use in demonstrations, computer hardware and
software, and other instructional equipment for student’s use), and having a school
climate not supportive of learning in terms of teachers’ expectations for student
achievement, parental support for student achievement, parental involvement in school
activities, and students’ desire to do well in school.
Using Hierarchical Linear Modeling (HLM) analyses, this study also found that
controlling home background factors might result in reduced achievement differences
across regions. Similarly, if school context factors were controlled, regional differences
in achievement might be reduced. Moreover, a statistical model that controlled for both
home background and school context factors reduced the region effect to the extent that
the regional achievement gaps were no longer statistically significant. The statistical
models applied in this study imply that if students across the regions were provided with
similar opportunities in terms of the characteristics of the schools they attended and their
home backgrounds, the significant achievement gaps across the regions could be greatly
reduced.
156

Policy Implications of the Study
Over the past decade, the priority for Turkey’s educational policies was providing
universal access to primary schooling for the children in the nation, including girls and
children in rural areas. In addition to the fundamental reform of increasing compulsory
education from 5 to 8 years, important initiatives targeting school access were
successfully implemented and as a result, the net enrollment ratio in primary school has
reached 97 percent as of the 2007/08 academic year (MoNE, 2008). These educational
projects included a girls’ education campaign, busing students to schools in rural areas,
and providing access to free boarding schools in primary education (Aydagul, 2007).
The results of this study suggest that, even though Turkey has nearly achieved
equity in access to primary schooling, equity in educational outcomes at the end of
primary education has yet to be achieved. There are significant regional disparities in
student achievement at the end of compulsory education. This means that Turkey’s
challenge of improving overall education quality is coupled with the challenge of
achieving equity in student achievement across the regions. Therefore, Turkey’s
remarkable success in expanding access to primary schooling needs to be repeated
through complementary efforts to improve quality and equity in student achievement.
Educational policies aimed at improving the quality of teaching and learning in
Turkey have already been launched. In 2003, Turkey initiated its most comprehensive
curriculum reform to develop and implement new curricula in all core subjects in primary
education. The new curricula for grades 1 to 5 were implemented in schools beginning in
157

the 2005/06 academic year, followed by implementation for grades 6, 7, and 8 in the
2006/07, 2007/08, and 2008/09 academic years, respectively. Along with these
curriculum reform efforts, the percentage of total instructional time allocated to science
was increased from 10 to 13 percent (Demirer, et al., 2008).
Recent curriculum efforts are significant steps toward improving overall
education quality in Turkey. However, to ensure the success of the main goal of progress
in quality education overall, progress in student achievement in the eastern part of the
country is necessary. Therefore, efforts aimed at increasing quality education needs to
integrate measures for eliminating regional gaps in education quality. Such efforts should
target barriers to progress in equity of student achievement across regions. Among
hundreds of policy related background variables examined in this study, several factors
emerged as key contributors to the low performance of students in Southeastern and
Eastern Anatolia. These contributing factors were the disadvantages in home background,
such as infrequently speaking Turkish (i.e., language of instruction) at home, low levels
of parental education and educational resources at home, and unfavorable characteristics
in school contexts including being located in rural areas, not adequately equipped with
instructional resources, and having a school climate not supportive of learning.
In recent years, initial steps have been taken to combat the disadvantages in home
background in the east of Turkey. These efforts included cash transfers made to the
poorest six percent of families with children (World Bank, 2008) and implementing adult
education programs. In Turkey, adult education initiatives are offered as part of non-
158

formal education activities and mostly in collaboration with NGOs. Major recent
programs that are being conducted by the Mother and Child Education Foundation
(ACEV), a prominent NGO in Turkey, include literacy programs, such as The Functional
Adult Literacy and Women’s Support Program and parenting skills programs, such as the
Mother Support Program and the Father Support Program. The findings of this study
suggest that adult education programs are greatly needed in Southeastern and Eastern
Anatolia and thus, should be supported and extended to all illiterate mothers and fathers
across the country.
The results of this dissertation study also suggest that existing parent education
programs should be enhanced so that they encompass strategies that equip parents to
support student achievement and involvement in school activities. Such comprehensive
education programs may be conducted jointly with schools and include teachers in order
to create school climates generally supportive of student learning. Strategies may involve
helping parents understand the main elements of the curriculum and keeping them
informed about how well their children are progressing in school. Sustained training for
parents and collaboration with teachers may help build trusting relationships among
parents, teachers, and students. In such a supportive and collaborative system, teachers
are more likely to have high expectations from students and in turn students are more
likely to desire to perform well in school (Muijs, Harris, Chapman, Stoll, & Russ, 2005;
Reynolds & Teddlie, 2000).
159

The results of this study suggest that one way to improve education levels in
Turkey would be to develop educational policies in the low performing regions that
aimed specifically to alleviate the disadvantages that stem from students receiving school
instruction in Turkish but infrequently speaking Turkish at home. Currently, such policies
for second language learners are essentially absent in Turkey. If Turkish remains the only
formal language of instruction, initiatives should be put in place to compensate for the
negative influences of not being fluent in Turkish. Students who do not speak Turkish
frequently at home may benefit from studying Turkish as a second language or from
special training programs in the Turkish language. These extra Turkish language
programs may be embedded in after-school programs offering extended learning time in
the language of instruction. For schools with double-shift education where two sets of
students are taught in a full day due to shortage of classrooms and teachers, school
facilities might not be available for such language programs. In these cases, special
training programs in the Turkish language may be part of summer school programs. Most
recently, the United States’ the National Literacy Panel on Language-Minority Children
and Youth examined the research on acquiring literacy in a second language and
concluded that the most promising literacy programs for language-minority students
provide an early, ongoing, and intensive instructional support to develop reading, writing,
and oral proficiency in the language of instruction (August & Shanahan, 2006).
In addition to preparing students for primary education, early childhood
development programs are viewed as one of the most effective intervention approaches
provided for disadvantaged children (Field, Kuczera, & Pont, 2007; OECD, 2009;
160

Wobmann & Schutz, 2006). In Turkey, the schooling ratio for preprimary education,
which is optional in the country, is a source of considerable concern. As shown in Figure
2.1 in chapter 2, a 13% gross schooling ratio for preprimary schooling is the lowest ratio
among the EU member and candidate states and lags far behind the 85% average.
Consistent with this grim picture of the status of access to preprimary schooling in
Turkey, Progress in International Reading Literacy Study (PIRLS) 2001 results showed
that only in Turkey and Iran, of the 35 countries that participated in the study, “did the
majority of students not attend preschool” (76% and 70%, respectively) whereas “almost
all countries make provision for at least one year of preprimary education” (Mullis et al.,
2003, p.129). Moreover, the already low numbers of children that have access to
preprimary schooling are mostly located in urban areas and in the western part of the
country (MoNE, 2005). The government’s target is to increase the gross enrollment ratio
to 50% (up from 20% as of 2005 figures) in preschool by 2013, the year that Turkey is
expected to become a full member of the EU (DPT, 2006). Given the importance of
preprimary schooling for achieving equity in student achievement, initiatives need to be
formulated to prioritize preschool education in Southeastern and Eastern Anatolia.
The results of this study also indicated that schools in the eastern regions of
Turkey may have fewer resources than those in other regions. In TIMSS 2007, science
teachers in the eastern regions reported nearly three-fourths of students were in schools
with inadequate instructional resources such as equipment for teacher use in
demonstrations, computer hardware and software, and other instructional equipment for
student’s use. Adequacy of school resources in teaching was a significant explanatory
161

variable in the HLM analyses of regional disparities. To better combat the unfavorable
characteristics of school learning contexts in the east of Turkey, perhaps, the Ministry of
National Education’s resource allocation policies need to be revisited. The ministry
currently allocates funds to schools on an incremental budgeting basis. That is, “through
a percentage increase on a school’s prior year budget” (OECD, 2007b, p.134).
Compensatory financing that is tailored according to the information on key indicators,
such as enrollment and percentage of socioeconomically disadvantaged students, may
ensure better resource allocation as well as enhance the physical infrastructure and
instructional resources for teachers.
Significant increases in educational outcomes in disadvantaged regions are
essential for those regions and for improving the overall education quality in Turkey.
Therefore, elimination of the educational barriers in Southeastern and Eastern Anatolia is
critical to raising overall achievement level in Turkey. Consequently, to raise the overall
educational quality in the country, some educational policies and strategies should be
developed specifically for low performing regions. The results of this study suggest that a
number of targeted policies could be crafted with the aim of compensating for some of
the disadvantageous home background factors such as low parental education levels and
lack of fluency in speaking Turkish as well as aspects of the unfavorable school
characteristics of students in disadvantaged regions such as fewer instructional resources
and less academic rigor.
162

Without a doubt, the reality of establishing and implementing educational policies
aiming to raise overall educational quality and provide equal educational opportunities to
all students in the nation would be enormously challenging. In addition to the massive
scale, addressing these issues also has a sense of urgency as Turkey pursues full
membership in the EU in upcoming years. The government’s Ninth Development Plan
2007-2013, the primary strategy plan aimed at coordinating the efforts involved in the EU
accession process, documents that Turkey seeks to be “globally competitive” and
“sharing more equitably”. Considering these national goals of the country, progress in
increasing the quality and equity in student achievement is imperative.
Given the scale, significance, and urgency of the issues in educational quality and
equity in Turkey, political determination is fundamental for progress. The government’s
latest development plan addresses the socioeconomic equity issues across the regions and
between rural and urban settings. Elimination of regional disparities in socioeconomic
indicators is viewed as one of the key elements in Turkey’s path to the EU. The
government’s commitment to alleviate regional gaps in human development is expected
to provide direction to other national programs, including the public policies, strategic
goals, and priorities in the Ministry of National Education. The ministry can contribute to
the efforts in tackling persistent regional development issues via ensuring that
comprehensive educational policies are formulated and implemented for all Turkish
students. However, the ministry may also need to specifically address the unfavorable
conditions in the low performing regions with special initiatives.
163

Limitations of the Study
Although this study used highly reliable data and sophisticated statistical
analyses, there are some inherent limitations of the study. It should be noted that TIMSS
is an observational study and not a randomized experiment. That is, students tested in
TIMSS were already enrolled in their schools and not randomly assigned to schools by
TIMSS. Effects of the predictors estimated using observational data, such as TIMSS,
should not be interpreted in terms of causal relationships because it is not possible to
determine the extent to which pre-assignment differences in student populations might
affect the estimated effects.
In addition, the results of this study are based on statistical models that are
constrained by the available data. Even though TIMSS collected a vast array of
background information from students, teachers, and school principals, there most
certainly is other information related to student achievement that was not fully captured
in the data. For example, in reference to this study, it may be the case that the students in
the low performing regions are also overly represented among students with low or no
preprimary education. Because information on students’ preprimary education was not in
the dataset, the statistical models of this study could not investigate the role of preprimary
education on regional achievement differences.
Despite these limitations of the study, the findings are consistent with other
findings in the literature reporting associations between student achievement and
characteristics of home background and school context. Moreover, the results of this
164

study provide empirical evidence for policy makers to establish targeted educational
policies that increase low student achievement outcomes in Turkey, in general, and
diminish achievement disparities between its regions, in particular.
Suggestions for Future Research
Further research on student achievement will be possible as Turkey continues to
participate in international studies such as TIMSS and PIRLS. These international studies
of educational achievement provide Turkey an opportunity to compare its national
achievement to other countries as well as to identify the major factors involved in
national achievement in reading, mathematics, and science. Gathering evidence about
students’ achievement in core academic subjects provides researchers opportunities for
secondary data analysis. Analysis of national data allows for in-depth investigation of
factors related to achievement, which in turn, helps educational policy makers make
informed decisions to increase the quality of education. It would be especially
worthwhile to conduct such research in the context of monitoring trends in achievement.
It also is important to initiate small-scale studies or programs in Turkey on the
basis of theories generated from TIMSS and PIRLS, especially if these theories are
substantiated by experiences in other countries. If new programs provide compelling
evidence about the effects of the intervention on student achievement, a broad-scale
implementation of the intervention could then be initiated. For example, using the
findings from this dissertation study, a possible intervention for students in eastern
165

Turkey may be a Turkish language support program to provide compensatory education
for students who do not frequently speak Turkish at home.
Turkey participated in TIMSS 1999 and TIMSS 2007 at the eighth grade and,
currently, is planning to participate in TIMSS 2011 both at the fourth and eighth grades.
In the absence of trend data at the fourth grade, participating in TIMSS 2011 at the fourth
grade would provide Turkey a baseline to measure trends in future TIMSS cycles. Turkey
will benefit even further by participating in TIMSS 2011 at the eighth grade and
examining the trends in educational progress. New curricula in all core subjects in
primary education were implemented beginning in the 2005/06 academic year. That is,
when TIMSS 2011 is conducted, Turkish students assessed at the eighth grade will be the
ones who were exposed to the revised curricula in mathematics and science. This would
provide Turkey a unique opportunity to assess the contribution of its curricular reforms in
student achievement trends at the eighth grade. Moreover, Turkey’s participation in
TIMSS 2011 at both grades would allow conducting further research on regional
disparities in student achievement to investigate the extent to which regional gaps in
achievement exist at the fourth grade and determine whether progress has been made in
narrowing the gaps in achievement at the eighth grade as students progress through
school.
Because Turkey participated in PIRLS 2001, participating in PIRLS 2011 would
allow Turkey to assess trends in reading achievement at the fourth grade. A unique aspect
of PIRLS is its home questionnaire, which collects information from parents about their
166

employment situations and students’ preparations for primary schooling, including
attendance in preschool. Therefore, participating in PIRLS 2011 would provide Turkey
information about students’ preprimary education, and as a result, analysis of Turkey’s
data from PIRLS 2011 could investigate the role of preprimary education on
achievement, an investigation that could not be conducted in this dissertation study.
Measuring, assessing, and monitoring student achievement during the primary
school years (grades 1 to 8) is particularly important for Turkey. In 2007, the net
schooling ratio in compulsory primary education was very high (97%), but decreases
substantially as students move on to optional secondary education (57%). As a result,
nearly half of the secondary school age children are excluded from the picture that is
portrayed by studies that collect data from Turkish students in secondary education.
Because a high percent of the dropouts in Turkey are usually low performing students
who come from disadvantaged home backgrounds, such studies are limited since they
may underestimate the distribution of disadvantaged background characteristics, while
overestimating the achievement. However, studies that sample Turkish students in
primary school do not have such limitations as these studies have the advantage of
collecting data that is representative of almost all primary school age children in the
country. The ministry’s plans to participate in TIMSS 2011 demonstrate Turkey’s
commitment to monitor progress in educational quality which is greatly needed in
Turkey’s historic path to the European Union.
167

References
August, D. & Shanahan, T. (Eds.) (2006). Developing literacy in second-language learners: Report of the national literacy panel on language-minority children and youth. New Jersey: Lawrence Erlbaum Associates.
Aydagul, B. (2002). The nation-state strikes back? The expansion of secular compulsory
education in Turkey. Unpublished monograph, Stanford University. Aydagul, B. (2007). Turkey country case study. Country profile commissioned for the
EFA Global Monitoring Report 2008, Education for all by 2015: Will we make it? UNESCO (2008/ED/EFA/MRT/PI/13).
Aypay, A., Erdogan, M., & Sozer, M.A. (2007). Variation among schools on classroom
practices in science based on TIMSS 1999 in Turkey. Journal of Research in Science Education, 44(10), 1417-1435.
Baker, D.P., Goesling, B., & Letendre, G.K. (2002). Socioeconomic status, school
quality, and national economic development: A cross-national analysis of the “Heyneman-Loxley effect” on mathematics and science achievement. Comparative Education Review, 46(3), 291-312.
Bankov, K., Mikova, D., & Smith, T.M. (2006). Assessing between-school variation in
educational resources and mathematics and science achievement in Bulgaria. Prospects, 36(4), 447-473.
Barton, P.E, & Coley, R.J. (2009) Parsing the Achievement Gap II. ETS Policy
Information Center. Retrieved May 24, 2008, from http://www.ets.org/Media/Research/pdf/PICPARSING.pdf
Beaton, A.E, Martin, M.O., Mullis, I.V.S, Gonzalez, E.J., Smith, T.A., & Kelly, D.L. (1996). Science achievement in the middle school years: IEA’s Third International Mathematics and Science Study (TIMSS). Chestnut Hill, MA: TIMSS International Study Center, Boston College.
Berberoglu, G., Celebi, O., Ozdemir, E., Uysal, E., & Yayan, B. (2003). Ucuncu
Uluslararasi Matematik ve Fen Calismasinda Turk ogrencilerinin basarilarini etkileyen faktorler [Factors effecting achievement level of Turkish students in the Third International Mathematics and Science Study (TIMSS)]. Educational Sciences and Practice, 2(3), 3-14.
168

Braun, H., Jenkins, F., & Grigg, W. (2006a). A Closer Look at Charter Schools Using Hierarchical Linear Modeling (NCES 2006–460). U.S. Department of Education, National Center for Education Statistics, Institute of Educational Sciences. Washington, DC: U.S. Government Printing Office.
Braun, H., Jenkins, F., & Grigg, W. (2006b). Comparing Private Schools and Public
Schools Using Hierarchical Linear Modeling (NCES 2006–461). U.S. Department of Education, National Center for Education Statistics, Institute of Educational Sciences. Washington, DC: U.S. Government Printing Office.
Brecko, B.Z. (2004). How family background influences student achievement? In C.
Papanastasiou (Ed.), Proceedings of the IEA International Research Conference (IRC), 1, (pp. 192-201). Cyprus: Cyprus University Press.
Buchmann, C. (2002). Measuring family background in international studies of
education: Conceptual issues and methodological challenges. In A.C. Porter & A. Gamoran (Eds.), Methodological Advances in cross-national surveys of educational achievement (pp. 150-197). Washington, DC: National Academy Press.
Caliskan, M. (2008). The impact of school and student related factors on scientific literacy skills in the Programme for International Student Assessment – PISA 2006. Unpublished doctoral dissertation, Middle East Technical University, Ankara, Turkey.
Carey, N. & Shavelson, R. (1989). Outcomes, achievement, participation, and attitudes.
In R.J. Shavelson, L.M. McDonnell, & J. Oakes (Eds.), Indicators for monitoring mathematics and science education: A Sourcebook (pp. 147-191). Santa Monica, CA: The Rand Corporation.
Cingi, H., Kadilar, C., & Kocberber, G. (2007). Turkiye genelinde ilk ve ortaogretim
olanaklarinin incelenmesi ve belirlenen aksakliklara cozum onerilerinin getirilmesi. [Investigation of educational opportunities in primary and secondary education in Turkey and recommendations for the barriers identified]. Ankara: TUBITAK [Turkey’s Scientific and Technological Research Council].
Cobern, W.W. (1996) Constructivism and non-western science education research.
International Journal of Science Education, 18(3), 295-310.
Coleman, J.S., Campbell, E.Q., Hobson, C.J., McPartland, J., Mood, A.M., Weinfeld, F.D., et al. (1966). Equality of educational opportunity. National Center for Educational Statistics. Washington, DC: US Government Printing Office.
169

Demirer, I., Oz, G., Basaran, S.T., Yilmaz, A.D., Durak, A.A., Bal, H., et al. (2008). Turkey. In I.V.S. Mullis, M.O. Martin, J.F. Olson, D.R. Berger, D. Milne, & G.M., Stanco (Eds.), TIMSS 2007 encyclopedia: A guide to mathematics and science education around the world (Vol.1, pp. 611-619). Chestnut Hill, MA: TIMSS & PIRLS International Study Center, Boston College.
Devellis, R.F. (2003). Scale development: Theory and applications (2nd ed.). Applied
Social Research Methods Series, Vol. 26. California: SAGE. Dincer, B., Ozaslan, M. & Kavasoglu, T. (2003). Illerin ve bolgelerin sosyo-ekonomik
gelismislik siralamasi arastirmasi [Investigation of socioeconomic ranking of regions and provinces]. Ankara: Republic of Turkey. Prime Ministry State Planning Organization (Report no: 2671). Retrieved March 24, 2008, from http://ekutup.dpt.gov.tr/bolgesel/gosterge/2003-05.pdf
DPT (Devlet Planlama Teskilati) [State Planning Organization]. (2001). Eighth
Five year development plan 2001-2005. Ankara: Republic of Turkey. Prime Ministry State Planning Organization. Retrieved May 2, 2008, from http://ekutup.dpt.gov.tr/plan/viii/plan8i.pdf
DPT (Devlet Planlama Teskilati) [State Planning Organization]. (2003). Acil eylem plani
[Urgent action plan]. Ankara: Republic of Turkey. Prime Ministry State Planning Organization. Retrieved May 6, 2008, from http://ekutup.dpt.gov.tr/plan/aep.pdf
DPT (Devlet Planlama Teskilati) [State Planning Organization]. (2006). Ninth
development plan 2007-2013. Ankara: Republic of Turkey. Prime Ministry State Planning Organization. Retrieved May 3, 2008, from http://ekutup.dpt.gov.tr/plan/ix/9developmentplan.pdf
Dulger, I. (2004, May). Turkey: Rapid coverage for compulsory education. The 1997 basic education program. A Case Study from Scaling Up Poverty Reduction: A Global Learning Process and Conference, Shanghai. Available from, www.worldbank.org.tr/ess
EACEA (Education, Audiovisual and Culture Executive Agency). (2009). Early
Childhood Education and Care in Europe: Tackling Social and Cultural Inequalities. European Commission Directorate General for Education and Culture. Brussels, Belgium: Author. Retrieved March, 2009, from http://eacea.ec.europa.eu/portal/page/portal/Eurydice/showPresentation?pubid=098EN
170

EARGED (Egitimi Arastirma ve Gelistirme Dairesi Baskanligi) [Educational Research and Development Directorate]. (2007). PISA 2006: Uluslararasi ogrenci degerlendime programi : Ulusal on rapor [PISA 20062: Programme for International Student Assessment: National report]. Ankara: EARGED, Ministry of National Education. Retrieved August 14, 2008, from http://earged.meb.gov.tr/pisa/dokuman/2006/rapor/Pisa_2006_Ulusal_On_Rapor.pdf
Education budget exceeded defense for the first time. (2004, July 1). Hurriyet.
Retrieved July 20, 2008, from http://webarsiv.hurriyet.com.tr/2004/07/01/483346.asp
Erberber, E., Arora, A., & Preuschoff, C. (2008). Developing the TIMSS 2007
questionnaires. In J.F. Olson, M.O. Martin, & I.V.S. Mullis (Eds.), TIMSS 2007 technical report. Chestnut Hill, MA: TIMSS & PIRLS International Study Center, Boston College.
EU (European Union). (2008). Working for the regions: EU regional policy 2007-2013.
Retrieved June 28, 2008, from http://ec.europa.eu/regional_policy/sources/docgener/presenta/working2008/ work_en.pdf
Eurydice. (2006). The education system in Turkey 2006/2007. Eurybase: The Information Database on Education Systems in Europe. Directorate-General for Education and Culture. Retrieved June 28, 2008, from http://www.eurydice.org/ressources/eurydice/eurybase/pdf/0_integral/TR_EN.pdf
Field, S., Kuczera, M., & Pont, B. (2007). No more failures: Ten steps to equity in
education. Paris, France: OECD.
Foy, P., Galia, J., & Li, I. (2008). Scaling the TIMSS 2007 mathematics and science assessment data. In J.F. Olson, M.O. Martin, & I.V.S. Mullis (Eds.), TIMSS 2007 technical report. Chestnut Hill, MA: TIMSS & PIRLS International Study Center, Boston College.
Foy, P. & Olson, J.F. (Eds.). (2009). TIMSS 2007 user guide for the international
database. Chestnut Hill, MA: International Study Center, Lynch School of Education, Boston College.
Gershberg, A.I. (2005). Towards an education decentralization strategy for Turkey:
Guideposts from international experience. Policy Note for the Turkey Education Sector Study (ESS). Washington, DC: World Bank. Available from, www.worldbank.org.tr/ess
171

Guo, C.J. (2007). Issues in science learning: An international perspective. In S. K. Abell, & N. G. Lederman (Eds.), Handbook of Research on Science Education (pp. 227-256). New Jersey: Lawrence Erlbaum Associates.
Heyneman, S.P. & Loxley, W.A. (1983). The effect of primary-school quality on
academic achievement across twenty-nine high- and low-income countries. The American Journal of Sociology, 88(6), 1162-1194.
Hosgor, S. (2004). Status and trends of education in Turkey (1970-2003). Paper
commissioned for the Turkey Education Sector Study (ESS). Washington, DC: World Bank. Available from, www.worldbank.org.tr/ess
House, J.D. (2000). Student self-beliefs and science achievement in Ireland: Findings
from the Third International Mathematics and Science Study (TIMSS). International Journal of Instructional Media, 27(1), 107-115.
House, J.D. (2003). Self-beliefs and science and mathematics achievement of adolescent
students in Hong Kong: Findings from the Third International Mathematics and Science Study (TIMSS). International Journal of Instructional Media, 30(2), 195-212.
House, J.D. (2006, November). Effects of science beliefs and instructional strategies on
achievement of students in the United States and Korea: Results from the TIMSS 2003 assessment. Paper presented at the meeting of the IEA International Research Conference (IRC), Washington, DC.
HUIPS (Hacettepe University Institute of Population Studies). (2006). Turkey migration
and internally displaced population survey [Press Release]. Retrieved July 10, 2008, from http://www.hips.hacettepe.edu.tr/english/press_release.pdf
Icduygu, A., Romano, D., & Sirkeci, I. (1999). The ethnic question in an environment of insecurity: The Kurds in Turkey. Ethnic and Racial Studies, 26(5), 829-853.
IEA. (2008). IEA International Database (IDB) analyzer. (Version 2.0) [Computer
software]. Hamburg, Germany: IEA Data Processing and Research Center. Available from http://www.iea.nl/iea_software.html
Istrate, O., Noveanu, G., & Smith, T.M. (2006). Exploring sources of variation in
Romanian science achievement. Prospects, 36(4), 475-496. Joncas, M. (2008a). TIMSS 2007 sampling design. In J.F. Olson, M.O. Martin, & I.V.S.
Mullis (Eds.), TIMSS 2007 technical report. Chestnut Hill, MA: TIMSS & PIRLS International Study Center, Boston College.
172

Joncas, M. (2008b). TIMSS 2007 sampling weights and participation rates. In J.F. Olson,
M.O. Martin, & I.V.S. Mullis (Eds.), TIMSS 2007 technical report. Chestnut Hill, MA: TIMSS & PIRLS International Study Center, Boston College.
Keeves, J.P. (Ed.). (1992). The IEA science study III: Changes in science education and achievement: 1970 to 1984. Oxford: Pergamon Press.
Keyder, C. & Ustundag, N. (2006). Dogu ve Guneydogu Anadolu’nun kalkinmasinda
sosyal politikalar [Social policies for the development of eastern and southeastern Anatolia]. In Dogu ve Guneydogu Anadolu’da sosyal ve ekonomik oncelikler [Social and economic priorities in eastern and southeastern Anatolia] (pp. 90-149). Istanbul: TESEV (Turkish Economic and Social Studies Foundation). Retrieved July 28, 2008, from http://www.tesev.org.tr/UD_OBJS/PDF/DEMP/guneydogu%5B1%5D.pdf
Kirdar, M. & Saracoglu, S. (2007). Migration and Regional Convergence: An empirical
Investigation for Turkey. Unpublished. MPRA Paper no. 2648. Retrieved July 12, 2008, from http://mpra.ub.uni-muenchen.de/2648/1/MPRA_paper_2648.pdf
Kocman, A. & and Sutgibi, S. (2004). Geographical education and training at
Turkish universities. International Research in Geographical and Environmental Education, 13(1), 97-102.
Loewendahl Ertugal, E. (2005). Europeanisation of regional policy and regional
governance: The case of Turkey. European Political Economy Review,3(1),18-53. Markandey, R. (2006, September). Operational definition of urban, rural and urban
agglomeration for monitoring human settlements. Paper presented at the meeting of SCORUS Conference on Regional and Urban Statistics and Research Globalization Impact on Regional and Urban Statistics, Wraclaw, Poland.
Martin, M.O., Mullis, I.V.S., Gonzalez, E.J., Gregory, K.D., Smith, T.A., et al.,
(2000). TIMSS 1999 international science report: Findings from IEA's repeat of the Third International Mathematics and Science Study at the eighth grade. Chestnut Hill, MA: International Study Center, Lynch School of Education, Boston College.
Martin, M.O., Mullis, I.V.S., Gregory, K.D., Hoyle, C., & Shen, C. (2000). Effective
schools in science and mathematics: IEA's Third International Mathematics and Science Study. Chestnut Hill, MA: International Study Center, Lynch School of Education, Boston College.
173

Martin, M.O., Mullis, I.V.S., Gonzalez, E.J., & Chrostowski, S.J. (2004). TIMSS 2003 international science report: Findings from IEA’s Trends in International Mathematics and Science Study at the fourth and eighth grades. Chestnut Hill, MA: TIMSS & PIRLS International Study Center, Boston College.
Martin, M.O., Mullis, I.V.S., & Foy, P. (with Olson, J.F., Erberber, E., Preuschoff, C.,
& Galia, J.) (2008). TIMSS 2007 international science report: Findings from IEA’s Trends in International Mathematics and Science Study at the fourth and eighth grades. Chestnut Hill, MA: TIMSS & PIRLS International Study Center, Boston College.
McKinley, E. (2007). Postcolonialism, indigenous students, and science education. In
Abell, S.K. & Lederman, N.G. (Eds.), Handbook of Research on Science Education (pp. 199-226). New Jersey: Lawrence Erlbaum Associates.
Mettas, A., Karmiotis, I., & Christoforou, P. (2003). Relationship between students’ self-
beliefs and attitudes on science achievement in Cyprus: Findings from the Third International Mathematics and Science Study (TIMSS). Eurasia Journal of Mathematics, Science and Technology Education, 2(1), 41-52.
MoNE (Ministry of National Education). (2002). OBBS 2002: Ilkogretim ogrencilerinin
basarilarinin belirlenmesi raporu. [OBBS 2002: Report on primary school students’ achievement]. Ankara: EARGED, Ministry of National Education.
MoNE (Ministry of National Education). (2005). Basic education in Turkey: Background
report. Ankara: Republic of Turkey. Ministry of National Education. Retrieved May 24, 2008, from http://www.oecd.org/dataoecd/8/51/39642601.pdf
MoNE (Ministry of National Education). (2007). OBBS 2005: Ilkogretim ogrencilerinin
basarilarinin belirlenmesi raporu. [OBBS 2005: Report on primary school students’ achievement]. Ankara: EARGED, Ministry of National Education.
MoNE (Ministry of National Education). (2008). National education statistics: Formal
education 2007-2008. Ankara: Republic of Turkey. Ministry of National Education. Available from, http://www.meb.gov.tr/english/indexeng.htm
Muijs, D., Harris, A., Chapman, C., Stoll, L., & Russ, J. (2005). Improving schools in
Socio-economically disadvantaged areas: A review of Research Evidence. In P. Clarke (Ed.), Improving schools in difficulty (pp. 94-114). London: Continuum International.
Mullis, I.V.S., Erberber, E., & Preuschoff, C. (2008). The TIMSS 2007 international benchmarks of student achievement in mathematics and science. In J.F. Olson, M.O. Martin, & I.V.S. Mullis (Eds.), TIMSS 2007 technical report. Chestnut Hill, MA: TIMSS & PIRLS International Study Center, Boston College.
174

Mullis, I.V.S., Martin, M.O., & Foy, P. (with Olson, J.F., Preuschoff, C., Erberber, E., Arora, A., & Galia, J. (2008). TIMSS 2007 international mathematics report: Findings from IEA’s Trends in International Mathematics and Science Study at the fourth and eighth grades. Chestnut Hill, MA: TIMSS & PIRLS International Study Center, Boston College.
Mullis, I.V.S., Martin, M.O., Gonzalez, E.J., & Kennedy, A.M. (2003). PIRLS 2001
international report: IEA’s study of reading literacy achievement in primary schools in 35 countries. Chestnut Hill, MA: Boston College.
Mullis, I.V.S., Martin, M.O., Ruddock, G.J., O’Sullivan, C.Y., Arora, A., & Erberber,
E. (2005). TIMSS 2007 assessment frameworks. Chestnut Hill, MA: Boston College.
Oakes, J. (1989). Creating indicators that address policy problems: The distribution of
opportunities and outcomes. In R.J. Shavelson, L.M. McDonnell, & J. Oakes (Eds.), Indicators for monitoring mathematics and science education: A sourcebook (pp. 192-222). Santa Monica, CA: The Rand Corporation.
OECD (Organisation for Economic Co-Operation and Development). (2006). OECD
economic surveys: Turkey 2006. Making quality education accessible to the whole population. OECD Economic Surveys, 15, 153-167.
OECD (Organisation for Economic Co-Operation and Development). (2007a). PISA
2006 science competencies for tomorrow’s world. Volume 1: Analysis. Paris: OECD.
OECD (Organisation for Economic Co-Operation and Development). (2007b). Reviews
of national policies for education: Basic education for Turkey. Paris: OECD.
OECD (Organisation for Economic Co-Operation and Development). (2009). Education today: The OECD perspective. Paris: OECD.
Olson, J.F., Martin, M.O., & Mullis, I.V.S. (Eds.). (2008). TIMSS 2007 technical
report. Chestnut Hill, MA: TIMSS & PIRLS International Study Center, Boston College.
Olson, J.F., Martin, M.O., & Mullis, I.V.S., Foy, P., Erberber, E., & Preuschoff, C. (2008). Reviewing the TIMSS 2007 item statistics. In J.F. Olson, M.O. Martin, & I.V.S. Mullis (Eds.), TIMSS 2007 technical report. Chestnut Hill, MA: TIMSS & PIRLS International Study Center, Boston College.
175

Ozdemir, E. (2003). Modeling of the factors affecting science achievement of eighth grade Turkish students based on the Third International Mathematics and Science Study–Repeat (TIMSS–R) data. Unpublished master’s thesis, Middle East Technical University, Ankara. Turkey.
Raudenbush, S.W. & Bryk, A.S. (2002). Hierarchical Linear Models: Applications and
data analysis methods (2nd ed.). Thousand Oaks, CA: Sage. Raudenbush, S.W., Bryk, A.S., & Congdon, R. (2004). Hierarchical linear and
nonlinear modeling: HLM for Windows (Version 6.00) [Computer Software]. Lincolnwood, IL: Scientific Software International.
Reinikainen, P. (2004). Explanatory variables of science achievement in Finland:
Cultural approach. In C. Papanastasiou (Ed.), Proceedings of the IEA International Research Conference (IRC) (Vol. 2, pp. 192-201). Cyprus: Cyprus University Press.
Reynolds, D. (2007). School effectiveness and school improvement (SESI): Links with
the international standards/accountability agenda. In T. Townsend (Ed.), International handbook of school effectiveness and improvement, (pp.471-484). The Netherlands: Springer.
Reynolds, D. & Teddlie, C. (2000). The processes of school effectiveness. In C. Teddlie
& D. Reynolds (Eds.), The international handbook of school effectiveness research (pp. 134-159). London: Falmer.
Roth, K.J., Druker, S.L., Garnier, H. E., Lemmens, M., Chen, C., Kawanaka, T., et al.
(2006). Teaching science in five countries: Results from the TIMSS 1999 video study. (NCES 2006-011). U.S. Department of Education. Washington, DC: National Center for Education Statistics.
Ruddock, G.J., O’Sullivan, C.Y., Arora, A., & Erberber, E. (2008). Developing the
TIMSS 2007 mathematics and science assessment and scoring guides. In J.F. Olson, M.O. Martin, & I.V.S. Mullis (Eds.), TIMSS 2007 technical report. Chestnut Hill, MA: TIMSS & PIRLS International Study Center, Boston College.
Scheerens, J. & Creemers, B.P.M. (1989). Conceptualizing school effectiveness. International Journal of Educational Research, 3, 691-706.
Sjoberg, S. & Schreiner, C. (2006). How do student perceive science and technology?
Science in School, 1, 66-69. Smits, J. & Hosgor, A.G. (2003). Linguistic capital: Language as a socioeconomic
resource among Kurdish and Arabic women in Turkey. Ethnic and Racial Studies, 26(5), 829-853.
176

Smits, J. & Hosgor, A.G. (2006). Effects of family background characteristics on educational participation in Turkey. International Journal of Educational Development, 26, 545-560.
Snijders, T. & Bosker, R. (1999). Multilevel Analysis: An introduction to basic and
advanced multilevel modeling. Thousand Oaks, California: SAGE. Tai, R., Liu, C.Q., Maltese, A.V., and Fan, X. (2006). Planning early for careers in
science. Science, 312, 1143-1144. Tas, H.I. (2005). Geographic education in Turkish high schools. Journal of Geography,
104(1), 35-39. Teddlie, C., Stringfield, S., & Reynolds, D. (2000). Context issues within school
effectiveness research. In C. Teddlie & D. Reynolds (Eds.), The international handbook of school effectiveness research (pp. 160-185). London: Falmer Press.
TESEV (Turkish Economic and Social Studies Foundation). (2006). Social and economic
priorities in eastern and southeastern Anatolia. Istanbul: TESEV. Retrieved July 5, 2008, from http://www.undp.org.tr/publicationsDocuments/tesevENG.pdf
TNA (Turkish News Agency). (1999). Facts about Turkey. Turkish News Agency for the Directorate General of Press and Information of the Prime Ministry. Retrieved July 24, 2008, from
http://www.byegm.gov.tr/YAYINLARIMIZ/kitaplar/isteturkiye/english/english.htm Trong, K.L. (2009). Using PIRLS 2006 to measure equity in reading achievement
internationally. Unpublished doctoral dissertation, Boston College. Turan, S. (2000). John Dewey’s report of 1924 and his recommendations on the Turkish
educational system revisited. History of Education, 29(6), 543-555. Turkish Statistics Institution. (2008). Databases [Data file]. Available from
http://www.turkstat.gov.tr UNDP (United Nations Development Programme). (2001). Human development report
Turkey 2001. Ankara. New York, NY: UNDP. Retrieved March 24, 2008, from http://hdr.undp.org/en/reports/nationalreports/europethecis/turkey/name,2933,en.html UNDP (United Nations Development Programme). (2004). Country Evaluation Turkey:
Assessment of development results. New York, NY: UNDP. Retrieved June 11, 2008, from http://www.undp.org/eo/documents/ADR/ADR-Reports/ADR_Turkey.pdf
177

UNDP (United Nations Development Programme). (2007). Human development report 2007/2008. Fighting climate change: Human solidarity and human development. New York, NY: Palgrave Macmillan. Available from, http://hdr.undp.org/en/
UNESCO (United Nations Educational, Scientific and Cultural Organization). (2004, September). National report for Turkey. Presented at the 2004 International Conference on Education. Retrieved July 14, 2008, from http://www.ibe.unesco.org/International/ICE47/English/Natreps/Nrep_main.htm
UNESCO (United Nations Educational, Scientific and Cultural Organization). (2007).
Enhancing learning: From access to success. Paris: UNESCO. Retrieved July 10, 2008, from http://unesdoc.unesco.org/images/0015/001556/155642E.pdf
UNESCO Institute for Statistics. (2008). EdStats Query [Data file]. Available from
World Bank’s Web site, http://go.worldbank.org/47P3PLE940 Webster, B.J. & Fisher, D.L. (2000). Accounting for variation in science and
mathematics achievement: A multilevel analysis of Australian data: Third International Mathematics and Science Study (TIMSS). School Effectiveness and School Improvement, 11(3), 339–360.
Wobmann, L. & Schutz, G. (2006). Efficiency and Equity in European Education in
Training Systems. Retrieved February 23, 2009, from http://ec.europa.eu/education/policies/2010/doc/eenee.pdf
World Bank. (2005). Turkey education sector study: Sustainable pathways to an effective, equitable, and efficient education system for preschool through secondary school education. Washington, DC: The World Bank (Report No: 32450-TU). Available from, www.worldbank.org.tr/ess
World Bank. (2007). Turkey: Country Brief 2007. Retrieved March 23, 2008, from
http://go.worldbank.org/VQSCYP1Y50 World Bank. (2008). Turkey - Social Risk Mitigation Project (SRMP): Implementation
completion and results report. Report No: ICR0000306. Author. World Conference on Education for All. (1990). World declaration on education for all.
New York: UNESCO. Wynne, H. (1999). Effective teaching of science: A review of research. Edinburgh:
Scottish Council for Research in Education. Young, D.J (1998). Rural and urban differences in student achievement in science and
mathematics: A multilevel analysis. School Effectiveness & School Improvement, 9(4), 386-418.
178

Appendix Information About Student and School Background Variables
179

Table A.1. Information About Student Background Variables
Frequency of Speaking Turkish at Home
Source
Based on students’ responses to the following question in the Student Questionnaire:
How often do you speak Turkish at home?
Original categories
1= Always; 2= Almost always; 3= Sometimes; 4= Never
Recoded categories
0= Always or almost always (Original categories 1 and 2)
1= Sometimes or never (Original categories 3 and 4)
Note: For multi-level analysis, 0.2% missing cases replaced using conditional mean imputation method.
Parents’ Highest Education Level
Source
Variable provided in Turkey’s student data file. TIMSS derived the variable from students’ responses to the following questions in the Student Questionnaire:
What is the highest level of education completed by your mother?
What is the highest level of education completed by your father?
Original categories
The education level of the parent with more education was used in assigning students to the following categories:
1= Completed university or higher (including master’s or doctorate)
2= Completed post-secondary education but not university
3= Completed upper-secondary/secondary
4= Completed lower-secondary/primary
5= Less than lower-secondary/primary
6= Do not know
Recoded categories
0= Higher than primary school (Original categories 1 to 3)
1= Primary school or less (Original categories 4 to 6)
Note. For multi-level analysis, 1.0% missing cases replaced using conditional mean imputation method. Students in the “Do not know” category (1.2%) had the lowest performance in Turkey as well as in regions compared to the students in other original categories, hence this category collapsed in “primary school or less” category.
180

Table A.1. Information About Student Background Variables (Continued)
Index of Home Resources
Source and original categories
Based on students’ responses to the following questions in the Student Questionnaire:
Do you have any of these things at your home? (1= Yes, 2= No)
Computer
Study desk/table for your use
Internet connection
Dishwasher
Heating system with radiator
DVD/CD player
About how many books are there in your home?
1= None or very few books (0-10 books)
2= Enough to fill one shelf (11-25 books)
3= Enough to fill one bookcase (26-100 books)
4= Enough to fill two bookcases (101-200 books)
5= Enough to fill three or more bookcases (more than 200 books)
Index categories
The six home possessions recoded:
0= No
1= Yes
The book variable recoded:
0= 25 or less books (Original categories 1 and 2)
1= More than 25 books (Original categories 3 to 5)
The index is computed by averaging the responses to the seven source questions:
0= High = Average is 0.5 or more (On average, 4 or more home resources)
1= Low = Average is less than 0.5 (On average, 3 or less home resources)
Scale reliability: 0.76
Total scale variance accounted for by component variables: 41% Note. For multi-level analysis, missing cases for source questions (max. 1.7%) replaced using conditional mean imputation method.
181

Table A.1. Information About Student Background Variables (Continued)
Index of Self-confidence in Learning Science
Source and original categories
Based on students’ responses to the following questions in the Student Questionnaire:
How much do you agree with these statements about learning science? 1= Agree a lot; 2= Agree a little; 3= Disagree a little; 4= Disagree a lot
I usually do well in science I learn things quickly in science Science is more difficult for me than for many of my classmates (Reversed) Science is not one of my strenghths (Reversed)
Index categories
The index is computed by averaging the responses to the four source questions:
0= High = Average is less than or equal to 2 (Agreeing to source questions)
1= Low = Average is greater than 2 (Disagreeing to source questions)
Scale reliability: 0.72
Total scale variance accounted for by component variables: 55%
Index of Valuing Science
Source and original categories
Based on students’ responses to the following questions in the Student Questionnaire:
How much do you agree with these statements about science? 1= Agree a lot; 2= Agree a little; 3= Disagree a little; 4= Disagree a lot
I think learning science will help me in my daily life I need science to learn other school subjects I need to do well in science to get into the university of my choice I need to do well in science to get the job I want
Index categories
The index is computed by averaging the responses to the four source questions:
0= High = Average is less than or equal to 2 (Agreeing to source questions)
1= Low = Average is greater than 2 (Disagreeing to source questions)
Scale reliability: 0.72
Total scale variance accounted for by component variables: 55%
182

Table A.1. Information About Student Background Variables (Continued)
Index of Positive Affect Toward Science
Source and original categories
Based on students’ responses to the following questions in the Student Questionnaire:
How much do you agree with these statements about learning science? 1= Agree a lot; 2= Agree a little; 3= Disagree a little; 4= Disagree a lot
I enjoy learning science Science is boring (Reversed) I like science
Index categories
The index is computed by averaging the responses to the three source questions.
0= High = Average is less than or equal to 2 (Agreeing to source questions)
1= Low = Average is greater than 2 (Disagreeing to source questions)
Scale reliability: 0.74
Total scale variance accounted for by component variables: 68%
Students’ Educational Expectations
Source
Based on students’ responses to the following question in the Student Questionnaire:
How far in school do you expect to go?
Original categories
1= Finish <ISCED 3>
2= Finish <ISCED 4>
3= Finish <ISCED 5B>
4= Finish <ISCED 5A, first degree>
5= Beyond <ISCED 5A, first degree>
6= I don’t know
Turkey’s national adaptation
1= Finish secondary school
3= Finish first stage of tertiary education (2 or 3 years)
4= Finish tertiary education (first degree, B.A.)
5= Finish tertiary education (second degree, M.S./M.A., Ph.D.)
6= I don’t know
Note. According to Turkey’s national adaptation to the source questions, Turkey did not administer the original Category 2 (Finish <ISCED 4>).
183

Table A.2. Information About School Context Variables
Region
Source Explicit stratum categories provided in Turkey’s data file
Original
categories
1= Marmara
2= Central Anatolia
3= Aegean
4= Mediterranean
5= Black Sea
6= Eastern Anatolia
7= Southeastern Anatolia
Recoded
categories
Central Anatolia: 0= Marmara; 1= Central Anatolia
Aegean: 0= Marmara; 1= Aegean
Mediterranean: 0= Marmara; 1= Mediterranean
Black Sea: 0= Marmara; 1= Black Sea
Eastern Anatolia: 0= Marmara; 1= Eastern Anatolia
Southeastern Anatolia: 0= Marmara; 1= Southeastern Anatolia
School Community Type
Source Principals’ responses to the following question in the School Questionnaire:
How many people live in the city, town, or area where your school is located?
Original categories
1= More than 500,000 people
2= 100,001 to 500,000 people
3= 50,001 to 100,000 people
4= 15,001 to 50,000 people
5= 3,001 to 15,000 people
6= 3,000 people or fewer
Recoded categories
0= Urban (Original categories 1 to 3, i.e., population greater than 50,000)
1= Rural (Original categories 4 to 6, i.e., population less than or equal to 50,000)
Note. For multi-level analysis, 2.1% missing cases replaced using conditional mean imputation method.
184

Table A.2. Information About School Context Variables (Continued)
Index of Principals’ Reports on Positive School Climate for Academic Achievement
Source and original categories
Based on principals’ responses to the following questions in the School Questionnaire:
How would you characterize each of the following within your school? 1= Very high; 2= High; 3= Medium; 4= Low; 5= Very low
Teachers' expectations for student achievement
Parental support for student achievement
Parental involvement in school activities
Students' desire to do well in school
Index categories
The index is computed by averaging the responses to the six source questions:
0= High = Average is less than 3
(High or very high positive school climate)
1= Low = Average is 3 or more
(Medium, low, or very low high positive school climate)
Scale reliability: 0.81
Total scale variance accounted for by component variables: 64%
Note. For multi-level analysis, missing cases for source questions (max. 0.7%) replaced using conditional mean imputation method.
185

186
Table A.2. Information About School Context Variables (Continued)
Index of Teachers’ Reports on Adequacy of School Resources in Teaching Science
Source and original categories
Based on science teachers’ responses to the following questions in the Science Teacher Questionnaire:
In your view, to what extent do the following limit how you teach science to the TIMSS class? 1= Not applicable; 2= Not at all; 3= A little; 4= Some; 5= A lot
Shortage of computer hardware
Shortage of computer software
Shortage of support for using computers
Shortage of other instructional equipment for students’ use
Shortage of equipment for teachers’ use in demonstrations and other exercises
Inadequate physical facilities
Index categories
Original categories to the source questions recoded:
1= A lot; 2= Some; 3= A little; 4= Not applicable or Not at all
The index is computed by averaging the responses to the six source questions:
0= High = Average is more than 2.5 (No or little impact)
1= Low = Average is 2.5 or less (Some or a lot impact)
Scale reliability: 0.89
Total scale variance accounted for by component variables: 65%
Note. For multi-level analysis, missing cases for source questions (max. 1.4%) replaced using conditional mean imputation method.