Embed Size (px)
Citation preview
Journal website: http://epaa.asu.edu/ojs/ Manuscript received: 5/8/2016 Facebook: /EPAAA Revisions received: 21/1/2016 Twitter: @epaa_aape Accepted: 22/1/2016
education policy analysis archives A peer-reviewed, independent, open access, multilingual journal
Arizona State University
Volume 25 Number 11 February 13, 2017 ISSN 1068-2341
Linking TIMSS and NAEP Assessments to Evaluate International Trends in Achievement
Hwanggyu Lim &
Stephen G. Sireci University of Massachusetts Amherst
United States Citation: Lim, H., & Sireci, S. G. (2017). Linking TIMSS and NAEP assessments to evaluate international trends in achievement. Education Policy Analysis Archives, 25(11). http://dx.doi.org/10.14507/epaa.25.2682 Abstract: The Trends in International Mathematics and Science Study (TIMSS) makes it possible to compare the performance of students in the US in Mathematics and Science to the performance of students in other countries. TIMSS uses four international benchmarks for describing student achievement: Low, Intermediate, High, and Advanced. In this study, we linked the eighth-grade Math TIMSS and NAEP scales using equipercentile equating to (a) help better interpret U.S. eighth-grade students’ performance on TIMSS, and (b) investigate the progress of eighth-grade U.S. students over time relative to the progress of students in other countries. Results indicated that relative to other countries, U.S. eighth-grade students increased with respect to the “At or Above Basic” NAEP Achievement level, but that other countries saw larger improvements in the higher achievement level categories, relative to the US. This finding may reflect the emphasis of No Child Left Behind on raising lower achievement to “proficient.” However, with respect to “Advanced” mathematics achievement, eighth-grade U.S. students showed less
Education Policy Analysis Archives Vol. 25 No. 11 2
improvement than students in other countries. Keywords: achievement levels, equipercentile equating, international assessment, linking, NAEP, TIMSS La vinculación de las evaluaciones TIMSS y NAEP para evaluar las tendencias internacionales en el logro Resumen: Las Tendencias en Matemáticas Internacionales y Estudios Ciencias (TIMSS) le permite comparar el rendimiento de los estudiantes en los EE.UU. en Matemáticas y Ciencia con el rendimiento de otros estudiantes de los países. El TIMSS utiliza cuatro puntos de referencia internacionales para describir el rendimiento del estudiante: bajo, intermedio y avanzado de alta. En este estudio, asociamos las escalas de TIMSS matemáticas y NAEP dadas en octavo grado utilizando equipercentile equivalente a (a) ayuda a interpretar mejor el rendimiento de octavo grado en el TIMSS, y (b) para investigar el progreso de los estudiantes de 8º grado en los Estados Unidos en el tiempo sobre el progreso de los estudiantes de otros países. Los resultados indicaron que, en comparación con otros países, los estudiantes de 8º grado de Estados Unidos aumentaron desde el nivel “igual o superior al básico” NAEP logro, pero otros países marcaron la mayor mejora en la mayoría de las categorías de nivel de rendimiento en los EE.UU.. Este hallazgo puede reflejar el énfasis de No Child Left Behind (NCLB) para elevar el rendimiento más bajo de "competente". Sin embargo, en cuanto a rendimiento en matemáticas “avanzada”, los estudiantes estadounidenses de octavo grado mostraron menor mejoría de los estudiantes de otros países. Palabras-clave: niveles de rendimiento, equipercentile equivalente, evaluación internacional, vinculación, NAEP, TIMSS
Vinculando avaliações TIMSS e NAEP para avaliar tendências internacionais em
realizações
Resumo: As Tendências em Matemática Internacional e Estudos em Ciências (TIMSS) permite comparar o desempenho dos estudantes nos EUA em Matemática e Ciência com o desempenho de alunos de outros países. O TIMSS usa quatro referências internacionais para descrever o desempenho dos alunos: Baixo, Intermediário, Alto e Avançado. Neste estudo, associamos as escalas de TIMSS e NAEP de matemática dada na 8ª série usando equivalentes equipercentile para (a) ajudar a interpretar melhor o desempenho dos estudantes da oitava série no TIMSS, e (b) investigar o progresso de estudantes de 8ª série nos EUA ao longo do tempo relativo ao progresso dos alunos em outros países. Os resultados indicaram que, em relação a outros países, os estudantes de 8º ano dos Estados Unidos aumentaram em relação ao nível “no ou acima do básico” de realização NAEP, mas que outros países marcaram melhorias maiores nas categorias de maior nível de desempenho em relação aos EUA. Essa descoberta pode refletir na ênfase de Nenhuma Criança Deixada Para Trás (No Child Left Behind) em elevar a realização inferior para "proficiente". No entanto, no que diz respeito à conquista de matemática “Avançada,” os estudantes americanos de 8ª série apresentaram menor melhora do que os estudantes de outros países. Palavras-chave: níveis de realização, equivalentes equipercentile, avaliação internacional, vinculação, NAEP, TIMSS

Linking TIMSS and NAEP Assessments 3
Introduction
Educators, researchers, and policymakers in the United States are interested in how well the academic achievement of U.S. students compares to students in other countries. However, it is difficult to study the international competitiveness of students because of few common metrics for comparing student achievement.
The Trends in International Mathematics and Science Study (TIMSS) is one of the major assessments that makes it possible to compare the Mathematics and Science achievement of students in the U.S. with that of students in other countries. The International Association for the Evaluation of Educational Achievement (IEA) implements TIMSS to measure the mathematics and science knowledge and skills of students in several countries. Since 1995, they have collected data on the mathematics and science achievement of fourth- and eighth-grade students every four years.
TIMSS uses four achievement level standards, called “international benchmarks,” for each subject and grade. These benchmarks are Low International, Intermediate International, High International, and Advanced International. For instance, the descriptions of 2011 TIMSS benchmarks for mathematics at grade 8 are:
Low International: Students have some knowledge of whole numbers and decimals, operations, and basic graphs. Intermediate International: Students can apply basic mathematical knowledge in a variety of situations. High International: Students can apply their understanding and knowledge in a variety of relatively complex situations. Advanced International: Students can reason with information, draw conclusions, make generalizations, and solve linear equations. (National Center for Education Statistics: NCES, 2013)
In addition to how U.S. students rank with respect to students in other countries using average TIMSS scores, the benchmarks can be used to compare the performance of U.S. students to students in other countries. However, these international benchmarks used for TIMSS reporting are not familiar to a U.S. audience, such as U.S policymakers, who are more familiar with the achievement level standards used for the National Assessment of Educational Progress (NAEP).
NAEP is a comprehensive national assessment in the United States for measuring the academic achievement of U.S. students and for tracking their achievement over time (Beaton et al., 2011; National Assessment Governing Board: NAGB, 2016a). Since 1969, the National Center for Education Statistics (NCES) has administered NAEP periodically to representative samples of students at fourth-, eighth-, and twelfth grade to measure what U.S. students know and can do in various subject areas, including mathematics and science. Three achievement levels are reported on all NAEP assessments: Basic, Proficient, and Advanced. The general descriptions are:
Basic: Denotes partial mastery of prerequisite knowledge and skills that are fundamental for proficient work at each grade. Proficient: Represents solid academic performance for each grade assessed. Students reaching this level have demonstrated competency over challenging subject matter. Advanced: Signifies superior performance. (NAGB, 2016b)
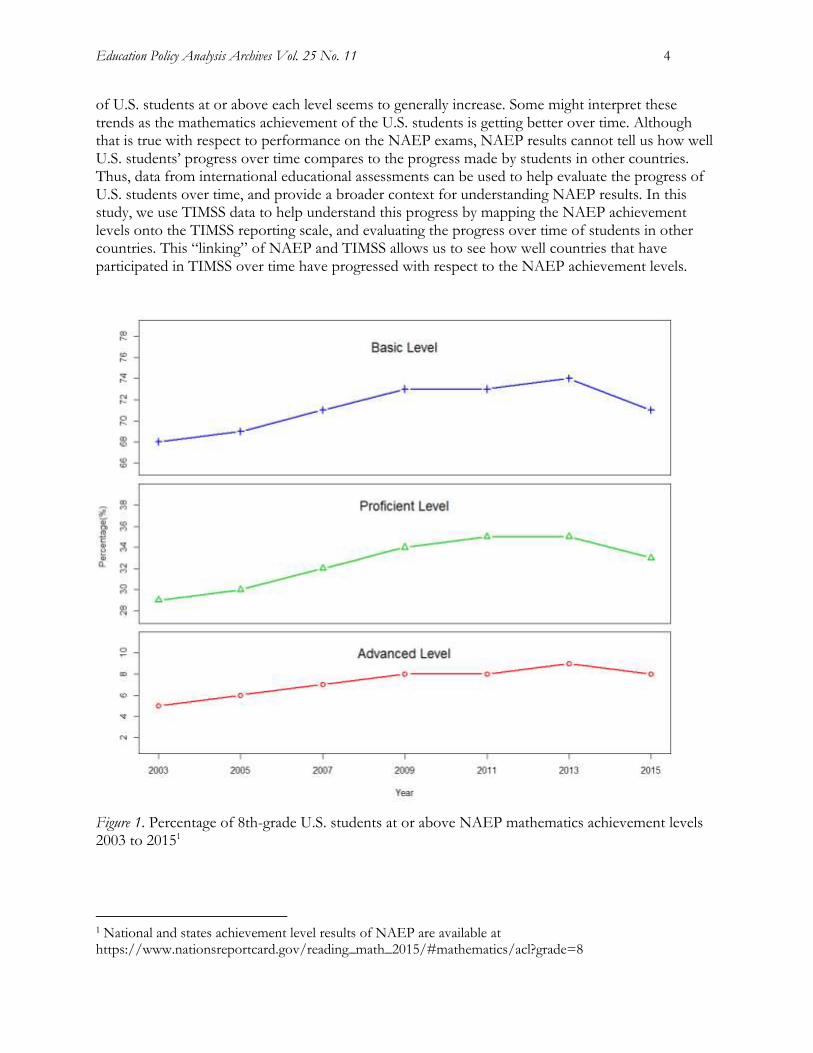
Figure 1 shows the percentages of eighth-grade students at or above the NAEP mathematics achievement levels from 2003 to 2015. With the exception of the slight dip in 2015, the percentages
Education Policy Analysis Archives Vol. 25 No. 11 4
of U.S. students at or above each level seems to generally increase. Some might interpret these trends as the mathematics achievement of the U.S. students is getting better over time. Although that is true with respect to performance on the NAEP exams, NAEP results cannot tell us how well U.S. students’ progress over time compares to the progress made by students in other countries. Thus, data from international educational assessments can be used to help evaluate the progress of U.S. students over time, and provide a broader context for understanding NAEP results. In this study, we use TIMSS data to help understand this progress by mapping the NAEP achievement levels onto the TIMSS reporting scale, and evaluating the progress over time of students in other countries. This “linking” of NAEP and TIMSS allows us to see how well countries that have participated in TIMSS over time have progressed with respect to the NAEP achievement levels.
Figure 1. Percentage of 8th-grade U.S. students at or above NAEP mathematics achievement levels 2003 to 20151
1 National and states achievement level results of NAEP are available at https://www.nationsreportcard.gov/reading_math_2015/#mathematics/acl?grade=8

Linking TIMSS and NAEP Assessments 5
The goal of the present study is to link the eighth-grade NAEP mathematics achievement levels to the TIMSS eighth-grade mathematics scale to facilitate interpretation of U.S. students’ performance on TIMSS mathematics, relative to the changes in the performance of students in other countries over time. Using a process called “linking,” we can project how students in different countries have performed relative to the NAEP standards over time.
Linking Educational Assessments
Phillips (2007) described linking as “a process that provides a concordance table that expresses scores on one test (e.g., TIMSS) in terms of the metric of another test (e.g., NAEP)” (p. 2). Linking studies are typically done to make general comparisons across tests, and so are “weaker” than more complex equating studies that are conducted to produce interchangeable scores across different versions of a test. Equating is typically done when there are two versions of the same test and the goal is to put them on the same scale, so examinees can take either form and get essentially the same score. Linking, as used in this study, results in “distributional equivalence” (Pommerich, 2016), where the score scales from different tests are considered to have the same distribution, and achievement levels from one test can be mapped onto the scale of the other test. This is the category of linking used in the present study.
Although previous studies have linked NAEP to TIMSS (e.g., Hambleton, Sireci, & Smith, 2009; Jia et al., 2014; Johnson, Cohen, Chen, Jiang, & Zhang, 2005; Phillips, 2007), these studies did not provide information about whether the performance of the U.S students improved over time compared to the performance of students in other countries. Rather, they only focused on relative performance in a given year. Thus, the present study extends previous research in a way that should be helpful to policy makers who want to evaluate how well eighth-grade U.S. students are performing in mathematics over time, within an international context.
In the present study, we used linking to map the eighth-grade 2003, 2007, and 2011 NAEP mathematics achievement levels onto the 2003, 2007, 2011 TIMSS scales, respectively. This linking allowed us to estimate the percentages of students at or above the Basic, Proficient, and Advanced achievement levels on NAEP in each country that participated in the 2003, 2007, and 2011 TIMSS mathematics assessments.
Before describing the linking method used in this study, we briefly review previous research related to NAEP and TIMSS. This review includes (a) other studies that linked NAEP and TIMSS in some way, (b) analyses of the content similarity between NAEP and TIMSS mathematics assessments, and (c) the consistency of the NAEP and TIMSS mathematics framework over time.
Previous NAEP /TIMSS Linking Studies
Johnson et al. (2005) explored linking the 2000 eighth-grade NAEP mathematics and science assessments to the 1999 TIMSS eighth-grade mathematics and science assessments. Their major purpose was to compare the U.S. states that participated in NAEP with the nations that participated in TIMSS. To conduct this comparison, they linked the assessments using two linking methods: projection and statistical moderation. In the projection method, a regression equation based on students’ NAEP and TIMSS scores was used to predict the scores on TIMSS from those on NAEP. For this method, the data were gathered from a sample of students who responded to both NAEP and TIMSS assessments. This approach “allows a direct comparison of performance on the two instruments, … and removes all doubt about the comparability of the people taking each instrument” (Johnson et al., 2005, p. 1).
The statistical moderation method was conducted based on the national sample of both NAEP and TIMSS. In this approach, the mean and standard deviation of the two assessments were put on the same scale by conducting a linear transformation such that the NAEP scores have the

Education Policy Analysis Archives Vol. 25 No. 11 6
same distribution as the TIMSS scores2. This approach could be applied to “entirely unrelated tests because this method does not use any information about the correlation between the tests being linked” (p. 33). To evaluate both linking methods, they conducted a validation study using 12 states that took both NAEP and TIMSS. The findings indicated that the projection method did not perform well because the estimated TIMSS scores significantly under-predicted actual TIMSS scores. The statistical moderation method showed a better performance for predicting the TIMSS scores from NAEP scores.
Phillips (2007) linked the 2000 NAEP mathematics and science exams to the 1999 TIMSS exams for eighth-grade students. He also applied this linking function to link the 2000 NAEP mathematics and science exams to the 2003 TIMSS. Given the results of Johnson et al. (2005), he used statistical moderation to project the NAEP achievement levels onto the TIMSS scale for each country that participated in the 1999 TIMSS and 2003 TIMSS. His goal was to discover “how would other countries perform if their TIMSS results could be expressed in terms of NAEP achievement levels?” (p. 2). He also concluded that although this study could help interpret the performance patterns of international students, “the estimates provided by statistical moderation should be considered rough, ballpark estimates and should only be for broad policy understandings” (p. 3).
Hambleton et al. (2009) used equipercentile linking to map the 2003 NAEP mathematics achievement levels onto the corresponding the 2003 TIMSS and the 2003 Program for International Student Achievement (PISA) reporting scales based on eighth grade students. Equipercentile linking is used to identify scores on a test form that have same percentile ranks as scores on another test form (Kolen & Brennan, 2004). Once the distribution of scores on the first test form (X) are converted the new form (Y) scale, the converted scores of form X would have the same distribution as scores from form Y. This approach is usually applied to equate the scores of the multiple parallel test forms which have same content and same statistical characteristics so that the test scores can be used interchangeably. Obviously, these exams deviate from parallel forms derived from the same test specifications. However, the linked scores were considered sufficiently comparable for the purpose of designating the proportion of students scoring at or below the points on the NAEP scale that corresponded to the achievement levels (Hambleton et al. 2009; Waltman, 1997).
The focus of Hambleton et al. (2009) was to check whether the NAEP achievement levels were set too high by comparing the performance of the U.S. students to that of students in other countries who took TIMSS and PISA. They linked assessments administered in the same year to “avoid the confounding of findings from the study with any achievement growth that may have occur by the national student samples over time” (p. 383). The results of both the NAEP-TIMSS linkage and the NAEP-PISA linkage showed that the highest-performing countries had substantially larger students who were classified at or above the “advanced” and “proficient” levels on NAEP. They concluded “relative to the question of whether these NAEP standards are too high, it appears they are not, when taken within an international context” (p. 389).
Jia et al. (2014) linked the 2011 NAEP and TIMSS assessments for both mathematics and science. The purpose of their study was to predict comparable TIMSS scores for U.S. states that
2 In this method, the distribution of NAEP scores are transformed to the distribution of TIMSS scores by using the moderation linking function such that:
And A and B are estimated by the equations such that:
. After the NAEP scores are mapped onto the TIMSS score scale, this transforms scores have the same distribution with that of TIMSS scores.

Linking TIMSS and NAEP Assessments 7
participated in NAEP but did not participate in TIMSS. They used three linking methods—statistical moderation, calibration, and statistical projection. Statistical moderation and projection were described earlier. Calibration refers to calibration of all items from two assessments onto a common scale. This linking method is used when two tests are assumed to measure common content, but have different test specifications and different statistical characteristics. Although all three methods yielded similar predicted TIMSS scores, NCES decided to report the predicted TIMSS scores for the states that were estimated by the statistical moderation method. The reason was that “the statistical moderation technique is the simplest method among the three requiring the estimation of the fewest parameters (i.e., the means and standard deviations of the U.S. national public school samples for NAEP and TIMSS)” (p. xiv).
As we describe later, we choose the equipercentile method for linking NAEP and TIMSS in this study. Our goal was to map the NAEP achievement levels onto the TIMSS scale, and so our purpose was most similar to Hambleton et al. (2009), who used the equipercentile approach. Given that we did not have a sample of students who took both exams, the projection and calibration methods were not options for this study.
Before describing the equipercentile linking method used in this study, we first describe the consistency of content across the two assessments. The content overlap of NAEP and TIMSS has been previously evaluated in several studies.
Comparing NAEP and TIMSS Content
NAEP and TIMSS are national and international assessments, respectively, and so it is reasonable that they differ on several features such as purpose, population, precision of estimation, and content. To defend the linking of different tests, evidence should be provided that the different tests measure similar constructs (Kolen, 2007). Analyses comparing the content of NAEP and TIMSS have been conducted by Nohara and Goldstein (2001), Neidorf, Binkley, Gattis, and Nohara (2006), and Provasnik, Lin, Darling, and Dodson (2013). The results of these studies generally indicate NAEP mathematics and TIMSS mathematics have considerable overlap with respect to mathematics content; however, there are some differences in organization of the content frameworks and item formats.
With respect to mathematics, which is the focus of the present study, Neidorf et al. (2006) compared the content of the 2003 NAEP mathematics exam and the 2003 TIMSS mathematics exam for fourth and eighth grade. They found substantial overlap in the content of both assessments. Nearly all items from each assessment were classified into one of the major content areas of the other assessment framework at the broadest level. They argued that the two assessments “appear to be quite similar overall in terms of the distribution of items across the low, moderate, and high mathematical complexity levels” (p. v). However, there were differences in content between NAEP and TIMSS when considering more detailed comparison of the mathematics content (e.g., the specific objectives measured by the items, rather than the broad content categories). They warned that although the items of both the NAEP and TIMSS mathematics assessments addressed many similar topics and required similar skills and processes to solve the items, these results should not be interpreted that both assessments measure the same content in the same way.
Provasnik et al. (2013) compared the content of the 2011 TIMSS mathematics with 2011 NAEP mathematics framework. In their study, two expert panels who were familiar with the TIMSS and NAEP assessments analyzed the similarities and differences between the TIMSS mathematics items and the NAEP mathematics items for both fourth- and eighth-grades. The content match analyses of both assessments were conducted by classifying all TIMSS 2011 mathematics items into the NAEP 2011 mathematics framework based on three specified categories: (a) content area, (b) content area’s subtopic, and (c) subtopic’s objective by grade level. The goal of this item-by-item
Education Policy Analysis Archives Vol. 25 No. 11 8
review was “to see how many TIMSS items fit in the NAEP framework and how much of the NAEP framework was covered by TIMSS items” (p. 18).
Provasnik et al. (2013) found strong content correspondence between 2011 TIMSS and 2011 NAEP mathematics assessments. Specifically, almost all items in the 2011 TIMSS mathematics could be classified in the 2011 NAEP mathematics framework’s content categories. Only 1% of the 2011 TIMSS mathematics items on the fourth-grade exam, and 3% of the 2011 TIMSS mathematics items on the eighth-grade exam, could not be classified to a specific objective within the 2011 NAEP mathematics framework. Based on the results, they concluded “This level of congruence at both fourth- and eighth-grade can be described as a strong content match” (p. 23).
Consistency of Mathematics Framework Over Time
Given that our study linked NAEP and TIMSS math assessments at three different points in time (2003, 2007, and 2011), as a reviewer of an earlier version of this article pointed out, differential change in the content of these exams is a potential problem. The NAEP mathematics framework changed slightly in 2005 and 2009. However, the framework changes for eighth-grade in both years were minimal, and NAEP continued to report trend results from previous assessments (NCES, 2016). In fact, NCES (2016) reported the objectives of the NAEP mathematics assessments for eighth-grade remained the same.
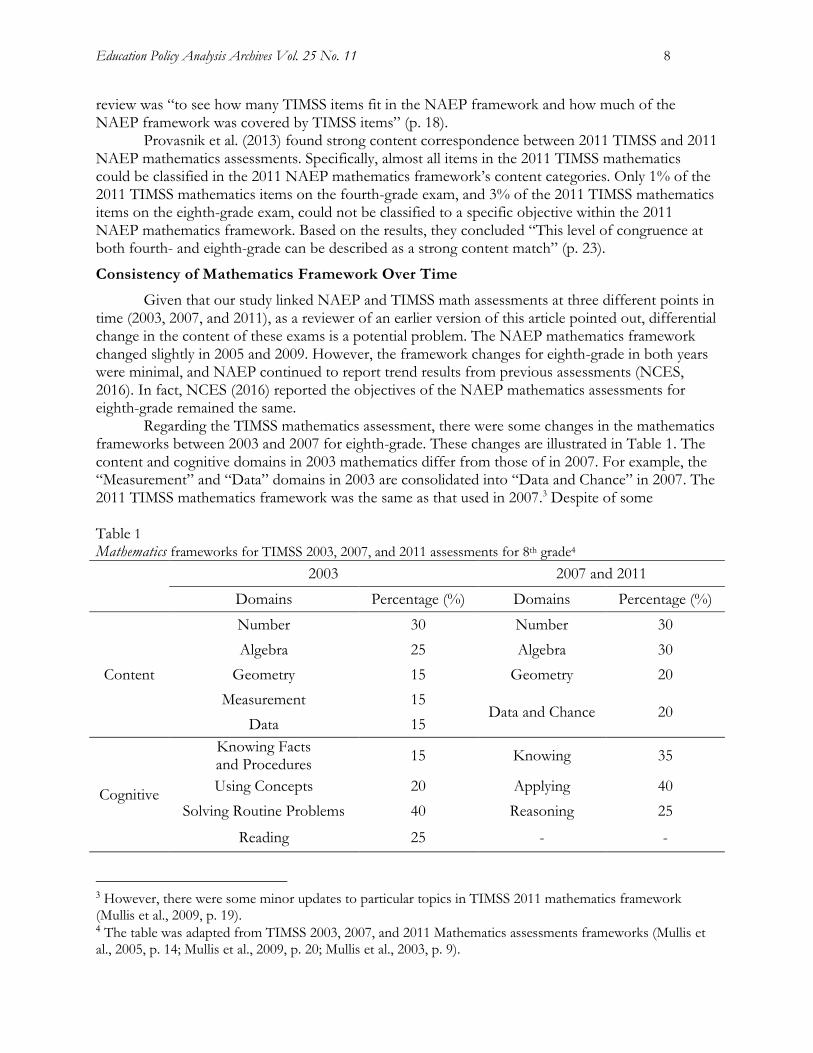
Regarding the TIMSS mathematics assessment, there were some changes in the mathematics frameworks between 2003 and 2007 for eighth-grade. These changes are illustrated in Table 1. The content and cognitive domains in 2003 mathematics differ from those of in 2007. For example, the “Measurement” and “Data” domains in 2003 are consolidated into “Data and Chance” in 2007. The 2011 TIMSS mathematics framework was the same as that used in 2007.3 Despite of some Table 1
Mathematics frameworks for TIMSS 2003, 2007, and 2011 assessments for 8th grade4
2003 2007 and 2011
Domains Percentage (%) Domains Percentage (%)
Content
Number 30 Number 30
Algebra 25 Algebra 30
Geometry 15 Geometry 20
Measurement 15 Data and Chance 20
Data 15
Cognitive
Knowing Facts and Procedures
15 Knowing 35
Using Concepts 20 Applying 40
Solving Routine Problems 40 Reasoning 25
Reading 25 - -
3 However, there were some minor updates to particular topics in TIMSS 2011 mathematics framework (Mullis et al., 2009, p. 19). 4 The table was adapted from TIMSS 2003, 2007, and 2011 Mathematics assessments frameworks (Mullis et al., 2005, p. 14; Mullis et al., 2009, p. 20; Mullis et al., 2003, p. 9).

Linking TIMSS and NAEP Assessments 9
differences in frameworks between TIMSS mathematics assessments, we assume that the comparison results over time are not seriously affected by these differences since TIMSS technical reports already have reported the change of mathematics achievement since 1995 (e.g., Mullis et al., 2008). It is also worthwhile to note that Hencke, Rutkowski, Neuschmidt, and Gonzalez (2009) found that if TIMSS results were computed for countries based only on the items the country judged to be covered in their curriculum, the results for the countries would essentially be the same.
Although the TIMSS mathematics exam experienced more content change over the time period of this study than did the NAEP mathematics assessment, given the prior studies that supported the content comparability of the 2003 and 2011 NAEP and TIMSS math assessments (Neidorf et al., 2006; Provasnik et al. 2013), and the fact that any content changes would be the same for all countries who participated across the time period analyzed here, we believe the content similarity and consistency is sufficiently adequate to support linking the score scales from these exams for the purposes of mapping the NAEP achievement levels onto the TIMSS scale.
Method
Data
To map the NAEP achievement levels onto the TIMSS reporting scale, we used the 2003, 2007, and 2011 TIMSS mathematics results for grade 8 students. These data are publically available from the official TIMSS website5. The reason for selecting these three years was that this study focused on the growth of the U.S. student achievement after the No Child Left Behind Act of 2001. Also, 2003, 2007, and 2011 are the years both NAEP and TIMSS were administered to grade 8 students in the United States. The comparison of achievement across countries in the same year avoids misleading results due to growth that may occur when comparisons are made from tests administered in different years (Hambleton et al., 2009).
The number of countries analyzed in this linking study varied somewhat from year to year. The 2003 TIMSS involved 47 countries, the 2007 TIMSS data involved 59 countries, and the 2011 TIMSS data involved 60 countries. As we subsequently describe, our comparisons focused on only those countries who participated in all three assessment years.
Data Analysis
We used equipercentile linking to map the 2003, 2007, and 2011 Grade 8 NAEP mathematics achievement levels onto the score scale of the 2003, 2007, and 2011 Grade 8 TIMSS mathematics assessment, respectively, by extending the process used in Hambleton et al. (2009). By placing the NAEP achievement levels onto the TIMSS scale, the mapped NAEP achievement levels provide new benchmarks for international comparisons of student’s performance. Our equipercentile linking assumed that U.S. students who took the NAEP mathematics assessments in a given year were randomly equivalent (i.e., equivalent up to sampling error) to the U.S. students who took the TIMSS mathematics assessment in that same year. Given that both studies involved carefully selected samples to represent the U.S. population, we believe this assumption is justified6.
The overall procedure to map the NAEP mathematics achievement levels onto the score scale of TIMSS mathematics was as follows:
5 TIMSS data are available from the website of TIMSS and PIRLS: http://timss.bc.edu 6 Sampling methods for NAEP and TIMSS are described in: https://nces.ed.gov/nationsreportcard/about/nathow.asp, and https://nces.ed.gov/timss/faq.asp?FAQType=3

Education Policy Analysis Archives Vol. 25 No. 11 10
1) Find the percentiles corresponding to each of the NAEP mathematics achievement levels (Basic, Proficient, and Advanced).
2) Find the TIMSS scores corresponding to these percentiles in the U.S. TIMSS score distribution.
3) Use these TIMSS scores as the cut-scores to determine the NAEP basic, proficient, and advanced levels on the TIMSS score scale.
4) Classify the students in other countries using three NAEP cut-scores into the three NAEP achievement.
Because five plausible values are estimated for each student achievement on TIMSS, the average of the five plausible values were used to find the scores corresponding to the percentile of the NAEP achievement levels in Step 2 above. The percentiles for the 2003, 2007, and 2011 NAEP mathematics achievement levels and the three cut-scores corresponding to the percentiles are presented in Table 1.
Table 2 TIMSS Math Scale Scores Corresponding to the Grade 8 NAEP Math Achievement Levels
Year Basic Proficient Advanced
2003 466.7 (31.9) 549.5 (71.2) 630.1 (94.6)
2007 462.5 (28.7) 544.3 (67.8) 617.3 (93.0)
2011 462.4 (26.6) 540.3 (65.3) 612.2 (91.7)
Note: The scale scores in each achievement level column indicate the TIMSS scale score associated with the NAEP achievement level. The number in parenthesis indicates the percentile corresponding to the NAEP mathematics achievement level.
Results
Validation Check on Equipercentile Linking
Before interpreting the results of the linking, we first evaluated the accuracy of the equipercentile linking following the process used by Hambleton et al. (2009). We compared our estimates of the percentages of students at or above each achievement level on NAEP based on the TIMSS linking, with the actual percentages of students classified at or above NAEP achievement levels for three states that participated in both NAEP and TIMSS—Indiana, Massachusetts, and Minnesota. In 2003, Indiana participated in both TIMSS and NAEP. In 2007, Massachusetts and Minnesota participated in both assessments.
For Indiana in 2003, the percentages of students who were classified at or above each achievement level are quite similar between NAEP and TIMSS (the largest difference was 2.7% for “At or Above Basic”). For Massachusetts, the largest percentage difference was 3.9% (for “At or Above Proficient”). For Minnesota, the largest difference was 3.4% for “% Advanced.” These results support the validity of our equipercentile linking method, and suggest a margin of error of the results of up to 3-4%.

Linking TIMSS and NAEP Assessments 11
Table 3 NAEP-TIMSS Comparison for Three States
Year State Assessment Advanced
(%)
At or Above Proficient (%) At or Above Basic (%)
2003 Indiana NAEP Math 5.2 30.7 73.5
TIMSS Math 5.2 29.6 76.2
2007
Massachusetts NAEP Math 14.9 50.7 85.0
TIMSS Math 17.5 54.6 85.3
Minnesota NAEP Math 11.5 43.1 81.0
TIMSS Math 8.1 41.9 83.5
Note: The percentages at or above each NAEP achievement levels are from actual Grade 8 Math state results reported by NAEP. TIMSS results are estimated based on the NAEP achievement levels mapped on the TIMSS score scale.
Achievement Level Results for U.S. and International Students Over Time
The achievement level results of linking NAEP mathematics achievement levels to TIMSS mathematics reporting scale are summarized in Tables 3, 4, and 5, for the “Advanced,” “At or Above Proficient,” and “At or Above Basic” achievement levels, respectively. We selected a subset of 31 countries from all participating countries, because there were only 31 countries that participated in all three assessment years. We also report the rank of each country each year, within the 31-country subset, where the ranks are based on the percentage of students in the relevant achievement level for that Table. Although the ranks are of less interest in this study, it is interesting to see how norm-referenced information (i.e., the rank-order of this subset of countries) changes or does not change based on the criterion-referenced achievement level results.
Table 4 shows achievement level percentages and their associated ranks for the NAEP Advanced achievement level on the TIMSS reporting scale from 2003 to 2011. In 2003, the United States ranked 8th with about 5.4% students who were classified as Advanced. In 2007, the rank of the U.S. dropped to 10th, and declined to 12th in 2011. However, the percentage of the U.S. students in the NAEP advanced level increased from 5.4% in 2003 to 7% in 2007, to 8.3% in 2011. The seeming contradiction between the increase in the percentage of “Advanced” U.S. students and the rank of the U.S. Advanced percentage is due to the fact that the achievement level gains for the US were smaller than that for the average of the 31 countries (11.6%, see last row of Table 4). England, the Russian Federation, Israel, and Australia, for example, all increased more than the U.S over this time period. In fact, the Russian Federation and Israel had increases in the percentages of “Advanced” students that were at three to four times that of the U.S. Similarly, the percentage increase of Advanced students in the top five TIMSS countries in 2003 grew by more than 10%. For example, overall growth of the percentage in Japan was about 12.3%, and the percentage of Chinese Taipei went up about 18.7%.

Education Policy Analysis Archives Vol. 25 No. 11 12
Table 4 2003, 2007, 2011 Grade 8 NAEP Math vs. TIMSS Math for the Advanced Level (reported for 31 countries that participated in 2003, 2007, and 2011 TIMSS Math)
Country 2003 2007 2011
Rank Advanced (%) Rank Advanced (%) Rank Advanced (%)
Singapore 1 40.1 3 41.2 3 52.3
Chinese Taipei 2 37.7 1 50.1 1 56.4
Korea, Rep. of 3 33.5 2 44.8 2 54.3
Hong Kong, SAR 4 28.5 4 36.8 4 42.7
Japan 5 21.0 5 30.2 5 33.3
Hungary 6 10.3 6 12.7 9 11.0
England 7 6.3 8 9.8 8 12.1
United States 8 5.4 10 7.0 12 8.3
Russian Federation 9 5.3 7 11.5 6 19.4
Lithuania 10 4.7 9 8.5 13 7.8
Malaysia 11 4.6 16 3.3 19 2.2
Israel 12 4.5 15 4.3 7 14.9
Australia 13 3.9 12 5.5 11 8.6
Romania 14 3.1 14 4.9 10 8.7
Sweden 15 2.2 18 2.7 20 1.6
Slovenia 16 1.9 13 5.1 14 5.1
Italy 17 1.7 17 2.9 16 4.6
Armenia 18 1.6 11 5.9 15 4.8
Indonesia 19 0.5 22 0.7 27 0.3
Iran, Islamic Rep. of 20 0.5 19 1.4 17 2.7
Jordan 21 0.4 20 1.3 25 0.5
Palestinian Nat’l Auth. 22 0.3 25 0.3 22 1.3
Norway 23 0.2 24 0.3 23 0.9
Lebanon 24 0.2 21 0.9 21 1.5
Bahrain 25 0.0 23 0.3 18 2.2
Syrian Arab Republic 26 0.0 27 0.1 29 0.3
Tunisia 27 0.0 26 0.1 26 0.4
Botswana 28 0.0 30 0.0 30 0.1
Ghana 29 0.0 29 0.0 31 0.0
Morocco 30 0.0 28 0.1 28 0.3
Saudi Arabia 31 0.0 31 0.0 24 0.7
Mean (SD) 7.0 (11.8) 9.4 (14.6) 11.6 (17.2)
Table 5 presents the results of the NAEP-TIMSS Mathematics comparison with respect to
the NAEP “At or Above Proficient” level. While the percentage of U.S. students who were At or Above Proficient rose about 6% over this period (28.8% to 34.7%), the rank associated with the percentage remained about the same (11th, 10th, 11th). This percentage growth (5.9%) was greater than the percentage increase for average of 31 countries (4.4%). Again, the Russian Federation and Israel showed a larger percentage increase in this achievement level category (about 10%).

Linking TIMSS and NAEP Assessments 13
Table 5
2003, 2007, 2011 Grade 8 NAEP Math vs. TIMSS Math for At or Above Proficient Level (reported for 31
countries that participated in 2003, 2007, and 2011 TIMSS Math)
Country 2003 2007 2011
Rank At or Above
Proficient (%) Rank
At or Above Proficient (%)
Rank At or Above
Proficient (%)
Singapore 1 77.1 3 70.8 2 80.0
Hong Kong, SAR 2 75.1 4 69.0 4 75.7
Korea, Rep. of 3 70.5 1 73.2 1 80.2
Chinese Taipei 4 67.6 2 72.9 3 76.6
Japan 5 62.0 5 64.8 5 65.4
Hungary 6 42.5 6 40.7 8 39.2
Russian Federation 7 30.4 7 39.6 6 53.4
Malaysia 8 30.2 17 19.8 19 14.8
England 9 29.5 8 37.3 9 36.5
Lithuania 10 29.2 9 34.1 10 35.1
United States 11 28.8 10 32.2 11 34.7
Israel 12 25.9 16 20.3 7 41.8
Australia 13 25.1 13 25.6 13 29.5
Sweden 14 23.8 15 22.9 17 19.4
Romania 15 22.7 14 23.8 15 25.0
Armenia 16 21.6 11 28.0 16 22.0
Slovenia 17 20.5 12 27.8 12 31.4
Italy 18 18.7 18 18.6 14 28.2
Norway 19 9.7 20 11.7 18 15.4
Jordan 20 6.9 21 10.4 24 6.9
Indonesia 21 6.8 23 4.9 27 4.0
Lebanon 22 4.3 19 12.4 20 12.9
Iran, Islamic Rep. of 23 3.7 22 7.5 22 9.8
Palestinian Nat’l Auth. 24 3.5 25 3.3 23 9.0
Bahrain 25 2.3 24 3.8 21 10.2
Tunisia 26 1.1 26 2.9 25 5.8
Syrian Arab Republic 27 0.8 27 2.8 28 3.6
Morocco 28 0.5 29 0.9 29 3.6
Botswana 29 0.4 28 1.1 30 2.5
Saudi Arabia 30 0.1 31 0.1 26 5.3
Ghana 31 0.0 30 0.4 31 0.8
Mean (SD) 23.9 (24.0) 25.3 (23.5) 28.3 (25.1)
Table 6 presents the comparison for the percentage of students “At or Above Proficient” on
NAEP. Here, the rank of the U.S. students gradually increased from 12th to 8th and the percentages of students At or Above Basic also increased (from 68.1% in 2003 to 71.3% in 2007 to 73.4% in 201). This percentage increase of 5.3% was larger than the percentage increase for average of the 31 countries (3.8%). An interesting result with respect to this category is that among the first twelve countries in 2003 (from Hong Kong to U.S.), the U.S. percentage of At or Above Basic showed the

Education Policy Analysis Archives Vol. 25 No. 11 14
greatest increase in rank over the eight-year time period (from 12th to 8th). Other than the U.S., only Korea increased two ranks (3rd to 1st) over this period among the twelve countries. The top five countries in 2003 showed very small percentage changes in this category over time, but this result was likely to be due to the fact that from 87.0% (Chinese Taipei) to 94.6% (Hong Kong) of their students were already at or above the basic level in 2003.
Table 6 2003, 2007, 2011 Grade 8 NAEP Math vs. TIMSS Math for At or Above Basic Level (reported for 31
countries that participated in 2003, 2007, and 2011 TIMSS Math)
Country 2003 2007 2011
Rank At or Above
Basic (%) Rank
At or Above Basic (%)
Rank At or Above
Basic (%)
Hong Kong, SAR 1 94.6 5 88.0 3 91.5
Singapore 2 93.8 3 89.7 2 94.0
Korea, Rep. of 3 91.9 1 92.4 1 94.7
Japan 4 90.4 2 90.0 5 89.8
Chinese Taipei 5 87.0 4 88.6 4 90.2
Hungary 6 79.7 6 76.0 7 73.8
Russian Federation 7 71.3 7 75.9 6 83.8
Malaysia 8 69.7 18 54.8 20 40.7
Lithuania 9 69.7 9 73.6 9 72.8
England 10 68.6 8 74.8 11 71.9
Sweden 11 68.5 13 68.4 15 63.2
United States 12 68.1 11 71.3 8 73.4
Australia 13 65.6 14 67.4 14 64.6
Israel 14 64.0 19 53.1 12 70.8
Slovenia 15 63.7 10 72.9 10 72.3
Italy 16 59.0 15 60.3 13 69.9
Armenia 17 57.5 12 70.3 17 56.1
Romania 18 57.2 16 55.9 18 51.6
Norway 19 47.2 17 55.5 16 59.7
Lebanon 20 32.8 20 48.3 19 47.2
Jordan 21 31.0 21 36.1 22 30.5
Indonesia 22 29.0 24 24.3 27 22.1
Iran, Islamic Rep. of 23 22.7 22 27.9 23 30.3
Palestinian Nat’l Auth. 24 20.5 27 17.8 24 30.3
Bahrain 25 19.3 25 23.3 21 31.6
Tunisia 26 16.1 23 25.6 25 27.5
Morocco 27 10.0 28 13.8 30 15.9
Syrian Arab Republic 28 7.9 26 19.9 28 19.1
Botswana 29 6.4 29 9.6 29 18.0
Saudi Arabia 30 3.1 31 3.8 26 22.2
Ghana 31 1.9 30 5.1 31 5.9
Mean (SD) 50.6 (30.1) 52.7 (28.4) 54.4 (27.1)

Linking TIMSS and NAEP Assessments 15
To evaluate these results further, we compared the percentages of U.S. students who were At or Above the mapped NAEP achievement levels with the percentages of U.S. students who were At or Above the TIMSS international benchmarks. TIMSS has four international benchmarks and the cut-scores for deciding each benchmark are consistent across year of administration and grade level (625 for advanced international, 550 for high international, 475 for intermediate international, and 400 for low international). These four cut-scores are close to the cut-scores of the mapped NAEP mathematics achievement levels in Table 1, if we compare the TIMSS advanced with the NAEP advanced, the TIMSS high with the NAEP proficient, and the TIMSS intermediate with the NAEP basic, respectively. These results are summarized in Table 7.
Table 7 Percentage At or Above the grade 8 NAEP mathematics achievement levels and At or Above the TIMSS
Mathematics benchmarks of the United States7
Year NAEP achievement levels
TIMSS benchmarks
Advanced (%)
At or above Proficient (%)
At or above Basic (%)
Advanced (%)
At or above High (%)
At or above Intermediate (%)
2003 5.4 (0.1) 28.8 (0.3) 68.1 (0.3)
7.0 (0.7) 29.0 (1.6) 64.0 (1.6)
2007 7.0 (0.2) 32.2 (0.3) 71.3 (0.3)
6.0 (0.6) 31.0 (1.5) 67.0 (1.4)
2011 8.3 (0.2) 34.7 (0.2) 73.4 (0.2)
7.0 (0.8) 30.0 (1.4) 68.0 (1.3)
difference
(2011-2003) 2.9 5.9
5
.3 0.0 1.0 4.0
Note: The number in the parenthesis denotes the standard error (SE). As seen in Table 7, the standard errors (SE) of the percentages are so small for both
assessments so that they can be comparable. For all the three comparisons, the percentages of U.S. students at or above each level were very similar. For example, in comparing the TIMSS advanced and NAEP advanced, the U.S. percentages are 7%, 6%, and 7%, respectively on the TIMSS scale, while their percentages on the NAEP advanced level were from 5.4%, 7.0%, and 8.3%. However, while the percentages At or Above the NAEP advanced and proficient levels increased gradually, the percentages at or above the Advanced and High TIMSS benchmarks barely changed. In comparing the TIMSS intermediate and the NAEP basic, the percentages of the U.S. students in both assessments showed the increasing trends. Specifically, the percentage of the U.S. At or Above the NAEP and the TIMSS intermediate benchmark rose 5.3% from 2003 (68.1%) to 2011 (73.4%) and 4% from 2003 (64%) to 2011 (68%), respectively. These results suggest the NAEP increases for the Basic achievement level are mirrored on TIMSS, but the increases for Proficient and Advanced are not. This is an important finding because it is consistent with the NCLB law that focused on getting students to “Proficiency” in grade level, rather than a higher achievement level such as “Advanced.”
Phillips (2007) suggested another way to check a nation’s overall performance on mathematics. He examined how well the average student in the nation was performing by classifying the average TIMSS mathematics score of the students in that nation into the projected NAEP achievement levels. As an additional analysis, we similarly compared the overall performance of the U.S students on mathematics with that of the students in other countries for the years of 2003, 2007, and 2011 by classifying the average TIMSS mathematics score of 31 countries to the NAEP
7 The percentages and standard errors of U.S. students at or above the 2003, 2007, and 2011 TIMSS benchmarks were taken from the 2007 and 2011 TIMSS Mathematics reports (Mullis, Martin, Foy, & Arora, 2012, p. 114; Mullis et al., 2008, p. 78-79).

Education Policy Analysis Archives Vol. 25 No. 11 16
achievement levels (mapped to the TIMSS score scale). Table 8 presents the average TIMSS mathematics scores and the corresponding achievement levels for 18 countries which were not classified as Below Basic in 2003 among 31 countries.
To determine the overall performance of each country, we adopted the criterion which Phillips (2007) suggested. “If a nation’s typical student (i.e., the nation’s mean) is at or above the proficient level, then we might consider the nation to represent world class educational achievement” (Phillips, 2007, p. 10). Based on this criterion, only five countries could be labeled as “world class” in educational achievement in 2003, 2007, and 2011. The United States did not meet this criterion in any of the years because the averages of the U.S. students’ scores were classified into Basic level in 2003, 2007, and 2011. Accordingly, these results can be interpreted that the United States did not satisfy its own aspiration of being world class in student performance, at least in mathematics, which is similar to the results of Phillips (2007).
Table 8 Achievement levels associated with the national average in grade 8 TIMSS Mathematics8
Country
2003 2007 2011
Average TIMSS Score
Achievement Level
Average TIMSS Score
Achievement Level
Average TIMSS Score
Achievement Level
Singapore 605 (3.6) Proficient 593 (3.8) Proficient 611 (3.8) Proficient
Korea, Rep. of 589 (2.2) Proficient 597 (2.7) Proficient 613 (2.9) Advanced
Hong Kong, SAR 586 (3.3) Proficient 572 (5.8) Proficient 586 (3.8) Proficient
Chinese Taipei 585 (4.6) Proficient 598 (4.5) Proficient 609 (3.2) Proficient
Japan 570 (2.1) Proficient 570 (2.4) Proficient 570 (3.7) Proficient
Hungary 529 (3.2) Basic 517 (3.5) Basic 505 (3.5) Basic
Malaysia 508 (4.1) Basic 474 (5.0) Basic 440 (5.4) Below Basic
Russian Federation 508 (3.7) Basic 512 (4.1) Basic 539 (3.6) Basic
Australia 505 (4.6) Basic 496 (3.9) Basic 505 (5.1) Basic
United States 504 (3.3) Basic 508 (2.8) Basic 509 (2.6) Basic
Lithuania 502 (2.5) Basic 506 (2.3) Basic 502 (2.5) Basic
Sweden 499 (2.6) Basic 491 (2.3) Basic 484 (1.9) Basic
England 498 (4.7) Basic 513 (4.8) Basic 507 (2.5) Basic
Israel 496 (3.4) Basic 463 (3.9) Basic 516 (4.1) Basic
Slovenia 493 (2.2) Basic 501 (2.2) Basic 505 (2.2) Basic
Italy 484 (3.2) Basic 480 (3.0) Basic 498 (2.4) Basic
Armenia 478 (3.0) Basic 499 (3.5) Basic 467 (2.7) Basic
Romania 475 (4.8) Basic 461 (4.1) Below Basic 458 (4.0) Below Basic
Note: The number in the parenthesis denotes the standard error (SE).
8 The national average TIMSS scores and standard errors were obtained from the 2007 and 2011 TIMSS Mathematics reports (Mullis et al., 2012, p. 56-59; Mullis et al., 2008, p. 46-48).

Linking TIMSS and NAEP Assessments 17
Discussion
In this study, we examined how the performance of U.S. students on mathematics improved over time within an international context. We compared the performance of U.S students’ achievement on mathematics with that of students in other countries by placing the 2003, 2007, and 2011 NAEP mathematics achievement levels on the score scale of the 2003, 2007, and 2011 TIMSS mathematics exams, respectively. The results suggest that the increase in mathematics achievement of the U.S. students over this period is greater than the average increase for the 31 countries that participated in all three years only with respect to the two lower achievement levels—Basic and Proficient. The percentage increases of the U.S. students at or above the NAEP Proficient and Basic achievement levels were 5.9% and 5.3%, respectively, compared to 4.4% and 3.8%, on average, for the other countries. Regarding the NAEP Advanced level however, the percentage increase of the U.S. was smaller relative to that of the average percentage for other countries over the same period (2.9% for the U.S. versus the 4.6% average).
The results also indicate the NAEP and TIMSS achievement levels were similar with respect to what they demand of students (see Table 7). In the U.S., some researchers claimed that the NAEP “Basic” achievement level is analogous to the “Proficient” achievement levels set on state achievement tests under the No Child Left Behind Act (e.g., Stoneberg, 2007). If that were true, the improved percentages of U.S. students At or Above Basic over time may be due to the focus of that law on getting lower-achieving students to proficiency benchmarks.
In our comparisons of the NAEP Basic and TIMSS Intermediate achievement levels, the percentages of U.S. students At or Above both achievement levels showed similar increasing trends from 2003 to 2011. Regarding At or Above the NAEP Basic achievement level, the percentages of U.S students increased from 68.1% to 73.4%, and the percentage at or above the TIMSS intermediate level increased from 64.0% to 68.0%. When it comes to the overall performance of the U.S. students on mathematics, their average scores of the TIMSS mathematics in 2003, 2007, and 2011 were classified to the NAEP basic level.
In summary, our results suggest that the performance of U.S. students on mathematics improved with respect to at or above the “Proficient” and “Basic” achievement levels defined by NAEP compared to other countries that participated in TIMSS. However, it is hard to say the overall performance of U.S. students on mathematics reached the “world class” level, which is the goal policymakers and others want U.S. students to reach. In contrast to the U.S., other countries such as England, the Russian Federation, Israel, and Australia that showed the similar percentages of Advanced students as the U.S. in 2003 (see Table 4), experienced much greater increases than the U.S. In addition, the top five Asian countries participating in TIMSS mathematics accomplished much larger increases in the percentages of the students At or Above Advanced. If the U.S. educators and the policymakers want the United States to be a world class nation in educational achievement, clearly more work needs to be done.
Limitations and Suggestions for Further Research
Although the NAEP and TIMSS mathematics assessments share similar content and item types, they are not identical in content. Studies that evaluated the content overlap of NAEP and TIMSS math found good overlap at a general content level, but less overlap at a finer grain size (e.g., Provasnik et al, 2013). Thus, some of the differences noted across U.S. students’ performance on these exams may be due to slight differences in the math construct measured. Other differences across these assessments include testing conditions and the number of items administered (NCES, 2013).

Education Policy Analysis Archives Vol. 25 No. 11 18
Another limitation of this study is the assumption inherent in using equipercentile linking to link two different assessments taken by different groups of students. The method assumed U.S. students who took the NAEP mathematics assessments and the U.S students who took the TIMSS mathematics assessments were randomly equivalent. We believe the sampling plans for both assessments were similar, but our results are limited by any degree to which these samples deviate from national representativeness.
An additional limitation of the present study is that we only linked the NAEP and the TIMSS for the years of 2003, 2007, and 2011 to match the both test administrations in the same years. Future research should analyze more recent TIMSS and NAEP data as they become available.
Of course, the process of setting achievement level standards also has its limitations in that there is no perfect place to set the cut-scores for any achievement level (Kane, 1994). Interestingly, the results of this study provide evidence that can be used to evaluate the validity of the standards set on both NAEP and TIMMS, at least with respect to grade 8 math exams. Given the similarity of the NAEP and TIMSS achievement level results, these standards seem to be consistent.
One final limitation relates to students’ motivation to do well on assessments such as NAEP and TIMSS that have no consequences for them. Motivational differences may exist across U.S. students and students in other countries. If so, these differences will underestimate the achievement of students who are not trying their best.
It will be difficult to address these limitations in future research. NAEP and TIMSS serve different purposes and their content is uniquely determined by each organization. Thus, improvements in content overlap are beyond what interested researchers can control. Future research should consider testing a common group of students with both assessments to see how the results might change. However, given current momentum to reduce testing in the U.S., finding and testing such students may prove difficult.
Future research could investigate differential motivation by surveying students about their motivation to do well on the NAEP and TIMSS tests. If these tests are administered via computer in the future, the amount of time students spend responding to the items could also be used to evaluate their motivation to do well and engagement in the testing process (Wise & DeMars, 2005).
Concluding Remarks
By continuing to monitor U.S. students’ performance on NAEP within an international context, we can better understand their progress over time in terms of both criterion-referenced and norm-referenced perspectives. By linking NAEP results with TIMSS, and potentially other international assessments like PISA, how U.S. students compare with achievement levels set on these international assessments, and with students in other countries, can be evaluated. In addition to providing more context for interpretation of students’ performance on NAEP, international assessment data also has the potential to enhance interpretation of statewide assessments. Therefore, in the future we may also see studies linking TIMSS and other international assessments to state achievement tests.

Linking TIMSS and NAEP Assessments 19
References
Beaton, A. E., Rogers, A. M., Gonzalez, E., Hanly, M. B., Kolstad, A., Rust, K. F., . . . Jia, Y. (2011). The NAEP Primer (NCES 2011-463). U.S. Department of Education, National Center for Education Statistics. Washington, DC.
Hambleton, R. K., Sireci, S. G., & Smith, Z. R. (2009). How Do Other Countries Measure Up to the Mathematics Achievement Levels on the National Assessment of Educational Progress? Applied Measurement in Education, 22(4), 376-393. https://doi.org/10.1080/08957340903221675
Hencke, J., Rutkowski, L., Neuschmidt, O., & Gonzalez, E. (2009). Curriculum coverage and scale correlation on TIMSS 2003. In M. von Davier & D. Hastedt (Eds.), IERI monograph series: Issues and methodologies in large scale assessments (pp. 85–112). New York: Springer.
Jia, Y., Phillips, G., Wise, L. L., Rahman, T., Xu, X., Wiley, C., & Diaz, T. E. (2014). 2011 NAEP-TIMSS Linking Study: Technical Report on the Linking Methodologies and Their Evaluations (NCES 2014-461). National Center for Education Statistics, Institute of Education Sciences, U.S. Department of Education, Washington, DC.
Johnson, E., Cohen, J., Chen, W. H., Jiang, T., & Zhang, Y. (2005). 2000 NAEP-1999 TIMSS Linking Report (NCES 2005-01) U.S. Department of Education. Washington, DC: National Center for Education Statistics.
Kane, M. (1994). Validating the performance standards associated with passing scores. Review of educational Research, 64, 425-461. https://doi.org/10.3102/00346543064003425
Kolen, M. J. (2007). Data collection designs and linking procedures. In N. J. Dorans, M. Pommerich, & P. W. Holland (Eds.), Linking and aligning scores and scales (pp. 31-55). New York, NY: Springer. https://doi.org/10.1007/978-0-387-49771-6_3
Kolen, M. J., & Brennan, R. L. (2004). Test equating, scaling, and linking. New York: Springer. https://doi.org/10.1007/978-1-4757-4310-4
Mullis, I. V. S., Martin, M. O., Foy, P., & Arora, A. (2012). TIMSS 2011 international results in mathematics. International Association for the Evaluation of Educational Achievement. Chestnut Hill, MA: TIMSS & PIRLS International Study Center, Boston College.
Mullis, I. V. S., Martin, M. O., Foy, P., Olson, J. F., Preuschoff, C., Erberber, E., . . . Galia, J. (2008). TIMSS 2007 international Mathematics Report: Findings from IEA’s Trends in International Mathematics and Science Study at the Fourth and Eighth Grades. International Association for the Evaluation of Educational Achievement. Chestnut Hill, MA: TIMSS & PIRLS International Study Center, Boston College.
Mullis, I. V. S., Martin, M. O., Ruddock, G. J., O’Sullivan, C. Y., Arora, A., & Erberber, E. (2005). TIMSS 2007 Assessment Frameworks. International Association for the Evaluation of Educational Achievement. Chestnut Hill, MA: TIMSS & PIRLS International Study Center, Boston College.
Mullis, I. V. S., Martin, M. O., Ruddock, G. J., O’Sullivan, C. Y., & Preuschoff, C. (2009). TIMSS 2011 Assessment Frameworks. International Association for the Evaluation of Educational Achievement. Chestnut Hill, MA: TIMSS & PIRLS International Study Center, Boston College.
Mullis, I. V. S., Martin, M. O., Smith, T. A., Garden, R. A., Gregory, K. D., Gonzalez, E. J., . . .O’Connor, K. M. (2003). TIMSS Assessment Frameworks and Specifications 2003 (2nd ed.). International Association for the Evaluation of Educational Achievement. Chestnut Hill, MA: TIMSS & PIRLS International Study Center, Boston College.

Education Policy Analysis Archives Vol. 25 No. 11 20
National Assessment Governing Board. (2016a). What is NAEP? Retrieved [July 04, 2016] from https://www.nagb.org/naep/what-naep.html
National Assessment Governing Board. (2016b). Achievement levels. Retrieved July 4, 2016, from https://www.nagb.org
National Center for Education Statistics. (2013). U.S States in a Global Context: Results from the 2011 NAEP-TIMSS linking study (NCES 2013-460). Institute of Education Sciences, U.S. Department of Education, Washington, DC.
National Center for Education Statistics. (2016). History of Framework Changes. Institute of Education Sciences, U.S. Department of Education, Washington, DC. from website: http://nces.ed.gov/nationsreportcard/mathematics/frameworkcomparison.aspx [Last updated 01 June 2016]
Neidorf, T. S., Binkley, M., Gattis, K., & Nohara, D. (2006). Comparing Mathematics Content in the National Assessment of Educational Progress (NAEP), Trends in International Mathematics and Science Study (TIMSS), and Program for International Student Assessment (PISA) 2003 Assessments. Technical Report (NCES 2006-029). U.S. Department of Education. Washington, DC: National Center for Education Statistics. Retrieved Dec 5, 2015, from http://nces.ed.gov/pubsearch
Nohara, D., & Goldstein, A. A. (2001). A comparison of the National Assessment of Educational Progress (NAEP), the Third International Mathematics and Science Study Repeat (TIMSS-R), and the Programme for International Student Assessment (PISA) (NCES 2001-07). U.S. Department of Education. Washington, DC: National Center for Education Statistics.
Phillips, G. W. (2007). Expressing International Educational Achievement in Terms of US Performance Standards: Linking NAEP Achievement Levels to TIMSS. American Institutes for Research.
Pommerich, M. (2016). The fairness of comparing test scores across different tests or modes of administration. In N. Dorans & L. Cook (Eds). Fairness in educational assessment and measurement. New York: Routledge.
Provasnik, S, Lin, C. Y., Darling, D., & Dodson, J. (2013). A comparison of the 2011 Trends in International Mathematics and Science Study (TIMSS) assessment items and the 2011 National Assessment of Educational Progress (NAEP) frameworks. U.S. Department of Education. Washington, DC: National Center for Education Statistics. Retrieved [Apr 18, 2016] from http://nces.ed.gov/nationsreportcard/subject/about/pdf/naep_timss_ comparison_items.pdf
Stoneberg, B. D. (2007). Using NAEP to Confirm State Test Results in the No Child Left Behind Act. Practical Assessment Research & Evaluation, 12(5). Available online: http://pareonline.net/getvn.asp?v=12&n=5
Waltman, K. K. (1997). Using performance standards to link statewide achievement results to NAEP. Journal of Educational Measurement, 34(2), 101-121. https://doi.org/10.1111/j.1745-3984.1997.tb00509.x
Wise, S. L., & DeMars, C. E. (2005) Low Examinee Effort in Low-Stakes Assessment: Problems and Potential Solutions. Educational Assessment, 10(1), 1–17. https://doi.org/10.1207/s15326977ea1001_1

Linking TIMSS and NAEP Assessments 21
About the Authors
Hwanggyu Lim University of Massachusettts Amherst [email protected] Hwanggyu Lim received a M.A. in Educational Measurement and Evaluation from Yonsei University in South Korea. He worked at the Korean Institute for Curriculum and Evaluation (KICE) as a researcher for three years. While working at KICE, he participated in several projects related to automated scoring and score reporting. Currently he is a doctoral student in Research and Evaluation Methods Program at UMass Amherst. His previous experiences in Item Response Theory (IRT), standard setting, equating, and structural equation modeling align with his research interests. Stephen G. Sireci University of Massachusettts Amherst [email protected] Dr. Sireci is Professor and Director of the Center for Educational Assessment in the College of Education at the University of Massachusetts Amherst. He earned his Ph.D. in psychometrics from Fordham University and his master and bachelor degrees in psychology from Loyola College in Maryland. Before UMASS, he was Senior Psychometrician at the GED Testing Service, Psychometrician for the Uniform CPA Exam and Research Supervisor of Testing for the Newark NJ Board of Education. He is known for his research in evaluating test fairness, particularly issues related to content validity, test bias, cross-lingual assessment, standard setting, and sensitivity review. He is the primary architect of the Massachusetts Adult Proficiency Tests, which is the primary assessment of reading and math skills used in adult education programs in Massachusetts. Formerly, he was President of the Northeastern Educational Research Association (NERA), Co-Editor of the International Journal of Testing, a Senior Scientist for the Gallup Organization and a member of the Board of Directors for the National Council on Measurement in Education.

Education Policy Analysis Archives Vol. 25 No. 11 22
education policy analysis archives Volume 25 Number 11 February 13, 2017 ISSN 1068-2341
Readers are free to copy, display, and distribute this article, as long as the work is attributed to the author(s) and Education Policy Analysis Archives, it is distributed for non-commercial purposes only, and no alteration or transformation is made in the work. More details of this Creative Commons license are available at http://creativecommons.org/licenses/by-nc-sa/3.0/. All other uses must be approved by the author(s) or EPAA. EPAA is published by the Mary Lou Fulton Institute and Graduate School of Education at Arizona State University Articles are indexed in CIRC (Clasificación Integrada de Revistas Científicas, Spain), DIALNET (Spain), Directory of Open Access Journals, EBSCO Education Research Complete, ERIC, Education Full Text (H.W. Wilson), QUALIS A2 (Brazil), SCImago Journal Rank; SCOPUS, SOCOLAR (China).
Please send errata notes to Audrey Amrein-Beardsley at [email protected]
Join EPAA’s Facebook community at https://www.facebook.com/EPAAAAPE and Twitter feed @epaa_aape.

Linking TIMSS and NAEP Assessments 23
education policy analysis archives
editorial board
Lead Editor: Audrey Amrein-Beardsley (Arizona State University) Editor Consultor: Gustavo E. Fischman (Arizona State University)
Associate Editors: David Carlson, Margarita Jimenez-Silva, Eugene Judson, Mirka Koro-Ljungberg, Scott Marley, Jeanne M. Powers, Iveta Silova, Maria Teresa Tatto (Arizona State University)
Cristina Alfaro San Diego State University
Ronald Glass University of California, Santa Cruz
R. Anthony Rolle University of Houston
Gary Anderson New York University
Jacob P. K. Gross University of Louisville
A. G. Rud Washington State University
Michael W. Apple University of Wisconsin, Madison
Eric M. Haas WestEd Patricia Sánchez University of University of Texas, San Antonio
Jeff Bale OISE, University of Toronto, Canada
Julian Vasquez Heilig California State University, Sacramento
Janelle Scott University of California, Berkeley
Aaron Bevanot SUNY Albany Kimberly Kappler Hewitt University of North Carolina Greensboro
Jack Schneider College of the Holy Cross
David C. Berliner Arizona State University
Aimee Howley Ohio University Noah Sobe Loyola University
Henry Braun Boston College Steve Klees University of Maryland Nelly P. Stromquist University of Maryland
Casey Cobb University of Connecticut
Jaekyung Lee SUNY Buffalo
Benjamin Superfine University of Illinois, Chicago
Arnold Danzig San Jose State University
Jessica Nina Lester Indiana University
Adai Tefera Virginia Commonwealth University
Linda Darling-Hammond Stanford University
Amanda E. Lewis University of Illinois, Chicago
Tina Trujillo University of California, Berkeley
Elizabeth H. DeBray University of Georgia
Chad R. Lochmiller Indiana University
Federico R. Waitoller University of Illinois, Chicago
Chad d'Entremont Rennie Center for Education Research & Policy
Christopher Lubienski University of Illinois, Urbana-Champaign
Larisa Warhol University of Connecticut
John Diamond University of Wisconsin, Madison
Sarah Lubienski University of Illinois, Urbana-Champaign
John Weathers University of Colorado, Colorado Springs
Matthew Di Carlo Albert Shanker Institute
William J. Mathis University of Colorado, Boulder
Kevin Welner University of Colorado, Boulder
Michael J. Dumas University of California, Berkeley
Michele S. Moses University of Colorado, Boulder
Terrence G. Wiley Center for Applied Linguistics
Kathy Escamilla University of Colorado, Boulder
Julianne Moss Deakin University, Australia
John Willinsky Stanford University
Melissa Lynn Freeman Adams State College
Sharon Nichols University of Texas, San Antonio
Jennifer R. Wolgemuth University of South Florida
Rachael Gabriel University of Connecticut
Eric Parsons University of Missouri-Columbia
Kyo Yamashiro Claremont Graduate University
Amy Garrett Dikkers University of North Carolina, Wilmington
Susan L. Robertson Bristol University, UK
Kyo Yamashiro Claremont Graduate University
Gene V Glass Arizona State University
Gloria M. Rodriguez University of California, Davis
Education Policy Analysis Archives Vol. 25 No. 11 24
archivos analíticos de políticas educativas consejo editorial
Editor Consultor: Gustavo E. Fischman (Arizona State University) Editores Asociados: Armando Alcántara Santuario (Universidad Nacional Autónoma de México), Jason Beech,
(Universidad de San Andrés), Ezequiel Gomez Caride, (Pontificia Universidad Católica Argentina), Antonio Luzon, (Universidad de Granada)
Claudio Almonacid Universidad Metropolitana de Ciencias de la Educación, Chile
Juan Carlos González Faraco Universidad de Huelva, España
Miriam Rodríguez Vargas Universidad Autónoma de Tamaulipas, México
Miguel Ángel Arias Ortega Universidad Autónoma de la Ciudad de México
María Clemente Linuesa Universidad de Salamanca, España
José Gregorio Rodríguez Universidad Nacional de Colombia, Colombia
Xavier Besalú Costa Universitat de Girona, España
Jaume Martínez Bonafé Universitat de València, España
Mario Rueda Beltrán Instituto de Investigaciones sobre la Universidad y la Educación, UNAM, México
Xavier Bonal Sarro Universidad Autónoma de Barcelona, España
Alejandro Márquez Jiménez Instituto de Investigaciones sobre la Universidad y la Educación, UNAM, México
José Luis San Fabián Maroto Universidad de Oviedo, España
Antonio Bolívar Boitia Universidad de Granada, España
María Guadalupe Olivier Tellez, Universidad Pedagógica Nacional, México
Jurjo Torres Santomé, Universidad de la Coruña, España
José Joaquín Brunner Universidad Diego Portales, Chile
Miguel Pereyra Universidad de Granada, España
Yengny Marisol Silva Laya Universidad Iberoamericana, México
Damián Canales Sánchez Instituto Nacional para la Evaluación de la Educación, México
Mónica Pini Universidad Nacional de San Martín, Argentina
Juan Carlos Tedesco Universidad Nacional de San Martín, Argentina
Gabriela de la Cruz Flores Universidad Nacional Autónoma de México
Omar Orlando Pulido Chaves Instituto para la Investigación Educativa y el Desarrollo Pedagógico (IDEP)
Ernesto Treviño Ronzón Universidad Veracruzana, México
Marco Antonio Delgado Fuentes Universidad Iberoamericana, México
José Luis Ramírez Romero Universidad Autónoma de Sonora, México
Ernesto Treviño Villarreal Universidad Diego Portales Santiago, Chile
Inés Dussel, DIE-CINVESTAV, México
Paula Razquin Universidad de San Andrés, Argentina
Antoni Verger Planells Universidad Autónoma de Barcelona, España
Pedro Flores Crespo Universidad Iberoamericana, México
José Ignacio Rivas Flores Universidad de Málaga, España
Catalina Wainerman Universidad de San Andrés, Argentina
Ana María García de Fanelli Centro de Estudios de Estado y Sociedad (CEDES) CONICET, Argentina
Juan Carlos Yáñez Velazco Universidad de Colima, México

Linking TIMSS and NAEP Assessments 25
arquivos analíticos de políticas educativas conselho editorial
Editor Consultor: Gustavo E. Fischman (Arizona State University) Editoras Associadas: Geovana Mendonça Lunardi Mendes (Universidade do Estado de Santa Catarina),
Marcia Pletsch, Sandra Regina Sales (Universidade Federal Rural do Rio de Janeiro)
Almerindo Afonso
Universidade do Minho
Portugal
Alexandre Fernandez Vaz
Universidade Federal de Santa
Catarina, Brasil
José Augusto Pacheco
Universidade do Minho, Portugal
Rosanna Maria Barros Sá
Universidade do Algarve
Portugal
Regina Célia Linhares Hostins
Universidade do Vale do Itajaí,
Brasil
Jane Paiva
Universidade do Estado do Rio de
Janeiro, Brasil
Maria Helena Bonilla
Universidade Federal da Bahia
Brasil
Alfredo Macedo Gomes
Universidade Federal de Pernambuco
Brasil
Paulo Alberto Santos Vieira
Universidade do Estado de Mato
Grosso, Brasil
Rosa Maria Bueno Fischer
Universidade Federal do Rio Grande
do Sul, Brasil
Jefferson Mainardes
Universidade Estadual de Ponta
Grossa, Brasil
Fabiany de Cássia Tavares Silva
Universidade Federal do Mato
Grosso do Sul, Brasil
Alice Casimiro Lopes
Universidade do Estado do Rio de
Janeiro, Brasil
Jader Janer Moreira Lopes
Universidade Federal Fluminense e
Universidade Federal de Juiz de Fora,
Brasil
António Teodoro
Universidade Lusófona
Portugal
Suzana Feldens Schwertner
Centro Universitário Univates
Brasil
Debora Nunes
Universidade Federal do Rio Grande
do Norte, Brasil
Lílian do Valle
Universidade do Estado do Rio de
Janeiro, Brasil
Flávia Miller Naethe Motta
Universidade Federal Rural do Rio de
Janeiro, Brasil
Alda Junqueira Marin
Pontifícia Universidade Católica de
São Paulo, Brasil
Alfredo Veiga-Neto
Universidade Federal do Rio Grande
do Sul, Brasil
Dalila Andrade Oliveira
Universidade Federal de Minas
Gerais, Brasil