Embed Size (px)
Citation preview
1
Improving the productivity of bioethanol production using marine yeast 1
and seawater-based media 2
3
Abdelrahman S. Zaky*1, 2, Chris E. French1, Gregory A. Tucker2 and Chenyu Du*3 4
1 School of Biological Sciences, University of Edinburgh, King's Buildings, Edinburgh EH9 3FF, UK. 5
2 School of Biosciences, University of Nottingham, Nottingham LE12 5RD. 6
3 School of Applied Sciences, University of Huddersfield, Huddersfield HD1 3DH, UK. 7
8
9
* Corresponding authors: 10
Dr Abdelrahman Zaky 11
Research Fellow at the University of Edinburgh 12
[email protected]; [email protected]; 13
Dr Chenyu Du 14
Reader at the University of Huddersfield 15
17
18

2
Abstract 1
Water consumption has become a serious concern in renewable fuel production as demand 2
for biofuels increases to address environmental issues associated with the use of fossil fuels. 3
In recent years, several research groups have suggested seawater (SW) as a promising 4
alternative to fresh water (FW) for the production of biofuels. However, the use of seawater 5
rather than fresh water in the fermentation process is still a relatively unexplored area of 6
research. In this paper, the tolerance of the marine yeast S. cerevisiae AZ65 to the presence of 7
salts in seawater was investigated. The results indicated that S. cerevisiae AZ65 grew well in 8
media containing up to 10.5% (w/v) sea salts and 20% (w/v) glucose compared with an 9
industrial distiller's strain, S. cerevisiae NCYC2592. A multi-stage batch fermentation 10
process was also investigated to increase ethanol productivity. Two different seawater based 11
media were used: SW-YPD medium and SW-molasses medium. S. cerevisiae AZ65 achieved 12
an ethanol concentration of 113.52 g/L with a productivity of 4.15 g/L/h using SW-YPD 13
medium and an ethanol concentration of 50.32 g/L with a productivity of 2.46 g/L/h using 14
SW-molasses medium. These results confirmed the potential of seawater and marine yeasts 15
for implementation in the bioethanol industry using a multi-stage fermentation process. 16
Keywords: 17
Bioethanol; marine yeast; marine fermentation; seawater; Saccharomyces cerevisiae; water 18
footprint; Bioenergy; biofuels 19

3
1. Introduction 1
The global demand for energy is continuously increasing due to the modernization of 2
people’s lifestyles and the rise in the world population. Fossil fuels including petroleum, coal 3
and natural gas are traditionally used to satisfy the demand for energy. However, the world 4
has realised the environmental damage caused by the excessive use of fossil fuels and a shift 5
towards a renewable energy-based economy is globally encouraged. Biofuels are thought to 6
provide the best alternative to fossil fuel because of their capacity for atmospheric CO2 7
capture [1, 2]. According to the International Energy Agency (IEA), global biofuel 8
production reached 152 billion litres in 2018 with an anticipated increase of 3% annually 9
until 2024. However, IEA stated that the sustainable annual growth rate of biofuels should be 10
10% until 2030 to keep pace with the Sustainable Development Scenario (SDS), 11
(www.iea.org/tcep/transport/biofuels/). 12
Several reports have indicated that energy demands and water consumption are interrelated 13
[3-5]. The expansion in biofuel production has raised, for decades, the food versus fuel 14
debate. Currently, a particular focus is being given to the water consumption of bioenergy, 15
especially for biofuel production [6, 7]. This could soon divert the debate into water versus 16
fuel. The global average water footprint (WF) of 1st generation bioethanol has been estimated 17
at around 2500 L H2O/L EtOH [8]. The vast majority of this water is consumed during the 18
agricultural process for the biomass production; however, a considerable amount of water is 19
consumed during the industrial process (hydrolysis, fermentation and distillation) for 20
bioethanol production. Although water is recycled during the process, 1st generation 21
bioethanol production requires 2.7 to 5.8 L of water for every L of ethanol produced. 22
Similarly, 2nd generation bioethanol production consumes 4.5 to 5.3 L water for every L of 23
ethanol produced [9]. 24

4
Seawater is abundant and contains a variety of minerals; hence, it is a promising sustainable 1
alternative to fresh water for bioethanol production. Using seawater in the fermentation 2
process will reduce the WF of bioethanol [10-12]. There is no need for water recycling when 3
using seawater and therefore, the distilled water produced during ethanol distillation could be 4
considered an additional product. This will convert bioethanol production from a water 5
consuming to a water producing process. The use of seawater in bioethanol production will 6
potentially increase the overall efficiency and profitability of the process by producing 7
distilled water and sea salts as additional products. It will also reduce the cost of adding 8
minerals into the fermentation media. In addition, the dried distillers’ grains with solubles 9
(DDGS) produced from the seawater-based bioethanol production will contain sea salts, 10
potentially adding additional value to this DDGS as an animal feed (Figure 1). 11
Seawater contains a high level of salt (about 35 g/L) along with various inhibitors [13]. 12
Hence, a halotolerant yeast strain with high fermentation capacity is required for seawater-13
based bioethanol production. The special features of marine yeasts, particularly high 14
osmotolerance and halotolerance, make them an ideal choice for bioethanol production 15
especially when seawater is used instead of freshwater for preparing the fermentation 16
medium [14]. The use of marine yeast strains for bioethanol production using freshwater has 17
already been demonstrated [15-17]. The current study aims to investigate an industrially 18
sound process for the production of bioethanol using seawater-based media and marine 19
yeasts. The growth rate of marine yeast in the presence of high concentrations of sea salts and 20
a very high concentration of glucose was investigated. Then, a multi-stage fermentation 21
procedure using very high gravity seawater-based fermentation media was carried out to 22
achieve high ethanol productivity. Sugarcane molasses prepared in seawater was used in this 23
study as an example of an industrial substrate for bioethanol production. Sugarcane molasses 24
is a by-product of the sugar industry and contains up to 50% fermentable sugars. It is widely 25

5
used as a carbohydrate substrate in the production of baker’s yeast and bioethanol production 1
[18-20]. During molasses clarification, large quantities of salts are generated [14, 18] which 2
is similar to the case for lignocellulosic hydrolysis in 2nd generation bioethanol production 3
and seaweed hydrolysis in the 3rd generation bioethanol production, where salts are generated 4
as a result of the neutralisation step. Hence, molasses is an ideal substrate to use as an 5
example for investigating the tolerance and fermentation ability of a new yeast strain. 6
7
2. Materials and Methods: 8
2.1. Microorganisms 9
Two marine yeast strains, S. cerevisiae AZ65 and S. cerevisiae AZ118, were used in this 10
study. These strains were previously isolated and identified by Zaky et al. (2016) [21] . 11
Propagation of each strain was as described previously in Zaky et al., (2016) [21]. Briefly, 12
seawater-YPD (SW-YPD) medium was used, which contains (w/v) 1% yeast extract, 2% 13
peptone, and 2% glucose at pH 6 ±0.20. The propagation was performed under aerobic 14
conditions in an orbital shaker (150 rpm) at 30°C for 48 h. A working stock culture of each 15
strain was prepared from cultures propagated on SW-YPD agar slants (as above + 2% agar) 16
and kept at 4°C until required. 17
The terrestrial yeast strain S. cerevisiae NCYC2592 was used in this study as the reference 18
strain. It was maintained using the same method as the marine strains, but the YPD media 19
were prepared using distilled water. S. cerevisiae NCYC2592 is an industrial distiller’s strain 20
that has been well characterised previously for sugar utilisation and tolerance to various 21
inhibitors [13, 22] 22

6
2.2. Natural Seawater 1
Natural Seawater (SW) used in this study was obtained from Skegness, which is located on 2
the North Sea coast of Lincolnshire, UK. Seawater was filtered using glass microfiber filters 3
(pore size, 1.20 μm; Whatman®) to remove suspended particles, then autoclaved at 121°C for 4
15 min, and stored at 4°C until required. 5
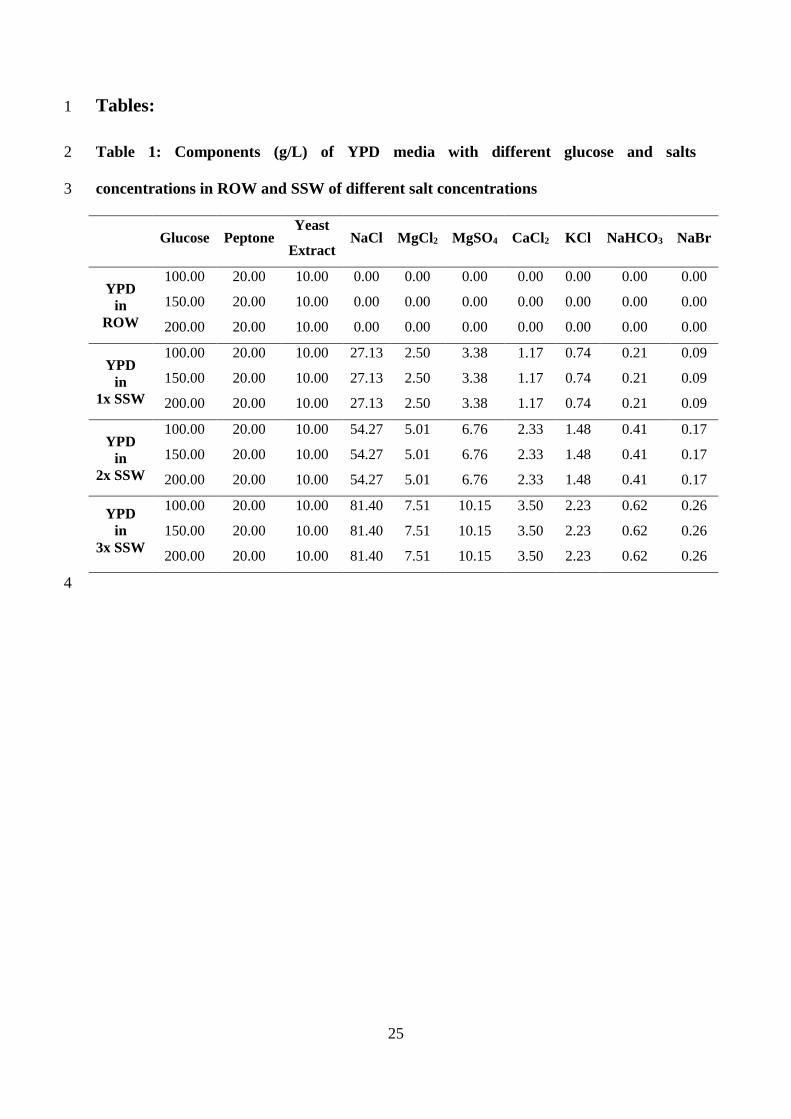
2.3. Synthetic seawater (SSW) 6
Synthetic seawater (SSW) was prepared according to the formula suggested by Fang et al. 7
(2015) [23] which contains NaCl, MgCl2, MgSO4, CaCl2, KCl, NaHCO3, and NaBr at 8
concentrations of (g/L) 27.13, 2.50, 3.38, 1.17, 0.74, 0.21, and 0.09 respectively. Double 9
strength (2x SSW) and triple strength (3x SSW) Synthetic seawater was also prepared (Table 10
1). 11
2.4. Seawater glucose solution 100% (w/v) 12
A 1000 g glucose was transferred into a 2-L Duran bottle contain 425 mL of filtered 13
preheated seawater. A sugar suspension was obtain after closing and shaking the 2-L Duran 14
bottle. The 2-L Duran bottle was then placed in a water bath at 70oC and shaken from time to 15
time until the sugar is totally dissolved and formed a clear colourless glucose syrup. The 16
syrup was left to cool down to the room temperature then transferred into a 1-L volumetric 17
flask. Filtered seawater, at 25oC, was added to the syrup to obtain a precise 100% (w/v) 18
glucose concentration. Sterilisation was conducted using disposable a vacuum filter/storage 19
systems, Pore Size 0.45um, (Fisher Scientific UK Ltd). 20
21

7
2.5. Sugarcane Molasses (SM) 1
The SM used in this study was a commercial product (animal feed supplement grade) called 2
‘NAF Molasses’ that was purchased online from Amazon.co.uk. This product is a crude 3
natural sugarcane molasses containing 45% (w/w) total sugar as stated on the label. 4
Clarification of crude molasses was carried out using seawater to produce 50% (w/v) SW-5
Molasses solution as described previously [14]. 6
2.6. Assessing the tolerance of marine S. cerevisiae to osmotic and salt stress 7
YPD media containing 5, 10, 15 and 20% glucose were prepared in Reverse Osmosis Water 8
(ROW) and SSW of different compositions (1x SSW, 2x SSW and 3x SSW) (Table 1). A 96-9
well cell culture plate was loaded with the media at 200 μL per well. The two marine S. 10
cerevisiae strains (AZ65 and AZ118) and the reference strain S. cerevisiae NCYC2592 were 11
grown aerobically to exponential phase in YPD broth at 30°C using the working stock 12
cultures. Cells were harvested by centrifugation at 1811× g for 3 min (Eppendorf 5810 R, 13
UK) and washed 3 times using ROW. Yeast suspension with, Optical Density measured at 14
600 nm wavelength, (OD600) of 2.00 was prepared from each strain using ROW. The 96-well 15
cell culture plate was inoculated by pipetting 5 µL of the yeast suspension into each well to 16
reach a starting OD600 of approximately 0.05. 17
Plates were incubated in a TECAN Infinite M200 Pro plate reader (Mannedorf, Switzerland) 18
at 30°C. The plate reader records OD600 every 30 minutes using Magellan (7.1, SP1) 19
software. The plates were orbitally shaken for 1 minute before converting pixel density to a 20
signal value reflecting cell growth. After completion of the run, the signal data was compiled 21
and automatically converted into Microsoft® Excel compatible data by Magellan software. 22
The assay was performed in triplicate and the average reading was plotted. 23

8
2.7. Fermentation using 15 L bioreactors 1
Fermentations for bioethanol production were conducted in a modified batch mode using 15 2
L, in-situ sterilisable, stainless steel bioreactors (Techfors-S, Infors-HT, Bottmingen, 3
Switzerland) with 10 L working volumes. 4
2.7.1. Inoculum preparation 5
Inocula of the marine S. cerevisiae AZ65 were prepared for 10 L fermentation media using 6
the following steps: i) a 50-mL conical flask contains 20 mL SW-YPD medium was 7
inoculated with a loopful of yeast from the yeast slope culture, then incubated in an orbital 8
shaker at 30ºC and 150 rpm for 48 h, ii) the culture was then transferred into a 500-mL 9
conical flask containing 200 mL SW-YPD medium and incubated under the previous 10
conditions, iii) The yeast culture obtained was used to inoculate two 2000-mL conical flasks, 11
each containing 1000 mL of SW-YPD medium, and these were incubated under the previous 12
conditions, iv) yeast cells were harvested using a centrifuge (Beckman, Model-J2-21) at 13
10,714× gfor 5 min) harvested yeast cells were washed 3 times using sterile SW and 14
centrifugation, then suspended in sterilised SW to form a concentrated yeast inoculum with 15
OD600 of about 500. Aseptic conditions were maintained in every step. 16
2.7.2. Three-stage batch fermentation using YPD medium prepared using seawater (SW-YPD 17 medium) 18
The first stage was starting by transferring 8 L of the propagation medium, composed of 1% 19
yeast extract, 2% peptone, and 4% glucose dissolved in seawater, into the bioreactors. The 20
pH of the medium was adjusted to 6.0 using NaOH (50% w/v). The sterilisation for the 21
medium and bioreactor was carried out at 121°C for 15 min. Vessels were cooled down to 22
30oC and aseptically inoculated using the yeast inoculum to achieve an initial cell 23
concentration of about OD600 2.0. The propagation stage (1st stage) was carried out 24
aerobically using compressed air at a rate of 10 L/min and stirring rate of 200 rpm. This stage 25

9
was conducted for 10 h at 30oC. Samples were collected at regular time points to determine 1
the growth rate by monitoring the OD changes using a spectrophotometer. At the end of the 2
propagation stage, air supply was stopped and the bioreactors were flushed with nitrogen (at a 3
rate of 10 L/min) for 30 min to establish anaerobic condition for the second stage. The 4
temperature of the reactors was also increased to 35oC. 5
The second stage was started by adding 2 L of sterilised glucose solution (100% w/v) 6
prepared in seawater to the bioreactors in order to obtain a glucose concentration around 20% 7
(w/v) in the fermentation medium. A sample was taken directly after glucose addition to 8
analyse the concentrations of glucose, glycerol, ethanol and yeast cell density at the 9
beginning of the ethanol fermentation stage. Then, samples were withdrawn at regular time 10
intervals over 20 h to assess the fermentation kinetics by monitoring the changes in the 11
concentrations of glucose, glycerol, ethanol and yeast cell density. The third stage was started 12
by the further addition of 1 L of the sterilised glucose solution (100% w/v) prepared in 13
seawater to the bioreactors. The fermentation conditions and sampling were conducted as in 14
the 2nd stage. The pH was adjusted to 6.0 at the beginning of each stage by adding 15
concentrated NaOH (50% w/v). 16
2.7.3. Two-Stage Batch fermentation using molasses media prepared using seawater (SW-17 Molasses medium) 18
Bioreactors were supplied with 4 L of seawater, then sterilised at 121°C for 15 min. One L 19
of the 50% (w/v) SW-Molasses solution was transferred aseptically into the bioreactors to 20
obtain a propagation medium of 10% (w/v) molasses concentration. The medium was 21
supplemented with 3 mL of antifoam (50% w/v in seawater) and 10 mL of urea solution 22
(20% w/v, in seawater). The medium was aerated for 1 h using compressed air at a rate of 10 23
L/min after adjusting the pH to 5.5 using NaOH (50% w/v). The propagation stage (1st stage) 24
was started by inoculating the fermentation medium with yeast to achieve a cell density of an 25

10
OD600 of about 2.0. The fermentation was carried out for 14 h at 30oC with a stirring rate of 1
200 rpm. Samples were collected at regular time points to determine the growth rate by 2
monitoring OD600 using a spectrophotometer. At the end of the propagation stage, the air 3
supply was stopped and the bioreactors were flushed with nitrogen (at a rate of 10 L/min) for 4
30 min to establish anaerobic condition for the second stage; also, the temperature of the 5
reactors was increased to 35oC. The second stage (ethanol production stage) was started by 6
adding 1 L of sterilized seawater and 4 L of the 50% (w/v) SW-Molasses solution to the 7
bioreactors in order to obtain a fermentation medium with 20% (w/v) molasses. A sample 8
was taken directly after sugar addition to analyse the concentrations of glucose, glycerol, 9
ethanol and yeast cell density at the beginning of the ethanol fermentation stage. Samples 10
were withdrawn at regular time intervals over 30 h to assess the fermentation kinetics by 11
monitoring the changes in the concentrations of sugars (glucose, fructose, and sucrose), 12
glycerol and ethanol as well as the pH and yeast cell density. 13
2.8 HPLC analysis 14
Samples were obtained from the bioreactors manually through a sampling port. The OD and 15
pH were measured directly after sampling, then samples were centrifuged at 1811× g for 5 16
min. The supernatant was stored at -20°C until required for analysis. Ethanol, glycerol, acetic 17
acid, glucose, sucrose and fructose were analysed using the HPLC method as developed by 18
Zaky et al (2017) [24]. 19
11
1
3. Results 2
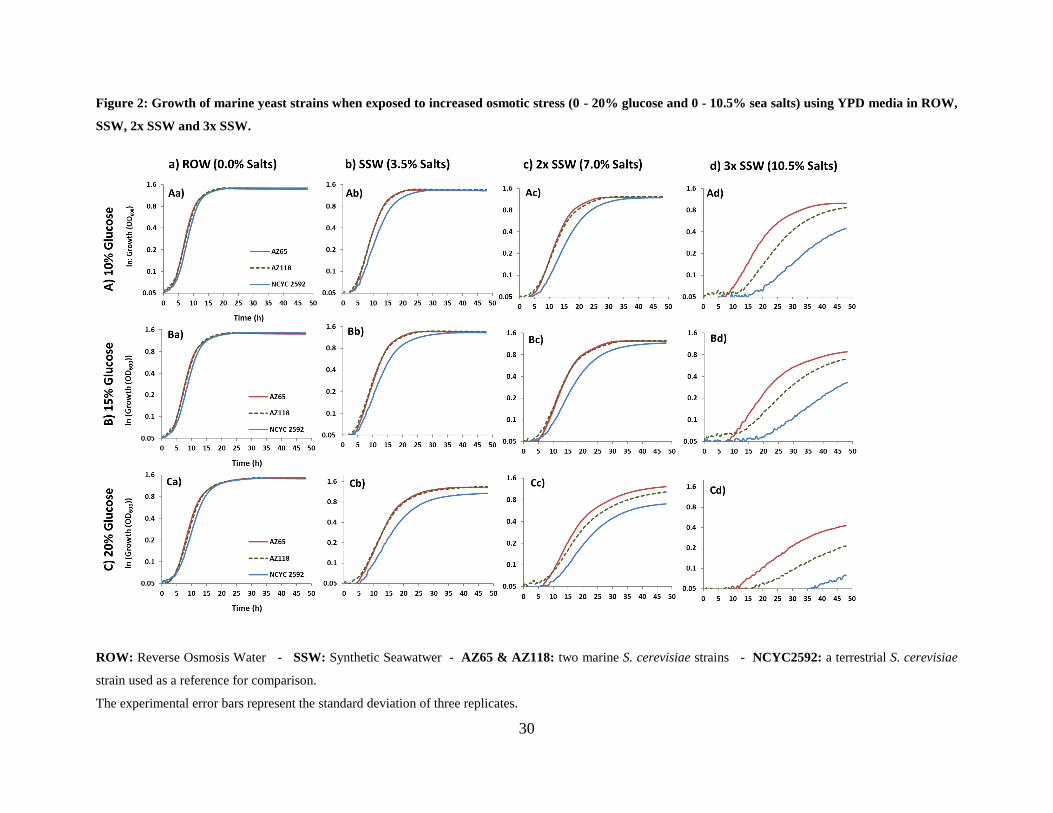
3.1 Growth of marine yeast exposed to increased osmotic stress induced by glucose and seawater 3
salts 4
Results of growth using increasing osmotic stress (up to 20% glucose) in ROW water 5
revealed that there were no differences in growth between the reference and marine strains. 6
All strains maintained a good growth rate and reached stationary phase in less than 20 h of 7
propagation (Figure 2 Aa, Ba & Ca). When 1x SSW was used for preparing the media, 8
marine strains grew faster than the reference strain especially with the media containing 15 9
and 20% glucose (Figure 2 Ab, Bb & Cb). Growth using 2x SSW showed that marine yeast 10
grew faster than the reference strain (Figure 2 Ac, Bc & Cc). Using YPD media containing 2x 11
SSW salts and 20% glucose showed that S. cerevisiae AZ65 grew faster than AZ118 while a 12
significant reduction in the growth of S. cerevisiae NCYC2592 was recorded (Figure 2 Cc). 13
Growth results using 3x SSW demonstrated that the marine strain AZ65 was more tolerant to 14
osmotic stress induced by glucose and salts compared with the other marine strain, AZ118 15
(Figure 2 Ad, Bd & Cd). Using 3x SSW and 20% glucose almost completely inhibited the 16
growth of the reference strain (Figure 2 Cd). 17
3.2 Ethanol production by the marine yeast strain S. cerevisiae AZ65 in a 15 L bioreactor using SW-18
YPD medium in Three-Stage batch fermentation process 19
The first stage (yeast propagation) was conducted to encourage rapid production of active 20
yeast cells for the ethanol production stage (the 2nd stage). The 2nd stage (ethanol production) 21
was conducted at a high concentration of active yeast obtained from the 1st stage and high 22
glucose concentration (20% w/v). The 3rd stage was conducted to test the tolerance and 23

12
fermentation ability of the marine yeast strain AZ65 in the presence of high ethanol, glucose, 1
and salt concentrations. 2
Figure 3 shows the relationship between glucose utilisation, yeast growth, ethanol production 3
and glycerol production throughout the three stages of the process. In the 1st stage, yeast 4
density increased rapidly from an OD of 2.22 ±0.11 to an OD of 15.25 ±0.35 during 8 hours 5
of propagation, at which time the glucose had been almost fully utilised and ethanol reached 6
its maximum concentration in this stage at 16.08 ±0.63 g/L. The OD continued to increase for 7
the next 2 h reaching an OD of 17.75 ±0.92 while the ethanol concentration slightly 8
decreased. The increase in OD during the last 2 h may be due to the maturation of the cells as 9
the glucose had already been consumed and ethanol production stopped. The highest ethanol 10
yield and productivity were achieved after 8 hours of the fermentation and were 74.10% and 11
2.01 g/L/h respectively. By the end of this stage, glycerol and acetic acid concentrations 12
reached 4.08 ±0.05 and 0.21 ±0.01 g/L, respectively (Table 2 & Figure 3). 13
In the 2nd stage, the addition of the glucose solution diluted the concentrations of yeast cells, 14
ethanol, glycerol, and acetic acid that were obtained from the first stage. Hence, this stage 15
started at a yeast cell concentration with OD value of 13.95 ±0.21, ethanol 13.41 ±0.26 g/L, 16
glycerol 3.03 ±0.06 g/L, acetic acid 0.18 ±0.02 g/L while glucose concentration was recorded 17
as 196.23 ±1.48 g/L. During 20 hours of fermentation in this stage, around 73.32 ±1.07 g/L of 18
ethanol was produced making the total ethanol in the reactor 86.72 ±1.33 g/L. However, 19
glucose was not fully utilised by the end of this stage, so the maximum ethanol yield was 20
only 73.26%, but the yield based on the utilised glucose ranged between 89.64 - 85.84% 21
throughout the second stage. Excellent ethanol productivity was achieved during this stage, 22
ranging from 3.67 - 4.15 g/L/h. By the end of this stage, glycerol and acetic acid 23
concentrations were recorded as15.16 ±20 and 0.86 ±0.06 g/L respectively. In addition, yeast 24
cells continued to increase especially during the first 3 h of this stage benefiting from the 25

13
remaining oxygen of the 1st stage. The yeast cells reached an OD of 24.65 ±0.78 by the end 1
of this stage (Table 2 & Figure 3). 2
The 3rd stage of this fermentation experiment started at 129.62 ±0.62 g/L glucose, 13.24 3
±0.91 g/L glycerol, 0.76 ±0.02 g/L acetic acid, 75.50 ±1.79 g/L ethanol and OD of 21.60 4
±0.85. The reduction of the OD and concentrations of glycerol, acetic acid and ethanol was a 5
result of adding the glucose solution. Yeast continued to produce ethanol but at a slower rate 6
compared with the second stage. The ethanol concentration reached 113.52 ±0.01 g/L after 24 7
hours of fermentation. Only 65.25% of the glucose had been utilised during the 3rd stage, 8
hence the maximum ethanol yield in this stage was 57.51%; however, the yield based on the 9
utilised glucose ranged from 74.31 to 90.73% throughout the stage. The highest ethanol 10
productivity was 1.86 g/L/h, which was recorded after 4 h of fermentation, then slightly 11
decreased to around 1.60 g/L/h throughout this stage. Yeast concentration stayed almost 12
constant at an OD of around 21.5. By the end of this stage, glycerol and acetic acid 13
concentrations were 18.31 ±0.77 and 0.98 ±0.13 g/L respectively (Table 2 & Figure 3). 14
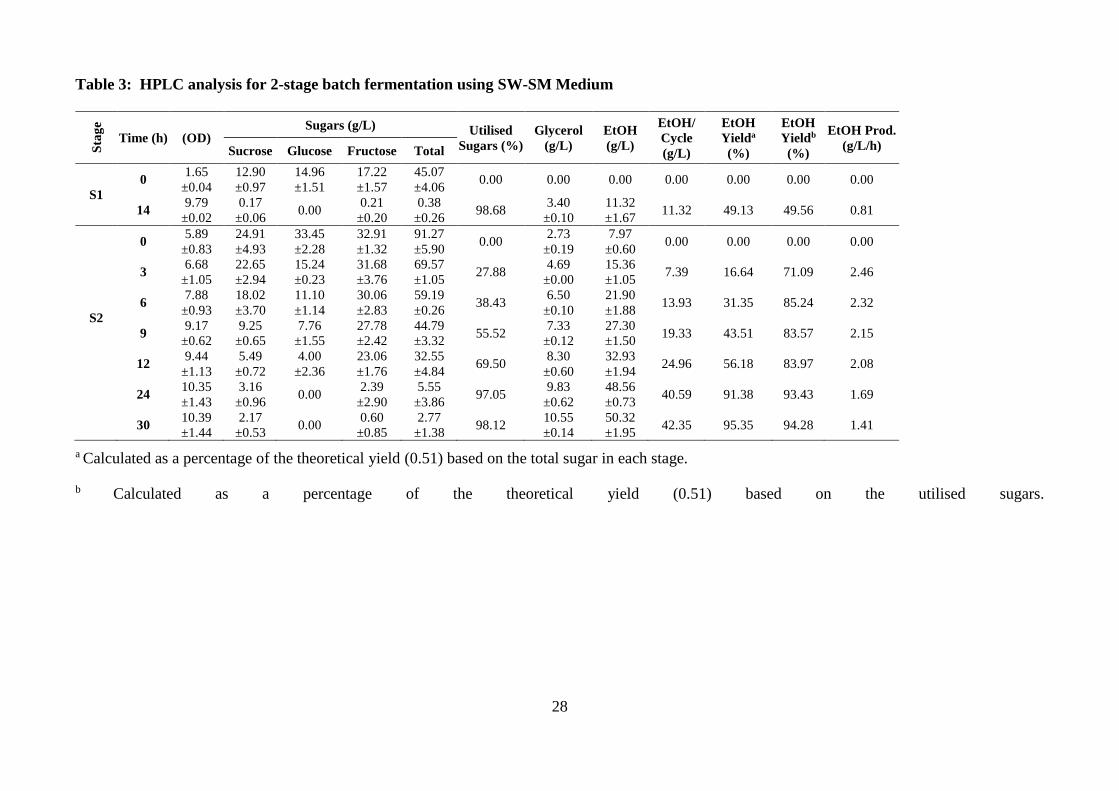
3.3 Ethanol production by the marine yeast strain S. cerevisiae AZ65 in a 15 L bioreactor using SW-15
Molasses medium in a Two-Stage batch fermentation process 16
In this experiment, a 2-stage batch fermentation process was investigated to improve the 17
bioethanol productivity using molasses media. The first stage was conducted to propagate the 18
yeast to obtain high numbers of active yeast cells for the ethanol production stage (the 2nd 19
stage). 20
In the first stage, yeast density increased from an OD of 1.65 ±0.04 to an OD of 9.79 ±0.02 21
over 14 hours at which time 98.68% of sugars had been utilised. By the end of this stage, 22
11.32 ±1.67 g/L of ethanol was produced which accounted for 49.13% of the theoretical 23
yield, and the productivity was 0.81 g/L/h, and the concentration of glycerol reached 3.40 24

14
±0.10 g/L (Table 3 & Figure 4). Although this stage was conducted aerobically to produce 1
yeast biomass, the results indicated that almost 50% of the sugars were consumed to produce 2
ethanol. This highlights the importance of the fed batch approach with low sugar 3
concentration throughout the fermentation time when using SW-molasses media for baker’s 4
yeast production to keep ethanol production at the lowest level. 5
The second stage started with the removal of 4 L of the yeast culture obtained from the 1st 6
stage. The removed culture was centrifuged to extract the yeast biomass which was then re-7
suspended in 4 L of 50% (w/v) molasses and returned to the reactor. As a consequence; the 8
total sugar concentration at the start of this stage was 91.27 ±5.90 g/L while the 9
concentrations of yeast cells, glycerol and ethanol were diluted to 5.89 ±0.83 OD, 2.73 ±0.19 10
g/L and 7.97 ±0.60 g/L respectively. During 30 hours of fermentation, yeast cells continued 11
to increase - especially in the first 9 hours - and reached an OD of 10.39 ±1.44 by the end of 12
this stage. Around 42.35 g/L of ethanol was produced during this stage making the total 13
ethanol in the fermenter 50.32 ±1.95 g/L when 98.12% of the sugars were utilised. Ethanol 14
yield reached 95.35% after 30 hours of fermentation and ethanol productivity was recorded as 15
2.46 g/L/h after 3 hours of fermentation, then decreased gradually to 1.41 g/L/h at the end of 16
the fermentation. The production of glycerol was recorded as 10.55 ±0.14 g/L by the end of 17
this stage (Table 3 & Figure 4). 18
4. Discussion 19
The results revealed that the growth rate of S. cerevisiae decreased as sea salts concentration 20
increased in the propagation media. However, the marine S. cerevisiae strains (AZ65 and 21
AZ118) had higher tolerance to the presence of salts when compared with the terrestrial yeast 22
strain S. cerevisiae NCYC2592. S. cerevisiae is only moderately salt tolerant and other yeast 23
species such as Zygosaccharomyces rouxii have been shown to be more tolerant to the 24

15
presence of salt than S. cerevisiae [25]. Capusoni et al. (2019) also reported that the growth 1
of two marine Debaryomyces hansenii strains was reduced by 42–46% when cultivated in 2
media containing sea salts with 2 M NaCl [12]. Their investigation suggested that this 3
inhibition occurred mainly due to membrane depolarization and reduced membrane 4
permeability induced by the presence of hyper-osmotic stress on the cell [12]. This reduction 5
in biomass yield may be a reflection of the cell’s greater energy expenditure to maintain the 6
balance of the cell’s internal osmotic pressure. We previously reported that the presence of 7
high amounts of salts, especially NaCl, slowed down the fermentation rates of marine and 8
terrestrial S. cerevisiae at different levels [14]. On the other hand, Petrovic et al., (2002) 9
reported that the black yeast Hortaea werneckii grew well in a medium containing high 10
concentrations of NaCl; however, the growth rate decreased by up to 60% in minimal 11
medium at a very high salinities between 10 and 17% NaCl [26]. 12
Bioethanol is usually produced in a batch fermentation processes. This is simple, has less 13
chance of contamination, is easy to manage the feedstock and does not require skilled labour. 14
However, the productivity is low due to low yeast concentration at the beginning of the 15
process and the high concentration of the fermentation substrate. Fed-batch and continuous 16
fermentation are two processes applied in bioethanol fermentation in order to overcome the 17
limitations associated with the convenient batch fermentation process. Both processes 18
provide higher productivity, shorter fermentation time and lower toxic effect of the medium 19
components compared with batch fermentation. However, they are more sophisticated 20
processes and are associated with many disadvantages including the requirement for skilled 21
labour, increased possibility of contamination and the loss of substrate [27]. 22
The Two-Stage and Three-Stage batch fermentation processes investigated in this paper 23
provide an easy solution to overcome the low ethanol productivity in batch fermentation by 24
increasing the yeast density in the fermenter before starting the ethanol production stage. 25
16
Maximum ethanol productivity in the 2nd stage (the ethanol production stage) in this study 1
reached 4.15 and 2.46 g/L/h from SW-YPD media and SW-Molasses media respectively. By 2
contrast, it was reported that the maximum ethanol productivity achieved in a single batch 3
fermentation for bioethanol production using SW-YPD media and SW-Molasses media was 4
2.49 and 1.43 g/L/h respectively [14]. Thus, almost a 2-fold increase in ethanol productivity 5
was achieved when using the Two-Stage and Three-Stage batch fermentation process. This is 6
mainly due to the high yeast cell density at the start of the ethanol production stage. The 7
concentration of yeast cells reached more than OD 17 in 10 h propagation allowing the 8
ethanol stage to start at almost OD 14 yeast cell concentration. While in a single stage 9
fermentation, the yeast cell concentration reached OD 17 after 42 [14]. Providing a suitable 10
condition for yeast propagation including aeration and low sugar concentration during the 1st 11
stage allowed the rapid production of yeast cells. Also, dividing the total sugar concentration 12
into 2 or 3 doses reduced the osmotic effect of the total concentration on the yeast cells. The 13
results could be further improved by optimising other fermentation conditions such as 14
supplying low aeration rate during the fermentation stage. Liu et al., (2016) found that 15
supplying low amounts of O2 during fermentation enhanced the yield and productivity of 16
ethanol in a very high gravity medium [28]. This is because O2 enhances cell recovery 17
through respiration and the TCA cycle by retaining pivotal cellular components during 18
carbon utilisation and synthesis. Oxygen also helps yeast to synthesise sterols and unsaturated 19
lipids which are required for maintaining a healthy cell membrane [29]. 20
Ethanol productivity dropped down during the 3rd stage. This is due to the increasing stress 21
occurred from adding high amount of glucose to the medium, which already contained very 22
high concentrations of ethanol and salts. It was reported that osmotic stress and high ethanol 23
concentration inhibits yeast cell growth and represses glucose transporters [27, 30-32]. This 24
stage was conducted mainly to test if the marine yeast is able to continue the fermentation at 25
17
such high stresses and it prove that it could as the ethanol concentration reached 113.52 g/L 1
comparing to 93.50 g/L in the single stage fermentation [14]. It is expected that fermentation 2
rate (glucose consumption and ethanol production) and ethanol productivity decrease as high 3
ethanol concentration reached; however, the productivity could have been maintained at 4
higher level during this stage if a lower amount of glucose was added. 5
Acetic acid is one of the most potent inhibitors of yeast growth and fermentation process as it 6
inhibits yeast cell growth by impeding the metabolic functions through intracellular 7
acidification [33, 34]. However, the maximum production was around 1 g/L, which is not 8
very toxic especially that marine yeast was reported to be tolerant to many inhibitors 9
including acetic acid compared with the terrestrial yeast [13]. On the other hand, glycerol is 10
an osmolyte and is formed in yeast in response to stress factors (especially osmotic stress) 11
[30]. Although, glycerol is the main by-product of ethanol fermentation accounting for 4 to 12
5% of the carbon substrate consumption [32, 35], its formation is inversely linked to ethanol 13
yield. Hence, a low-glycerol-producing strain would have a great positive impact on ethanol 14
yields on an industrial scale [30]. Sucrose is the major sugar in raw molasses (about 50% of 15
the total sugars), however, the chemical analysis of the clarified molasses showed lower 16
sucrose concentration compared with the concentrations of glucose and fructose. This was 17
due to the addition of concentrated sulphuric acid and heating for 1 hour during the 18
clarification of molasses. We noticed that yeast favours the utilisation of glucose, then 19
sucrose and finally fructose during fermentation. This was in line with results obtained by 20
D'Amore et al. (1989) [36]. The fermentations in this study used seawater and molasses 21
without any added minerals, indicating that seawater can provide the essential minerals 22
required for cell growth and ethanol production [37]. 23
The results obtained in this paper support our previous findings which indicated that seawater 24
can successfully substitute freshwater for ethanol production without compromising the 25

18
production rate [14]. They also elucidate the importance of marine yeast as a potential 1
candidate for the bioethanol industry. In addition, this paper demonstrated that applying a 2
multi-stage batch fermentation process significantly improved ethanol productivity. This 3
paper also indicates the potential of marine yeast for bioethanol production using 2nd and 3rd 4
generation biomass substrates which generate salts during hydrolysis. Practically, in these 5
experiments, the fermentations using seawater-based media were carried out in the same 6
manner as fermentation using fresh water on lab scale. However, at the industrial scale, 7
higher corrosion rate is possible because of the high salt content of seawater. This could be 8
avoided by applying a suitable coating layer inside the existing bioreactor and considering the 9
use of corrosion resistant steel when building a new system. Also pipes made from 10
Chlorinated Polyvinyl Chloride (CPVC) or Polyvinyl Chloride (PVC) should be used instead 11
of conventional metal pipes [14]. We anticipate that use of seawater will encourage rapid 12
advances in material science to provide alternative materials to solve the corrosion issue in 13
bioreactors. 14
Seawater fermentation is a sustainable approach that aims to reduce the water footprint of 15
industrial biotechnology products. In addition to bioethanol production, a seawater 16
fermentation approach has been recently proposed for other industrial biotechnology 17
applications including production of succinic acid [38], baker’s yeast [37] carotenoids [39], 18
lipids [40], polyhydroxyalkanoates [41] and others [42]. Successful seawater-based 19
biorefineries may be established as a coastal industry with direct access to clear and clean 20
seawater. There are several other potential benefits that could be obtained from the proposed 21
coastal-seawater-based biorefineries including; a) easy and direct access to an abundant 22
source of water and minerals; b) direct access to a safe site for biological waste disposal after 23
appropriate waste treatment procedures; c) easy access to low cost and low carbon footprint 24
transportation by sea freight; d) easy access to marine biomass which is a potential negative 25
19
WF substrate for biofuel production; e) potential for safe storage for the excess CO2 produced 1
(Figure 1). Seas and oceans have the potential to store huge amounts of CO2 as an indefinite 2
carbon sink [43, 44]. Storing the CO2 emitted from bioethanol production under seawater 3
could immensely reduce the carbon footprint of bioethanol and increase the positive 4
environmental impact of bioethanol as a green fuel. 5
6
7
8
9
Conclusion 10
The marine environment has a huge potential as a source of abundant water and halotolerant 11
yeast isolates for biorefineries. The marine S. cerevisiae AZ65 strain showed high growth 12
rate under osmotic stress induced by the presence of high concentration of sea salts and/or 13
glucose compared with the reference terrestrial yeast S. cerevisiae NCYC2592. Results 14
showed that S. cerevisiae AZ65 tolerated up to 10.5% sea salts and YPD medium containing 15
20% glucose. Applying 3-stage batch fermentation in 15-L bioreactors using seawater media, 16
AZ65 produced 73 g/L of ethanol from 165 g/L of glucose within 20 h of fermentation with 17
an ethanol productivity of around 4 g/L/h in the main ethanol production stage. The 18
concentration of ethanol in the bioreactor reached 113.52 g/L by the end of the 3rd 19
fermentation stage. Using sugarcane molasses prepared in SW, S. cerevisiae AZ65 produced 20
50.32 g/L of ethanol with an ethanol productivity ranging from 2.46 to 1.41 g/L/h. These 21
results indicated the potential use of seawater-based media for ethanol production using the 22
marine yeast strain S. cerevisiae AZ65. Full sustainability can be achieved by utilising marine 23

20
biomass as a carbon substrate in the seawater fermentation process, accommodating the 1
concept of marine fermentation where the whole system runs on marine elements (seawater, 2
marine substrates, and marine microorganisms). Hence, our future research will investigate 3
the use of seaweed in seawater-fermentation systems for the production of bioethanol and 4
bio-based high-value chemicals. 5
6
7
Declarations 8
Authors’ contributions 9
ASZ proposed, designed, performed the research, and drafted the first manuscript; CEF 10
provided technical advice and reviewed the manuscript; GAT co-supervised the research and 11
reviewed the manuscript; CD supervised the research and reviewed the manuscript. All the 12
authors discussed data, revised the manuscript and approved the final manuscript. 13
Competing interests 14
The authors declare that they have no competing interests. 15
Availability of data and materials 16
The datasets and yeast strains used in the current study are available from the corresponding 17
author (ASZ) on reasonable requests. 18
Funding 19
This research did not receive any specific grant from funding agencies in the public, 20
commercial, or not-for-profit sectors. 21

21
1
Acknowledgment 2
This project was conducted at BABS Building at the Division of Food Science, the 3
University of Nottingham. The authors would like to thank Dr Mohammad Aref Kyyaly, Dr 4
Chris Powell, and the Council for At-Risk Academics (CARA) for their support. 5
6

22
References 1
[1] M. Röder, E. Thiffault, C. Martínez-Alonso, F. Senez-Gagnon, L. Paradis, P. Thornley, 2 Understanding the timing and variation of greenhouse gas emissions of forest bioenergy systems, 3 Biomass and Bioenergy 121 (2019) 99-114. 4 [2] P. Thornley, P. Gilbert, S. Shackley, J. Hammond, Maximizing the greenhouse gas reductions 5 from biomass: The role of life cycle assessment, Biomass and Bioenergy 81 (2015) 35-43. 6 [3] D. Indira, B. Das, P. Balasubramanian, R. Jayabalan, Sea Water as a Reaction Medium for 7 Bioethanol Production, in: J.K. Patra, G. Das, H.-S. Shin (Eds.), Microbial Biotechnology: Volume 2. 8 Application in Food and Pharmacology, Springer Singapore, Singapore, 2018, pp. 171-192. 9 [4] E.S. Spang, W.R. Moomaw, K.S. Gallagher, P.H. Kirshen, D.H. Marks, The water consumption of 10 energy production: an international comparison, Environmental Research Letters 9(10) (2014) 11 105002. 12 [5] M.A.D. Larsen, M. Drews, Water use in electricity generation for water-energy nexus analyses: 13 The European case, Science of The Total Environment 651 (2019) 2044-2058. 14 [6] W. Gerbens-Leenes, A.Y. Hoekstra, The water footprint of sweeteners and bio-ethanol, 15 Environment International 40 (2012) 202-211. 16 [7] C. Zhao, B. Chen, Driving Force Analysis of the Agricultural Water Footprint in China Based on 17 the LMDI Method, Environmental Science & Technology 48(21) (2014) 12723-12731. 18 [8] W. Gerbens-Leenes, A.Y. Hoekstra, T.H. van der Meer, The water footprint of bioenergy, 19 Proceedings of the National Academy of Sciences 106(25) (2009) 10219-10223. 20 [9] M. Wu, Y. Chiu, Consumptive Water Use in the Production of Ethanol and Petroleum Gasoline — 21 2011 Update, Transportation Technology R&D Center, USA, 2011, p. 84. 22 [10] A.S. Zaky, G.A. Tucker, Z.Y. Daw, C. Du, Marine yeast isolation and industrial application, 23 FEMS Yeast Res 14(6) (2014) 813-25. 24 [11] A.S. Zaky, Marine Fermentation, the Sustainable Approach for Bioethanol Production, EC 25 Microbiology (ECO.01) (2017) 25-27. 26 [12] C. Capusoni, S. Arioli, S. Donzella, B. Guidi, I. Serra, C. Compagno, Hyper-Osmotic Stress 27 Elicits Membrane Depolarization and Decreased Permeability in Halotolerant Marine Debaryomyces 28 hansenii Strains and in Saccharomyces cerevisiae, Frontiers in microbiology 10 (2019) 64-64. 29 [13] D. Greetham, A.S. Zaky, C. Du, Exploring the tolerance of marine yeast to inhibitory compounds 30 for improving bioethanol production, Sustainable Energy & Fuels 3(6) (2019) 1545-1553. 31 [14] A.S. Zaky, D. Greetham, G.A. Tucker, C. Du, The establishment of a marine focused biorefinery 32 for bioethanol production using seawater and a novel marine yeast strain, Scientific Reports 8(1) 33 (2018) 12127. 34 [15] N. Obara, M Ishida, N Hamada-Sato, N. Urano, fficient Bioethanol Production from scrap paper 35 Shredder by a Marine Saccharomyces cerevisiae derived C-19 Studies in Science and Technology 1 36 (2012) 127-132. 37 [16] K. Saravanakumar, P. Senthilraja, K. Kathiresan, Bioethanol production by mangrove-derived 38 marine yeast, Sacchromyces cerevisiae, Journal of King Saud University - Science 25(2) (2013) 121-39 127. 40 [17] Y. Khambhaty, D. Upadhyay, Y. Kriplani, N. Joshi, K. Mody, M.R. Gandhi, Bioethanol from 41 Macroalgal Biomass: Utilization of Marine Yeast for Production of the Same, BioEnergy Research 42 6(1) (2013) 188-195. 43 [18] M. Arshad, T. Hussain, M. Iqbal, M. Abbas, Enhanced ethanol production at commercial scale 44 from molasses using high gravity technology by mutant S. cerevisiae, Brazilian Journal of 45 Microbiology 48(3) (2017) 403-409. 46 [19] Jayus, Nurhayati, A. Mayzuhroh, S. Arindhani, C. Caroenchai, Studies on Bioethanol Production 47 of Commercial Baker's and Alcohol Yeast under Aerated Culture Using Sugarcane Molasses as the 48 Media, Agriculture and Agricultural Science Procedia 9 (2016) 493-499. 49 [20] M.D. Ferrari, R. Bianco, C. Froche, M.L. Loperena, Baker's yeast production from 50 molasses/cheese whey mixtures, Biotechnology Letters 23(1) (2001) 1-4. 51

23
[21] A. Zaky, D. Greetham, E. Louis, G. Tucker, C. Du, A New Isolation and Evaluation Method for 1 Marine Derived Yeast spp with Potential Applications in Industrial Biotechnology, Journal of 2 microbiology and biotechnology 26(11) (2016) 1891-1907. 3 [22] D. Greetham, T. Wimalasena, D.W.M. Kerruish, S. Brindley, R.N. Ibbett, R.L. Linforth, G. 4 Tucker, T.G. Phister, K.A. Smart, Development of a phenotypic assay for characterisation of 5 ethanologenic yeast strain sensitivity to inhibitors released from lignocellulosic feedstocks, Journal of 6 Industrial Microbiology & Biotechnology 41(6) (2014) 931-945. 7 [23] C. Fang, M.H. Thomsen, G.P. Brudecki, I. Cybulska, C.G. Frankær, J.-R. Bastidas-Oyanedel, 8 J.E. Schmidt, Seawater as Alternative to Freshwater in Pretreatment of Date Palm Residues for 9 Bioethanol Production in Coastal and/or Arid Areas, ChemSusChem 8(22) (2015) 3823-3831. 10 [24] A.S. Zaky, N. Pensupa, Á. Andrade-Eiroa, G.A. Tucker, C. Du, A new HPLC method for 11 simultaneously measuring chloride, sugars, organic acids and alcohols in food samples, Journal of 12 Food Composition and Analysis 56 (2017) 25-33. 13 [25] T.C. Dakal, L. Solieri, P. Giudici, Adaptive response and tolerance to sugar and salt stress in the 14 food yeast Zygosaccharomyces rouxii, Int J Food Microbiol 185 (2014) 140-57. 15 [26] U. Petrovic, N. Gunde-Cimerman, A. Plemenitas, Cellular responses to environmental salinity in 16 the halophilic black yeast Hortaea werneckii, Mol Microbiol 45 (2002). 17 [27] S.H. Mohd Azhar, R. Abdulla, S.A. Jambo, H. Marbawi, J.A. Gansau, A.A. Mohd Faik, K.F. 18 Rodrigues, Yeasts in sustainable bioethanol production: A review, Biochemistry and Biophysics 19 Reports 10 (2017) 52-61. 20 [28] C.-G. Liu, X.-M. Hao, Y.-H. Lin, F.-W. Bai, Redox potential driven aeration during very-high-21 gravity ethanol fermentation by using flocculating yeast, Scientific Reports 6 (2016) 25763. 22 [29] C. Fornairon-Bonnefond, V. Demaretz, E. Rosenfeld, J.-M. Salmon, Oxygen addition and sterol 23 synthesis in Saccharomyces cerevisiae during enological fermentation, Journal of Bioscience and 24 Bioengineering 93(2) (2002) 176-182. 25 [30] L.C. Basso, H.V. de Amorim, A.J. de Oliveira, M.L. Lopes, Yeast selection for fuel ethanol 26 production in Brazil, FEMS Yeast Research 8(7) (2008) 1155-1163. 27 [31] D. Stanley, A. Bandara, S. Fraser, P.J. Chambers, G.A. Stanley, The ethanol stress response and 28 ethanol tolerance of Saccharomyces cerevisiae, Journal of Applied Microbiology 109(1) (2010) 13-29 24. 30 [32] X.Q. Zhao, F.W. Bai, Mechanisms of yeast stress tolerance and its manipulation for efficient fuel 31 ethanol production, Journal of Biotechnology 144(1) (2009) 23-30. 32 [33] M. Sousa, A.M. Duarte, T.R. Fernandes, S.R. Chaves, A. Pacheco, C. Leão, M. Côrte-Real, M.J. 33 Sousa, Genome-wide identification of genes involved in the positive and negative regulation of acetic 34 acid-induced programmed cell death in Saccharomyces cerevisiae, BMC Genomics 14(1) (2013) 838. 35 [34] M.-M. Zhang, L. Xiong, Y.-J. Tang, M.A. Mehmood, Z.K. Zhao, F.-W. Bai, X.-Q. Zhao, 36 Enhanced acetic acid stress tolerance and ethanol production in Saccharomyces cerevisiae by 37 modulating expression of the de novo purine biosynthesis genes, Biotechnology for Biofuels 12(1) 38 (2019) 116. 39 [35] C. Navarrete, J. Nielsen, V. Siewers, Enhanced ethanol production and reduced glycerol 40 formation in fps1∆ mutants of Saccharomyces cerevisiae engineered for improved redox balancing, 41 AMB Express 4(1) (2014) 86-86. 42 [36] T. D'Amore, I. Russell, G.G. Stewart, Sugar utilization by yeast during fermentation, Journal of 43 Industrial Microbiology 4(4) (1989) 315-323. 44 [37] M.A. Kyyaly, A.S. Zaky, C.D. Powell, Production of Baker's yeast using seawater-based media, 45 New Biotechnology 33, Supplement (2016) S71. 46 [38] C.S.K. Lin, R. Luque, J.H. Clark, C. Webb, C. Du, A seawater-based biorefining strategy for 47 fermentative production and chemical transformations of succinic acid, Energy & Environmental 48 Science 4(4) (2011) 1471-1479. 49 [39] Y. Guo, S. Xie, J.S. Yuan, K.C. Kao, Effects of Seawater on Carotenoid Production and Lipid 50 Content of Engineered Saccharomyces cerevisiae, Fermentation 5(1) (2019) 6. 51 [40] A. Dobrowolski, K. Drzymała, D.A. Rzechonek, P. Mituła, A.M. Mirończuk, Lipid Production 52 From Waste Materials in Seawater-Based Medium by the Yeast Yarrowia lipolytica, Frontiers in 53 microbiology 10 (2019) 547-547. 54

24
[41] H. Yue, C. Ling, T. Yang, X. Chen, Y. Chen, H. Deng, Q. Wu, J. Chen, G.-Q. Chen, A seawater-1 based open and continuous process for polyhydroxyalkanoates production by recombinant Halomonas 2 campaniensis LS21 grown in mixed substrates, Biotechnology for Biofuels 7(1) (2014) 108. 3 [42] B. Dev, A.S. Zaky, R. Jayabalan, Bioethanol Fermentation: The Path Forward for Eco-Friendly 4 and Sustainable Development, in: S.C. Deka, D. Seth, N.R.S. Hulle (Eds.), Technologies for Value 5 Addition in Food Products and Processes, Apple Academic Press, New York 2019, p. 404. 6 [43] N. Chamwudhiprecha, M.J. Blunt, CO2 Storage Potential in the North Sea, International 7 Petroleum Technology Conference, International Petroleum Technology Conference, Bangkok, 8 Thailand, 2011, p. 14. 9 [44] N. O’Neill, R. Pasquali, R. Vernon, A. Niemi, Geological Storage of CO2 in the Southern Baltic 10 Sea, Energy Procedia 59 (2014) 433-439. 11 12
13
14
15
25
Tables: 1
Table 1: Components (g/L) of YPD media with different glucose and salts 2
concentrations in ROW and SSW of different salt concentrations 3
Glucose Peptone Yeast
Extract NaCl MgCl2 MgSO4 CaCl2 KCl NaHCO3 NaBr
YPD
in
ROW
100.00 20.00 10.00 0.00 0.00 0.00 0.00 0.00 0.00 0.00
150.00 20.00 10.00 0.00 0.00 0.00 0.00 0.00 0.00 0.00
200.00 20.00 10.00 0.00 0.00 0.00 0.00 0.00 0.00 0.00
YPD
in
1x SSW
100.00 20.00 10.00 27.13 2.50 3.38 1.17 0.74 0.21 0.09
150.00 20.00 10.00 27.13 2.50 3.38 1.17 0.74 0.21 0.09
200.00 20.00 10.00 27.13 2.50 3.38 1.17 0.74 0.21 0.09
YPD
in
2x SSW
100.00 20.00 10.00 54.27 5.01 6.76 2.33 1.48 0.41 0.17
150.00 20.00 10.00 54.27 5.01 6.76 2.33 1.48 0.41 0.17
200.00 20.00 10.00 54.27 5.01 6.76 2.33 1.48 0.41 0.17
YPD
in
3x SSW
100.00 20.00 10.00 81.40 7.51 10.15 3.50 2.23 0.62 0.26
150.00 20.00 10.00 81.40 7.51 10.15 3.50 2.23 0.62 0.26
200.00 20.00 10.00 81.40 7.51 10.15 3.50 2.23 0.62 0.26
4

26
Table 2: HPLC analysis for 3-stage batch fermentation using SW-YPD medium 1
Stage Time
(h)
Growth
(OD)
Glucose
(g/L)
Utilized
Glucose
(%)
Glycerol
(g/L)
Acetic
(g/L)
EtOH
(g/L)
EtOH/
Cycle
(g/L)
EtOH
Yielda
(%)
EtOH
Yieldb
(%)
EtOH
Produc.
(g/L/h)
S1
0 2.22
±0.11
42.55
±0.14 0.00
0.00
±0.00
0.00
±0.00
0.00
±0.00
0.00
±0.00 0.00 0.00 0.00
2 2.82
±0.03
9.45
±1.00 0.58
0.58
±0.05
0.06
±0.00
2.89
±0.36
2.89
±0.36 13.34 59.96 1.45
4 4.65
±0.08
27.12
±0.47 36.27
1.13
±0.10
0.09
±0.00
5.60
±0.13
5.60
±0.13 25.81 71.14 1.40
8 15.25
±0.35
1.21
±0.16 97.15
3.70
±0.19
0.18
±0.01
16.08
±0.63
16.08
±0.63 74.10 76.28 2.01
10 17.75
±0.92
0.00
±0.00 100.00
4.08
±0.05
0.21
±0.01
15.92
±0.11
15.92
±0.11 73.36 73.36 1.59
S2
0 13.95
±0.21
196.23
±1.48 0.00
3.03
±0.06
0.18
±0.02
13.41
±0.26
0.00
±0.00 0.00 0.00 0.00
3 18.20
±0.00
169.22
±0.89 13.76
6.22
±0.89
0.34
±0.02
25.78
±1.97
12.37
±1.71 12.36 89.64 4.12
9 22.05
±0.07
114.32
±3.03 41.73
11.41
±0.88
0.66
±0.07
50.36
±3.84
36.95
±3.58 36.91 88.36 4.11

27
a Calculated as a percentage of the theoretical yield (0.51) based on the total glucose of each 1
stage. 2
b Calculated as a percentage of the theoretical yield (0.51) based on the utilised glucose. 3
4
5
6
7
8
12 23.85
±0.07
84.26
±0.65 57.06
12.73
±0.65
0.77
±0.07
63.15
±3.33
49.75
±3.07 49.70 87.10 4.15
15 24.45
±0.07
62.71
±0.46 68.04
14.15
±0.07
0.80
±0.04
71.86
±1.89
58.45
±0.63 58.41 85.84 3.90
20 24.65
±0.78
29.99
±0.30 84.72
15.16
±0.20
0.86
±0.06
86.72
±1.33
73.32
±1.07 73.26 86.48 3.67
S3
0 21.60
±0.85
129.62
±0.62 0.00
13.24
±0.91
0.76
±0.02
75.50
±1.79
0.00
±0.00 0.00 0.00 0.00
4 21.75
±0.78
110.00
±0.21 15.14
15.13
±0.24
0.86
±0.01
82.95
±0.78
7.45
±1.01 11.27 74.31 1.86
8 21.70
±0.71
101.60
±1.20 21.61
17.39
±0.11
1.00
±0.06
88.47
±0.79
12.97
±1.01 19.62 90.73 1.62
15 22.15
±0.07
75.05
±0.28 42.10
17.87
±0.92
1.05
±0.06
99.83
±2.32
24.33
±0.53 36.80 87.43 1.62
20 21.60
±0.28
58.00
±0.21 55.25
18.07
±0.77
1.08
±0.04
107.46
±3.12
31.95
±1.32 48.34 87.51 1.60
24 21.45
±0.35
45.05
±0.28 65.25
18.31
±0.77
0.98
±0.13
113.52
±0.01
38.02
±1.79 57.51 88.13 1.58
28
Table 3: HPLC analysis for 2-stage batch fermentation using SW-SM Medium S
tag
e
Time (h) (OD) Sugars (g/L) Utilised
Sugars (%)
Glycerol
(g/L)
EtOH
(g/L)
EtOH/
Cycle
(g/L)
EtOH
Yielda
(%)
EtOH
Yieldb
(%)
EtOH Prod.
(g/L/h) Sucrose Glucose Fructose Total
S1
0 1.65
±0.04
12.90
±0.97
14.96
±1.51
17.22
±1.57
45.07
±4.06 0.00 0.00 0.00 0.00 0.00 0.00 0.00
14 9.79
±0.02
0.17
±0.06 0.00
0.21
±0.20
0.38
±0.26 98.68
3.40
±0.10
11.32
±1.67 11.32 49.13 49.56 0.81
S2
0 5.89
±0.83
24.91
±4.93
33.45
±2.28
32.91
±1.32
91.27
±5.90 0.00
2.73
±0.19
7.97
±0.60 0.00 0.00 0.00 0.00
3 6.68
±1.05
22.65
±2.94
15.24
±0.23
31.68
±3.76
69.57
±1.05 27.88
4.69
±0.00
15.36
±1.05 7.39 16.64 71.09 2.46
6 7.88
±0.93
18.02
±3.70
11.10
±1.14
30.06
±2.83
59.19
±0.26 38.43
6.50
±0.10
21.90
±1.88 13.93 31.35 85.24 2.32
9 9.17
±0.62
9.25
±0.65
7.76
±1.55
27.78
±2.42
44.79
±3.32 55.52
7.33
±0.12
27.30
±1.50 19.33 43.51 83.57 2.15
12 9.44
±1.13
5.49
±0.72
4.00
±2.36
23.06
±1.76
32.55
±4.84 69.50
8.30
±0.60
32.93
±1.94 24.96 56.18 83.97 2.08
24 10.35
±1.43
3.16
±0.96 0.00
2.39
±2.90
5.55
±3.86 97.05
9.83
±0.62
48.56
±0.73 40.59 91.38 93.43 1.69
30 10.39
±1.44
2.17
±0.53 0.00
0.60
±0.85
2.77
±1.38 98.12
10.55
±0.14
50.32
±1.95 42.35 95.35 94.28 1.41
a Calculated as a percentage of the theoretical yield (0.51) based on the total sugar in each stage.
b Calculated as a percentage of the theoretical yield (0.51) based on the utilised sugars.

29
Figures:
Figure 1: Schematic Diagram for Industrial Seawater-Based Bioethanol Production (100,000 L Bioreactor)
30
Figure 2: Growth of marine yeast strains when exposed to increased osmotic stress (0 - 20% glucose and 0 - 10.5% sea salts) using YPD media in ROW,
SSW, 2x SSW and 3x SSW.
ROW: Reverse Osmosis Water - SSW: Synthetic Seawatwer - AZ65 & AZ118: two marine S. cerevisiae strains - NCYC2592: a terrestrial S. cerevisiae
strain used as a reference for comparison.
The experimental error bars represent the standard deviation of three replicates.

31
Figure 3: Changes in the concentration of glucose, ethanol, glycerol and biomass in 3-stage batch
fermentation conducted using S. cerevisiae AZ65 in SW-YPD medium.
The experimental error bars represent the standard deviation of the three replicates.

32
Figure 4: Changes in the concentration of sugars, ethanol, glycerol and biomass in 2-stage batch fermentation
conducted using S. cerevisiae AZ65 in SW-Molasses medium.
The experimental error bars represent the standard deviation of the three replicates.
33
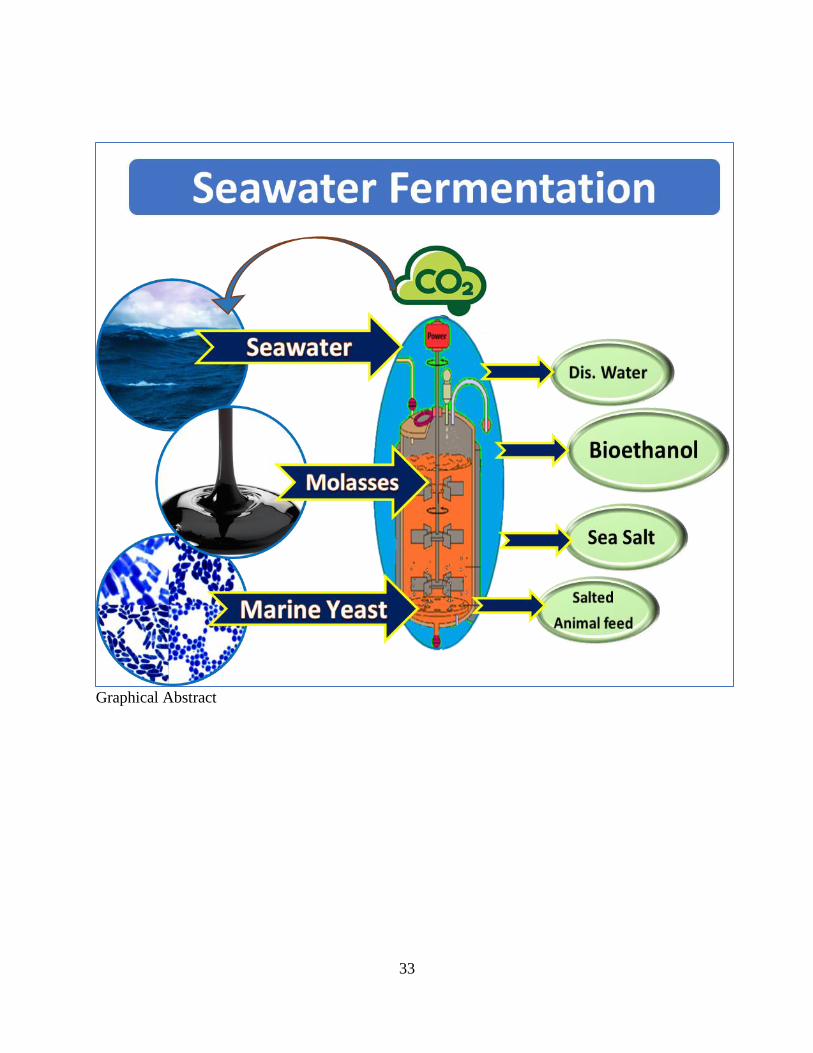
Graphical Abstract