Embed Size (px)
Citation preview

Improving the Lives of Patients
Worldwide
2013 Annual Report

Celgene is building a preeminent global biopharmaceutical company focused on the discovery, development and commercialization of innovative therapies for unmet medical needs in cancer and immune-inflammatory diseases
Celgene Corporation 2013 Annual Report
{ {
Providing benefits Finding opportunity

Celgene’s focus on operating excellence
has produced outstanding financial results over the past
five years
Financial HighlightsCelgene Corporation 2013 Annual Report
Finding opportunity
0
’13’12’11’10’090
1000
2000
3000
4000
5000
6000
7000
8000Total Net Product Sales*(dollars in billions)
$5
$7
$4
$1
$3
Total Net Product Sales(dollars in billions)
$6
$2
*Adjusted financial measure1) CAGR calculated using 2008 and 2013.
125%CAGR
’13’12’11’10’090
100
200
300
400
500
600
0
Earnings Per Share (EPS)*(dollars per share)
$4
$6
$3
$1
$2
Earnings Per Share(dollars per share)
$5
31%CAGR1
*Adjusted financial measure1) CAGR calculated using 2008 and 2013.
8.0%
25.4%
26.0%
41.0%
’13’12’11’10’09
Operating Margin SG&AR&DCOGS
●●●●
48.4%
23.4%
23.2%
5.1%
0
‘11‘10‘09
Operating Margin*(percent)
$4
$6
$3
$1
$2
$5
0
10
20
30
40
50
*Adjusted financial measure
Capital Base Net of Cash*Capital Base including Cash*ROIC Net of Cash*ROIC
●●●●
GAAP operating income used for all periods. Refer to reconcillation tables for ROIC calculation methodology.
*For purposes of this calculation, cash includes cash and equivalents and marketable securities available for sale.
0
10
20
30
40
50
60
70
80
0
’13’12’11’10
Return on Investment Capital(dollars in billions)
$10
$14
$8
$4
$6
$12
0
10
20
30
40
50
’09
0
15%
25%
10%
5%
20%
$2
1
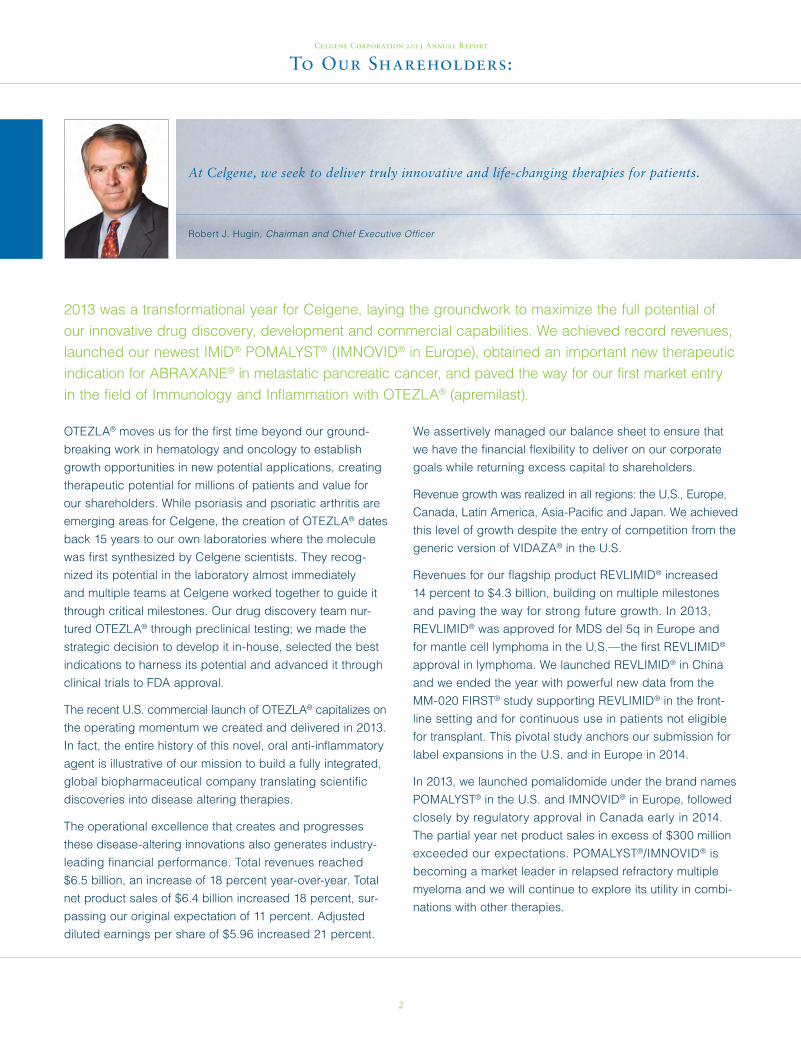
2013 was a transformational year for Celgene, laying the groundwork to maximize the full potential of our innovative drug discovery, development and commercial capabilities. We achieved record revenues, launched our newest IMiD® POMALYST® (IMNOVID® in Europe), obtained an important new therapeutic indication for ABRAXANE® in metastatic pancreatic cancer, and paved the way for our first market entry in the field of Immunology and Inflammation with OTEZLA® (apremilast).
OTEZLA® moves us for the first time beyond our ground-
breaking work in hematology and oncology to establish
growth opportunities in new potential applications, creating
therapeutic potential for millions of patients and value for
our shareholders. While psoriasis and psoriatic arthritis are
emerging areas for Celgene, the creation of OTEZLA® dates
back 15 years to our own laboratories where the molecule
was first synthesized by Celgene scientists. They recog-
nized its potential in the laboratory almost imme diately
and multiple teams at Celgene worked together to guide it
through critical milestones. Our drug discovery team nur-
tured OTEZLA® through preclinical testing; we made the
strategic decision to develop it in-house, selected the best
indications to harness its potential and advanced it through
clinical trials to FDA approval.
The recent U.S. commercial launch of OTEZLA® capitalizes on
the operating momentum we created and delivered in 2013.
In fact, the entire history of this novel, oral anti-inflammatory
agent is illustrative of our mission to build a fully integrated,
global biopharmaceutical company translating scientific
discoveries into disease altering therapies.
The operational excellence that creates and progresses
these disease-altering innovations also generates industry-
leading financial performance. Total revenues reached
$6.5 billion, an increase of 18 percent year-over-year. Total
net product sales of $6.4 billion increased 18 percent, sur-
passing our original expectation of 11 percent. Adjusted
diluted earnings per share of $5.96 increased 21 percent.
We assertively managed our balance sheet to ensure that
we have the financial flexibility to deliver on our corporate
goals while returning excess capital to shareholders.
Revenue growth was realized in all regions: the U.S., Europe,
Canada, Latin America, Asia-Pacific and Japan. We achieved
this level of growth despite the entry of competition from the
generic version of VIDAZA® in the U.S.
Revenues for our flagship product REVLIMID® increased
14 percent to $4.3 billion, building on multiple mile stones
and paving the way for strong future growth. In 2013,
REVLIMID® was approved for MDS del 5q in Europe and
for mantle cell lymphoma in the U.S.—the first REVLIMID®
approval in lymphoma. We launched REVLIMID® in China
and we ended the year with powerful new data from the
MM-020 FIRST® study supporting REVLIMID® in the front-
line setting and for continuous use in patients not eligible
for transplant. This pivotal study anchors our submission for
label expansions in the U.S. and in Europe in 2014.
In 2013, we launched pomalidomide under the brand names
POMALYST® in the U.S. and IMNOVID® in Europe, followed
closely by regulatory approval in Canada early in 2014.
The partial year net product sales in excess of $300 million
exceeded our expectations. POMALYST®/IMNOVID® is
becoming a market leader in relapsed refractory multiple
myeloma and we will continue to explore its utility in combi-
nations with other therapies.
Celgene Corporation 2013 Annual Report Celgene Corporation 2013 Annual Report
Robert J. Hugin, Chairman and Chief Executive Officer
To Our Shareholders:
At Celgene, we seek to deliver truly innovative and life-changing therapies for patients.
2

Our Oncology franchise also grew. Full year ABRAXANE®
sales were $649 million, an increase of 52 percent, driven
largely by the first full year of ABRAXANE® sales in non-small
cell lung cancer and the U.S. and European approvals in
metastatic pancreatic cancer.
Our success in translating Phase III studies into registration
applications and marketed products creates opportunities
for us to replenish our pipeline with continued innovation.
To fulfill this need, we have enhanced our internal efforts
with external collaborations that have extended our strategic
reach and pipeline productivity. In our Hematology franchise
we have new and ongoing collaborations with emerging
companies with disruptive concepts whose leaders share
our vision to advance their technologies to address unmet
medical needs.
In our R&D pipeline, our next-generation IMiDs®, CC-122
and CC-220, are advancing in programs for lymphoma and
inflammatory diseases. We are making significant investments
in programs that could be the next disruptive approach to
treating disease, such as epigentics, cancer metabolism, and
immunotherapy. In addition, we launched a unique program
to pair novel complementary drugs such as Tor Kinase inhibi-
tors and BTK inhibitors—new therapeutics with the potential
to work in combination to change the treatment landscape.
I especially want to emphasize our entry into the field of
biologics where we are advancing three novel programs,
ACE-011, ACE-536, and MOR 202 through various stages of
clinical development. Over the next few years, we anticipate
that half of our new Investigational New Drug (IND) candi-
dates will come from our focus on novel biologics.
These efforts create value for Celgene and benefit patients,
healthcare systems and economies. Medical innovation has
driven about half of all economic growth over the last 50
years1 and offers continued potential to make meaningful
differences in the quality and length of our lives. U.S. can-
cer death rates have fallen 1 percent a year for nearly two
decades2 and each 1 percent decline in cancer deaths
results in a half-trillion dollars in decreased healthcare costs
and increased productivity annually.3 Of future trends that
could shape human health, policies that advance medical
innovation and patient access are among the most important.
At Celgene, we are committed to deliver life-enhancing
medical innovation for the future. We currently have 21 clini-
cal development programs, with about 28,000 patients
enrolled in more than 100 Celgene-sponsored clinical trials.
All of this provides momentum for a future of accelerating
growth. We expect our total business to double between
now and 2017, with revenues to exceed $13 billion and at
least $15 in adjusted diluted earnings per share.
We recognize that our success is inextricably linked to mak-
ing a meaningful difference in the lives of patients world-
wide, and to changing the way they are treated in areas of
unmet medical need. Toward that end, the promise of our
pipeline has never been better, and the future of Celgene
has never been brighter than it is today.
Robert J. Hugin, Chairman and Chief Executive Officer
Celgene Corporation 2013 Annual Report Celgene Corporation 2013 Annual Report
We are positioned for sustainable growth with an increasingly diversified revenue mix through 2017 and beyond.
Our financial commitment is to generate annual growth of 21% in net product sales and 26% in adjusted diluted
earnings through 2017.
1 Murphy KM and Topel RH. The Value of Health and Longevity. J Polit Econ. 2006: 114(4); 871–904.
2 Kort EJ, Paneth N, Vande Woude GF. Cancer Res. 2009;69:6500–6505. National Cancer Institute, Surveillance Epidemiology and End Results (SEER). Available at http://seer.cancer.gov/csr/1975_2009_pops09/browse_csr.php?section=18&page=sect_18_table09.html. Accessed 7/25/13.
3 Murphy KM and Topel RH. The Value of Health and Longevity. J Polit Econ. 2006: 114(5); 871–904.
3

Celgene Corporation 2013 Annual Report Celgene Corporation 2013 Annual Report
Doug FarrellREVLIMID®
Multiple Myeloma
Hematology The Celgene Hematology franchise continues to grow and strengthen in multiple indications across several regions.
Throughout Europe and North America POMALYST®/IMNOVID® is gaining market share in third-line treatment and strengthening our lead ership position in multiple myeloma. In the U.S., market share continues to build faster than expected following the launch of POMALYST® last year. In Europe, the country-by-country roll-ing launch continues after obtaining marketing authorization from the European Medicines Agency in 2013. This approval was followed by regulatory approval in Canada in early 2014. We are com-mitted to maximizing POMALYST®/IMNOVID’s® full potential by studying it in various combina-tions with other therapies.
With our flagship IMiD® REVLIMID®, we are focused on expanding the currently approved indication in relapsed and refractory multiple myeloma by seeking the broadest possible indi-cation as a treatment for patients with newly diagnosed multiple myeloma. Powerful new data from the MM-020 FIRST® study highlighted at the American Society of Hematology (ASH) confer-ence at the end of last year demonstrate the value of continuous treatment with REVLIMID®. We believe these data support our global regulatory submissions for REVLIMID® in newly diagnosed myeloma patients not eligible for transplant.
During 2013 we made significant investments in novel programs that are complementary with our IMiD® products and could enhance our leader-ship position in myeloma. We are collaborating with Morphosys in developing MOR 202, a
Hematology Pre-Clinical Phase I Phase II Phase III Filing/Approval
REVLIMID®
MMMDS deletion 5q
MDSCLL
T-Cell leukemiaNHL-MCL
NHL-DLBCLNHL-FL
NHL-iNHLVIDAZA®
MDSAML
ISTODAX®
CTCL, PTCLPOMALYST®
MMCC-486 (oral aza)
MDSAML
ACE-011/-536Diamond blackfan anemia
Beta-thalassemiaMDS
CC-292 (BTKi)CLL, NHL
EPZ-5676 (DOT1L)MLL-r Leukemia
CC-122Heme malignancies
CC-115Heme malignancies
CC-223Heme malignancies
MOR 202MM and AML
ACY-1215MM
Marizomib IVMM
AG-221Heme malignancies
4

Oncology Pre-Clinical Phase I Phase II Phase III Filing/Approval
ABRAXANE®
BreastNSCLC
PancreaticMelanoma
Adjuvant pancreaticTriple negative breast
BladderColorectal cancer
VTX-2337Ovarian cancer
CC-486 (oral aza)Solid tumors
ISTODAX®
Solid tumorsCC-223 (TORKi)
Solid tumorsCC-122 (PPM)
Solid tumorsCC-115 (DNAPKi/TORKi)
Solid tumorsDemcizumabSolid tumors
Celgene Corporation 2013 Annual Report Celgene Corporation 2013 Annual Report
monoclonal antibody targeting CD-38 which is associated with multiple myeloma and certain leukemias. We are also collaborating with Acetylon, an emerging company focused on HDAC specific inhibitors that could build upon our work in epigenetics. Our initial focus is on ACY-1215, an HDAC 6 inhibitor, which has shown activity in combination with REVLIMID® in heavily treated myeloma patients. These are exciting early programs that could lead to the next break-through treatments for myeloma patients.
In addition to myeloma, we are making signifi-cant advances in other diseases. In Europe, REVLIMID® received approval for deletion 5q myelodysplastic syndromes (MDS). This year we expect data from a Phase III trial in non-deletion 5q MDS that could support expansion into this larger patient segment. Our Phase III programs for CC-486 in MDS and acute myeloid leukemia are accruing patients. The partnered programs with Acceleron Pharma, sotatercept and ACE-536, are advancing in multiple Phase II trials across a variety of diseases. By the end of the year we plan to initiate Phase III trials in MDS and ß-thalassemia with one or both drug candidates.
REVLIMID® achieved another milestone in 2013 with the approval for relapsed mantle cell lym-phoma (MCL) in the U.S. We believe the MCL approval is just the first of new potential clinical and commercial opportunities for REVLIMID® in
non-Hodgkin’s lymphoma and chronic lympho-cytic leukemia. Over the next 12 months we expect to complete enrollment in Phase III regis-tration trials for REVLIMID® as main tenance ther-apy in diffuse large B-cell lymphoma (REMARC), in combination with rituximab for follicular lym-phoma (RELEVANCE®), and as main tenance therapy in chronic lymphocytic leukemia (CONTINUUM®).
Our hematology programs are advancing. We are expanding our pipeline into new areas of treatment and research that provides new oppor-tunities to serve patients and grow Celgene’s leadership position.
Oncology Our Oncology franchise is committed to defining a new paradigm for the treatment of pancreatic cancer with our corner-stone therapy ABRAXANE®.
Pancreatic cancer is the third approved indication for ABRAXANE®, joining metastic breast and non-small cell lung cancer (NSCLC). ABRAXANE® is now approved for treating metastic breast cancer in over 30 countries around the world. In addition to our approval for NSCLC in the U.S. or partner in Japan, Taiho, received approval for this indication and gastric cancer last year. We plan to seek regulatory approval for NSCLC in Europe later this year. Building on these clinical strategies we are working to maximize the full potential of ABRAXANE®.
Pam RyanABRAXANE®
Pancreatic Cancer
5

Inflammation & Immunology Pre-Clinical Phase I Phase II Phase III Filing/Approval
OTEZLA®
Psoriatic ArthritisPsoriasis
Ankylosing spondylitisBehçet’s
Atopic dermatitisCrohn’s diseaseUlcerative colitis
ACE-011Renal Anemia/Bone
POMALYST®
Systemic sclerosisCC-220
Systemic sclerosisSarcoidosis
Cutaneous/Systemic lupus erythematosusCC-292 (BTKi)
Rheumatoid arthritisCC-90001 (JNK1)IPF/Liver fibrosis
PDA-001Crohn’s disease
PDA-002Peripheral arterial disease/Diabetic foot ulcer
Celgene Corporation 2013 Annual Report Celgene Corporation 2013 Annual Report
We are making investments to further enhance the treatment paradigm in pancreatic cancer. Last year we entered into a collaboration with OncoMed Pharmaceuticals to evaluate demci-zumab, a novel monoclonal antibody that targets the Notch signaling pathway that is implicated in several solid tumors. This is a unique approach and an important collaboration. We are evaluating the combination of demcizumab with ABRAXANE®/gemcitabine in pancreatic cancer.
We recently initiated a phase III registration study of ABRAXANE®/gemcitabine as a treatment for patients with pancreatic cancer who have suc-cessfully undergone surgery. In total over a dozen trials of novel agents plus ABRAXANE®/gemcitabine in pancreatic cancer are planned or currently underway.
We are also examining the clinical potential of ABRAXANE® in triple-negative metastatic breast cancer and are exploring new clinical oppor-tunities in lung, ovarian, and colorectal cancer.
We are still learning about the full potential of ABRAXANE® in treating a wide range of solid tumors. We are examining possibilities in combi-nation with epigenetic therapies that “re-program the tumor” to be more susceptible to treatment. Other combinations pair ABRAXANE® with thera-peutics that activate the immune system to target the tumor.
The 2013 clinical, regulatory and commercial success of ABRAXANE® has strengthened our Oncology franchise, enabling us to serve patients who would otherwise have very limited treatment options.
Inflammation & Immunology With the recent U.S. com-mercial launch of OTEZLA®, our Inflammation and Immunology franchise (I&I) is fully engaged in efforts to bring the clinical benefits of this product to patients worldwide.
We expect to build upon our initial U.S. approval in psoriatic arthritis to include psoriasis later this year and for approval in Europe for both diseases to follow early next year. We believe OTEZLA® will provide patients a compelling treatment option in these large, underserved markets.
We are investing in a once-daily formulation and evaluating new diseases to maximize the OTEZLA® opportunity. A Phase III trial in ankylosing spon-dylitis, a debilitating condition affecting the spinal column, fully enrolled last year and we plan to initiate Phase II trials in Crohn’s disease, ulcer-ative colitis, and atopic dermatitis this year.
Pat WilliamsPOMALYST®/IMNOVID®
Multiple Myeloma
6

Celgene Corporation 2013 Annual Report Celgene Corporation 2013 Annual Report
Beyond OTEZLA® we are looking ahead to CC-220, a next-generation IMiD® targeting inflammatory diseases. Phase II trials in systemic sclerosis, sarcoidosis, and systemic lupus erythe-matosus are planned to initiate in 2014.
OTEZLA® represents our entrée into Inflammation and Immunology, a growing franchise with signif-icant long-term importance to Celgene.
Research and Early Development Investing in and prepar-ing for the future is an imperative that drives us at Celgene. Our early clinical stage programs are accelerating across all of our areas of focus—hematology, oncology and immune inflammatory diseases.
Some specific areas of early development include:
• Key partnerships in the area of protein homeo-stasis, the manufacture and control of proteins by cellular mechanisms. This is the anchoring concept for our IMiDs® and has become an area of intense interest in cancer and other diseases.
• Expanding our leadership position in epigenetics, an emerging area of research with potentially broad ranging applications across a variety of diseases, in addition to developing novel and complementary approaches to cancer immunotherapy.
• In the area of biologic therapies we are advanc-ing three clinical candidates and anticipate that over the next few years half of our Investigational New Drug submissions will come from this promising area of drug development.
• Celgene Cellular Therapeutics continues to advance our proprietary placenta-derived adherent stem cell therapies. PDA-001 is in early-stage clinical trials for Crohn’s disease, and PDA-002 is being tested for peripheral artery disease and diabetic foot ulcers.
Our Translational Development team is engaged in further defining the mechanisms of action and the scope of opportunities addressed by our early-stage programs. We are advancing the science around protein homeostasis and exploit-ing our understanding of cereblon as the target
Lois MintaOTEZLA®
Psoriatic Arthritis
Discovery Lead Optimization Preclinical Phase I
Hematology/OncologyCC-292 (BTKi)
CC-223 (TORKi)CC-122 (PPM)
CC-486 (oral aza/Solid Tumor)CC-115 (DNAPKi/TORKi)
EZ 5676 (DOT1L)AG-221 (IDH-2)AG-120 (IDH-1)
CC-90002 (Ca ImmRx)CC-90004 (Triple Negative BC)
CC-90003 (ERKi)
Early Targets
Inflammation & ImmunologyPDA-001
CC-220 (IMiD)PDA-002
CC-90001 (JNK-1)CC-0739623 (PKC0)
BTKiARRY (TYK2)
Early Targets
7

Celgene Corporation 2013 Annual Report
protein for our IMiDs®, to further differentiate within this important class. This research is paving the way for CC-122 and CC-220, our next-generation IMiDs® for cancer and inflammatory diseases.
Because the diseases we are treating are biologically complex and the mechanisms of our drug candidates are complementary, we are evaluating novel-novel combinations that could lead to another area of drug development. Among our portfolio of early-stage programs to be included in a novel-novel combination are CC-122, our BTK inhibitor CC-292, and our Tor Kinase inhibitors CC-115 and CC-223. Working with novel-novel combinations places us at the leading edge of innovation.
For 2014 and beyond, our early development program is an ambi-tious value-creating undertaking with high potential programs underway internally as well as with high-value partners, collabora-tions that extend our capabilities and our productivity as we con-tinue to move ahead.
Collaborations At Celgene we maximize our capabili-ties by amplifying our strong internal research efforts with excep-tional collaborations. Adding external talent and resources to our own extends our access to novel programs and creates a powerful drug discovery and development platform.
We begin by scanning the landscape for emerging companies, far-sighted academic researchers and unique projects. We look for categorical differentiation—a disruptive technology that offers
an anchor point for future research efforts, a new therapeutic class of molecules, or a next-generation capability. We evaluate how well their work complements and enhances the direction of our own programs.
Relationship-building, business and personal, is at the heart of these collaborations.
• We are selective about the partners we work with. We look for people who have demonstrated capabilities with a history of achievement.
• We strategically evaluate the companies we work with. We listen to their objectives—and the objectives of their investors and backers—to measure how well they align with our own.
• We nurture and support our collaborations, involving teams of experienced industry professionals to enhance bidirectional information exchange, and to assure that we continue to learn innovative approaches.
It is the quality of people at this interface, and the care we take in selecting and aligning with these collaborations that make us a partner of choice.
Together with our partners, we are working toward building and expanding a rich pipeline diversified by timing and by portfolio candidates to best serve all of our stakeholders—patients, physicians and our investors.
External Collaborations
JNK1, New Targets,
Novel phenotypic
screens
GDF FamilyPKCOBTKi,TYK2,
Novel Targets
PayloadDelivery,Next GenEnhanced Activities
Novel IMiDs/CRBN & Other
Ubiquitin LigaseTargets
New TargetsEpigenetic
Re-programming& Convergencewith Metabolic
Targets
Novel and ComplementaryApproaches to
Immunotherapy,Breaking Tumor
Tolerance
Unique Validation /
Testing Capabilities
from BreakingTumor
Tolerance
Pathway Convergent
Mechanisms, Synthetic
LethalCombinations
+PDE4Complementation
+PKCO
Celgene Strengths
PlatformSHARED
Apremilast+Combinations
Fibrosis Novel Targets Fit for
Purpose
Next GenerationBiologics
ProteinHomeostasis
Epigenetics Immuno-therapy CancerStem Cells /Resistance
CancerStem Cells /Resistance
HEM/ONCI & I
THERAPEUTICSFORMA
RGB HEX #595959
RGB HEX #99CC00
PANTONE HEX Black (70%)
PANTONE 382U (100%)
FOR PRINT (Not actual colors)
FOR WEB
S u t r oBiopharma
Adimab
Adimab
8

Corporate HeadquartersCelgene Corporation 86 Morris Avenue Summit, New Jersey 07901 (908) 673-9000 www.celgene.com
Transfer AgentAmerican Stock Transfer and Trust Company 59 Maiden Lane New York, New York 10038
Independent AuditorsKPMG LLP 51 John F. Kennedy Parkway Short Hills, New Jersey 07078
Annual MeetingThe annual meeting of stockholders of Celgene Corporation will be held on Wednesday, June 18, 2014 at Celgene headquarters in Summit, New Jersey, at 1:00 P.M.
Form 10-KCopies of the Form 10-K for the year ended December 31, 2013 may be obtained by stockholders without charge upon written inquiry to the Corporate Secretary at Celgene headquarters.
Stockholder InformationCelgene common stock is traded on the NASDAQ GS (NASDAQ Global Select Market). NASDAQ Symbol: CELG. Celgene Contingent Value Rights (CVRs) are traded on the NASDAQ GM (NASDAQ Global Market). NASDAQ Symbol: CELGZ. Celgene options are listed on the Chicago Board Options Exchange. CBOE symbol: LQH.
As of March 19, 2014, there were 502,391 beneficial account holders of the Company’s common stock.
The following table sets forth the intra-day high and low sales price of the common stock for the periods indicated, as reported by the NASDAQ.
2013 2012
High Low High Low
Q4 $173.80 $142.10 $82.78 $71.23Q3 156.04 118.15 78.63 61.89Q2 131.82 110.53 80.42 58.53Q1 116.95 79.75 78.83 66.28
The price quotations set forth above represent prices to dealers and do not include retail markups, markdowns or commissions. Celgene has not paid, and does not anticipate paying in the near future, dividends on its common stock. Anyone wishing more information about Celgene should direct their inquiries to:
Investor Relations Celgene Corporation 86 Morris Avenue Summit, New Jersey 07901 (908) 673-9000
REVLIMID®, IMiDs®, VIDAZA®, ABRAXANE®, ISTODAX®, POMALYST®, POMALYST REMS™, REVLIMID REMS™, THALOMID REMS™, Celgene Patient Support®, IMNOVID® and OTEZLA® are trademarks of Celgene Corporation
Committed to improving the lives of patients worldwide® and Doing Well by Doing Good® are registered trademarks of Celgene Corporation
© Copyright 2014 Celgene Corporation
Celgene Corporation
Celgene Corporate InformationCelgene Corporation 2013 Annual Report
Ann
ual R
ep
ort
De
sig
n b
y C
urra
n &
Co
nno
rs, I
nc. /
ww
w.c
urra
n-c
onn
ors
.co
m
This document contains forward-looking statements. Forward-looking statements are statements that are not historical facts and are based on current plans, estimates,
assumptions and projections, and therefore you should not place too much reliance on them. Forward-looking statements speak only as of the date they are made,
and we undertake no obligation to update any forward-looking statement in light of new information or future events, although we intend to continue to meet our
ongoing disclosure obligations under applicable laws. Forward-looking statements involve inherent risks and uncertainties, most of which are difficult to predict and
are generally beyond our control. We caution you that actual results or outcomes may differ materially from those expressed in, or implied by, the forward-looking
statements as a result of the impact of a number of important factors, as well as other known and unknown risks and uncertainties, or if the assumptions underlying any
of these statements prove incorrect. Certain of these factors are discussed in more detail in our public reports filed with the Securities and Exchange Commission.
In addition to financial information prepared in accordance with U.S. GAAP (generally accepted accounting principles), this document also contains certain adjusted
financial measures that we believe provide investors and management with supplemental measures of operating performance and trends that facilitate comparisons
between periods and with respect to projected information. These adjusted measures should be considered in addition to, but not as a substitute for, the information
prepared in accordance with U.S. GAAP. Other companies may define these meas ures in different ways. For further information relevant to the interpretation and recon-
ciliation to GAAP adjusted financial measures, please refer to the Financial Reports page posted in the Investor Relations section of our website at www.celgene.com.
Celgene.com across devicesThe Celgene Story

Form 10-KCelgene Corporation 2013 Annual Report


UNITED STATESSECURITIES AND EXCHANGE COMMISSION
Washington, D.C. 20549
FORM 10-K(Mark one) ANNUAL REPORT PURSUANT TO SECTION 13 OR 15(d) OF THE
SECURITIES EXCHANGE ACT OF 1934For the fiscal year ended December 31, 2013
or
TRANSITION REPORT PURSUANT TO SECTION 13 OR 15(d) OF THESECURITIES EXCHANGE ACT OF 1934
For the transition period from to
Commission file number 001-34912
CELGENE CORPORATION(Exact name of registrant as specified in its charter)
Delaware(State or other jurisdiction ofincorporation or organization)
22-2711928
(I.R.S. Employer Identification No.)86 Morris Avenue
Summit, New Jersey(Address of principal executive offices)
07901
(Zip Code)(908) 673-9000
(Registrant's telephone number, including area code)Securities registered pursuant to Section 12(b) of the Act:
Title of each class Name of each exchange on which registeredCommon Stock, par value $.01 per share NASDAQ Global Select Market
Contingent Value Rights NASDAQ Global Market
Securities registered pursuant to Section 12(g) of the Act: None
Indicate by check mark if the registrant is a well-known seasoned issuer, as defined in Rule 405 of the Securities Act. Yes No
Indicate by check mark if the registrant is not required to file reports pursuant to Section 13 or Section 15(d) of the Act. Yes No
Indicate by check mark whether the registrant (1) has filed all reports required to be filed by Section 13 or 15(d) of the Securities Exchange Act of 1934 during the preceding 12 months (or for such shorter period that the registrant was required to file such reports), and (2) has been subject to such filing requirements for the past 90 days. Yes No
Indicate by check mark whether the registrant has submitted electronically and posted on its corporate Web site, if any, every Interactive Data File required to be submitted and posted pursuant to Rule 405 of Regulation S-T (§232.405 of this chapter) during the preceding 12 months (or for such shorter period that the registrant was required to submit and post such files). Yes No
Indicate by check mark if disclosure of delinquent filers pursuant to Item 405 of Regulation S-K is not contained herein, and will not be contained, to the best of registrant's knowledge, in definitive proxy or information statements incorporated by reference in Part III of this Form 10-K or any amendment to this Form 10-K.
Indicate by check mark whether the registrant is a large accelerated filer, an accelerated filer, a non-accelerated filer, or a smaller reporting company. See the definitions of "large accelerated filer," "accelerated filer" and "smaller reporting company" in Rule 12b-2 of the Exchange Act.
Large accelerated filer Accelerated filer Non-accelerated filer Smaller reporting company (Do not check if a smaller reporting company)
Indicate by check mark whether the registrant is a shell company (as defined in Rule12b-2 of the Act). Yes No
The aggregate market value of voting stock held by non-affiliates of the registrant on June 28, 2013, the last business day of the registrant's most recently completed second quarter, was $48,096,964,775 based on the last reported sale price of the registrant's Common Stock on the NASDAQ Global Select Market on that date.
There were 406,020,079 shares of Common Stock outstanding as of February 7, 2014.
Documents Incorporated by ReferenceThe registrant intends to file a definitive proxy statement pursuant to Regulation 14A within 120 days of the end of the fiscal year ended December 31, 2013. The proxy statement is incorporated herein by reference into the following parts of the Form 10-K:
Part II, Item 5.(d) Equity Compensation Plan Information.Part III, Item 10. Directors, Executive Officers and Corporate Governance.Part III, Item 11. Executive Compensation.Part III, Item 12. Security Ownership of Certain Beneficial Owners and Management and Related Stockholder Matters.Part III, Item 13. Certain Relationships and Related Transactions, and Director Independence.Part III, Item 14. Principal Accountant Fees and Services.

CELGENE CORPORATION
ANNUAL REPORT ON FORM 10-K
TABLE OF CONTENTS
Item No. PagePart I
1. Business 11A. Risk Factors 161B. Unresolved Staff Comments 262. Properties 263. Legal Proceedings 264. Mine Safety Disclosures 26
Part II5. Market for Registrant's Common Equity, Related Stockholder Matters and Issuer Purchases of Equity
Securities 276. Selected Financial Data 297. Management's Discussion and Analysis of Financial Condition and Results of Operations 307A. Quantitative and Qualitative Disclosures About Market Risk 518. Financial Statements and Supplementary Data 569. Changes in and Disagreements With Accountants on Accounting and Financial Disclosure 1039A. Controls and Procedures 1039B. Other Information 105
Part III10. Directors, Executive Officers and Corporate Governance 10511. Executive Compensation 10512. Security Ownership of Certain Beneficial Owners and Management and Related Stockholder Matters 10513. Certain Relationships and Related Transactions, and Director Independence 10514. Principal Accountant Fees and Services 105
Part IV15. Exhibits, Financial Statement Schedules 106
Signatures and Power of Attorney 110

1
PART I
ITEM 1. BUSINESS
Celgene Corporation, together with its subsidiaries (collectively “we,” “our,” “us,” “Celgene” or the “Company”), is a global biopharmaceutical company primarily engaged in the discovery, development and commercialization of innovative therapies designed to treat cancer and immune-inflammatory related diseases. We are dedicated to innovative research and development designed to bring new therapies to market and we are involved in research in several scientific areas that may deliver proprietary next-generation therapies, targeting areas including intracellular signaling pathways, protein homeostasis and epigenetics in cancer and immune cells, immunomodulation in cancer and autoimmune diseases and therapeutic application of cell therapies. Celgene Corporation was incorporated in the State of Delaware in 1986.
Our primary commercial stage products include REVLIMID®, VIDAZA®, ABRAXANE®, POMALYST®/IMNOVID®,
THALOMID® (inclusive of Thalidomide CelgeneTM), ISTODAX® and azacitidine for injection (generic version of VIDAZA®). Additional sources of revenue include royalties from Novartis Pharma AG (Novartis) on their sales of FOCALIN XR® and the entire RITALIN® family of drugs, the sale of services through our Celgene Cellular Therapeutics (CCT) subsidiary and other licensing agreements.
We continue to invest substantially in research and development in support of multiple ongoing proprietary clinical development programs which support our existing products and pipeline of new drug candidates. REVLIMID® is in several phase III trials across a range of hematological malignancies that include newly diagnosed multiple myeloma and maintenance, lymphomas, chronic lymphocytic leukemia (CLL) and myelodysplastic syndromes (MDS). POMALYST®/IMNOVID® was approved in the United States and European Union for indications in multiple myeloma based on phase II and phase III results, respectively, and additional phase III trials are underway with POMALYST®/IMNOVID® in relapsed refractory multiple myeloma. Phase III trials are also underway for VIDAZA® and CC-486 in MDS and acute myeloid leukemia (AML) and ISTODAX® in first-line peripheral T-cell lymphoma (PTCL). In solid tumors, we are evaluating ABRAXANE® in phase III trials for breast, pancreatic and non-small cell lung cancers. Our lead product candidate in inflammation and immunology, OTEZLA® (apremilast), is being evaluated in a broad phase III program for psoriatic arthritis, psoriasis and ankylosing spondylitis.
In addition to our phase III programs, we have a growing early-to-mid-stage pipeline of novel therapies to address significant unmet medical needs consisting of in-house developed compounds, compounds licensed from other companies and compounds we have options to acquire from collaboration partners.
We believe that continued use of our primary commercial stage products, ongoing internal and external collaborative research and development efforts, depth of our product pipeline, regulatory approvals of new products and expanded use of existing products will provide the catalysts for future growth.

2
COMMERCIAL STAGE PRODUCTS
REVLIMID® (lenalidomide): REVLIMID® is an oral immunomodulatory drug marketed in the United States and many international markets for the treatment of patients as indicated below:
Disease Geographic ApprovalsMultiple myeloma (MM), in combination withdexamethasone, in patients who have received at least oneprior therapy
* United States* European Union* Japan* Other international markets
Myelodysplastic syndromes (MDS)Transfusion-dependent anemia due to low- orintermediate-1-risk MDS associated with a deletion 5qabnormality with or without additional cytogeneticabnormalities
* United States* Other international markets
Transfusion-dependent anemia due to low- orintermediate-1-risk MDS in patients with isolateddeletion 5q cytogenetic abnormality when other optionsare insufficient or inadequate
* European Union (Approved June 2013)
MDS with a deletion 5q cytogenetic abnormality. Theefficacy or safety of REVLIMID for InternationalPrognostic Scoring System (IPSS) intermediate-2 or highrisk MDS has not been established.
* Japan
Mantle cell lymphoma (MCL) in patients whose disease hasrelapsed or progressed after two prior therapies, one ofwhich included bortezomib.
* United States (Approved June 2013)
REVLIMID® is distributed in the United States through contracted pharmacies under the REVLIMID® Risk Evaluation and Mitigation Strategy (REMS) program, which is a proprietary risk-management distribution program tailored specifically to provide for the safe and appropriate distribution and use of REVLIMID®. Internationally, REVLIMID® is distributed under mandatory risk-management distribution programs tailored to meet local authorities' specifications to provide for the safe and appropriate distribution and use of REVLIMID®. These programs may vary by country and, depending upon the country and the design of the risk-management program, the product may be sold through hospitals or retail pharmacies.
REVLIMID® continues to be evaluated in numerous clinical trials worldwide either alone or in combination with one or more other therapies in the treatment of a broad range of hematological malignancies, including multiple myeloma, MDS, various lymphomas, CLL, other cancers and other diseases.
VIDAZA® (azacitidine for injection): VIDAZA® is a pyrimidine nucleoside analog that has been shown to reverse the effects of DNA hypermethylation and promote subsequent gene re-expression. VIDAZA® is a Category 1 recommended treatment for patients with intermediate-2 and high-risk MDS, according to the National Comprehensive Cancer Network and is marketed in the United States for the treatment of all subtypes of MDS. The U.S. regulatory exclusivity for VIDAZA® expired in May 2011. As the result of the launch of a generic version of VIDAZA® in the United States by a competitor in September 2013, we experienced a significant reduction in our U.S. sales of VIDAZA® in the fourth quarter of 2013. In 2013, we also contracted with Sandoz AG to sell a generic version of VIDAZA®, which we supply. In Europe, VIDAZA® is marketed for the treatment of intermediate-2 and high-risk MDS, chronic myelomonocytic leukemia with 10% to 29% marrow blasts without myeloproliferative disorder, as well as AML with 20% to 30% blasts and multi-lineage dysplasia and has been granted orphan drug designation for the treatment of MDS and AML. Regulatory exclusivity for VIDAZA® is expected to continue in Europe through 2018.
3
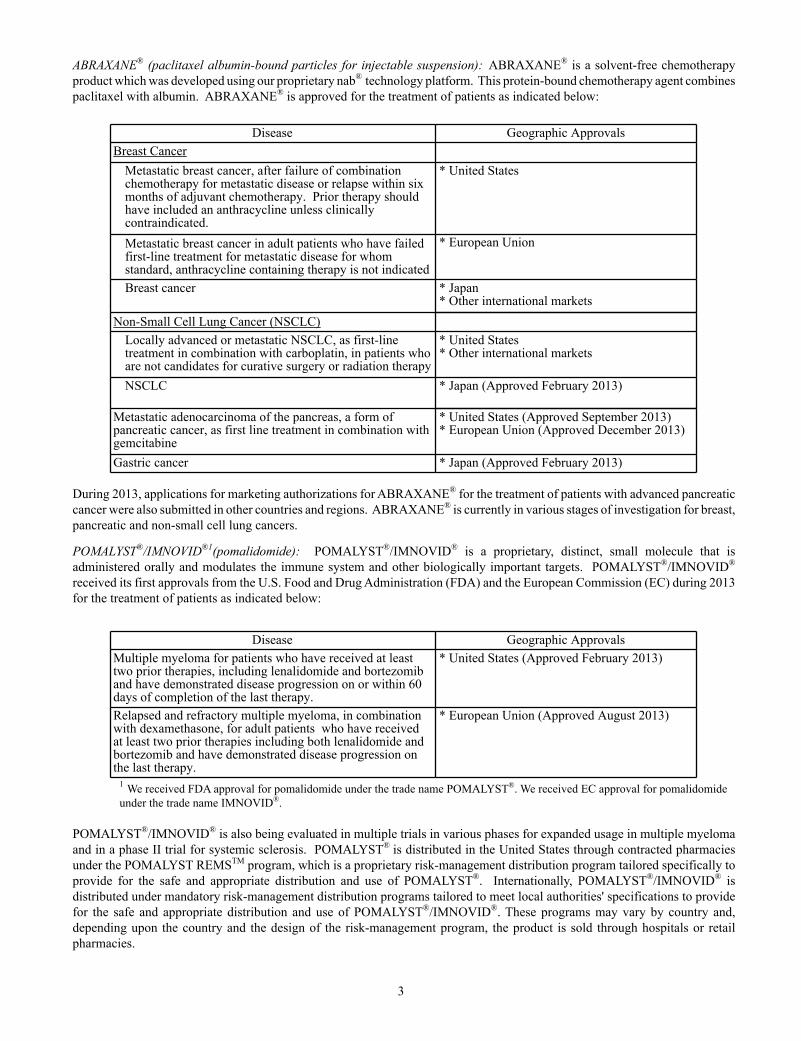
ABRAXANE® (paclitaxel albumin-bound particles for injectable suspension): ABRAXANE® is a solvent-free chemotherapy product which was developed using our proprietary nab® technology platform. This protein-bound chemotherapy agent combines paclitaxel with albumin. ABRAXANE® is approved for the treatment of patients as indicated below:
Disease Geographic ApprovalsBreast Cancer
Metastatic breast cancer, after failure of combinationchemotherapy for metastatic disease or relapse within sixmonths of adjuvant chemotherapy. Prior therapy shouldhave included an anthracycline unless clinicallycontraindicated.
* United States
Metastatic breast cancer in adult patients who have failedfirst-line treatment for metastatic disease for whomstandard, anthracycline containing therapy is not indicated
* European Union
Breast cancer * Japan* Other international markets
Non-Small Cell Lung Cancer (NSCLC)Locally advanced or metastatic NSCLC, as first-linetreatment in combination with carboplatin, in patients whoare not candidates for curative surgery or radiation therapy
* United States* Other international markets
NSCLC * Japan (Approved February 2013)
Metastatic adenocarcinoma of the pancreas, a form ofpancreatic cancer, as first line treatment in combination withgemcitabine
* United States (Approved September 2013)* European Union (Approved December 2013)
Gastric cancer * Japan (Approved February 2013)
During 2013, applications for marketing authorizations for ABRAXANE® for the treatment of patients with advanced pancreatic cancer were also submitted in other countries and regions. ABRAXANE® is currently in various stages of investigation for breast, pancreatic and non-small cell lung cancers.
POMALYST®/IMNOVID®1(pomalidomide): POMALYST®/IMNOVID® is a proprietary, distinct, small molecule that is administered orally and modulates the immune system and other biologically important targets. POMALYST®/IMNOVID® received its first approvals from the U.S. Food and Drug Administration (FDA) and the European Commission (EC) during 2013 for the treatment of patients as indicated below:
Disease Geographic ApprovalsMultiple myeloma for patients who have received at leasttwo prior therapies, including lenalidomide and bortezomiband have demonstrated disease progression on or within 60days of completion of the last therapy.
* United States (Approved February 2013)
Relapsed and refractory multiple myeloma, in combinationwith dexamethasone, for adult patients who have receivedat least two prior therapies including both lenalidomide andbortezomib and have demonstrated disease progression onthe last therapy.
* European Union (Approved August 2013)
1 We received FDA approval for pomalidomide under the trade name POMALYST®. We received EC approval for pomalidomide under the trade name IMNOVID®.
POMALYST®/IMNOVID® is also being evaluated in multiple trials in various phases for expanded usage in multiple myeloma and in a phase II trial for systemic sclerosis. POMALYST® is distributed in the United States through contracted pharmacies under the POMALYST REMSTM program, which is a proprietary risk-management distribution program tailored specifically to provide for the safe and appropriate distribution and use of POMALYST®. Internationally, POMALYST®/IMNOVID® is distributed under mandatory risk-management distribution programs tailored to meet local authorities' specifications to provide for the safe and appropriate distribution and use of POMALYST®/IMNOVID®. These programs may vary by country and, depending upon the country and the design of the risk-management program, the product is sold through hospitals or retail pharmacies.

4
THALOMID® (thalidomide): In combination with dexamethasone, THALOMID® is marketed in the United States for patients with newly diagnosed multiple myeloma and for the acute treatment of the cutaneous manifestations of moderate to severe erythema nodosum leprosum (ENL) an inflammatory complication of leprosy and as maintenance therapy for prevention and suppression of the cutaneous manifestation of ENL recurrence. Thalidomide CelgeneTM in combination with melphalan and prednisone is marketed in the European Union as a first line treatment for patients with untreated multiple myeloma who are aged sixty-five years of age or older or ineligible for high dose chemotherapy.
THALOMID® is distributed in the United States under our THALOMID REMSTM program, which is a proprietary risk-management distribution program tailored specifically to provide for the safe and appropriate distribution and use of THALOMID®. Internationally, THALOMID® and Thalidomide CelgeneTM are also distributed under mandatory risk-management distribution programs tailored to meet local authorities' specifications to provide for the safe and appropriate distribution and use of THALOMID® and Thalidomide CelgeneTM. These programs may vary by country and, depending upon the country and the design of the risk-management program, the products are sold through hospitals or retail pharmacies.
ISTODAX® (romidepsin): ISTODAX® is approved in the United States for the treatment of cutaneous T-cell lymphoma (CTCL) in patients who have received at least one prior systemic therapy and for the treatment of PTCL in patients who have received at least one prior therapy. ISTODAX® has received orphan drug designation for the treatment of non-Hodgkin’s T-cell lymphomas, including CTCL and PTCL.
azacitidine for injection (generic version of VIDAZA®): After the launch of a generic version of VIDAZA® in the United States by a competitor in September 2013, we contracted with Sandoz AG to sell azacitidine for injection, which we supply. We recognize net product sales from sales of azacitidine for injection to Sandoz AG.
FOCALIN®, FOCALIN XR® and RITALIN LA®: We licensed the worldwide rights (excluding Canada) regarding certain chirally pure forms of methylphenidate for FOCALIN® and FOCALIN XR® to Novartis. We also licensed to Novartis the rights related to long-acting formulations of methylphenidate and dex-methylphenidate products which are used in FOCALIN XR® and RITALIN LA®. As a result of the grant of these licenses we receive royalties on sales of these products.
PRECLINICAL AND CLINICAL STAGE PIPELINE
Our preclinical and clinical-stage pipeline of new drug candidates and cell therapies is highlighted by multiple classes of small molecule, therapeutic agents designed to selectively regulate disease-associated genes and proteins. These product candidates are at various stages of preclinical and clinical development.
Oral anti-inflammatory agents: We are developing novel, orally administered small molecules that specifically target PDE4, an intracellular enzyme that modulates the production of multiple pro-inflammatory and anti-inflammatory mediators including interleukin-2 (IL-2), IL-10, IL-12, IL-23, INF-gamma, leukotrienes and nitric oxide synthase. OTEZLA® (apremilast), our lead product candidate in inflammation and immunology, has demonstrated statistically significant and clinically meaningful benefits in recent phase III trials in the treatment of psoriasis (ESTEEM 1 and 2 trials), previously treated psoriatic arthritis (PALACE 1, 2 and 3 trials) and psoriatic arthritis in treatment-naïve patients (PALACE 4 trial). OTEZLA® (apremilast) is also being evaluated in a phase III trial for ankylosing spondylitis and a phase II trial for Behçet's disease has recently been completed.
Next generation of thalidomide analogues: CC-122 and CC-220 represent novel compounds that are in phase I clinical trials for hematological and solid tumor cancers. They have been differentiated from previous compounds and have been developed based on our scientific understanding of thalidomide mechanism of action and protein homeostasis.
Cellular therapies: At CCT we are conducting research with stem cells derived from the human placenta as well as from the umbilical cord. CCT is our research and development division dedicated to fulfilling the promise of cellular technologies by developing products and therapies to significantly benefit patients. Our goal is to develop proprietary cell therapy products for the treatment of unmet medical needs.
Stem cell based therapies offer the potential to provide disease-modifying outcomes for serious diseases that lack adequate therapy. We have developed proprietary technology for collecting, processing and storing placental stem cells with potentially broad therapeutic applications in cancer, auto-immune diseases, and other inflammatory diseases.
We are developing our cellular therapies, PDA-001 (IV formulation) and PDA-002 (IM/SC injectable formulation), with the initiation of phase I safety and dose finding studies for Crohn’s disease and peripheral arterial diseases. We are also continuing research to define the potential of placental-derived stem cells and to characterize other placental-derived products.
CC-486: We have initiated two phase III trials of CC-486 that are currently enrolling to evaluate CC-486 in the treatment of MDS and AML. In addition, a phase I trial of CC-486 for the treatment of solid tumors is currently in progress.

5
Sotatercept (ACE-011) and ACE-536: We have collaborated with Acceleron Pharma, Inc. (Acceleron) to develop sotatercept and ACE-536 to treat anemia in patients with rare blood disorders. Several phase II trials are in progress to evaluate the use of sotatercept or ACE-536 in the treatment of anemia in patients with rare blood disorders and chronic kidney disease, beta-thalassemia and MDS.
mTOR pathway inhibitors: CC-223 and CC-115 target the important cancer pathway that is dysregulated in a large proportion of cancers. In particular, activity is being investigated in lymphomas, hepatocellular and prostate cancers in phase I/II trials.
Epigenetics: The current insights into molecular regulation of genetic information (Epigenetics) has the potential to transform human diseases. Celgene has two epigenetic modifiers on the market, VIDAZA® and ISTODAX®. In addition, we are collaborating with Epizyme Inc. (Epizyme) to develop EPZ-5676 for AML.
CC-292: CC-292 is in phase I clinical trials for the treatment of CLL and lymphomas. CC-292 is also in phase II combination studies with REVLIMID® and Rituxan in CLL’s.
PRODUCT DEVELOPMENT
We devote significant resources to research and development programs in an effort to discover and develop potential future product candidates. Research and development expenses amounted to $2.226 billion in 2013, $1.724 billion in 2012 and $1.600 billion in 2011. The product candidates in our pipeline are at various stages of preclinical and clinical development. The path to regulatory approval includes three phases of clinical trials in which we collect data to support an application to regulatory authorities to allow us to market a product for treatment of a specified disease. There are many difficulties and uncertainties inherent in research and development of new products, resulting in a high rate of failure. To bring a drug from the discovery phase to regulatory approval, and ultimately to market, takes many years and significant cost. Failure can occur at any point in the process, including after the product is approved, based on post-market factors. New product candidates that appear promising in development may fail to reach the market or may have only limited commercial success because of efficacy or safety concerns, inability to obtain necessary regulatory approvals, limited scope of approved uses, reimbursement challenges, difficulty or excessive costs of manufacture, alternative therapies or infringement of the patents or intellectual property rights of others. Uncertainties in the FDA approval process and the approval processes in other countries can result in delays in product launches and lost market opportunities. Consequently, it is very difficult to predict which products will ultimately be submitted for approval, which have the highest likelihood of obtaining approval and which will be commercially viable and generate profits. Successful results in preclinical or clinical studies may not be an accurate predictor of the ultimate safety or effectiveness of a drug or product candidate.
Phase I Clinical Trials
Phase I clinical trials begin when regulatory agencies allow initiation of clinical investigation of a new drug or product candidate and usually involve up to 80 healthy volunteers or subjects. The trials study a drug's safety profile, and may include a preliminary determination of a drug or product candidate's safe dosage range. The phase I clinical trial also determines how a drug is absorbed, distributed, metabolized and excreted by the body, and therefore the potential duration of its action. Phase I clinical trials generally take from one to three years to complete.
Phase II Clinical Trials
Phase II clinical trials are conducted on a limited number of subjects with the targeted disease. An initial evaluation of the drug's effectiveness on subjects is performed and additional information on the drug's safety and dosage range is obtained. Phase II clinical trials normally include up to several hundred subjects and may take as many as two to three years to complete.
Phase III Clinical Trials
Phase III clinical trials are typically controlled multi-center trials that involve a larger target patient population that normally consists of from several hundred to several thousand subjects to ensure that study results are statistically significant. During phase III clinical trials, physicians monitor subjects to determine efficacy and to gather further information on safety. These trials are generally global in nature and are designed to generate all of the clinical data necessary to submit an application for marketing approval to regulatory agencies. Phase III testing varies by disease state, but can often last from two to seven years.
Regulatory Review
If a product candidate successfully completes phase III clinical trials and is submitted to governmental regulators, such as the FDA in the United States or the EC in the European Union, the time to final marketing approval can vary from six months (for a U.S. filing that is designated for priority review by the FDA) to several years, depending on a number of variables,

6
such as the disease state, the strength and complexity of the data presented, the novelty of the target or compound, risk-management approval and whether multiple rounds of review are required for the agency to evaluate the submission. There is no guarantee that a potential treatment will receive marketing approval, or that decisions on marketing approvals or treatment indications will be consistent across geographic areas.
The current stage of development of our commercial stage products and new drug candidates in various areas of research are outlined in the following table:
Area of Research StatusEntered Current
StatusMultiple Myeloma (MM)REVLIMID® Relapsed/refractory . . . . . . . . . . . . . . . . . . Post-approval research1 2006
Newly diagnosed. . . . . . . . . . . . . . . . . . . . Phase III 2008Maintenance . . . . . . . . . . . . . . . . . . . . . . . Phase III 2004
POMALYST®/IMNOVID® Relapsed/refractory2 . . . . . . . . . . . . . . . . . Post-approval research1 February 2013THALOMID®/Thalidomide CelgeneTM Newly diagnosed. . . . . . . . . . . . . . . . . . . . Post-approval research1 2006Anti-CD38 Antibody: MOR2023 Relapsed/refractory . . . . . . . . . . . . . . . . . . Phase I 2011
Myelodysplastic Syndromes (MDS)VIDAZA® . . . . . . . . . . . . . . . . . . . . . . . . . . . . . . . . . . Post-approval research1 2004REVLIMID® Deletion 5q . . . . . . . . . . . . . . . . . . . . . . . . Post-approval research1 2005
Non-deletion 5q. . . . . . . . . . . . . . . . . . . . . Phase III 2010CC-486 Lower-risk . . . . . . . . . . . . . . . . . . . . . . . . . Phase III May 2013
Post HSC transplant . . . . . . . . . . . . . . . . . Phase I/II October 2013
Acute Myeloid Leukemia (AML)VIDAZA® AML (20%-30% blasts) (EU) . . . . . . . . . . Post-approval research1 2008
AML (>30% blasts) (EU) . . . . . . . . . . . . . Phase III 2010REVLIMID® & VIDAZA® . . . . . . . . . . . . . . . . . . . . . . . . . . . . . . . . . . Phase II September 2013CC-486 Post-induction AML maintenance. . . . . . . Phase III May 2013
Post HSC transplant . . . . . . . . . . . . . . . . . Phase I/II October 2013DOT 1L Inhibitor: EPZ-56764 . . . . . . . . . . . . . . . . . . . . . . . . . . . . . . . . . . Phase I 2012

7
Area of Research StatusEntered Current
StatusLymphomaISTODAX® Cutaneous T-cell lymphoma (US)5 . . . . . . Post-approval research1 2009
Peripheral T-cell lymphoma: Relapsed/refractory (US)5 . . . . . . . . . . . . . . . . . . . . . Post-approval research1 2011Peripheral T-cell lymphoma: Relapsed/refractory (Japan) . . . . . . . . . . . . . . . . . . . Phase II March 2013Peripheral T-cell lymphoma: First-line. . . Phase III January 2013
REVLIMID®Mantle cell lymphoma: Relapsed/refractory (US) . . . . . . . . . . . . . . . . . . . . . Post-approval research1 June 2013Mantle cell lymphoma: Relapsed/refractory (EU) . . . . . . . . . . . . . . . . . . . . . Phase II 2009Diffuse large B-cell: Maintenance . . . . . . Phase III 2009Diffuse large B-cell: Relapsed/refractory . Phase II/III 2010Relapsed/refractory indolent lymphoma. . Phase III September 2013Follicular lymphoma: First-line . . . . . . . . Phase III 2011Adult T-cell leukemia-lymphoma (Japan). Phase II 2012
CC-292 . . . . . . . . . . . . . . . . . . . . . . . . . . . . . . . . . . Phase I 2012CC-122 Diffuse large B-cell lymphoma. . . . . . . . . Phase Ib January 2014
Chronic Lymphocytic Leukemia (CLL)REVLIMID® Maintenance . . . . . . . . . . . . . . . . . . . . . . . Phase III 2009CC-292 . . . . . . . . . . . . . . . . . . . . . . . . . . . . . . . . . . Phase I 2012
Anemias
sotatercept (ACE-011)6Renal anemia with metabolic bonedisease . . . . . . . . . . . . . . . . . . . . . . . . . . . . Phase II 2010Diamond blackfan anemia . . . . . . . . . . . . Phase II 2012Beta-thalassemia . . . . . . . . . . . . . . . . . . . . Phase II 2012MDS . . . . . . . . . . . . . . . . . . . . . . . . . . . . . Phase II 2012
ACE-5366 Beta-thalassemia . . . . . . . . . . . . . . . . . . . . Phase II January 2013MDS . . . . . . . . . . . . . . . . . . . . . . . . . . . . . Phase II January 2013
Solid TumorsABRAXANE® Breast: Metastatic . . . . . . . . . . . . . . . . . . . Post-approval research1 2005
Breast: Metastatic (first-line, triplenegative) . . . . . . . . . . . . . . . . . . . . . . . . . . Phase II/III September 2013Non-small cell lung: Advanced (first-line) (US, Japan) . . . . . . . . . . . . . . . . . . . . Post-approval research1 2012Pancreatic: Advanced (first-line) (US) . . . Post-approval research1 September 2013Pancreatic: Advanced (first-line) (EU) . . . Post-approval research1 December 2013
Gastric: Metastatic (Japan)8 . . . . . . . . . . . Post-approval research1,7 February 2013CC-223 . . . . . . . . . . . . . . . . . . . . . . . . . . . . . . . . . . Phase I 2012CC-115 . . . . . . . . . . . . . . . . . . . . . . . . . . . . . . . . . . Phase I 2011CC-122 . . . . . . . . . . . . . . . . . . . . . . . . . . . . . . . . . . Phase I 2011CC-486 . . . . . . . . . . . . . . . . . . . . . . . . . . . . . . . . . . Phase I 2011

8
Area of Research StatusEntered Current
StatusAnti-Inflammatory
OTEZLA® (apremilast) Psoriatic arthritis . . . . . . . . . . . . . . . . . . . .Regulatory filing andapproval March 2013
Psoriasis . . . . . . . . . . . . . . . . . . . . . . . . . .Regulatory filing andapproval September 2013
Ankylosing spondylitis . . . . . . . . . . . . . . . Phase III 2012Behçet's disease. . . . . . . . . . . . . . . . . . . . . Phase II 2009Rheumatoid arthritis . . . . . . . . . . . . . . . . . Phase II 2010
POMALYST®/IMNOVID® Systemic sclerosis . . . . . . . . . . . . . . . . . . . Phase II March 2013CC-220 . . . . . . . . . . . . . . . . . . . . . . . . . . . . . . . . . . Phase I January 2013
Cellular TherapiesPDA-001 Crohn's disease . . . . . . . . . . . . . . . . . . . . . Phase I February 2013
PDA-002Peripheral artery disease/Diabetic footulcers . . . . . . . . . . . . . . . . . . . . . . . . . . . . . Phase I June 2013
UCB+HPDSC® Transplants . . . . . . . . . . . . . . . . . . . . . . . . Phase I April 2013
1 Includes Celgene-sponsored and Celgene-supported studies.2 In the United States, regulatory approval is based on pivotal phase II data; phase III program ongoing.3 In collaboration with MorphoSys AG.4 In collaboration with Epizyme.5 Filing for regulatory approval based on pivotal phase II data.6 In collaboration with Acceleron Pharma, Inc.7 For information on approved uses, please refer to approved product labeling.8 Trial conducted by licensee partner, Taiho Pharmaceuticals Co. Ltd.

9
PATENTS AND PROPRIETARY TECHNOLOGY
We consider intellectual property protection to be critical to our operations. For many of our products, in addition to compound (e.g., drug substance) and composition (e.g., drug product) patents, we hold polymorph, formulation, methods of treatment or use, and methods of manufacture patents that may extend exclusivity beyond the expiration of the compound patent or composition patent.
Key product exclusivities:
The following table shows the expected expiration dates in the United States and Europe of the last-to-expire period of exclusivity (primary regulatory approval or patent) related to the following drugs:
U.S.1 EuropeREVLIMID® brand drug 2027 2024
(U.S. and European Patent Office (EPO) drug substance patents)THALOMID® brand drug 2023 2019(Use and/or drug product patents)VIDAZA® brand drug 2011 2018(U.S. and EMA regulatory exclusivities only)ABRAXANE® brand drug 2026 2022(U.S. use and EPO use/drug product patents)ISTODAX® brand drug 2021 *(U.S. drug substance patents) POMALYST®/IMNOVID® brand drug 20242 20233
(U.S. use patent) (EMA regulatory exclusivity)FOCALIN® brand drug 2015 N/A(U.S. use patents)FOCALIN XR® brand drug 2015 2018(U.S. use patents)(EPO drug product patent)OTEZLA® brand drug 20244 20245
_____________________* Generally, 10 years regulatory exclusivity upon approval of submitted application for an orphan indication.
1 The patents covering these drugs include patents listed in the U.S. Orange Book. The date provided reflects the last-to-expire patent as listed in the U.S. Orange Book, which may not be the last date on which all relevant patents (e.g., polymorph and manufacturing patents) expire.
2 Application for patent term extension through June 2025 pending.3 Patent application pending, receipt of which would likely extend exclusivity beyond 2023.4 Application for patent term extension of up to five years will be made upon marketing approval.5 Patent grant pending, receipt of which would extend exclusivity through 2024.

10
The term of individual patents and patent applications will depend upon the legal term of the patents in the countries in which they are obtained. In the United States, the patent term is 20 years from the date of filing of the patent application although term extensions are available. We may obtain patents for certain products many years before marketing approval is obtained for those products. Because of the limited life of patents, which ordinarily commences prior to the commercial sale of the related product, the commercial value of the patent may be limited. However, we may be able to obtain patent term extensions upon marketing approval. For example, supplementary protection certificates (SPCs) on some of our products have been granted in a number of European countries, compensating in part for delays in obtaining marketing approval. Also, under the Hatch-Waxman Act, the term of a patent that covers an FDA-approved drug may also be eligible for patent term extension (for up to five years, but not beyond a total of 14 years from the date of product approval) as compensation for patent term lost during the FDA regulatory review process. When possible, depending upon the length of clinical trials and other factors involved in the filing of a new drug application (NDA) with the FDA, we expect to apply for patent term extensions for patents covering our drug products and their use in treating various diseases.
In most cases, our drugs are also covered in foreign countries by patents and patent applications that correspond to certain of those listed in the U.S. Orange Book. For example, patents related to the active pharmaceutical ingredient, uses and pharmaceutical compositions for most of our drugs have been granted in Europe. Although certain of the patents granted by the regulatory authorities of the European Union may expire at specific dates, patents granted in certain European countries, such as Spain, France, Italy, Germany and the United Kingdom, will extend beyond such European Union patent expiration date due to the SPCs granted in these countries for many of our drugs. The table above may also reflect patents in Europe that relate to certain polymorphic forms of the active pharmaceutical ingredient of our drugs.
Patent term extensions have been granted in other markets as well, including Australia and Korea, relative to certain of our patents related to REVLIMID®. Patent term extensions relative to lenalidomide have been granted in Japan. Further, patent term extensions relative to ABRAXANE® have been secured and/or are actively being sought in Australia, Japan, Russia and Korea. We are also considering alternative exclusivity strategies, mostly through international treaties, in a variety of countries throughout Latin America.
The existence of issued patents does not guarantee our right to practice the patented technology or commercialize the patented product. Third parties may have or obtain rights to patents which could be used to prevent or attempt to prevent us from commercializing the patented product candidates. Patents relating to pharmaceutical, biopharmaceutical and biotechnology products, compounds and processes, such as those that cover our existing compounds, products and processes and those that we will likely file in the future, do not always provide complete or adequate protection. Future litigation or re-examination proceedings (including oppositions and invalidity proceedings) regarding the enforcement or validity of our existing patents or any future patents could invalidate such patents or substantially reduce their protection.
In total, we own or have exclusively licensed 480 issued U.S. patents. In addition, approximately 530 additional pending U.S. patent applications are owned by or exclusively licensed to us. We have a policy to seek broad global patent protection for our inventions and have foreign patent rights corresponding to most of our U.S. patents.
Our patents are subject to challenge by generic drug companies and others for a variety of reasons. For more information regarding challenges to certain of our patents, see Item 1A. "Risk Factors” and Item 3. "Legal Proceedings."
Trade secret strategies and intellectual property rights in our brand names, logos and trademarks are also important to our business. We maintain both registered and common law trademarks. Common law trademark protection typically continues where and for as long as the mark is used. Registered trademarks continue in each country for as long as the trademark is registered.
GOVERNMENTAL REGULATION
General: Regulation by governmental authorities in the United States and other countries is a significant factor in the manufacture and marketing of pharmaceuticals and in our ongoing research and development activities. Our therapeutic products require regulatory approval by governmental agencies. Human therapeutic products are subject to rigorous preclinical testing and clinical trials and other pre-marketing and post-marketing approval requirements of the FDA and regulatory authorities in other countries. In the United States, various federal and, in some cases, state statutes and regulations also govern, or impact the manufacturing, testing for safety and effectiveness, labeling, storage, record-keeping and marketing of such products. The lengthy process of seeking required approvals and the continuing need for compliance with applicable statutes and regulations, require the expenditure of substantial resources. Regulatory approval, if and when obtained, may be limited in scope which may significantly limit the uses for which a product may be promoted. Further, approved drugs, as well as their manufacturers, are subject to ongoing post-marketing review, inspection and discovery of previously unknown problems with such products or the manufacturing or quality control procedures used in their production, which may result in restrictions on their manufacture, sale or use or in their withdrawal

11
from the market. Any failure or delay by us, our suppliers of manufactured drug product, collaborators or licensees, in obtaining regulatory approvals could adversely affect the marketing of our products and our ability to receive product revenue, license revenue or profit sharing payments. For more information, see Item 1A. “Risk Factors.”
Clinical Development: Before a product may be administered to human subjects, it must undergo preclinical testing. Preclinical tests include laboratory evaluation of a product candidate's chemistry and biological activities and animal studies to assess potential safety and efficacy. The results of these studies must be submitted to the FDA as part of an Investigational New Drug (IND) application which must be reviewed by the FDA primarily for safety considerations before clinical trials in humans can begin.
Typically, clinical trials in humans involve a three-phase process as previously described under “- Product Development.”
In some cases, further studies beyond the three-phase clinical trial process described above are required as a condition for an NDA or biologics license application (BLA) approval. The FDA requires monitoring of all aspects of clinical trials and reports of all adverse events must be made to the FDA. The FDA may also require the conduct of pediatric studies for the drug and indication either before or after submission of an NDA.
FDA Review and Approval: The results of the preclinical testing and clinical trials are submitted to the FDA as part of an NDA or BLA for evaluation to determine if there is substantial evidence that the product is sufficiently safe and effective to warrant approval. In responding to an NDA or BLA, the FDA may grant marketing approval, deny approval, or request additional information, including data from new clinical trials.
Expedited Programs for Serious Conditions: The FDA has developed four distinct approaches to make new drugs available as rapidly as possible in cases where there is no available treatment or there are advantages over existing treatments.
The FDA may grant “accelerated approval” to products that have been studied for their safety and effectiveness in treating serious or life-threatening illnesses and that provide meaningful therapeutic benefit to patients over existing treatments. For accelerated approval, the product must have an effect on a surrogate endpoint or an intermediate clinical endpoint that is considered reasonably likely to predict the clinical benefit of a drug, such as an effect on irreversible morbidity and mortality. When approval is based on surrogate endpoints or clinical endpoints other than survival or morbidity, the sponsor will be required to conduct additional post-approval clinical studies to verify and describe clinical benefit. These studies are known as confirmatory trials. Approval of a drug may be withdrawn or the labeled indication of the drug changed if these trials fail to verify clinical benefit or do not demonstrate sufficient clinical benefit to justify the risks associated with the drug.
The FDA may grant “fast track” status to products that treat serious diseases or conditions and fill an unmet medical need. Fast track is a process designed to facilitate the development and expedite the review of such products by providing, among other things, more frequent meetings with the FDA to discuss the product's development plan, more frequent written correspondence from the FDA about trial design, eligibility for accelerated approval if relevant criteria are met, and rolling review, which allows submission of individually completed sections of an NDA or BLA for FDA review before the entire submission is completed. Fast track status does not ensure that a product will be developed more quickly or receive FDA approval.
“Breakthrough Therapy” designation is a process designed to expedite the development and review of drugs that are intended to treat a serious condition and preliminary clinical evidence indicates that the drug may demonstrate substantial improvement over available therapy on a clinically significant endpoint. For drugs and biologics that have been designated as Breakthrough Therapies, robust FDA-sponsor interaction and communication can help to identify the most efficient and expeditious path for clinical development while minimizing the number of patients placed in ineffective control regimens.
The FDA may grant “priority review” status to products that, if approved, would provide significant improvement in the safety or effectiveness of the treatment, diagnosis, or prevention of serious conditions. Priority review is intended to reduce the time it takes for the FDA to review an NDA or BLA, with the goal to take action on the application within six months.
Orphan Drug Act: Pursuant to the United States Orphan Drug Act, a sponsor may request that the FDA designate a drug intended to treat a “rare disease or condition” as an “orphan drug.” A “rare disease or condition” is defined as one which affects less than 200,000 people in the United States, or which affects more than 200,000 people, but for which the cost of developing and making available the product is not expected to be recovered from sales of the product in the United States. Upon the approval of the first NDA or BLA for a drug designated as an orphan drug for a specified indication, the sponsor of that NDA or BLA is entitled to seven years of exclusive marketing rights in the United States unless the sponsor cannot assure the availability of sufficient quantities to meet the needs of persons with the disease. However, orphan drug status is particular to the approved indication and does not prevent another company from seeking approval of an off-patent drug that has other labeled indications that are not under orphan or other exclusivities. Orphan drugs may also be eligible for federal income tax credits for costs associated with

12
the drugs' development. In order to increase the development and marketing of drugs for rare disorders, regulatory bodies outside the United States have enacted regulations similar to the Orphan Drug Act.
Review and Approval Outside of the United States: Approval procedures must be undertaken in virtually every other country comprising the market for our products. The approval procedure and the time required for approval vary from country to country and may involve additional testing. In certain countries such as the EU countries, Switzerland, Canada and Australia, regulatory requirements and approval processes are similar to those in the United States, where approval decisions by regulators are based on the regulators’ review of the results of clinical trials performed for specific indications. Other countries may have a less comprehensive review process in terms of data requirements and may rely on prior marketing approval from a foreign regulatory authority in the United States or the EU.
Manufacturing Quality Control: Among the conditions for NDA or BLA approval is the requirement that the prospective manufacturer’s quality control and manufacturing procedures continually conform with the FDA’s current Good Manufacturing Practice (cGMP) regulations (which are regulations established by the FDA governing the manufacture, processing, packing, storage and testing of drugs and biologics intended for human use). In complying with cGMP, manufacturers must devote substantial time, money and effort in the areas of production, quality control and quality assurance to maintain compliance. Material changes in manufacturing equipment, location or process, may result in additional regulatory review and approval. The FDA, the EC and other regulatory agencies conduct periodic visits to inspect equipment, facilities, and processes following the initial approval of a product. If a manufacturing facility is not in substantial compliance with the applicable regulations and requirements imposed when the product was approved, regulatory enforcement action may be taken, which may include a warning letter or an injunction against shipment of products from the facility and/or recall of products previously shipped.
Post-approval Review and Enforcement: Regulatory authorities closely review and regulate the marketing and promotion of drug and biologic products. In most countries, regulatory approval is granted for a specified indication and is required before marketing or promoting a product for that indication. Regulatory authorities may take enforcement action against a company for promoting unapproved uses of a product ("off-label promotion") or for other violations of advertising and labeling laws and regulations.
When an NDA or BLA is approved, the NDA or BLA holder must, among other things, (a) employ a system for obtaining reports of drug adverse events and side effects associated with the drug and make appropriate submissions to the FDA and (b) timely advise the FDA if any marketed product fails to adhere to specifications established by the NDA or BLA. If the FDA concludes that a drug previously shown to be effective can be safely used only if distribution or use is restricted, the FDA will require post-marketing restrictions as necessary to assure safe use. The sponsor may be required to establish systems to assure use of the product under safe conditions. The FDA may require the drug sponsor to implement REMS to ensure that benefits of a drug outweigh risks and that safety protocols are adhered to.
In addition, a sponsor of a drug product has ongoing reporting obligations concerning assessment of serious risks associated with the drug. Following assessment of these reports, regulatory authorities can require product label updates to reflect new safety data or warnings. If the FDA or other regulatory authorities become aware of new safety information, they can also require us to conduct studies or clinical trials to assess the potential for a serious risk. The FDA and other regulatory authorities can also impose marketing restrictions, including the suspension of marketing or complete withdrawal of a product from the market.
The FDA may issue publicly available warning letters and non-compliance letters, which may require corrective actions, including modification of advertising or other corrective communications to consumers or healthcare professionals.
Failure to comply with applicable FDA or other regulatory agency requirements can result in enforcement actions, such as license revocation or suspension; orders for retention, recall, seizure or destruction of product; cessation of manufacturing; injunctions; inspection warrants; search warrants; civil penalties, including fines based on disgorgement; restitution; and criminal prosecution.
Other Regulations: We are also subject to various federal and state laws, as well as foreign laws, pertaining to healthcare “fraud and abuse,” including anti-kickback laws and false claims laws. Anti-kickback laws make it illegal to solicit, offer, receive or pay any remuneration in exchange for or to induce the referral of business, including the purchase or prescription of a particular drug that is reimbursed by a state or federal program. False claims laws prohibit knowingly and willingly presenting, or causing to be presented for payment to third-party payers (including Medicare and Medicaid) any claims for reimbursed drugs or services that are false or fraudulent, claims for items or services not provided as claimed or claims for medically unnecessary items or services. Our activities related to the sale and marketing of our products may be subject to scrutiny under these laws. Violations of fraud and abuse laws may be punishable by criminal and/or civil sanctions, including fines and civil monetary penalties, as well as the possibility of exclusion from federal healthcare programs (including Medicare and Medicaid).

13
We are also subject to regulation under the Occupational Safety and Health Act, the Toxic Substances Control Act, the Resource Conservation and Recovery Act and other federal, state and local laws, rules and regulations. Our research and development activities may involve the controlled use of hazardous materials, chemicals, biological materials and various radioactive compounds. We believe our procedures comply with the standards prescribed by federal, state or local laws, rules and regulations; however, the risk of injury or accidental contamination cannot be completely eliminated.
Additionally, the U.S. Foreign Corrupt Practices Act (FCPA) prohibits U.S. corporations and their representatives from offering, promising, authorizing or making payments to any foreign government official, government staff member, political party or political candidate, in an attempt to obtain or retain business abroad. The scope of the FCPA includes interactions with certain healthcare professionals in many countries. Other countries have enacted similar anti-corruption laws and regulations to which our activities are subject.
COMPETITION
Our current products and products under development face competition from other innovative drugs and, in some cases, generic drugs. The relative speed with which we develop new products, complete clinical trials, obtain regulatory approvals, receive pricing and reimbursement approvals, and finalize manufacturing and distribution arrangements, and market our products are critical factors in gaining a competitive advantage. Competition among approved products depends, among other things, on product efficacy, safety, convenience, reliability, availability, price, third-party reimbursement, sales and promotional activities, product liability issues and patent and non-patent exclusivity. For additional information, see Item 1A. "Risk Factors.”
SIGNIFICANT ALLIANCES
We have entered into a variety of alliances in the ordinary course of our business. Although we do not consider any individual alliance to be material, a brief description of certain of the more notable alliances are identified in Note 17 of Notes to Consolidated Financial Statements contained in this Annual Report on Form 10-K.
MANUFACTURING
We own and operate an FDA approved manufacturing facility in Zofingen, Switzerland which produces the active pharmaceutical ingredient (API) for REVLIMID® and THALOMID® and have contracted with FDA approved third-party contract manufacturers to provide backup API manufacturing services for these products. Manufacturing services for REVLIMID® and THALOMID®, which consist of formulation, encapsulation, packaging, warehousing and distribution, are performed at our FDA approved drug product manufacturing facility in Boudry, Switzerland. We have contracted with a number of third-party drug product manufacturing service providers and packaging service providers to provide backup manufacturing and packaging services. All of our third-party service providers are approved by the regulatory authorities for the geographies that they serve.
The API for ABRAXANE® is generally available from multiple sources and is normally available in quantities adequate to meet our needs. Manufacturing services for ABRAXANE® are performed at our manufacturing facility in Arizona and by an approved third party contract manufacturing facility.
The API for VIDAZA® is supplied by three suppliers. Manufacturing and packaging services are provided by a number of third-party service providers.
The API for the azacitidine for injection (generic version of VIDAZA®) is supplied by a single -source supplier. Manufacturing and packaging services are provided by a single manufacturer.
The API for POMALYST®/IMNOVID® is supplied by a single-source supplier with primary manufacturing services being performed at our Boudry manufacturing facility.We have contracted with a number of third-party drug product manufacturing service providers and packaging service providers to provide backup manufacturing and packaging services for this product.
The API for ISTODAX® is supplied by a single-source supplier. Manufacturing and packaging services are provided by a number of third-party service providers.
The API for OTEZLA® (apremilast) is supplied by two suppliers with manufacturing services being performed at our Boudry manufacturing facility. We expect to utilize third-party service providers for backup manufacturing and packaging services for this product.
The API for FOCALIN® and FOCALIN XR® is currently obtained from two suppliers, and we rely on a single manufacturer for the tableting and packaging of FOCALIN® finished product.

14
CCT currently operates an FDA registered facility in Cedar Knolls, New Jersey for the recovery and storage of cord blood and placental stem cells for LifeBankUSA®. In addition, our Warren, New Jersey facility is FDA registered for production of PDA-001 and PDA-002, which are culture-expanded placenta-derived stem cell products, under cGMP to supply clinical studies. This is a multi-purpose facility capable of supporting other products.
INTERNATIONAL OPERATIONS
We have significant operations outside the United States conducted both through our subsidiaries and through distributors. Revenues from operations outside the United States were $2.632 billion, or 40.5% of total revenues in 2013, $2.338 billion, or 42.4% of total revenues in 2012 and $1.981 billion, or 40.9% of total revenues in 2011. The decrease in the percentage of total revenues from outside of the United States in 2013 compared to 2012 was primarily due to increased U.S. sales of ABRAXANE® resulting from the October 2012 and September 2013 FDA approvals for treatment of NSCLC and pancreatic cancer, respectively, as well as the U.S. launch of POMALYST® resulting from the February 2013 FDA approval for treatment of relapsed and refractory multiple myeloma.
Our international headquarters and a drug product manufacturing facility which performs formulation, encapsulation, packaging, warehousing and distribution are located in Boudry, Switzerland. We continue to expand our international regulatory, clinical and commercial infrastructure and currently conduct our international operations in over 50 countries and have sales in over 70 countries and regions including Europe, Latin America, Middle East, Asia/Pacific and Canada.
Our international operations are subject to risks associated with operating on an international basis including currency fluctuations, price and exchange controls and other restrictive governmental actions. Our international operations are also subject to government-imposed constraints, including laws on pricing, reimbursement and access to our products. Depending on the direction of change relative to the U.S. dollar, foreign currency values can increase or decrease the reported dollar value of our net assets and results of operations. While we cannot predict with certainty future changes in foreign exchange rates or the effect they will have, we attempt to mitigate their impact through operational means and by using foreign currency derivative instruments. See the discussions under Item 7A. "Quantitative and Qualitative Disclosures About Market Risk."
SALES AND COMMERCIALIZATION
We promote our brands globally through our commercial organization which supports our currently marketed brands and prepares for the launches of new products, as well as new indications for existing products. We have a team of dedicated market access professionals to help physicians, patients and payers understand the value our products deliver. Given our goal to ensure that patients who might benefit from our therapies have the opportunity to do so and given the complex reimbursement environment in the United States, we offer the services of Celgene Patient Support® or similar outside services to serve as a dedicated, central point of contact for patients and healthcare professionals who use or prescribe Celgene products. Celgene Patient Support® is a free service that helps patients and healthcare professionals navigate the challenges of reimbursement, providing information about co-pay assistance and answering questions about obtaining Celgene products.
In most countries, we promote our products through our own sales organizations. In some countries, particularly in Latin America, we partner with third-party distributors. Generally, we distribute our products through commonly used channels in local markets. However, REVLIMID®, POMALYST®/IMNOVID® and THALOMID®/Thalidomide CelgeneTM are distributed under mandatory risk-management distribution programs tailored to meet local authorities' specifications to provide for their safe and appropriate distribution and use.
EMPLOYEES
As of December 31, 2013, we had 5,100 full-time employees, of whom 2,110 were engaged primarily in research and development activities, 1,690 engaged primarily in sales and commercialization activities, 470 engaged primarily in manufacturing, and the remaining 830 engaged primarily in executive and general and administrative activities. The number of full-time employees in our international operations has grown from 1,834 at the end of 2012 to 1,933 at the end of 2013. We also employ a number of part-time employees and maintain consulting arrangements with a number of researchers at various universities and other research institutions around the world.
AVAILABLE INFORMATION
Our Current Reports on Form 8-K, Quarterly Reports on Form 10-Q and Annual Reports on Form 10-K are electronically filed with or furnished to the Securities and Exchange Commission (SEC), and all such reports and amendments to such reports have been and will be made available, free of charge, through our website (http://www.celgene.com) as soon as reasonably practicable after such submission to the SEC. Such reports will remain available on our website for at least 12 months. The contents of our website are not incorporated by reference into this Annual Report on Form 10-K. The public may read and copy any materials filed by us with the SEC at the SEC's Public Reference Room at 100 F Street, NW, Washington, D.C. 20549.
15
The public may obtain information on the operation of the Public Reference Room by calling the SEC at 1-800-SEC-0330. The SEC maintains an Internet site (http://www.sec.gov) that contains reports, proxy and information statements, and other information regarding issuers that file electronically with the SEC.
DISCLOSURE PURSUANT TO SECTION 219 OF THE IRAN THREAT REDUCTION AND SYRIA HUMAN RIGHTS ACT OF 2012
Section 219 of the Iran Threat Reduction and Syria Human Rights Act of 2012 (ITRSHRA) added Section 13(r) to the Securities Exchange Act of 1934, as amended, which requires, among other things, disclosure by an issuer, in its annual or quarterly reports, as applicable, whether it or any of its affiliates knowingly conducted, without specific authority from a U.S. federal department or agency, any transaction or dealing with the Government of Iran, which includes, without limitation, any person or entity owned or controlled, directly or indirectly, by the Government of Iran or any of its political subdivisions, agencies or instrumentalities. Neither Celgene nor, to its knowledge, any of its affiliates engaged in activities during 2013 that are required to be disclosed pursuant to ITRSHRA.
FORWARD-LOOKING STATEMENTS
Certain statements contained or incorporated by reference in this Annual Report on Form 10-K are considered forward-looking statements (within the meaning of the Private Securities Litigation Reform Act of 1995, Section 27A of the Securities Act of 1933, as amended, and Section 21E of the Securities Exchange Act of 1934, as amended) concerning our business, results of operations, economic performance and/or financial condition, based on management's current expectations, plans, estimates, assumptions and projections. Forward-looking statements are included, for example, in the discussions about:
• strategy;• new product discovery and development;• current or pending clinical trials;• our products' ability to demonstrate efficacy or an acceptable safety profile;• actions by the FDA and other regulatory authorities;• product manufacturing, including our arrangements with third-party suppliers;• product introduction and sales;• royalties and contract revenues;• expenses and net income;• credit and foreign exchange risk management;• liquidity;• asset and liability risk management;• the outcome of litigation and other proceedings;• intellectual property rights and protection;• economic factors;• competition; and• operational and legal risks.
Any statements contained in this report that are not statements of historical fact may be deemed forward-looking statements. Forward-looking statements generally are identified by the words "expects," "anticipates," "believes," "intends," "estimates," "aims," "plans," "may," "could," "will," "will continue," "seeks," "should," "predict," "potential," "outlook," "guidance," "target," "forecast," "probable," "possible" or the negative of such terms and similar expressions. Forward-looking statements are subject to change and may be affected by risks and uncertainties, most of which are difficult to predict and are generally beyond our control. Forward-looking statements speak only as of the date they are made, and we undertake no obligation to update any forward-looking statement in light of new information or future events, although we intend to continue to meet our ongoing disclosure obligations under the U.S. securities laws and other applicable laws.
We caution you that a number of important factors could cause actual results or outcomes to differ materially from those expressed in, or implied by, the forward-looking statements, and therefore you should not place too much reliance on them. These factors include, among others, those described herein, under "Risk Factors" and elsewhere in this Annual Report and in our other public reports filed with the SEC. It is not possible to predict or identify all such factors, and therefore the factors that are noted are not intended to be a complete discussion of all potential risks or uncertainties that may affect forward-looking statements. If these or other risks and uncertainties materialize, or if the assumptions underlying any of the forward-looking statements prove incorrect, our actual performance and future actions may be materially different from those expressed in, or implied by, such forward-looking statements. We can offer no assurance that our estimates or expectations will prove accurate or that we will be able to achieve our strategic and operational goals.

16
ITEM 1A. RISK FACTORS
The following describes the major risks to our business and should be considered carefully. Any of these factors could significantly and negatively affect our business, prospects, financial condition, operating results or credit ratings, which could cause the trading prices of our equity securities to decline. The risks described below are not the only risks we may face. Additional risks and uncertainties not presently known to us, or risks that we currently consider immaterial, could also negatively affect us. Our operating results are subject to significant fluctuations. Our operating results may fluctuate from quarter to quarter and year to year for a number of reasons, including the risks discussed elsewhere in this “Risk Factors” section. Events such as a delay in product development or a revenue shortfall may cause financial results for a particular period to be below our expectations. In addition, we have experienced and may continue to experience fluctuations in our quarterly operating results due to the timing of charges that we may take. We have recorded, or may be required to record, charges that include development milestone and license payments under collaboration and license agreements and amortization of acquired intangibles and other acquisition related charges.
Our revenues are also subject to foreign exchange rate fluctuations due to the global nature of our operations. We recognize foreign currency gains or losses arising from our operation in the period in which we incur those gains or losses. Although we utilize foreign currency forward contracts and option contracts to manage foreign currency risk, our efforts to reduce currency exchange losses may not be successful. As a result, currency fluctuation among our reporting currency, the U.S. dollar, and the currencies in which we do business will affect our operating results. Our net income may also fluctuate due to the impact of charges we may be required to take with respect to foreign currency and other hedge transactions. In particular, we may incur higher than expected charges from hedge ineffectiveness or from the termination of a hedge arrangement.
We are dependent on the continued commercial success of our primary products, REVLIMID®, VIDAZA®, THALOMID®, ABRAXANE® and POMALYST ®/IMNOVID ®. Currently, our business is largely dependent on the commercial success of REVLIMID®, VIDAZA®, THALOMID®, ABRAXANE®
and POMALYST®/IMNOVID®. The success of these products depends on acceptance by regulators, key opinion leaders, physicians, and patients as effective drugs with certain advantages over other therapies. A number of factors, as discussed in greater detail below, may adversely impact the degree of acceptance of these products, including their efficacy, safety, price and benefits over competing products, as well as the reimbursement policies of third-party payers, such as government and private insurance plans. If unexpected adverse events are reported in connection with the use of any of these products, physician and patient acceptance of the product could deteriorate and the commercial success of such product could be adversely affected. We are required to report to the FDA or similar bodies in other countries events associated with our products relating to death or serious injury. Adverse events could result in additional regulatory controls, such as a requirement for costly post-approval clinical studies or revisions to our approved labeling which could limit the indications or patient population for a product or could even lead to the withdrawal of a product from the market. THALOMID® is known to be toxic to the human fetus and exposure to the drug during pregnancy could result in significant deformities. REVLIMID® and POMALYST®/IMNOVID® are also considered toxic to the human fetus and their respective labels contain warnings against use by pregnant women. While we have restricted distribution systems for THALOMID®, REVLIMID®, and POMALYST®/IMNOVID®, and endeavor to educate patients regarding the potential known adverse events, including pregnancy risks, we cannot ensure that all such warnings and recommendations will be complied with or that adverse events resulting from non-compliance will not occur. Our future commercial success depends on gaining regulatory approval for products in development, and obtaining approvals for our current products for additional indications. The testing, manufacturing and marketing of our products require regulatory approvals, including approval from the FDA and similar bodies in other countries. Certain of our pharmaceutical products, such as FOCALIN®, also require authorization by the U.S. Drug Enforcement Agency (DEA) of the U.S. Department of Justice. Our future growth would be negatively impacted if we fail to obtain timely, or at all, requisite regulatory approvals in the United States and internationally for products in development and approvals for our existing products for additional indications.

17
The principal risks to obtaining and maintaining regulatory approvals are as follows:
• In general, preclinical tests and clinical trials can take many years and require the expenditure of substantial resources, and the data obtained from these tests and trials may not lead to regulatory approval;
• Delays or rejections may be encountered during any stage of the regulatory process if the clinical or other data fails to demonstrate compliance with a regulatory agency’s requirements for safety, efficacy and quality;
• Requirements for approval may become more stringent due to changes in regulatory agency policy or the adoption of new regulations or legislation;
• Even if a product is approved, the scope of the approval may significantly limit the indicated uses for which the product may be marketed and may impose significant limitations in the nature of warnings, precautions and contra-indications that could materially affect the sales and profitability of the product;
• After a product is approved, the FDA or other international regulatory agency may withdraw or modify an approval in a significant manner or request that we perform additional clinical trials or change the labeling of the product due to a number of reasons, including safety concerns, adverse events and side effects;
• Products, such as REVLIMID® and POMALYST®/IMNOVID®, that are subject to accelerated approval can be subject to an expedited withdrawal if post-marketing restrictions are not adhered to or are shown to be inadequate to assure safe use, or if the drug is shown to be unsafe or ineffective under its conditions of use;
• Guidelines and recommendations published by various governmental and non-governmental organizations can reduce the use of our approved products;
• Approved products, as well as their manufacturers, are subject to continuing and ongoing review by regulatory agencies, and the discovery of previously unknown problems with these products or the failure to comply with manufacturing or quality control requirements may result in restrictions on the manufacture, sale or use of a product or its withdrawal from the market; and
• Changes in regulatory agency policy or the adoption of new regulations or legislation could impose restrictions on the sale of our approved products.
If we fail to comply with laws or government regulations or policies our business could be adversely affected.
The discovery, preclinical development, clinical trials, manufacturing, risk evaluation and mitigation strategies (such as our REMS® program), marketing and labeling of pharmaceuticals and biologics are all subject to extensive laws and government regulations and policies. In addition, individual states, acting through their attorneys general, are increasingly seeking to regulate the marketing of prescription drugs under state consumer protection and false advertising laws. If we fail to comply with the laws and regulations regarding the promotion and sale of our products, appropriate distribution of our products under our restricted distribution systems, off-label promotion and the promotion of unapproved products, government agencies may bring enforcement actions against us that could inhibit our commercial capabilities and result in significant penalties.
Other matters that may be the subject of governmental or regulatory action which could adversely affect our business include laws, regulations and policies governing:
• protection of the environment, privacy, healthcare reimbursement programs, and competition;
• parallel importation of prescription drugs from outside the United States at prices that are regulated by the governments of various foreign countries; and
• premature or mandated disclosures of clinical trial or other data.
The FDA’s Center for Biologics Evaluation and Research currently regulates human tissue or cells intended for transplantation, implantation, infusion or transfer to a human, requiring, among other things, cell and tissue establishments to screen and test donors, prepare and follow written procedures for the prevention of the spread of communicable disease and register with FDA. Through our CCT subsidiary, we are licensed in certain states to operate our allogeneic and private stem cell banking businesses. If we are unable to maintain those licenses or are unable to obtain licenses in other states that may adopt similar licensing requirements, those businesses could be adversely affected.

18
Sales of our products will be significantly reduced if access to and reimbursement for our products by governmental and other third-party payers is reduced or terminated. Sales of our current and future products depend, in large part, on the conditions under which our products are paid for by health maintenance, managed care, pharmacy benefit and similar health care management organizations, or reimbursed by government health administration authorities, private health coverage insurers and other third-party payers. Generally, in Europe and other countries outside the United States, the government-sponsored healthcare system is the primary payer of patients’ healthcare costs. These health care management organizations and third-party payers are increasingly challenging the prices charged for medical products and services, seeking to implement cost-containment programs, including price controls, restrictions on reimbursement and requirements for substitution of generic products. Our products continue to be subject to increasing price and reimbursement pressure due to price controls imposed by governments in many countries; increased difficulty in obtaining and maintaining satisfactory drug reimbursement rates; and the tendency of governments and private health care providers to favor generic pharmaceuticals. In addition, governmental and private third-party payers and purchasers of our products may restrict access to formularies or otherwise discourage use of our products. Limitations on patient access to our drugs, adoption of price controls and cost-containment measures could adversely affect our business. In addition, our operating results may also be affected by distributors seeking to take advantage of price differences among various markets by buying our products on low cost markets for resale in higher cost markets.
The Affordable Care Act will affect our profitability.
In March 2010, the Patient Protection and Affordable Care Act, as amended by the Health Care and Education Reconciliation Act (together, the Affordable Care Act), was enacted in the United States. The provisions of the Affordable Care Act became effective over various periods from 2010 through 2014. We expect that the rebates, discounts, taxes and other costs resulting from the Affordable Care Act will have a significant effect on our profitability in the future. In addition, potential reductions of the per capita rate of growth in Medicare spending under the Affordable Care Act, could potentially limit access to certain treatments or mandate price controls for our products. Similarly, the promulgation of new regulations concerning rebates, discounts, taxes and other costs, or the interpretation and enforcement of new or existing regulations by government agencies could affect our profitability in ways that are difficult to predict. Our ability to sell our products to hospitals in the United States depends in part on our relationships with group purchasing organizations.
Many existing and potential customers for our products become members of group purchasing organizations (GPOs). GPOs negotiate pricing arrangements and contracts, sometimes on an exclusive basis, with medical supply manufacturers and distributors and these negotiated prices are made available to a GPO’s affiliated hospitals and other members. If we are not one of the providers selected by a GPO, affiliated hospitals and other members may be less likely to purchase our products, and if the GPO has negotiated a strict sole source, market share compliance or bundling contract for another manufacturer’s products, we may be precluded from making sales to members of the GPO for the duration of that contractual arrangement. Our failure to enter into or renew contracts with GPOs may cause us to lose market share and could adversely affect our sales. Our long-term success depends, in part, on intellectual property protection. Our success depends, in part, on our ability to obtain and enforce patents, protect trade secrets, obtain licenses to technology owned by third parties and to conduct our business without infringing upon the proprietary rights of others. The patent positions of pharmaceutical and biopharmaceutical companies, including ours, can be uncertain and involve complex legal and factual questions. There can be no assurance that if claims of any of our owned or licensed patents are challenged by one or more third parties a court or patent authority ruling on such challenge will determine that our patent claims are valid and enforceable. If a third party is found to have rights covering products or processes used by us, we could be forced to cease using the products or processes covered by the disputed rights, be subject to significant liabilities to such third party and/or be required to license technologies from such third party. Lawsuits involving patent claims are costly and could affect our results of operations, result in significant expense and divert the attention of managerial and scientific personnel. For more information on challenges to certain of our patents, see “Legal Proceedings” contained elsewhere in this report.
In addition, we do not know whether any of our owned or licensed pending patent applications, which have not already been allowed, will result in the issuance of patents or, if patents are issued, whether they will be dominated by third-party patent rights, provide significant proprietary protection or commercial advantage or be circumvented, opposed, invalidated, rendered unenforceable or infringed by others. Our intellectual property rights may be affected in ways that are difficult to anticipate at this time under the provisions of the

19
America Invents Act enacted in 2011. This law includes a number of important changes to established practices, including transition to a first-to-file system, post-grant review for issued patents, and various procedural changes. The scope of these changes and the lack of experience with their practical implementation may result in uncertainty over the next few years. Also, different countries have different procedures for obtaining patents and patents issued by different countries provide different degrees of protection against the use of a patented invention by others. There can be no assurance that the issuance to us in one country of a patent covering an invention will be followed by the issuance in other countries of patents covering the same invention or that any judicial interpretation of the validity, enforceability or scope of the claims in a patent issued in one country will be similar to or recognized by the judicial interpretation given to a corresponding patent issued in another country.
The United States Patent and Trademark Office and various foreign governmental patent agencies require compliance with a number of procedural, documentary, fee payment and other similar provisions during the patent application process. While an inadvertent lapse can in many cases be cured by payment of a late fee or by other means in accordance with the applicable rules, there are situations in which noncompliance can result in abandonment or lapse of the patent or patent application, resulting in partial or complete loss of patent rights in the relevant jurisdiction.
We also rely upon unpatented, proprietary and trade secret technology that we seek to protect, in part, by confidentiality agreements with our collaborative partners, employees, consultants, outside scientific collaborators, sponsored researchers and other advisors. Despite precautions taken by us, there can be no assurance that these agreements provide meaningful protection, that they will not be breached, that we would have adequate remedies for any such breach or that our proprietary and trade secret technology will not otherwise become known to others or found to be non-proprietary.
We receive confidential and proprietary information from collaborators, prospective licensees and other third parties. In addition, we employ individuals who were previously employed at other biotechnology or pharmaceutical companies. We may be subject to claims that we or our employees, consultants or independent contractors have inadvertently or otherwise used or disclosed confidential information of these third parties or our employees’ former employers. Litigation may be necessary to defend against these claims. Even if we are successful in defending against these claims, litigation could result in substantial costs and diversion of personnel and resources.
Our products may face competition from lower cost generic or follow-on products. Manufacturers of generic drugs are seeking to compete with our drugs and present a significant challenge to us. Those manufacturers may challenge the scope, validity or enforceability of our patents in court, requiring us to engage in complex, lengthy and costly litigation. If any of our owned or licensed patents are infringed or challenged, we may not be successful in enforcing or defending those intellectual property rights and, as a result, may not be able to develop or market the relevant product exclusively, which would have a material adverse effect on our sales from that product. In addition, manufacturers of innovative drugs as well as generic drug manufacturers may be able to design around our owned or licensed patents and compete with us using the resulting alternative technology. For more information concerning certain pending proceedings relating to our intellectual property rights, see “Legal Proceedings” contained elsewhere in this report. Upon the expiration or loss of patent protection for a product, or upon the “at-risk” launch (despite pending patent infringement litigation against the generic product) by a manufacturer of a generic version of one of our products, we can quickly lose a significant portion of our sales of that product. In addition, if generic versions of our competitors’ branded products lose their market exclusivity, our patented products may face increased competition for our products. Our business operates in an extremely competitive environment. The pharmaceutical and biotechnology industries in which we operate are highly competitive and subject to rapid and significant technological change. Our present and potential competitors include major pharmaceutical and biotechnology companies, as well as specialty pharmaceutical firms, including:
• Hematology and Oncology: Amgen, AstraZeneca, Bristol-Myers-Squibb, Eisai, Gilead, Johnson & Johnson, Novartis, Pharmacyclics, Roche/Genentech, Sanofi and Takeda.
• Inflammation and Immunology: AbbVie, Amgen, Biogen Idec, Eisai, Johnson & Johnson, Merck, Pfizer and UCB S.A.
Many of these companies have considerably greater financial, technical and marketing resources than we have, enabling them, among other things, to make greater research and development investments. We also experience competition in drug development from universities and other research institutions, and we compete with others in acquiring technology from these sources. The

20
pharmaceutical industry has undergone, and is expected to continue to undergo, rapid and significant technological change and we expect competition to intensify as technical advances are made and become more widely known. The development of products or processes by our competitors with significant advantages over those that we are developing could adversely affect our future revenues and profitability. A decline in general economic conditions would adversely affect our results of operations. Sales of our products are dependent, in large part, on third-party payers. As a result of global credit and financial market conditions, these organizations may be unable to satisfy their reimbursement obligations or may delay payment. For information about amounts receivable from the government owned or controlled hospitals in Spain, Italy and Portugal, see our discussion of accounts receivable from those countries in the “Management’s Discussion and Analysis of Financial Condition and Results of Operations” section of this report.
In addition, due to tightened global credit, there may be a disruption or delay in the performance of our third-party contractors, suppliers or collaborators. We rely on third parties for several important aspects of our business, including portions of our product manufacturing, clinical development of future collaboration products, conduct of clinical trials and supply of raw materials. If such third parties are unable to satisfy their commitments to us, our business could be adversely affected. We may be required to modify our business practices, pay fines and significant expenses or experience other losses due to governmental investigations or other enforcement activities. We may become subject to litigation or governmental investigations in the United States and foreign jurisdictions that may arise from the conduct of our business. Like many companies in our industry, we have from time to time received inquiries and subpoenas and other types of information requests from government authorities and we have been subject to claims and other actions related to our business activities. For more information relating to governmental investigations and other legal proceedings, see Note 18 of Notes to Consolidated Financial Statements contained in this Annual Report on Form 10-K. While the ultimate outcome of investigations and legal proceedings are difficult to predict, adverse resolutions or settlements of those matters could result in, among other things:
• significant damage awards, fines, penalties or other payments, and administrative remedies, such as exclusion and/or debarment from government programs, or other rulings that preclude us from operating our business in a certain manner;
• changes to our business operations to avoid risks associated with such litigation or investigations;
• product recalls;
• reputational damage and decreased demand for our products; and
• expenditure of significant time and resources that would otherwise be available for operating our business.
While we maintain insurance for certain risks, the amount of our insurance coverage may not be adequate to cover the total amount of all adverse resolutions and settlements of claims and liabilities. It also is not possible to obtain insurance to protect against all potential risks and liabilities. For more information, see Note 18 of Notes to Consolidated Financial Statements contained in this Annual Report on Form 10-K.

21
The development of new biopharmaceutical products involves a lengthy and complex process and we may be unable to commercialize any of the products we are currently developing. Many of our drug candidates are in the early or mid-stages of research and development and will require the commitment of substantial financial resources, extensive research, development, preclinical testing, clinical trials, manufacturing scale-up and regulatory approval prior to being ready for sale. This process takes many years of effort without any assurance of ultimate success. Our product development efforts with respect to a product candidate may fail for many reasons, including:
• the failure of the product candidate in preclinical or clinical studies; • adverse patient reactions to the product candidate or indications of other safety concerns; • insufficient clinical trial data to support the effectiveness or superiority of the product candidate; • our inability to manufacture sufficient quantities of the product candidate for development or commercialization activities
in a timely and cost-efficient manner; • our failure to obtain, or delays in obtaining, the required regulatory approvals for the product candidate, the facilities or
the process used to manufacture the product candidate;• changes in the regulatory environment, including pricing and reimbursement, that make development of a new product
or of an existing product for a new indication no longer attractive; and• the failure to obtain or maintain satisfactory drug reimbursement rates by governmental or third-party payers.
The stem cell products that we are developing through our CCT subsidiary may represent substantial departures from established treatment methods and will compete with a number of traditional products and therapies which are now, or may be in the future, manufactured and marketed by major pharmaceutical and biopharmaceutical companies. Furthermore, public attitudes may be influenced by claims that stem cell therapy is unsafe and stem cell therapy may not gain the acceptance of the public or the medical community.
If a product were to fail to be approved or if sales fail to materialize for a newly approved product, we may incur losses related to the write-down of inventory, impairment of property, plant and equipment dedicated to the product or expenses related to restructuring.
Disruptions of our manufacturing and distribution operations could significantly interrupt our production and distribution capabilities.
We have our own manufacturing facilities for many of our products and we have contracted with third parties to provide other manufacturing, finishing, and packaging services. Any of those manufacturing processes could be partially or completely disrupted by fire, contamination, natural disaster, terrorist attack, governmental action or military action. A disruption could lead to substantial production delays and the need to establish alternative manufacturing sources for the affected products requiring additional regulatory approvals. In the interim, our finished goods inventories may be insufficient to satisfy customer orders on a timely basis. Further, our business interruption insurance may not adequately compensate us for any losses that may occur. In all the countries where we sell our products, governmental regulations define standards for manufacturing, packaging, labeling, distributing and storing pharmaceutical products. Our failure to comply, or the failure of our contract manufacturers and distributors to comply with applicable regulations could result in sanctions being imposed on them or us, including fines, injunctions, civil penalties, disgorgement, suspension or withdrawal of approvals, license revocation, seizures or recalls of products, operating restrictions and criminal prosecutions. We have contracted with distributors to distribute REVLIMID®, THALOMID®, VIDAZA®, ABRAXANE®, POMALYST®/IMNOVID® and ISTODAX®. If our distributors fail to perform and we cannot secure a replacement distributor within a reasonable period of time, our revenue could be adversely affected. The consolidation of drug wholesalers and other wholesaler actions could increase competitive and pricing pressures. We sell our pharmaceutical products in the United States primarily through wholesale distributors and contracted pharmacies. These wholesale customers comprise a significant part of our distribution network for pharmaceutical products in the United States. This distribution network is continuing to undergo significant consolidation. As a result, a smaller number of large wholesale distributors and pharmacy chains control a significant share of the market. We expect that consolidation of drug wholesalers and pharmacy chains will increase competitive and pricing pressures on pharmaceutical manufacturers, including us. In addition, wholesalers may apply pricing pressure through fee-for-service arrangements and their purchases may exceed customer demand, resulting in increased returns or reduced wholesaler purchases in later periods.
22
Risks from the improper conduct of employees, agents, contractors or collaborators could adversely affect our business or reputation. We cannot ensure that our compliance controls, policies and procedures will in every instance protect us from acts committed by our employees, agents, contractors or collaborators that violate the laws or regulations of the jurisdictions in which we operate, including employment, anti-corruption, environmental, competition and privacy laws. Such improper actions could subject us to civil or criminal investigations, monetary and injunctive penalties and could adversely impact our ability to conduct business, our results of operations and our reputation. The integration of acquired businesses may present significant challenges to us. We may face significant challenges in effectively integrating entities and businesses that we acquire and we may not realize the benefits anticipated from such acquisitions. Achieving the anticipated benefits of our acquired businesses will depend in part upon whether we can integrate our businesses in an efficient and effective manner. Our integration of acquired businesses involves a number of risks, including:
• demands on management related to the increase in our size after the acquisition;
• the diversion of management’s attention from daily operations to the integration of acquired businesses and personnel;
• higher than anticipated integration costs;
• failure to achieve expected synergies and costs savings;
• difficulties in the assimilation and retention of employees;
• difficulties in the assimilation of different cultures and practices, as well as in the assimilation of broad and geographically dispersed personnel and operations; and
• difficulties in the integration of departments, systems, including accounting systems, technologies, books and records and procedures, as well as in maintaining uniform standards and controls, including internal control over financial reporting, and related procedures and policies.
We may not be able to continue to attract and retain highly qualified managerial, scientific, manufacturing and commercial talent. The success of our business depends, in large part, on our continued ability to attract and retain highly qualified managerial, scientific, manufacturing and commercial personnel, and competition for these types of personnel is intense. We cannot be sure that we will be able to attract or retain skilled personnel or that the costs of doing so will not materially increase. Risks associated with using hazardous materials in our business could subject us to significant liability. We use certain hazardous materials in our research, development, manufacturing and other business activities. If an accident or environmental discharge occurs, or if we discover contamination caused by prior owners and operators of properties we acquire, we could be liable for remediation obligations, damages and fines that could exceed our insurance coverage and financial resources. Additionally, the cost of compliance with environmental and safety laws and regulations may increase in the future, requiring us to expend more financial resources either in compliance or in purchasing supplemental insurance coverage. Product liability claims could adversely affect our business, results of operations and financial condition.
Product liability claims could result in significant damage awards or settlements. Such claims can also be accompanied by consumer fraud claims or claims by third-party payers seeking reimbursement of the cost of our products. In addition, adverse determinations or settlements of product liability claims may result in suspension or withdrawal of a product marketing authorization or changes to our product labeling, including restrictions on therapeutic indications, inclusion of new contraindications, warnings or precautions. Although we purchase product liability coverage from third-party carriers, it is increasingly difficult and costly to obtain. There can be no assurance that we will be able to recover under any insurance policy or that such coverage will be adequate to fully cover all risks or damage awards or settlements. Product liability claims, regardless of their merits or ultimate outcome, are costly, divert management attention, may harm our reputation and can impact the demand for our products.

23
Changes in our effective income tax rate could adversely affect our results of operations. We are subject to income taxes in both the United States and various foreign jurisdictions and our domestic and international tax liabilities are largely dependent upon the distribution of income among these different jurisdictions. Various factors may have favorable or unfavorable effects on our effective income tax rate. These factors include interpretations of existing tax laws, the accounting for stock options and other share-based compensation, changes in tax laws and rates, future levels of research and development spending, changes in accounting standards, changes in the mix of earnings in the various tax jurisdictions in which we operate, the outcome of examinations by the U.S. Internal Revenue Service and other tax authorities, the accuracy of our estimates for unrecognized tax benefits and realization of deferred tax assets and changes in overall levels of pre-tax earnings. The impact on our income tax provision resulting from the above-mentioned factors and others could have a material impact on our results of operations. Currency fluctuations and changes in exchange rates could adversely affect our revenue growth, increase our costs and cause our profitability to decline. We collect and pay a substantial portion of our sales and expenditures in currencies other than the U.S. dollar. Therefore, fluctuations in foreign currency exchange rates affect our operating results. We utilize foreign currency forward contracts and option contracts, which are derivative instruments, to manage foreign currency risk. We use these derivative instruments to hedge certain forecasted transactions, manage exchange rate volatility in the translation of foreign earnings and reduce exposures to foreign currency fluctuations of certain balance sheet items denominated in foreign currencies. The use of these derivative instruments is intended to mitigate a portion of the exposure of these risks with the intent to reduce our risk or cost, but generally would not fully offset any change in operating results as a consequence of fluctuations in foreign currencies. Any significant foreign exchange rate fluctuations could adversely affect our financial condition and results of operations. See Note 5 of Notes to Consolidated Financial Statements, and Item 7A. “Quantitative and Qualitative Disclosures About Market Risk” contained in this Annual Report on Form 10-K. We may experience an adverse market reaction if we are unable to meet our financial reporting obligations. As we continue to expand at a rapid pace, the development of new and/or improved automated systems will remain an ongoing priority. During this expansion period, our internal control over financial reporting may not prevent or detect misstatements in our financial reporting. Such misstatements may result in litigation and/or negative publicity and possibly cause an adverse market reaction that may negatively impact our growth plans and the value of our common stock. Impairment charges or write downs in our books and changes in accounting standards could have a significant adverse effect on our results of operations and financial condition.
New or revised accounting standards, rules and interpretations could result in changes to the recognition of income and expense that may materially and adversely affect our financial results. In addition, the value allocated to certain of our assets could be substantially impaired due to a number of factors beyond our control. Also, if any of our strategic equity investments decline in value, we may be required to write down such investment.
The price of our common stock may fluctuate significantly. The market for our shares of common stock may fluctuate significantly. The following key factors may have an adverse impact on the market price of our common stock:
• results of our clinical trials or adverse events associated with our marketed products;
• fluctuations in our commercial and operating results;
• announcements of technical or product developments by us or our competitors;
• market conditions for pharmaceutical and biotechnology stocks in particular;
• changes in laws and governmental regulations, including changes in tax, healthcare, environmental, competition and patent laws;
• new accounting pronouncements or regulatory rulings;
• public announcements regarding medical advances in the treatment of the disease states that we are targeting;

24
• patent or proprietary rights developments;
• changes in pricing and third-party reimbursement policies for our products;
• the outcome of litigation involving our products, processes or intellectual property;
• the existence and outcome of governmental investigations and proceedings;
• regulatory actions that may impact our products or potential products;
• disruptions in our manufacturing processes or supply chain;
• failure of our collaboration partners to successfully develop potential drug candidates;
• competition; and
• investor reaction to announcements regarding business or product acquisitions.
In addition, a market downturn in general and/or in the biopharmaceutical sector in particular, may adversely affect the market price of our securities, which may not necessarily reflect the actual or perceived value of our company. Our business would be adversely affected if we are unable to service our debt obligations. We have incurred various forms of indebtedness, including senior notes, commercial paper and a senior unsecured credit facility. Our ability to pay interest and principal amounts when due, comply with debt covenants or repurchase the senior notes if a change of control occurs, will depend upon, among other things, continued commercial success of our products and other factors that affect our future financial and operating performance, including prevailing economic conditions and financial, business and regulatory factors, many of which are beyond our control. If we are unable to generate sufficient cash flow to service the debt service requirements under our debt instruments, we may be forced to take remedial actions such as:
• restructuring or refinancing our debt;
• seeking additional debt or equity capital;
• reducing or delaying our business activities, acquisitions, investments or capital expenditures, including research and development expenditures; or
• selling assets, businesses, products or other potential revenue streams.
Such measures might not be successful and might not enable us to service our debt obligations. In addition, any such financing, refinancing or sale of assets might not be available on economically favorable terms, if at all. A breakdown or breach of our information technology systems could subject us to liability or interrupt the operation of our business.
We rely upon our information technology systems and infrastructure for our business. The size and complexity of our computer systems make them potentially vulnerable to breakdown and unauthorized intrusion. Similarly, data privacy breaches by those who access our systems may pose a risk that sensitive data may be exposed to unauthorized persons or to the public. There can be no assurance that our efforts to protect our data and information technology systems will prevent breakdowns or breaches in our systems that could adversely affect our business. The illegal distribution and sale by third parties of counterfeit versions of our products or stolen products could have a negative impact on our reputation and business.
Third parties might illegally distribute and sell counterfeit versions of our products, which do not meet our rigorous manufacturing and testing standards. A patient who receives a counterfeit drug may be at risk for a number of dangerous health consequences. Our reputation and business could suffer harm as a result of counterfeit drugs sold under our brand name. In addition, thefts of inventory at warehouses, plants or while in-transit, which are not properly stored and which are sold through unauthorized channels, could adversely impact patient safety, our reputation and our business.

25
We have certain charter and by-law provisions that may deter a third-party from acquiring us and may impede the stockholders’ ability to remove and replace our management or board of directors. Our board of directors has the authority to issue, at any time, without further stockholder approval, up to 5.0 million shares of preferred stock and to determine the price, rights, privileges and preferences of those shares. An issuance of preferred stock could discourage a third-party from acquiring a majority of our outstanding voting stock. Additionally, our by-laws contain provisions intended to strengthen the board’s position in the event of a hostile takeover attempt. These provisions could impede the stockholders’ ability to remove and replace our management and/or board of directors. Furthermore, we are subject to the provisions of Section 203 of the Delaware General Corporation Law, an anti-takeover law, which may also dissuade a potential acquirer of our common stock. In addition to the risks relating to our common stock, holders of our CVRs are subject to additional risks. On October 15, 2010, we acquired all of the outstanding common stock of Abraxis BioScience, Inc. (Abraxis) and in connection with our acquisition, Contingent Value Rights (CVRs) were issued entitling each holder of a CVR to a pro rata portion of certain milestone and net sales payments if certain specified conditions are satisfied. In addition to the risks relating to our common stock, CVR holders are subject to additional risks, including:
• an active public market for the CVRs may not continue to exist or the CVRs may trade at low volumes, both of which could have an adverse effect on the market price, if any, of the CVRs;
• if the clinical approval milestones or net sales targets specified in the CVR Agreement are not achieved for any reason within the time periods specified therein, no payment will be made under the CVRs and the CVRs will expire valueless;
• since the U.S. federal income tax treatment of the CVRs is unclear, any part of a CVR payment could be treated as ordinary income and the tax thereon may be required to be paid prior to the receipt of the CVR payment;
• any payments in respect of the CVRs are subordinated to the right of payment of certain of our other indebtedness;
• we may under certain circumstances redeem the CVRs; and
• upon expiration of our obligations under the CVR Agreement to continue to commercialize ABRAXANE® or any of the other Abraxis pipeline products, we may discontinue such efforts, which would have an adverse effect on the value, if any, of the CVRs.

26
ITEM 1B. UNRESOLVED STAFF COMMENTS
None.
ITEM 2. PROPERTIES
Our corporate headquarters are located in Summit, New Jersey and our international headquarters are located in Boudry, Switzerland. Summarized below are the locations, primary usage and approximate square footage of the facilities we own worldwide:
Location Primary UsageApproximateSquare Feet
Summit, New Jersey Administration, marketing, research 400,000Boudry, Switzerland Manufacturing, administration and warehousing 266,500Phoenix, Arizona Manufacturing and warehousing 247,000Zofingen, Switzerland Manufacturing 12,000
We occupy the following facilities, located in the United States, under operating lease arrangements, none of which are individually material to us. Under these lease arrangements, we may be required to reimburse the lessors for real estate taxes, insurance, utilities, maintenance and other operating costs. All leases are with unaffiliated parties.
Location Primary UsageApproximateSquare Feet
Berkeley Heights, New Jersey Office space 337,800Warren, New Jersey Office space and research 177,600San Diego, California Research 171,900Basking Ridge, New Jersey Office space 95,900San Francisco, California Office space and research 55,900Durham, North Carolina Clinical trial management 36,000Overland Park, Kansas Office space 29,600Cedar Knolls, New Jersey Office space and stem cell recovery 25,300Bedford, Massachusetts Office space 23,000Los Angeles, California Office space 9,900Dallas, Texas Office space 3,000Destin, Florida Office space 1,600
We also lease a number of offices under various lease agreements outside of the United States for which the minimum annual rents may be subject to specified annual rent increases. At December 31, 2013, the non-cancelable lease terms for our operating leases expire at various dates between 2014 and 2023 and in some cases include renewal options. The total amount of rent expense recorded for all leased facilities in 2013 was $42.5 million.
ITEM 3. LEGAL PROCEEDINGS
See Note 18 of Notes to Consolidated Financial Statements contained in this Annual Report on Form 10-K.
ITEM 4. MINE SAFETY DISCLOSURES
Not applicable.

27
PART II
ITEM 5. MARKET FOR REGISTRANT'S COMMON EQUITY, RELATED STOCKHOLDER MATTERS AND ISSUER PURCHASES OF EQUITY SECURITIES
(a) MARKET INFORMATION
Our common stock is traded on the NASDAQ Global Select Market under the symbol "CELG." The following table sets forth, for the periods indicated, the intra-day high and low prices per share of common stock on the NASDAQ Global Select Market:
High Low2013:
Fourth Quarter $ 173.80 $ 142.10Third Quarter 156.04 118.15Second Quarter 131.82 110.53First Quarter 116.95 79.75
2012: Fourth Quarter $ 82.78 $ 71.23Third Quarter 78.63 61.89Second Quarter 80.42 58.53First Quarter 78.83 66.28
Cumulative Total Return 12/08 12/09 12/10 12/11 12/12 12/13Celgene Corporation $ 100.00 $ 100.72 $ 106.98 $ 122.29 $ 141.95 $ 305.66S&P 500 100.00 125.92 144.58 147.60 171.04 225.85NASDAQ Composite 100.00 145.05 171.14 169.83 199.89 279.63NASDAQBiotechnology 100.00 115.93 134.42 150.63 199.91 331.72
* $100 Invested on 12/31/08 in Stock or Index – Including Reinvestment of Dividends, Fiscal Year Ended December 31.

28
(b) HOLDERS
The closing sales price per share of common stock on the NASDAQ Global Select Market on February 6, 2014 was $149.91. As of February 6, 2014, there were approximately 468 holders of record of our common stock.
(c) DIVIDEND POLICY
We have never declared or paid any cash dividends on our common stock and have no present intention to pay a cash dividend on our common stock.
(d) EQUITY COMPENSATION PLAN INFORMATION
We incorporate information regarding the securities authorized for issuance under our equity compensation plan into this section by reference from the section entitled "Equity Compensation Plan Information" to be included in the proxy statement for our 2014 Annual Meeting of Stockholders.
(e) REPURCHASE OF EQUITY SECURITIES
During the period April 2009 through December 2013, our Board of Directors approved repurchases of up to an aggregate of $9.500 billion of our common stock, including the June 2013 authorization to repurchase an additional $3.000 billion of our common stock. Approved amounts exclude share repurchase transaction fees.
As part of our share repurchase program, in February 2013 we entered into an Accelerated Share Repurchase (ASR) agreement with an investment bank to repurchase an aggregate of $600.0 million of our common stock. The total number of shares repurchased under the ASR agreement was 5,249,137 shares at a weighted average price of $114.30 per share.
As of December 31, 2013, an aggregate 96,774,120 common shares were repurchased under the program at an average price of $76.80 per common share and an aggregate cost of $7.432 billion, excluding share repurchase transaction fees.
The following table presents the total number of shares purchased during the three-month period ended December 31, 2013, the average price paid per share, the number of shares that were purchased and the approximate dollar value of shares that still could have been purchased, pursuant to our repurchase program:
PeriodTotal Number ofShares Purchased
Average Price Paidper Share
Total Number ofShares Purchased as
Part of PubliclyAnnounced Plans or
Programs
Approximate DollarValue of Shares That
Still Could Be PurchasedUnder the Plans or
ProgramsOctober 1 - October 31 975,000 $ 154.86 975,000 $ 2,638,566,036November 1 - November 30 1,627,900 $ 152.22 1,627,900 $ 2,390,759,137December 1 - December 31 1,950,800 $ 165.47 1,950,800 $ 2,067,961,325
During the period covered by this report, we did not sell any of our equity shares that were not registered under the Securities Act of 1933, as amended.

29
ITEM 6. SELECTED FINANCIAL DATA
The following Selected Consolidated Financial Data should be read in conjunction with our Consolidated Financial Statements and the related Notes thereto, Management's Discussion and Analysis of Financial Condition and Results of Operations and other financial information included elsewhere in this Annual Report on Form 10-K. The data set forth below with respect to our Consolidated Statements of Income for the years ended December 31, 2013, 2012 and 2011 and the Consolidated Balance Sheet data as of December 31, 2013 and 2012 are derived from our Consolidated Financial Statements which are included elsewhere in this Annual Report on Form 10-K and are qualified by reference to such Consolidated Financial Statements and related Notes thereto. The data set forth below with respect to our Consolidated Statements of Income for the years ended December 31, 2010 and 2009 and the Consolidated Balance Sheet data as of December 31, 2011, 2010 and 2009 are derived from our Consolidated Financial Statements, which are not included elsewhere in this Annual Report on Form 10-K (amounts in millions, except per share data).
Years ended December 31, 2013 2012 2011 2010 2009Consolidated Statements of Income: Total revenue $ 6,493.9 $ 5,506.7 $ 4,842.1 $ 3,625.7 $ 2,689.9Costs and operating expenses 4,685.0 3,760.3 3,399.4 2,636.1 1,848.4Operating income 1,808.9 1,746.4 1,442.7 989.6 841.5Interest and investment income, net 22.0 15.3 25.9 44.7 76.8Interest (expense) (91.6) (63.2) (42.7) (12.6) (2.0)Other income (expense), net (73.9) (17.0) (6.4) (9.1) 59.4Income before income taxes 1,665.4 1,681.5 1,419.5 1,012.6 975.7Income tax provision 215.5 225.3 102.1 132.4 199.0Net income $ 1,449.9 $ 1,456.2 $ 1,317.4 $ 880.2 $ 776.7
Less: Net loss attributable to non-controlling interests — — 0.7 0.3 —
Net income attributable to Celgene $ 1,449.9 $ 1,456.2 $ 1,318.1 $ 880.5 $ 776.7Net income per share attributable toCelgene:
Basic $ 3.50 $ 3.38 $ 2.89 $ 1.90 $ 1.69Diluted $ 3.37 $ 3.30 $ 2.85 $ 1.88 $ 1.66
Weighted average shares: Basic 413.8 430.9 455.3 462.3 459.3Diluted 430.3 440.8 462.7 469.5 467.4
As of December 31, 2013 2012 2011 2010 2009Consolidated Balance Sheets Data: Cash, cash equivalents and marketablesecurities $ 5,687.0 $ 3,900.3 $ 2,648.2 $ 2,601.3 $ 2,996.8Total assets 13,378.2 11,734.3 10,005.9 10,177.2 5,389.3Short-term borrowings 544.8 308.5 526.7 — —Long-term debt, net of discount 4,196.5 2,771.3 1,275.6 1,247.6 —Retained earnings (accumulated deficit) 4,472.5 3,022.6 1,566.4 248.3 (632.2)Total equity 5,589.9 5,694.5 5,512.7 5,995.5 4,394.6

30
ITEM 7. MANAGEMENT'S DISCUSSION AND ANALYSIS OF FINANCIAL CONDITION AND RESULTS OF OPERATIONS
EXECUTIVE SUMMARY
Celgene Corporation, together with its subsidiaries (collectively “we,” “our,” “us,” “Celgene” or the “Company”), is a global biopharmaceutical company primarily engaged in the discovery, development and commercialization of innovative therapies designed to treat cancer and immune-inflammatory related diseases. We are dedicated to innovative research and development designed to bring new therapies to market and we are involved in research in several scientific areas that may deliver proprietary next-generation therapies, targeting areas including intracellular signaling pathways, protein homeostasis and epigenetics in cancer and immune cells, immunomodulation in cancer and autoimmune diseases and therapeutic application of cell therapies.
Our primary commercial stage products include REVLIMID®, VIDAZA®, ABRAXANE®, POMALYST®/IMNOVID®,
THALOMID® (inclusive of Thalidomide CelgeneTM), ISTODAX® and azacitidine for injection (generic version of VIDAZA®). Additional sources of revenue include royalties from Novartis Pharma AG (Novartis) on their sales of FOCALIN XR® and the entire RITALIN® family of drugs, the sale of services through our Celgene Cellular Therapeutics (CCT) subsidiary and other licensing agreements.
REVLIMID® (lenalidomide): REVLIMID® is an oral immunomodulatory drug marketed in the United States and many international markets for the treatment of patients as indicated below:
Disease Geographic ApprovalsMultiple myeloma (MM), in combination withdexamethasone, in patients who have received at least oneprior therapy
* United States* European Union* Japan* Other international markets
Myelodysplastic syndromes (MDS)Transfusion-dependent anemia due to low- orintermediate-1-risk MDS associated with a deletion 5qabnormality with or without additional cytogeneticabnormalities
* United States* Other international markets
Transfusion-dependent anemia due to low- orintermediate-1-risk MDS in patients with isolateddeletion 5q cytogenetic abnormality when other optionsare insufficient or inadequate
* European Union (Approved June 2013)
MDS with a deletion 5q cytogenetic abnormality. Theefficacy or safety of REVLIMID for InternationalPrognostic Scoring System (IPSS) intermediate-2 or highrisk MDS has not been established.
* Japan
Mantle cell lymphoma (MCL) in patients whose disease hasrelapsed or progressed after two prior therapies, one ofwhich included bortezomib.
* United States (Approved June 2013)
VIDAZA® (azacitidine for injection): VIDAZA® is a pyrimidine nucleoside analog that has been shown to reverse the effects of DNA hypermethylation and promote subsequent gene re-expression. VIDAZA® is a Category 1 recommended treatment for patients with intermediate-2 and high-risk MDS, according to the National Comprehensive Cancer Network and is marketed in the United States for the treatment of all subtypes of MDS. The U.S. regulatory exclusivity for VIDAZA® expired in May 2011. As the result of the launch of a generic version of VIDAZA® in the United States by a competitor in September 2013, we experienced a significant reduction in our U.S. sales of VIDAZA® in the fourth quarter of 2013. In 2013, we also contracted with Sandoz AG to sell a generic version of VIDAZA®, which we supply. In Europe, VIDAZA® is marketed for the treatment of intermediate-2 and high-risk MDS, chronic myelomonocytic leukemia with 10% to 29% marrow blasts without myeloproliferative disorder, as well as acute myeloid leukemia (AML) with 20% to 30% blasts and multi-lineage dysplasia and has been granted orphan drug designation for the treatment of MDS and AML. Regulatory exclusivity for VIDAZA® is expected to continue in Europe through 2018.

31
ABRAXANE® (paclitaxel albumin-bound particles for injectable suspension): ABRAXANE® is a solvent-free chemotherapy product which was developed using our proprietary nab® technology platform. This protein-bound chemotherapy agent combines paclitaxel with albumin. ABRAXANE® is approved for the treatment of patients as indicated below:
Disease Geographic ApprovalsBreast Cancer
Metastatic breast cancer, after failure of combinationchemotherapy for metastatic disease or relapse within sixmonths of adjuvant chemotherapy. Prior therapy shouldhave included an anthracycline unless clinicallycontraindicated.
* United States
Metastatic breast cancer in adult patients who have failedfirst-line treatment for metastatic disease for whomstandard, anthracycline containing therapy is not indicated
* European Union
Breast cancer * Japan* Other international markets
Non-Small Cell Lung Cancer (NSCLC)Locally advanced or metastatic NSCLC, as first-linetreatment in combination with carboplatin, in patients whoare not candidates for curative surgery or radiation therapy
* United States* Other international markets
NSCLC * Japan (Approved February 2013)
Metastatic adenocarcinoma of the pancreas, a form ofpancreatic cancer, as first line treatment in combination withgemcitabine
* United States (Approved September 2013)* European Union (Approved December 2013)
Gastric cancer * Japan (Approved February 2013)
During 2013, applications for marketing authorizations for ABRAXANE® for the treatment of patients with advanced pancreatic cancer were also submitted in other countries and regions. ABRAXANE® is currently in various stages of investigation for breast, pancreatic and non-small cell lung cancers.
POMALYST®/IMNOVID®1(pomalidomide): POMALYST®/IMNOVID® is a proprietary, distinct, small molecule that is administered orally and modulates the immune system and other biologically important targets. POMALYST®/IMNOVID® received its first approvals from the U.S. Food and Drug Administration (FDA) and the European Commission (EC) during 2013 for the treatment of patients as indicated below:
Disease Geographic ApprovalsMultiple myeloma for patients who have received at leasttwo prior therapies, including lenalidomide and bortezomiband have demonstrated disease progression on or within 60days of completion of the last therapy.
* United States (Approved February 2013)
Relapsed and refractory multiple myeloma, in combinationwith dexamethasone, for adult patients who have receivedat least two prior therapies including both lenalidomide andbortezomib and have demonstrated disease progression onthe last therapy.
* European Union (Approved August 2013)
1 We received FDA approval for pomalidomide under the trade name POMALYST®. We received EC approval for pomalidomide under the trade name IMNOVID®.
THALOMID® (thalidomide): In combination with dexamethasone, THALOMID® is marketed in the United States for patients with newly diagnosed multiple myeloma and for the acute treatment of the cutaneous manifestations of moderate to severe erythema nodosum leprosum (ENL) an inflammatory complication of leprosy and as maintenance therapy for prevention and suppression of the cutaneous manifestation of ENL recurrence. Thalidomide CelgeneTM in combination with melphalan and prednisone is marketed in the European Union as a first line treatment for patients with untreated multiple myeloma who are aged sixty-five years of age or older or ineligible for high dose chemotherapy.
ISTODAX® (romidepsin): ISTODAX® is approved in the United States for the treatment of cutaneous T-cell lymphoma (CTCL) in patients who have received at least one prior systemic therapy and for the treatment of peripheral T-cell lymphoma (PTCL) in patients who have received at least one prior therapy. ISTODAX® has received orphan drug designation for the treatment of non-Hodgkin’s T-cell lymphomas, including CTCL and PTCL.

32
azacitidine for injection (generic version of VIDAZA®): After the launch of a generic version of VIDAZA® in the United States by a competitor in September 2013, we contracted with Sandoz AG to sell azacitidine for injection, which we supply. We recognize net product sales from sales of azacitidine for injection to Sandoz AG.
We continue to invest substantially in research and development in support of multiple ongoing proprietary clinical development programs which support our existing products and pipeline of new drug candidates. REVLIMID® is in several phase III trials across a range of hematological malignancies that include newly diagnosed multiple myeloma and maintenance, lymphomas, chronic lymphocytic leukemia (CLL) and MDS. POMALYST®/IMNOVID® was approved in the United States and European Union for indications in multiple myeloma based on phase II and phase III results, respectively, and additional phase III trials are underway with POMALYST®/IMNOVID® in relapsed refractory multiple myeloma. Phase III trials are also underway for VIDAZA® and CC-486 in MDS and acute myeloid leukemia (AML) and ISTODAX® in first-line peripheral T-cell lymphoma (PTCL). In solid tumors, ABRAXANE® is currently in various stages of investigation for breast, pancreatic and non-small cell lung cancers. Our lead product candidate in inflammation and immunology, OTEZLA® (apremilast) is being evaluated in a broad phase III program for psoriatic arthritis, psoriasis and ankylosing spondylitis.
Beyond our phase III programs, we have access to a growing early-to-mid-stage pipeline of novel therapies to address significant unmet medical needs that consists of a combination of in-house developed compounds, compounds licensed from other companies and options to acquire compounds from collaboration partners. For more information, see Item 1 "Preclinical and Clinical Stage Pipeline."
We believe that continued use of our primary commercial stage products, participation in research and development collaboration arrangements, depth of our product pipeline, regulatory approvals of new products and expanded use of existing products will provide the catalysts for future growth.
The following table summarizes total revenue and earnings for the years ended December 31, 2013, 2012 and 2011 (dollar amounts in millions, except per share data):
% Change
Years Ended December 31, 2013versus2012
2012versus2011 2013 2012 2011
Total revenue $ 6,493.9 $ 5,506.7 $ 4,842.1 17.9 % 13.7%Net income attributable to Celgene $ 1,449.9 $ 1,456.2 $ 1,318.1 (0.4)% 10.5%Diluted earnings per share attributableto Celgene $ 3.37 $ 3.30 $ 2.85 2.1 % 15.8%
Revenue increased by $987.2 million to $6.494 billion in 2013 compared to 2012 primarily due to the continued growth in unit sales of REVLIMID® and ABRAXANE® as well as the FDA and EC approvals of POMALYST® /IMNOVID® in February 2013 and August 2013, respectively, as noted above. The $6.3 million decrease in net income to $1.450 billion in 2013 compared to 2012 was primarily due to a $446.3 million increase in payments made related to research and development collaboration arrangements, a $61.9 million increase in ABRAXANE® amortization expense due to the October 2012 FDA approval of ABRAXANE® for treatment of NSCLC, a $94.8 million increase in share-based compensation expense and increased spending in support of our currently marketed products and those that we plan to launch. The increases in expense were nearly offset by the favorable impact from a higher level of net product sales. The $0.07 increase in diluted earnings per share in 2013 compared to 2012 was favorably impacted by the repurchase of 22.3 million common shares under our common share repurchase program, reducing our outstanding share base.

33
Results of Operations:
Fiscal Years Ended December 31, 2013, 2012 and 2011
Total Revenue: Total revenue and related percentages for the years ended December 31, 2013, 2012 and 2011 were as follows (dollar amounts in millions, except per share data):
% Change
2013 2012 2011
2013versus2012
2012versus2011
Net product sales: REVLIMID® $ 4,280.3 $ 3,766.6 $ 3,208.2 13.6 % 17.4 %VIDAZA® 803.3 823.2 705.3 (2.4)% 16.7 %ABRAXANE® 648.9 426.7 385.9 52.1 % 10.6 %POMALYST®/IMNOVID® 305.4 12.0 0.6 N/M N/MTHALOMID® 244.5 302.1 339.1 (19.1)% (10.9)%ISTODAX® 54.0 50.0 30.9 8.0 % 61.7 %azacitidine for injection 23.3 — — N/M N/MOther 2.6 5.0 29.7 (48.0)% (83.2)%
Total net product sales $ 6,362.3 $ 5,385.6 $ 4,699.7 18.1 % 14.6 %Collaborative agreements and otherrevenue 14.7 10.7 19.5 37.4 % (45.1)%Royalty revenue 116.9 110.4 122.9 5.9 % (10.2)%Total revenue $ 6,493.9 $ 5,506.7 $ 4,842.1 17.9 % 13.7 %
The increase in total revenue of $987.2 million in 2013 compared to 2012 reflected increases of $693.0 million, or 21.9%, in the United States, and $294.2 million, or 12.6%, in international markets. The increase in total revenue of $664.6 million in 2012 compared to 2011 reflected increases of $308.2 million, or 10.8%, in the United States, and $356.4 million, or 18.0%, in international markets.
Net Product Sales: Total net product sales for 2013 increased by $976.7 million, or 18.1%, to $6.362 billion compared to 2012. The increase was comprised of net volume increases of $950.3 million and price increases of $117.0 million, partly offset by an unfavorable impact from foreign exchange of $90.6 million. The increase in volume was driven by increased unit sales of REVLIMID®, the favorable impact from increased U.S. sales of ABRAXANE® resulting from the October 2012 and September 2013 FDA approvals for treatment of NSCLC and pancreatic cancer, respectively, as well as the February 2013 FDA and August 2013 EC approvals of POMALYST®/IMNOVID® for treatment of multiple myeloma. The increase in price was primarily due to price increases on REVLIMID®, VIDAZA® and THALOMID® in the U.S. market.
Total net product sales for 2012 increased by $685.9 million, or 14.6%, to $5.386 billion compared to 2011. The increase was comprised of net volume increases of $559.1 million and price increases of $162.2 million, partly offset by an unfavorable impact from foreign exchange of $35.4 million. The increase in price was primarily due to price increases on REVLIMID®, VIDAZA® and THALOMID® in the U.S. market.
REVLIMID® net sales increased by $513.7 million, or 13.6%, to $4.280 billion in 2013 compared to 2012, primarily due to increased unit sales in both international and U.S. markets in addition to price increases in the U.S. market. These increases were partially offset by unfavorable changes in price in international markets and unfavorable foreign exchange impacts, including the impact of foreign exchange hedging activity. Increases in market penetration and treatment duration of patients using REVLIMID®
in multiple myeloma contributed to the increase in United States unit sales. The growth in international markets resulted from volume increases, primarily driven by increased duration of use and market share gains.
Net sales of REVLIMID® increased by $558.4 million, or 17.4%, to $3.767 billion in 2012 compared to 2011, primarily due to increased unit sales in both U.S. and international markets. Increases in market penetration, treatment duration of patients using REVLIMID® in multiple myeloma and price increases contributed to U.S. growth. The growth in international markets resulted from volume increases, primarily driven by increased duration of use and market share gains.

34
VIDAZA® net sales decreased by $19.9 million, or 2.4%, to $803.3 million in 2013 compared to 2012, reflecting volume decreases in the U.S. market due to the launch of a generic version of VIDAZA® by a competitor in September 2013 and the launch of a generic version of VIDAZA® (azacitidine for injection) by Sandoz AG in the fourth quarter of 2013, which we supply. Foreign exchange also unfavorably impacted sales. These decreases were partly offset by price increases in the U.S. market and volume increases in international markets. VIDAZA® retains orphan drug exclusivity in Europe through the end of 2018.
Net sales of VIDAZA® increased by $117.9 million, or 16.7%, to $823.2 million in 2012 compared to 2011, reflecting increases in both U.S. and international markets. The U.S. growth reflects an increase in volume and price. The growth in international markets was partly due to the increase in treatment duration of patients using VIDAZA® and launches of VIDAZA® in new markets, including the United Kingdom and Japan.
ABRAXANE® net sales increased by $222.2 million, or 52.1%, to $648.9 million in 2013 compared to 2012, primarily due to increased unit volumes in both U.S. and international markets, reflecting increased acceptance of the product in the treatment of metastatic breast cancer, the October 2012 FDA approval for treatment of NSCLC and the September 2013 FDA approval for treatment of pancreatic cancer.
Net sales of ABRAXANE® increased by $40.8 million, or 10.6%, to $426.7 million in 2012 compared to 2011, primarily due to increased unit volumes in both U.S. and international markets, reflecting increased acceptance of the product in the treatment of metastatic breast cancer and the October 2012 FDA approval for NSCLC.
Net sales of POMALYST®/IMNOVID® totaled $305.4 million in 2013, reflecting the approval of POMALYST® by the FDA in February 2013 for patients with multiple myeloma who have received at least two prior therapies, including lenalidomide and bortezomib, and have demonstrated disease progression on or within 60 days of completion of the last therapy. IMNOVID® (the non-U.S. trade name) in combination with dexamethasone was approved by the EC in August 2013 for adult patients with relapsed and refractory multiple myeloma who have received at least two prior therapies, including both lenalidomide and bortezomib, and have demonstrated disease progression on the last therapy. Net sales of POMALYST® totaled $246.0 million in the United States and IMNOVID® net sales totaled $59.4 million in international markets.
THALOMID® net sales decreased by $57.6 million, or 19.1%, to $244.5 million in 2013 compared to 2012, primarily due to lower unit volumes in the U.S. and international markets and an increase in estimated returns related to the transition of THALOMID® distribution from retail to specialty pharmacies. The reductions in volume were partially offset by price increases in the United States.
Net sales of THALOMID® decreased by $37.0 million, or 10.9%, to $302.1 million in 2012 compared to 2011,primarily due to lower unit volumes in the United States, partly resulting from the increased use of REVLIMID®, partially offset by an increase in price and lower gross to net adjustments.
ISTODAX® net sales increased by $4.0 million, or 8.0%, to $54.0 million in 2013 compared to 2012, primarily due to increases in price in the United States.
Net sales of ISTODAX® increased by $19.1 million, or 61.7%, to $50.0 million in 2012 compared to 2011, primarily due to increased unit sales in the treatment of CTCL and the June 2011 FDA approval of ISTODAX® for the treatment of PTCL in patients who have received at least one prior therapy.
Net sales of azacitidine for injection, which is a generic version of VIDAZA®, reached $23.3 million after its launch in the second half of 2013. We have entered into an agreement with Sandoz AG to sell azacitidine, which we supply.
The "other" net product sales category, which includes LENADEX® and FOCALIN®, decreased by $2.4 million, or 48.0%, to $2.6 million in 2013 compared to 2012. The "other" net product sales category decreased by $24.7 million, or 83.2%, to $5.0 million in 2012 compared to 2011. That decrease was primarily due to the April 2011 sale of Abraxis non-core assets, resulting in the elimination of further Abraxis non-core product sales. Sales of Abraxis non-core products totaled $21.3 million in 2011.
Collaborative Agreements and Other Revenue: Revenue from collaborative agreements and other sources increased by $4.0 million to $14.7 million in 2013 compared to 2012. The increase was primarily due to a $5.0 million milestone payment received in 2013 related to ABRAXANE® in Japan. Revenue from collaborative agreements and other sources decreased by $8.8 million to $10.7 million in 2012 compared to 2011. The decrease was primarily due to a $2.4 million reduction in certain manufacturing and management fees and a $6.3 million milestone payment received in 2011 related to VIDAZA® in Japan which was not repeated in 2012.
Royalty Revenue: Royalty revenue increased by $6.5 million to $116.9 million in 2013 compared to 2012, due to an increase in royalties earned from Novartis based upon its sales of both RITALIN® and FOCALIN XR®. Royalty revenue decreased by $12.5 million to $110.4 million in 2012 compared to 2011, primarily due to reduced royalties earned from Novartis based upon

35
its sales of RITALIN®, which was negatively impacted by generic competition in certain markets, partly offset by an increase in royalties from sales of FOCALIN XR®.
Gross to Net Sales Accruals: We record gross to net sales accruals for sales returns and allowances, sales discounts, government rebates, chargebacks and distributor service fees. REVLIMID®, POMALYST® and THALOMID® are distributed in the United States primarily through contracted pharmacies under the REVLIMID® Risk Evaluation and Mitigation Strategy (REMS), POMALYST REMSTM and THALOMID REMSTM programs, respectively. These are proprietary risk-management distribution programs tailored specifically to provide for the safe and appropriate distribution and use of REVLIMID®, POMALYST® and THALOMID®. Internationally, REVLIMID®, THALOMID®/Thalidomide CelgeneTM and IMNOVID® are distributed under mandatory risk-management distribution programs tailored to meet local authorities’ specifications to provide for the product’s safe and appropriate distribution and use. These programs may vary by country and, depending upon the country and the design of the risk-management program, the product may be sold through hospitals or retail pharmacies. VIDAZA®, ABRAXANE® and ISTODAX® are distributed through the more traditional pharmaceutical industry supply chain and are not subject to the same risk-management distribution programs as REVLIMID®, POMALYST®/IMNOVID®, THALOMID®/Thalidomide CelgeneTM.
We base our sales returns allowance on estimated on-hand retail/hospital inventories, measured end-customer demand as reported by third-party sources, actual returns history and other factors, such as the trend experience for lots where product is still being returned or inventory centralization and rationalization initiatives conducted by major pharmacy chains, as applicable. If the historical data we use to calculate these estimates do not properly reflect future returns, then a change in the allowance would be made in the period in which such a determination is made and revenues in that period could be materially affected. Under this methodology, we track actual returns by individual production lots. Returns on closed lots, that is, lots no longer eligible for return credits, are analyzed to determine historical returns experience. Returns on open lots, that is, lots still eligible for return credits, are monitored and compared with historical return trend rates. Any changes from the historical trend rates are considered in determining the current sales return allowance. As noted above, REVLIMID®, POMALYST®/IMNOVID®, THALOMID®/Thalidomide CelgeneTM are distributed primarily through hospitals and contracted pharmacies, which are typically subject to tighter controls of inventory quantities within the supply channel and, thus, resulting in lower returns activity. Sales discount accruals are based on payment terms extended to customers. Government rebate accruals are based on estimated payments due to governmental agencies for purchases made by third parties under various governmental programs. U.S. Medicaid rebate accruals are generally based on historical payment data and estimates of future Medicaid beneficiary utilization applied to the Medicaid unit rebate formula established by the Center for Medicaid and Medicare Services. The Medicaid rebate percentage was increased and extended to Medicaid Managed Care Organizations in March 2010. The accrual of the rebates associated with Medicaid Managed Care Organizations is calculated based on estimated historical patient data related to Medicaid Managed Care Organizations. We have also analyzed actual billings received from the states to further support the accrual rates. Subsequent to implementation of the Patient Protection and Affordable Care Act and the Health Care and Education Reconciliation Act of 2010 (collectively, the 2010 U.S. Health Care Reform Law), certain states have only recently begun submitting partial Medicaid Managed Care Organization bills. Our accruals for these Medicaid Managed Care Organization rebates had been at elevated levels given the delays in the receipt of complete invoices from certain states. Due to the receipt of more complete claims data as 2013 progressed, the accruals for certain states were reduced from the elevated levels at December 31, 2012 as a result of both the payments made being applied to the accrual and a $20.3 million favorable change in estimate of the ultimate obligation. We will continue to adjust the rebate accruals as more information becomes available and to reflect actual claims experience. Effective January 1, 2011, manufacturers of pharmaceutical products are responsible for 50% of the patient’s cost of branded prescription drugs related to the Medicare Part D Coverage Gap. In order to estimate the cost to us of this coverage gap responsibility, we analyze data for eligible Medicare Part D patients against data for eligible Medicare Part D patients treated with our products as well as the historical invoices. This expense is recognized throughout the year as costs are incurred. In certain international markets government-sponsored programs require rebates to be paid based on program specific rules and, accordingly, the rebate accruals are determined primarily on estimated eligible sales.
Rebates or administrative fees are offered to certain wholesale customers, group purchasing organizations and end-user customers, consistent with pharmaceutical industry practices. Settlement of rebates and fees may generally occur from one to 15 months from the date of sale. We record a provision for rebates at the time of sale based on contracted rates and historical redemption rates. Assumptions used to establish the provision include level of wholesaler inventories, contract sales volumes and average contract pricing. We regularly review the information related to these estimates and adjust the provision accordingly. Chargeback accruals are based on the differentials between product acquisition prices paid by wholesalers and lower government contract pricing paid by eligible customers covered under federally qualified programs. Distributor service fee accruals are based

36
on contractual fees to be paid to the wholesale distributor for services provided. TRICARE is a health care program of the U.S. Department of Defense Military Health System that provides civilian health benefits for military personnel, military retirees and their dependents. TRICARE rebate accruals are included in chargeback accruals and are based on estimated Department of Defense eligible sales multiplied by the TRICARE rebate formula. See Critical Accounting Estimates and Significant Accounting Policies below for further discussion of gross to net sales accruals.
Gross to net sales accruals and the balance in the related allowance accounts for the years ended December 31, 2013, 2012 and 2011 were as follows (in millions):
Returnsand
Allowances DiscountsGovernment
Rebates
Chargebacksand DistributorService Fees Total
Balance at December 31, 2010 $ 4.8 $ 8.3 $ 84.9 $ 47.4 $ 145.4Allowances for sales during priorperiods — — (5.4) 2.1 (3.3)Allowances for sales during 2011 16.7 56.1 192.1 191.8 456.7Credits/deductions issued for prioryear sales (5.7) (4.2) (34.3) (38.2) (82.4)Credits/deductions issued for salesduring 2011 (6.8) (51.5) (100.3) (138.8) (297.4)
Balance at December 31, 2011 $ 9.0 $ 8.7 $ 137.0 $ 64.3 $ 219.0Allowances for sales during priorperiods (7.5) — (13.3) (2.4) (23.2)Allowances for sales during 2012 15.0 64.9 208.7 212.6 501.2Credits/deductions issued for prioryear sales 1.7 (4.3) (60.2) (54.8) (117.6)Credits/deductions issued for salesduring 2012 (4.9) (58.1) (146.4) (158.5) (367.9)
Balance at December 31, 2012 $ 13.3 $ 11.2 $ 125.8 $ 61.2 $ 211.5Allowances for sales during priorperiods (1.1) — (27.8) (1.9) (30.8)Allowances for sales during 2013 10.7 74.3 262.1 290.8 637.9Credits/deductions issued for prioryear sales (3.1) (5.2) (53.4) (42.0) (103.7)Credits/deductions issued for salesduring 2013 (4.3) (68.2) (172.6) (224.9) (470.0)
Balance at December 31, 2013 $ 15.5 $ 12.1 $ 134.1 $ 83.2 $ 244.9
A comparison of provisions for allowances for sales within each of the four categories noted above for 2013 and 2012 follows:
2013 compared to 2012: Returns and allowances increased by $2.1 million in 2013 compared to 2012, partly due to a first quarter 2012 reversal of approximately $7.5 million in reserves established for certain products with quality issues which were resolved in 2012. In addition, during 2013 we recorded a sales returns reserve of $7.9 million for estimated returns related to the transition of THALOMID® distribution from retail to specialty pharmacies. The increases were partly offset by a $12.5 million net reduction in the VIDAZA® returns provision, which included a $7.5 million reduction in the returns allowance related to inventory levels held by distributors in early 2013 and a $2.8 million increase in the returns allowance related to inventory held by distributors at the end of 2013 given the launch of a generic version of VIDAZA® in September 2013.
Discounts increased by $9.4 million in 2013 compared to 2012, primarily due to sales increases in the United States. Government rebates increased by $38.9 million in 2013 compared to 2012, partly due to an increase of approximately $21.1 million in government rebates related to U.S. governmental agencies, primarily attributable to volume increases and higher expense rates for the Medicare Part D Coverage Gap, partially offset by the refinement of the accrual for rebates to Medicaid Managed Care Organizations completed in the latter part of 2013. Rebates related to international markets increased by approximately $17.8 million, primarily due to a reduction in rebates recorded during 2012 for an amendment to a price/volume agreement for VIDAZA®

37
in a specific European country that resulted in a reduction in government rebates of approximately $10.9 million in 2012. Sales growth in multiple countries worldwide also contributed to higher rebates.
Chargebacks and distributor service fees increased by $78.7 million in 2013 compared to 2012. Chargebacks and distributor service fees increased by approximately $46.2 million and $32.5 million, respectively, primarily due to higher sales volumes and contract eligible sales. Rebates specifically related to the TRICARE program increased by $6.8 million also due to higher sales volume.
2012 compared to 2011: Returns and allowances decreased by $9.2 million in 2012 compared 2011, primarily due to the reversal of approximately $7.5 million in reserves established for certain products with quality issues which were resolved in 2012 and lower returns experience on all products, partially offset by a $7.6 million increase in the returns allowance related to increased levels of VIDAZA® inventory held by distributors at the end of 2012.
Discounts increased by $8.8 million in 2012 compared to 2011, primarily due to revenue increases in the U.S. and international markets, both of which offer different discount programs, and expansion into new international markets. These amounts were partly offset by rebates related to VIDAZA® sales in the Japanese market being included in the chargebacks and distributor service fees category in 2012.
Government rebates increased by $8.7 million in 2012 compared to 2011, primarily due to an increase of approximately $15.8 million in rebates related to various U.S. programs, partly offset by a $7.0 million decrease in rebates in certain international markets. The U.S. programs increase was primarily attributable to volume increases and the refinement of accrual rates for Medicaid Managed Care Organizations and Medicare Part D Coverage Gap. The decrease in government rebates of $7.0 million in international markets was primarily driven by the refinement of select government rebates during the third quarter of 2012.
Chargebacks and distributor service fees increased by $16.3 million in 2012 compared to 2011. Chargebacks increased by approximately $2.8 million and distributor service fees increased by approximately $13.5 million. Chargebacks primarily increased due to $7.7 million of rebates related to VIDAZA® sales in the Japanese market which were included within discounts during the 2011 period, partially offset by a $4.1 million decrease in TRICARE rebates, reflecting lower utilization of THALOMID®. The distributor service fees increase was primarily due to higher sales volumes, including $8.3 million associated with higher sales of ABRAXANE®.
Cost of Goods Sold (excluding amortization of acquired intangible assets): Cost of goods sold and related percentages for the years ended December 31, 2013, 2012 and 2011 were as follows (dollar amounts in millions):
2013 2012 2011Cost of goods sold (excluding amortization of acquired intangible assets) $ 340.4 $ 299.1 $ 425.9Increase (decrease) from prior year $ 41.3 $ (126.8) $ 119.3Percent increase (decrease) from prior year 13.8% (29.8)% 38.9%Percent of net product sales 5.4% 5.6 % 9.1%
Cost of goods sold (excluding amortization of acquired intangible assets) increased by $41.3 million to $340.4 million in 2013 compared to 2012. The increase was primarily due to the higher level of REVLIMID® and ABRAXANE® sales, partly offset by the elimination of royalty payments on sales of REVLIMID® resulting from the expiration of our royalty obligations to Children's Medical Center Corporation (CMCC) at the end of February 2013. As a percent of net product sales, cost of goods sold (excluding amortization of acquired intangible assets) decreased to 5.4% in 2013 compared to 5.6% in 2012 primarily due to the increase in lower cost REVLIMID® sales and the elimination of royalty payments on our sales of REVLIMID® as noted above. See Note 18 of Notes to Consolidated Financial Statements contained in this Annual Report on Form 10-K for additional details related to a lawsuit filed by CMCC against us.
Cost of goods sold (excluding amortization of acquired intangible assets) decreased by $126.8 million to $299.1 million in 2012 compared to 2011. The net decrease was primarily due to the 2011 inclusion of the $90.3 million final inventory step-up amortization adjustment on sales of ABRAXANE® related to the October 2010 acquisition of Abraxis, an aggregate $13.2 million in costs related to the sale of non-core Abraxis products which were divested in April 2011, a $15.3 million decrease in the allocation of prepaid royalties related to sales of VIDAZA® and a $8.6 million decrease in costs related to former Pharmion products to be exited. These decreases were partly offset by an increase in 2012 product material costs resulting from a higher level of sales activity. As a percent of net product sales, cost of goods sold (excluding amortization of acquired intangible assets) decreased to 5.6% in 2012 compared to 9.1% in 2011. Excluding the inventory step-up amortization for ABRAXANE®, the cost of goods sold ratio in 2011 was 7.1%. The cost of goods sold ratio in 2012 was favorably impacted by 0.3% from a reduction in prepaid royalties

38
expensed in 2012 related to sales of VIDAZA® and lower cost products, such as REVLIMID®, comprising a larger portion of total net sales.
Research and Development: Research and development costs are expensed as incurred and primarily include salary and benefit costs, third-party grants and fees paid to clinical research organizations, supplies and upfront and milestone payments resulting from collaboration arrangements.
Research and development expenses and related percentages for the years ended December 31, 2013, 2012 and 2011 were as follows (dollar amounts in millions):
2013 2012 2011Research and development $ 2,226.2 $ 1,724.2 $ 1,600.3Increase from prior year $ 502.0 $ 123.9 $ 471.8Percent increase from prior year 29.1% 7.7% 41.8%Percent of total revenue 34.3% 31.3% 33.0%
Research and development expenses increased by $502.0 million to $2.226 billion in 2013 compared to 2012. The increase was primarily due to a $446.3 million increase in payments made related to research and development collaboration arrangements as well as an increase in general research activity. The increases were partly offset by 2012 in-process research and development (IPR&D) asset impairment charges of $122.5 million, of which $53.4 million related to ISTODAX® for PTCL in Europe and $69.1 million related to an adjustment to the probability weighted forecasted sales of CC-292 compared to prior estimates. No IPR&D asset impairment charges were recorded in 2013.
Research and development expenses increased by $123.9 million to $1.724 billion in 2012 compared to 2011. The increase was primarily due to a $31.9 million increase in payments related to research and development collaboration arrangements, an increase in 2012 research and development project spending in support of multiple programs across a broad range of diseases and the inclusion of Avila expenses incurred subsequent to the March 2012 acquisition date. The expense for 2012 also included $122.5 million in IPR&D asset impairment charges related to ISTODAX® and CC-292 as noted above.
The following table provides a breakdown of research and development expenses (in millions):
Increase (Decrease)
2013 2012 2011
2013versus2012
2012versus2011
Human pharmaceutical clinicalprograms $ 825.3 $ 781.0 $ 732.4 $ 44.3 $ 48.6Other pharmaceutical programs 530.9 428.3 406.1 102.6 22.2Drug discovery and development 202.9 166.6 159.4 36.3 7.2Cellular therapy 25.9 30.9 21.4 (5.0) 9.5Collaboration arrangements 641.2 194.9 163.0 446.3 31.9IPR&D impairments — 122.5 118.0 (122.5) 4.5Total $ 2,226.2 $ 1,724.2 $ 1,600.3 $ 502.0 $ 123.9
We make significant investments in research and development in support of multiple ongoing proprietary clinical development programs which support both our existing products and pipeline of new drug candidates. See Item 1. "Business" for a table summarizing the current stage of development of both our commercial stage products and new drug candidates. Expenses related to collaboration arrangements increased significantly during 2013 compared to 2012 as a result of an increased number of new collaboration arrangements entered into during 2013 as well as higher levels of upfront fees associated with those new collaboration agreements. Expenses for milestone payments related to collaboration arrangements was also higher in 2013 than in 2012. See Note 17 of Notes to Consolidated Financial Statements contained in this Annual Report on Form 10-K for additional details related to our collaboration arrangements.
We do not collect costs on a project basis or for any category of projects for the majority of costs involved in carrying out research projects. While we do perform cost calculations to facilitate our internal evaluation of individual projects, these calculations include

39
significant estimations and allocations that are not relevant to, or included in, our external financial reporting mechanisms. As a consequence, we do not report research and development costs at the project level.
The following table presents significant developments in our phase III clinical trials and regulatory approval requests that occurred during the three-month period ended December 31, 2013, as well as developments that are expected to occur if the future occurrence is material and reasonably certain:
New phase III trials:
Product Disease Indication POMALYST®/IMNOVID® Relapsed/Refractory
Multiple Myeloma
Regulatory approval requests in major markets:
Product Disease Indication MajorMarket
RegulatoryAgency Date of Filing
OTEZLA® (apremilast) Psoriasis U.S. FDA November 2013
Psoriasis and PsoriaticArthritis
E.U. EC December 2013
Regulatory agency actions:
Product Disease Indication MajorMarket
RegulatoryAgency Action
ABRAXANE® Pancreatic cancer E.U. EC Approval
Selling, General and Administrative: Selling, general and administrative expenses primarily include salary and benefit costs for employees included in our sales, marketing, finance, legal and administrative organizations, costs related to the launch of new products or those approved for new indications, outside legal and professional services, donations to independent non-profit patient assistance organizations in the United States and facilities costs.
Selling, general and administrative expenses and related percentages for the years ended December 31, 2013, 2012 and 2011 were as follows (dollar amounts in millions):
2013 2012 2011Selling, general and administrative $ 1,684.5 $ 1,373.5 $ 1,226.3Increase from prior year $ 311.0 $ 147.2 $ 275.7Percent increase from prior year 22.6% 12.0% 29.0%Percent of total revenue 25.9% 24.9% 25.3%
Selling, general and administrative expenses increased by $311.0 million to $1.685 billion in 2013 compared to 2012, partly due to an increase in headcount related costs, including share based compensation expense, and marketing activities primarily related to the global launch of POMALYST®/IMNOVID®, expenses related to the launch of ABRAXANE® in pancreatic cancer, headcount increases and marketing expenses to prepare for the planned future launch of OTEZLA® (apremilast), a $27.7 million increase in service fees attributable to Latin American operations, an increase in incentive accruals and continued support of our currently marketed products, partially offset by a $23.6 million decrease in donations to independent non-profit patient assistance organizations in the United States.
Selling, general and administrative expenses increased by $147.2 million to $1.374 billion in 2012 compared to 2011, partly due to a $72.0 million increase in donations to independent non-profit patient assistance organizations in the United States, a $6.1 million increase in allowances for doubtful accounts related to our European operations and increased marketing activities related to the pre-launch of ABRAXANE® for first-line treatment of advanced NSCLC in the United States and pre-launch activities for POMALYST®/IMNOVID® globally.

40
Amortization of Acquired Intangible Assets: Amortization of intangible assets acquired as a result of business combinations is summarized below for the years ended December 31, 2013, 2012 and 2011 (in millions):
2013 2012 2011Avila $ 47.3 $ 39.4 $ —Abraxis 160.0 99.6 89.3Gloucester 51.5 51.5 40.2Pharmion 4.0 4.0 159.7Total amortization $ 262.8 $ 194.5 $ 289.2
Increase (decrease) from prior year $ 68.3 $ (94.7) $ 86.0
Amortization of acquired intangible assets increased by $68.3 million to $262.8 million in 2013 compared to 2012 primarily due to a $61.9 million increase attributable to the October 2012 approval of ABRAXANE® in the United States for the treatment of NSCLC, which resulted in the commencement of amortization of the related intangible asset, and a $7.9 million increase in amortization related to intangible assets obtained in the March 2012 acquisition of Avila, partly offset by certain Abraxis related intangibles becoming fully amortized early in 2012.
Amortization of acquired intangible assets decreased by $94.7 million to $194.5 million in 2012 compared to 2011 primarily due to certain Pharmion intangible assets becoming fully amortized at the end of 2011, which reduced amortization expense in 2012 by $155.8 million. The decrease was partly offset by the addition of intangible assets obtained in the March 2012 acquisition of Avila, which increased amortization expense by $39.4 million. In addition, the June 2011 FDA approval of ISTODAX® for treatment of PTCL in patients who have received at least one prior therapy increased amortization expense by $15.0 million and the October 2012 approval of ABRAXANE® in the United States for the treatment of NSCLC increased amortization expense by $16.3 million, both of which resulted from the commencement of amortization of the related intangible assets.
Acquisition Related (Gains) Charges and Restructuring, net: Acquisition related (gains) charges and restructuring, net is summarized below for the years ended December 31, 2013, 2012 and 2011 (dollar amounts in millions):
2013 2012 2011Acquisition related (gains) charges and restructuring, net $ 171.1 $ 169.0 $ (142.3)Increase (decrease) from prior year $ 2.1 $ 311.3 $ (189.6)Percentage increase from prior year 1.2% N/M N/M
Acquisition related (gains) charges and restructuring, net was a net charge of $171.1 million in 2013 and $169.0 million in 2012. The net increase in expense of $2.1 million in 2013 compared to 2012 was primarily due to a combined $80.8 million unfavorable change in the income statement impact related to the fair values of our contingent consideration liabilities related to the Gloucester and Avila acquisitions, partly offset by a $76.1 million favorable change in the income statement impact related to the fair value of our our publicly traded contingent value rights (CVRs) that were issued as part of the acquisition of Abraxis.
Acquisition related (gains) charges and restructuring, net increased by $311.3 million in 2012 compared to 2011 primarily due to a $368.3 million change in the income statement impact related to the fair value of our CVRs. We recorded a $216.8 million charge in 2012 and a $151.5 million gain in 2011. In addition, in 2012 we recorded a $9.2 million accretion of the contingent consideration liability related to our acquisition of Avila. The increases were partly offset by a $63.6 million reduction in the contingent consideration liability related to the approval of ISTODAX® for PTCL in Europe.
Interest and Investment Income, Net: Interest and investment income, net is summarized below for the years ended December 31, 2013, 2012 and 2011 (dollar amounts in millions):
2013 2012 2011Interest and investment income, net $ 22.0 $ 15.3 $ 25.9Increase (decrease) from prior year $ 6.7 $ (10.6) $ (18.9)Percentage increase (decrease) from prior year 43.8% (41.0)% (42.2)%

41
Interest and investment income, net increased by $6.7 million to $22.0 million in 2013 compared to 2012 primarily due to higher investment balances compared to the prior year, partly offset by a $6.1 million increase in losses on sales of marketable securities.
Interest and investment income, net decreased by $10.6 million to $15.3 million in 2012 compared to 2011. The decrease was primarily due to a $3.7 million reduction in interest income due to lower overall interest rates, a $5.1 million net decrease in gains on sales of marketable securities and a $1.9 million net increase in the cost of amortization of discounts and premiums related to marketable securities.
Interest Expense: Interest expense is summarized below for the years ended December 31, 2013, 2012 and 2011 (in millions):
2013 2012 2011Interest expense $ 91.6 $ 63.2 $ 42.7Increase from prior year $ 28.4 $ 20.5 $ 30.1
Interest expense increased by $28.4 million to $91.6 million in 2013 compared to 2012 primarily due to interest and fees associated with the issuance of $1.500 billion in senior notes in both August 2013 and August 2012.
Interest expense increased by $20.5 million to $63.2 million in 2012 compared to 2011 primarily due to interest and fees associated with the issuance in August 2012 of the $1.500 billion in senior notes referred to above and an increase in interest on Commercial Paper borrowings, which was in effect for full year 2012.
Other Income (Expense), Net: Other income, net is summarized below for the years ended December 31, 2013, 2012 and 2011 (in millions):
2013 2012 2011Other income (expense), net $ (73.9) $ (17.0) $ (6.4)Increase (decrease) from prior year $ (56.9) $ (10.6) $ 2.8
Other expense increased by $56.9 million to $73.9 million in 2013 compared to 2012, primarily due to a $73.7 million increase in investment related impairment charges, including an $80.0 million impairment charge related to a royalty receivable asset that was received in April 2011 as partial consideration for the sale of the Abraxis non-core assets. The increase was partly offset by increased gains of $18.8 million related to foreign exchange contracts not designated as hedging instruments which were intended to mitigate the impact of exchange rate volatility in the translation of foreign earnings.
Other expense increased by $10.6 million to $17.0 million in 2012 compared to 2011, primarily due to $25.5 million in impairment losses related to cost method investments. The increase was partly offset by a $7.4 million gain on the sale of equity securities, net gains of $3.7 million related to the short period in June 2012 when certain treasury rate lock agreements were not designated as hedges and a $2.1 million decrease in equity method investment losses.
Income Tax Provision: The income tax provision decreased by $9.8 million to $215.5 million in 2013 compared to 2012. The full year 2013 underlying effective tax rate of 12.2% reflects the impact of our global business footprint. The decrease in the underlying effective tax rate from 2012 reflects an increase in tax benefits from certain collaboration and acquisition-related items, including the $80.0 million impairment charge for the royalty receivable referred to above, and upfront payments to collaboration partners of $227.0 million that were incurred in the fourth quarter of 2013. The effective tax rate for 2013 was increased by 0.7 percentage points as a result of discrete items, including a net increase in unrecognized tax benefits resulting from ongoing examinations and settlements with taxing authorities, partially offset by tax benefits from the retroactive reinstatement of the 2012 U. S. research and development tax credit. The U.S. research and development tax credit expired on December 31, 2011 and was retroactively reinstated in the first quarter of 2013.
The income tax provision increased by $123.2 million to $225.3 million in 2012 compared to 2011. The full year 2012 underlying effective tax rate of 13.5% reflects the impact of our global business footprint. The increase in the underlying effective tax rate from 2011 reflects a decrease in tax benefits from certain acquisition-related items. The effective tax rate for 2012 was reduced by 0.1 percentage points as a result of discrete items, including tax benefits related to the settlement of tax examinations and expirations of statutes of limitations offset by an increase in deferred tax liabilities recorded on certain unremitted foreign earnings previously treated as permanently reinvested in such foreign jurisdictions and tax expense related to the filing of our 2011 income tax returns with certain items being less favorable than originally estimated. The U.S. research and development tax credit expired on December 31, 2011 and was retroactively reinstated in the first quarter of 2013. The tax benefit of our 2012 research credit was recorded in the first quarter of 2013. This change in tax law did not have a significant impact on our income tax provisions.

42
The income tax provision for 2011 included a full year underlying effective tax rate of 11.5%. The effective tax rate was reduced by 4.3 percentage points in 2011 as a result of discrete items which included tax benefits related to a foreign tax credit, a decrease in unrecognized tax benefits for certain ongoing income tax audits and expirations of statutes of limitations, and a net tax benefit related to changes in state tax laws.
Net Income: Net income and per common share amounts for the years ended December 31, 2013, 2012 and 2011 were as follows (dollar amounts in millions, except per share data):
2013 2012 2011Net income attributable to Celgene $ 1,449.9 $ 1,456.2 $ 1,318.1Per common share amounts:
Basic $ 3.50 $ 3.38 $ 2.89Diluted $ 3.37 $ 3.30 $ 2.85
Weighted average shares: Basic 413.8 430.9 455.3Diluted 430.3 440.8 462.7
The $6.3 million decrease in net income to $1.450 billion in 2013 compared to 2012 was primarily due to a $446.3 million increase in payments made related to research and development collaboration arrangements, a $61.9 million increase in ABRAXANE®
amortization expense due to the October 2012 FDA approval of ABRAXANE® for treatment of NSCLC, a $94.8 million increase in share-based compensation expense, and increased spending in support of our currently marketed products and those that we plan to launch. The increases in expense were nearly offset by the favorable impact from a higher level of net product sales. The $0.07 increase in diluted earnings per share in 2013 compared to 2012 was favorably impacted by the repurchase of 22.3 million common shares under our common share repurchase program, reducing our outstanding share base.
Net income increased by $138.1 million to $1.456 billion and diluted earnings per share increased by $0.45 to $3.30 in 2012 compared to 2011 reflecting a higher level of net product sales, reduction in amortization of acquired intangible assets primarily due to certain intangible assets becoming fully amortized at the end of 2011 and a decrease in cost of goods sold, resulting from the 2011 inclusion of inventory step-up amortization for sales of ABRAXANE®. These favorable items were partly offset by an increase in the fair value of our liability related to publicly traded CVRs, an increase in payments related to research and development collaboration arrangements and increase in marketing activity, primarily related to pre-launch expenses for POMALYST® and ABRAXANE® for new indications. Earnings per diluted share were also favorably impacted in 2012 by the repurchase of 28.6 million common shares under our common share repurchase program, reducing our outstanding share base.

43
Liquidity and Capital Resources
The following table summarizes the components of our financial condition for the years ended December 31, 2013, 2012 and 2011 (in millions):
Increase (Decrease)
2013 2012 2011
2013versus2012
2012versus2011
Financial assets: Cash and cash equivalents $ 3,234.4 $ 2,090.4 $ 1,859.5 $ 1,144.0 $ 230.9Marketable securities available forsale 2,452.6 1,809.9 788.7 642.7 1,021.2
Total financial assets $ 5,687.0 $ 3,900.3 $ 2,648.2 $ 1,786.7 $ 1,252.1Debt:
Short-term borrowings $ 544.8 $ 308.5 $ 526.7 $ 236.3 $ (218.2)Long-term debt, net of discount 4,196.5 2,771.3 1,275.6 1,425.2 1,495.7
Total debt $ 4,741.3 $ 3,079.8 $ 1,802.3 $ 1,661.5 $ 1,277.5Working capital1 $ 5,607.4 $ 3,767.6 $ 2,660.0 $ 1,839.8 $ 1,107.6
1 Includes cash, cash equivalents and marketable securities available for sale, accounts receivable, net of allowances, inventory and other current assets, less short-term borrowings, accounts payable, accrued expenses, income taxes payable and other current liabilities.
We rely primarily on positive cash flows from operating activities, proceeds from sales of available-for-sale marketable securities, and borrowings in the form of long-term notes payable and short-term Commercial Paper to provide for our liquidity requirements. We expect continued growth in our expenditures, particularly those related to research and development, clinical trials, commercialization of new products, international expansion and capital investments. However, we anticipate that existing cash and cash equivalent balances, marketable securities available for sale, cash generated from operations and existing sources of and access to financing are adequate to fund our operating needs, capital expenditures, debt service requirements and our plans to repurchase stock or pursue other strategic business initiatives for the foreseeable future.
Many of our operations are conducted outside the United States and significant portions of our cash, cash equivalents and short-term investments are held internationally. As of December 31, 2013, we held approximately $4.701 billion of these short-term funds in foreign tax jurisdictions. The amount of funds held in U.S. tax jurisdictions can fluctuate due to the timing of receipts and payments in the ordinary course of business and due to other reasons, such as repurchases of our common stock and business-development activities. As part of our ongoing liquidity assessments, we regularly monitor the mix of domestic and international cash flows (both inflows and outflows). Repatriation of overseas funds can result in additional U.S. federal, state and local income tax payments. We record U.S. deferred tax liabilities for certain unremitted earnings, but when amounts earned overseas are expected to be permanently reinvested outside of the United States, no accrual for U.S. taxes is provided. Approximately $900.0 million of our foreign earnings, included in the $4.701 billion of short-term funds in foreign tax jurisdictions, may not be required for use in offshore operations and may be available for use in the United States. These earnings are not treated as permanently reinvested and accordingly, our deferred tax liabilities as of December 31, 2013 and December 31, 2012 included $316.5 million for the estimated U.S. federal and state income taxes that may be incurred should these earnings be repatriated. The remaining foreign earnings are unremitted and expected to be permanently reinvested outside the United States. We do not rely on these earnings as a source of funds for our domestic business as we expect to have sufficient current cash resources combined with future cash flows in the United States to fund our U.S. operational and strategic needs.
Share Repurchase Program: Our Board of Directors has approved an aggregate $9.500 billion stock repurchase program of which we have approximately $2.068 billion remaining for future share repurchases. During 2013, we used $2.765 billion for repurchases of our common stock, measured on a settlement date basis.
Components of Working Capital
Cash, Cash Equivalents and Marketable Securities Available for Sale: We invest our excess cash primarily in money market funds, U.S. Treasury securities, U.S. government-sponsored agency securities, U.S. government-sponsored agency mortgage-backed securities, non-U.S. government agency and Supranational securities, global corporate debt securities and asset backed securities. All liquid investments with maturities of three months or less from the date of purchase are classified as cash equivalents and all investments with maturities of greater than three months from the date of purchase are classified as marketable securities

44
available for sale. We determine the appropriate classification of our investments in marketable debt and equity securities at the time of purchase. The $1.787 billion increase in cash, cash equivalents and marketable securities available for sale at December 31, 2013 compared to 2012 was primarily due to the issuance of $1.500 billion in senior notes in August 2013, net increase of $234.1 million in short-term borrowings and by cash generated from operations, partly offset by $2.765 billion paid under our share repurchase program.
Marketable securities available for sale are carried at fair value, held for an unspecified period of time and are intended for use in meeting our ongoing liquidity needs. Unrealized gains and losses on available-for-sale securities, which are deemed to be temporary, are reported as a separate component of stockholders' equity, net of tax. The cost of debt securities is adjusted for amortization of premiums and accretion of discounts to maturity. The amortization, along with realized gains and losses and other than temporary impairment charges, is included in interest and investment income, net. For more information related to the fair value and valuation of our marketable securities, see Note 4 of Notes to Consolidated Financial Statements included in this Annual Report on Form 10-K.
Accounts Receivable, Net: Accounts receivable, net increased by $100.9 million to $1.061 billion at December 31, 2013 compared to December 31, 2012 primarily due to increased U.S. and international sales of REVLIMID®, ABRAXANE® and POMALYST®/IMNOVID®. Sales made outside the United States typically have payment terms that are greater than 60 days, thereby extending collection periods beyond those in the United States. We expect our accounts receivable balance to continue to grow as our international sales continue to expand.
We continue to monitor economic conditions, including the volatility associated with international economies, the sovereign debt crisis in certain European countries and associated impacts on the financial markets and our business. Our current business model in these markets is typically to sell our products directly to principally government owned or controlled hospitals, which in turn directly deliver critical care to patients. Our products are used to treat life-threatening diseases and we believe this business model enables timely delivery and adequate supply of products. Many of the outstanding receivable balances are related to government-funded hospitals and we believe the receivable balances are ultimately collectible. Similarly, we believe that future sales to these customers will continue to be collectible. The credit and economic conditions within Spain, Italy, Portugal and Greece, as well as increasing sales levels in those countries have resulted in, and may continue to result in, an increase in the average length of time it takes to collect accounts receivable. Our total net receivables in Spain, Italy and Portugal are composed almost entirely of amounts receivable from government-owned or controlled hospitals and the public sector and amounted to $348.4 million at December 31, 2013 compared to $324.2 million at December 31, 2012. Approximately $86.4 million of the $348.4 million receivable at December 31, 2013 was greater than one year past due. Our exposure to the sovereign debt crisis in Greece is limited, as we do not have a material amount of receivables in Greece. We maintain timely and direct communication with hospital customers in Spain, Italy and Portugal regarding both the current and past due receivable balances. We continue to receive payments from these countries and closely monitor the plans for payment at the regional government level. Payments from customers in these countries are not received on regular intervals and several months could elapse between significant payments. In determining the appropriate allowance for doubtful accounts for Spain, Italy and Portugal, we considered that the balance of past due receivables is related to sales made to government-owned or supported customers. We regularly monitor developments in Europe to assess whether the level of risk of default for any customers has increased and note the ongoing efforts by the European Union, European Monetary Union and International Monetary Fund to support countries with large public deficits and outstanding debt balances. We also monitor the efforts of individual countries to support their regions with large public deficits and outstanding debt balances. We have not experienced significant losses or write-offs with respect to the collection of our accounts receivable in these countries as a result of their economic difficulties and we do not expect to have write-offs or adjustments to accounts receivable which would have a material adverse impact on our financial position or results of operations.
Inventory: Inventory balances increased by $80.9 million to $340.4 million at the end of 2013 compared to 2012. The increase was primarily due to an increase in ABRAXANE® inventories, attributable to a higher sales level resulting from the FDA approvals of ABRAXANE® for treatment of NSCLC in October 2012 and pancreatic cancer in September 2013, as well as $33.4 million of OTEZLA® (apremilast) inventory that has been capitalized prior to regulatory approval, in anticipation of regulatory approval for this product.
Other Current Assets: Other current assets increased by $116.2 million to $436.4 million at the end of 2013 compared to 2012 primarily due to a $48.8 million increase in prepaid taxes, a $33.9 million increase in the fair value of foreign currency forward contracts and a net increase in other prepaid accounts.
Commercial Paper: In September 2011, we entered into a commercial paper program (the Program) under which we issue unsecured commercial paper notes (Commercial Paper) on a private placement basis, the proceeds of which are used for general corporate purposes. The maximum aggregate amount available under the Program is currently $1.500 billion. The maturities of

45
the Commercial Paper may vary, but may not exceed 270 days from the date of issue. The Commercial Paper is sold under customary terms to a dealer or in the commercial paper market and is issued at a discount from par or, alternatively, is sold at par and bears varying interest rates on a fixed or floating basis. Borrowings under the Program are accounted for as short-term borrowings. As of December 31, 2013, $544.8 million of Commercial Paper was outstanding bearing an effective interest rate of 0.4%.
Senior Unsecured Credit Facility: In September 2011, we entered into a senior unsecured revolving credit facility (Credit Facility) providing for revolving credit in the aggregate amount of $1.000 billion, which was increased to $1.500 billion in April 2013. The term of the Credit Facility was also extended from September 2, 2016 to April 18, 2018. Subject to certain conditions, we have the right to increase the amount of the Credit Facility (but in no event more than one time per annum), up to a maximum aggregate amount of $1.750 billion.
Amounts may be borrowed under the Credit Facility for working capital, capital expenditures and other corporate purposes. The Credit Facility serves as backup liquidity for our Commercial Paper borrowings. As of December 31, 2013 there was no outstanding borrowing against the Credit Facility. The Credit Facility contains affirmative and negative covenants including certain customary financial covenants. We were in compliance with those covenants as of December 31, 2013.
Accounts Payable, Accrued Expenses and Other Current Liabilities: Accounts payable, accrued expenses and other current liabilities increased by $4.4 million to $1.357 billion at the end of 2013 compared to 2012. The increase was primarily due to increases of $93.1 million in compensation related expenses, $45.3 million of contingent consideration related to the January 2012 Avila acquisition, $45.0 million related to collaboration agreements, $30.3 million related to sales adjustments, $22.7 million related to foreign exchange contracts, $22.8 million in accrued interest and other miscellaneous liabilities. The increases were mostly offset by the 2013 payment of a $300.0 million liability, which had a fair value of $277.4 million at the end of 2012, associated with our publicly traded CVRs.
Income Taxes Payable (Current and Non-Current): Income taxes payable increased by $51.0 million to $251.0 million at the end of 2013 compared to 2012, primarily from the current provision for income taxes of $462.1 million, net deferred intercompany credits of $32.6 million and an increase in refundable income taxes of $23.9 million, offset by income tax payments of $291.9 million and a tax benefit of stock options of $171.7 million.
Senior Notes: In August 2013, we issued an additional $1.500 billion principal amount of senior notes consisting of $400.0 million aggregate principal amount of 2.300% Senior Notes due 2018 (the 2018 notes), $700.0 million aggregate principal amount of 4.000% Senior Notes due 2023 (the 2023 notes) and $400.0 million aggregate principal amount of 5.250% Senior Notes due 2043 (the 2043 notes) and, together with the 2018 notes and 2023 notes, referred to herein as the “2013 issued notes”. The 2013 issued notes were issued at 99.792%, 99.452% and 99.147% of par, respectively, and the discount is being amortized as additional interest expense over the period from issuance through maturity. Offering costs of approximately $12.5 million have been recorded as debt issuance costs on our Consolidated Balance Sheets and are being amortized as additional interest expense using the effective interest rate method over the period from issuance through maturity. Interest on the notes is payable semi-annually in arrears on February 15 and August 15 each year beginning February 15, 2014 and the principal on each note is due in full at their respective maturity dates. The notes may be redeemed at our option, in whole or in part, at any time at a redemption price defined in a make-whole clause equaling accrued and unpaid interest plus the greater of 100% of the principal amount of the notes to be redeemed or the sum of the present values of the remaining scheduled payments of interest and principal discounted to the date of redemption on a semi-annual basis plus 15 basis points in the case of the 2018 notes, 20 basis points in the case of the 2023 notes and 25 basis points in the case of the 2043 notes. If we experience a change of control accompanied by a downgrade of the debt to below investment grade, we will be required to offer to repurchase the notes at a purchase price equal to 101% of their principal amount plus accrued and unpaid interest. We are subject to covenants which limit our ability to pledge properties as security under borrowing arrangements and limit our ability to perform sale and leaseback transactions involving our property. The carrying value of all of our senior notes issued was $4.196 billion at December 31, 2013.

46
Cash flows from operating, investing and financing activities for the years ended December 31, 2013, 2012 and 2011 were as follows (in millions):
Increase (Decrease)
2013 2012 2011
2013versus2012
2012versus2011
Net cash provided by operatingactivities $ 2,225.9 $ 2,018.6 $ 1,776.1 $ 207.3 $ 242.5Net cash (used in) provided byinvesting activities $ (528.6) $ (1,553.6) $ 377.7 $ 1,025.0 $ (1,931.3)
Net cash used in financing activities $ (553.7) $ (248.8) $ (1,622.0) $ (304.9) $ 1,373.2
Operating Activities: Net cash provided by operating activities increased by $207.3 million to $2.226 billion in 2013 compared to 2012 primarily as a result of an expansion of our operations and a related increase in net earnings.
Net cash provided by operating activities in 2012 increased by $242.5 million to $2.019 billion compared to 2011 primarily as a result of an expansion of our operations and related increase in net earnings.
Investing Activities: Net cash used in investing activities decreased by $1.025 billion in 2013 compared to 2012. The decrease in net cash used in investing activities was principally related to a cash use of $341.3 million for net purchases of marketable securities available for sale during 2013 compared to a cash use of $1.025 billion for net purchases in 2012, plus the use of $352.2 million for the acquisition of Avila in 2012.
Net cash used in investing activities in 2012 changed to a net use of $1.554 billion compared to $377.7 million of net cash provided by investing activities in 2011. The decrease in net cash provided by investing activities was principally related to a cash use of $1.025 billion for net purchases of marketable securities available for sale during 2012 compared to net sales of $481.8 million in 2011, plus the use of $352.2 million for the acquisition of Avila and $48.9 million for the purchase of intellectual property and other assets.
Financing Activities: Net cash used in financing activities in 2013 was $553.7 million compared to a net cash use of $248.8 million in 2012. The $304.9 million increase in net cash used in financing activities was primarily attributable to a $721.0 million increase in cash used for the purchase of treasury shares and a cash use of $225.0 million recorded as a financing activity to reflect the portion of a $300.0 million milestone payment to holders of our CVRs that represents the original fair value of Abraxis contingent consideration. These increases were partially offset by net proceeds from borrowing of $234.1 million during 2013 compared to net repayments of $217.4 million in 2012. Proceeds from issuances of common stock under our employee stock plans plus the excess tax benefit from share-based compensation arrangements provided an aggregate $721.0 million during 2013, which is an increase of $195.5 million from 2012.
Net cash used in financing activities in 2012 was $248.8 million compared to a net cash use of $1.622 billion in 2011. The $1.372 billion decrease in net cash used in financing activities in 2012 was primarily attributable to $1.487 billion of proceeds from the issuance of long-term debt, partially offset by $217.4 million of net repayments of short-term borrowing in 2012, compared to $525.7 million of net short-term borrowing in 2011. During 2012 and 2011, we used $2.044 billion and $2.189 billion, respectively, for repurchases of our common stock, measured on a settlement date basis.

47
Contractual Obligations
The following table sets forth our contractual obligations as of December 31, 2013 (in millions):
Payment Due By Period
Less than
1 Year 1 to 3 Years 3 to 5 YearsMore than
5 Years TotalSenior notes1 $ 146.5 $ 780.6 $ 1,158.9 $ 3,998.0 $ 6,084.0Short-term borrowings 544.8 — — — 544.8Operating leases 54.5 87.3 52.8 44.6 239.2Other contract commitments 101.7 68.6 — — 170.3Total $ 847.5 $ 936.5 $ 1,211.7 $ 4,042.6 $ 7,038.3
1 The senior note obligation amounts include future principal and interest payments.
Senior Notes: In August 2013, we issued $1.500 billion principal amount of senior notes consisting of $400.0 million aggregate principal amount of 2.300% Senior Notes due 2018, $700.0 million aggregate principal amount of 4.000% Senior Notes due 2023 and $400.0 million aggregate principal amount of 5.250% Senior Notes due 2043.
In August 2012, we issued a total of $1.500 billion principal amount of senior notes consisting of $500.0 million aggregate principal amount of 1.90% Senior Notes due 2017, and $1.000 billion aggregate principal amount of 3.25% Senior Notes due 2022.
In October 2010, we issued a total of $1.250 billion principal amount of senior notes consisting of $500.0 million aggregate principal amount of 2.45% Senior Notes due 2015, $500.0 million aggregate principal amount of 3.95% Senior Notes due 2020 and $250.0 million aggregate principal amount of 5.7% Senior Notes due 2040.
Short-term Borrowings: Contractual obligations related to short-term borrowings included principal, interest and fees of $544.8 million related to commercial paper outstanding at December 31, 2013.
Operating Leases: We lease office and research facilities under various operating lease agreements in the United States and various international markets. The non-cancelable lease terms for operating leases expire at various dates between 2014 and 2023 and include renewal options. In general, we are also required to reimburse the lessors for real estate taxes, insurance, utilities, maintenance and other operating costs associated with the leases. For more information on the major facilities that we occupy under lease arrangements refer to Part I, Item 2. "Properties" of this Annual Report on Form 10-K.
Other Contract Commitments: Other contract commitments of $170.3 million on December 31, 2013 primarily included $153.7 million in contractual obligations related to product supply contracts and a remaining $14.6 million balance due in connection with our acquisition of a manufacturing facility in Switzerland.
Collaboration Arrangements: We have entered into certain research and development collaboration agreements with third parties that include the funding of certain development, manufacturing and commercialization efforts with the potential for future milestone and royalty payments upon the achievement of pre-established developmental, regulatory and/or commercial targets. Our obligation to fund these efforts is contingent upon continued involvement in the programs and/or the lack of any adverse events which could cause the discontinuance of the programs. Due to the nature of these arrangements, the future potential payments related to the attainment of specified development and regulatory approval milestones over a period of several years are inherently uncertain, and accordingly, no amounts have been recorded for these future potential payments in our Consolidated Balance Sheets at December 31, 2013 and 2012 contained in this Annual Report on Form 10-K. Potential milestone payments (not including potential royalty payments) total approximately $4.300 billion, including approximately $3.503 billion contingent on the achievement of various research, development and regulatory approval milestones and approximately $796.7 million in sales-based milestones. The more notable collaboration agreements are identified in Note 17 of Notes to Consolidated Financial Statements contained in this Annual Report on Form 10-K.
New Accounting Standards
For a discussion of new accounting standards please see Note 1 of Notes to Consolidated Financial Statements contained in this Annual Report on Form 10-K.

48
Critical Accounting Estimates and Significant Accounting Policies
A critical accounting policy is one that is both important to the portrayal of our financial condition and results of operation and requires management's most difficult, subjective or complex judgments, often as a result of the need to make estimates about the effect of matters that are inherently uncertain. While our significant accounting policies are more fully described in Note 1 of Notes to Consolidated Financial Statements included in this Annual Report on Form 10-K, we believe the following accounting estimates and policies to be critical:
Revenue Recognition: Revenue from the sale of products is recognized when title and risk of loss of the product is transferred to the customer and the sales price is fixed and determinable. Provisions for discounts, early payments, rebates, sales returns and distributor chargebacks under terms customary in the industry are provided for in the same period the related sales are recorded. We record estimated reductions to revenue for volume-based discounts and rebates at the time of the initial sale. The estimated reductions to revenue for such volume-based discounts and rebates are based on the sales terms, historical experience and trend analysis.
We recognize revenue from royalties based on licensees' sales of our products or products using our technologies. Royalties are recognized as earned in accordance with the contract terms when royalties from licensees can be reasonably estimated and collectability is reasonably assured. If royalties cannot be reasonably estimated or collectability of a royalty amount is not reasonably assured, royalties are recognized as revenue when the cash is received.
Gross to Net Sales Accruals: We base our sales returns allowance on estimated on-hand retail/hospital inventories, measured end-customer demand as reported by third-party sources, actual returns history and other factors, such as the trend experience for lots where product is still being returned or inventory centralization and rationalization initiatives conducted by major pharmacy chains, as applicable. If the historical data we use to calculate these estimates do not properly reflect future returns, then a change in the allowance would be made in the period in which such a determination is made and revenues in that period could be materially affected. Under this methodology, we track actual returns by individual production lots. Returns on closed lots, that is, lots no longer eligible for return credits, are analyzed to determine historical returns experience. Returns on open lots, that is, lots still eligible for return credits, are monitored and compared with historical return trend rates. Any changes from the historical trend rates are considered in determining the current sales return allowance. REVLIMID®, POMALYST® and THALOMID® are distributed primarily through hospitals and contracted pharmacies, which are typically subject to tighter controls of inventory quantities within the supply channel, resulting in generally lower returns activity for those products.
Sales discount accruals are based on payment terms extended to customers.
Government rebate accruals are based on estimated payments due to governmental agencies for purchases made by third parties under various governmental programs. U.S. Medicaid rebate accruals are generally based on historical payment data and estimates of future Medicaid beneficiary utilization applied to the Medicaid unit rebate formula established by the Center for Medicaid and Medicare Services. The Medicaid rebate percentage was increased and extended to Medicaid Managed Care Organizations in March 2010. The accrual of the rebates associated with Medicaid Managed Care Organizations is calculated based on estimated historical patient data related to Medicaid Managed Care Organizations. We have also analyzed actual billings received from the states to further support the accrual rates. Subsequent to implementation of the Patient Protection and Affordable Care Act and the Health Care and Education Reconciliation Act of 2010 (collectively the 2010 U.S. Health Care Reform Law), certain states have only recently begun submitting partial Medicaid Managed Care Organization bills. Our accruals for these Medicaid Managed Care Organization rebates had been at elevated levels given the delays in the receipt of complete invoices from certain states. Due to the receipt of more complete claims data as 2013 progressed, the accruals for certain states were reduced from the elevated levels at December 31, 2012 as a result of both the payments made being applied to the accrual and a $20.3 million favorable change in estimate of the ultimate obligation. We will continue to adjust the rebate accruals as more information becomes available and to reflect actual claims experience. Effective January 1, 2011, manufacturers of pharmaceutical products are responsible for 50% of the patient’s cost of branded prescription drugs related to the Medicare Part D Coverage Gap. In order to estimate the cost to us of this coverage gap responsibility, we analyze data for eligible Medicare Part D patients against data for eligible Medicare Part D patients treated with our products as well as the historical invoices. This expense is recognized throughout the year as costs are incurred. In addition, certain international markets have government-sponsored programs that require rebates to be paid based on program specific rules and, accordingly, the rebate accruals are determined primarily on estimated eligible sales.
Rebates or administrative fees are offered to certain wholesale customers, group purchasing organizations and end-user customers, consistent with pharmaceutical industry practices. Settlement of rebates and fees may generally occur from one to 15 months from the date of sale. We provide a provision for rebates at the time of sale based on contracted rates and historical redemption rates. Assumptions used to establish the provision include level of wholesaler inventories, contract sales volumes and average contract pricing. We regularly review the information related to these estimates and adjust the provision accordingly.

49
Chargeback accruals are based on the differentials between product acquisition prices paid by wholesalers and lower government contract pricing paid by eligible customers covered under federally qualified programs. Distributor service fee accruals are based on contractual fees to be paid to the wholesale distributor for services provided. TRICARE is a health care program of the U.S. Department of Defense Military Health System that provides civilian health benefits for military personnel, military retirees and their dependents. TRICARE rebate accruals are included in chargeback accruals and are based on estimated Department of Defense eligible sales multiplied by the TRICARE rebate formula.
Allowance for Doubtful Accounts: We estimate an allowance for doubtful accounts primarily based on the credit worthiness of our customers, historical payment patterns, aging of receivable balances and general economic conditions, including publicly available information on the credit worthiness of countries themselves and provinces or areas within such countries where they are the ultimate customers.
Income Taxes: We utilize the asset and liability method of accounting for income taxes. Under this method, deferred tax assets and liabilities are determined based on the difference between the financial statement carrying amounts and tax bases of assets and liabilities using enacted tax rates in effect for years in which the temporary differences are expected to reverse. We provide a valuation allowance when it is more likely than not that deferred tax assets will not be realized.
We account for interest and penalties related to uncertain tax positions as part of our provision for income taxes. These unrecognized tax benefits relate primarily to issues common among multinational corporations in our industry. We apply a variety of methodologies in making these estimates which include studies performed by independent economists, advice from industry and subject experts, evaluation of public actions taken by the U.S. Internal Revenue Service and other taxing authorities, as well as our own industry experience. We provide estimates for unrecognized tax benefits. If our estimates are not representative of actual outcomes, our results of operations could be materially impacted.
We periodically evaluate the likelihood of the realization of deferred tax assets, and reduce the carrying amount of these deferred tax assets by a valuation allowance to the extent we believe a portion will not be realized. We consider many factors when assessing the likelihood of future realization of deferred tax assets, including our recent cumulative earnings experience by taxing jurisdiction, expectations of future taxable income, carryforward periods available to us for tax reporting purposes, various income tax strategies and other relevant factors. Significant judgment is required in making this assessment and, to the extent future expectations change, we would have to assess the recoverability of our deferred tax assets at that time. At December 31, 2013, it was more likely than not that we would realize our deferred tax assets, net of valuation allowances.
Share-Based Compensation: We utilize share based compensation in the form of stock options, restricted stock units, or RSUs, and performance-based restricted stock units, or PSUs. Compensation expense is recognized in the Consolidated Statements of Income based on the estimated fair value of the awards at grant date. Compensation expense recognized reflects an estimate of the number of awards expected to vest after taking into consideration an estimate of award forfeitures based on actual experience and is recognized on a straight-line basis over the requisite service period, which is generally the vesting period required to obtain full vesting. Management expectations related to the achievement of performance goals associated with PSU grants is assessed regularly and that assessment is used to determine whether PSU grants are expected to vest. If performance-based milestones related to PSU grants are not met or not expected to be met, any compensation expense recognized to date associated with grants that are not expected to vest will be reversed.
Other-Than-Temporary Impairments of Available-For-Sale Marketable Securities: A decline in the market value of any available-for-sale marketable security below its cost that is deemed to be other-than-temporary results in a reduction in carrying amount to fair value. The impairment is charged to operations and a new cost basis for the security established. The determination of whether an available-for-sale marketable security is other-than-temporarily impaired requires significant judgment and requires consideration of available quantitative and qualitative evidence in evaluating the potential impairment. Factors evaluated to determine whether the investment is other-than-temporarily impaired include: significant deterioration in the issuer's earnings performance, credit rating, asset quality, business prospects of the issuer, adverse changes in the general market conditions in which the issuer operates, length of time that the fair value has been below our cost, our expected future cash flows from the security, our intent not to sell, an evaluation as to whether it is more likely than not that we will not have to sell before recovery of our cost basis, and issues that raise concerns about the issuer's ability to continue as a going concern. Assumptions associated with these factors are subject to future market and economic conditions, which could differ from our assessment.
Derivatives and Hedging Activities: All derivative instruments are recognized on the balance sheet at their fair value. Changes in the fair value of derivative instruments are recorded each period in current earnings or other comprehensive income (loss), depending on whether a derivative instrument is designated as part of a hedging transaction and, if it is, the type of hedging transaction. For a derivative to qualify as a hedge at inception and throughout the hedged period, we formally document the nature and relationships between the hedging instruments and hedged item. We assess, both at inception and on an on-going basis, whether the derivative instruments that are used in cash flow hedging transactions are highly effective in offsetting the changes in cash flows of hedged items. We assess hedge effectiveness on a quarterly basis and record the gain or loss related to the ineffective

50
portion of derivative instruments, if any, to current earnings. If we determine that a forecasted transaction is no longer probable of occurring, we discontinue hedge accounting and any related unrealized gain or loss on the derivative instrument is recognized in current earnings. We use derivative instruments, including those not designated as part of a hedging transaction, to manage our exposure to movements in foreign exchange and interest rates. The use of these derivative instruments modifies the exposure of these risks with the intent to reduce our risk or cost.
Investments in Other Entities: We hold a portfolio of investments in equity securities and certain investment funds that are accounted for under either the equity method or cost method. Investments in companies or certain investment funds over which we have significant influence but not a controlling interest are accounted for using the equity method, with our share of earnings or losses reported in other income (expense), net. Investments in equity securities of companies that become publicly traded are accounted for as available-for-sale marketable securities prospectively from the date of such companies' initial public offering.
Our cost method and equity method investments are included in other assets on the Consolidated Balance Sheets.
All investments are reviewed on a regular basis for possible impairment. If an investment's fair value is determined to be less than its net carrying value and the decline is determined to be other-than-temporary, the investment is written down to its fair value. Such an evaluation is judgmental and dependent on specific facts and circumstances. Factors considered in determining whether an other-than-temporary decline in value has occurred include: market value or exit price of the investment based on either market-quoted prices or future rounds of financing by the investee; length of time that the market value was below its cost basis; financial condition and business prospects of the investee; our intent and ability to retain the investment for a sufficient period of time to allow for recovery in market value of the investment; issues that raise concerns about the investee's ability to continue as a going concern; any other information that we may be aware of related to the investment.
Accounting for Long-Term Incentive Plans: We have established a Long-Term Incentive Plan, or LTIP, designed to provide key officers and executives with performance-based incentive opportunities contingent upon achievement of pre-established corporate performance objectives covering a three-year period. We currently have three separate three-year performance cycles running concurrently ending December 31, 2014, 2015 and 2016. Performance measures for each of the performance cycles are based on the following components: 37.5% on non-GAAP earnings per share; 37.5% on total non-GAAP revenue, as defined; and 25% on relative total shareholder return, which is a measurement of our stock price performance during the year compared with a group of other companies in the biopharmaceutical industry.
Payouts may be in the range of 0% to 200% of the participant's salary for the LTIPs. Such awards are payable in cash or common stock or a mixture of cash and common stock, which will be determined by the Compensation Committee at the time of award delivery. For awards payable in common stock, the number of shares is determined using the average closing price for the 30 trading days prior to the beginning of the cycle. The Compensation Committee may determine that payments made in common stock will be restricted from trading for a period of three years. We accrue the long-term incentive liability over each three-year cycle. Prior to the end of a three-year cycle, the accrual is based on an estimate of our level of achievement during the cycle. Upon a change in control, participants will be entitled to an immediate payment equal to their target award or, if higher, an award based on actual performance through the date of the change in control.
Accruals recorded for the LTIP entail making certain assumptions concerning future non-GAAP earnings per share, non-GAAP revenues and relative total shareholder return, as defined; the actual results of which could be materially different than the assumptions used. Accruals for the LTIP are reviewed on a regular basis and revised accordingly so that the liability recorded reflects updated estimates of future payouts. In estimating the accruals, management considers actual results to date for the performance period, expected results for the remainder of the performance period, operating trends, product development, pricing and competition.
Valuation of Goodwill, Acquired Intangible Assets, Other Assets and IPR&D: We have recorded goodwill, acquired intangible assets and IPR&D primarily through the acquisitions of Pharmion, Gloucester, Abraxis and Avila. When identifiable intangible assets, including in-process research and development and securitized financial assets, are acquired, we determine the fair values of these assets as of the acquisition date. Discounted cash flow models are typically used in these valuations if quoted market prices are not available, and the models require the use of significant estimates and assumptions including but not limited to:
• projecting regulatory approvals;• estimating future cash flows from product sales resulting from completed products and in-process projects or
estimating future cash flows expected to be collected; and• developing appropriate discount rates and probability rates.
Goodwill represents the excess of purchase price over fair value of net assets acquired in a business combination accounted for by the acquisition method of accounting and is not amortized, but subject to impairment testing at least annually or when a triggering event occurs that could indicate a potential impairment. We test our goodwill annually for impairment each November 30. We are

51
organized as a single reporting unit and therefore the goodwill impairment test is done using our overall market value, as determined by our traded share price, as compared to our book value of net assets.
Intangible assets with definite useful lives are amortized to their estimated residual values over their estimated useful lives and reviewed for impairment if certain events occur. Intangible assets related to IPR&D product rights are treated as indefinite-lived intangible assets and not amortized until the product is approved for sale by regulatory authorities in specified markets. At that time, we will determine the useful life of the asset, reclassify the asset out of IPR&D and begin amortization. Impairment testing is also performed at least annually or when a triggering event occurs that could indicate a potential impairment. Such test entails completing an updated discounted cash flow model to estimate the fair value of the asset.
Other assets are tested for impairment when a triggering event occurs that could indicate a potential impairment. Such test entails completing an updated discounted cash flow model to estimate the fair value of the asset.
Valuation of Contingent Consideration Resulting from a Business Combination: We record contingent consideration resulting from a business combination at its fair value on the acquisition date, and for each subsequent reporting period revalue these obligations and record increases or decreases in their fair value as an adjustment to operating earnings in the consolidated statements of income. Changes to contingent consideration obligations can result from movements in publicly traded share prices of CVRs, adjustments to discount rates and periods, updates in the assumed achievement or timing of any development milestones or changes in the probability of certain clinical events and changes in the assumed probability associated with regulatory approval. The assumptions related to determining the value of a contingent consideration include a significant amount of judgment and any changes in the assumptions could have a material impact on the amount of contingent consideration expense recorded in any given period. Our contingent consideration liabilities were acquired in the acquisitions of Gloucester, Abraxis, and Avila. The fair values of the Gloucester and Avila contingent consideration liabilities are based on the discount rate, probability and estimated timing of cash milestone payments to the former shareholders or each company. The fair value of the Abraxis contingent consideration liability is based on the quoted market price of the publicly traded CVRs.
ITEM 7A. QUANTITATIVE AND QUALITATIVE DISCLOSURES ABOUT MARKET RISK
The following discussion provides forward-looking quantitative and qualitative information about our potential exposure to market risk. Market risk represents the potential loss arising from adverse changes in the value of financial instruments. The risk of loss is assessed based on the likelihood of adverse changes in fair values, cash flows or future earnings.
We have established guidelines relative to the diversification and maturities of investments to maintain safety and liquidity. These guidelines are reviewed periodically and may be modified depending on market conditions. Although investments may be subject to credit risk, our investment policy specifies credit quality standards for our investments and limits the amount of credit exposure from any single issue, issuer or type of investment. At December 31, 2013, our market risk sensitive instruments consisted of marketable securities available for sale, our long-term debt and certain derivative contracts.
Marketable Securities Available for Sale: At December 31, 2013, our marketable securities available for sale consisted of U.S. Treasury securities, U.S. government-sponsored agency securities, U.S. government-sponsored agency mortgage-backed (MBS) securities, non-U.S. government, agency and Supranational securities, global corporate debt securities, asset backed securities and marketable equity securities. U.S. government-sponsored agency securities include general unsecured obligations either issued directly by or guaranteed by U.S. Government Sponsored Enterprises. U.S. government-sponsored agency MBS include mortgage backed securities issued by the Federal National Mortgage Association, the Federal Home Loan Mortgage Corporation and the Government National Mortgage Association. Non-U.S. government, agency and Supranational securities consist of direct obligations of highly rated governments of nations other than the United States, obligations of sponsored agencies and other entities that are guaranteed or supported by highly rated governments of nations other than the United States. Corporate debt – global includes obligations issued by investment-grade corporations including some issues that have been guaranteed by governments and government agencies. Asset backed securities consist of triple-A rated securities with cash flows collateralized by credit card receivables and auto loans.
Marketable securities available for sale are carried at fair value, held for an unspecified period of time and are intended for use in meeting our ongoing liquidity needs. Unrealized gains and losses on available-for-sale securities, which are deemed to be temporary, are reported as a separate component of stockholders' equity, net of tax. The cost of debt securities is adjusted for amortization of premiums and accretion of discounts to maturity. The amortization, along with realized gains and losses and other than temporary impairment charges, is included in interest and investment income, net.

52
As of December 31, 2013, the principal amounts, fair values and related weighted-average interest rates of our investments in debt securities classified as marketable securities available for sale were as follows (dollar amounts in millions):
Duration
Less than 1
Year 1 to 3 Years 3 to 5 Years Over 5 Years TotalPrincipal amount $ 390.4 $ 1,351.8 $ 222.3 $ 33.8 $ 1,998.3Fair value $ 391.6 $ 1,363.8 $ 229.8 $ 34.3 $ 2,019.5Weighted average interest rate 0.4% 0.7% 2.1% 2.6% 0.8%
Long-Term Debt: We have issued an aggregate $4.250 billion principal amount of senior notes at varying maturity dates and interest rates. The principal amounts and carrying values of these senior notes as of the end of December 31, 2013 are summarized below:
PrincipalAmount
CarryingValue
2.450% senior notes due 2015 $ 500.0 $ 513.91.900% senior notes due 2017 500.0 499.92.300% senior notes due 2018 400.0 399.03.950% senior notes due 2020 500.0 484.63.250% senior notes due 2022 1,000.0 956.64.000% senior notes due 2023 700.0 696.35.700% senior notes due 2040 250.0 249.65.250% senior notes due 2043 400.0 396.6Total long-term debt $ 4,250.0 $ 4,196.5
At December 31, 2013, the fair value of our senior notes outstanding was $4.269 billion.
Celgene Common Stock: As part of the management of our Board of Director authorized share repurchase program, we may, from time to time, sell put options on our common stock with strike prices that we believe represent an attractive price to repurchase our shares. If the trading price of our shares exceeds the strike price of the put option at the time the option expires, we will have economically reduced the cost of our share repurchase program by the amount of the premium we received from the sale of the put option. If the trading price of our stock is below the strike price of the put option at the time the option expires, we would repurchase the shares covered by the option at the strike price of the put option. While such a purchase would be at a price above the then fair market value of our shares, it would be at a price that we feel is favorable in the overall context of our share repurchase program. During 2013 we sold a single put option for a premium of $1.2 million that expired unexercised. At December 31, 2013, we had no outstanding put options. In February 2014, we sold a put option on $200.0 million notional amount of shares of stock with a strike price of $142.81 and maturing in March 2014 for a premium of $4.8 million.
MARKET RISK MANAGEMENT
Our revenue and earnings, cash flows and fair values of assets and liabilities can be impacted by fluctuations in foreign exchange rates and interest rates. We actively manage the impact of foreign exchange rate and interest rate movements through operational means and through the use of various financial instruments, including derivative instruments such as foreign currency options, foreign currency forward contracts, treasury rate lock agreements and interest rate swap contracts.
Foreign Currency Risk Management
We maintain a foreign exchange exposure management program to mitigate the impact of volatility in foreign exchange rates on future foreign currency cash flows, translation of foreign earnings and changes in the fair value of assets and liabilities denominated in foreign currencies.
Through our revenue hedging program, we endeavor to reduce the impact of possible unfavorable changes in foreign exchange rates on our future U.S. dollar cash flows that are derived from foreign currency denominated sales. To achieve this objective, we hedge a portion of our forecasted foreign currency denominated sales that are expected to occur in the foreseeable future, typically within the next three years. We manage our anticipated transaction exposure principally with foreign currency forward contracts and occasionally foreign currency put and call options.

53
Foreign Currency Forward Contracts: We use foreign currency forward contracts to hedge specific forecasted transactions denominated in foreign currencies, manage exchange rate volatility in the translation of foreign earnings and to reduce exposures to foreign currency fluctuations of certain assets and liabilities denominated in foreign currencies.
We manage a portfolio of foreign currency forward contracts to protect against changes in anticipated foreign currency cash flows resulting from changes in foreign currency exchange rates, primarily associated with non-functional currency denominated revenues and expenses of foreign subsidiaries. The foreign currency forward hedging contracts outstanding at December 31, 2013 and 2012 had settlement dates within 36 months. These foreign currency forward contracts are designated as cash flow hedges and, to the extent effective, any unrealized gains or losses on them are reported in other comprehensive income (loss) (OCI) and reclassified to operations in the same periods during which the underlying hedged transactions affect operations. Any ineffectiveness on these foreign currency forward contracts is reported in other income (expense), net. Foreign currency forward contracts entered into to hedge forecasted revenue and expenses were as follows at December 31, 2013 and 2012 (in millions):
Notional AmountForeign Currency: 2013 2012Australian Dollar $ — $ 5.1British Pound 279.4 77.9Canadian Dollar — 134.4Euro 3,318.2 969.3Japanese Yen 559.1 236.2Total $ 4,156.7 $ 1,422.9
We consider the impact of our own and the counterparties' credit risk on the fair value of the contracts as well as the ability of each party to execute its obligations under the contract on an ongoing basis. As of December 31, 2013, credit risk did not materially change the fair value of our foreign currency forward contracts.
We also manage a portfolio of foreign currency contracts to reduce exposures to foreign currency fluctuations of certain recognized assets and liabilities denominated in foreign currencies and, from time to time, we enter into foreign currency contracts to manage exposure related to translation of foreign earnings. These foreign currency forward contracts have not been designated as hedges and, accordingly, any changes in their fair value are recognized on the Consolidated Statements of Income in other income (expense), net in the current period. The aggregate notional amount of the foreign currency forward non-designated hedging contracts outstanding at December 31, 2013 and 2012 were $878.5 million and $795.4 million, respectively.
Although not predictive in nature, we believe a hypothetical 10% threshold reflects a reasonably possible near-term change in foreign currency rates. Assuming that the December 31, 2013 exchange rates were to change by a hypothetical 10%, the fair value of the foreign currency forward contracts would change by approximately $501.0 million. However, since the contracts either hedge specific forecasted intercompany transactions denominated in foreign currencies or relate to assets and liabilities denominated in currencies other than the entities' functional currencies, any change in the fair value of the contract would be either reported in other comprehensive income and reclassified to earnings in the same periods during which the underlying hedged transactions affect earnings or re-measured through earnings each period along with the underlying asset or liability.

54
Foreign Currency Option Contracts: From time to time, we may hedge a portion of our future foreign currency exposure by utilizing a strategy that involves both a purchased local currency put option and a written local currency call option that are accounted for as hedges of future sales denominated in euros. In connection with this strategy, we may also sell local currency put options that are not accounted for as hedges in order to reduce or fully offset the net cost of the hedging contracts. Foreign currency option contracts entered into to hedge forecasted revenue and expenses were as follows at December 31, 2013 and 2012:
Notional Amount 1
2013 2012Foreign Currency Option:Designated as hedging activity:
Purchased Put $ — $ 228.8Written Call $ — $ 235.9
Not designated as hedging activity:Purchased Put $ — $ 160.5Written Put $ — $ (216.0)
1 U.S. dollar notional amounts are calculated as the hedged local currency amount multiplied times the strike value of the foreign currency option. The local currency notional amounts of our purchased put, and written call that are designated as hedging activity are equal to each other.
Interest Rate Risk Management
In anticipation of issuing fixed-rate debt, we may use forward starting interest rate swaps (forward starting swaps) or treasury rate lock agreements (treasury rate locks) that are designated as cash flow hedges to hedge against changes in interest rates that could impact expected future issuances of debt. To the extent these hedges of cash flows related to anticipated debt are effective, any realized or unrealized gains or losses on the treasury rate locks or forward starting swaps are reported in OCI and are recognized in income over the life of the anticipated fixed-rate notes.
Forward Starting Interest Rate Swaps: During 2013, we entered into forward starting swaps, that were designated as cash flow hedges, with an aggregate notional value of $300.0 million and effective dates in November 2014, with $100.0 million maturing in five years and $200 million maturing in ten years to hedge against changes in interest rates that could impact an anticipated issuance of debt. During January and February 2014, we entered into additional forward starting swaps with effective dates in November 2014 and an aggregate notional value of $350.0 million and maturities of five and ten years. A one percentage point increase in interest rates at December 31, 2013 would not have had a material impact on the fair value of our forward starting interest rate swaps.
Treasury Rate Lock Agreements: During 2012, we entered into treasury rate lock agreements, or treasury rate locks, in anticipation of issuing fixed-rate notes that were issued in August 2012. The treasury rate locks were settled during 2012 which resulted in losses of $35.3 million that were recorded to OCI. No material amounts were recorded in income during 2013 or 2012 as a result of hedge ineffectiveness or hedge components excluded from the assessment of effectiveness.
Interest Rate Swap Contracts: From time to time we hedge the fair value of certain debt obligations through the use of interest rate swap contracts. The interest rate swap contracts are designated hedges of the fair value changes in the notes attributable to changes in interest rates. Since the specific terms and notional amount of the swap are intended to match those of the debt being hedged, it is assumed to be a highly effective hedge and all changes in fair value of the swap is recorded on the Consolidated Balance Sheets with no net impact recorded in income. Any net interest payments made or received on interest rate swap contracts are recognized as interest expense. We may terminate the hedging relationship of certain swap contracts by settling the contracts or by entering into offsetting contracts. At the time a hedging relationship is terminated, accumulated gains or losses associated with the swap contract are measured and recorded as a reduction of current and future interest expense associated with the previously hedged notes.

55
We have entered into swap contracts that were designated as hedges of our fixed rate notes due in 2015, 2017, 2018, 2020, 2022 and 2023 and also terminated the hedging relationship by settling certain of those swap contracts during 2012 and 2013. The settlement of swap contracts resulted in the receipt of net proceeds of $5.0 million in 2012 and $22.9 million in 2013 which is accounted for as a reduction of current and future interest expense associated with these notes. See Note 11 of Notes to Consolidated Financial Statements contained in this Annual Report on Form 10-K for additional details related to reductions of current and future interest expense. The following table summarizes the notional amounts of our outstanding swap contracts at the end December 31, 2013 and 2012:
Notional Amount
2013 2012Interest rate swap contracts entered into as fair value hedges of the following fixed-ratesenior notes:
2.450% senior notes due 2015 $ 300.0 $ —1.900% senior notes due 2017 300.0 100.0
2.300% senior notes due 2018 200.0 —3.950% senior notes due 2020 500.0 —3.250% senior notes due 2022 850.0 200.0
4.000% senior notes due 2023 150.0 —Total $ 2,300.0 $ 300.0
During 2014 we continued to actively manage our interest rate swaps and have terminated the hedging relationships of certain swap contracts and entered into new swaps that were designated as fair value hedges of our senior notes. The notional amount of our outstanding interest rate contracts at February 12, 2014 was $1.850 billion.
A sensitivity analysis to measure potential changes in the market value of our debt and interest rate swap contracts from a change in interest rates indicated that a one percentage point increase in interest rates at December 31, 2013 would have reduced the aggregate fair value of our net payable by $157.2 million. A one percentage point decrease at December 31, 2013 would have increased the aggregate fair value of our net payable by $181.9 million.

56
ITEM 8. FINANCIAL STATEMENTS AND SUPPLEMENTARY DATA
CELGENE CORPORATION AND SUBSIDIARIES
INDEX TO CONSOLIDATED FINANCIAL STATEMENTS
PageConsolidated Financial Statements
Financial Statement Schedule
Report of Independent Registered Public Accounting Firm 57Consolidated Balance Sheets as of December 31, 2013 and 2012 58Consolidated Statements of Income – Years Ended December 31, 2013, 2012 and 2011 59Consolidated Statements of Comprehensive Income – Years Ended December 31, 2013, 2012 and 2011 60Consolidated Statements of Cash Flows – Years Ended December 31, 2013, 2012 and 2011 61Consolidated Statements of Stockholders' Equity – Years Ended December 31, 2013, 2012 and 2011 63Notes to Consolidated Financial Statements 64
Schedule II – Valuation and Qualifying Accounts 111

57
REPORT OF INDEPENDENT REGISTERED PUBLIC ACCOUNTING FIRM
The Board of Directors and Stockholders
Celgene Corporation:
We have audited the accompanying consolidated balance sheets of Celgene Corporation and subsidiaries (the Company) as of December 31, 2013 and 2012, and the related consolidated statements of income, comprehensive income, cash flows, and stockholders' equity for each of the years in the three-year period ended December 31, 2013. In connection with our audits of the consolidated financial statements, we also have audited the consolidated financial statement schedule, "Schedule II – Valuation and Qualifying Accounts." These consolidated financial statements and consolidated financial statement schedule are the responsibility of the Company's management. Our responsibility is to express an opinion on these consolidated financial statements and consolidated financial statement schedule based on our audits.
We conducted our audits in accordance with the standards of the Public Company Accounting Oversight Board (United States). Those standards require that we plan and perform the audit to obtain reasonable assurance about whether the financial statements are free of material misstatement. An audit includes examining, on a test basis, evidence supporting the amounts and disclosures in the financial statements. An audit also includes assessing the accounting principles used and significant estimates made by management, as well as evaluating the overall financial statement presentation. We believe that our audits provide a reasonable basis for our opinion.
In our opinion, the consolidated financial statements referred to above present fairly, in all material respects, the financial position of Celgene Corporation and subsidiaries as of December 31, 2013 and 2012, and the results of their operations and their cash flows for each of the years in the three-year period ended December 31, 2013, in conformity with U.S. generally accepted accounting principles. Also, in our opinion, the related consolidated financial statement schedule, when considered in relation to the basic consolidated financial statements taken as a whole, presents fairly, in all material respects, the information set forth therein.
We also have audited, in accordance with the standards of the Public Company Accounting Oversight Board (United States), the effectiveness of the Company's internal control over financial reporting as of December 31, 2013, based on criteria established in Internal Control – Integrated Framework issued by the Committee of Sponsoring Organizations of the Treadway Commission in 1992 and our report dated February 13, 2014 expressed an unqualified opinion on the effectiveness of the Company's internal control over financial reporting.
/s/ KPMG LLP
Short Hills, New Jersey
February 13, 2014

58
CELGENE CORPORATION AND SUBSIDIARIESCONSOLIDATED BALANCE SHEETS
(Dollars in millions, except per share amounts)
December 31, 2013 2012Assets
Current assets: Cash and cash equivalents $ 3,234.4 $ 2,090.4Marketable securities available for sale 2,452.6 1,809.9Accounts receivable, net of allowances of $40.0 and $33.0 at December 31, 2013 and 2012, respectively 1,061.4 960.5Inventory 340.4 259.5Deferred income taxes 25.3 93.2Other current assets 436.4 320.2
Total current assets 7,550.5 5,533.7Property, plant and equipment, net 593.4 578.4Intangible assets, net 2,839.7 3,100.4Goodwill 2,041.2 2,042.8Other assets 353.4 479.0
Total assets $ 13,378.2 $ 11,734.3Liabilities and Stockholders' Equity
Current liabilities: Short-term borrowings $ 544.8 $ 308.5Accounts payable 156.2 145.6Accrued expenses 1,001.1 775.7Income taxes payable 16.0 11.8Current portion of deferred revenue 27.7 17.3Other current liabilities 199.7 431.3
Total current liabilities 1,945.5 1,690.2Deferred revenue, net of current portion 23.7 16.2Income taxes payable 235.0 188.2Deferred income taxes 804.9 1,018.4Other non-current liabilities 582.7 355.5Long-term debt, net of discount 4,196.5 2,771.3
Total liabilities 7,788.3 6,039.8Commitments and Contingencies (Note 18)Stockholders' Equity:
Preferred stock, $.01 par value per share, 5.0 million shares authorized; none outstanding at December 31, 2013and 2012, respectively — —Common stock, $.01 par value per share, 575.0 million shares authorized; issued 511.2 million and 498.4 millionshares at December 31, 2013 and 2012, respectively 5.1 5.0Common stock in treasury, at cost; 101.5 million and 78.7 million shares at December 31, 2013 and 2012,respectively (7,662.1) (4,823.2)Additional paid-in capital 8,680.4 7,539.8Retained earnings 4,472.5 3,022.6Accumulated other comprehensive income (loss) 94.0 (49.7)
Total stockholders' equity 5,589.9 5,694.5Total liabilities and stockholders' equity $ 13,378.2 $ 11,734.3
See accompanying Notes to Consolidated Financial Statements

59
CELGENE CORPORATION AND SUBSIDIARIESCONSOLIDATED STATEMENTS OF INCOME
(In millions, except per share amounts)
Years Ended December 31, 2013 2012 2011Revenue:
Net product sales $ 6,362.3 $ 5,385.6 $ 4,699.7Collaborative agreements and other revenue 14.7 10.7 19.5Royalty revenue 116.9 110.4 122.9
Total revenue 6,493.9 5,506.7 4,842.1Expenses:
Cost of goods sold (excluding amortization of acquired intangible assets) 340.4 299.1 425.9Research and development 2,226.2 1,724.2 1,600.3Selling, general and administrative 1,684.5 1,373.5 1,226.3Amortization of acquired intangible assets 262.8 194.5 289.2Acquisition related (gains) charges and restructuring, net 171.1 169.0 (142.3)
Total costs and expenses 4,685.0 3,760.3 3,399.4Operating income 1,808.9 1,746.4 1,442.7Other income and (expense):
Interest and investment income, net 22.0 15.3 25.9Interest (expense) (91.6) (63.2) (42.7)Other income (expense), net (73.9) (17.0) (6.4)
Income before income taxes 1,665.4 1,681.5 1,419.5Income tax provision 215.5 225.3 102.1Net income 1,449.9 1,456.2 1,317.4Net loss attributable to non-controlling interest — — 0.7Net income attributable to Celgene $ 1,449.9 $ 1,456.2 $ 1,318.1Net income per share attributable to Celgene:
Basic $ 3.50 $ 3.38 $ 2.89Diluted $ 3.37 $ 3.30 $ 2.85
Weighted average shares: Basic 413.8 430.9 455.3Diluted 430.3 440.8 462.7
See accompanying Notes to Consolidated Financial Statements

60
CELGENE CORPORATION AND SUBSIDIARIESCONSOLIDATED STATEMENTS OF COMPREHENSIVE INCOME
(Dollars in millions)
Years Ended December 31, 2013 2012 2011Net income $ 1,449.9 $ 1,456.2 $ 1,317.4Other comprehensive income:
Foreign currency translation adjustments 27.4 25.9 (9.8)Pension liability adjustment 3.2 (4.7) (1.5)Change in functional currency of a foreign subsidiary — 13.1 —Net asset transfer of a common control foreign subsidiary — 0.6 (0.1)Net unrealized (losses) gains related to cash flow hedges:
Unrealized holding gains (losses), net of tax expense (benefit) of $2.6,($13.8) and ($0) for the years ended 2013, 2012 and 2011, respectively (5.8) 53.0 21.3Reclassification adjustment for (gains) losses included in net income,net of tax (expense) benefit of $6.9, ($1.9) and ($2.9) for the yearsended 2013, 2012 and 2011, respectively (14.2) (77.7) 2.9
Net unrealized gains (losses) on marketable securities available for sale:
Unrealized holding gains, net of tax expense (benefit) of $77.1, ($0.1)and $1.4 for the years ended 2013, 2012 and 2011, respectively 128.0 1.4 2.9Reclassification adjustment for losses (gains) included in net income,net of tax (expense) benefit of $2.2, $0.1 and $0.3 for the years ended2013, 2012 and 2011, respectively 5.1 1.0 (4.3)
Total other comprehensive income 143.7 12.6 11.4Comprehensive income 1,593.6 1,468.8 1,328.8Comprehensive loss attributable to non-controlling interest — — 0.7Comprehensive income attributable to Celgene $ 1,593.6 $ 1,468.8 $ 1,329.5
See accompanying Notes to Consolidated Financial Statements

61
CELGENE CORPORATION AND SUBSIDIARIESCONSOLIDATED STATEMENTS OF CASH FLOWS
(Dollars in millions)
Years Ended December 31, 2013 2012 2011Cash flows from operating activities: Net income $ 1,449.9 $ 1,456.2 $ 1,317.4Adjustments to reconcile net income to net cash provided by operating activities:
Depreciation 96.9 84.9 71.2Amortization 277.2 198.6 291.7Provision for accounts receivable allowances 6.2 12.5 6.4Deferred income taxes (246.6) 100.2 (85.8)Impairment charges 105.4 148.0 118.0Change in value of contingent consideration 171.1 166.4 (147.5)Share-based compensation expense 325.8 231.0 217.2Share-based employee benefit plan expense 32.6 19.3 20.7Reclassification adjustment for cash flow hedges included in net income (7.3) (79.6) —Unrealized change in value of derivative instruments (1.4) 71.7 (47.6)Realized losses (gains) on marketable securities available for sale 7.3 1.1 (3.8)Other, net 4.5 (1.8) 15.9
Change in current assets and liabilities, excluding the effect of acquisitions: Accounts receivable (101.4) (30.1) (263.1)Inventory (89.7) (69.7) 71.0Other operating assets (90.9) 91.7 (66.9)Accounts payable and other operating liabilities 287.2 68.2 191.2Payment of contingent consideration (75.0) — (23.3)Income tax payable 57.4 (455.5) 95.3Deferred revenue 16.7 5.5 (1.9)
Net cash provided by operating activities 2,225.9 2,018.6 1,776.1Cash flows from investing activities:
Proceeds from sales of marketable securities available for sale 3,642.3 1,743.7 2,175.2Purchases of marketable securities available for sale (3,983.6) (2,768.8) (1,693.4)Payments for acquisition of business, net of cash acquired — (352.2) —Purchases of intellectual property and other assets (19.4) (48.9) —Proceeds from the sale of assets, net — 15.8 93.2Capital expenditures (119.7) (111.5) (132.1)Purchases of investment securities (47.1) (30.0) (59.3)Other investing activities (1.1) (1.7) (5.9)
Net cash (used in) provided by investing activities (528.6) (1,553.6) 377.7Cash flows from financing activities:
Payment for treasury shares (2,764.6) (2,043.6) (2,188.6)Proceeds from short-term borrowing 4,462.0 4,494.8 1,878.8Principal repayments on short-term borrowing (4,227.9) (4,712.2) (1,353.1)Proceeds from sale of common equity put options 1.2 — —Payment of contingent consideration (225.0) — (156.7)Proceeds from the issuance of long-term debt 1,479.6 1,486.7 —Net proceeds from exercise of common stock options and warrants 551.6 476.2 166.5Excess tax benefit from share-based compensation arrangements 169.4 49.3 31.1
Net cash used in financing activities (553.7) (248.8) (1,622.0)Effect of currency rate changes on cash and cash equivalents 0.4 14.7 (23.4)Net increase in cash and cash equivalents 1,144.0 230.9 508.4Cash and cash equivalents at beginning of period 2,090.4 1,859.5 1,351.1Cash and cash equivalents at end of period $ 3,234.4 $ 2,090.4 $ 1,859.5
See accompanying Notes to Consolidated Financial Statements

62
CELGENE CORPORATION AND SUBSIDIARIESCONSOLIDATED STATEMENTS OF CASH FLOWS – (Continued)
(Dollars in millions)
Years Ended December 31, 2013 2012 2011Supplemental schedule of non-cash investing and financing activity:
Change in net unrealized gain on marketable securities available for sale $ (205.1) $ (1.3) $ (3.7)Matured shares tendered in connection with stock option exercises $ — $ (1.2) $ (4.9)
Supplemental disclosure of cash flow information: Interest paid $ 90.8 $ 48.4 $ 50.2Income taxes paid $ 291.9 $ 469.6 $ 93.0
See accompanying Notes to Consolidated Financial Statements

63
CELGENE CORPORATION AND SUBSIDIARIESCONSOLIDATED STATEMENTS OF STOCKHOLDERS' EQUITY
(Dollars in millions)
Celgene Corporation Shareholders
Years Ended December 31,2013, 2012 and 2011
CommonStock
TreasuryStock
AdditionalPaid-inCapital
RetainedEarnings
AccumulatedOther
ComprehensiveIncome(Loss)
Stockholders'Equity
Non-Controlling
Interest Total
Balances at December 31, 2010 $ 4.8 $ (545.6) $ 6,350.2 $ 248.3 $ (73.7) $ 5,984.0 $ 11.5 $ 5,995.5
Net income 1,318.1 1,318.1 (0.7) 1,317.4
Other comprehensive income 0.1 11.4 11.5 11.5
Mature shares tendered related tooption exercise (4.9) 3.0 (1.9) (1.9)
Exercise of stock options andwarrants and conversion ofrestricted stock units 0.1 166.7 166.8 166.8
Shares purchased under sharerepurchase program (2,221.2) (2,221.2) (2,221.2)
Issuance of common stock foremployee benefit plans 11.0 2.6 13.6 13.6
Issuance of common stockrelated to Abraxis acquisition 0.1 0.1 0.1
Expense related to share-basedcompensation 216.6 216.6 216.6
Income tax benefit upon exerciseof stock options 25.1 25.1 25.1
Disposal of non-controllinginterest (10.8) (10.8)
Balances at December 31, 2011 $ 4.9 $ (2,760.7) $ 6,764.4 $ 1,566.4 $ (62.3) $ 5,512.7 $ — $ 5,512.7
Net income 1,456.2 1,456.2 1,456.2
Other comprehensive income (13.7) 12.6 (1.1) (1.1)
Mature shares tendered related tooption exercise (1.2) 0.6 (0.6) (0.6)
Exercise of stock options and warrants and conversion ofrestricted stock units 0.1 (10.6) 483.0 472.5 472.5
Shares purchased under sharerepurchase program (2,050.7) (2,050.7) (2,050.7)
Issuance of common stock foremployee benefit plans 19.2 19.2 19.2
Expense related to share-basedcompensation 230.5 230.5 230.5
Income tax benefit upon exerciseof stock options 55.8 55.8 55.8
Balances at December 31, 2012 $ 5.0 $ (4,823.2) $ 7,539.8 $ 3,022.6 $ (49.7) $ 5,694.5 $ — $ 5,694.5
Net income 1,449.9 1,449.9 1,449.9
Other comprehensive income 143.7 143.7 143.7
Exercise of stock options and conversion ofrestricted stock units 0.1 (69.7) 623.6 554.0 554.0
Shares purchased under sharerepurchase program (2,769.2) (2,769.2) (2,769.2)
Issuance of common stock foremployee benefit plans 22.0 22.0 22.0
Expense related to share-basedcompensation 325.0 325.0 325.0
Income tax benefit upon exerciseof stock options 170.0 170.0 170.0
Balances at December 31, 2013 $ 5.1 $ (7,662.1) $ 8,680.4 $ 4,472.5 $ 94.0 $ 5,589.9 $ — $ 5,589.9
See accompanying Notes to Consolidated Financial Statements

64
CELGENE CORPORATION AND SUBSIDIARIES
NOTES TO CONSOLIDATED FINANCIAL STATEMENTS
(Amounts in millions, except per share amounts, unless otherwise indicated)
1. Nature of Business and Basis and Summary of Significant Accounting Policies
Celgene Corporation, together with its subsidiaries (collectively “we,” “our,” “us,” “Celgene” or the “Company”) is a global biopharmaceutical company primarily engaged in the discovery, development and commercialization of innovative therapies designed to treat cancer and immune-inflammatory related diseases. We are dedicated to innovative research and development designed to bring new therapies to market and are involved in research in several scientific areas that may deliver proprietary next-generation therapies, targeting areas such as intracellular signaling pathways in cancer and immune cells, immunomodulation in cancer and autoimmune diseases and therapeutic application of cell therapies. Our primary commercial stage products include REVLIMID®, VIDAZA®, ABRAXANE®, POMALYST®/IMNOVID®, THALOMID® (inclusive of Thalidomide CelgeneTM), ISTODAX® and azacitidine for injection (generic version of VIDAZA®). Additional sources of revenue include royalties from Novartis Pharma AG (Novartis) on their sales of FOCALIN XR® and the entire RITALIN® family of drugs, the sale of services through our Celgene Cellular Therapeutics subsidiary and other licensing agreements. The consolidated financial statements include the accounts of Celgene Corporation and its subsidiaries. Investments in limited partnerships and interests where we have an equity interest of 50% or less and do not otherwise have a controlling financial interest are accounted for by either the equity or cost method. We record net income (loss) attributable to non-controlling interest, if any, in our Consolidated Statements of Income equal to the percentage of ownership interest retained in the respective operations by the non-controlling parties. Certain prior year amounts have been reclassified to conform to the current year's presentation.
The preparation of the consolidated financial statements requires management to make estimates and assumptions that affect reported amounts and disclosures. Actual results could differ from those estimates. We are subject to certain risks and uncertainties related to, among other things, product development, regulatory approval, market acceptance, scope of patent and proprietary rights, competition, outcome of civil and governmental proceedings, European credit risk, technological change and product liability.
Financial Instruments: Certain financial instruments reflected in the Consolidated Balance Sheets, (e.g., cash, cash equivalents, accounts receivable, certain other assets, accounts payable, short-term borrowings and certain other liabilities) are recorded at cost, which approximates fair value due to their short-term nature. The fair values of financial instruments other than marketable securities are determined through a combination of management estimates and information obtained from third parties using the latest market data. The fair value of available-for-sale marketable securities is determined utilizing the valuation techniques appropriate to the type of security (See Note 4).
Derivative Instruments and Hedges: All derivative instruments are recognized on the balance sheet at their fair value. Changes in the fair value of derivative instruments are recorded each period in current earnings or other comprehensive income (loss), depending on whether a derivative instrument is designated as part of a hedging transaction and, if it is, the type of hedging transaction. For a derivative to qualify as a hedge at inception and throughout the hedged period, we formally document the nature and relationships between the hedging instruments and hedged item. We assess, both at inception and on an on-going basis, whether the derivative instruments that are used in cash flow hedging transactions are highly effective in offsetting the changes in cash flows of hedged items. We assess hedge ineffectiveness on a quarterly basis and record the gain or loss related to the ineffective portion of derivative instruments, if any, to current earnings. If we determine that a forecasted transaction is no longer probable of occurring, we discontinue hedge accounting and any related unrealized gain or loss on the derivative instrument is recognized in current earnings. We use derivative instruments, including those not designated as part of a hedging transaction, to manage our exposure to movements in foreign exchange, on our stock price and interest rates. The use of these derivative instruments modifies the exposure of these risks with the intent to reduce our risk or cost.
Cash, Cash Equivalents and Marketable Securities Available for Sale: We invest our excess cash primarily in money market funds, U.S. Treasury securities, U.S. government-sponsored agency securities, U.S. government-sponsored agency mortgage-backed securities (MBS), non-U.S. government, agency and Supranational securities, global corporate debt securities and asset backed securities. All liquid investments with maturities of three months or less from the date of purchase are classified as cash equivalents and all investments with maturities of greater than three months from date of purchase are classified as marketable securities available for sale. We determine the appropriate classification of our investments in marketable debt and equity securities

CELGENE CORPORATION AND SUBSIDIARIESNOTES TO CONSOLIDATED FINANCIAL STATEMENTS – (Continued)
65
at the time of purchase. In addition, our equity investments in the publicly traded common stock of companies with whom we have entered into collaboration agreements are also designated as marketable securities available for sale.
Marketable securities available for sale are carried at fair value, held for an unspecified period of time and are intended for use in meeting our ongoing liquidity needs. Unrealized gains and losses on available-for-sale securities, which are deemed to be temporary, are reported as a separate component of stockholders' equity, net of tax. The cost of debt securities is adjusted for amortization of premiums and accretion of discounts to maturity. The amortization, along with realized gains and losses and other-than-temporary impairment charges, is included in interest and investment income, net.
A decline in the market value of any available-for-sale security below its carrying value that is determined to be other-than-temporary would result in a charge to earnings and decrease in the security's carrying value down to its newly established fair value. Factors evaluated to determine if an investment is other-than-temporarily impaired include significant deterioration in earnings performance, credit rating, asset quality or business prospects of the issuer; adverse changes in the general market condition in which the issuer operates; our intent to hold to maturity and an evaluation as to whether it is more likely than not that we will not have to sell before recovery of its cost basis; our expected future cash flows from the security; and issues that raise concerns about the issuer's ability to continue as a going concern.
Concentration of Credit Risk: Cash, cash equivalents and marketable securities are financial instruments that potentially subject the Company to concentration of credit risk. We invest our excess cash primarily in money market funds, U.S. Treasury securities, U.S. government-sponsored agency securities, U.S. government-sponsored agency MBS, non-U.S. government, agency and Supranational securities, global corporate debt securities and asset backed securities (See Note 6). We have established guidelines relative to diversification and maturities to maintain safety and liquidity. These guidelines are reviewed periodically and may be modified to take advantage of trends in yields and interest rates.
We sell our products in the United States primarily through wholesale distributors and specialty contracted pharmacies. Therefore, wholesale distributors and large pharmacy chains account for a large portion of our U.S. trade receivables and net product revenues (See Note 19). International sales are primarily made directly to hospitals, clinics and retail chains, many of which in Europe are government owned and have extended their payment terms in recent years given the economic pressure these countries are facing. We continuously monitor the creditworthiness of our customers, including these governments, and have internal policies regarding customer credit limits. We estimate an allowance for doubtful accounts primarily based on the credit worthiness of our customers, historical payment patterns, aging of receivable balances and general economic conditions, including publicly available information on the credit worthiness of countries themselves and provinces or areas within such countries where they are the ultimate customers.
We continue to monitor economic conditions, including the volatility associated with international economies, the sovereign debt crisis in certain European countries and associated impacts on the financial markets and our business. Our current business model in these markets is typically to sell our products directly to principally government owned or controlled hospitals, which in turn directly deliver critical care to patients. Our products are used to treat life-threatening diseases and we believe this business model enables timely delivery and adequate supply of products. Many of the outstanding receivable balances are related to government-funded hospitals and we believe the receivable balances are ultimately collectible. Similarly, we believe that future sales to these customers will continue to be collectible.
The credit and economic conditions within Spain, Italy, Portugal and Greece, as well as increasing sales levels in those countries have resulted in, and may continue to result in, an increase in the average length of time it takes to collect accounts receivable. Our total net receivables in Spain, Italy and Portugal are composed almost entirely of amounts receivable from government-owned or controlled hospitals and the public sector and amounted to $348.4 million at December 31, 2013, compared to $324.2 million at December 31, 2012. Approximately $86.4 million of the $348.4 million receivable at December 31, 2013 was greater than one year past due. Our exposure to the sovereign debt crisis in Greece is limited, as we do not have a material amount of receivables in Greece. We maintain timely and direct communication with hospital customers in Spain, Italy and Portugal regarding both the current and past due receivable balances. We continue to receive payments from these countries, and closely monitor the plans for payment at the regional government level. Payments from customers in these countries are not received on regular intervals and several months could elapse between significant payments. We also regularly request and receive positive confirmation of the validity of our receivables from most of the regional governmental authorities.
In determining the appropriate allowance for doubtful accounts for Spain, Italy and Portugal, we considered that the balance of past due receivables is related to sales made to government-owned or supported customers. We regularly monitor developments in Europe to assess whether the level of risk of default for any customers has increased and note the ongoing efforts by the European Union, European Monetary Union and International Monetary Fund to support countries with large public deficits and outstanding debt balances. We also monitor the efforts of individual countries to support their regions with large public deficits and outstanding debt balances. We have not experienced significant losses or write-offs with respect to the collection of our accounts receivable in these countries as a result of their economic difficulties and we do not expect to have write-offs or adjustments to accounts receivable which would have a material adverse impact on our financial position or results of operations.

CELGENE CORPORATION AND SUBSIDIARIESNOTES TO CONSOLIDATED FINANCIAL STATEMENTS – (Continued)
66
Inventory: Inventories are recorded at the lower of cost or market, with cost determined on a first-in, first-out basis. We periodically review the composition of inventory in order to identify obsolete, slow-moving or otherwise non-saleable items. If non-saleable items are observed and there are no alternate uses for the inventory, we will record a write-down to net realizable value in the period that the decline in value is first recognized. Included in inventory are raw materials used in the production of preclinical and clinical products, which are charged to research and development expense when consumed.
We capitalize inventory costs associated with certain products prior to regulatory approval of products, or for inventory produced in new production facilities, when management considers it highly probable that the pre-approval inventories will be saleable. The determination to capitalize is based on the particular facts and circumstances relating to the expected regulatory approval of the product or production facility being considered, and accordingly, the time frame within which the determination is made varies from product to product. The assessment of whether or not the product is considered highly probable to be saleable is made on a quarterly basis and includes, but is not limited to, how far a particular product or facility has progressed along the approval process, any known safety or efficacy concerns, potential labeling restrictions and other impediments. We could be required to write down previously capitalized costs related to pre-launch inventories upon a change in such judgment, or due to a denial or delay of approval by regulatory bodies, a delay in commercialization or other potential factors.
Property, Plant and Equipment: Property, plant and equipment are stated at cost less accumulated depreciation. Depreciation of plant and equipment is recorded using the straight-line method. Building improvements are depreciated over the remaining useful life of the building. Leasehold improvements are depreciated over the lesser of the economic useful life of the asset or the remaining term of the lease, including anticipated renewal options. The estimated useful lives of capitalized assets are as follows:
Buildings 40 yearsBuilding and operating equipment 15 yearsManufacturing machinery and equipment 10 yearsOther machinery and equipment 5 yearsFurniture and fixtures 5 yearsComputer equipment and software 3-7 years
Maintenance and repairs are charged to operations as incurred, while expenditures for improvements which extend the life of an asset are capitalized.
Capitalized Software Costs: We capitalize software costs incurred in connection with developing or obtaining software. Capitalized software costs are included in property, plant and equipment, net and are amortized over their estimated useful life of three to seven years from the date the systems are ready for their intended use.
Investments in Other Entities: We hold a portfolio of investments in equity securities and certain investment funds that are accounted for under either the equity method or cost method. Investments in companies or certain investment funds over which we have significant influence but not a controlling interest are accounted for using the equity method, with our share of earnings or losses reported in other income (expense), net. Investments in equity securities of companies that become publicly traded are accounted for as available-for-sale marketable securities prospectively from the date of such companies' initial public offering.
Our cost method and equity method investments are included in other assets on the Consolidated Balance Sheets.
All investments are reviewed on a regular basis for possible impairment. If an investment's fair value is determined to be less than its net carrying value and the decline is determined to be other-than-temporary, the investment is written down to its fair value. Such an evaluation is judgmental and dependent on specific facts and circumstances. Factors considered in determining whether an other-than-temporary decline in value has occurred include: market value or exit price of the investment based on either market-quoted prices or future rounds of financing by the investee; length of time that the market value was below its cost basis; financial condition and business prospects of the investee; our intent and ability to retain the investment for a sufficient period of time to allow for recovery in market value of the investment; issues that raise concerns about the investee's ability to continue as a going concern; any other information that we may be aware of related to the investment.
Other Intangible Assets: Intangible assets with definite useful lives are amortized to their estimated residual values over their estimated useful lives and reviewed for impairment if certain events or changes in circumstances indicate that the carrying amount of an asset may not be recoverable. Intangible assets which are not amortized include acquired in-process research and development (IPR&D) and acquired intangible assets held for sale. Amortization is initiated for IPR&D intangible assets when their useful lives have been determined. IPR&D intangible assets which are determined to have had a drop in their fair value are adjusted downward and an expense recognized in the income statement. These IPR&D intangible assets are tested at least annually or when a triggering event occurs that could indicate a potential impairment.

CELGENE CORPORATION AND SUBSIDIARIESNOTES TO CONSOLIDATED FINANCIAL STATEMENTS – (Continued)
67
Goodwill: Goodwill represents the excess of purchase price over fair value of net assets acquired in a business combination accounted for by the acquisition method of accounting and is not amortized, but is subject to impairment testing at least annually or when a triggering event occurs that could indicate a potential impairment. We test our goodwill annually for impairment each November 30.
Impairment of Long-Lived Assets: Long-lived assets, such as property, plant and equipment and certain other long-term assets are reviewed for impairment whenever events or changes in circumstances indicate that the carrying amount of an asset may not be recoverable.
Recoverability of assets to be held and used is measured by a comparison of the carrying amount of an asset or asset group to the estimated undiscounted future cash flows expected to be generated by the asset or asset group. If the carrying amount of the assets exceed their estimated future undiscounted net cash flows, an impairment charge is recognized for the amount by which the carrying amount of the assets exceed the fair value of the assets.
Contingent Consideration from Business Combinations: Subsequent to the acquisition date, we measure contingent consideration arrangements at fair value for each period with changes in fair value recognized in income as acquisition related (gains) charges and restructuring, net. Changes in fair values reflect new information about related IPR&D and other assets and the passage of time. In the absence of new information, changes in fair value reflect only the passage of time as development work towards the achievement of the milestones progresses, and is accrued based on an accretion schedule.
Foreign Currency Translation: Operations in non-U.S. entities are recorded in the functional currency of each entity. For financial reporting purposes, the functional currency of an entity is determined by a review of the source of an entity's most predominant cash flows. The results of operations for non-U.S. dollar functional currency entities are translated from functional currencies into U.S. dollars using the average currency rate during each month, which approximates the results that would be obtained using actual currency rates on the dates of individual transactions. Assets and liabilities are translated using currency rates at the end of the period. Adjustments resulting from translating the financial statements of our foreign entities into the U.S. dollar are excluded from the determination of net income and are recorded as a component of other comprehensive income (loss). Transaction gains and losses are recorded in other income (expense), net in the Consolidated Statements of Income. We had a net foreign exchange gain of $22.2 million in 2013 and losses of $10.8 million and $3.1 million in 2012 and 2011, respectively. These amounts include the impact of gains and losses on foreign exchange contracts not designated as hedging instruments (See Note 5).
Research and Development Costs: Research and development costs are expensed as incurred. These include all internal and external costs related to services contracted by us. Upfront and milestone payments made to third parties in connection with research and development collaborations are expensed as incurred up to the point of regulatory approval. Milestone payments made to third parties subsequent to regulatory approval are capitalized and amortized over the remaining useful life of the related product. Upfront payments are recorded when incurred, and milestone payments are recorded when the specific milestone has been achieved.
Income Taxes: We utilize the asset and liability method of accounting for income taxes. Under this method, deferred tax assets and liabilities are determined based on the difference between the financial statement carrying amounts and tax bases of assets and liabilities using enacted tax rates in effect for years in which the temporary differences are expected to reverse. A valuation allowance is provided when it is more likely than not that some portion or all of a deferred tax asset will not be realized. We recognize the benefit of an uncertain tax position that we have taken or expect to take on income tax returns we file if such tax position is more likely than not to be sustained.
Revenue Recognition: Revenue from the sale of products is recognized when title and risk of loss of the product is transferred to the customer and the sales price is fixed and determinable. Provisions for discounts, early payments, rebates, sales returns and distributor chargebacks under terms customary in the industry are provided for in the same period the related sales are recorded. We record estimated reductions to revenue for volume-based discounts and rebates at the time of the initial sale. The estimated reductions to revenue for such volume-based discounts and rebates are based on the sales terms, historical experience and trend analysis.
We base our sales returns allowance on estimated on-hand retail/hospital inventories, measured end-customer demand as reported by third-party sources, actual returns history and other factors, such as the trend experience for lots where product is still being returned or inventory centralization and rationalization initiatives conducted by major pharmacy chains, as applicable. If the historical data we use to calculate these estimates do not properly reflect future returns, then a change in the allowance would be made in the period in which such a determination is made and revenues in that period could be materially affected. Under this methodology, we track actual returns by individual production lots. Returns on closed lots, that is, lots no longer eligible for return credits, are analyzed to determine historical returns experience. Returns on open lots, that is, lots still eligible for return credits, are monitored and compared with historical return trend rates. Any changes from the historical trend rates are considered in determining the current sales return allowance.

CELGENE CORPORATION AND SUBSIDIARIESNOTES TO CONSOLIDATED FINANCIAL STATEMENTS – (Continued)
68
Sales discount accruals are based on payment terms extended to customers. Government rebate accruals are based on estimated payments due to governmental agencies for purchases made by third parties under various governmental programs. U.S. Medicaid rebate accruals are generally based on historical payment data and estimates of future Medicaid beneficiary utilization applied to the Medicaid unit rebate formula established by the Center for Medicaid and Medicare Services. The Medicaid rebate percentage was increased and extended to Medicaid Managed Care Organizations in March 2010. The accrual of the rebates associated with Medicaid Managed Care Organizations is calculated based on estimated historical patient data related to Medicaid Managed Care Organizations. We have also analyzed actual billings received from the states to further support the accrual rates. Subsequent to implementation of the Patient Protection and Affordable Care Act and the Health Care and Education Reconciliation Act of 2010 (collectively, the 2010 U.S. Health Care Reform Law), certain states have only recently begun submitting partial Medicaid Managed Care Organization bills. Our accruals for these Medicaid Managed Care Organization rebates had been at elevated levels given the delays in the receipt of complete invoices from certain states. Due to the receipt of more complete claims data as 2013 progressed, the accruals for certain states were reduced from the elevated levels at December 31, 2012 as a result of both the payments made being applied to the accrual and a $20.3 million favorable change in estimate of the ultimate obligation. We will continue to adjust the rebate accruals as more information becomes available and to reflect actual claims experience. Effective January 1, 2011, manufacturers of pharmaceutical products are responsible for 50% of the patient’s cost of branded prescription drugs related to the Medicare Part D Coverage Gap. In order to estimate the cost to us of this coverage gap responsibility, we analyze data for eligible Medicare Part D patients against data for eligible Medicare Part D patients treated with our products as well as the historical invoices. This expense is recognized throughout the year as costs are incurred. In certain international markets, government-sponsored programs require rebates to be paid based on program specific rules and, accordingly, the rebate accruals are determined primarily on estimated eligible sales. Rebates or administrative fees are offered to certain wholesale customers, group purchasing organizations and end-user customers, consistent with pharmaceutical industry practices. Settlement of rebates and fees may generally occur from one to 15 months from the date of sale. We provide a provision for rebates at the time of sale based on contracted rates and historical redemption rates. Assumptions used to establish the provision include level of wholesaler inventories, contract sales volumes and average contract pricing. We regularly review the information related to these estimates and adjust the provision accordingly. Chargeback accruals are based on the differentials between product acquisition prices paid by wholesalers and lower government contract pricing paid by eligible customers covered under federally qualified programs. Distributor service fee accruals are based on contractual fees to be paid to the wholesale distributor for services provided. TRICARE is a health care program of the U.S. Department of Defense Military Health System that provides civilian health benefits for military personnel, military retirees and their dependents. TRICARE rebate accruals are included in chargeback accruals and are based on estimated Department of Defense eligible sales multiplied by the TRICARE rebate formula.
We record estimated reductions to revenue for free goods and volume-based discounts at the time of the initial sale. The estimated reductions to revenue for such free goods and volume-based discounts are based on the sales terms, historical experience and trend analysis. The cost of free goods is included in Cost of Goods Sold (excluding amortization of acquired intangible assets).
We recognize revenue from royalties based on licensees' sales of its products or products using its technologies. Royalties are recognized as earned in accordance with the contract terms when royalties from licensees can be reasonably estimated and collectability is reasonably assured. If royalties cannot be reasonably estimated or collectability of a royalty amount is not reasonably assured, royalties are recognized as revenue when the cash is received.
Share-Based Compensation: We utilize share based compensation in the form of stock options, restricted stock units (RSUs) and performance-based restricted stock units (PSUs). Compensation expense is recognized in the Consolidated Statements of Income based on the estimated fair value of the awards at grant date. Compensation expense recognized reflects an estimate of the number of awards expected to vest after taking into consideration an estimate of award forfeitures based on actual experience and is recognized on a straight-line basis over the requisite service period, which is generally the vesting period required to obtain full vesting. Management expectations related to the achievement of performance goals associated with PSU grants is assessed regularly and that assessment is used to determine whether PSU grants are expected to vest. If performance-based milestones related to PSU grants are not met or not expected to be met, any compensation expense recognized to date associated with grants that are not expected to vest will be reversed.
The fair values of stock option grants are estimated as of the date of grant using a Black-Scholes option valuation model. The fair values of RSU and PSU grants are based on the market value of our Common Stock on the date of grant.
Earnings Per Share: Basic earnings per share is computed by dividing net income by the weighted-average number of common shares outstanding during the period. Diluted earnings per share is computed by dividing net income by the weighted-average number of common shares outstanding during the period, assuming potentially dilutive common shares, resulting from option

CELGENE CORPORATION AND SUBSIDIARIESNOTES TO CONSOLIDATED FINANCIAL STATEMENTS – (Continued)
69
exercises, restricted stock units, warrants and other incentives had been issued and any proceeds thereof used to repurchase common stock at the average market price during the period. The assumed proceeds used to repurchase common stock is the sum of the amount to be paid to us upon exercise of options, the amount of compensation cost attributed to future services and not yet recognized and, if applicable, the amount of excess income tax benefit that would be credited to paid-in capital upon exercise.
New Accounting Pronouncements: In February 2013, the Financial Accounting Standards Board (FASB) issued Accounting Standards Update “Comprehensive Income (Topic 220): Reporting of Amounts Reclassified Out of Accumulated Other Comprehensive Income” (ASU 2013-2). ASU 2013-2 requires an entity to report the effect of significant reclassifications out of accumulated other comprehensive income on the respective line items in net income if the amount being reclassified is required under U.S. generally accepted accounting principles (GAAP) to be reclassified in its entirety to net income. The amendments require an entity to provide information about the amounts reclassified out of accumulated other comprehensive income by component. An entity shall provide this information together, in one location, either on the face of the statement where net income is presented or as a separate disclosure in the notes to the financial statements. The amendments are effective prospectively for reporting periods beginning after December 15, 2012. The adoption of ASU 2013-2 did not have a material impact on our financial position or results of operations.
In July 2013, the FASB issued Accounting Standards Update "Derivatives and Hedging (Topic 815): Inclusion of the Fed Funds Effective Swap Rate (or Overnight Index Swap Rate) as a Benchmark Interest Rate for Hedge Accounting Purposes" (ASU 2013-10). ASU 2013-10 permits the use of the Fed Funds Effective Swap Rate (also referred to as the Overnight Index Swap Rate), in addition to the U.S. government rate (UST) and London Interbank Offered Rate (LIBOR), as a U.S. benchmark interest rate for hedge accounting purposes. This update is effective prospectively for qualifying new or re-designated hedging relationships entered into on or after July 17, 2013. The adoption of ASU 2013-10 did not have a material impact on our financial position or results of operations.
In July 2013, the FASB issued Accounting Standards Update "Income Taxes (Topic 740): Presentation of an Unrecognized Tax Benefit When a Net Operating Loss Carryforward, a Similar Tax Loss, or a Tax Credit Carryforward Exists" (ASU 2013-11). ASU 2013-11 requires an entity to present an unrecognized tax benefit as a reduction of a deferred tax asset for a net operating loss (NOL) carryforward, or similar tax loss or tax credit carryforward, rather than as a liability when (1) the uncertain tax position would reduce the NOL or other carryforward under the tax law of the applicable jurisdiction and (2) the entity intends to use the deferred tax asset for that purpose. ASU 2013-11 is effective prospectively for fiscal years and interim periods within those years, beginning after December 15, 2013 for public entities. During the quarter ended December 31, 2013, we early adopted ASU 2013-11 on a prospective basis, and the change in presentation had no material impact on our financial position or results of operations.
2. Acquisitions and Divestitures
Avila Acquisition
On March 7, 2012 (the Acquisition Date), we acquired all of the outstanding common stock of Avila Therapeutics, Inc., subsequently renamed Celgene Avilomics Research, herein referred to as Avila. The acquisition resulted in Avila becoming our wholly-owned subsidiary. The results of operations for Avila are included in our consolidated financial statements from the Acquisition Date and the assets and liabilities of Avila have been recorded at their respective fair values on the Acquisition Date and consolidated with our other assets and liabilities. Avila's results of operations to the Acquisition Date were determined to be immaterial to us; therefore, pro forma financial information is not required to be presented.
We paid $352.2 million in cash, net of cash acquired, and may make additional payments of up to an estimated maximum of $595.0 million in contingent developmental and regulatory milestone payments.
Avila is a clinical-stage biotechnology company focused on the design and development of targeted covalent drugs to achieve best-in-class outcomes. Avila's product pipeline has been created using its proprietary Avilomics platform for developing targeted covalent drugs that treat diseases through protein silencing. Avila's most advanced product candidate, CC-292, formerly AVL-292, a potential treatment for cancer and autoimmune diseases, is currently in phase I clinical testing. We acquired Avila to enhance our portfolio of potential therapies for patients with life-threatening illnesses worldwide.
Our potential contingent consideration payments are classified as liabilities, which were measured at fair value as of the Acquisition Date and subsequently adjusted for time and probability accretion. The range of potential milestone payments is from no payment if none of the milestones are achieved to an estimated maximum of $595.0 million if all milestones are achieved. The potential milestones consist of developmental and regulatory achievements, including milestones for the initiation of phase II and phase III studies, investigational new drug, or IND, filings, and other regulatory events.

CELGENE CORPORATION AND SUBSIDIARIESNOTES TO CONSOLIDATED FINANCIAL STATEMENTS – (Continued)
70
We estimated the fair value of potential contingent consideration using a probability-weighted income approach, which reflects the probability and timing of future potential payments. This fair value measurement is based on significant input not observable in the market and thus represents a Level 3 liability within the fair value hierarchy. The resulting probability-weighted cash flows were discounted using a discount rate based on a market participant assumption.
The acquisition has been accounted for using the acquisition method of accounting which requires that assets acquired and liabilities assumed be recognized at their fair values as of the Acquisition Date and requires the fair value of acquired IPR&D to be classified as indefinite-lived assets until the successful completion or abandonment of the associated research and development efforts.
The fair value of consideration transferred in the acquisition of Avila is shown in the table below:
Fair Value at theAcquisition Date
Cash $ 363.4Contingent consideration 171.7Total fair value of consideration transferred $ 535.1
The purchase price allocation resulted in the following amounts being allocated to the assets acquired and liabilities assumed at the Acquisition Date based upon their respective fair values summarized below:
AmountsRecognized as ofAcquisition Date
Working capital1 $ 12.0Property, plant and equipment 2.6Platform technology intangible asset2 330.8In-process research and development product rights 198.4Net deferred tax liability3 (165.0)Total identifiable net assets 378.8Goodwill 156.3Net assets acquired $ 535.1
1 Includes cash and cash equivalents, accounts receivable, other current assets, accounts payable and other current liabilities.
2 Platform technology related to the Avilomics discovery platform which is being amortized over a useful life of seven years based on the estimated useful life of the platform.
3 Includes current deferred income tax asset of $14.7 million and non-current deferred tax liability of $179.7 million.
The fair values of current assets, current liabilities and property, plant and equipment were determined to approximate their book values.
The fair value of the platform technology intangible asset was based primarily on expected cash flows from future product candidates to be developed from the Avilomics platform and the fair value assigned to acquired IPR&D was primarily based on expected cash flows from the CC-292 product candidate which is in phase I testing. The values assigned to the platform technology intangible asset and the IPR&D asset were determined by estimating the costs to develop CC-292 and future product candidates into commercially viable products, estimating the resulting revenue from the potential products, and discounting the net cash flows to present value. The revenue and cost projections used were reduced based on the probability of developing new drugs. Additionally, the projections considered the relevant market sizes, growth factors and the nature and expected timing of new product introductions. The resulting net cash flows from such potential products are based on our estimates of cost of sales, operating expenses, and income taxes. The rates utilized to discount the net cash flows to their present value were commensurate with the stage of development of the projects and uncertainties in the economic estimates used in the projections described above. Acquired IPR&D will be accounted for as an indefinite-lived intangible asset until regulatory approval in specified markets or discontinuation of CC-292.
The excess of purchase price over the fair value amounts assigned to the assets acquired and liabilities assumed represents the goodwill amount resulting from the acquisition. The goodwill recorded as part of the acquisition is largely attributable to full ownership rights to the Avilomics platform. We do not expect any portion of this goodwill to be deductible for tax purposes. The

CELGENE CORPORATION AND SUBSIDIARIESNOTES TO CONSOLIDATED FINANCIAL STATEMENTS – (Continued)
71
goodwill attributable to the acquisition has been recorded as a non-current asset in our Consolidated Balance Sheets and is not amortized, but is subject to review for impairment annually.
Prior to the acquisition, Avila had a number of collaboration agreements in place to which we are now party. These agreements entitle us to receive potential milestone payments and reimbursement of expenses for research and development expenses incurred under the collaborations and our collaboration partners may receive intellectual property rights or options to purchase such rights related to products developed under the collaborations. We do not consider these collaboration arrangements to be significant.
Sale of Non-core Assets
The 2010 acquisition of Abraxis BioScience, Inc. (Abraxis) included a number of assets that were not associated with nab® technology or ABRAXANE®. In April 2011, we sold these non-core assets to various entities that were owned or controlled by Dr. Patrick Soon-Shiong, the former majority shareholder and executive chairman of Abraxis. We received cash consideration, 10% equity ownership in Active Biomaterials, LLC, which we subsequently sold to Dr. Patrick Soon-Shiong, and a future royalty stream based on net sales of certain products of Active Biomaterials, LLC. We recorded the future royalty stream as an asset and assigned a value of $170.0 million based on its April 2011 fair market value calculated as the present value of estimated future net cash flows. Based on observed industry consolidation in the market that produces the raw materials for the products sold by Active Biomaterials, LLC and the forecasted reduction of net sales subject to royalties, we performed an analysis in December 2013 of the fair value of the future royalty stream. Our evaluation of discounted estimated future cash flows resulted in a fair value of $90.0 million for the future royalty stream and we recorded an impairment expense of $80.0 million in 2013.
In January 2014, we entered into a collaboration agreement with NantBioScience, Inc. (NantBioScience), an entity controlled by Dr. Patrick Soon-Shiong in which Celgene contributed $75 million, the rights to the future royalty stream noted above and licenses to two nab® product candidates. In return, Celgene received 14 percent equity ownership in NantBioScience, an option to license a certain number of product candidates developed by NantBioScience, including the two nab® product candidates that Celgene is licensing to NantBioScience, and the parent company of NantBioScience assumed, and agreed to pay and satisfy when due, our obligation to pay The Chan Soon-Shiong Institute for Advanced Health (CSS Institute) $50.0 million contingent, matching contributions.
3. Earnings Per Share
2013 2012 2011Net income attributable to Celgene $ 1,449.9 $ 1,456.2 $ 1,318.1Weighted-average shares:
Basic 413.8 430.9 455.3Effect of dilutive securities:
Options, restricted stock units, warrants and other 16.5 9.9 7.4Diluted 430.3 440.8 462.7
Net income per share attributable to Celgene: Basic $ 3.50 $ 3.38 $ 2.89Diluted $ 3.37 $ 3.30 $ 2.85
The total number of potential shares of common stock excluded from the diluted earnings per share computation because their inclusion would have been anti-dilutive was 7.2 million in 2013, 12.7 million in 2012 and 25.9 million in 2011.
During the period of April 2009 through December 2013, our Board of Directors has approved repurchases of up to an aggregate of $9.500 billion of our common stock, including the June 2013 authorization to repurchase an additional $3.000 billion of our common stock.
As part of the Board authorized share repurchase program, in February 2013 we entered into an Accelerated Share Repurchase (ASR) agreement with an investment bank to repurchase an aggregate of $600.0 million of our common stock. The total number of shares repurchased under the ASR agreement was 5.2 million shares at a weighted average price of $114.30 per share.
As part of the management of our Board of Director authorized share repurchase program, we may, from time to time, sell put options on our common stock with strike prices that we believe represent an attractive price to repurchase our shares. If the trading price of our shares exceeds the strike price of the put option at the time the option expires, we will have economically reduced the cost of our share repurchase program by the amount of the premium we received from the sale of the put option. If the trading

CELGENE CORPORATION AND SUBSIDIARIESNOTES TO CONSOLIDATED FINANCIAL STATEMENTS – (Continued)
72
price of our stock is below the strike price of the put option at the time the option expires, we would repurchase the shares covered by the option at the strike price of the put option. During 2013 we sold a single put option for a premium of $1.2 million that expired unexercised. At December 31, 2013, we had no outstanding put options. In February 2014, we sold a put option on $200.0 million notional amount of shares of stock with a strike price of $142.81 and maturing in March 2014 for a premium of $4.8 million.
We repurchased 22.3 million shares of common stock under the program from all sources, including the ASR during 2013. As of December 31, 2013, we had a remaining open-ended repurchase authorization of $2.068 billion.
4. Financial Instruments and Fair Value Measurement
The table below presents information about assets and liabilities that are measured at fair value on a recurring basis as of December 31, 2013 and the valuation techniques we utilized to determine such fair value. Fair values determined based on Level 1 inputs utilize quoted prices (unadjusted) in active markets for identical assets or liabilities. Our Level 1 assets consist of marketable equity securities. Fair values determined based on Level 2 inputs utilize observable quoted prices for similar assets and liabilities in active markets and observable quoted prices for identical or similar assets in markets that are not very active. Our Level 2 assets consist primarily of U.S. Treasury securities, U.S. government-sponsored agency securities, U.S. government-sponsored agency MBS, non-U.S. government, agency and Supranational securities, global corporate debt securities, asset backed securities, foreign currency forward contracts, purchased foreign currency options and interest rate swap contracts. Fair values determined based on Level 3 inputs utilize unobservable inputs and include valuations of assets or liabilities for which there is little, if any, market activity. We do not have any Level 3 assets. Our Level 1 liability relates to our publicly traded Contingent Value Rights (CVRs). See Note 18 for a description of the CVRs. Our Level 2 liabilities relate to interest rate swap contracts and forward starting interest rate swap contracts. Our Level 3 liabilities consist of contingent consideration related to undeveloped product rights resulting from the acquisition of Gloucester Pharmaceuticals, Inc. (Gloucester) and contingent consideration related to the undeveloped product rights and the technology platform acquired from the Avila acquisition. The maximum potential payments related to the contingent consideration from the acquisitions of Gloucester and Avila are estimated to be $120.0 million and $595.0 million, respectively.
Balance atDecember 31, 2013
Quoted Price inActive Markets for
Identical Assets(Level 1)
SignificantOther Observable
Inputs(Level 2)
SignificantUnobservable
Inputs(Level 3)
Assets: Available-for-sale securities $ 2,452.6 $ 433.1 $ 2,019.5 $ —Cash equivalents 20.0 — 20.0 —
Total assets $ 2,472.6 $ 433.1 $ 2,039.5 $ —Liabilities: Forward currency contracts $ (9.2) $ — $ (9.2) $ —
Contingent value rights (118.1) (118.1) — —Interest rate swaps (49.6) — (49.6) —Other acquisition relatedcontingent consideration (228.5) — — (228.5)
Total liabilities $ (405.4) $ (118.1) $ (58.8) $ (228.5)

CELGENE CORPORATION AND SUBSIDIARIESNOTES TO CONSOLIDATED FINANCIAL STATEMENTS – (Continued)
73
Balance atDecember 31, 2012
Quoted Price inActive Markets for
Identical Assets(Level 1)
SignificantOther Observable
Inputs(Level 2)
SignificantUnobservable
Inputs(Level 3)
Assets: Available-for-sale securities $ 1,809.9 $ 0.3 $ 1,809.6 $ —Cash equivalents 27.0 — 27.0 —Interest rate swaps 1.7 — 1.7 —Forward currency contracts 17.8 — 17.8 —Purchased currency options 2.7 — 2.7 —
Total assets $ 1,859.1 $ 0.3 $ 1,858.8 $ —Liabilities:
Contingent value rights $ (277.4) $ (277.4) $ — $ —Written currency options (5.1) — (5.1) —Other acquisition relatedcontingent consideration (198.1) — — (198.1)
Total liabilities $ (480.6) $ (277.4) $ (5.1) $ (198.1)
The following table represents a roll-forward of the fair value of Level 3 liabilities (significant unobservable inputs):
2013 2012Liabilities:
Balance at beginning of period $ (198.1) $ (76.9)Amounts acquired or issued — (171.7)Net change in fair value (30.4) 50.5Settlements — —Transfers in and/or out of Level 3 — —Balance at end of period $ (228.5) $ (198.1)
The $30.4 million increase in the fair value of Level 3 liabilities in 2013 was primarily due to probability adjustments for two Avila milestones. Level 3 liabilities issued during 2012 consisted of contingent consideration related to the acquisition of Avila. The $50.5 million net decrease in the fair value of Level 3 liabilities in 2012 was due to a $59.7 million reduction in the contingent consideration liability related to the approval of ISTODAX® for PTCL in Europe, partly offset by a $9.2 million increase in the accretion of the contingent consideration liability related to our acquisition of Avila.
5. Derivative Instruments and Hedging Activities
Our revenue and earnings, cash flows and fair values of assets and liabilities can be impacted by fluctuations in foreign exchange rates and interest rates. We actively manage the impact of foreign exchange rate and interest rate movements through operational means and through the use of various financial instruments, including derivative instruments such as foreign currency option contracts, foreign currency forward contracts, treasury rate lock agreements and interest rate swap contracts.
Foreign Currency Risk Management
We maintain a foreign exchange exposure management program to mitigate the impact of volatility in foreign exchange rates on future foreign currency cash flows, translation of foreign earnings and changes in the fair value of assets and liabilities denominated in foreign currencies.
Through our revenue hedging program, we endeavor to reduce the impact of possible unfavorable changes in foreign exchange rates on our future U.S. dollar cash flows that are derived from foreign currency denominated sales. To achieve this objective, we hedge a portion of our forecasted foreign currency denominated sales that are expected to occur in the foreseeable future, typically within the next three years. We manage our anticipated transaction exposure principally with foreign currency forward contracts and occasionally foreign currency put and call options.

CELGENE CORPORATION AND SUBSIDIARIESNOTES TO CONSOLIDATED FINANCIAL STATEMENTS – (Continued)
74
Foreign Currency Forward Contracts: We use foreign currency forward contracts to hedge specific forecasted transactions denominated in foreign currencies, manage exchange rate volatility in the translation of foreign earnings, and to reduce exposures to foreign currency fluctuations of certain assets and liabilities denominated in foreign currencies.
We manage a portfolio of foreign currency forward contracts to protect against changes in anticipated foreign currency cash flows resulting from changes in foreign currency exchange rates, primarily associated with non-functional currency denominated revenues and expenses of foreign subsidiaries. The foreign currency forward hedging contracts outstanding at December 31, 2013 and 2012 had settlement dates within 36 months. These foreign currency forward contracts are designated as cash flow hedges and, to the extent effective, any unrealized gains or losses on them are reported in other comprehensive income (loss) (OCI) and reclassified to operations in the same periods during which the underlying hedged transactions affect operations. Any ineffectiveness on these foreign currency forward contracts is reported in other income (expense), net. Foreign currency forward contracts entered into to hedge forecasted revenue and expenses were as follows at December 31, 2013 and 2012:
Notional AmountForeign Currency: 2013 2012Australian Dollar $ — $ 5.1British Pound 279.4 77.9Canadian Dollar — 134.4Euro 3,318.2 969.3Japanese Yen 559.1 236.2Total $ 4,156.7 $ 1,422.9
We consider the impact of our own and the counterparties' credit risk on the fair value of the contracts as well as the ability of each party to execute its obligations under the contract on an ongoing basis. As of December 31, 2013, credit risk did not materially change the fair value of our foreign currency forward contracts.
We also manage a portfolio of foreign currency contracts to reduce exposures to foreign currency fluctuations of certain recognized assets and liabilities denominated in foreign currencies and, from time to time, we enter into foreign currency contracts to manage exposure related to translation of foreign earnings. These foreign currency forward contracts have not been designated as hedges and, accordingly, any changes in their fair value are recognized on the Consolidated Statements of Income in other income (expense), net in the current period. The aggregate notional amount of the foreign currency forward non-designated hedging contracts outstanding at December 31, 2013 and 2012 were $878.5 million and $795.4 million, respectively.
Foreign Currency Option Contracts: From time to time, we may hedge a portion of our future foreign currency exposure by utilizing a strategy that involves both a purchased local currency put option and a written local currency call option that are accounted for as hedges of future sales denominated in euros. In connection with this strategy, we may also sell local currency put options that are not accounted for as hedges in order to reduce or fully offset the net cost of the hedging contracts. Foreign currency option contracts entered into to hedge forecasted revenue and expenses were as follows at December 31, 2013 and 2012:
Notional Amount1
2013 2012Foreign Currency Option:Designated as hedging activity:
Purchased Put $ — $ 228.8Written Call $ — $ 235.9
Not designated as hedging activity:Purchased Put $ — $ 160.5Written Put $ — $ (216.0)
1 U.S. dollar notional amounts are calculated as the hedged local currency amount multiplied times the strike value of the foreign currency option. The local currency notional amounts of our purchased put and written call that are designated as hedging activities are equal to each other.

CELGENE CORPORATION AND SUBSIDIARIESNOTES TO CONSOLIDATED FINANCIAL STATEMENTS – (Continued)
75
Interest Rate Risk Management
In anticipation of issuing fixed-rate debt, we may use forward starting interest rate swaps (forward starting swaps) or treasury rate lock agreements (treasury rate locks) that are designated as cash flow hedges to hedge against changes in interest rates that could impact expected future issuances of debt. To the extent these hedges of cash flows related to anticipated debt are effective, any realized or unrealized gains or losses on the treasury rate locks or forward starting swaps are reported in OCI and are recognized in income over the life of the anticipated fixed-rate notes.
Forward Starting Interest Rate Swaps: During 2013, we entered into forward starting swaps, that were designated as cash flow hedges, with an aggregate notional value of $300.0 million and effective dates in November 2014, with $100.0 million maturing in five years and $200 million maturing in ten years to hedge against changes in interest rates that could impact an anticipated issuance of debt. During January and February 2014, we entered into additional forward starting swaps with effective dates in November 2014 and an aggregate notional value of $350.0 million and maturities of five and ten years.
Treasury Rate Lock Agreements: During 2012, we entered into treasury rate locks in anticipation of issuing fixed-rate notes that were issued in August 2012. The treasury rate locks were settled during 2012 which resulted in losses of $35.3 million that were recorded to OCI. No material amounts were recorded in income during 2013 or 2012 as a result of hedge ineffectiveness or hedge components excluded from the assessment of effectiveness.
Interest Rate Swap Contracts: From time to time we hedge the fair value of certain debt obligations through the use of interest rate swap contracts. The interest rate swap contracts are designated hedges of the fair value changes in the notes attributable to changes in interest rates. Since the specific terms and notional amount of the swap are intended to match those of the debt being hedged, it is assumed to be a highly effective hedge and all changes in fair value of the swap is recorded on the Consolidated Balance Sheets with no net impact recorded in income. Any net interest payments made or received on interest rate swap contracts are recognized as interest expense. We may terminate the hedging relationship of certain swap contracts by settling the contracts or by entering into offsetting contracts. At the time a hedging relationship is terminated, accumulated gains or losses associated with the swap contract are measured and recorded as a reduction of current and future interest expense associated with the previously hedged notes.
We have entered into swap contracts that were designated as hedges of our fixed rate notes due in 2015, 2017, 2018, 2020, 2022 and 2023 and also terminated the hedging relationship by settling certain of those swap contracts during 2012 and 2013. The settlement of swap contracts resulted in the receipt of net proceeds of $5.0 million in 2012 and $22.9 million in 2013 which is accounted for as a reduction of current and future interest expense associated with these notes. See Note 11 for additional details related to reductions of current and future interest expense. The following table summarizes the notional amounts of our outstanding swap contracts at the end December 31, 2013 and 2012:
Notional Amount
2013 2012Interest rate swap contracts entered into as fair value hedges of the following fixed-ratesenior notes:
2.450% senior notes due 2015 $ 300.0 $ —1.900% senior notes due 2017 300.0 100.0
2.300% senior notes due 2018 200.0 —3.950% senior notes due 2020 500.0 —3.250% senior notes due 2022 850.0 200.0
4.000% senior notes due 2023 150.0 —Total $ 2,300.0 $ 300.0
During 2014 we continued to actively manage our interest rate swaps and have terminated the hedging relationships of certain swap contracts and entered into new swaps that were designated as fair value hedges of our senior notes. The notional amount of our outstanding interest rate contracts at February 12, 2014 was $1.850 billion.

CELGENE CORPORATION AND SUBSIDIARIESNOTES TO CONSOLIDATED FINANCIAL STATEMENTS – (Continued)
76
The following table summarizes the fair value and presentation in the Consolidated Balance Sheets for derivative instruments as of December 31, 2013 and 2012:
December 31, 2013 Asset Derivatives Liability Derivatives
InstrumentBalance Sheet
Location Fair ValueBalance Sheet
Location Fair ValueDerivatives designated as hedging instruments: Foreign exchange contracts1 Other current assets $ 63.6 Other current assets $ 24.9 Other current liabilities 41.5 Other current liabilities 84.7 Other non-current assets 60.6 Other non-current assets 41.9
Other non-current liabilities 4.3 Other non-current liabilities 25.6
Interest rate swap agreements Other current assets 17.1 Other current assets — Other non-current liabilities — Other non-current liabilities 68.3Derivatives not designated as hedging instruments: Foreign exchange contracts1 Other current assets 11.3 Other current assets 0.7 Other current liabilities 6.0 Other current liabilities 18.7
Interest rate swap agreements Other current assets 0.1 Other current assets — Other non-current assets 1.5 Other non-current assets —Total $ 206.0 $ 264.8
December 31, 2012 Asset Derivatives Liability Derivatives
InstrumentBalance Sheet
Location Fair ValueBalance Sheet
Location Fair ValueDerivatives designated as hedging instruments: Foreign exchange contracts1 Other current assets $ 35.2 Other current assets $ 12.7 Other current liabilities 9.1 Other current liabilities 31.4 Other non-current assets 30.5 Other non-current assets 13.8
Interest rate swap agreements Other current assets 0.1 Other current assets — Other non-current assets 0.1 Other non-current assets 0.2 Other non-current liabilities — Other non-current liabilities 0.6Derivatives not designated as hedging instruments: Foreign exchange contracts1 Other current assets 45.8 Other current assets 36.3 Other current liabilities 10.4 Other current liabilities 21.4
Interest rate swap agreements Other current assets 0.6 Other current assets — Other non-current assets 1.7 Other non-current assets —Total $ 133.5 $ 116.4
1Derivative instruments in this category are subject to master netting arrangements and are presented on a net basis in the Consolidated Balance Sheets in accordance with ASC 210-20.

CELGENE CORPORATION AND SUBSIDIARIESNOTES TO CONSOLIDATED FINANCIAL STATEMENTS – (Continued)
77
The following table summarizes the effect of derivative instruments designated as cash-flow hedging instruments on the Consolidated Statements of Income for the years ended December 31, 2013 and 2012:
2013
Amount ofGain/(Loss)
Recognized in OCIon Derivative1
Location ofGain/(Loss)
Reclassified fromAccumulated OCI
into Income
Amount ofGain/(Loss)
Reclassified fromAccumulated OCI
into Income
Location ofGain/(Loss)
Recognized inIncome onDerivative
Amount ofGain/(Loss)
Recognized inIncome onDerivative
Instrument (Effective Portion) (Effective Portion) (Effective Portion)
(Ineffective Portionand Amount Excluded
From EffectivenessTesting)
(Ineffective Portionand Amount
ExcludedFrom Effectiveness
Testing) Foreign exchangecontracts $ (9.7) Net product sales $ 10.7 Other income, net $ 12.6
2
Treasury rate lockagreements $ — Interest expense $ (3.4)
Forward starting interestrate swaps $ 6.5 Interest expense $ —
1 Net losses of $13.2 million are expected to be reclassified from Accumulated OCI into income in the next 12 months.2 The amount of net gains recognized in income represents $6.3 million of gains related to the ineffective portion of the hedging relationships and
$6.3 million of gains related to amounts excluded from the assessment of hedge effectiveness.
2012
Amount ofGain/(Loss)
Recognized in OCIon Derivative
Location ofGain/(Loss)
Reclassified fromAccumulated OCI
into Income
Amount ofGain/(Loss)
Reclassified fromAccumulated OCI
into Income
Location ofGain/(Loss)
Recognized inIncome onDerivative
Amount ofGain/(Loss)
Recognized inIncome onDerivative
Instrument (Effective Portion) (Effective Portion) (Effective Portion)
(Ineffective Portionand Amount Excluded
From EffectivenessTesting)
(Ineffective Portionand Amount
ExcludedFrom Effectiveness
Testing) Foreign exchangecontracts $ 74.5 Net product sales $ 80.9 Other income, net $ (6.6)
1
Treasury rate lockagreements $ (35.3) Interest Expense $ (1.3)
1 The amount of net losses recognized in income represents $9.0 million in losses related to the ineffective portion of the hedging relationships and $2.4 million of gains related to amounts excluded from the assessment of hedge effectiveness.
The following table summarizes the effect of derivative instruments designated as fair value hedging instruments on the Consolidated Statements of Income for the years ended December 31, 2013 and 2012:
Location of Gain (Loss)Recognized in Income
on Derivative
Amount of Gain (Loss)Recognized in Income
on DerivativeInstrument 2013 2012
Interest Rate Swaps Interest expense $ 31.4 $ 7.8

CELGENE CORPORATION AND SUBSIDIARIESNOTES TO CONSOLIDATED FINANCIAL STATEMENTS – (Continued)
78
The following table summarizes the effect of derivative instruments not designated as hedging instruments on the Consolidated Statements of Income for the years ended December 31, 2013 and 2012:
Location of Gain (Loss)Recognized in Income
on Derivative
Amount of Gain (Loss)Recognized in Income
on DerivativeInstrument 2013 2012
Foreign exchange contracts Other income, net $ 34.1 $ 23.8
Treasury rate lock agreements Other income, net $ — $ 3.7
Interest rate swap agreements Other income, net $ 0.7 $ 0.3
Put options sold Other income, net $ 1.2 $ —
The impact of gains and losses on foreign exchange contracts not designated as hedging instruments related to changes in the fair value of assets and liabilities denominated in foreign currencies are generally offset by net foreign exchange gains and losses, which are also included in other income (expense), net for all periods presented. When we enter into foreign exchange contracts not designated as hedging instruments to mitigate the impact of exchange rate volatility in the translation of foreign earnings, gains and losses will generally be offset by fluctuations in the U.S. dollar translated amounts of each Income Statement account in current and/or future periods.
6. Cash, Cash Equivalents and Marketable Securities Available-for-Sale
Money market funds of $1.697 billion and $1.160 billion at December 31, 2013 and 2012, respectively, were recorded at cost, which approximates fair value and are included in cash and cash equivalents.
The amortized cost, gross unrealized holding gains, gross unrealized holding losses and estimated fair value of available-for-sale securities by major security type and class of security at December 31, 2013 and 2012 were as follows:
December 31, 2013Amortized
Cost
GrossUnrealized
Gain
GrossUnrealized
Loss
EstimatedFair
ValueU.S. Treasury securities $ 795.2 $ 0.3 $ (0.4) $ 795.1U.S. government-sponsored agency securities 208.9 0.2 (0.2) 208.9U.S. government-sponsored agency MBS 450.8 0.1 (6.9) 444.0Non-U.S. government, agency andSupranational securities 10.4 — — 10.4Corporate debt – global 379.2 1.1 (0.6) 379.7Asset backed securities 181.6 — (0.2) 181.4Marketable equity securities 212.9 220.2 — 433.1Total available-for-sale marketable securities $ 2,239.0 $ 221.9 $ (8.3) $ 2,452.6
December 31, 2012Amortized
Cost
GrossUnrealized
Gain
GrossUnrealized
Loss
EstimatedFair
ValueU.S. Treasury securities $ 902.0 $ 0.5 $ — $ 902.5U.S. government-sponsored agency securities 303.5 0.3 — 303.8U.S. government-sponsored agency MBS 387.2 1.6 (1.8) 387.0Non-U.S. government, agency andSupranational securities 7.1 — — 7.1Corporate debt – global 208.5 0.9 (0.2) 209.2Marketable equity securities 0.4 — (0.1) 0.3Total available-for-sale marketable securities $ 1,808.7 $ 3.3 $ (2.1) $ 1,809.9

CELGENE CORPORATION AND SUBSIDIARIESNOTES TO CONSOLIDATED FINANCIAL STATEMENTS – (Continued)
79
U.S. government-sponsored agency securities include general unsecured obligations either issued directly by or guaranteed by U.S. Government Sponsored Enterprises. U.S. government-sponsored agency MBS include mortgage-backed securities issued by the Federal National Mortgage Association, the Federal Home Loan Mortgage Corporation and the Government National Mortgage Association. Non-U.S. government, agency and Supranational securities consist of direct obligations of highly rated governments of nations other than the United States and obligations of sponsored agencies and other entities that are guaranteed or supported by highly rated governments of nations other than the United States. Corporate debt-global includes obligations issued by investment-grade corporations, including some issues that have been guaranteed by governments and government agencies. Asset backed securities consist of triple-A rated securities with cash flows collateralized by credit card receivables and auto loans. Marketable equity securities consist of investments in equity securities that have become publicly traded. The increase in net unrealized gains in marketable equity securities in 2013 compared to 2012 primarily reflects the increase in market value for certain equity investments subsequent to their respective initial public offerings. Net unrealized losses in the marketable securities primarily reflect the impact of increased interest rates at December 31, 2013.
The fair value of all available-for-sale securities, which have been in an unrealized loss position for less than and longer than 12 months at December 31, 2013, was as follows:
Less than 12 months 12 months or longer Total
December 31, 2013
EstimatedFair
Value
GrossUnrealized
Loss
EstimatedFair
Value
GrossUnrealized
Loss
EstimatedFair
Value
GrossUnrealized
LossU.S. Treasurysecurities $ 316.9 $ (0.4) $ — $ — $ 316.9 $ (0.4)U.S. government-sponsored agencysecurities 78.2 (0.2) — — 78.2 (0.2)U.S. government-sponsored agencyMBS 358.9 (5.4) 45.8 (1.5) 404.7 (6.9)Corporate debt –global 135.1 (0.6) — — 135.1 (0.6)Asset backedsecurities 126.3 (0.2) — — 126.3 (0.2)Total $ 1,015.4 $ (6.8) $ 45.8 $ (1.5) $ 1,061.2 $ (8.3)
The Company believes that the decline in fair value of securities held at December 31, 2013 below their cost is temporary and intends to retain its investment in these securities for a sufficient period of time to allow for recovery in the market value of these investments.
Duration periods of available-for-sale debt securities at December 31, 2013 were as follows:
AmortizedCost
FairValue
Duration of one year or less $ 391.8 $ 391.6Duration of one through three years 1,364.8 1,363.8Duration of three through five years 233.9 229.8Duration of over five years 35.6 34.3Total $ 2,026.1 $ 2,019.5

CELGENE CORPORATION AND SUBSIDIARIESNOTES TO CONSOLIDATED FINANCIAL STATEMENTS – (Continued)
80
7. Inventory
A summary of inventories by major category at December 31, 2013 and 2012 follows:
2013 2012Raw materials $ 147.4 $ 79.2Work in process 99.6 86.5Finished goods 93.4 93.8Total $ 340.4 $ 259.5
Raw materials increased by $68.2 million in 2013 compared to 2012 primarily resulting from an increase in the sales level of ABRAXANE® , which was approved by the FDA for treatment of Non-Small Cell Lung Cancer (NSCLC) in October 2012 and pancreatic cancer in September 2013. In addition, $33.4 million of OTEZLA® (apremilast) inventory has been capitalized in 2013 prior to regulatory approval, in anticipation of regulatory approval for this product.
8. Property, Plant and Equipment
Property, plant and equipment at December 31, 2013 and 2012 consisted of the following:
2013 2012Land $ 37.9 $ 36.7Buildings 258.0 228.4Building and operating equipment 30.8 30.0Leasehold improvements 128.2 78.1Machinery and equipment 193.8 175.2Furniture and fixtures 46.3 41.2Computer equipment and software 286.1 239.5Construction in progress 44.6 90.1
Subtotal 1,025.7 919.2Less accumulated depreciation and amortization 432.3 340.8Total $ 593.4 $ 578.4
The balance of construction in progress at December 31, 2013 relates primarily to an expansion of our international headquarters in Boudry, Switzerland as well as the expansion of our corporate headquarters in Summit, New Jersey.

CELGENE CORPORATION AND SUBSIDIARIESNOTES TO CONSOLIDATED FINANCIAL STATEMENTS – (Continued)
81
9. Other Financial Information
Accrued expenses at December 31, 2013 and 2012 consisted of the following:
2013 2012Compensation $ 261.7 $ 170.3Rebates, distributor chargebacks and distributor services 217.3 187.0Clinical trial costs and grants 192.6 183.3Common share repurchases 45.7 41.0Interest 49.0 26.3Royalties, license fees and collaboration agreements 52.4 19.4Commercial related activities 46.6 22.8Sales returns 15.5 13.3Rent 14.8 9.5Professional services 9.3 9.8Other Taxes 7.6 8.3Other 88.6 84.7Total $ 1,001.1 $ 775.7
Other current liabilities at December 31, 2013 and 2012 consisted of the following:
2013 2012Contingent value rights – Abraxis acquisition $ — $ 277.4Sales, use and value added tax 50.9 56.9Foreign exchange contracts 55.9 33.3Collaboration agreement 7.0 17.0Contingent consideration – Avila acquisition 62.7 17.4Other 23.2 29.3Total $ 199.7 $ 431.3
Other non-current liabilities at December 31, 2013 and 2012 consisted of the following:
2013 2012Contingent consideration – Avila acquisition $ 147.5 $ 163.5Deferred compensation and long-term incentives 127.2 99.2Contingent value rights - Abraxis acquisition 118.1 —Foreign exchange contracts 89.6 0.6Deferred lease incentive 28.7 31.4Collaboration agreement 28.0 —Contingent consideration – Gloucester acquisition 18.3 17.3Manufacturing facility purchase 13.9 14.4Other 11.4 29.1Total $ 582.7 $ 355.5

CELGENE CORPORATION AND SUBSIDIARIESNOTES TO CONSOLIDATED FINANCIAL STATEMENTS – (Continued)
82
10. Intangible Assets and Goodwill
Intangible Assets: Our intangible assets consist of developed product rights obtained primarily from the Pharmion Corp. (Pharmion), Gloucester and Abraxis acquisitions, IPR&D product rights from the Gloucester and Avila acquisitions and technology obtained primarily from the Avila acquisition. Also included are contract-based licenses and other miscellaneous intangibles. The amortization periods related to non-IPR&D intangible assets range from one to 17 years. The following summary of intangible assets by category includes intangibles currently being amortized and intangibles not yet subject to amortization:
December 31, 2013
GrossCarrying
ValueAccumulatedAmortization
IntangibleAssets,
Net
WeightedAverage
Life (Years)Amortizable intangible assets: Acquired developed product rights $ 3,405.9 $ (1,026.4) $ 2,379.5 13.0Technology 333.7 (87.4) 246.3 7.0Licenses 66.2 (13.9) 52.3 16.5Other 42.5 (18.8) 23.7 8.6
3,848.3 (1,146.5) 2,701.8 12.5Non-amortized intangible assets: Acquired IPR&D product rights 137.9 — 137.9 Total intangible assets $ 3,986.2 $ (1,146.5) $ 2,839.7
December 31, 2012
GrossCarrying
ValueAccumulatedAmortization
IntangibleAssets,
Net
WeightedAverage
Life (Years)Amortizable intangible assets: Acquired developed product rights $ 3,400.4 $ (814.5) $ 2,585.9 13.0Technology 333.3 (39.8) 293.5 7.0Licenses 64.3 (10.0) 54.3 16.8Other 43.4 (14.6) 28.8 8.5
3,841.4 (878.9) 2,962.5 12.5Non-amortized intangible assets: Acquired IPR&D product rights 137.9 — 137.9 Total intangible assets $ 3,979.3 $ (878.9) $ 3,100.4
The gross carrying value of intangible assets increased by $6.9 million in 2013 compared to 2012 primarily resulting from the acquisition of $5.5 million in certain developed product rights and the addition of $3.9 million from other miscellaneous agreements, net of a $2.5 million impairment charge.
Amortization expense was $270.1 million, $196.2 million and $290.3 million for the years ended December 31, 2013, 2012 and 2011, respectively. Amortization expense increased by $73.9 million in 2013 compared to 2012 primarily due to the October 2012 approval of ABRAXANE® in the United States for the treatment of NSCLC which resulted in the commencement of amortization of the related intangible asset and an increase in amortization of technology related to the March 7, 2012 acquisition of Avila and its Avilomics™ platform. Assuming no changes in the gross carrying amount of intangible assets, the amortization of intangible assets for years 2014 through 2018 is estimated to be in the range of approximately $255.0 million to $270.0 million annually.
Goodwill: At December 31, 2013, our goodwill related to the 2012 acquisition of Avila, the 2010 acquisitions of Abraxis and Gloucester, the 2008 acquisition of Pharmion and the 2004 acquisition of Penn T Limited.

CELGENE CORPORATION AND SUBSIDIARIESNOTES TO CONSOLIDATED FINANCIAL STATEMENTS – (Continued)
83
The change in carrying value of goodwill is summarized as follows:
Balance at December 31, 2012 $ 2,042.8Tax benefit on the exercise of Pharmion converted stock options (1.6)
Balance at December 31, 2013 $ 2,041.2
11. Debt
Senior Notes: Summarized below are the carrying values of our senior notes at December 31, 2013 and 2012:
2013 20122.450% senior notes due 2015 $ 513.9 $ 520.11.900% senior notes due 2017 499.9 500.62.300% senior notes due 2018 399.0 —3.950% senior notes due 2020 484.6 499.03.250% senior notes due 2022 956.6 1,002.14.000% senior notes due 2023 696.3 —5.700% senior notes due 2040 249.6 249.55.250% senior notes due 2043 396.6 —Total long-term debt $ 4,196.5 $ 2,771.3
At December 31, 2013, the fair value of our outstanding Senior Notes was $4.269 billion and represented a Level 2 measurement within the fair value measurement hierarchy.
In August 2013, we issued an additional $1.500 billion principal amount of senior notes consisting of $400.0 million aggregate principal amount of 2.300% Senior Notes due 2018 (the 2018 notes), $700.0 million aggregate principal amount of 4.000% Senior Notes due 2023 (the 2023 notes) and $400.0 million aggregate principal amount of 5.25% Senior Notes due 2043 (the 2043 notes) and, together with the 2018 notes and 2023 notes, referred to herein as the "2013 issued notes". The 2013 issued notes were issued at 99.792%, 99.452% and 99.147% of par, respectively, and the discount is being amortized as additional interest expense over the period from issuance through maturity. Offering costs of approximately $12.5 million have been recorded as debt issuance costs on our Consolidated Balance Sheets and are being amortized as additional interest expense using the effective interest rate method over the period from issuance through maturity. Interest on the notes is payable semi-annually in arrears on February 15 and August 15 each year beginning February 15, 2014 and the principal on each note is due in full at their respective maturity dates.
The notes may be redeemed at the option of the Company, in whole or in part, at any time at a redemption price defined in a make-whole clause equaling accrued and unpaid interest plus the greater of 100% of the principal amount of the notes to be redeemed or the sum of the present values of the remaining scheduled payments of interest and principal. If we experience a change of control accompanied by a downgrade of the debt to below investment grade, we will be required to offer to repurchase the notes at a purchase price equal to 101% of their principal amount plus accrued and unpaid interest. We are subject to covenants which limit our ability to pledge properties as security under borrowing arrangements and limit our ability to perform sale and leaseback transactions involving our property.
During 2012, we entered into treasury rate locks in anticipation of issuing the fixed-rate notes that were issued in August 2012. As of December 31, 2013, a balance of $30.6 million in losses remained in OCI related to treasury rate locks and will be recognized as interest expense over the life of the 2017 notes and the 2022 notes.
At December 31, 2013, we were party to pay-floating, receive-fixed interest rate swap contracts designated as fair value hedgesof fixed-rate notes as described in Note 5. Our swap contracts outstanding at December 31, 2013 effectively convert the hedged portion of our fixed-rate notes to floating rates. From time to time we terminate the hedging relationship on certain of our swap contracts by settling the contracts or by entering into offsetting contracts. Any net proceeds received or paid in these settlements are accounted for as a reduction or increase of current and future interest expense associated with the previously hedged notes. As of December 31, 2013 and 2012, we had balances of $32.1 million and $25.5 million, respectively, in unamortized gains recorded as a component of our debt as a result of past swap contract settlements. During 2013, we terminated the hedging relationship on certain of our swap contracts, resulting in gains of $15.8 million.

CELGENE CORPORATION AND SUBSIDIARIESNOTES TO CONSOLIDATED FINANCIAL STATEMENTS – (Continued)
84
Commercial Paper: The carrying value of Commercial Paper as of December 31, 2013 and 2012 was $544.8 million and $308.5 million, respectively, and approximated its fair value. The effective interest rate on the outstanding Commercial Paper balance at December 31, 2013 was 0.4%.
Senior Unsecured Credit Facility: We maintain a senior unsecured revolving credit facility (Credit Facility) that provides revolving credit in the aggregate amount of $1.500 billion, which was increased from $1.000 billion in April 2013. During April 2013, the term of the Credit Facility was also extended from September 2, 2016 to April 18, 2018. Subject to certain conditions, we have the right to increase the amount of the Credit Facility (but in no event more than one time per annum) up to a maximum aggregate amount of $1.750 billion. Amounts may be borrowed in U.S. dollars for working capital, capital expenditures and other corporate purposes. The Credit Facility currently serves as backup liquidity for our Commercial Paper borrowings. At December 31, 2013 and 2012, there was no outstanding borrowing against the Credit Facility.
The Credit Facility contains affirmative and negative covenants including certain customary financial covenants. We were in compliance with all financial covenants as of December 31, 2013.
12. Stockholders' Equity
Preferred Stock: Our Board of Directors is authorized to issue, at any time, without further stockholder approval, up to 5.0 million shares of preferred stock, and to determine the price, rights, privileges, and preferences of such shares.
Common Stock: At December 31, 2013, we were authorized to issue up to 575.0 million shares of common stock of which shares of common stock issued totaled 511.2 million.
Treasury Stock: During the period of April 2009 through December 2013, our Board of Directors has approved repurchases of up to an aggregate $9.500 billion of our common stock, including the June 2013 authorization to repurchase an additional $3.000 billion of our common stock. We repurchased $2.769 billion, $2.050 billion, and $2.220 billion of treasury stock under the program in 2013, 2012 and 2011, respectively, excluding transaction fees. As of December 31, 2013 an aggregate 96.8 million common shares were repurchased under the program at an average price of $76.80 per common share and total cost of $7.432 billion.
Other: When employee awards of RSUs vest and are settled net in order to fulfill minimum statutory tax withholding requirements, the shares withheld are reflected as treasury stock.
A summary of changes in common stock issued and treasury stock is presented below:
Common StockCommon Stock
in TreasuryDecember 31, 2010 482.2 (11.8)Exercise of stock options, warrants and conversion of restricted stock units 5.2 —Issuance of common stock for employee benefit plans — 0.2Shares repurchased under share repurchase program — (38.3)December 31, 2011 487.4 (49.9)Exercise of stock options, warrants and conversion of restricted stock units 10.7 (0.2)Issuance of common stock for employee benefit plans 0.3 —Shares repurchased under share repurchase program — (28.6)December 31, 2012 498.4 (78.7)Exercise of stock options and conversion of restricted stock units 12.5 (0.5)Issuance of common stock for employee benefit plans 0.3 —Shares repurchased under share repurchase program — (22.3)December 31, 2013 511.2 (101.5)
13. Accumulated Other Comprehensive Income (Loss)
The components of other comprehensive income (loss) consist of changes in pension liability, changes in net unrealized gains (losses) on marketable securities classified as available-for-sale, net unrealized gains (losses) related to cash flow hedges and changes in foreign currency translation adjustments, which includes changes in a subsidiary's functional currency and net asset transfers of common control subsidiaries.

CELGENE CORPORATION AND SUBSIDIARIESNOTES TO CONSOLIDATED FINANCIAL STATEMENTS – (Continued)
85
The accumulated balances related to each component of other comprehensive income (loss), net of tax, are summarized as follows:
PensionLiability
Net UnrealizedGains (Losses) FromMarketable Securities
Net UnrealizedGains (Losses)From Hedges
ForeignCurrency
TranslationAdjustment
TotalAccumulated
OtherComprehensiveIncome (Loss)
BalanceDecember 31, 2011 $ (5.4) $ 1.8 $ 8.7 $ (67.4) $ (62.3)Period change (4.7) 2.4 (24.7) 39.6 12.6BalanceDecember 31, 2012 (10.1) 4.2 (16.0) (27.8) (49.7)Period change 3.2 133.1 (20.0) 27.4 143.7BalanceDecember 31, 2013 $ (6.9) $ 137.3 $ (36.0) $ (0.4) $ 94.0
Gains (Losses) Reclassified Out of AccumulatedOther Comprehensive Income
Accumulated Other ComprehensiveIncome Components
Affected Line Item in theConsolidated Statements of
IncomeYears Ended December 31,
2013 2012 2011Gains (losses) from cash-flow hedges:
Foreign exchange contracts Net product sales $ 10.7 $ 80.9 $ —Treasury rate lock agreements Interest (expense) (3.4) (1.3) —
Income tax benefit(expense) 6.9 (1.9) (2.9)
Gains (losses) from available-for-sale marketable securities:Realized income (loss) on sales ofmarketable securities
Interest and investmentincome, net (7.3) (1.1) 4.0
Income tax benefit 2.2 0.1 0.3Total reclassification, net of tax
$ 9.1 $ 76.7 $ 1.4
14. Share-Based Compensation
We have a stockholder-approved stock incentive plan, the 2008 Stock Incentive Plan (Amended and Restated as of April 17, 2013) (Plan) which provides for the granting of options, RSUs, stock appreciation rights, PSUs and other share-based awards to our employees and officers. The Management Compensation and Development Committee of the Board of Directors (Compensation Committee) may determine the type, amount and terms, including vesting, of any awards made under the Plan.
On June 12, 2013, our stockholders approved an amendment and restatement of the Plan, which included the following key modifications: adoption of an aggregate share reserve of 105.0 million shares of Common Stock, which includes 9.0 million new shares of Common Stock; increase in the maximum payment to an eligible employee under a cash-based performance award from $4.0 million to $6.0 million; and extension of the term of the plan through April 17, 2023.
With respect to options granted under the Plan, the exercise price may not be less than the market closing price of the common stock on the date of grant. In general, options granted under the Plan vest over periods ranging from immediate vesting to four-year vesting and expire ten years from the date of grant, subject to earlier expiration in case of termination of employment unless the participant meets the retirement provision under which the option would have a maximum of three additional years to vest. The vesting period for options granted under the Plan is subject to certain acceleration provisions if a change in control, as defined in the Plan, occurs. Plan participants may elect to exercise options at any time during the option term. However, any shares so purchased which have not vested as of the date of exercise shall be subject to forfeiture, which will lapse in accordance with the established vesting time period.
Shares of common stock available for future share-based grants under all plans were 16.7 million at December 31, 2013.

CELGENE CORPORATION AND SUBSIDIARIESNOTES TO CONSOLIDATED FINANCIAL STATEMENTS – (Continued)
86
The following table summarizes the components of share-based compensation expense in the Consolidated Statements of Income for the years ended December 31, 2013, 2012 and 2011:
2013 2012 2011Cost of goods sold $ 18.5 $ 12.4 $ 9.8Research and development 144.7 102.4 104.7Selling, general and administrative 162.6 116.2 102.7Total share-based compensation expense 325.8 231.0 217.2Tax benefit related to share-based compensation expense 94.5 61.3 55.9Reduction in income $ 231.3 $ 169.7 $ 161.3
Included in share-based compensation expense for the years ended December 31, 2013, 2012 and 2011 was compensation expense related to non-qualified stock options of $197.6 million, $155.2 million and $154.4 million, respectively. Share-based compensation cost included in inventory was $1.8 million and $1.2 million at December 31, 2013 and 2012, respectively. We do not recognize a deferred tax asset for excess tax benefits that have not been realized and have adopted the tax law method as our accounting policy regarding the ordering of tax benefits to determine whether an excess tax benefit has been realized.
Stock Options: Cash received from stock option exercises for the years ended December 31, 2013, 2012 and 2011 was $551.6 million, $476.2 million and $166.5 million, respectively, and the excess tax benefit recognized was $169.4 million, $49.3 million and $31.1 million, respectively. As of December 31, 2013, there was $463.2 million of total unrecognized compensation cost related to stock options granted under the plans. That cost will be recognized over an expected remaining weighted-average period of 2.2 years.
The weighted-average grant date fair value of the stock options granted during the years ended December 31, 2013, 2012 and 2011 was $40.44 per share, $19.33 per share and $17.09 per share, respectively. We estimated the fair value of options granted using a Black-Scholes option pricing model with the following assumptions:
2013 2012 2011Risk-free interest rate 0.68% - 1.70% 0.21% - 1.23% 0.21% - 2.20%Expected volatility 27% - 35% 27% - 30% 27% - 33%Weighted average expected volatility 31% 28% 29%Expected term (years) 5.03 - 5.50 1.30 - 5.17 1.80 - 5.20Expected dividend yield 0% 0% 0%
The risk-free interest rate is based on the U.S. Treasury zero-coupon curve. Expected volatility of stock option awards is estimated based on the implied volatility of our publicly traded options with settlement dates of six months. The use of implied volatility was based upon the availability of actively traded options on our common stock and the assessment that implied volatility is more representative of future stock price trends than historical volatility. The expected term of an employee share option is the period of time for which the option is expected to be outstanding. We made a determination of expected term by analyzing employees' historical exercise experience from its history of grants and exercises in our option database and management estimates. Forfeiture rates are estimated based on historical data.

CELGENE CORPORATION AND SUBSIDIARIESNOTES TO CONSOLIDATED FINANCIAL STATEMENTS – (Continued)
87
The following table summarizes all stock option activity for the year ended December 31, 2013:
Options
WeightedAverage ExercisePrice Per Option
WeightedAverage Remaining
ContractualTerm (Years)
AggregateIntrinsic Value(In Millions)
Outstanding at December 31, 2012 42.6 $ 58.31 6.9 $ 860.3Changes during the Year: Granted 9.6 131.96 Exercised (11.5) 54.23 Forfeited (1.1) 73.96 Expired — 56.74
Outstanding at December 31, 2013 39.6 $ 76.94 7.1 $ 3,643.4Vested at December 31, 2013 orexpected to vest in the future 38.9 $ 76.46 7.0 $ 3,595.3Vested at December 31, 2013 17.0 $ 54.81 5.3 $ 1,945.6
The total fair value of shares vested during the years ended December 31, 2013, 2012 and 2011 was $159.3 million, $144.1 million and $162.8 million, respectively. The total intrinsic value of stock options exercised during the years ended December 31, 2013, 2012 and 2011 was $814.7 million, $293.5 million and $147.9 million, respectively. We primarily utilize newly issued shares to satisfy the exercise of stock options.
Restricted Stock Units: We issue RSU, under our equity program in order to provide an effective incentive award with a strong retention component. Equity awards may, at the option of employee participants, be divided between stock options and RSUs. The employee may choose between alternate Company defined mixes of stock options and RSUs, with the number of options to be granted reduced by four for every one RSU to be granted. Information regarding the Company's RSUs for the years ended December 31, 2013 and 2012 is as follows:
Nonvested RSUsShare
Equivalent
WeightedAverage
Grant DateFair Value
Nonvested at December 31, 2012 4.5 $ 66.20Changes during the period:
Granted 1.8 124.96Vested (0.8) 60.17Forfeited (0.4) 63.20
Nonvested at December 31, 2013 5.1 $ 88.15
As of December 31, 2013, there was $246.5 million of total unrecognized compensation cost related to non-vested awards of RSUs. That cost is expected to be recognized over a weighted-average period of 1.5 years. The Company primarily utilizes newly issued shares to satisfy the vesting of RSUs.

CELGENE CORPORATION AND SUBSIDIARIESNOTES TO CONSOLIDATED FINANCIAL STATEMENTS – (Continued)
88
Performance-Based Restricted Stock Units: The Company's performance-based restricted stock units vest contingent upon the achievement of pre-determined performance-based milestones typically related to product development. The following table summarizes the Company's performance-based restricted stock unit activity for the year ended December 31, 2013 (shares in thousands):
Nonvested Performance-Based RSUs Share Equivalent
Weighted AverageGrant Date Fair
ValueNonvested at December 31, 2012 26 $ 60.80Changes during the period:
Granted 46 119.02Vested (6) 60.78Forfeited (8) 64.26
Non-vested at December 31, 2013 58 $ 106.87
As of December 31, 2013, there was $3.9 million of total unrecognized compensation cost related to non-vested awards of performance-based RSUs that is expected to be recognized over a weighted-average period of 1.7 years.
15. Employee Benefit Plans
We sponsor an employee savings and retirement plan, which qualifies under Section 401(k) of the Internal Revenue Code, as amended (the Code) for our U.S. employees. Our contributions to the U.S. savings plan are discretionary and have historically been made in the form of our common stock (See Note 12). Such contributions are based on specified percentages of employee contributions up to 6% of eligible compensation or a maximum permitted by law. Total expense for contributions to the U.S. savings plans were $32.6 million, $19.3 million and $20.7 million in 2013, 2012 and 2011, respectively.
We also sponsor defined contribution plans in certain foreign locations. Participation in these plans is subject to the local laws that are in effect for each country and may include statutorily imposed minimum contributions. We also maintain defined benefit plans in certain foreign locations for which the obligations and the net periodic pension costs were determined to be immaterial at December 31, 2013.
In 2000, our Board of Directors approved a deferred compensation plan. The plan was frozen effective as of December 31, 2004, and no additional contributions or deferrals can be made to that plan. Accrued benefits under the frozen plan will continue to be governed by the terms under the tax laws in effect prior to the enactment of Section 409A. In February 2005, our Board of Directors adopted the Celgene Corporation 2005 Deferred Compensation Plan, effective as of January 1, 2005, and amended the plan in February 2008. This plan operates as our ongoing deferred compensation plan and is intended to comply with the American Jobs Creation Act of 2004, Section 409A. Eligible participants, which include certain top-level executives as specified by the plan, can elect to defer up to an amended 90% of the participant's base salary, 100% of cash bonuses and equity compensation allowed under Section 409A of the Code. Company contributions to the deferred compensation plan represent a match to certain participants' deferrals up to a specified percentage, which currently ranges from 10% to 20%, depending on the employee's position as specified in the plan, of the participant's base salary. We recorded expenses of $0.6 million, $0.6 million and $0.7 million related to the deferred compensation plans in 2013, 2012 and 2011, respectively. The Company's matches are fully vested upon contribution. All other Company contributions to the plan do not vest until the specified requirements are met. At December 31, 2013 and 2012, we had a deferred compensation liability included in other non-current liabilities in the Consolidated Balance Sheets of approximately $73.7 million and $59.8 million, respectively, which included the participant's elected deferral of salaries and bonuses, the Company's matching contribution and earnings on deferred amounts as of that date. The plan provides various alternatives for the measurement of earnings on the amounts participants defer under the plan. The measuring alternatives are based on returns of a variety of funds that offer plan participants the option to spread their risk across a diverse group of investments.
In 2003, we established a Long-Term Incentive Plan (LTIP) designed to provide key officers and executives with performance-based incentive opportunities contingent upon achievement of pre-established corporate performance objectives covering a three-year period. We currently have three separate three-year performance cycles running concurrently ending December 31, 2014, 2015 and 2016. Performance measures for each of the performance cycles are based on the following components: 37.5% on non-GAAP earnings per share (as defined in the LTIP); 37.5% on total non-GAAP revenue (as defined in the LTIP); and 25% on relative total shareholder return, which is a measurement of our stock price performance during the year compared with a group of other companies in the biopharmaceutical industry.

CELGENE CORPORATION AND SUBSIDIARIESNOTES TO CONSOLIDATED FINANCIAL STATEMENTS – (Continued)
89
Payouts may be in the range of 0% to 200% of the participant's salary for the LTIPs. The estimated payout for the concluded 2013 Plan is $28.9 million, which is included in accrued expenses at December 31, 2013, and the maximum potential payout, assuming maximum objectives are achieved for the 2014, 2015 and 2016 Plans are $19.6 million, $22.6 million and$25.2 million, respectively. Such awards are payable in cash or common stock or a mixture of cash and common stock, which will be determined by the Compensation Committee at the time of award delivery. For awards payable in common stock, the number of shares is determined using the average closing price for the 30 trading days prior to the beginning of the cycle. The Compensation Committee may determine that payments made in common stock are restricted from trading for a period of three years. We accrue the long-term incentive liability over each three-year cycle. Prior to the end of a three-year cycle, the accrual is based on an estimate of our level of achievement during the cycle. Upon a change in control, participants will be entitled to an immediate payment equal to their target award or, if higher, an award based on actual performance through the date of the change in control. For the years ended December 31, 2013, 2012 and 2011, we recognized expense related to the LTIP of $40.8 million, $10.1 million and $12.0 million, respectively.
16. Income Taxes
The income tax provision is based on income before income taxes as follows:
2013 2012 2011U.S. $ 36.8 $ 279.6 $ 416.8Non-U.S. 1,628.6 1,401.9 1,002.7
Income before income taxes $ 1,665.4 $ 1,681.5 $ 1,419.5
For the years ended December 31, 2013, 2012, and 2011, U.S. income before income taxes reflects charges related to share-based compensation, up-front collaboration payments, asset impairments and acquisitions, which increased in the United States from 2011 to 2013. These charges were less significant outside the United States in those years.
The provision (benefit) for taxes on income is as follows:
2013 2012 2011United States: Taxes currently payable:
Federal $ 352.6 $ 101.5 $ 100.8State and local 45.4 (31.8) 33.2
Deferred income taxes (245.1) 107.3 (67.1)Total U.S. tax provision 152.9 177.0 66.9International:
Taxes currently payable 64.1 55.4 53.8Deferred income taxes (1.5) (7.1) (18.6)
Total international tax provision 62.6 48.3 35.2Total provision $ 215.5 $ 225.3 $ 102.1
Amounts are reflected in the preceding tables based on the location of the taxing authorities. We do not provide for U.S. federal or state income taxes on unremitted earnings of our international subsidiaries that are indefinitely invested outside the United States. As of December 31, 2013, we have not made a U.S. tax provision on $6.129 billion of unremitted earnings of our international subsidiaries. As these earnings are expected to be reinvested overseas indefinitely, it is not practicable to compute the estimated deferred tax liability on these earnings.
Deferred taxes arise because of different treatment between financial statement accounting and tax accounting, known as temporary differences. We record the tax effect on these temporary differences as deferred tax assets (generally items that can be used as a tax deduction or credit in future periods) or deferred tax liabilities (generally items for which we received a tax deduction but that have not yet been recorded in the Consolidated Statements of Income). We periodically evaluate the likelihood of the realization of deferred tax assets, and reduce the carrying amount of these deferred tax assets by a valuation allowance to the extent we believe a portion will not be realized. We consider many factors when assessing the likelihood of future realization of deferred tax assets, including our recent cumulative earnings experience by taxing jurisdiction, expectations of future taxable income, the carryforward periods available to us for tax reporting purposes, tax planning strategies and other relevant factors. Significant judgment is required

CELGENE CORPORATION AND SUBSIDIARIESNOTES TO CONSOLIDATED FINANCIAL STATEMENTS – (Continued)
90
in making this assessment. At December 31, 2013 and 2012, it was more likely than not that we would realize our deferred tax assets, net of valuation allowances. The principal valuation allowance at December 31, 2013 relates to deferred tax assets generated by certain fair value adjustments, and at December 31, 2012 relates to Swiss deferred tax assets.
In 2012, we concluded that approximately $900.0 million of our foreign earnings may not be required for use in offshore operations and may be available for use in the United States. These earnings are not treated as permanently reinvested, and our deferred tax liabilities include $316.5 million for the estimated U.S. federal and state income taxes that may be incurred should these earnings be repatriated. In drawing this conclusion, we considered our future sources of funds as well as our global operating and strategic liquidity needs, including common share repurchase activities and expansion of our commercial, research, manufacturing and administrative infrastructure worldwide.
At December 31, 2013 and 2012 the tax effects of temporary differences that give rise to deferred tax assets and liabilities were as follows:
2013 2012 Assets Liabilities Assets LiabilitiesFederal and state NOL carryforwards $ 5.3 $ — $ 12.6 $ —Deferred revenue 2.3 — 2.3 —Capitalized research expenses 6.1 — 37.1 —Tax credit carryforwards 4.2 — 4.1 —Non-qualified stock options 183.3 — 164.4 —Plant and equipment, primarily differences indepreciation — (9.6) — (13.6)Inventory 8.4 — 6.3 —Other assets 32.7 (0.7) 26.8 (9.3)Intangibles 311.9 (1,005.0) 187.2 (1,069.2)Accrued and other expenses 161.3 — 116.1 —Unremitted earnings — (316.5) — (316.5)Unrealized (gains) losses on securities — (71.4) 17.3 —Subtotal 715.5 (1,403.2) 574.2 (1,408.6)Valuation allowance (35.5) — (41.7) —Total deferred taxes $ 680.0 $ (1,403.2) $ 532.5 $ (1,408.6)Net deferred tax asset (liability) $ (723.2) $ (876.1)
At December 31, 2013 and 2012, deferred tax assets and liabilities were classified on the Company's balance sheet as follows:
2013 2012Current assets $ 25.3 $ 93.2Other assets (non-current) 56.4 49.1Current liabilities — —Other non-current liabilities (804.9) (1,018.4)Net deferred tax asset (liability) $ (723.2) $ (876.1)

CELGENE CORPORATION AND SUBSIDIARIESNOTES TO CONSOLIDATED FINANCIAL STATEMENTS – (Continued)
91
Reconciliation of the U.S. statutory income tax rate to the Company's effective tax rate is as follows:
Percentages 2013 2012 2011U.S. statutory rate 35.0 % 35.0 % 35.0 %Foreign tax rate differences (28.8)% (28.0)% (21.1)%Unremitted earnings — % 18.8 % — %State taxes, net of federal benefit 0.6 % 1.1 % 0.7 %Change in valuation allowance 1.2 % 0.4 % — %Acquisition related differences 3.7 % 3.8 % (3.5)%Changes in uncertain tax positions 0.8 % (19.3)% (2.5)%Other 0.4 % 1.6 % (1.4)%Effective income tax rate 12.9 % 13.4 % 7.2 %
In our reconciliation of the U.S. statutory income tax rate to our effective tax rate, we disclose changes in uncertain tax positions which include the effect of settlements, expirations of statutes of limitations, and other changes in prior year tax positions.
We have operations in many foreign tax jurisdictions, which impose income taxes at different rates than the United States. The impact of these rate differences is included in the foreign tax rate differences that we disclose in our reconciliation of the U.S. statutory income tax rate to our effective tax rate. The benefit related to foreign tax rate differences primarily results from our commercial operations in Switzerland, which include significant research and development and manufacturing for worldwide markets. We operate under an income tax agreement in Switzerland through 2015 that provides a complete exemption from Swiss income taxes on predominantly all of our operations in Switzerland. In 2013, we entered into a new agreement with the Swiss tax authorities which reflects the planned expansion of our Swiss operations and will result in substantially similar tax benefits through the end of 2024. The impact of the Swiss tax agreement is reflected in our effective tax rate. The difference between the maximum statutory Swiss income tax rate (approximately 19.7% in 2013, 21.0% in 2012 and 22.0% in 2011) and our Swiss income tax rate under the tax agreement resulted in a reduction in the 2013, 2012 and 2011 effective tax rates of 25.1, 26.6 and 20.2 percentage points, respectively. The increase in benefits reflected in the foreign tax rate differences from 2011 to 2013 results from growth in our Non-U.S. operations and an increase in the proportion of consolidated income before income taxes from Non-U.S. operations.
At December 31, 2013, we had combined state NOL carryforwards of approximately $485.6 million that will expire in the years 2014 through 2033. We also have research and experimentation credit carryforwards of approximately $10.0 million that will expire in the years 2018 through 2027. Excess tax benefits related to stock option deductions incurred after December 31, 2005 are required to be recognized in the period in which the tax deduction is realized through a reduction of income taxes payable. As a result, we have not recorded deferred tax assets for certain stock option deductions included in our state NOL carryforwards and research and experimentation credit carryforwards. At December 31, 2013, deferred tax assets have not been recorded on state NOL carryforwards of approximately $311.3 million and for research and experimentation credits of approximately $5.7 million. These stock option tax benefits will be recorded as an increase in additional paid-in capital when realized.
We realized stock option deduction benefits in 2013, 2012 and 2011 for income tax purposes and have increased additional paid-in capital in the amount of approximately $170.0 million, $55.8 million and $25.1 million, respectively. We have recorded deferred income taxes as a component of accumulated other comprehensive income resulting in a deferred income tax liability at December 31, 2013 of $71.4 million and a deferred income tax asset at December 31, 2012 of $17.3 million.
Our tax returns are under routine examination in many taxing jurisdictions. The scope of these examinations includes, but is not limited to, the review of our taxable presence in a jurisdiction, our deduction of certain items, our claims for research and development credits, our compliance with transfer pricing rules and regulations and the inclusion or exclusion of amounts from our tax returns as filed. During 2012, we settled an examination with the U.S. Internal Revenue Service (IRS) for the years ended December 31, 2006, 2007 and 2008. Our U.S. federal income tax returns have now been audited by the IRS through the year ended December 31, 2008. Tax returns for the years ended December 31, 2009, 2010, and 2011 are currently under examination by the IRS. We are also subject to audits by various state and foreign taxing authorities, including, but not limited to, most U.S. states and major European and Asian countries where we have operations.
We regularly reevaluate our tax positions and the associated interest and penalties, if applicable, resulting from audits of federal, state and foreign income tax filings, as well as changes in tax law (including regulations, administrative pronouncements, judicial precedents, etc.) that would reduce the technical merits of the position to below more likely than not. We believe that our accruals for tax liabilities are adequate for all open years. Many factors are considered in making these evaluations, including past history, recent interpretations of tax law and the specifics of each matter. Because tax regulations are subject to interpretation and tax litigation is inherently uncertain, these evaluations can involve a series of complex judgments about future events and can rely

CELGENE CORPORATION AND SUBSIDIARIESNOTES TO CONSOLIDATED FINANCIAL STATEMENTS – (Continued)
92
heavily on estimates and assumptions. We apply a variety of methodologies in making these estimates and assumptions, which include studies performed by independent economists, advice from industry and subject experts, evaluation of public actions taken by the IRS and other taxing authorities, as well as our industry experience. These evaluations are based on estimates and assumptions that have been deemed reasonable by management. However, if management's estimates are not representative of actual outcomes, our results of operations could be materially impacted.
Unrecognized tax benefits, generally represented by liabilities on the consolidated balance sheet and all subject to tax examinations, arise when the estimated benefit recorded in the financial statements differs from the amounts taken or expected to be taken in a tax return because of the uncertainties described above. A reconciliation of the beginning and ending amount of unrecognized tax benefits is as follows:
2013 2012Balance at beginning of year $ 174.7 $ 596.8Increases related to prior year tax positions 25.5 —Decreases related to prior year tax positions — —Increases related to current year tax positions 30.2 38.1Settlements (10.3) (450.6)Lapse of statute (0.9) (9.6)Balance at end of year $ 219.2 $ 174.7
These unrecognized tax benefits relate primarily to issues common among multinational corporations. If recognized, unrecognized tax benefits of approximately $198.9 million would have a net impact on the effective tax rate. We account for interest and penalties related to uncertain tax positions as part of our provision for income taxes. Accrued interest at December 31, 2013 and 2012 is approximately $23.2 million and $18.0 million, respectively.
We have recorded changes in the liability for unrecognized tax benefits for current and prior year tax positions related to ongoing income tax audits in various taxing jurisdictions. During 2012, we settled examinations with various taxing authorities related to tax positions taken in prior years. The settlements resulted in a decrease in our gross unrecognized tax benefits of $450.6 million, exclusive of interest, and a reduction to income tax expense of $318.6 million. The decrease in unrecognized tax benefits and the reduction to income tax expense reflect the impact of the settlements on tax returns filed in various taxing jurisdictions for the years examined as well as certain adjustments to unrecognized tax benefits for years subsequent to the examination period.
The liability for unrecognized tax benefits is expected to increase in the next 12 months relating to operations occurring in that period. Any settlements of examinations with taxing authorities or statute of limitations expirations would likely result in a decrease in our unrecognized tax benefits. Our estimates of tax benefits and potential tax benefits may not be representative of actual outcomes, and variation from such estimates could materially affect our financial statements in the period of settlement or when the statutes of limitations expire.
17. Collaboration Agreements
We have entered into a variety of alliances in the ordinary course of our business. Although we do not consider any individual alliance to be material, certain of the more notable alliances are described below. The summarized financial information related to our alliances is presented in tabular format after the description of alliances:
Novartis Pharma AG: We licensed the worldwide rights (excluding Canada) regarding certain chirally pure forms of methylphenidate for FOCALIN® and FOCALIN XR® to Novartis. We also licensed to Novartis the rights related to long-acting formulations of methylphenidate and dex-methylphenidate products which are used in FOCALIN XR® and RITALIN LA®. We sell FOCALIN® to Novartis and receive royalties of between 30% and 35% on Novartis' sales of FOCALIN XR® and RITALIN LA®. The arrangement with Novartis will continue until the later of (i) the tenth anniversary of the first commercial launch on a country-by-country basis or (ii) when the last applicable patent expires with respect to that country. At the expiration date, we will grant Novartis a perpetual, non-exclusive, royalty-free license to make, have made, use, import and sell products using the dex-methylphenidate and long-acting formulation technology. The agreement may be terminated by Novartis upon 12 months prior written notice or by either party upon, among other things, the breach of a material obligation by the other party or in the event of withdrawal of the dex-methylphenidate product or RITALIN® product from the market because of regulatory mandate.
If the agreement is terminated by us, then all licenses granted to Novartis under the agreement will terminate and Novartis will grant us a non-exclusive license to certain of their intellectual property related to the compounds and products. If the agreement is terminated by Novartis then all licenses granted to Novartis under the agreement will terminate.

CELGENE CORPORATION AND SUBSIDIARIESNOTES TO CONSOLIDATED FINANCIAL STATEMENTS – (Continued)
93
When a generic version of dexmethylphenidate hydrochloride enters the market, we expect Novartis' sales of FOCALIN XR® to decrease and therefore our royalties will also decrease. A generic version of RITALIN LA® was introduced in January 2012 and resulted in a decrease in royalties we received from Novartis related to sales of RITALIN LA®.
Acceleron Pharma (Acceleron): We have worldwide strategic collaboration agreements with Acceleron for the joint development and commercialization of sotatercept (ACE-11) and ACE-536. ACE-11 is currently in phase II studies for treatment of renal anemia, diamond blackfan anemia, beta-thalassemia and MDS, and ACE-536 is currently in phase II studies for beta-thalassemia and MDS.
On January 1, 2013 we became responsible for the payment of all development costs related to ACE-11 and ACE-536 and have recognized development expenses as research and development expense as they were incurred.
With respect to the ACE-11 program, Acceleron is eligible to receive of up to $367.0 million in development, regulatory approval and sales-based milestones and up to an additional $348.0 million for each of three specific discovery stage programs. We also agreed to co-promote the developed products in North America. Acceleron will receive tiered royalties on worldwide net sales upon the commercialization of a development compound.
With respect to the ACE-536 program, we have an exclusive, worldwide, royalty-bearing license to ACE-536 and future Acceleron products for the treatment of anemia. We also agreed to co-promote the products in the United States, Canada and Mexico. Acceleron is eligible to receive development, regulatory approval and sales-based milestones of up to $217.5 million for ACE-536 and up to an additional $170.8 million for the first discovery stage program, $148.8 million for the second discovery stage program and $125.4 million for each additional discovery stage program thereafter. Acceleron will receive tiered royalties on worldwide net sales upon the commercialization of a development compound.
The ACE-11 agreement may be terminated by us, at our sole discretion, at any time or by either party, among other things, upon a material breach by the other party. The ACE-536 agreement may be terminated by us, at our sole discretion, after completion of the initial phase II clinical trial or by either party, among other things, upon a material breach by the other party.
Agios Pharmaceuticals, Inc. (Agios): During 2010, we entered into a discovery and development collaboration and license agreement with Agios that focuses on cancer metabolism targets and the discovery, development and commercialization of associated therapeutics. We have an exclusive option to license any potential products that result from the Agios cancer metabolism research platform through the end of phase I clinical trials.
With respect to each product that we choose to license, Agios could receive up to approximately $120.0 million upon achievement of certain milestones and other payments plus royalties on sales, and Agios may also participate in the development and commercialization of certain products in the United States. Our option to license a product will terminate on April 14, 2015.
We have determined that Agios is a variable interest entity; however, we are not the primary beneficiary of this arrangement. Although we would have the right to receive the benefits from the collaboration and license agreement, we do not have the power to direct the activities under the collaboration and license agreement as Agios has the decision-making authority for this collaboration until we exercise our option to license a product. Our interest in Agios is limited to our equity ownership and we do not have any obligations or rights to the future losses or returns of Agios beyond this ownership.
Epizyme Inc. (Epizyme): In April 2012, we entered into a collaboration and license agreement with Epizyme to discover, develop and commercialize novel therapeutic compounds by inhibiting histone methyltransferases (HMT), an important epigenetic target class. Under the terms of the agreement, we made an upfront payment to Epizyme and also made an equity investment in Epizyme and received an exclusive option to license rights outside the United States to HMT inhibitors targeting the DOT1L HMT, including the Company’s product candidate EPZ-5676 and each Epizyme compound associated with such licensed compounds during the option term. If the option is exercised, Epizyme could receive up to $165.0 million in milestone payments associated with each Epizyme compound developed to inhibit each distinct HMT target under the collaboration plus royalties on sales. Epizyme will have the sole responsibility to develop and commercialize compounds in the United States.
The option term expires on either July 9, 2015 (or July 9, 2016 if we extend the option term for a fourth year and pay an option extension fee). Further, if an HMT target or targets are selected, the collaboration agreement will expire upon the expiration of all applicable royalty terms with respect to all licensed Epizyme compounds. Upon the expiration of the collaboration agreement, we will have a fully paid-up, royalty-free license to use Epizyme intellectual property to manufacture, market, use and sell such licensed Epizyme compounds outside the United States.

CELGENE CORPORATION AND SUBSIDIARIESNOTES TO CONSOLIDATED FINANCIAL STATEMENTS – (Continued)
94
bluebird bio, Inc. (bluebird): In March 2013, we entered into a collaboration agreement with bluebird to discover, develop and commercialize novel disease-altering gene therapies in oncology. The collaboration focuses on applying gene therapy technology to modify a patient’s own T-cells, known as chimeric antigen receptor (CAR) T-cells, to target and destroy cancer cells. The collaboration has the potential to lead to the development of multiple CAR T-cell products. We have an option to license any products resulting from the collaboration after the completion of a phase I clinical study by bluebird for each product.
We made an upfront payment and may be obligated to pay up to $225.0 million per licensed product in aggregate potential option fees and clinical and regulatory milestone payments. bluebird also has the option to participate in the development and commercialization of any licensed products resulting from the collaboration through a 50/50 co-development and profit share in the United States in exchange for a reduction of milestone payments. Royalties would also be paid to bluebird in regions where there is no profit share, including in the United States, if bluebird declines to exercise their co-development and profit sharing rights.
The agreement has a termination date of March 19, 2016 and we have the option to extend the agreement until March 19, 2019 with the payment of extension fees. Further, we have the ability to terminate the collaboration at our discretion upon 90 days written notice to bluebird. If a product is optioned, the parties will enter into a pre-negotiated license agreement and potentially a co-development agreement should bluebird exercise its option to participate in the development and commercialization in the United States. The license agreement, if not terminated sooner, would expire upon the expiration of all applicable royalty terms under the agreement with respect to the particular product, and the co-development agreement, if not terminated sooner, would expire when the product is no longer being developed or commercialized in the United States. Upon the expiration of a particular license agreement, we will have a fully paid-up, royalty-free license to use bluebird intellectual property to manufacture, market, use and sell such licensed product.
FORMA Therapeutics Holdings, LLC (FORMA): In April 2013, we entered into a collaboration arrangement with FORMA under which the parties will discover, develop and commercialize drug candidates to regulate protein homeostasis targets. Protein homeostasis, which is important in oncology, neurodegenerative and other disorders, involves a tightly regulated network of pathways controlling the biogenesis, folding, transport and degradation of proteins.
The collaboration was launched with an upfront payment that enables us to evaluate selected targets and lead assets in protein homeostasis pathways during the pre-clinical phase. We will have the right to obtain exclusive licenses with respect to the development and commercialization of multiple drug candidates outside of the United States, in exchange for research and early development payments of up to approximately $200.0 million. FORMA is incentivized to advance the full complement of drug candidates through Phase I, and we will be responsible for all further global clinical development for each licensed candidate. FORMA is eligible to receive up to an additional $315.0 million in potential payments based upon development, regulatory and sales objectives for the first ex-U.S. license. FORMA is also eligible to receive potential payments for successive licenses, which escalate for productivity, increasing up to a maximum of an additional $430.0 million per program. In addition, FORMA will receive royalties on ex-U.S. sales and additional payments if multiple drug candidates reach defined cumulative sales objectives. The collaboration arrangement includes provisions for us to obtain rights with respect to development and commercialization of drug candidates in the United States in exchange for additional payments.
Under the collaboration arrangement, the parties will perform initial research and development for a term of four years. If, during such research term, a drug candidate meets certain criteria, then the parties will enter into a pre-negotiated license agreement and the collaboration will continue until all license agreements and all applicable royalty terms have expired. Each license agreement, if not terminated sooner would expire upon the expiration of all applicable royalty terms under such agreement. Upon the expiration of each license agreement, we will have an exclusive, fully-paid, royalty-free license to use the applicable FORMA intellectual property to manufacture, market, use and sell the product developed under such agreement outside of the United States. On October 7, 2013, we entered into the first ex-US license with FORMA and paid the applicable upfront payment under such license.
MorphoSys AG (MorphoSys): In June 2013, we signed a collaboration, license and equity purchase agreement with MorphoSys to jointly develop MOR202 globally and to co-promote MOR202 in Europe. In August 2013, the transaction became effective. MOR202 is a fully human monoclonal antibody targeting CD38 to treat patients with multiple myeloma and certain leukemias. MOR202 is currently being evaluated in a phase I/IIa trial in patients with relapsed/refractory multiple myeloma.
MorphoSys could receive up to EUR 511.0 million (approximately $664.5 million) in development, regulatory and sales milestones and tiered royalties on net sales of MOR202 outside the co-promotion territory. In the co-promotion territory, MorphoSys retains a 50/50 profit sharing right on MOR202 in exchange for paying one third of the MOR202 development costs. Should MorphoSys choose to opt out of its co-promotion rights, MorphoSys would receive tiered royalties on net sales of MOR202 globally.

CELGENE CORPORATION AND SUBSIDIARIESNOTES TO CONSOLIDATED FINANCIAL STATEMENTS – (Continued)
95
The agreement may be terminated at our discretion upon six months written notice to MorphoSys, or by either party upon material breach of the other party. Upon the expiration of the agreement, we will have a fully paid-up, irrevocable, perpetual, non-terminable license to use the intellectual property licensed from MorphoSys to research, develop, make, commercialize, use and sell MOR202.
Acetylon Pharmaceuticals, Inc. (Acetylon): In July 2013, we entered into a collaboration and option agreement with Acetylon. Under the agreement, the parties will support the development of Acetylon's portfolio of oral, selective HDAC inhibitors in oncology, hematology, immunology and neurologic disease indications. In addition, we have rights to receive certain research and development services from Acetylon and an exclusive right to acquire Acetylon at a later date at a purchase price based upon future independent company valuations.
The collaboration focuses on the continued clinical advancement of Acetylon's lead candidate, ACY-1215, an HDAC6 inhibitor being developed for hematological malignancies, ACY-738 for neurological diseases, an HDAC1/2 inhibitor and a yet unnamed project, spanning cancer and non-cancer disease indications. Under the agreement, we made an upfront payment to Acetylon, which included a fee for entering into the collaboration, fees for the exclusive right to acquire Acetylon and the rights to receive certain research and development services from Acetylon. During the term of the agreement, Acetylon will retain control of its drug development programs. If we exercise our right to acquire Acetylon, in addition to the purchase price based upon independent company valuations to be paid at the time of the acquisition, Acetylon shareholders will be eligible to receive potential future milestone payments for approvals, or additional indications, of drugs developed by Acetylon and for accomplishing defined sales targets. If all the milestones are achieved, the aggregate amount of the milestone payments would be $1.100 billion.
The agreement has an expiration date of December 31, 2015 and we have the right to extend the agreement until either June 30, 2016 or December 31, 2016 with the payment of an extension fee. Further, we have the ability to terminate the agreement at our discretion upon written notice to Acetylon.
OncoMed Pharmaceuticals, Inc. (OncoMed): On December 2, 2013, we entered into a collaboration agreement to jointly develop and commercialize up to six anti-cancer stem cell (CSC) product candidates from OncoMed’s biologics pipeline, including demcizumab (OMP-21M18, Anti-DLL4). OncoMed will control and conduct initial clinical studies. We will have an option to license worldwide rights to up to six novel anti-CSC therapeutic candidates commencing upon the completion of enrollment of patients in a phase I trial (and with respect to Demcizumab, a phase II trial) and ending 60 days after delivery by OncoMed of the applicable data package for each therapeutic candidate, subject to certain extensions. We will also have research, development and commercialization rights to small molecule compounds in another cancer stem cell pathway, with OncoMed eligible to receive milestones and royalties on any resulting products.
Demcizumab is currently in three phase Ib clinical studies in combination with standard-of-care therapeutics, including a trial in patients with first-line advanced pancreatic cancer. Subsequent to the exercise of our option rights, the parties will co-develop demcizumab and share global development costs on a one-third OncoMed and two-thirds Celgene split. Outside the United States, we would lead development and commercialization efforts, with OncoMed eligible to receive milestones and tiered royalties on sales outside the United States.
In addition to demcizumab, the collaboration includes up to five preclinical- or discovery-stage biologics programs: OncoMed’s anti-DLL4/VEGF bispecific antibody and up to four additional biologics programs targeting either the RSPO-LGR CSC pathway or another CSC pathway. We have exclusive options on these programs during or after completion of certain phase I clinical trials to be conducted by OncoMed, which if exercised, contain U.S. profit sharing and co-commercialization terms, plus one-third OncoMed and two-thirds Celgene global development cost-sharing and royalties outside the profit-sharing territory.
The collaboration agreement also includes option exercise payments and payments for achievement of development, regulatory and commercial milestones, paid on a per-program basis. For the demcizumab program, these contingent payments could total up to approximately $790.0 million, and include a payment for achievement of predetermined safety criteria in phase II clinical trials. For the anti-DLL4/VEGF bispecific antibody program, contingent payments could total up to $505.0 million. For the other four programs, each program is eligible for up to approximately $440.0 million of contingent payments. OncoMed could also receive more than $100.0 million in contingent payments for the small molecule program.
The collaboration agreement may be terminated by us on a program-by-program basis upon one hundred twenty (120) days prior written notice before exercise of that program option, and after such program option exercise, by either party for material breach by the other party. With certain exceptions, the collaboration agreement expires upon the later of (a) the last-to-expire option term and (b) if one or more options are exercised, the termination or expiration of the last to expire agreement with respect to such exercised option.

CELGENE CORPORATION AND SUBSIDIARIESNOTES TO CONSOLIDATED FINANCIAL STATEMENTS – (Continued)
96
Other Collaboration Arrangements in 2013: In addition to the collaboration arrangements described above, we entered into a number of collaborative arrangements during 2013 that resulted in $52.1 million of assets for investments in equity or other assets and research and development expenses of $149.0 million. These additional arrangements entered into during 2013 include the potential for future milestone payments of up to an aggregate $373.0 million related to the attainment of specified development and regulatory approval milestones over a period of several years. Our obligation to fund these efforts is contingent upon continued involvement in the programs and/or the lack of any adverse events which could cause the discontinuance of the programs. We do not consider these collaboration arrangements to be individually significant at this time.
Summarized financial information related to our collaboration agreements is presented below:
Year ended December 31, As of December 31,1
Research and Development Expense
Upfront Fees Milestones
Extension of
Agreements
Amortization of Prepaid
Research and Development
Additional Equity
Investments Made
Intangible Asset
Balance
Equity Investment
Balance
Percentage of
Outstanding Equity
Acceleron 2013 $ — $ 17.0 $ — $ — $ 10.0 $ — $ 127.2 11%
2012 — — — — — — 30.5 12%
2011 25.0 14.5 — — 25.02010and
prior 45.0 13.0 — — 5.5
Agios 2013 — — 20.0 — 12.8 — 113.0 15%
2012 — — — — — — 37.5 17%
2011 — — 20.0 — 28.72010and
prior 121.2 — — — 8.8
Epizyme 2013 — 25.0 — — 1.0 — 69.4 12%
2012 65.0 — — — 25.0 — 25.0 15%
bluebird 2013 74.7 — — — — 0.2 — —%
FORMA 2013 52.8 — — — — 0.2 — —%
MorphoSys 2013 94.3 — — — 61.3 — 61.4 3%
Acetylon 2013 50.0 — — 4.3 10.0 35.7 25.0 10%
2012 — — — — 5.0 — 15.0 10%
2011 — — — — 10.0
Oncomed 2013 155.0 — — — 22.2 — 43.4 5%OtherCollaborationArrangements
2013 149.0 — — 3.0 13.6 25.6 30.0 N/A
2012 113.5 5.4 — 0.2 13.6 27.3 29.9 N/A
2011 103.5 1.0 2.4 — 1.1
1 Year-end balance and percentage of outstanding equity are presented for the current and prior year.
18. Commitments and Contingencies
Contingent Value Rights: In connection with the acquisition of Abraxis in 2010, CVRs were issued under a Contingent Value Rights Agreement, or CVR Agreement, entered into between Celgene and American Stock Transfer & Trust Company, LLC, as trustee. The CVRs are registered for trading on the NASDAQ Global Market under the symbol "CELGZ." The fair value of the liability of the Company related to payments under the CVR Agreement are subject to fluctuation based on trading prices for the publicly traded CVRs. Subsequent to the Abraxis Acquisition Date, we measured the contingent consideration represented by the CVRs at fair value with changes in fair value recognized in operating earnings. The fair value of our liability related to the CVRs was $118.1 million at the end of 2013 compared to $277.4 million at the end of 2012.

CELGENE CORPORATION AND SUBSIDIARIESNOTES TO CONSOLIDATED FINANCIAL STATEMENTS – (Continued)
97
Each holder of a CVR is entitled to receive a pro rata portion, based on the number of CVRs then outstanding, of each of the following contingent cash payments:
• Milestone Payment #1. $250.0 million upon FDA approval of ABRAXANE® for use in the treatment of NSCLC if such approval permits us to market ABRAXANE® with FDA approval that includes a progression-free survival, or PFS, claim, but only if this milestone is achieved no later than the fifth anniversary of the Merger.
• Milestone Payment #2. $400.0 million (if achieved no later than April 1, 2013) or $300.0 million (if achieved after April 1, 2013 and before the fifth anniversary of the Merger) upon FDA approval of ABRAXANE® for use in the treatment of pancreatic cancer, if such approval permits us to market ABRAXANE® with FDA approval that includes an overall survival claim.
• Net Sales Payments. For each full one-year period ending December 31 during the term of the CVR Agreement, which we refer to as a net sales measuring period (with the first net sales measuring period beginning January 1, 2011 and ending December 31, 2011):
2.5% of the net sales of ABRAXANE® and the Abraxis pipeline products that exceed $1.000 billion but are less than or equal to $2.000 billion for such period, plusan additional amount equal to 5% of the net sales of ABRAXANE® and the Abraxis pipeline products that exceed $2.000 billion but are less than or equal to $3.000 billion for such period, plusan additional amount equal to 10% of the net sales of ABRAXANE® and the Abraxis pipeline products that exceed $3.000 billion for such period.
No payments will be due under the CVR Agreement with respect to net sales of ABRAXANE® and the Abraxis pipeline products after December 31, 2025, which we refer to as the net sales payment termination date, unless net sales for the net sales measuring period ending on December 31, 2025 are equal to or greater than $1.000 billion, in which case the net sales payment termination date will be extended until the last day of the first net sales measuring period subsequent to December 31, 2025 during which net sales of ABRAXANE® and the Abraxis pipeline products are less than $1.000 billion or, if earlier, December 31, 2030.
Milestone Payment #1 update: In October 2012, the FDA approved ABRAXANE® for the first-line treatment of locally advanced or metastatic NSCLC, in combination with carboplatin, in patients who are not candidates for curative surgery or radiation therapy. The FDA approval was based on tumor response rates and did not result in the use of a marketing label that includes a progression-free survival claim, and accordingly, the CVR Milestone Payment #1, as described above, has not been achieved. This approval resulted in the related $1.172 billion intangible asset obtained from the Abraxis acquisition being reclassified in October 2012 from an acquired IPR&D intangible to an acquired developed product rights intangible asset and amortization commenced in October 2012.
Milestone Payment #2 update: In September 2013, the FDA approved ABRAXANE® for use in the treatment of pancreatic cancer, permitting us to market ABRAXANE® with a label that includes an overall survival claim. This approval resulted in the achievement of milestone #2 and the subsequent payment of $300.0 million to CVR holders in October 2013.
Leases: We lease offices and research facilities under various operating lease agreements in the United States and international markets. We also lease automobiles and certain equipment in these same markets. At December 31, 2013, the non-cancelable lease terms for the operating leases expire at various dates between 2014 and 2023 and include renewal options. In general, the Company is also required to reimburse the lessors for real estate taxes, insurance, utilities, maintenance and other operating costs associated with the leases.
Future minimum lease payments under non-cancelable operating leases as of December 31, 2013 are:
Operating
Leases2014 $ 54.52015 47.72016 39.62017 31.42018 21.4Thereafter 44.6Total minimum lease payments $ 239.2
Total rental expense under operating leases was approximately $50.9 million in 2013, $41.9 million in 2012 and $48.1 million in 2011.

CELGENE CORPORATION AND SUBSIDIARIESNOTES TO CONSOLIDATED FINANCIAL STATEMENTS – (Continued)
98
Lines of Credit: We maintain lines of credit with several banks to support its hedging programs and to facilitate the issuance of bank letters of credit and guarantees on behalf of its subsidiaries. Lines of credit supporting our hedging programs as of December 31, 2013 allowed us to enter into derivative contracts with settlement dates through 2016. As of December 31, 2013, we have entered into derivative contracts with net notional amounts totaling $7.635 billion. Lines of credit facilitating the issuance of bank letters of credit and guarantees as of December 31, 2013 allowed us to have letters of credit and guarantees issued on behalf of our subsidiaries totaling $86.6 million.
Other Commitments: Our obligations related to product supply contracts totaled $153.7 million at December 31, 2013. We are also committed to pay the remaining $14.6 million balance due from our acquisition of a manufacturing facility in Switzerland.
As part of the sale of certain non-core assets in April 2011 (see Note 2) we committed to make certain future contingent matching contributions and an additional milestone-based contingent contribution to the CSS Institute. Under the terms of the agreement, we were obligated to make two additional contributions of $25.0 million based on like amounts of other third-party contributions being received by the CSS Institute and a $25.0 million milestone-based contribution contingent upon the CSS Institute achieving specified results related to the collection of DNA data and genomic sequences and the initiation of research and development alliances to be achieved before December 31, 2015. In conjunction with a September 2013 equity investment, the parent company of NantHealth LLC assumed, and agreed to pay and satisfy when due, our obligation to pay CSS Institute the $25.0 million contingent, milestone-based contribution. Subsequent to December 31, as part of the January 2014 equity investment in NantBioScience, the parent company of NantBioScience assumed, and agreed to pay and satisfy when due, our obligation to pay CSS Institute the $50.0 million contingent, matching contributions.
Collaboration Arrangements: We have entered into certain research and development collaboration agreements, as identified in Note 17 above, with third parties that include the funding of certain development, manufacturing and commercialization efforts with the potential for future milestone and royalty payments upon the achievement of pre-established developmental, regulatory and/or commercial targets. Our obligation to fund these efforts is contingent upon continued involvement in the programs and/or the lack of any adverse events which could cause the discontinuance of the programs. Due to the nature of these arrangements, the future potential payments are inherently uncertain, and accordingly no amounts have been recorded for the potential future achievement of these targets in our accompanying Consolidated Balance Sheets at December 31, 2013 and 2012.
Contingencies: We believe we maintain insurance coverage adequate for our current needs. Our operations are subject to environmental laws and regulations, which impose limitations on the discharge of pollutants into the air and water and establish standards for the treatment, storage and disposal of solid and hazardous wastes. We review the effects of such laws and regulations on our operations and modify our operations as appropriate. We believe we are in substantial compliance with all applicable environmental laws and regulations.
We have ongoing customs, duties and VAT examinations in various countries that have yet to be settled. Based on our knowledge of the claims and facts and circumstances to date, none of these matters, individually or in the aggregate, are deemed to be material to our financial condition.
Legal Proceedings:
Like many companies in our industry, we have from time to time received inquiries and subpoenas and other types of information requests from government authorities and we have been subject to claims and other actions related to our business activities. While the ultimate outcome of investigations and legal proceedings are difficult to predict, adverse resolutions or settlements of those matters may result in, among other things, modification of our business practices, product recalls, costs and significant payments, which may have a material adverse effect on our results of operations, cash flows or financial condition. Pending patent proceedings include challenges to the scope, validity or enforceability of our patents relating to certain of our products or processes. Further, we are subject to claims of third parties that we infringe their patents covering products or processes. Although we believe we have substantial defenses to these challenges and claims, there can be no assurance as to the outcome of these matters and an adverse decision in any of these proceedings could result in (i) a loss of patent protection, which could lead to a significant reduction of sales that could materially affect future results of operations, (ii) our inability to continue to engage in infringing activities, and (iii) significant liabilities, including payment of damages, royalties and/or license fees to any such third party.

CELGENE CORPORATION AND SUBSIDIARIESNOTES TO CONSOLIDATED FINANCIAL STATEMENTS – (Continued)
99
Among the principal matters pending are the following:
Investigative Proceedings:
In 2009, we received a Civil Investigative Demand (CID) from the U.S. Federal Trade Commission (FTC) seeking documents and other information relating to requests by generic companies to purchase our patented REVLIMID® and THALOMID® brand drugs in order for the FTC to evaluate whether there may be reason to believe that we have engaged in unfair methods of competition relating to requests by generic companies to purchase our patented REVLIMID® and THALOMID® brand drugs. In 2010, the State of Connecticut issued a subpoena referring to the same issues raised by the 2009 CID. Also in 2010, we received a second CID from the FTC relating to this matter. We continue to cooperate with the FTC and State of Connecticut investigations. In 2011, the United States Attorney’s Office for the Central District of California informed us that they are investigating possible off-label marketing and improper payments to physicians in connection with the sales of THALOMID® and REVLIMID®. In 2012, we learned that two other United States Attorneys’ offices (the Northern District of Alabama and the Eastern District of Texas) and various state Attorneys General were conducting related investigations. In February 2014, three civil qui tam actions related to those investigations brought by three former Celgene employees on behalf of the federal and various state governments under the False Claims Act and certain state laws, were unsealed after the United States Department of Justice (DOJ) declined to intervene in these actions. The DOJ maintains the right to intervene at any time. The three actions are as follows: (i) United States of America ex rel. James Patrick Eddins, Plaintiff/Relator v. Celgene Corporation, Defendant, United States District Court for the Northern District of Alabama (the “Northern District of Alabama action”), (ii) David Schmidt, by and on behalf of the United States of America and various States, ex rel. Plaintiff/Relator v. Celgene Corporation, Defendant, United States District Court for the Eastern District of Texas, and (iii) United States of America and various States, ex rel. Beverly Brown Plaintiff/Relator v. Celgene Corporation, Defendant, United States District Court for the Central District of California. The plaintiff in the Northern District of Alabama action voluntarily dismissed that case. We intend to vigorously defend against the two remaining civil actions.
Patent Related Proceedings:
REVLIMID®: We received Notice Letters, the first of which was dated August 30, 2010, from Natco Pharma Limited of India (Natco) notifying us of Natco’s Abbreviated New Drug Application (ANDA), which contains Paragraph IV certifications against certain of Celgene’s patents that are listed in the FDA Approved Drug Products With Therapeutic Equivalence Evaluations (the “Orange Book”) for REVLIMID® (lenalidomide). Natco’s Notice Letters were sent in connection with its filing of an ANDA seeking permission from the FDA to market a generic version of 25mg, 15mg, 10mg and 5mg REVLIMID® capsules. In response to the Notice Letters, we filed infringement actions in the United States District Court for the District of New Jersey against Natco, Natco’s U.S. partner, Arrow International Limited (Arrow), and Watson Laboratories, Inc. (Watson, a wholly-owned subsidiary of Actavis, Inc. (formerly known as Watson Pharmaceuticals, Inc.), which is Arrow’s parent) (Natco, Arrow and Watson are collectively referred to hereinafter as “Natco”). In its answer and counterclaim, Natco asserts that our patents are invalid, unenforceable and/or not infringed by Natco’s proposed generic products.
The patents in dispute include United States Patent Nos. 5,635,517, 6,045,501, 6,315,720, 6,555,554, 6,561,976, 6,561,977, 6,755,784, 7,119,106, 7,465,800, 6,281,230, 7,189,740, 7,855,217, 7,968,569, 8,288,415, 8,315,886, 8,404,717 and 8,431,598 plus two non-Orange Book listed patents, United States Patent Nos. 7,977,357 and 8,193,219.
On December 11, 2013, the court set the close of fact discovery for April 21, 2014. Claim construction is currently expected to be fully briefed by April 8, 2014. Dates for a claim construction hearing and trial have yet to be set. We believe that Natco’s defenses and counterclaims are unlikely to be sustained and we intend to vigorously assert our patent rights. Although there can be no assurance as to the ultimate outcome of this proceeding, we currently expect that it will not have a material adverse effect on our financial condition or results of operations. However, if Natco is successful in challenging all the patents in dispute or if the court rules that certain of our key patent claims are invalid or not infringed, such events could have a material adverse effect on our financial condition and results of operations.
ABRAXANE®: On December 14, 2011, Cephalon, Inc. and Acusphere, Inc. filed a complaint against us in the United States District Court for the District of Massachusetts, alleging, among other things, that the making, using, selling, offering to sell and importing of ABRAXANE® brand drug infringes claims of United States Patent No. RE40,493. Plaintiffs are seeking damages and injunctive relief. On December 3, 2013, the court issued an order construing certain disputed claim terms in accordance with Celgene’s proposed construction for several key terms. We intend to vigorously defend against this infringement suit. If the suit against us is successful, we may have to pay damages, ongoing royalties and may have to license rights from plaintiffs. However, we believe that (a) it is unlikely that the plaintiffs in this matter will prevail and (b) the ultimate outcome will not have a material adverse effect on our financial condition or results of operations.

CELGENE CORPORATION AND SUBSIDIARIESNOTES TO CONSOLIDATED FINANCIAL STATEMENTS – (Continued)
100
VIDAZA®: On September 28, 2012, we were named as a defendant in a lawsuit filed by Ivax LLC (formerly Ivax Corporation) (“Ivax”) in the United States District Court for the Southern District of Florida. Ivax alleged that we infringed the claims of United States Patent No. 7,759,481 (the “‘481 patent”) by making, using and selling VIDAZA® brand drug in the United States. In December 2013 the parties reached a resolution in which the patent infringement lawsuit was voluntarily dismissed by Ivax with prejudice with no payments by Celgene to Ivax.
THALOMID® and REVLIMID®: On October 2, 2013, Andrulis Pharmaceuticals Corporation (Andrulis) filed a lawsuit against us in the United States District Court for the District of Delaware claiming infringement of U.S. Patent No. 6,140,346 (“the ‘346 patent”). Andrulis alleges that we are liable for infringement of one or more claims of the ‘346 patent which covers the use of THALOMID® (and, as asserted by Andrulis, REVLIMID®) in combination with an alkylating agent (e.g., melphalan) to treat cancers. Andrulis is seeking an unspecified amount of damages, attorneys’ fees and injunctive relief. We disagree with Andrulis’ allegations and intend to vigorously defend against this infringement suit. On November 25, 2013, we filed a motion to dismiss Andrulis’ complaint. Andrulis’ motion seeking leave to file an amended complaint, was granted by the court on December 30, 2013. We filed a motion to dismiss Andrulis’ amended complaint on January 30, 2014. We expect that the ultimate outcome of this lawsuit will not have a material adverse effect on our financial condition or results of operations.
Other Proceedings:
On June 7, 2013, Children's Medical Center Corporation (CMCC) filed a lawsuit against us in the Superior Court of the Commonwealth of Massachusetts alleging that our obligation to pay a 1% royalty on REVLIMID® net sales revenue and a 2.5% royalty on POMALYST®/IMNOVID® net sales revenue under a license agreement entered into in December 2002 extended beyond February 28, 2013 and that our failure to make royalty payments to CMCC subsequent to February 28, 2013 breached the license agreement. CMCC is seeking unspecified damages and a declaration that the license agreement remains in full force and effect. In July 2013, we removed these proceedings to the United States District Court for the District of Massachusetts. On August 5, 2013, we filed an answer to CMCC’s complaint and a counterclaim for declaratory judgment that our obligations to pay royalties have expired. On August 26, 2013, CMCC filed an answer to our counterclaim. A scheduling conference was held on February 11, 2014 and the court ordered fact discovery to be completed by December 15, 2014. No trial date has as yet been set by the court. We intend to vigorously defend against CMCC's claims. As of December 31, 2013, we consider the range of reasonably possible loss relating to this lawsuit to be between zero and $35.9 million, with the high end of the range being the royalty payments on REVLIMID® we would have made under the license agreement through December 31, 2013, if it had remained in effect. CMCC contends that our royalty obligation continues on sales of REVLIMID® at least until May 2016 and if CMCC prevails, we may be obligated to continue to pay royalties for periods after December 31, 2013.
19. Geographic and Product Information
Operations by Geographic Area: Revenues primarily consisted of sales of REVLIMID®, VIDAZA®, ABRAXANE®, POMALYST®/IMNOVID®, THALOMID® and ISTODAX®. Additional sources of revenue included a licensing agreement with Novartis, which entitles us to royalties on FOCALIN XR® and the entire RITALIN® family of drugs, the sale of services through our Cellular Therapeutics subsidiary and other miscellaneous licensing agreements.
Revenues 2013 2012 2011United States $ 3,862.1 $ 3,169.1 $ 2,860.9Europe 1,865.7 1,617.7 1,477.5All other 766.1 719.9 503.7Total revenues $ 6,493.9 $ 5,506.7 $ 4,842.1
Long-Lived Assets1 2013 2012United States $ 348.0 $ 343.3Europe 230.4 221.5All other 15.0 13.6Total long lived assets $ 593.4 $ 578.4
1 Long-lived assets consist of net property, plant and equipment.

CELGENE CORPORATION AND SUBSIDIARIESNOTES TO CONSOLIDATED FINANCIAL STATEMENTS – (Continued)
101
Revenues by Product: Total revenues from external customers by product for the years ended December 31, 2013, 2012 and 2011 were as follows:
2013 2012 2011REVLIMID® $ 4,280.3 $ 3,766.6 $ 3,208.2VIDAZA® 803.3 823.2 705.3ABRAXANE® 648.9 426.7 385.9POMALYST®/IMNOVID® 305.4 12.0 0.6THALOMID® 244.5 302.1 339.1ISTODAX® 54.0 50.0 30.9Azacitidine for injection 23.3 — —Other 2.6 5.0 29.7Total net product sales 6,362.3 5,385.6 4,699.7Collaborative agreements and other revenue 14.7 10.7 19.5Royalty revenue 116.9 110.4 122.9Total revenue $ 6,493.9 $ 5,506.7 $ 4,842.1
Major Customers: We sell our products primarily through wholesale distributors and specialty pharmacies in the United States, which account for a large portion of our total revenues. International sales are primarily made directly to hospitals, clinics and retail chains, many of which are government owned. During the three-year period of 2013, 2012 and 2011, only Amerisource Bergen accounted for more than 10% of our total revenue in at least one of those years and is summarized below. The percentage of amounts due from this customer compared to total net accounts receivable is also summarized below as of December 31, 2013 and 2012.
Percent of Total Revenue Percent of Net Accounts ReceivableCustomer 2013 2012 2011 2013 2012Amerisource Bergen Corp. 10.7% 11.5% 12.6% 6.4% 9.6%

CELGENE CORPORATION AND SUBSIDIARIESNOTES TO CONSOLIDATED FINANCIAL STATEMENTS – (Continued)
102
20. Quarterly Results of Operations (Unaudited)
2013 1Q 2Q 3Q 4Q 3 YearTotal revenue $ 1,464.6 $ 1,599.0 $ 1,674.4 $ 1,755.9 $ 6,493.9Gross profit1 1,348.8 1,483.2 1,557.8 1,632.1 6,021.9Income tax provision 63.5 79.7 69.5 2.8 215.5
Net income attributable to Celgene 384.9 478.1 372.5 214.4 1,449.9
Net income per share:2 Basic $ 0.92 $ 1.15 $ 0.90 $ 0.52 $ 3.50Diluted $ 0.89 $ 1.11 $ 0.87 $ 0.50 $ 3.37
Weighted average shares (in millions) Basic 417.9 414.1 412.3 411.2 413.8Diluted 432.2 429.3 428.8 428.6 430.3
2012 1Q 2Q 3Q 4Q 4 YearTotal revenue $ 1,273.3 $ 1,366.8 $ 1,419.2 $ 1,447.4 $ 5,506.7Gross profit1 1,173.0 1,264.7 1,313.4 1,335.4 5,086.5Income tax provision 72.5 73.3 52.3 27.2 225.3Net income attributable to Celgene 401.5 367.4 424.2 263.1 1,456.2
Net income per share attributable to Celgene:2
Basic $ 0.92 $ 0.84 $ 0.99 $ 0.62 $ 3.38Diluted $ 0.90 $ 0.82 $ 0.97 $ 0.61 $ 3.30
Weighted average shares (in millions) Basic 438.3 436.7 427.2 421.6 430.9Diluted 448.6 445.4 436.3 432.3 440.8
1 Gross profit is computed by subtracting cost of goods sold (excluding amortization of acquired intangible assets) from net product sales.
2 The sum of the quarters may not equal the full year due to rounding. In addition, quarterly and full year basic and diluted earnings per share are calculated separately.
3 Net income attributable to Celgene for 2013 was moderately lower in the fourth quarter compared to each of the other three quarters. The decrease was primarily due to a higher level of expense related to research and development collaborations, an increase in fair value of our liability related to CVRs and an asset impairment charge related to a royalty receivable asset.
4 Net income attributable to Celgene for 2012 was moderately lower in the fourth quarter compared to each of the other three quarters. The decrease was primarily due to an increase in fair value of our liability related to the CVRs.
21. Subsequent Event
On February 12, 2014, our Board of Directors voted to recommend a two-for-one split of the Company’s common stock to be effected through an amendment to the Company’s Certificate of Incorporation. Implementation of the stock split is subject to stockholder approval of the amendment at the Annual Meeting of Stockholders, which is currently scheduled to take place on June 18, 2014. Per share information contained in this Annual Report on Form 10-K has not been restated to reflect this recommended stock split as it is subject to stockholder approval.

103
ITEM 9. CHANGES IN AND DISAGREEMENTS WITH ACCOUNTANTS ON ACCOUNTING AND FINANCIAL DISCLOSURE
None.
ITEM 9A. CONTROLS AND PROCEDURES
CONCLUSION REGARDING THE EFFECTIVENESS OF DISCLOSURE CONTROLS AND PROCEDURES
As of the end of the period covered by this Annual Report, we carried out an evaluation, under the supervision and with the participation of our management, including our Chief Executive Officer and Chief Financial Officer, of the effectiveness of the design and operation of our disclosure controls and procedures (as defined in the Exchange Act Rules 13a-15(e) and 15d-15(e)) (the "Exchange Act"). Based on the foregoing evaluation, our Chief Executive Officer and Chief Financial Officer have concluded that our disclosure controls and procedures are effective to ensure that information required to be disclosed by us in the reports that we file or submit under the Exchange Act is recorded, processed, summarized and reported within the time periods specified in the rules and forms of the Securities and Exchange Commission and that such information is accumulated and communicated to our management (including our Chief Executive Officer and Chief Financial Officer) to allow timely decisions regarding required disclosures.
CHANGES IN INTERNAL CONTROLS OVER FINANCIAL REPORTING
There were no changes in our internal control over financial reporting during the fiscal quarter ended December 31, 2013 that have materially affected, or are reasonably likely to materially affect, our internal control over financial reporting.
MANAGEMENT'S REPORT ON INTERNAL CONTROL OVER FINANCIAL REPORTING
Our management is responsible for establishing and maintaining adequate internal control over financial reporting and for the assessment of the effectiveness of internal control over financial reporting. As defined by the Securities and Exchange Commission, internal control over financial reporting is a process designed by, or under the supervision of, our principal executive and principal financial officers and effected by our Board of Directors, management and other personnel, to provide reasonable assurance regarding the reliability of financial reporting and the preparation of the consolidated financial statements in accordance with U.S. generally accepted accounting principles.
Our internal control over financial reporting includes those policies and procedures that (1) pertain to the maintenance of records that, in reasonable detail, accurately and fairly reflect our transactions and dispositions of our assets; (2) provide reasonable assurance that transactions are recorded as necessary to permit preparation of the consolidated financial statements in accordance with generally accepted accounting principles, and that our receipts and expenditures are being made only in accordance with authorizations of our management and directors; and (3) provide reasonable assurance regarding prevention or timely detection of unauthorized acquisition, use or disposition of our assets that could have a material effect on the consolidated financial statements.
Because of its inherent limitations, internal control over financial reporting may not prevent or detect misstatements. Also, projections of any evaluation of effectiveness to future periods are subject to the risk that controls may become inadequate because of changes in conditions, or that the degree of compliance with the policies or procedures may deteriorate.
In connection with the preparation of our annual consolidated financial statements, management has undertaken an assessment of the effectiveness of our internal control over financial reporting as of December 31, 2013, based on criteria established in Internal Control-Integrated Framework issued by the Committee of Sponsoring Organizations of the Treadway Commission in 1992, or the COSO Framework. Management's assessment included an evaluation of the design of our internal control over financial reporting and testing of the operational effectiveness of those controls.
Based on this evaluation, management has concluded that our internal control over financial reporting was effective as of December 31, 2013.
KPMG LLP, the independent registered public accounting firm that audited our consolidated financial statements included in this report, has issued their report on the effectiveness of internal control over financial reporting as of December 31, 2013, a copy of which is included herein.
104
REPORT OF INDEPENDENT REGISTERED PUBLIC ACCOUNTING FIRM
The Board of Directors and Stockholders
Celgene Corporation:
We have audited Celgene Corporation and subsidiaries' internal control over financial reporting as of December 31, 2013, based on criteria established in Internal Control-Integrated Framework issued by the Committee of Sponsoring Organizations of the Treadway Commission in 1992, or COSO. Celgene Corporation and subsidiaries' management is responsible for maintaining effective internal control over financial reporting and for its assessment of the effectiveness of internal control over financial reporting, included in the accompanying Management's Report on Internal Control Over Financial Reporting. Our responsibility is to express an opinion on the effectiveness of Celgene Corporation and subsidiaries' internal control over financial reporting based on our audit.
We conducted our audit in accordance with the standards of the Public Company Accounting Oversight Board (United States). Those standards require that we plan and perform the audit to obtain reasonable assurance about whether effective internal control over financial reporting was maintained in all material respects. Our audit included obtaining an understanding of internal control over financial reporting, assessing the risk that a material weakness exists, and testing and evaluating the design and operating effectiveness of internal control based on the assessed risk. Our audit also included performing such other procedures as we considered necessary in the circumstances. We believe that our audit provides a reasonable basis for our opinion.
A company's internal control over financial reporting is a process designed to provide reasonable assurance regarding the reliability of financial reporting and the preparation of financial statements for external purposes in accordance with generally accepted accounting principles. A company's internal control over financial reporting includes those policies and procedures that (1) pertain to the maintenance of records that, in reasonable detail, accurately and fairly reflect the transactions and dispositions of the assets of the company; (2) provide reasonable assurance that transactions are recorded as necessary to permit preparation of financial statements in accordance with generally accepted accounting principles, and that receipts and expenditures of the company are being made only in accordance with authorizations of management and directors of the company; and (3) provide reasonable assurance regarding prevention or timely detection of unauthorized acquisition, use, or disposition of the company's assets that could have a material effect on the financial statements.
Because of its inherent limitations, internal control over financial reporting may not prevent or detect misstatements. Also, projections of any evaluation of effectiveness to future periods are subject to the risk that controls may become inadequate because of changes in conditions, or that the degree of compliance with the policies or procedures may deteriorate.
In our opinion, Celgene Corporation and subsidiaries maintained, in all material respects, effective internal control over financial reporting as of December 31, 2013, based on criteria established in Internal Control-Integrated Framework (1992) issued by COSO.
We also have audited, in accordance with the standards of the Public Company Accounting Oversight Board (United States), the consolidated balance sheets of Celgene Corporation and subsidiaries as of December 31, 2013 and 2012, and the related consolidated statements of income, comprehensive income, cash flows, and stockholders' equity for each of the years in the three-year period ended December 31, 2013, and our report dated February 13, 2014 expressed an unqualified opinion on those consolidated financial statements.
/s/ KPMG LLP
Short Hills, New Jersey
February 13, 2014

105
ITEM 9B. OTHER INFORMATION
None.
PART III
ITEM 10. DIRECTORS, EXECUTIVE OFFICERS AND CORPORATE GOVERNANCE
Pursuant to Paragraph G(3) of the General Instructions to Form 10-K, the information required by Part III (Items 10, 11, 12, 13 and 14) is being incorporated by reference herein from our definitive proxy statement (or an amendment to our Annual Report on Form 10-K) to be filed with the SEC within 120 days of the end of the fiscal year ended December 31, 2013 in connection with our 2014 Annual Meeting of Stockholders.
ITEM 11. EXECUTIVE COMPENSATION
See Item 10.
ITEM 12. SECURITY OWNERSHIP OF CERTAIN BENEFICIAL OWNERS AND MANAGEMENT AND RELATED STOCKHOLDER MATTERS
See Item 10.
ITEM 13. CERTAIN RELATIONSHIPS AND RELATED TRANSACTIONS, AND DIRECTOR INDEPENDENCE
See Item 10.
ITEM 14. PRINCIPAL ACCOUNTANT FEES AND SERVICES
See Item 10.

106
PART IV
ITEM 15. EXHIBITS, FINANCIAL STATEMENT SCHEDULES
Page(a) 1. Consolidated Financial Statements
(a) 2. Financial Statement Schedule
(a) 3. Exhibit Index The following exhibits are filed with this report or incorporated by reference:
Report of Independent Registered Public Accounting Firm 57Consolidated Balance Sheets as of December 31, 2013 and 2012 58Consolidated Statements of Income – Years Ended December 31, 2013, 2012 and 2011 59Consolidated Statements of Comprehensive Income – Years Ended December 31, 2013, 2012 and 2011 60Consolidated Statements of Cash Flows – Years Ended December 31, 2013, 2012 and 2011 61Consolidated Statements of Stockholders' Equity – Years Ended December 31, 2013, 2012 and 2011 63Notes to Consolidated Financial Statements 64
Schedule II – Valuation and Qualifying Accounts 111

107
ExhibitNo. Exhibit Description
2.1 Agreement and Plan of Merger, dated as of November 18, 2007, among Pharmion Corporation, CelgeneCorporation and Cobalt Acquisition LLC (incorporated by reference to Exhibit 2.1 to the Company's CurrentReport on Form 8-K filed on November 19, 2007).
2.2 Agreement and Plan of Merger dated as of June 30, 2010, among Celgene Corporation, ArtistryAcquisition Corp. and Abraxis Bioscience, Inc. (incorporated by reference to Exhibit 2.1 to the Company'sCurrent Report on Form 8-K filed on July 1, 2010).
3.1 Certificate of Incorporation of the Company, as amended through February 16, 2006 (incorporated by referenceto Exhibit 3.1 to the Company's Annual Report on Form 10-K for the year ended December 31, 2005).
3.2 Bylaws of the Company (incorporated by reference to Exhibit 2 to the Company's Current Report on Form 8-K,dated September 16, 1996), as amended effective May 1, 2006 (incorporated by reference to Exhibit 3.2 to theCompany's Quarterly Report on Form 10-Q for the quarter ended March 31, 2006), as further amended effectiveDecember 16, 2009 (incorporated by reference to Exhibit 3.1 to the Company's Current Report on Form 8-Kfiled on December 17, 2009), and as further amended effective February 17, 2010 (incorporated by reference toExhibit 3.2 to the Company's Annual Report on Form 10-K for the fiscal year ended December 31, 2009).
4.1 Contingent Value Rights Agreement, dated as of October 15, 2010, between Celgene Corporation and AmericanStock Transfer & Trust Company, LLC, as trustee, including the Form of CVR Certificate as Annex A(incorporated by reference to Exhibit 4.1 to the Company's Form 8-A12B filed on October 15, 2010).
4.2 Indenture, dated as of October 7, 2010, relating to the 2.450% Senior Notes due 2015, 3.950% Senior Notes due2020 and 5.700% Senior Notes due 2040, between the Company and The Bank of New York Mellon TrustCompany, N.A., as trustee (incorporated by reference to Exhibit 4.1 to the Company's Current Report onForm 8-K filed on October 7, 2010).
4.3 Indenture, dated as of August 9, 2012, relating to the 1.900% Senior Notes due 2017 and 3.250% Senior Notesdue 2022, between the Company and The Bank of New York Mellon Trust Company, N.A., as trustee(incorporated by reference to Exhibit 4.1 to the Company's Current Report on Form 8-K filed on August 9,2012).
4.4 Indenture, dated as of August 6, 2013, relating to the 2.300% Senior Notes due 2018, 4.000% Senior Notes due2023 and the 5.250% Senior Notes due 2043, between the Company and The Bank of New York Mellon TrustCompany, N.A., as trustee (incorporated by reference to Exhibit 4.1 to the Company's Current Report onForm 8-K filed on August 6, 2013).
4.5 Form of 2.450% Senior Notes due 2015 (incorporated by reference to Exhibit 4.2 to the Company's CurrentReport on Form 8-K filed on October 7, 2010).
4.6 Form of 3.950% Senior Notes due 2020 (incorporated by reference to Exhibit 4.3 to the Company's CurrentReport on Form 8-K filed on October 7, 2010).
4.7 Form of 5.700% Senior Notes due 2040 (incorporated by reference to Exhibit 4.4 to the Company's CurrentReport on Form 8-K filed on October 7, 2010).
4.8 Form of 1.900% Senior Notes due 2017 (incorporated by reference to Exhibit 4.2 to the Company's CurrentReport on Form 8-K filed on August 9, 2012).

108
ExhibitNo. Exhibit Description
4.9 Form of 3.250% Senior Notes due 2022 (incorporated by reference to Exhibit 4.3 to the Company's CurrentReport on Form 8-K filed on August 9, 2012).
4.10 Form of 2.300% Senior Notes due 2018 (incorporated by reference to Exhibit 4.2 to the Company's CurrentReport on Form 8-K filed on August 6, 2013).
4.11 Form of 4.000% Senior Notes due 2023 (incorporated by reference to Exhibit 4.3 to the Company's CurrentReport on Form 8-K filed on August 6, 2013).
4.12 Form of 5.250% Senior Note due 2043 (incorporated by reference to Exhibit 4.4 to the Company's CurrentReport on Form 8-K filed on August 6, 2013).
10.1 1992 Long-Term Incentive Plan (incorporated by reference to Exhibit A to the Company's Proxy Statementdated May 30, 1997), as amended by Amendment No. 1 thereto, effective as of June 22, 1999 (incorporated byreference to Exhibit 10.1 to the Company's Quarterly Report on Form 10-Q for the quarter ended September 30,2002).
10.2 1995 Non Employee Directors' Incentive Plan (incorporated by reference to Exhibit A to the Company's ProxyStatement, dated May 24, 1999), as amended by Amendment No. 1 thereto, effective as of June 22, 1999(incorporated by reference to Exhibit 10.2 to the Company's Quarterly Report on Form 10-Q for the quarterended September 30, 2002), as further amended by Amendment No. 2 thereto, effective as of April 18, 2000(incorporated by reference to Exhibit 10.3 to the Company's Quarterly Report on Form 10-Q for the quarterended September 30, 2002), as further amended by Amendment No. 3 thereto, effective as of April 23, 2003(incorporated by reference to Exhibit 10.1 to the Company's Quarterly Report on Form 10-Q for the quarterended March 31, 2005), as further amended by Amendment No. 4 thereto, effective as of April 5, 2005(incorporated by reference to Exhibit 99.2 to the Company's Registration Statement on Form S-8(No. 333-126296)), as amended by Amendment No. 5 thereto (incorporated by reference to Exhibit 10.1 to theCompany's Quarterly Report on Form 10-Q for the quarter ended June 30, 2007), as further amended byAmendment No. 6 thereto (incorporated by reference to Exhibit 10.1 to the Company's Quarterly Report onForm 10-Q for the quarter ended June 30, 2008).
10.3 Form of Indemnification Agreement between the Company and each officer and director of the Company(incorporated by reference to Exhibit 10.12 to the Company's Annual Report on Form 10-K for the year endedDecember 31, 1996).
10.4 Amended and Restated Employment Agreement effective May 1, 2006 between the Company and Robert J.Hugin (incorporated by reference to Exhibit 10.3 to the Company's Quarterly Report on Form 10-Q for thequarter ended March 31, 2006), as amended by Amendment No. 1 thereto, effective as of December 31, 2008(incorporated by reference to Exhibit 10.8 to the Company's Annual Report on Form 10-K for the year endedDecember 31, 2008), as further amended by Amendment No. 2 thereto, effective as of June 16, 2010(incorporated by reference to Exhibit 10.3 to the Company's Current Report on Form 8-K filed on June 18,2010).
10.5 Celgene Corporation 2008 Stock Incentive Plan, as amended and restated as of April 17, 2013 (incorporated byreference to Exhibit 10.1 to the Company's Current Report on Form 8-K filed on June 13, 2013).
10.6 Development and License Agreement between the Company and Novartis Pharma AG, dated April 19, 2000(incorporated by reference to Exhibit 10.21 to the Company's Annual Report on Form 10-K for the year endedDecember 31, 2000).
10.7 Collaborative Research and License Agreement between the Company and Novartis Pharma AG, datedDecember 20, 2000 (incorporated by reference to Exhibit 10.22 to the Company's Annual Report on Form 10-Kfor the year ended December 31, 2000).
10.8 Celgene Corporation 2005 Deferred Compensation Plan, effective as of January 1, 2005 (incorporated byreference to Exhibit 10.22 to the Company's Annual Report on Form 10-K for the year ended December 31,2004), as amended and restated, effective January 1, 2008 (incorporated by reference to Exhibit 10.4 to theCompany's Quarterly Report on Form 10-Q for the quarter ended March 31, 2008, filed on May 12, 2008).
10.9 Anthrogenesis Corporation Qualified Employee Incentive Stock Option Plan (incorporated by reference toExhibit 10.35 to the Company's Annual Report on Form 10-K for the year ended December 31, 2002).
10.10 Distribution and Supply Agreement between SmithKline Beecham Corporation, d/b/a GlaxoSmithKline andCelgene Corporation, dated as of March 31, 2003 (incorporated by reference to Exhibit 10.1 to the Company'sQuarterly Report on Form 10-Q for the quarter ended March 31, 2003).
10.11 Technical Services Agreement among the Company, Celgene UK Manufacturing II, Limited (f/k/a Penn TLimited), Penn Pharmaceutical Services Limited and Penn Pharmaceutical Holding Limited, dated October 21,2004 (incorporated by reference to Exhibit 10.33 to the Company's Annual Report on Form 10-K for the yearended December 31, 2004).

109
ExhibitNo. Exhibit Description
10.12 Lease Agreement between the Company and Powder Horn Associates, with respect to the Warren, New Jerseyproperty, dated January 16, 1987 (incorporated by reference to Exhibit 10.17 to the Company's RegistrationStatement on Form S-1 dated July 24, 1987) (incorporated by reference to Exhibit 10.40 to the Company'sAnnual Report on Form 10-K for the year ended December 31, 2004).
10.13 Finished Goods Supply Agreement between the Company and Penn Pharmaceutical Services Limited, datedSeptember 8, 2004 (certain portions of the agreement have been redacted and filed separately with the Securitiesand Exchange Commission pursuant to a request for confidential treatment, which has been granted)(incorporated by reference to Exhibit 10.52 to the Company's Annual Report on Form 10-K for the year endedDecember 31, 2005).
10.14 Distribution Services and Storage Agreement between the Company and Sharp Corporation, dated January 1,2005 (certain portions of the agreement have been redacted and filed separately with the Securities andExchange Commission pursuant to a request for confidential treatment, which has been granted) (incorporatedby reference to Exhibit 10.53 to the Company's Annual Report on Form 10-K for the year ended December 31,2005).
10.15 Non-Competition, Non-Solicitation and Confidentiality Agreement between Celgene Corporation andDr. Patrick Soon-Shiong, dated as of June 30, 2010 (incorporated by reference to Exhibit 10.3 to the Company'sCurrent Report on Form 8-K filed on July 1, 2010).
10.16 Stockholders' Agreement among Celgene Corporation, Dr. Patrick Soon-Shiong, California Capital LP, PatrickSoon-Shiong 2009 GRAT 1, Patrick Soon-Shiong 2009 GRAT 2, Michele B. Soon-Shiong GRAT 1, Michele B.Soon-Shiong GRAT 2, Soon-Shiong Community Property Revocable Trust, California Capital Trust andMichele B. Chan Soon-Shiong, dated as of June 30, 2010 (incorporated by reference to Exhibit 10.4 to theCompany's Current Report on Form 8-K filed on July 1, 2010).
10.17 Letter Agreement between the Company and Jacqualyn A. Fouse, dated August 18, 2010 (incorporated byreference to Exhibit 99.2 to the Company's Current Report on Form 8-K filed on August 27, 2010).
10.18 Amended and Restated Credit Agreement among Celgene Corporation, the lender parties named therein, andCitibank, N.A., as administrative agent, dated as of April 18, 2013 (incorporated by reference to Exhibit 10.1 tothe Company's Current Report on Form 8-K filed on April 19, 2013).
10.19* Celgene Corporation Management Incentive Plan.10.20 Form of Stock Option Agreement (incorporated by reference to Exhibit 10.20 to the Company’s Annual Report
on Form 10-K for the year ended December 31, 2012).10.21 Form of Restricted Stock Unit Agreement (incorporated by reference to Exhibit 10.21 to the Company’s Annual
Report on Form 10-K for the year ended December 31, 2012).10.22 Letter agreement with Mark J. Alles (incorporated by reference to Exhibit 10. 1 to the Company’s Quarterly
Report on Form 10-Q for the quarter ended March 31, 2013).10.23 Letter agreement with Thomas O. Daniel, M.D. (incorporated by reference to Exhibit 10. 2 to the Company’s
Quarterly Report on Form 10-Q for the quarter ended March 31, 2013).10.24 Letter agreement with Perry A. Karsen (incorporated by reference to Exhibit 10.3 to the Company’s Quarterly
Report on Form 10-Q for the quarter ended March 31, 2013).14.1 Code of Ethics (incorporated by reference to Exhibit 14.1 to the Company's Annual Report on Form 10-K for
the year ended December 31, 2004).21.1* List of Subsidiaries.23.1* Consent of KPMG LLP.24.1* Power of Attorney (included in Signature Page).31.1* Certification by the Company's Chief Executive Officer.31.2* Certification by the Company's Chief Financial Officer.32.1* Certification by the Company's Chief Executive Officer pursuant to 18 U.S.C. Section 1350.32.2* Certification by the Company's Chief Financial Officer pursuant to 18 U.S.C. Section 1350.101* The following materials from Celgene Corporation's Annual Report on Form 10-K for the year ended
December 31, 2013, formatted in XBRL (Extensible Business Reporting Language): (i) the ConsolidatedBalance Sheets, (ii) the Consolidated Statements of Income, (iii) the Consolidated Statements of ComprehensiveIncome, (iv) the Consolidated Statements of Cash Flows, (v) the Consolidated Statements of Stockholders'Equity and (vi) Notes to Consolidated Financial Statements.
*Filed herewith.

110
SIGNATURES AND POWER OF ATTORNEY
KNOW ALL MEN AND WOMEN BY THESE PRESENTS, that each person or entity whose signature appears below constitutes and appoints Robert J. Hugin its true and lawful attorney-in-fact and agent, with full power of substitution and resubstitution, for it and in its name, place and stead, in any and all capacities, to sign any and all amendments to this Form 10-K and to file the same, with all exhibits thereto, and other documents in connection therewith, with the Securities and Exchange Commission, granting unto said attorney-in-fact and agent full power and authority to do and perform each and every act and thing requisite and necessary to be done, as fully to all contents and purposes as it might or could do in person, hereby ratifying and confirming all that said attorney-in-fact and agent or his substitute or substitutes may lawfully do or cause to be done by virtue thereof.
Pursuant to the requirements of Section 13 or 15 (d) of the Securities Exchange Act of 1934, the registrant has duly caused this report to be signed on its behalf by the undersigned thereunto duly authorized.
CELGENE CORPORATION By: /s/ Robert J. Hugin
Robert J. HuginChief Executive Officer (principal executive officer)
________________________________________________________________________________________________________________________
Date: February 13, 2014
Pursuant to the requirements of the Securities Exchange Act of 1934, this report has been signed below by the following persons on behalf of the registrant and in the capacities and on the dates indicated.
Signature Title Date
/s/ Robert J. HuginRobert J. Hugin
Chairman of the Board;Chief Executive Officer (principal executive officer) February 13, 2014
/s/ Jacqualyn A. FouseJacqualyn A. Fouse
Chief Financial Officer(principal financial and accounting officer) February 13, 2014
/s/ Richard W. BarkerRichard W. Barker Director February 13, 2014
/s/ Michael D. CaseyMichael D. Casey Director February 13, 2014
/s/ Carrie S. CoxCarrie S. Cox Director February 13, 2014
/s/ Rodman L. DrakeRodman L. Drake Director February 13, 2014
/s/ Michael A. FriedmanMichael A. Friedman Director February 13, 2014
/s/ Gilla KaplanGilla Kaplan Director February 13, 2014
/s/ James LoughlinJames Loughlin Director February 13, 2014
/s/ Ernest MarioErnest Mario Director February 13, 2014

111
Celgene Corporation and Subsidiaries
Schedule II – Valuation and Qualifying Accounts
Year ended December 31,
Balance atBeginning of
Year
Additions Chargedto Expense or
Sales DeductionsBalance at
End of Year(In millions)
2013Allowance for doubtful accounts $ 21.8 $ 12.3 $ 6.2 $ 27.9Allowance for customer discounts 11.2 74.3 1 73.4 12.1
Subtotal 33.0 86.6 79.6 40.0Allowance for sales returns 13.3 9.6 1 7.4 15.5
Total $ 46.3 $ 96.2 $ 87.0 $ 55.52012
Allowance for doubtful accounts $ 10.1 $ 12.5 $ 0.8 $ 21.8Allowance for customer discounts 8.7 64.9 1 62.4 11.2
Subtotal 18.8 77.4 63.2 33.0Allowance for sales returns 9.0 7.5 1 3.2 13.3
Total $ 27.8 $ 84.9 $ 66.4 $ 46.32011
Allowance for doubtful accounts $ 4.8 $ 6.4 $ 1.1 $ 10.1Allowance for customer discounts 8.3 56.1 1 55.7 8.7
Subtotal 13.1 62.5 56.8 18.8Allowance for sales returns 4.8 16.8 1 12.6 9.0
Total $ 17.9 $ 79.3 $ 69.4 $ 27.8
1 Amounts are a reduction from gross sales.

EXHIBIT 21.1
LIST OF SUBSIDIARIES
NameState or Other Jurisdiction ofIncorporation
Celgene Inc. CanadaAbraxis Bioscience Australia Pty Ltd. AustraliaAbraxis BioScience International Holding Company, Inc. DelawareAbraxis BioScience Puerto Rico, LLC Puerto RicoAbraxis BioScience Service (Beijing) Co. Ltd. Beijing, P.R.C. People’s Republic of ChinaAbraxis BioScience, LLC DelawareAnthrogenesis Corporation New JerseyCabrellis Pharmaceuticals Corp. DelawareCelgene Alpine Investment. Co., LLCCelgene Alpine Investment. Co. II, LLC
DelawareDelaware
Celgene Ab FinlandCelgene AB SwedenCelgene ApS DenmarkCelgene AS NorwayCelgene BV NetherlandsCelgene BVBA BelgiumCelgene Chemicals Sarl SwitzerlandCelgene Co. South KoreaCelgene Edinburgh Finance ScotlandCelgene Europe, Limited United KingdomCelgene European Investment Co. LLC DelawareCelgene Financing Company, LLC DelawareCelgene GmbH AustriaCelgene GmbH GermanyCelgene GmbH SwitzerlandCelgene Holdings East Corp. New JerseyCelgene Holdings SarlCelgene Holdings II Sarl
Switzerland Switzerland
Celgene International Holdings Corporation DelawareCelgene International SARL SwitzerlandCelgene International, Inc. DelawareCelgene Kft HungaryCelgene KK JapanCelgene Limited Hong KongCelgene Limited IrelandCelgene Limited TaiwanCelgene Limited United KingdomCelgene llac Pazarlama ve Tic.Ltd. Sti. TurkeyCelgene Logistics Sarl SwitzerlandCelgene Luxembourg Finance Company SARL Luxembourg

Celgene Luxembourg SARL LuxembourgCelgene Management Sarl SwitzerlandCelgene Netherlands BV NetherlandsCelgene Netherlands II BV NetherlandsCelgene Netherlands Investment, B.V. NetherlandsCelgene NJ Investment Co. New JerseyCelgene Pharmaceuticals Information Consulting Co., Ltd (Shanghai) ChinaCelgene PTE Ltd SingaporeCelgene Pty Limited New ZealandCelgene Pty Limited AustraliaCelgene Puerto Rico Distribution LLC Puerto RicoCelgene R&D SarlCelgene Research and Development, LLC
Switzerland Delaware
Celgene Research and Investment Company LLC DelawareCelgene Research, SL SpainCelgene Sdn. Bhd. MalaysiaCelgene S.L. SpainCelgene SarlCelgene Services Sarl
France Switzerland
Celgene Sociedade Unipessoal Lda PortugalCelgene sp. zoo PolandCelgene Srl ItalyCelgene sro Czech RepublicCelgene sro SlovakiaCelgene Summit Investment Co New JerseyCelgene Switzerland Holdings SarlCelgene Switzerland Investment Sarl
SwitzerlandSwitzerland
Celgene Switzerland SA SwitzerlandCelgene UK Distribution Limited United KingdomCelgene UK Holdings, Limited United KingdomCelgene UK Manufacturing II, Limited United KingdomCelgene UK Manufacturing III, Limited United KingdomCelgene UK Manufacturing, Limited United KingdomCelgro Corporation DelawareCenomed BioSciences, LLC DelawareCHT I LLC DelawareCHT II LLC DelawareCHT III LLC DelawareCHT IV LLC DelawareGlobal Strategic Partners, LLC DelawareGloucester Pharmaceuticals, LLC DelawareMorris Avenue Investment II, LLC New JerseyMorris Avenue Investment LLC New JerseyCelgene Ltd ThailandPharmion LLC DelawareResuscitation Technologies, LLC DelawareSeamair Insurance Limited Ireland

Signal Pharmaceuticals, LLC CaliforniaVivoRx Autoimmune, Inc. CaliforniaCelgene Brasil Biofarmacêutica Ltda. BrazilAbraxis BioScience Limited Hong KongAHI Investment, LLC DelawareAbraxis BioScience, Inc. DelawareCelgene Logistics II Sarl SwitzerlandGloucester International, LLC DelawareCelgene Avilomics Research, Inc. DelawareDeuteria Pharmaceuticals, Inc. DelawareCelgene, S. de R.l. de C.V. MexicoCelgene Research Investment Company II, LLC Delaware

Exhibit 23.1
CONSENT OF INDEPENDENT REGISTERED PUBLIC ACCOUNTING FIRM
The Board of DirectorsCelgene Corporation:
We consent to the incorporation by reference in the registration statements (Nos. 333-70083, 333-91977, 333-39716, 333-107980, 333-65908, 333-138497, 333-149603, 333-152655, 333-160955, 333-177669, 333-184634, 333-191996) on Form S-8, in the registration statements (Nos. 333-02517, 333-32115, 333-38861, 333-52963, 333-87197, 333-93759, 333-94915, 333-75636, 333-107977, 333-107978, 333-138395, 333-169731, 333-191998) on Form S-3, and in the registration statements (Nos. 333-101196, 333-42302, 333-148777 and 333-168369) on Form S-4 of Celgene Corporation of our reports dated February 13, 2014, with respect to the consolidated balance sheets of Celgene Corporation and subsidiaries as of December 31, 2013 and 2012, and the related consolidated statements of income, comprehensive income, cash flows, and stockholders' equity for each of the years in the three-year period ended December 31, 2013, the related consolidated financial statement schedule, and the effectiveness of internal control over financial reporting as of December 31, 2013, which reports appear in the December 31, 2013 annual report on Form 10-K of Celgene Corporation and subsidiaries.
/s/ KPMG LLP
Short Hills, New JerseyFebruary 13, 2014

Exhibit 31.1
CERTIFICATION PURSUANT TO18 U.S.C. Sec. 1350,
AS ADOPTED PURSUANT TOSECTION 302 OF THE SARBANES-OXLEY ACT OF 2002
I, Robert J. Hugin, certify that:
1. I have reviewed this annual report on Form 10-K of Celgene Corporation;
2. Based on my knowledge, this report does not contain any untrue statement of a material fact or omit to state a material fact necessary to make the statements made, in light of the circumstances under which such statements were made, not misleading with respect to the period covered by this annual report;
3. Based on my knowledge, the financial statements, and other financial information included in this report, fairly present in all material respects the financial condition, results of operations and cash flows of the registrant as of, and for the periods presented in this report;
4. The registrant's other certifying officer and I are responsible for establishing and maintaining disclosure controls and procedures (as defined in Exchange Act Rules 13a-15(e) and 15d-15(e)) and internal control over financial reporting (as defined in Exchange Act Rules 13a-15(f) and 15d-15(f) for the registrant and have:
a) Designed such disclosure controls and procedures, or caused such disclosure controls and procedures to be designed under our supervision, to ensure that material information relating to the registrant, including its consolidated subsidiaries, is made known to us by others within those entities, particularly during the period in which this report is being prepared;
b) Designed such internal control over financial reporting, or caused such internal control over financial reporting to be designed under our supervision, to provide reasonable assurance regarding the reliability of financial reporting and the preparation of financial statements for external purposes in accordance with generally accepted accounting principles;
c) Evaluated the effectiveness of the registrant's disclosure controls and procedures and presented in this report our conclusions about the effectiveness of the disclosure controls and procedures, as of the end of the period covered by this report based on such evaluation; and
d) Disclosed in this report any change in the registrant's internal control over financial reporting that occurred during the registrant's most recent fiscal quarter (the registrant's fourth fiscal quarter in the case of an annual report) that has materially affected, or is reasonably likely to materially affect, the registrant's internal control over financial reporting; and
5. The registrant's other certifying officer and I have disclosed, based on our most recent evaluation of internal control over financial reporting, to the registrant's auditors and the audit committee of the registrant's Board of Directors (or persons performing the equivalent functions):
a) All significant deficiencies and material weaknesses in the design or operation of internal control over financial reporting which are reasonably likely to adversely affect the registrant's ability to record, process, summarize and report financial information; and
b) Any fraud, whether or not material, that involves management or other employees who have a significant role in the registrant's internal control over financial reporting.
Date: February 13, 2014
/s/ Robert J. Hugin Robert J. Hugin
Chief Executive Officer

Exhibit 31.2
CERTIFICATION PURSUANT TO18 U.S.C. Sec. 1350,
AS ADOPTED PURSUANT TOSECTION 302 OF THE SARBANES-OXLEY ACT OF 2002
I, Jacqualyn A. Fouse, certify that:
1. I have reviewed this annual report on Form 10-K of Celgene Corporation;
2. Based on my knowledge, this report does not contain any untrue statement of a material fact or omit to state a material fact necessary to make the statements made, in light of the circumstances under which such statements were made, not misleading with respect to the period covered by this annual report;
3. Based on my knowledge, the financial statements, and other financial information included in this report, fairly present in all material respects the financial condition, results of operations and cash flows of the registrant as of, and for the periods presented in this report;
4. The registrant's other certifying officer and I are responsible for establishing and maintaining disclosure controls and procedures (as defined in Exchange Act Rules 13a-15(e) and 15d-15(e)) and internal control over financial reporting (as defined in Exchange Act Rules 13a-15(f) and 15d-15(f) for the registrant and have:
a) Designed such disclosure controls and procedures, or caused such disclosure controls and procedures to be designed under our supervision, to ensure that material information relating to the registrant, including its consolidated subsidiaries, is made known to us by others within those entities, particularly during the period in which this report is being prepared;
b) Designed such internal control over financial reporting, or caused such internal control over financial reporting to be designed under our supervision, to provide reasonable assurance regarding the reliability of financial reporting and the preparation of financial statements for external purposes in accordance with generally accepted accounting principles;
c) Evaluated the effectiveness of the registrant's disclosure controls and procedures and presented in this report our conclusions about the effectiveness of the disclosure controls and procedures, as of the end of the period covered by this report based on such evaluation; and
d) Disclosed in this report any change in the registrant's internal control over financial reporting that occurred during the registrant's most recent fiscal quarter (the registrant's fourth fiscal quarter in the case of an annual report) that has materially affected, or is reasonably likely to materially affect, the registrant's internal control over financial reporting; and
5. The registrant's other certifying officer and I have disclosed, based on our most recent evaluation of internal control over financial reporting, to the registrant's auditors and the audit committee of the registrant's Board of Directors (or persons performing the equivalent functions):
a) All significant deficiencies and material weaknesses in the design or operation of internal control over financial reporting which are reasonably likely to adversely affect the registrant's ability to record, process, summarize and report financial information; and
b) Any fraud, whether or not material, that involves management or other employees who have a significant role in the registrant's internal control over financial reporting.
Date: February 13, 2014
/s/ Jacqualyn A. Fouse Jacqualyn A. Fouse, Ph.D.
Executive Vice PresidentChief Financial Officer(principal financial and accounting officer)

Exhibit 32.1
CERTIFICATION PURSUANT TO18 U.S.C. §1350,
AS ADOPTED PURSUANT TOSECTION 906 OF THE SARBANES-OXLEY ACT OF 2002
In connection with the accompanying Annual Report on Form 10-K of Celgene Corporation ("the Company") for the year ended December 31, 2013 ("the Periodic Report"), I, Robert J. Hugin, Chief Executive Officer of the Company, hereby certify pursuant to 18 U.S.C. Section 1350, as adopted pursuant to Section 906 of the Sarbanes-Oxley Act of 2002, to the best of my knowledge that the Periodic Report fully complies with the requirements of Section 13 (a) or 15 (d) of the Securities Exchange Act of 1934 and that the information contained in the Periodic Report fairly presents, in all material respects, the financial condition and results of operations of the Company.
Date: February 13, 2014 /s/ Robert J. Hugin Robert J. Hugin
Chief Executive Officer

Exhibit 32.2
CERTIFICATION PURSUANT TO18 U.S.C. §1350,
AS ADOPTED PURSUANT TOSECTION 906 OF THE SARBANES-OXLEY ACT OF 2002
In connection with the accompanying Annual Report on Form 10-K of Celgene Corporation ("the Company") for the year ended December 31, 2013 ("the Periodic Report"), I, Jacqualyn A. Fouse, Chief Financial Officer of the Company, hereby certify pursuant to 18 U.S.C. Section 1350, as adopted pursuant to Section 906 of the Sarbanes-Oxley Act of 2002, to the best of my knowledge that the Periodic Report fully complies with the requirements of Section 13 (a) or 15 (d) of the Securities Exchange Act of 1934 and that the information contained in the Periodic Report fairly presents, in all material respects, the financial condition and results of operations of the Company.
Date: February 13, 2014 /s/ Jacqualyn A. Fouse
Jacqualyn A. Fouse, Ph.D. Executive Vice President Chief Financial Officer (principal financial and accounting officer)


Corporate HeadquartersCelgene Corporation86 Morris AvenueSummit, New Jersey 07901(908) 673-9000