Embed Size (px)
Citation preview

1
Improving regional performance in Russia: a capability-based approach
Fadi Farra, Nadia Klos, Uwe Schober, Olga Sigalova and Alexander Zhukov
Summary
Over the past 15 years, while China’s economy has become more complex and export driven, Russia's economy has become less complex and less competitive. Traditional “horizontal policies” that focus on governance and institutional quality have failed to boost two key drivers of economic development: knowledge and capability building. We map the capabilities of the Russian regions and outline a pattern where regions move through four stages of “capability development”: basic diversification, the development of new complex products, new complex sectors, and specialisation and innovation. Building on a new Regional Capability Index as well as historical and case study analysis, we develop a set of scenarios and recommended models to address capability gaps and enhance the competitiveness of Russia.
Keywords: regional development, competitiveness, product space, innovation, Russia
JEL Classification Number: O11, O14, O33, F43
Contact details: Fadi Farra, Whiteshield Partners, Charter House, 5 Pembroke Row, Dublin 2, Ireland. E-mail: [email protected]
Fadi Farra is Partner at Whiteshield Partners and Adjunct Lecturer in Public Policy at the Harvard Kennedy School of Government; Nadia Klos is Senior Analyst, Uwe Schober is Principal, Olga Sigalova is Senior Economist and Alexander Zhukov is Partner, all at Whiteshield Partners.
The authors are grateful to Erik Berglöf and Alexander Plekhanov for their valuable comments and contribution.
The working paper series has been produced to stimulate debate on the economic transformation of central and eastern Europe and the CIS. Views presented are those of the authors and not necessarily of the EBRD.
Working Paper No. 155 Prepared in January 2013
2
1. Introduction Russia is confronted with six major regional development challenges. The high level of inequality in regional GDP distribution remains the key issue to address: in 2011, 10 regions accounted for more than 50 per cent of total GDP in basic prices in Russia and the top 20 regions accounted for almost 70 per cent of GDP. Top contributing regions include the cities of Moscow and St Petersburg, the Moscow region, the Khanty-Mansiysk Autonomous District, Sverdlovsk and Krasnoyarsk regions.
Discrepancies in productivity performances, an indicator of competitiveness, are also significant. The top 10 producing regions had an hourly labour productivity of 439 roubles versus 164 roubles in the bottom 10 regions.1 At the sectorial level the share of output per sector in 2010 for the top 10 regions accounted for 46 per cent of processing, 66 per cent of wholesale and retail trade, 47 per cent of transport and communication, 69 per cent of real estate, leasing and services, 44 per cent of construction, 22 per cent of agriculture and 55 per cent of mining.2
Over-dependence on oil and gas, reflected at the national level, remains a major challenge. In 2010, for example, minerals and fuels jointly made up 85 per cent of export income in Russia. Two regions contribute mainly to these numbers: Khanty-Mansiysk Autonomous District accounted for 32 per cent of the country’s output in the mining sector and Yamalo-Nenets Autonomous District for 10 per cent of Russia’s mining sector in 2010.
Another difficulty is the low population density in many regions, combined with economic development challenges, especially in the Far East: more than 80 per cent of Russia’s inhabitants live in the European part (central, north-western, southern, Volga and Urals federal districts) with the Moscow and St Petersburg regions accounting together for 10 per cent of the Russian population. The Far East is especially affected. These territories are rich in natural resources, including gold, diamonds, minerals and oil. However, they have a relatively low population density and show limited economic development. For example, the Republic of Sakha is about the size of India but has a population of less than 1 million.
The oil- and gas-rich area of the Sakhalin Region and Moscow together accounted for 50 per cent of all foreign direct investment (FDI) inflows in 2004-09. Along with these two regions, the Moscow region, St Petersburg, Omsk and Chelyabinsk regions (six regions) accounted for 70 per cent of all FDI inflows over the same period.3
The concentration of the banking sector is also leading to disparate access to finance. According to Deutsche Bank, Moscow accounted for 31 per cent of total loans and 50 per cent of total deposits in 2009. In addition, out of 1,108 credit institutions in Russia, 543 were in Moscow. As stated by Deutsche Bank, banking profits are also very unevenly distributed across the regions with Moscow representing 85 per cent of total profits of Russian credit institutions.
1 Based on Rosstat, EMISS and OECD Regional Statistics, 2011. 2 Based on Deutsche Bank Research (September 2009) and Rosstat. 3 Based on Deutsche Bank Research (September 2009).
3
Lastly, high unemployment rates characterise several regions, especially the North Caucasus federal district. According to the World Bank, this district had an average unemployment rate of 16.9 per cent in 2010, more than twice as high as the country’s average. By contrast, the unemployment rate in the broader Moscow oblast in the same period was 3.3 per cent.4
The Russian government has put regional development at the core of its policy reform agenda. However, only mainly traditional policy instruments have been put in place to date. These are essentially in the form of financial support to underperforming regions, deploying targeted investment, purpose-oriented programmes and creating Special Economic Zones (SEZs). More broadly, in 2008, challenged by the global economic downturn, the Russian government adopted a long-term social and economic development plan, entitled “Russia 2020”. The plan includes a comprehensive set of competitiveness policies in the field of human capital and infrastructure development. In addition to addressing the diversification imperative, innovation was placed at the top of the agenda as a major public initiative in this area. From 2009 to 2010 several new bodies were founded, such as the Presidential Commission for Modernization and Technological Development, the high-tech segment on the Russian Stock Exchange or the launch of the Skolkovo Innovation Center initiative dedicated to innovation development. As a result, about 94 business incubators, 85 techno parks and 100 centres of technology transfers were created across Russia, including in St Petersburg, Zelenograd, Dubna and Tomsk and a more industry oriented SEZ in the Lipetsk region and the Republic of Tatarstan. In addition, legislative steps were taken to protect innovation, including adherence to OECD instruments, improved intellectual property legislation and tax incentives for companies involved in research and development (R&D) and patenting activities. However, the impact of these policies remains to be assessed at the regional level. Centralisation of funding allocation and the lack of private sector and university-led research and collaboration in the field of innovation remain key policy challenges. For example, to date, only about 20 per cent of performed R&D is delivered by higher education versus more than 55 per cent for most OECD countries. The private sector also only contributes to 60 per cent of total R&D spending, below China, which is approximately at 74 per cent.5 Beyond generic policy challenges, there is a need to identify innovation and capability gaps for each region to unlock their full potential.
The limitation of traditional horizontal approaches focusing solely on governance, institutional variables or the regulatory framework seem to have failed to address the major driver behind economic growth: knowledge.6 New and innovative approaches such as economic complexity have been put forward by Hausmann et al. (2011) to address this challenge, yet concrete implications remain to be developed further.7
4 World Bank (2011). 5 OECD (2011). 6 OECD (2011). 7 Hausmann et al. (2011). According to the authors’ calculations, the Economic Complexity Index accounts for 15.1 per cent of the variance in economic growth during the 1996-2008 period versus the World Governance Indicators combined, including government effectiveness, regulatory quality, rule of law, voice and accountability, political stability or control of corruption which only account for 1 per cent. ECI also has a 0.75 per cent correlation coefficient with GDP growth.

4
Box 1: Economic complexity: key generic definitions
Several concepts will be used throughout this article. Key generic definitions are provided below. For more details, please refer to the methodology annex.
Revealed comparative advantage (RCA). The revealed comparative advantage is an index used for calculating the relative advantage or disadvantage of a certain country or region in a certain class of goods or services as evidenced by trade flows.
Product space. The product space is a visualisation of world trade, expressed in terms of global exports, structured according to the similarity of capabilities required to produce products. There are a number of factors that can describe the relatedness between a pair of products: the amount of capital required for production, technological sophistication, or inputs and outputs in a product’s value chain. Choosing to study one of these notions assumes the others are relatively unimportant; instead, the product space – or economic complexity approach – considers an outcome-based measure built on the idea that if a pair of products are related because they require similar institutions, capital, infrastructure or technology, they are likely to be produced in tandem. Dissimilar goods, on the other hand, are less likely to be co-produced. This a posteriori test of similarity is called “proximity”.
It should be noted that a product space can be constructed at the global or regional level. At the global level, the Russian product space should contain 775 products. Ninety-two products (mainly, in the periphery) would be marked as Russian RCAs (mainly in the periphery). At the regional level, the product space contains 628 products and the number of regional RCAs varying from 1 (for example, Tyva Republic) to 368 (for example, Moscow region).
Diversity, Ubiquity, Regional Economic Complexity Index (ECI or RECI) and Product Complexity Index (PCI). A key principle behind the concept of economic complexity is to view the exports structure as an indicator of knowledge possessed by a country (ECI) or region (RECI). A region is considered to have a complex economy if it produces and exports many products which can be only produced and exported by few other regions. In this way two indicators are introduced at the outset of the analysis – diversity and ubiquity – which stand for the number of products exported by each region and the number of regions, which export each product respectively. These indicators are recursively corrected by one another until the process converges. As a result we obtain two interconnected sub-indices: the RECI and the Product Complexity Index (PCI). According to these indicators region r is considered to have a complex economic structure if it produces many complex products. Product p is complex if it is manufactured mainly by complex economies.
The economic complexity approach considers an outcome-based measure on the premise that if a pair of products is related because they require similar institutions, capital, infrastructure and technology, they are likely to be produced in tandem. More broadly, “the complexity of an economy is related to the multiplicity of useful knowledge embedded in it. For a complex society to exist, and to sustain itself, people who know about design, marketing, finance, technology, human resource management, operations and trade law must be able to interact and combine their knowledge to make products. These same products cannot be made in societies that are missing parts of this capability set. Economic complexity, therefore, is expressed in the composition of a country’s productive output and reflects the structures that emerge to hold and combine knowledge”.8 The Economic Complexity Index (ECI) explains 15 per cent of the contribution to the variance of economic growth across all countries over a period of 12 years. ECI also has a 0.75 correlation coefficient with GDP growth worldwide. Russia displays a similar sensitivity to economic complexity. Historically, the ECI of Russia was broadly stable until 2002, then dropped sharply
8 Hausmann et al. (2011).

fromand regaincr(Ch
Cha
Sou
Cha
SouNote
For prodsam
Theperf
9 Hau
m 2007, potcompetitio
arding manureasing its charts 1 and 2
art 1: ECI ind
rces: Hausm
art 2: Manufa
rces: Hausme: Index of 10
example, inducts, and b
me period Ru
ere are key qformance an
What is
Where
Which v
usmann et al.
tentially reflon from otheufacturing e
complexity a2).
dex for Russ
mann et al. (2
actured exp
mann et al. (200 = 1996.
n 2002 Chinbetween 200ussia decrea
questions thnd capabilit
s driving the
are the relev
value-chain
(2011).
lecting the ler countriesexports.9 In and exports
sia and Chin
2011), World
ports as per
2011), World
na had an R02 and 2010ased its num
hat need to bties of Russi
e declining
vant capabi
ns and produ
C
5
lack of imp. Almost thcomparison
s of manufac
na, 1991-200
Bank databa
cent of mer
Bank databa
RCA (reveal0 this numb
mber of RCA
be addressedia.
economic c
ility and inn
ucts could h
China
ort demande same dynn, an economcturing prod
08
ase and auth
rchandise ex
ase and auth
led comparaer increased
As from 129
d to improv
complexity p
novation gap
help improv
due to the famic can bemy like Chiducts over a
hors’ calculat
xports, 1996
hors’ calculat
ative advantd by 51 prod9 to 91.
ve tangibly t
pattern for R
ps at the reg
ve regional p
financial cre noted ina has beena similar per
tions.
6-2010
tions.
tage) in 312ducts. Over
the
Russia?
gional level?
performanc
risis
n riod
2 r the
?
e?

6
Which obstacles to doing business need to be addressed as a matter of priority to unlock the growth potential of regions?
Based on the concept of economic complexity, the authors developed an approach leveraging recent and comprehensive product export data, sectorial and territorial data including a combination of company and policy barriers surveys by sector, in addition to intellectual property and scientific publications trends. This approach uses a combination of three units of analysis: capabilities, value-chains and territories.
The analysis and maps provided in this paper aim at guiding policy-makers and investors towards identification and improvement of capability and innovation opportunities.
7
2. Identifying capability-based performance and potential
2.1. The Regional Capability Index: a tool to identify and rank regions based on their current and leveraged capabilities Which regions have the strongest and most leveraged capabilities? Addressing this question would help identify potential new policy responses that could accelerate economic development in Russia through a knowledge and capability based approach. In order to address this question, a set of sub-questions and related indicators were put forward leading to the development of the Regional Capability Index (RCI):
Dimension 1 – Existing capabilities: Does the region have the capabilities to export complex products today?
Dimension 2 – Leveraged capabilities: Is the region leveraging its capabilities in Russia? Is the region, relative to other regions, leveraging its capabilities globally?
In order to address the first dimension, the level of existing capabilities and productive knowledge of the region was quantified by measuring the level of complexity of the local economy. Capabilities are defined here as institutions, knowledge, capital, infrastructure and technology required to build and export products with a comparative advantage. The quantitative measure of capabilities is captured by the Regional Index of Economic Complexity (RECI) – See Box 1. For example, Lipetsk region, which has the highest contribution of processing sector to gross regional product (GRP) in Russia (44 per cent), has the third largest RECI in Russia (98). Two other leaders by RECI – Tula region and Samara region (RECI equal to 100 and 99 respectively) – are also in the first tier of the top processing regions in Russia (contribution of processing to GRP 30 per cent and 23 per cent respectively). Most “successful” Russian regions (like Moscow, Novosibirsk or Chelyabinsk) also have a high RECI score. On the other hand, at the bottom of the RECI ranking appear the least developed regions with low levels of industrial production and high levels of resource dependence, like Yamalo-Nenets autonomous region (RECI = 1, contribution of processing to GRP = 1 per cent, contribution of mining to GRP = 45 per cent), Khanty-Mansiysk Autonomous District (RECI = 1, contribution of processing to GRP = 3 per cent, contribution of mining to GRP = 63 per cent) or Ingushetia republic (RECI = 1, contribution of processing to GRP = 2 per cent).
In order to address the second dimension, both the Opportunity Value (OV) of Regions in Russia and their World Revealed Comparative Advantage (WRCA) were quantified.
The OV chart represents the current position of the region on the product space, capturing both the average proximity to all products, which are not currently exported by the region, and average complexity of these products. This indicator is a proxy of the economic performance of the region in the productive sense. The OV of a region will be high if it has many products to build upon to diversify its economy. It could do so by building strong positions in the most significant clusters of products with high complexity, in which the region does not have an RCA, but has productive knowledge required producing them. The latter also means that the region can easily start the production of many new products, represented in the product space of the country.
8
For example St Petersburg, Novosibirsk region, Moscow region – prosperous regions with diversified economies – have the highest OV in Russia (100, 94 and 94 respectively). On the contrary, in our dataset, the Tyva republic has the lowest OV of 1. The region is considered to be one of the regions in Russia with the lowest perspectives and with very high investment risks and a stagnating economy. Another example is the Tyumen region with an OV of 1 and a non-diversified economy.
The WRCA10 chart, based on the Ricardian concept of comparative advantage, represents the relative level of complexity and competitiveness of products exported by regions to other countries. The WRCA is proportional to the number of products with a high Product Complexity Index (above 0.5) in which Russia has an RCA internationally and the region in question has a high or intermediate RCA within Russia. Products with low complexity were not taken into consideration in order to exclude the export of natural resources from the analysis. A high WRCA chart thus represents regions that export relatively high numbers of complex products, which form Russia’s global export suite. In 2011 top WRCA regions were Moscow, Chelyabinsk, Novosibirsk and Nizhny Novgorod (13, 11, 10 and 10 products, respectively). At the bottom are the Chechen Republic, Sakha-Yakutia and other regions with no products with an RCA in the world. For the index, both dimensions – existing capabilities and leveraged capabilities – were weighted equally (50 per cent weight each) with OV and WRCA having equal weight within the second dimension (25 per cent each). Therefore the index is calculated as follows: RCI = (0.5 x RECI) + (0.25 x OV + 0.25 x WRCA)
10 For definitions see Box 1.
9
Table 1: RCI ranking
Source: Authors’ calculations.
Existing
capabilities
Does the region have the
capabilities to export
complex products today?
(100: High, 1: low)
Is the region leveraging
its capabilities in Russia?
(100: High, 1: Low)
Is the region, relative to
other regions, leveraging
its capabilities globally?
(100: High, 1: Low)
Tier Name EN Federal District CODE
Regional Economic
Complexi ty Index
(sca led)
Russ ian Opportunity
Value
(PCI from 0 to 1 ‐ Sca led)
World Revealed
Comparative Advantages
(Sca led)
RCI
(RECI+OV+WRCA) re‐
sca led
RCI Rank
Tier 1 Moscow obl. Central FD MOS 89 94 90 100 1
Tier 1 Sverdlovsk obl. Urals FD SVE 95 70 100 99 2
Tier 1 Chelyabinsk obl. Urals FD CHE 93 72 100 99 3
Tier 1 Novosibirsk obl. Siberia FD NVS 90 94 69 95 4
Tier 1 Tula obl. Central FD TUL 100 54 79 92 5
Tier 1 Nizhni Novgorod obl. Volga FD NIZ 94 74 64 90 6
Tier 1 Saint‐Petersburg North‐West FD SPB 86 100 48 88 7
Tier 1 Ryazan obl. Central FD RYA 98 65 58 88 8
Tier 1 Vladimir obl. Central FD VLA 94 80 37 84 9
Tier 1 Yaroslavl obl. Central FD YAR 92 88 32 84 10
Tier 1 Udmurtia Volga FD UDM 95 63 43 82 11
Tier 1 Moscow (city) Central FD MOW 85 92 32 81 12
Tier 1 Penza obl. Volga FD PNZ 97 63 32 80 13
Tier 1 Kaluga obl. Central FD KAL 94 72 27 79 14
Tier 1 Ulyanovsk obl. Volga FD ULY 96 61 32 79 15
Tier 1 Rostov obl. Southern FD ROS 84 67 48 78 16
Tier 1 Oryol obl. Central FD ORL 97 55 32 78 17
Tier 1 Samara obl. Volga FD SAM 99 46 37 78 18
Tier 1 Pskov obl. North‐West FD PSK 86 80 27 77 19
Tier 1 Buryatia Siberia FD BUR 82 93 22 77 20
Tier 1 Belgorod obl. Central FD BEL 89 49 48 76 21
Tier 2 Kursk obl. Central FD KUR 94 49 37 76 22
Tier 2 Voronezh obl. Central FD VOR 96 51 32 76 23
Tier 2 Altai (Republic of Altai) Siberia FD ALI 86 64 37 75 24
Tier 2 North Ossetia‐Alania North Caucasian FD NOR 86 68 32 75 25
Tier 2 Perm obl. Volga FD PER 95 44 37 75 26
Tier 2 Tver obl. Central FD TVE 91 76 11 74 27
Tier 2 Bryansk obl. Central FD BRY 89 60 32 74 28
Tier 2 Orenburg obl. Volga FD ORE 95 26 53 74 29
Tier 2 Kurgan obl. Urals FD KUG 94 44 32 73 30
Tier 2 Ivanovo obl. Central FD IVA 91 59 22 73 31
Tier 2 Saratov obl. Volga FD SAR 94 46 27 72 32
Tier 2 Krasnodar kray Southern FD KRA 78 64 32 70 33
Tier 2 Lipetsk obl. Central FD LIP 98 23 32 70 34
Tier 2 Volgograd obl. Southern FD VGG 92 40 27 69 35
Tier 2 Altai kray Siberia FD ALT 95 32 27 69 36
Tier 2 Kemerovo obl. Siberia FD KEM 93 18 43 68 37
Tier 2 Bashkortostan Volga FD BAS 93 28 32 68 38
Tier 2 Kostroma obl. Central FD KOS 91 47 17 67 39
Tier 2 Kaliningrad obl. North‐West FD KAG 73 84 11 66 40
Tier 2 Vologda obl. North‐West FD VLG 89 24 37 66 41
Tier 2 Tambov obl. Central FD TAM 95 33 17 66 42
Tier 3 Chuvashia Volga FD CHV 93 37 11 64 43
Tier 3 Mordovia Volga FD MOR 94 31 11 64 44
Tier 3 Marij El Volga FD MAR 92 40 6 64 45
Tier 3 Smolensk obl. Central FD SMO 82 45 22 64 46
Tier 3 Tomsk obl. Siberia FD TOM 88 41 11 63 47
Tier 3 Kirov obl. Volga FD KIR 78 52 22 63 48
Tier 3 Sakha (Yakutia), Republic oFar East FD SAH 96 25 11 63 49
Tier 3 Stavropol kray North Caucasian FD STA 78 53 17 62 50
Tier 3 Novgorod obl. North‐West FD NGR 87 29 17 61 51
Tier 3 Kabardino‐Balkaria North Caucasian FD KAB 88 31 11 60 52
Tier 3 Adygeya Southern FD ADY 91 22 11 60 53
Tier 3 Astrakhan obl. Southern FD AST 79 47 11 60 54
Tier 3 Tatarstan Volga FD TAT 89 32 6 60 55
Tier 3 Leningrad obl. North‐West FD LEN 79 45 11 59 56
Tier 3 Daghestan North Caucasian FD DAG 72 63 6 59 57
Tier 3 Krasnoyarsk kray Siberia FD КУА 83 21 17 56 58
Tier 3 Karachayevo‐Cherkessia North Caucasian FD KAO 79 37 6 55 59
Tier 3 Zabaikaliski krai Siberia FD ZAB 80 27 11 55 60
Tier 3 Kalmykia Southern FD KAI 86 18 1 53 61
Tier 3 Komi Republic North‐West FD KOM 83 12 1 49 62
Tier 4 Karelia North‐West FD KAR 71 30 6 49 63
Tier 4 Irkutsk obl. Siberia FD IRK 74 22 1 47 64
Tier 4 Arkhangelsck obl. North‐West FD ARK 65 31 6 46 65
Tier 4 Chechen Republic North Caucasian FD CHA 76 8 1 44 66Tier 4 Amur obl. Far East FD AMU 69 15 6 44 67
Tier 4 Murmansk obl. North‐West FD MUR 50 57 1 44 68
Tier 4 Sakhalin obl. Far East FD SAK 46 41 1 37 69
Tier 4 Chukotka aut. okr. Far East FD CHU 59 13 1 37 70
Tier 4 Primorie kray Far East FD PRI 42 45 1 36 71
Tier 4 Omsk obl. Siberia FD OMS 61 6 1 35 72
Tier 4 Jewish a.o. Far East FD JEW 52 12 1 32 73
Tier 4 Khabarovsk kray Far East FD KHA 32 16 1 22 74
Tier 4 Kamchatka obl. Far East FD KAM 8 14 1 9 75
Tier 4 Magadan obl. Far East FD MAG 1 14 1 5 76
Tier 4 Khakassia Siberia FD KHK 1 5 6 3 77
Tier 4 Ingushetia North Caucasian FD ING 1 4 6 3 78
Tier 4 Yamalo‐Nenets aut. okr. Urals FD YAN 1 2 6 3 79
Tier 4 Khanty‐Mansijsk aut. okr. Urals FD KHM 1 2 1 1 80
Tier 4 Tyumen obl. Urals FD TYU 1 1 1 1 81
Tier 4 Tuva (Tyva) Siberia FD TUV 1 1 1 1 82
Dimensions
Variables
(scale 1 to 100 with 1: Low, 100: High)
Which regions have the strongest and
most leveraged capabilities?
(100: High, 1: Low)
Regional Capability Index
ScoreLeveraged capabilities
Russia Regional Capability Index 2012
10
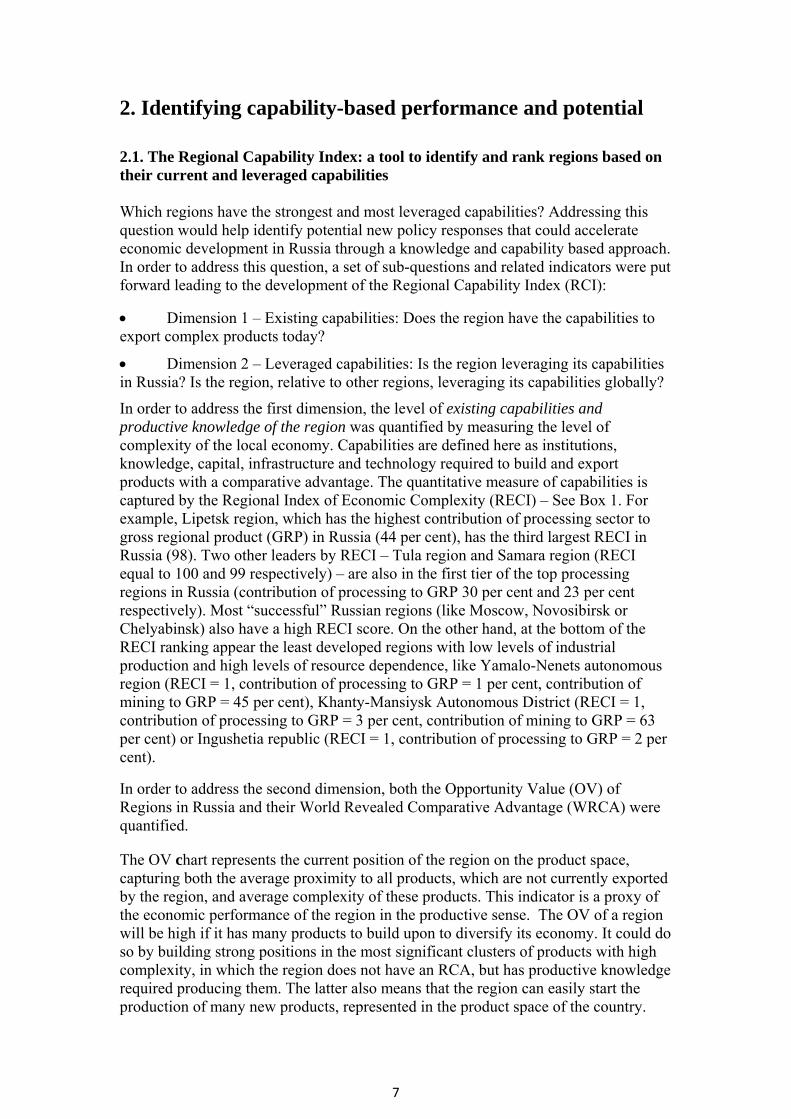
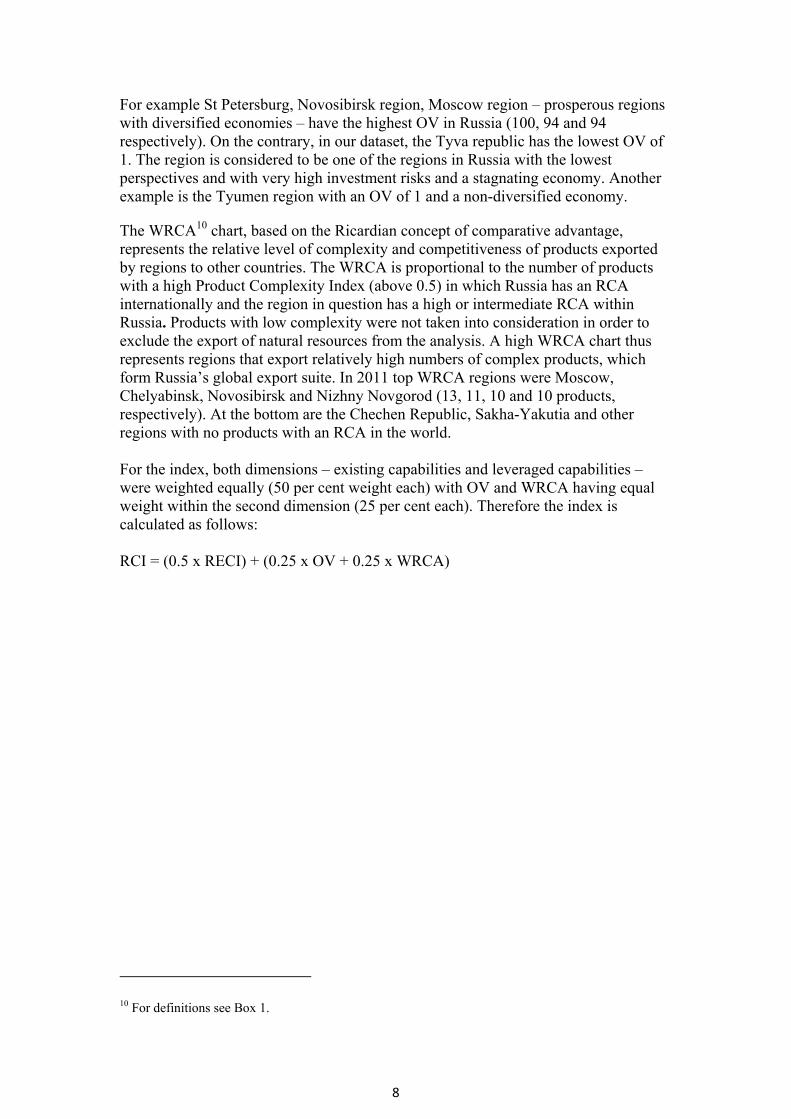
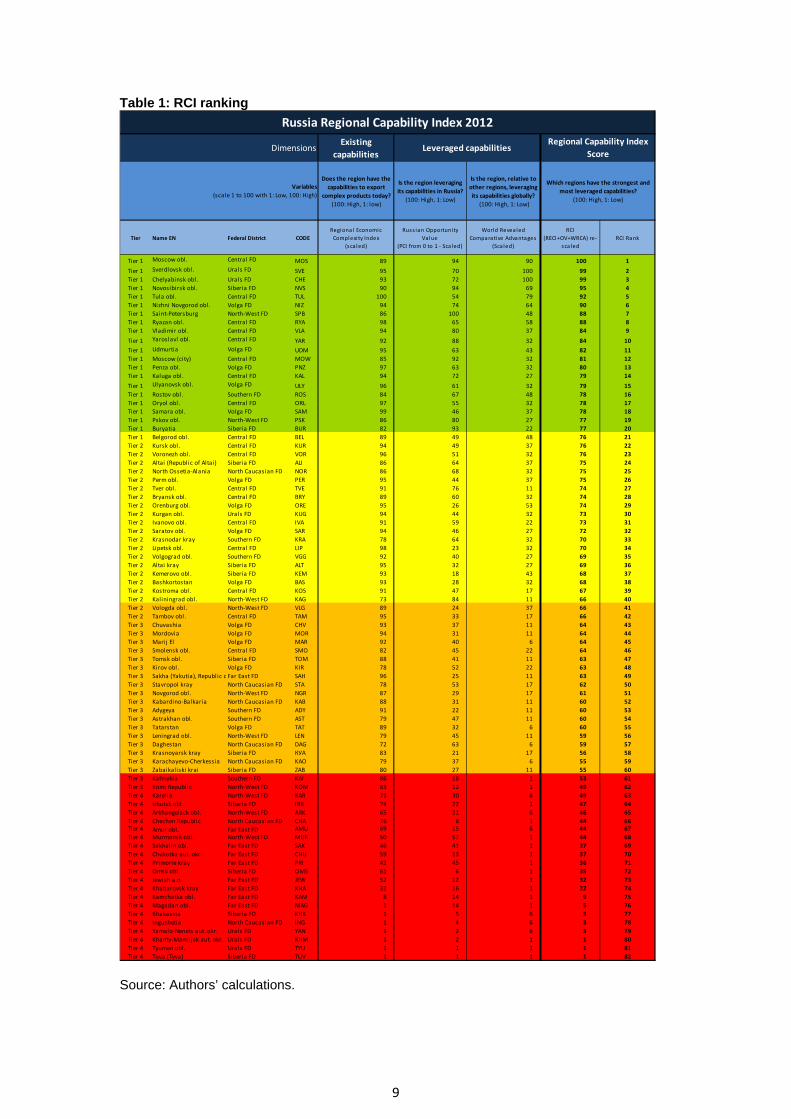
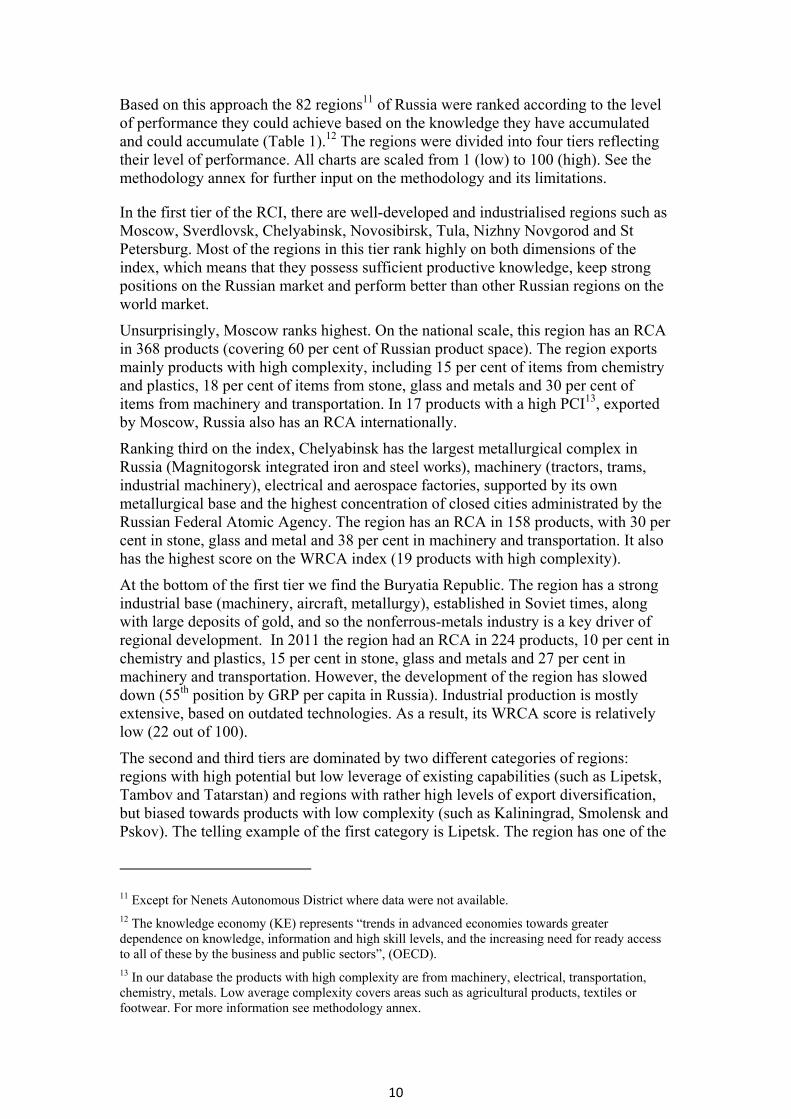
Based on this approach the 82 regions11 of Russia were ranked according to the level of performance they could achieve based on the knowledge they have accumulated and could accumulate (Table 1).12 The regions were divided into four tiers reflecting their level of performance. All charts are scaled from 1 (low) to 100 (high). See the methodology annex for further input on the methodology and its limitations.
In the first tier of the RCI, there are well-developed and industrialised regions such as Moscow, Sverdlovsk, Chelyabinsk, Novosibirsk, Tula, Nizhny Novgorod and St Petersburg. Most of the regions in this tier rank highly on both dimensions of the index, which means that they possess sufficient productive knowledge, keep strong positions on the Russian market and perform better than other Russian regions on the world market.
Unsurprisingly, Moscow ranks highest. On the national scale, this region has an RCA in 368 products (covering 60 per cent of Russian product space). The region exports mainly products with high complexity, including 15 per cent of items from chemistry and plastics, 18 per cent of items from stone, glass and metals and 30 per cent of items from machinery and transportation. In 17 products with a high PCI13, exported by Moscow, Russia also has an RCA internationally.
Ranking third on the index, Chelyabinsk has the largest metallurgical complex in Russia (Magnitogorsk integrated iron and steel works), machinery (tractors, trams, industrial machinery), electrical and aerospace factories, supported by its own metallurgical base and the highest concentration of closed cities administrated by the Russian Federal Atomic Agency. The region has an RCA in 158 products, with 30 per cent in stone, glass and metal and 38 per cent in machinery and transportation. It also has the highest score on the WRCA index (19 products with high complexity).
At the bottom of the first tier we find the Buryatia Republic. The region has a strong industrial base (machinery, aircraft, metallurgy), established in Soviet times, along with large deposits of gold, and so the nonferrous-metals industry is a key driver of regional development. In 2011 the region had an RCA in 224 products, 10 per cent in chemistry and plastics, 15 per cent in stone, glass and metals and 27 per cent in machinery and transportation. However, the development of the region has slowed down (55th position by GRP per capita in Russia). Industrial production is mostly extensive, based on outdated technologies. As a result, its WRCA score is relatively low (22 out of 100).
The second and third tiers are dominated by two different categories of regions: regions with high potential but low leverage of existing capabilities (such as Lipetsk, Tambov and Tatarstan) and regions with rather high levels of export diversification, but biased towards products with low complexity (such as Kaliningrad, Smolensk and Pskov). The telling example of the first category is Lipetsk. The region has one of the
11 Except for Nenets Autonomous District where data were not available. 12 The knowledge economy (KE) represents “trends in advanced economies towards greater dependence on knowledge, information and high skill levels, and the increasing need for ready access to all of these by the business and public sectors”, (OECD). 13 In our database the products with high complexity are from machinery, electrical, transportation, chemistry, metals. Low average complexity covers areas such as agricultural products, textiles or footwear. For more information see methodology annex.
11
highest levels of industrial production in Russia (highest contribution of processing sector to GRP). It is the major producer of refrigerators and freezers in Russia, and one of the major producers of steel and rolled metal. Since 2005, Lipetsk has been home to one of Russia’s four special industrial zones. The Lipetsk Industrial Zone focuses on finished metal products, machinery and equipment, vehicles, machines and components, construction materials. However, with quite a strong potential and accumulated productive knowledge Lipetsk has an RCA in only 39 products. As a result, its position on the product space is not very favourable despite a strong level of economic complexity (RECI = 98, 3rd in Russia, and OV = 23, 63rd in Russia).
Kaliningrad region is typical of the second category. Considered to be one of Russia’s best performing regional economies, Kaliningrad is bolstered by a low manufacturing tax rate, as set by its SEZ status. The region had experienced 7 per cent of real GRP growth at basic prices between 2002 and 2010 (4 per cent is a median for Russia). However, it also has a low rate of innovation activities (Innovation index = 18.514 out of 100). On the product space, the region has a rather high level of export of “complex” industrial production (10 per cent of chemicals and plastics, 25 per cent of machinery and transportation) but these products are outweighed by a high proportion of rather “simple products” (13 per cent agricultural products and foodstuffs, 32 per cent of wood products, textiles and clothes), so the average complexity of Kaliningrad’s export suite is below the Russian average. As a result, the economic complexity of the region is estimated to be below the average for Russia (73, with 87 as the median for Russia). However, the OV of the region is high, because it already has strong positions in the key clusters of industrial products (OV is 84, where 44 is the median for Russia).
The fourth tier includes mainly regions that are lagging behind on both dimensions of the RCI. These regions have a low level of accumulated productive knowledge (as reflected by their level of economic complexity), a poor position on the Russian product space and low potential to grow given their current export suite (low level of leveraged capabilities). We find in this category of regions mainly oil-based and resource-dependent regions, such as Tyva, Tyumen region, Khanty-Mansiysk Autonomous District and Yamalo-Nenets Autonomous District.
For example, Khanty-Mansiysk Autonomous District is underperforming on all three sub-indices (RECI = 1, WRCA = 1, OV = 2). Sixty-three per cent of its GRP is provided by oil and gas incomes, and contribution of processing to GRP is only 3 per cent. The region has only three RCAs in Russia and no WRCAs. In order to further develop the region, diversification is key.
However, in this fourth tier there are also some regions, which perform well on one sub-index of RCI. These regions are the first candidates to move up in the ranking to the next tier. For example, Murmansk region has RECI of 50 (below median), WRCA of 1 and is the 81st in Russia by the rate of GRP growth. However, it has an OV equal to 57 (above median). Murmansk (administrative centre of the region) is one of the largest ports in Russia and the largest city in the world beyond the Arctic Circle. The region has a rather “simple” export suite (60 per cent, comprising agricultural products, wood products and textiles), but also possesses technologies to produce
14 For the information about index calculation see the methodology annex.
macroom
Fromin thdevreladropAs wChehav
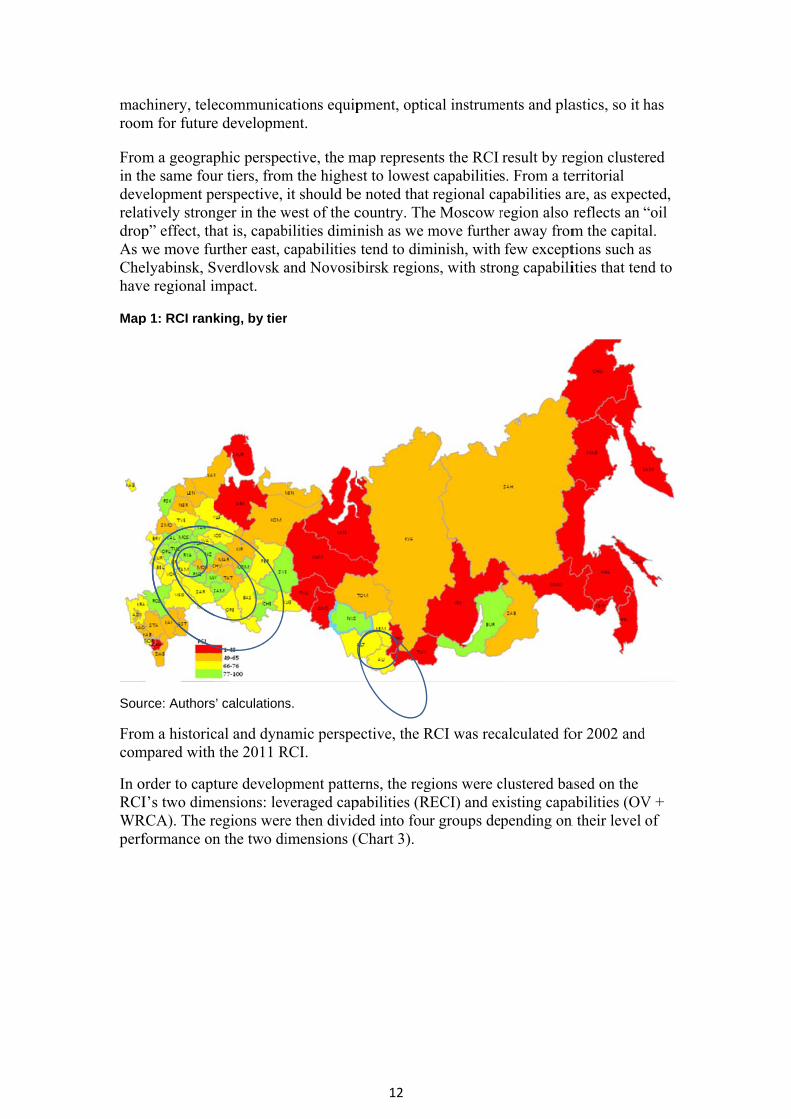
Map
Sou
Fromcom
In oRCIWRperf
chinery, telem for future
m a geographe same fouelopment p
atively stronp” effect, thwe move fuelyabinsk, Se regional i
p 1: RCI rank
rce: Authors
m a historicmpared with
order to captI’s two dim
RCA). The rformance on
ecommunice developme
phic perspeur tiers, fromerspective,
nger in the what is, capaburther east, cSverdlovsk ampact.
king, by tier
s’ calculations
cal and dynah the 2011 R
ture developmensions: levregions weren the two di
ations equipent.
ctive, the mm the highesit should be
west of the cbilities dimincapabilities and Novosib
r
s.
amic perspeRCI.
pment patteveraged cape then dividimensions (
12
pment, optic
map represenst to loweste noted that country. Thnish as we mtend to dimbirsk region
ective, the R
erns, the regpabilities (Rded into fou(Chart 3).
cal instrume
nts the RCI t capabilitieregional cae Moscow rmove furthe
minish, withns, with stro
RCI was rec
gions were cRECI) and exur groups de
ents and pla
result by res. From a teapabilities aregion also er away fromfew except
ong capabili
calculated fo
clustered baxisting capapending on
astics, so it h
egion clusteerritorial are, as expecreflects an m the capitations such aities that ten
or 2002 and
ased on the abilities (OVn their level
has
ered
cted, “oil al. as nd to
d
V + of
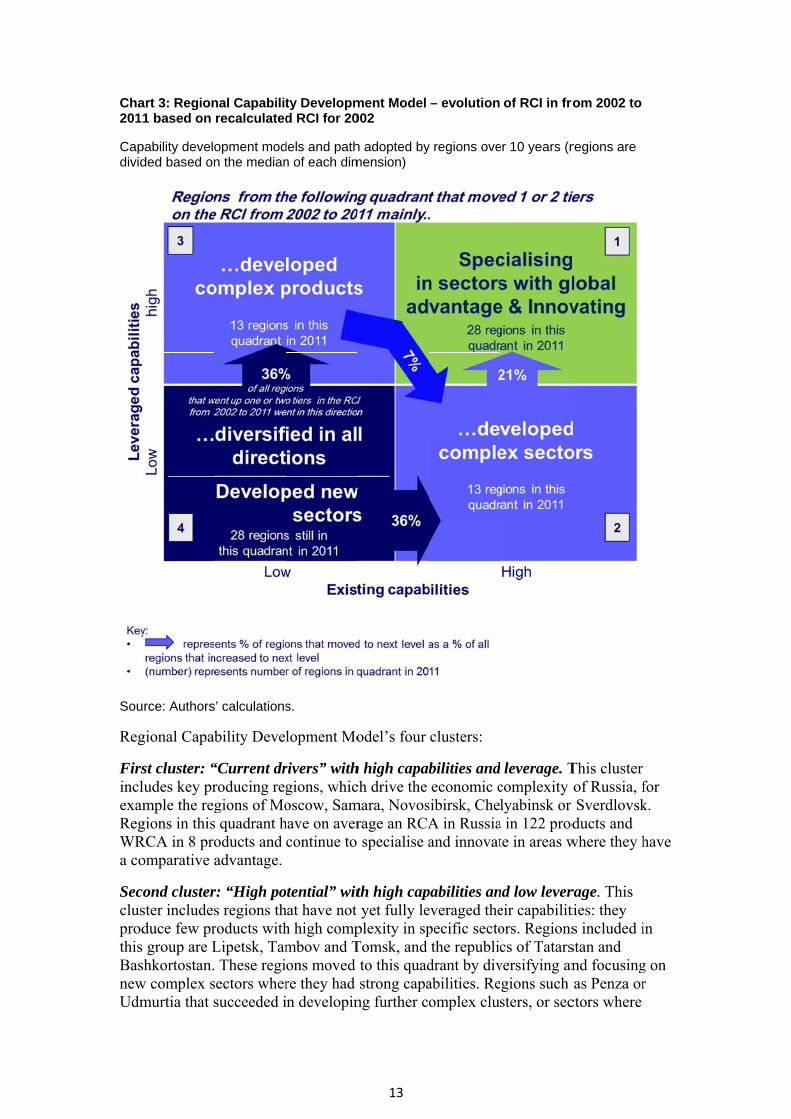
Cha2011
Capdivid
Sou
Reg
FirsinclexamRegWRa co
Secclusprodthis BasnewUdm
art 3: Region1 based on
pability develoded based on
rce: Authors
gional Capab
st cluster: “ludes key prmple the reg
gions in thisRCA in 8 proomparative a
ond clusterster includesduce few prgroup are L
shkortostan.w complex smurtia that s
nal Capabilitrecalculated
opment modn the median
s’ calculations
bility Devel
“Current drroducing reggions of Mo
s quadrant hoducts and advantage.
r: “High pos regions throducts withLipetsk, Tam These regi
sectors whersucceeded i
ty Developmd RCI for 20
dels and pathn of each dim
s.
lopment Mo
rivers” withgions, whicoscow, Sam
have on avercontinue to
otential” withat have noth high compmbov and Tons moved re they had in developin
13
ment Model 002
h adopted bymension)
odel’s four
h high capabch drive the mara, Novosrage an RCA specialise a
th high capyet fully le
plexity in spTomsk, and
to this quadstrong capa
ng further co
– evolution
y regions ove
clusters:
bilities andeconomic c
sibirsk, CheA in Russiaand innovat
pabilities aneveraged thepecific sectothe republic
drant by divabilities. Reomplex clus
of RCI in fro
er 10 years (r
d leverage. Tcomplexity lyabinsk or
a in 122 prodte in areas w
nd low levereir capabilitors. Regionscs of Tatars
versifying angions such sters, or sec
rom 2002 to
regions are
This cluster of Russia, fSverdlovsk
ducts and where they h
rage. This ties: they s included istan and nd focusingas Penza or
ctors where
for k.
have
in
g on r
14
they had strong capabilities, moved to the upper right quadrant. On average, regions in this quadrant have an RCA in 58 products and WRCA in 3 products.
Third cluster: “Unsustained growers” with low capabilities and high leverage. This cluster includes regions that diversified their economies but have either no or limited complex products in their export suite.15 The cluster includes, for example, Smolensk, Kaliningrad, Pskov and Krasnodar. Most regions in this cluster do not have a strong industrial base. They leveraged, for example, their favourable geographical locations (proximity to Europe, trade routes) and support from the state to diversify their economy. Only a few, such as Mariy-El republic and Vologda region, managed to build above average capabilities thus moving to the second quadrant. They did so by leveraging existing product areas were they had an advantage. None moved directly to the first quadrant from 2002 to 2012. Regions in this cluster on average have RCA in a higher number of products (158) than regions in the first cluster but the competitiveness on the world market is lower (on average, they have WRCA in five products).
Fourth cluster: “laggers regions” with low capabilities and leverage. This cluster includes mainly Russia’s Far East and North Caucasus regions, which are characterised by a limited industrial base and structural challenges. Two types of regions are included in this quadrant.
Resource-dependent regions such as Chukotsky Autonomous District (gold, tin, coal, tungsten, mercury and mining – 45 per cent of GRP); Tyumen region (where oil and gas account for 86.4 per cent of all industrial production and mining accounts for 50 per cent of GRP); Khanty-Mansiysk Autonomous District (oil and gas account for 89.4 per cent of all industrial production and mining 63 per cent of GRP); and Yamalo-Nenets Autonomous District (oil, gas and mining account for 48 per cent of GRP).
Regions with the lowest level of development such as the Chechen Republic, which has an economic infrastructure affected by the war in the 1990s and which is ranked 74th in Russia by GRP in basic prices in 2010 despite subsidies from the federal budget. It also includes the Ingushetia republic which is mainly an agricultural region ranked 83rd in Russia by GRP in basic prices in 2010 with subsidies from the federal budget). Kamchatka region is also in this quadrant. The region is driven by fishing as well as gold, coal, mercury and silver deposits (mining accounts for 4 per cent of GRP). The region is ranked 66th in Russia by GRP in basic prices in 2010. Finally, Tyva Republic is another telling example. The region is rich in non-ferrous metals, coal, iron ore, gold, mercury and processing but still ranks 66th in Russia by GRP in basic prices in 2010.
Resource-dependent regions that moved to the second quadrant did so by developing new sectors. Least developed regions that moved to the third quadrant did so by diversifying in any product, both simple and complex. A sound and tailored industrial policy may be necessary for both groups in this cluster. In 2011 they on average had RCA in 38 products within Russia and WRCA in 1 product.
15 Services and financial services are not included in this product-based analysis.

15
Based on the 2002 and 2011 time series analysis, a pattern seems to emerge where regions move from quadrant 4 to 3 to 2 to 1 (long path) or directly from 4 to 2 to 1 (short path).
The long path (4-3-2-1): Regions such as Krasnodar, Dagestan or Mariy-El Republic took this path. Moving from cluster 4 to cluster 3 can be illustrated by the case of Dagestan. This economically challenged region from the North Caucasus improved its performance significantly thanks to federal subsidies. More than 10 federal target programmes were implemented successfully in the region. Real GRP of Dagestan in basic prices had increased by more than 200 per cent from 2002 to 2010, employment has risen by 35 per cent, and the number of RCAs increased from 46 to 122. Over the last decades regional policy was aimed mainly at creating jobs and establishing an industrial infrastructure. In 2011 Dagestan had a diversified economy: its export structure consists of agriculture (17 per cent), foodstuffs (19 per cent), chemicals and plastics (15 per cent), textiles and footwear (16 per cent), glass and metals (7 per cent), and machinery and transportation (21 per cent).16 As a strategic priority, the region should now focus on developing complex products, most probably in machinery and transportation, in order to move to the second quadrant.
Supporting this perspective, Mariy El Republic moved successfully from quadrant 3 to 2 by focusing on the development of complex products. The region had 67 RCAs in 2002. In 2011 this number was almost the same (70), but the structure of production has changed. The region is moving away from wood and textile product clusters, which declined from 24 per cent to 13 per cent in the export suite of the region, and is developing its capabilities in the metals sector (increase from 5 per cent to 23 per cent) and further improving its positions in the machinery sector (increase from 27 per cent to 33 per cent). Machinery and metal-working are now the two main industries of the region and processing accounts for 28 per cent of GRP. The region’s GRP is still low (71st in Russia) but the focus on developing new complex sectors places it in a position to eventually move to the first quadrant.
The short path (4-2-1): Regions such as Tatarstan, Udmurtia, Penza, Ryazan, Lipetsk or Sakha-Yakutia took this path. An example of moving directly from cluster 4 to cluster 2 is Sakha-Yakutia. This is the largest region in Russia and the eighth largest territory in the world (just a bit smaller than India) with the richest uranium and coal deposits in Russia, very rich in diamond and gold, but with a population of less than 1 million (81st in Russia by population density). The region had RCA in 4 products in 2002 and in 35 products in 2011. Diversification in the region went straight to the direction of high complexity products in nascent sectors (74 per cent of RCAs in 2011 – in machinery and transportation). However, the capabilities in the region are not leveraged and its position on the product space is weak (OV = 25, WRCA in 11 products). So there is still a large gap separating this region from the first cluster and it, probably, should pay much more attention to developing industrial infrastructure and human capital.
A successful example of moving from the second to the first cluster is Penza region. Now Penza region is an important industrialised region with a developed heavy
16 Percentages are given not by the absolute values of export, but by the number of products exported with RCA from each category.
16
industry, with about 15,000 enterprises, 700 owned by the state. Over the period 2002-2011 the region leveraged its capabilities in two directions:
it improved the complexity of the metallurgy cluster (17 per cent of export suite in 2011 versus 11 per cent in 2002) while keeping its positions in machinery and transportation and chemistry and plastics sectors
it specialised in the existing capability-intensive products in strong sectors and therefore improved its position on the global market: WRCA rose from 1 in 2002 to 32 in 2011. For example, the region produces unique medical and chemical equipment for export.
Regions in cluster two should focus on developing much further the complexity of existing sectors to move to quadrant one. Regions in the first quadrant need to continue specialising in areas with a global advantage. They also need to innovate to keep their position.
Indeed, some regions have also fallen from the top quadrant. For example, regions such as Astrakhan, Omsk and Irkutsk fell in the RCI ranking from 2002 to 2011. This decrease in the ranking is probably due to resource dependence of their economies and regional policy failures – or simply for not having any strategy at all.
Chart 3 also highlights that there is a strong correlation between two dimensions of the index: about 70 per cent of the regions were either in the fourth (low-low) or first (high-high) quadrant in 2011 (75 per cent in 2002). The correlation between these two indicators was 0.59 in 2011 and 0.61 in 2011. So regions in quadrants 2 and 3 are rather like “transition” regions that are either on their way up or down or structurally “trapped” without policy support.
This is the case of the Lipetsk region – which has a significant productive potential that is, a high RECI, but low leverage of existing capabilities. In addition, despite new policies such as the establishment of a Special Industrial Zone, the region did not improve its RCI over the past 10 years: its RCI is exactly the same as in 2002 and the number of products with RCAs increased by only 1 (from 38 to 39). Therefore, improving the OV of Lipetsk, together with WRCA, is the key challenge for the policy-makers to address.
2.2. Unlocking the potential of under-performing regions: which areas matter most?
In order to identify potential policy levers and areas to improve that have impact, regions’ capabilities were compared with their actual economic performance. Performance is defined here as the combination of GRP real growth in basic prices over 10 years and innovation activities (Box 1). Innovation is defined as including both tangible and intangible drivers, that is input to education, research and development, and innovation activities (see annex). The quantitative measure of capabilities is captured by the Regional Capability Index. The different sub-indices were disaggregated even further focusing on different areas of performance and capabilities. Which areas to focus on first, innovation or typical economic performance levers?
BasregiNovsuchundundInde
HoweconRusFrawithregithe diveKalin th
Cha
SouNote
17 Htend regiouppe
sed on Chartions like thevosibirsk reh as Lipetsk
derperforms derperforminex.
wever, the snomic compssian regionamework (Chhin Russia iions with dileast develoersified econiningrad reghe lower rig
art 4: Region
rces: Rosstae: Data are fr
However, otheto concentra
ons with higher part of the c
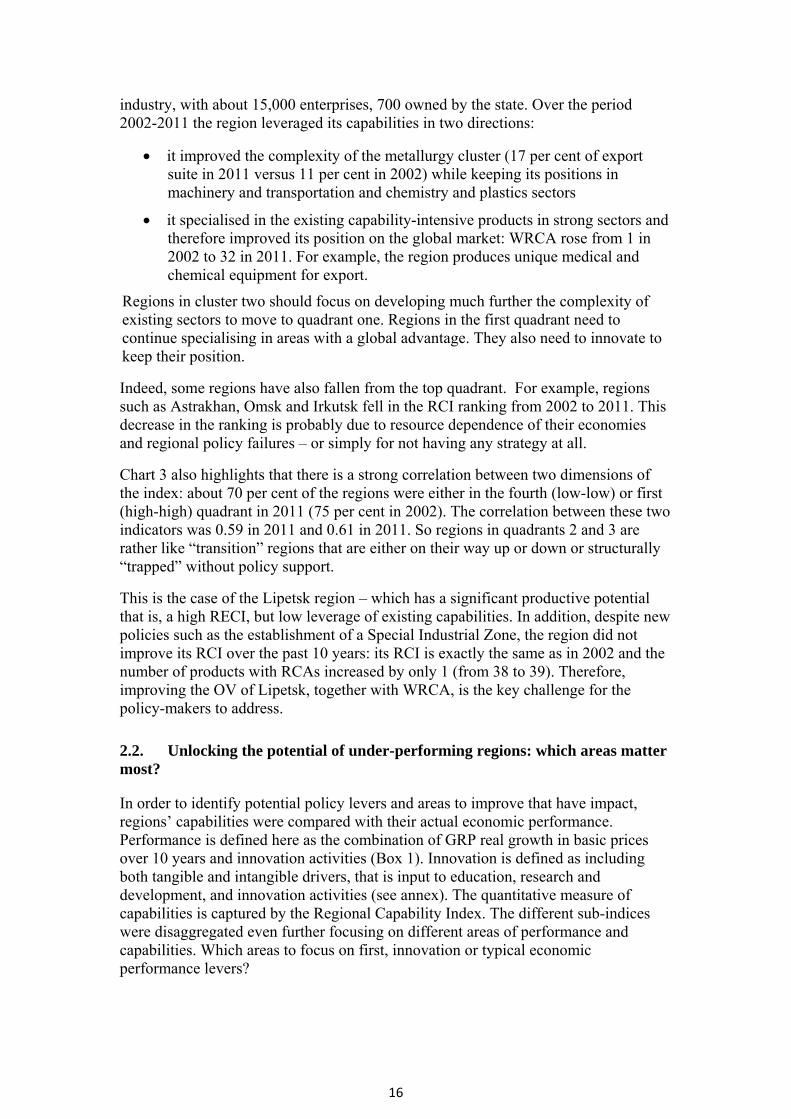
t 4, these ine cities of Mgion, which
k is above min terms of
ng compare
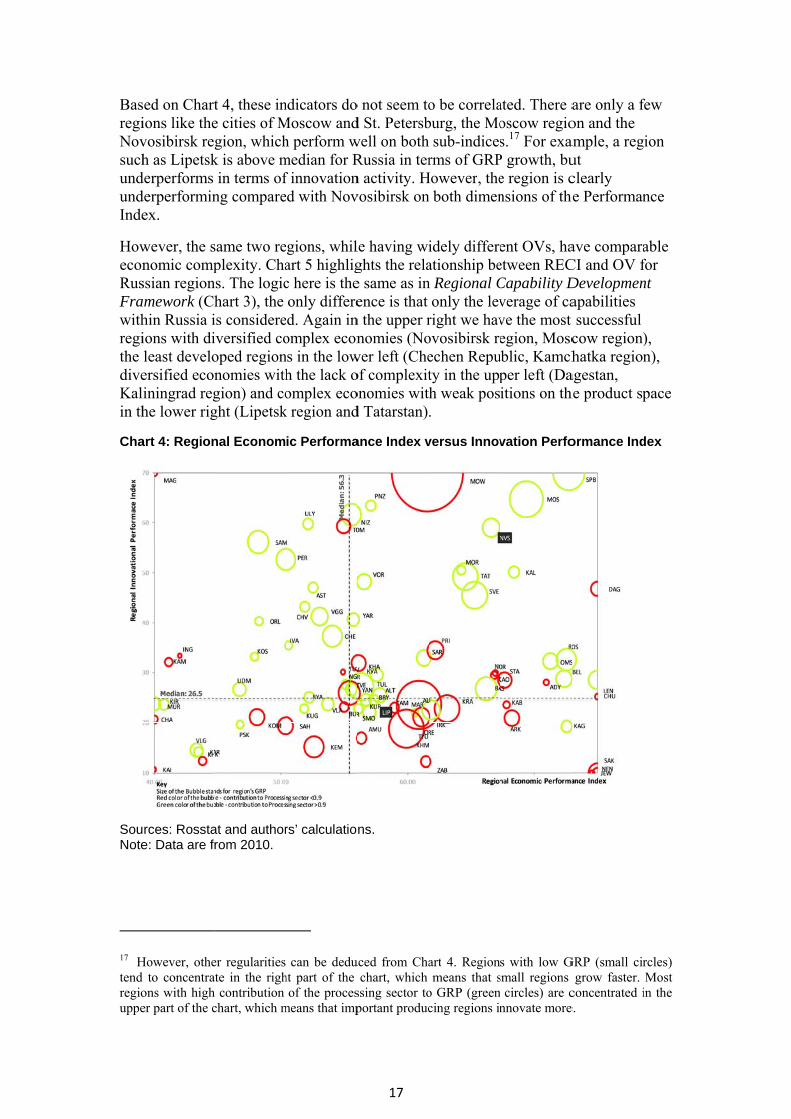
same two replexity. Cha
ns. The logichart 3), the is considereiversified cooped regionnomies withgion) and coght (Lipetsk
nal Econom
at and authorrom 2010.
er regularities ate in the righh contribution chart, which m
ndicators do Moscow andh perform wmedian for Rf innovationed with Nov
egions, whilart 5 highligc here is theonly differe
ed. Again inomplex econns in the lowh the lack oomplex eco
k region and
ic Performa
rs’ calculatio
can be deduht part of the
of the procesmeans that imp
17
o not seem tod St. Petersbwell on bothRussia in tern activity. Hvosibirsk on
le having wights the relae same as inence is that
n the upper rnomies (No
wer left (Cheof complexitonomies witd Tatarstan)
ance Index v
ns.
uced from Chachart, which
ssing sector toportant produc
o be correlaburg, the Mo
sub-indicesrms of GRP
However, then both dimen
idely differeationship ben Regional C
only the levright we havovosibirsk reechen Reputy in the upph weak pos.
versus Innov
art 4. Regionmeans that s
o GRP (greencing regions in
ated. There aoscow regios.17 For exa
P growth, bue region is cnsions of the
ent OVs, haetween RECCapability Dverage of cave the most egion, Mosc
ublic, Kamchper left (Daitions on th
vation Perfo
s with low Gsmall regions
circles) are cnnovate more
are only a fon and the ample, a regut clearly
he Performan
ave comparaCI and OV fDevelopmenapabilities successful
cow region)hatka region
agestan, he product sp
ormance Ind
GRP (small cirgrow faster.
concentrated ie.
few
gion
nce
able for nt
), n),
pace
dex
rcles) Most
in the
Cha
SouNote
Regwhofurthprod
MapRusand oppcoalof dOreindu
art 5: Region
rces: Federae: Data are fr
gions in the ose productiher exports ducts not cu
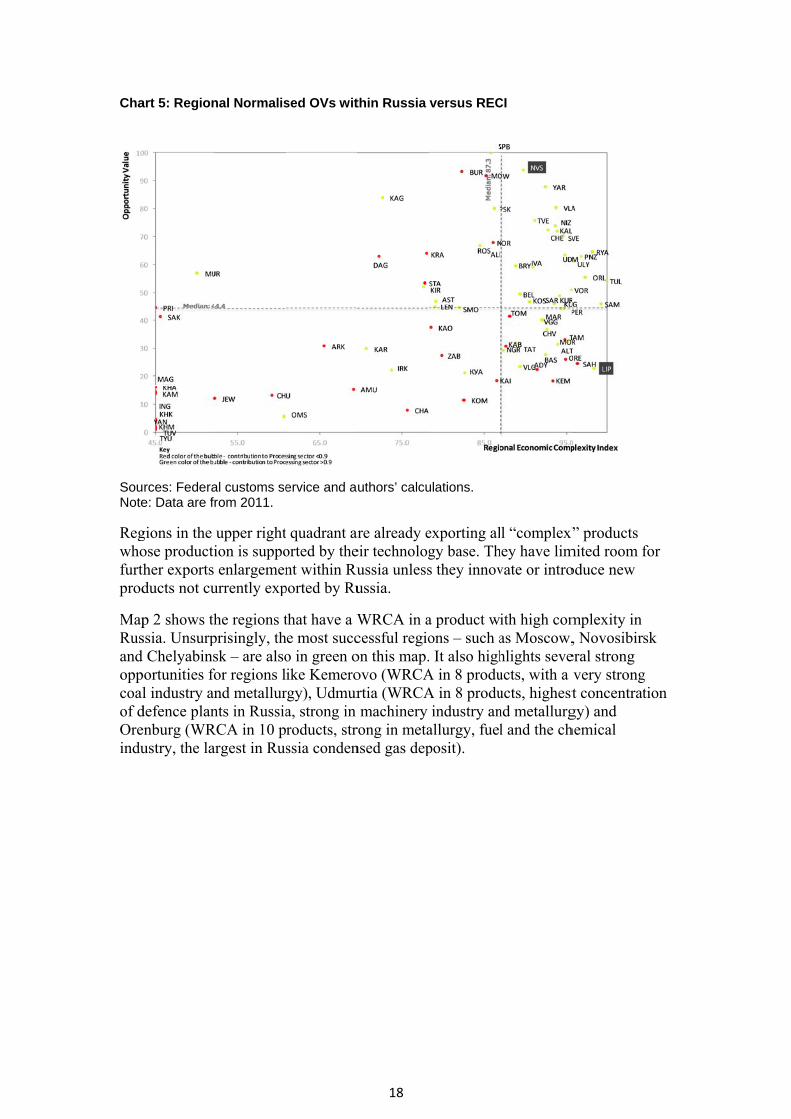
p 2 shows thssia. Unsurp
Chelyabinsportunities fol industry an
defence planenburg (WRustry, the la
nal Normalis
al customs serom 2011.
upper rightion is suppoenlargemen
urrently exp
he regions tprisingly, thsk – are also
for regions lnd metallurnts in Russia
RCA in 10 pargest in Rus
sed OVs wit
ervice and a
t quadrant arorted by thent within Ru
ported by Ru
that have a Whe most succo in green oike Kemero
rgy), Udmura, strong in roducts, strssia conden
18
thin Russia
uthors’ calcu
are already eeir technologussia unlessussia.
WRCA in acessful regioon this map.ovo (WRCArtia (WRCAmachinery
rong in metansed gas dep
versus REC
ulations.
exporting algy base. Ths they innov
a product wons – such a It also high
A in 8 produA in 8 produ
industry anallurgy, fuelposit).
CI
l “complex”hey have limvate or intro
ith high comas Moscow,hlights seveucts, with a ucts, highestnd metallurgl and the ch
” products mited room foduce new
mplexity in , Novosibir
eral strong very strongt concentratgy) and hemical
for
sk
g tion
19
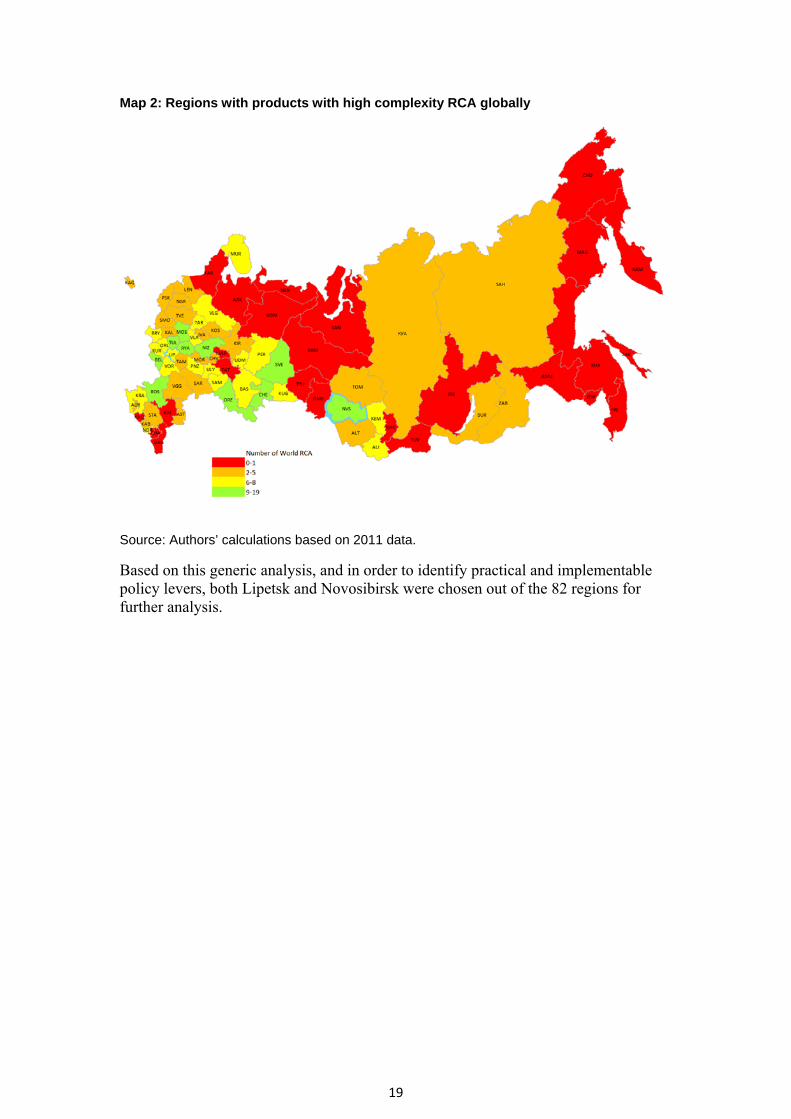
Map 2: Regions with products with high complexity RCA globally
Source: Authors’ calculations based on 2011 data.
Based on this generic analysis, and in order to identify practical and implementable policy levers, both Lipetsk and Novosibirsk were chosen out of the 82 regions for further analysis.
3. A
3.1.
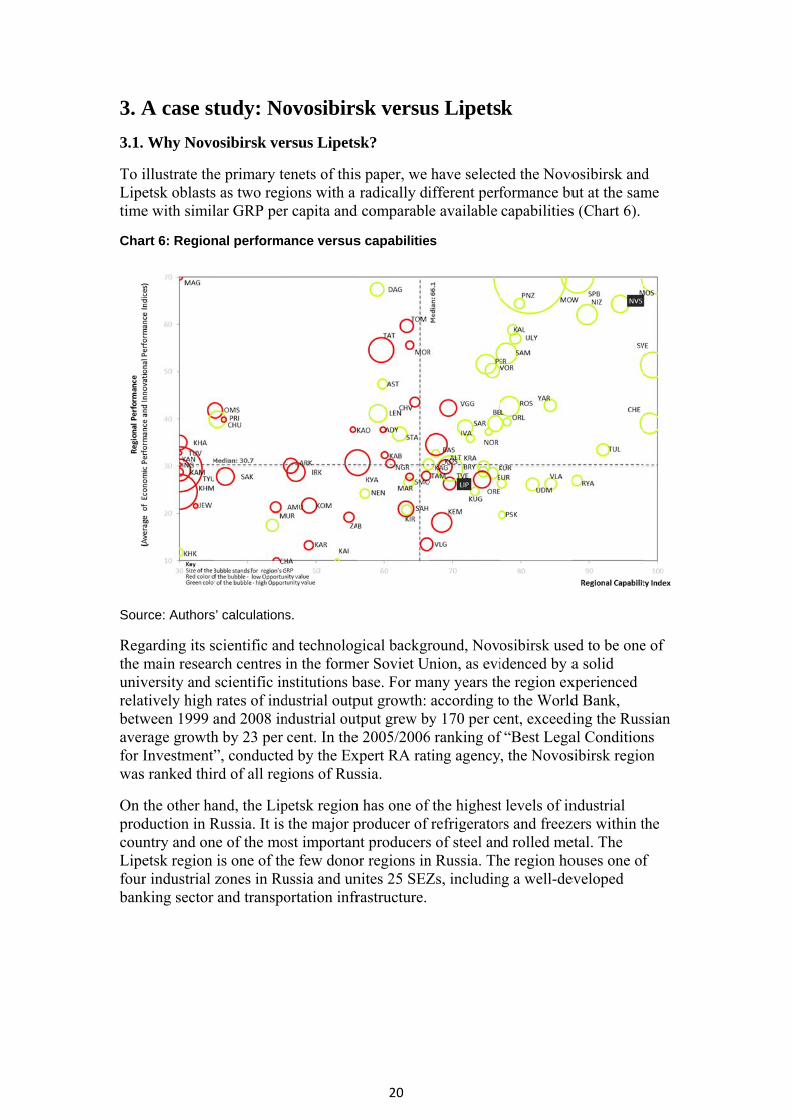
To iLipetime
Cha
Sou
Regthe univrelabetwaverfor Iwas
On prodcounLipefourbank
A case st
. Why Novo
illustrate theetsk oblastse with simil
art 6: Region
rce: Authors
garding its smain researversity and atively high ween 1999 arage growthInvestment”
s ranked thir
the other haduction in Rntry and onetsk region r industrial king sector
tudy: No
osibirsk ver
e primary tes as two regilar GRP per
nal performa
s’ calculations
scientific anrch centres iscientific inrates of indand 2008 inh by 23 per ”, conducterd of all reg
and, the LipRussia. It is ne of the mo
is one of thzones in Ruand transpo
ovosibirs
rsus Lipets
enets of thisions with a r capita and
ance versus
s.
nd technologin the formenstitutions bdustrial outpndustrial outcent. In thed by the Ex
gions of Rus
petsk regionthe major p
ost importanhe few donoussia and unortation infr
20
sk versu
sk?
s paper, we radically di
d comparabl
s capabilitie
gical backgrer Soviet U
base. For maput growth: tput grew b
e 2005/2006xpert RA ratssia.
n has one of producer of nt producersor regions innites 25 SEZrastructure.
us Lipets
have selectifferent perfe available
es
round, Novonion, as eviany years thaccording ty 170 per c
6 ranking ofting agency
f the highestrefrigerator
s of steel ann Russia. ThZs, includin
k
ted the Novoformance bucapabilities
osibirsk useidenced by ahe region exto the Worldent, exceedi
f “Best Lega, the Novos
t levels of inrs and freezd rolled me
he region hong a well-de
osibirsk andut at the sams (Chart 6).
ed to be onea solid
xperienced d Bank,
ding the Rusal Conditionsibirsk regio
ndustrial zers within tetal. The ouses one ofeveloped
d me
e of
ssian ns on
the
f

Cha
Sou
Sevhavstro90, whileveGRPthe averservcomeconperfiden
NovwhipoodivebaskpoteRusranklinkfaci
SS
ScaleContRECI OppoNumRCI sPopuGRP,
art 7: Key ind
rces: Rossta
veral criteriae a RECI hi
ong future ecwhile Lipet
ich reaches el in RussiaP comparedprocessing rage, was chvices sector mparable in nomic strucform substantify and ex
vosibirsk reile Lipetsk ror performanersity. Low ket on the oentially impssia (after thked 63rd anks in its econilitating eco
Scaled Economic pScaled Innovation ed average performribution to the proscaled (100: high, ortunity value scalber of complex prcaled (100: high, 0ulation, persons RUR mn
dicators for
at, Federal C
a, as outlineigher than tconomic petsk, with a f98, that is, b. Second, bo
d with othersector in Ruhosen due tdevelopmesize – they
cture to ensuantially diffexplain differ
gion appearregion is thence of the LOVs on the
other show tprove its perhe Moscow nd still has rnomic struc
onomic grow
performance indexperformance indemance index (100: ocessing sector0: low)ed (100: high, 0: looducts with RCA0: low)
r the selecte
ustoms Serv
d in Chart 7he Russian
erformance.far poorer pboth regionoth regions r regions. Liussia. Novoo its develo
ent. Moreovare relativeure the comerently. Thirences in pe
rs to be the e 20th worst
Lipetsk regioe one hand athat filling trformance. Nregion), meoom for imp
cture or “miwth perform
(100: high, 0: lowx (100: high, 0: lowhigh, 0: low)
ow)
21
ed regions
vice, authors
7, were usedaverage, wThe Novos
performancens are in the
have a highipetsk has inosibirsk, eveoped scientiver, these regely large and
mparability os compariso
erformance u
seventh best economic on could beand the highthe gaps in pNovosibirskeaning that i
mprovement ssing produ
mance.
Indicator/)w)
2
1 172 254
s’ calculations
d for this sehich would
sibirsk regioe as demons
top 30 per h share of thncidentally en though bfic and innogions couldd have similof the regionon of regionusing a capa
st economicperforming
e explained bh complexitproduction (k region hasit fulfils itsthrough the
ucts” in spec
/Index Rank of57 4122 6426 64
2.47 198 323 636 2070 34026 51738 45
s.
lection. Firs, in principl
on has a scatrated abovcent of highhe processinthe highest eing slightl
ovation based also be conlar GRP perns. Howevens was thereability-base
cally performg region in Rby its low pty of its exis(missing pros the secondpotential, w
e developmecific sectors
f 83 Indicator144133041 2 665 48
st, both regle, support a
aled RECI ove, has an REhest compleng sector oft contributioly below e, as well asnsidered r capita and
er, these regefore usefuled approach
ming regionRussia. Theproduct sting producroducts) coud highest OVwhile Lipetsent of missis, capable o
r/Index Rank 675964
0.9290941395
66 46582 027
ions a
of ECI
exity f on to
s its
d ions to
h.
n, e
ct uld V in sk is ing f
of 832097
4734254
2428
22
To summarise: Novosibirsk is one of the best performing Russian regions. Its positions in the Russian product space, as outlined in the next section, are strong. Its focus should be on enhancing its position on the global scene and innovating. Being at a different stage of capability development, Lipetsk is not leveraging its existing capabilities. Its focus should thus be on addressing its gaps in the Russian product space. To do so, Lipetsk will need to focus on developing the complex sectors it already holds. The next section provides examples of how this could be done.
3.2. Missing products, lack of human capital and collaboration key to improving performance
Several barriers seem to impede Lipetsk’s knowledge economy development.
Addressing missing products opportunities
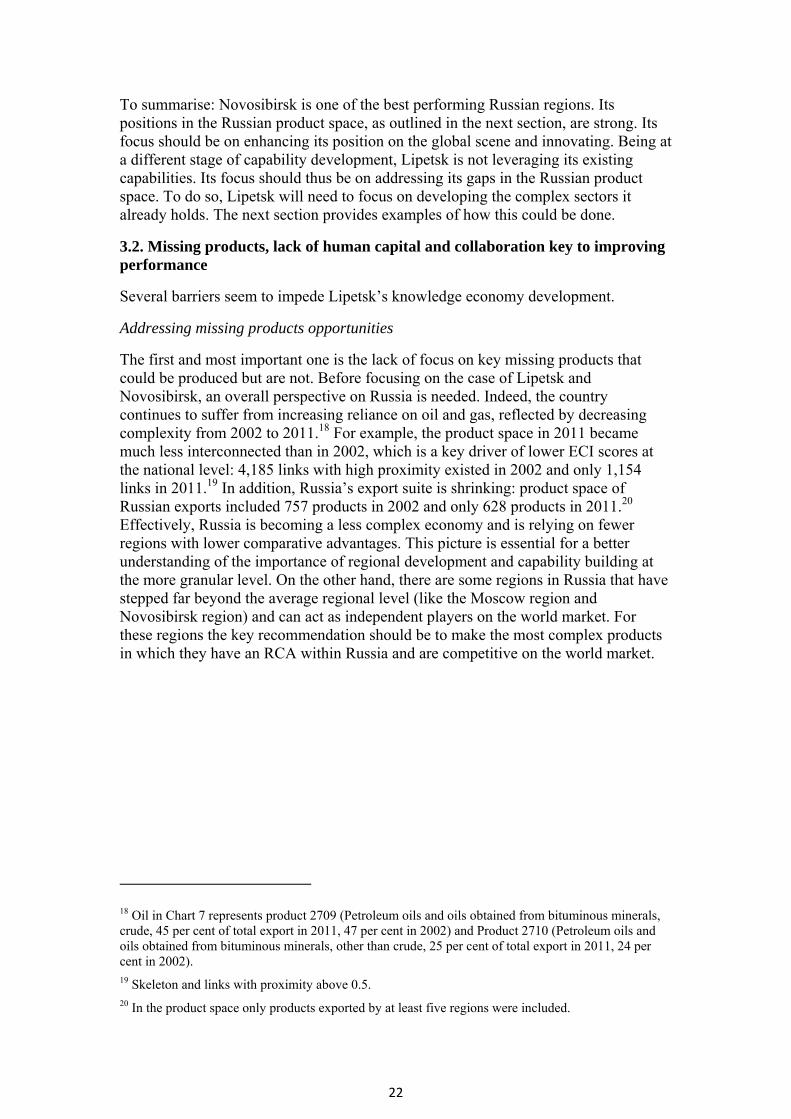
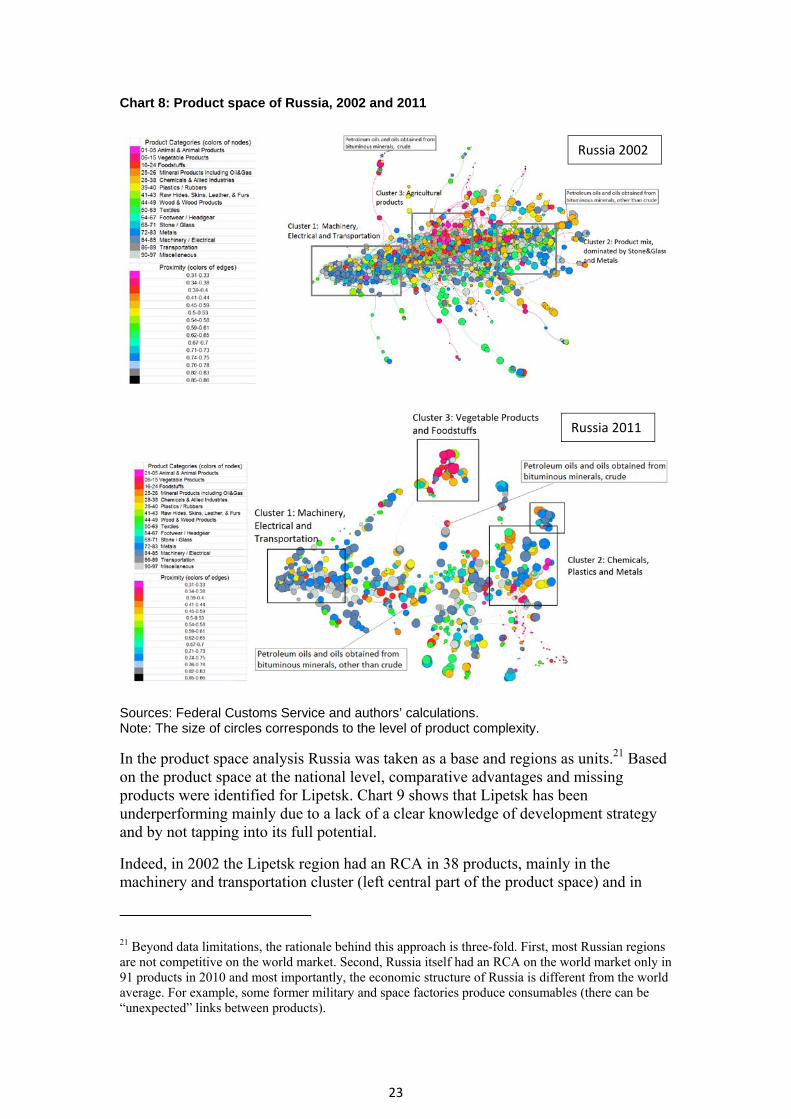
The first and most important one is the lack of focus on key missing products that could be produced but are not. Before focusing on the case of Lipetsk and Novosibirsk, an overall perspective on Russia is needed. Indeed, the country continues to suffer from increasing reliance on oil and gas, reflected by decreasing complexity from 2002 to 2011.18 For example, the product space in 2011 became much less interconnected than in 2002, which is a key driver of lower ECI scores at the national level: 4,185 links with high proximity existed in 2002 and only 1,154 links in 2011.19 In addition, Russia’s export suite is shrinking: product space of Russian exports included 757 products in 2002 and only 628 products in 2011.20 Effectively, Russia is becoming a less complex economy and is relying on fewer regions with lower comparative advantages. This picture is essential for a better understanding of the importance of regional development and capability building at the more granular level. On the other hand, there are some regions in Russia that have stepped far beyond the average regional level (like the Moscow region and Novosibirsk region) and can act as independent players on the world market. For these regions the key recommendation should be to make the most complex products in which they have an RCA within Russia and are competitive on the world market.
18 Oil in Chart 7 represents product 2709 (Petroleum oils and oils obtained from bituminous minerals, crude, 45 per cent of total export in 2011, 47 per cent in 2002) and Product 2710 (Petroleum oils and oils obtained from bituminous minerals, other than crude, 25 per cent of total export in 2011, 24 per cent in 2002). 19 Skeleton and links with proximity above 0.5. 20 In the product space only products exported by at least five regions were included.
23
Chart 8: Product space of Russia, 2002 and 2011
Sources: Federal Customs Service and authors’ calculations. Note: The size of circles corresponds to the level of product complexity.
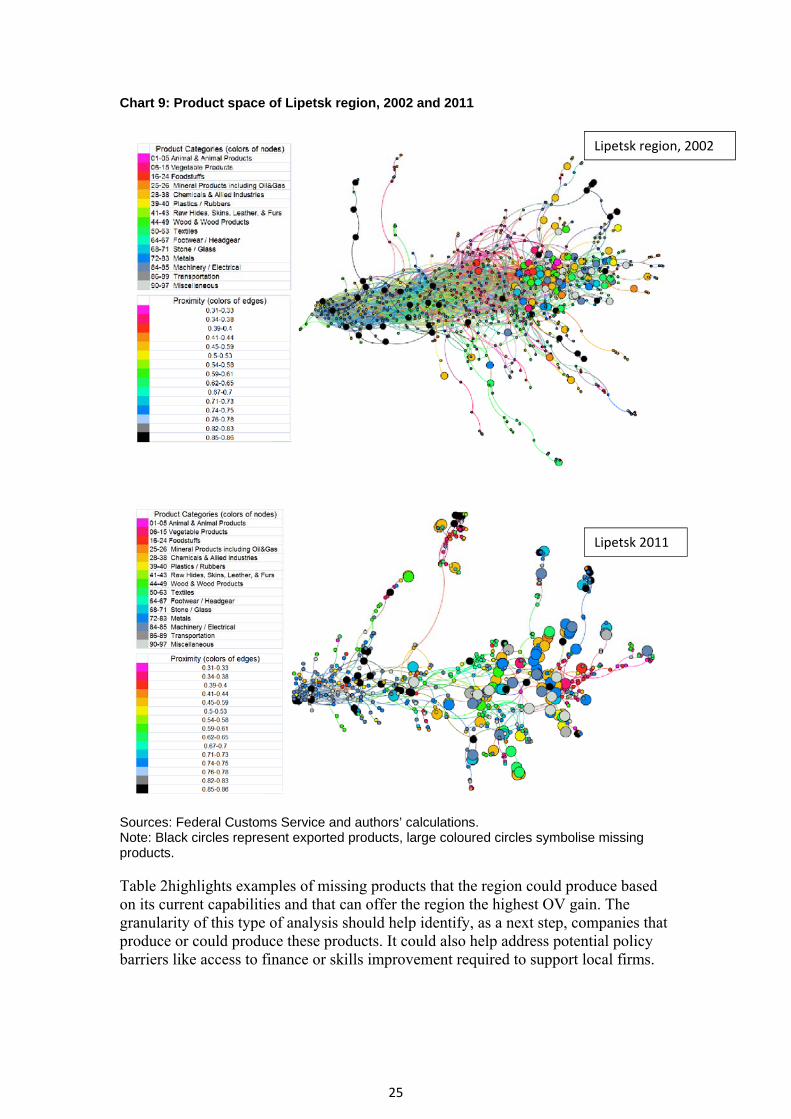
In the product space analysis Russia was taken as a base and regions as units.21 Based on the product space at the national level, comparative advantages and missing products were identified for Lipetsk. Chart 9 shows that Lipetsk has been underperforming mainly due to a lack of a clear knowledge of development strategy and by not tapping into its full potential.
Indeed, in 2002 the Lipetsk region had an RCA in 38 products, mainly in the machinery and transportation cluster (left central part of the product space) and in
21 Beyond data limitations, the rationale behind this approach is three-fold. First, most Russian regions are not competitive on the world market. Second, Russia itself had an RCA on the world market only in 91 products in 2010 and most importantly, the economic structure of Russia is different from the world average. For example, some former military and space factories produce consumables (there can be “unexpected” links between products).
Russia 2002
Russia 2011
24
ancillary fields. Its 100 products with the highest opportunity gains, that is, “missing products” were concentrated mainly in the right central part of the product space, dominated by stone, glass and metals.
This means that, at that time, exploring existing nascent industries with a high concentration of products, for example on the right part of the product space, would have offered the region the highest prospects for future development. Almost 10 years later, in 2011, the Lipetsk region has started to address this gap by showing a more pronounced presence in metals. In total it had an RCA in 39 products distributed between all three key clusters – but still with the strongest positions in machinery, which can be seen on Chart 9. However, much more could be done. In 2011 the “missing products” were still concentrated mainly in metals, chemicals and plastics, while the products with the highest proximity to already exported goods were mainly in the machinery sector (Chart 14). Thus, Lipetsk region already has all capabilities to produce more types of different machinery, and still has big gaps in plastics, chemicals, stone, glass and metals. This effectively implies that the Lipetsk region had achieved a higher level of export diversification by 2002 but the number of exported products did not move much between 2002 and 2011. The region now needs to focus a lot more on areas where it has a comparative advantage, such as electronics, machinery, plastics and metals, and fill the gaps in its export suite, indicated by “missing products”.
25
Chart 9: Product space of Lipetsk region, 2002 and 2011
Sources: Federal Customs Service and authors’ calculations. Note: Black circles represent exported products, large coloured circles symbolise missing products.
Table 2highlights examples of missing products that the region could produce based on its current capabilities and that can offer the region the highest OV gain. The granularity of this type of analysis should help identify, as a next step, companies that produce or could produce these products. It could also help address potential policy barriers like access to finance or skills improvement required to support local firms.
Lipetsk region, 2002
Lipetsk 2011

26
Table 2: Lipetsk - example of missing products, with existing capabilities, that could be produced from 2012
Source: Authors’ calculations.
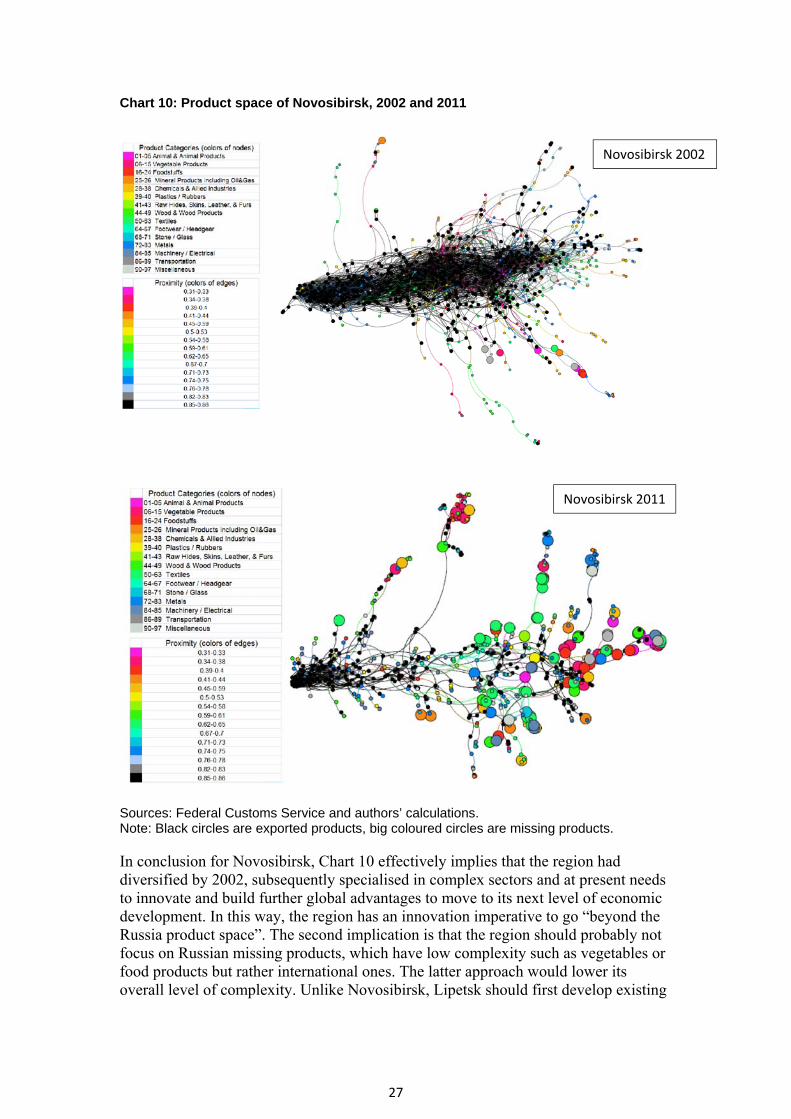
By contrast, in 2002, the Novosibirsk region had already occupied most spaces in all three sectors where Lipetsk is present (RCA in 437 products). Its only opportunity was to develop new industries in ancillary fields (only 12 products with opportunity gains above 0, mainly agricultural, wood products, textiles and minerals). Arguably, it seems that from 2002 to 2011 the region switched from diversification to specialisation in complex products and sectors:22 in 2011 it already had an RCA only in 236 products mainly in machinery, transportation, chemicals, plastics and metals. It has many missing products in the periphery, that is, with low complexity and low opportunity gains that are probably wise to ignore for now. Average PCI of Novosibirsk region’s “missing products” was -1.3 (compared with +0.55 for Lipetsk), average opportunity gain of the “missing products” was 2.2 (compared with 5.6 for Lipetsk).
22Another possibility is that some of these products became more scarce (ubiquity decreased), and consequently were excluded from the RCA matrix.
Category Product"Acyclic alcohols and their halogenated. sulphonated. nitrated or nitrosated derivatives"''Safety fuses; detonating fuses; percussion or detonating caps; igniters; electric detonators'
"Prepared explosives. other than propellent powders"'
"Reaction initiators. reaction accelerators and catalytic preparations. not elsewhere specified or included"'
"Anti‐knock preparations. oxidation inhibitors. gum inhibitors. viscosity improvers. anti‐corrosive preparations"
"Polymers of ethylene. in primary forms"'
"Polymers of propylene or of other olefins. in primary forms"'
'Silicones in primary forms'
"Polyacetals. other polyethers and epoxide resins. in primary forms; polycarbonates. alkyd resins. polyallyl esters"'
"Amino‐resins. phenolic resins and polyurethanes. in primary forms"'
"Ceramic wares for laboratory. chemical or other technical uses; ceramic troughs. tubs and packing of goods"'
"Float glass and surface ground or polished glass. in sheets"'
"Slag wool. rock wool and similar mineral wools; exfoliated vermiculite. expanded clays"
"Safety glass. consisting of toughened (tempered) or laminated glass"'
"Refractory bricks. blocks. tiles and similar refractory ceramic constructional goods. other than those of siliceous fossil meals"'
"Table. kitchen or other household articles and parts thereof. of copper; pot scourers and scouring or polishing pads."'
"Aluminium bars. rods and profiles"'
"Tools of two or more of headings 8202 to 8205. put up in sets for retail sale"'
'Wire of stainless steel'
'Aluminium tubes and pipes'
"Nickel bars. rods. profiles and wire"'
"Machinery parts. not containing electrical connectors. insulators. coils. contacts or other electrical features.'
"Book‐binding machinery.including book‐sewing machines"'
"Thermionic. cold cathode or photocathode valves and tubes (for example. vacuum or vapour or gas filled valves and tubes."'
'Spark‐ignition reciprocating or rotary internal combustion piston engines'
"Carbon electrodes. carbon brushes. lamp carbons. battery carbons and other articles of graphite or other carbon"'
'28‐38
Chemicals &
Allied
Industries '
'39‐40 Plastics
/ Rubbers '
'68‐71 Stone /
Glass '
'72‐83 Metals
'
'84‐85
Machinery /
Electrical'
27
Chart 10: Product space of Novosibirsk, 2002 and 2011
Sources: Federal Customs Service and authors’ calculations. Note: Black circles are exported products, big coloured circles are missing products.
In conclusion for Novosibirsk, Chart 10 effectively implies that the region had diversified by 2002, subsequently specialised in complex sectors and at present needs to innovate and build further global advantages to move to its next level of economic development. In this way, the region has an innovation imperative to go “beyond the Russia product space”. The second implication is that the region should probably not focus on Russian missing products, which have low complexity such as vegetables or food products but rather international ones. The latter approach would lower its overall level of complexity. Unlike Novosibirsk, Lipetsk should first develop existing
Novosibirsk 2002
Novosibirsk 2011
28
complex sectors and cover the entire space in areas where it has a comparative advantage before focusing on global specialisation and innovation.
Reducing policy barriers to unlock the potential
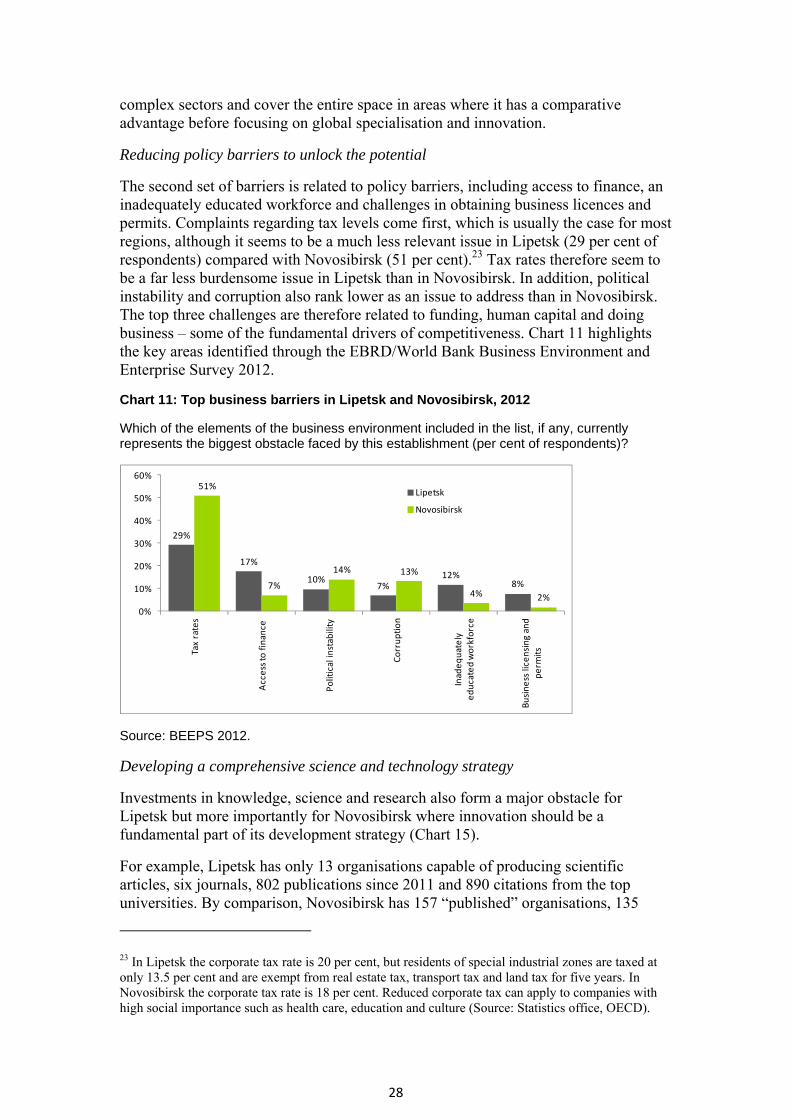
The second set of barriers is related to policy barriers, including access to finance, an inadequately educated workforce and challenges in obtaining business licences and permits. Complaints regarding tax levels come first, which is usually the case for most regions, although it seems to be a much less relevant issue in Lipetsk (29 per cent of respondents) compared with Novosibirsk (51 per cent).23 Tax rates therefore seem to be a far less burdensome issue in Lipetsk than in Novosibirsk. In addition, political instability and corruption also rank lower as an issue to address than in Novosibirsk. The top three challenges are therefore related to funding, human capital and doing business – some of the fundamental drivers of competitiveness. Chart 11 highlights the key areas identified through the EBRD/World Bank Business Environment and Enterprise Survey 2012.
Chart 11: Top business barriers in Lipetsk and Novosibirsk, 2012
Which of the elements of the business environment included in the list, if any, currently represents the biggest obstacle faced by this establishment (per cent of respondents)?
Source: BEEPS 2012.
Developing a comprehensive science and technology strategy
Investments in knowledge, science and research also form a major obstacle for Lipetsk but more importantly for Novosibirsk where innovation should be a fundamental part of its development strategy (Chart 15).
For example, Lipetsk has only 13 organisations capable of producing scientific articles, six journals, 802 publications since 2011 and 890 citations from the top universities. By comparison, Novosibirsk has 157 “published” organisations, 135
23 In Lipetsk the corporate tax rate is 20 per cent, but residents of special industrial zones are taxed at only 13.5 per cent and are exempt from real estate tax, transport tax and land tax for five years. In Novosibirsk the corporate tax rate is 18 per cent. Reduced corporate tax can apply to companies with high social importance such as health care, education and culture (Source: Statistics office, OECD).
29%
17%
10%7%
12%8%
51%
7%
14% 13%
4% 2%
0%
10%
20%
30%
40%
50%
60%
Tax rates
Access to
finance
Political instability
Corruption
Inadequately
educated workforce
Business licensing and
perm
its
Lipetsk
Novosibirsk

jourpate
Finaintehas proppracdriv
Chacolla
Sou
Looexamversand of bzon
Numb
Numb
Numb
Tot
200
Total
Paten
OECD
I
I
rnals, 44,55ents, the dif
ally, Lipetskellectual pro
focused muperty develoctices worldver of innov
art 12: Organaboration in
rces: elibrary
oking at sciemple psychsus 74 per ccore scienc
biology, phyes”).
ber of organization
ber of journals
ber of publications
tal
01‐2010
citation (top twen
nts for inventions a
D collaboration leve
IP co‐authorships w
IP co‐authorships w
8 articles ovfference is a
k seems to foperty co-auuch more onoped in colldwide wherevation.
nisations prn 2012
y.ru, Rosstat
entific gaps,hology or lincent in this ace in areas wysics, mathe
ns
s
nty universities)
and utility models g
el
within the same co
within the region (2
ver the samalso signific
focus on couthorship den national claboration we intra-regio
roducing sc
t, OECD data
, Lipetsk senguistics, warea for Novwith a stronematics, me
granted in 2010, it
untry (2007 OECD)
2007 OECD)
29
me period anant with fiv
llaboration eveloped in ollaboration
with other reonal and int
cientific artic
abase (data
eems to focuwith almost n
vosibirsk. Nng stock of pechanics or I
tems (Rosstat)
)
nd 279,778 cve compared
within its rcollaboration with 45 peegions. Theternational c
cles, patents
for 2008).
us mainly onno articles inNovosibirsk publicationsIT (see Tab
Lipe
3 6
8
8
1
2
7
citations. Lod with 183 (
egion with 7on regionaller cent of inlatter reflec
collaboratio
s and degre
n non-scienn the area ois also focu
s and citatiole 3 – red ar
etsk No
13
6
619
802
890 2
110
5%
5%
ooking at (Chart 12).
75 per cent ly. Novosibntellectual cts best
on is a key
ee of regiona
ntific areas, of science using on keyons in the arreas or “hot
ovosibirsk
157
135
52 996
44 558
279 778
707
45%
55%
of birsk
al
for
y reas t
30
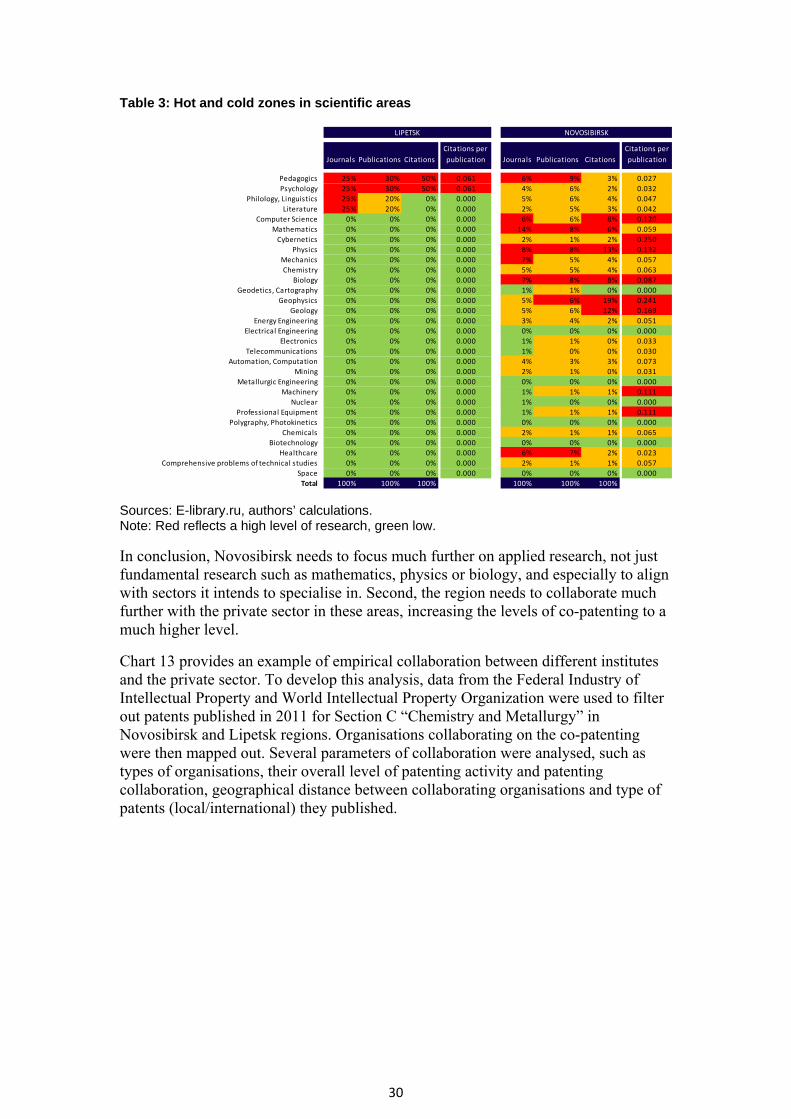
Table 3: Hot and cold zones in scientific areas
Sources: E-library.ru, authors’ calculations. Note: Red reflects a high level of research, green low.
In conclusion, Novosibirsk needs to focus much further on applied research, not just fundamental research such as mathematics, physics or biology, and especially to align with sectors it intends to specialise in. Second, the region needs to collaborate much further with the private sector in these areas, increasing the levels of co-patenting to a much higher level.
Chart 13 provides an example of empirical collaboration between different institutes and the private sector. To develop this analysis, data from the Federal Industry of Intellectual Property and World Intellectual Property Organization were used to filter out patents published in 2011 for Section C “Chemistry and Metallurgy” in Novosibirsk and Lipetsk regions. Organisations collaborating on the co-patenting were then mapped out. Several parameters of collaboration were analysed, such as types of organisations, their overall level of patenting activity and patenting collaboration, geographical distance between collaborating organisations and type of patents (local/international) they published.
LIPETSK NOVOSIBIRSK
Journals Publications Citations
Citations per
publication Journals Publications Citations
Citations per
publication
Pedagogics 25% 30% 50% 0.061 6% 9% 3% 0.027
Psychology 25% 30% 50% 0.061 4% 6% 2% 0.032
Philology, Linguistics 25% 20% 0% 0.000 5% 6% 4% 0.047
Literature 25% 20% 0% 0.000 2% 5% 3% 0.042
Computer Science 0% 0% 0% 0.000 6% 6% 8% 0.120
Mathematics 0% 0% 0% 0.000 14% 8% 6% 0.059
Cybernetics 0% 0% 0% 0.000 2% 1% 2% 0.250
Physics 0% 0% 0% 0.000 8% 8% 13% 0.132
Mechanics 0% 0% 0% 0.000 7% 5% 4% 0.057
Chemistry 0% 0% 0% 0.000 5% 5% 4% 0.063
Biology 0% 0% 0% 0.000 7% 8% 8% 0.087
Geodetics, Cartography 0% 0% 0% 0.000 1% 1% 0% 0.000
Geophysics 0% 0% 0% 0.000 5% 6% 19% 0.241
Geology 0% 0% 0% 0.000 5% 6% 12% 0.169
Energy Engineering 0% 0% 0% 0.000 3% 4% 2% 0.051
Electrical Engineering 0% 0% 0% 0.000 0% 0% 0% 0.000
Electronics 0% 0% 0% 0.000 1% 1% 0% 0.033
Telecommunications 0% 0% 0% 0.000 1% 0% 0% 0.030
Automation, Computation 0% 0% 0% 0.000 4% 3% 3% 0.073
Mining 0% 0% 0% 0.000 2% 1% 0% 0.031
Metallurgic Engineering 0% 0% 0% 0.000 0% 0% 0% 0.000
Machinery 0% 0% 0% 0.000 1% 1% 1% 0.111
Nuclear 0% 0% 0% 0.000 1% 0% 0% 0.000
Professional Equipment 0% 0% 0% 0.000 1% 1% 1% 0.111
Polygraphy, Photokinetics 0% 0% 0% 0.000 0% 0% 0% 0.000
Chemicals 0% 0% 0% 0.000 2% 1% 1% 0.065
Biotechnology 0% 0% 0% 0.000 0% 0% 0% 0.000
Healthcare 0% 0% 0% 0.000 6% 7% 2% 0.023
Comprehensive problems of technical studies 0% 0% 0% 0.000 2% 1% 1% 0.057
Space 0% 0% 0% 0.000 0% 0% 0% 0.000
Total 100% 100% 100% 100% 100% 100%

Cha
SoulibraNoteAll tothe cpubland cros
Thapatewasorgasectthe PCTactivMetcornhavmetof cof thpateorga
3.3.“cu
If wTab
art 13: Colla
rces: Federaary.ru, authore: Red reflecopics relevancomparison. lication (201citations ass
ss-disciplinar
anks to its esent volumess very local,anisations. tor was offsonly four p
T patents invity by scietallurgy” is nerstone of e publishedtallurgy. Alcollaborationhe Boreskovents publishanisations.
. Potential surrent drive
we apply theble 4) movin
boration in
al Industry ofrs’ calculatiocts high levelnt to scienceThen, article
1) and rangesuming therery journals/ar
stablished ss and a high, with a highFor Lipetsk
set by very latents inven
nvented by Oentific institthus very loLipetsk’s in
d substantiallmost half on between ov Institute o
hed – six, of
scenario foer” cluster
e scenario thng from tier
patenting
f Intellectual ns. of research,
e and severaes publisheded by numbee are exhausrticles could a
scientific infher level of ch share of sck region, a hlow patent vnted in LipeOJSC “Novoutions in Liow, especiandustrial seclly more patof these pateorganisationof Catalysisf which four
r Lipetsk i
hat Lipetsk cr 2 to tier 1 o
31
Property, Wo
, green low. l topics from
d in these jouer of citationsstive. The jouappear in tw
frastructurecollaboratiocientific inshigher sharevolumes andetsk oblast polipetsk Steipetsk regio
ally given thctor. Organtents (23) dents were cons of Novoss were foundr were inven
if it moved
could addreon the RCI
orld Intellect
Journals filtethe non-scie
urnals were fis. Calculationurnals/articleswo or more to
e, Novosibiron. Neverthestitutions vee of patent ad low level published ineel” employon in Sectionhe fact that Mnisations in tduring 2011 o-patents insibirsk city. d to have thnted in colla
from the “
ess 50 of itsover the ne
ual Property
ered by regioence group wiltered by yean of total nums are not unipics.
rsk region heless, this cersus industrauthors fromof collabora
n 2011, threeyees. The ovn “ChemistrMetallurgy the Novosibin chemistrvolving diff For exampe highest quaboration w
High poten
missing proxt five year
Organizatio
on and by topwere chosenar of the
mber of articleque, that is,
has much higcollaborationtrial m the industration. Out oe of them w
verall patentry and is a
birsk regionry and fferent degreple, specialiuantity of
with other
ntial” to
oducts (see rs, it could h
n, E-
pic. for
es
gher n
trial of were ting
n
ees sts
have

32
the same performance as its peers in this same cluster. This implies moving from a GRP of 245 billion roubles to the average GRP of 370 billion roubles in the top quadrant and from 11 per cent to 10 per cent unemployment, the average of the same first quadrant.
In order to make this move to tier 1 happen, the most sensitive policy levers seem to be related to product space, that is, improving sector competitiveness in areas such as electronics, chemicals and metals, as well as horizontal policies related to access to finance, human capital development and to a lesser extent other typical World Bank “Doing Business” Indicators. Production of new products will influence position of the region on the product space. Dependent on the number of new products changes will be the following:
Table 4: Missing product scenario for Lipetsk
Starts to produce
25 top missing products
50 top missing products
55 top missing products
60 top missing products Median for Russia
Opportunity value 33.0 54.8 52.2 51.0 42.0
Leveraged capabilities ((OV+WRCA)/2) 32.6 43.5 42.2 41.6 31.0
Source: Authors’ calculations.
If the region increases the number of products with RCA from 39 to 64, filling its gaps on the product space in 2011, it will have an OV close to the median. Production of 50 new missing products will provide the region with strong positions in the first cluster (high RECI, high OV+WRCA). Beyond 50, further enlargement of Lipetsk exports based on 2011 missing products will not bring new opportunities because this direction will be exhausted, and the list of missing products should be updated.
Moving the scenario to the next level: which products could have been produced by the region from 2002 to 2011? Why didn’t it? Which products could the region produce by 2020? Looking back, from 2002 to 2011 the Lipetsk region did not improve much. Indeed, by 2011 the RECI has risen from 96.2 to 98.4 and OV has risen from 18 to 23, but the changes were not significant enough to move it up on RCI. Indeed, ranking on the RCI in 2002 and RCI 2011 were exactly the same at number 66. Over the same period, the number of products exported with RCA increased only by one product, but the export structure has changed – Lipetsk region achieved RCA in 28 new products (6 of them were not represented in Russian export suite in 2002) and lost RCA in 27 products (10 of them were no longer exported by Russia in 2011). However, the products, exported in 2002 and 2011 are mostly from the same clusters and of the same complexity (Chart 14).
Tier 1 achieved
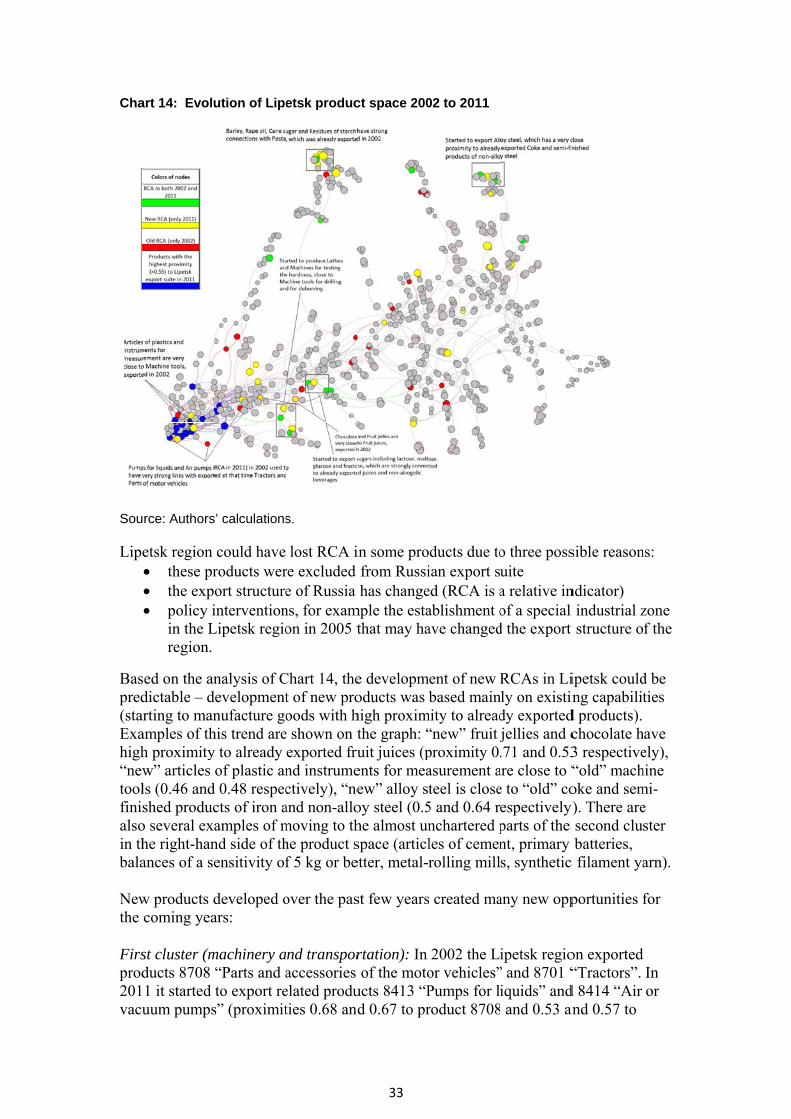
Cha
Sou
Lipe
Baspred(starExahigh“newtoolfinisalsoin thbala Newthe
Firsprod201vacu
art 14: Evolu
rce: Authors
etsk region these pr the exp policy i
in the Lregion.
sed on the andictable – drting to man
amples of thh proximityw” articles ls (0.46 andshed produc
o several exahe right-hanances of a se
w products dcoming yea
st cluster (mducts 8708 1 it started uum pumps
ution of Lipe
s’ calculations
could haveroducts werort structureinterventionLipetsk regio
nalysis of Cdevelopmentnufacture go
his trend arey to already of plastic an
d 0.48 respeccts of iron aamples of mnd side of thensitivity of
developed oars:
machinery a“Parts and ato export re
s” (proximit
etsk produc
s.
lost RCA ire excluded e of Russia
ns, for examon in 2005 t
Chart 14, thet of new prooods with h
e shown on texported frund instrumectively), “neand non-allomoving to thhe product sf 5 kg or be
over the pas
and transporaccessories elated produties 0.68 and
33
ct space 200
in some profrom Russihas change
mple the estathat may ha
e developmoducts was bhigh proximthe graph: “uit juices (pents for meaew” alloy stoy steel (0.5he almost unspace (articletter, metal-r
st few years
rtation): In of the moto
ucts 8413 “Pd 0.67 to pr
02 to 2011
ducts due toian export sed (RCA is aablishment oave changed
ent of new Rbased main
mity to alread“new” fruit jproximity 0.asurement ateel is close
5 and 0.64 rnchartered ples of cemenrolling mill
s created ma
2002 the Lor vehicles”Pumps for lroduct 8708
o three possuite a relative inof a special d the export
RCAs in Lily on existindy exportedjellies and c.71 and 0.53
are close to “e to “old” coespectively)parts of the nt, primary s, synthetic
any new opp
ipetsk regio” and 8701 “iquids” and and 0.53 an
sible reason
ndicator) industrial zstructure o
ipetsk couldng capabilit
d products). chocolate h3 respective“old” machoke and sem
y). There aresecond clusbatteries,
c filament ya
portunities f
on exported “Tractors”.
d 8414 “Air and 0.57 to
ns:
zone f the
d be ties
have ely), hine mi-e ster
arn).
for
In or
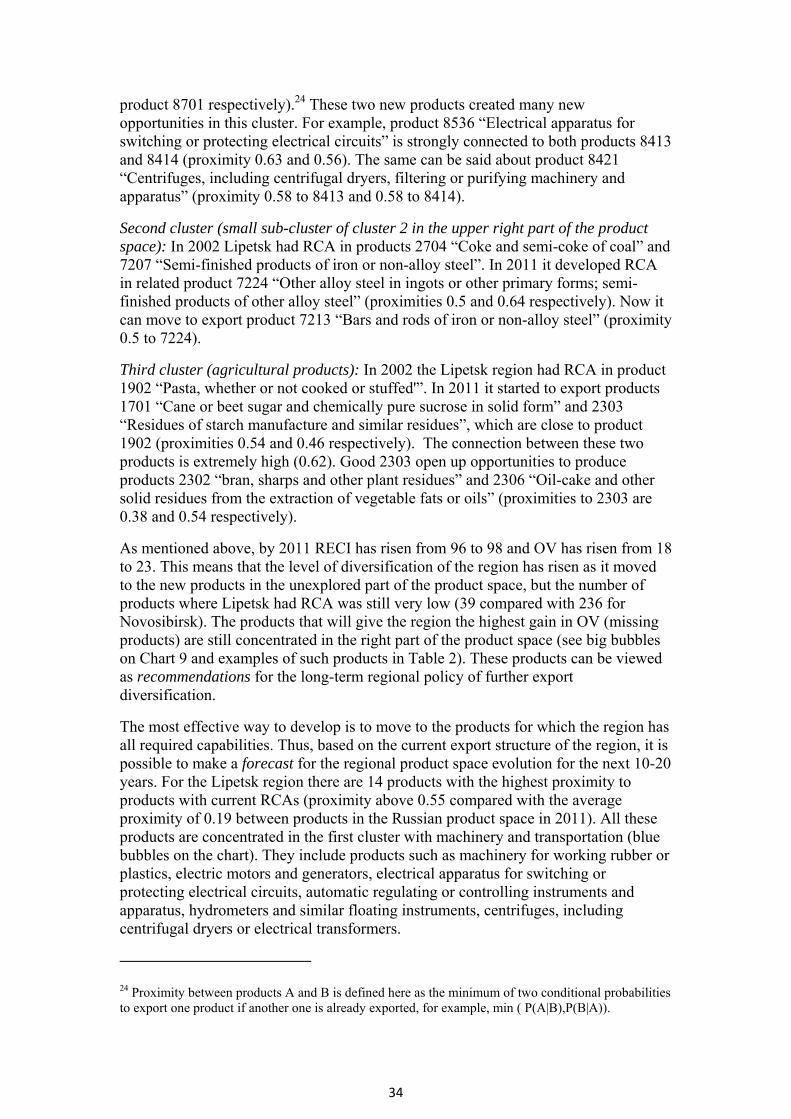
34
product 8701 respectively).24 These two new products created many new opportunities in this cluster. For example, product 8536 “Electrical apparatus for switching or protecting electrical circuits” is strongly connected to both products 8413 and 8414 (proximity 0.63 and 0.56). The same can be said about product 8421 “Centrifuges, including centrifugal dryers, filtering or purifying machinery and apparatus” (proximity 0.58 to 8413 and 0.58 to 8414).
Second cluster (small sub-cluster of cluster 2 in the upper right part of the product space): In 2002 Lipetsk had RCA in products 2704 “Coke and semi-coke of coal” and 7207 “Semi-finished products of iron or non-alloy steel”. In 2011 it developed RCA in related product 7224 “Other alloy steel in ingots or other primary forms; semi-finished products of other alloy steel” (proximities 0.5 and 0.64 respectively). Now it can move to export product 7213 “Bars and rods of iron or non-alloy steel” (proximity 0.5 to 7224).
Third cluster (agricultural products): In 2002 the Lipetsk region had RCA in product 1902 “Pasta, whether or not cooked or stuffed'”. In 2011 it started to export products 1701 “Cane or beet sugar and chemically pure sucrose in solid form” and 2303 “Residues of starch manufacture and similar residues”, which are close to product 1902 (proximities 0.54 and 0.46 respectively). The connection between these two products is extremely high (0.62). Good 2303 open up opportunities to produce products 2302 “bran, sharps and other plant residues” and 2306 “Oil-cake and other solid residues from the extraction of vegetable fats or oils” (proximities to 2303 are 0.38 and 0.54 respectively).
As mentioned above, by 2011 RECI has risen from 96 to 98 and OV has risen from 18 to 23. This means that the level of diversification of the region has risen as it moved to the new products in the unexplored part of the product space, but the number of products where Lipetsk had RCA was still very low (39 compared with 236 for Novosibirsk). The products that will give the region the highest gain in OV (missing products) are still concentrated in the right part of the product space (see big bubbles on Chart 9 and examples of such products in Table 2). These products can be viewed as recommendations for the long-term regional policy of further export diversification.
The most effective way to develop is to move to the products for which the region has all required capabilities. Thus, based on the current export structure of the region, it is possible to make a forecast for the regional product space evolution for the next 10-20 years. For the Lipetsk region there are 14 products with the highest proximity to products with current RCAs (proximity above 0.55 compared with the average proximity of 0.19 between products in the Russian product space in 2011). All these products are concentrated in the first cluster with machinery and transportation (blue bubbles on the chart). They include products such as machinery for working rubber or plastics, electric motors and generators, electrical apparatus for switching or protecting electrical circuits, automatic regulating or controlling instruments and apparatus, hydrometers and similar floating instruments, centrifuges, including centrifugal dryers or electrical transformers.
24 Proximity between products A and B is defined here as the minimum of two conditional probabilities to export one product if another one is already exported, for example, min ( P(A|B),P(B|A)).

35
In conclusion, it should be noted that policy-makers should focus first on high proximity products, then high opportunity gain products or “missing products”. The first category can be exported in the short term even without a sound regional policy. The second category is a longer-term strategic priority for the region. Scenarios built in this section are based on improvements in “missing products”.
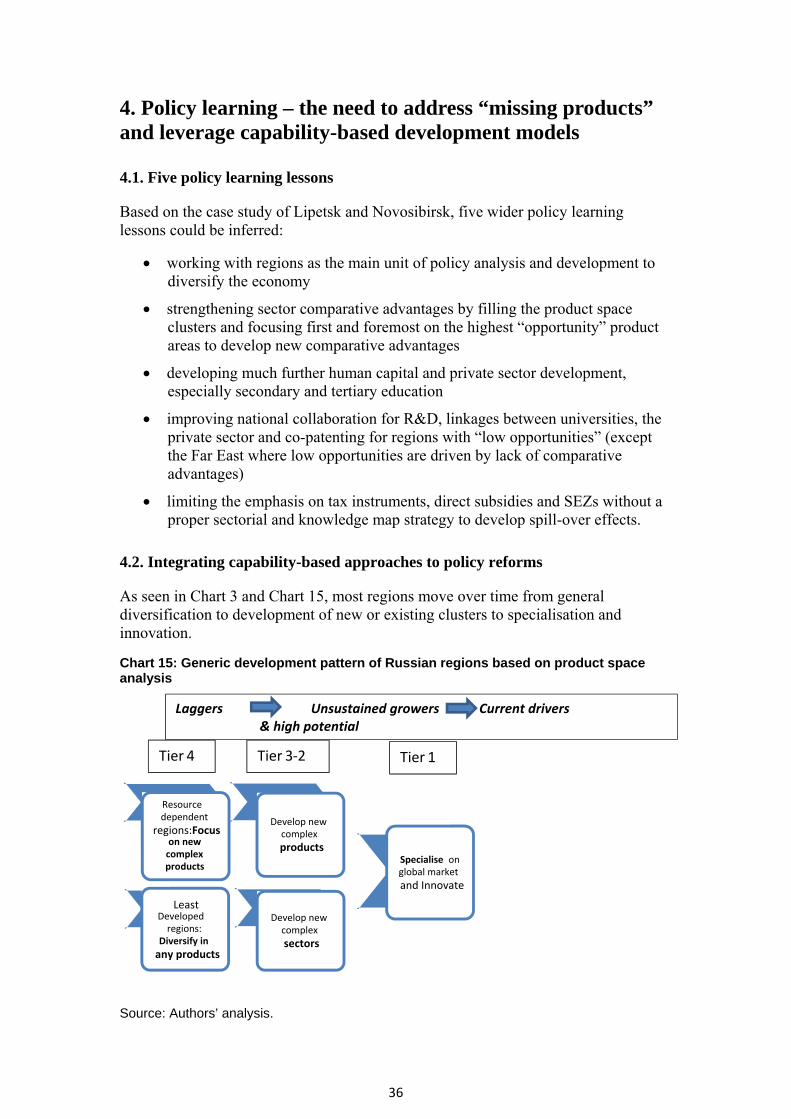
36
4. Policy learning – the need to address “missing products” and leverage capability-based development models
4.1. Five policy learning lessons
Based on the case study of Lipetsk and Novosibirsk, five wider policy learning lessons could be inferred:
working with regions as the main unit of policy analysis and development to diversify the economy
strengthening sector comparative advantages by filling the product space clusters and focusing first and foremost on the highest “opportunity” product areas to develop new comparative advantages
developing much further human capital and private sector development, especially secondary and tertiary education
improving national collaboration for R&D, linkages between universities, the private sector and co-patenting for regions with “low opportunities” (except the Far East where low opportunities are driven by lack of comparative advantages)
limiting the emphasis on tax instruments, direct subsidies and SEZs without a proper sectorial and knowledge map strategy to develop spill-over effects.
4.2. Integrating capability-based approaches to policy reforms
As seen in Chart 3 and Chart 15, most regions move over time from general diversification to development of new or existing clusters to specialisation and innovation.
Chart 15: Generic development pattern of Russian regions based on product space analysis
Source: Authors’ analysis.
Least Developed regions:
Diversify in
any products
Develop new complex
products
Develop new complex
sectors
Specialise on global market
and Innovate
Resource dependent
regions: Focus on new complex products
Tier 4 Tier 3‐ 2 Tier 1
Laggers Unsustained growers Current drivers & high potential
37
Based on this pattern and case study provided, capability based approaches would benefit from being even more integrated into national and regional economic policy analysis. Table 5 highlights the key models to consider.
Table 5: Key policy models guidelines according to a capability-based approach to regional development
Cluster 3 - Specialise in complex products For example, Smolensk, Kaliningrad, Pskov, Krasnodar region.
Cluster 1- Specialise in complex sectors at global level and innovate For example, Moscow, Samara, Novosibirsk, Chelyabinsk, Sverdlovsk regions.
Cluster 4 - Develop any products for least developed regions For example, Chechen Republic, Ingushetia. Develop new complex sectors for resource based regions For example, Chukotsky Autonomous District, Tyumen region Khanty-Mansiysk Autonomous District, Yamalo-Nenets Autonomous District.
Cluster 2 - Specialise in complex sectors For example, Tambov, Tatarstan, Bashkortostan, Tomsk.
Source: Authors’ analysis.
Specialise in complex sectors at global level and innovate implies moving further up the value chain in specific product trees where the region already has a WRCA by improving access to finance, public/private sector collaboration and reducing business operational barriers. A focus on the relevant research and coordinated university and corporate innovation projects could have a strong impact. Regions in this quadrant include Novosibirsk, as well as Moscow, Samara, Chelyabinsk and Sverdlovsk.
Specialise in complex sectors implies adding products to already strong sectors. Required policies include focused sectorial approaches aimed at removing sector-specific policy barriers and supporting SMEs in the relevant clusters. Focused export promotion instruments would also be very beneficial. On the contrary, early innovation policies in other clusters would probably have limited impact. Regions in this quadrant include, for example, Lipetsk, Tambov, Tatarstan, Bashkortostan and Tomsk.
Specialise in complex products implies focusing on adding more complex products in different parts of the product space. The state has a fundamental role in attracting national and foreign direct investment (FDI) in new areas, supporting nascent demand through private sector development policies and addressing skills gaps through tailed instruments like FDI-SME linkage programmes. Regions included in this quadrant include Smolensk, Kaliningrad, Pskov and Krasnodar.
Leveraged cap
abilities
Lower
Higher
Lower Higher
Existing capabilities
38
Develop any products or new complex sectors implies focusing for least developed regions on the fundamental horizontal policies first, including infrastructure development, human capital development and access to finance. For resource-dependent regions, this means targeted industrial policies with a strong vertical focus. Regions included in this quadrant are the Chechen Republic and Ingushetia Republic for the first group and Chukotsky Autonomous District, Tyumen region, Khanty-Mansiysk Autonomous District, Yamalo-Nenets Autonomous District for the second group.
For policy-makers to build on a capability-based approach to regional development, the following questions should be addressed:
For any region, which products can be produced, exported and exported with RCA?
How should missing products data be used to identify and eventually support companies that could development them?
Which instruments should be put in place for each cluster of region and which ones should be limited?
How should economic complexity principles be embedded in public policy?
Which key performance indicators should be leveraged?
How should policies best be prioritised based on this novel approach?
39
References
B. Balassa (1986), “Comparative Advantage in Manufactured Goods: A Reappraisal”, Review of Economics and Statistics, Vol. 68, No 2, pp. 315-19.
R. Hausmann, C. Hidalgo, S. Bustos, M. Coscia, S. Chung, J. Jimenez, A. Simoes and M. Yildirim (2011), The Atlas of Economic Complexity , Cambridge, MA: Puritan Press.
OECD (2011), Measuring Innovation, Paris: OECD.
World Bank (2011), Russian Economic Report, 14 September.
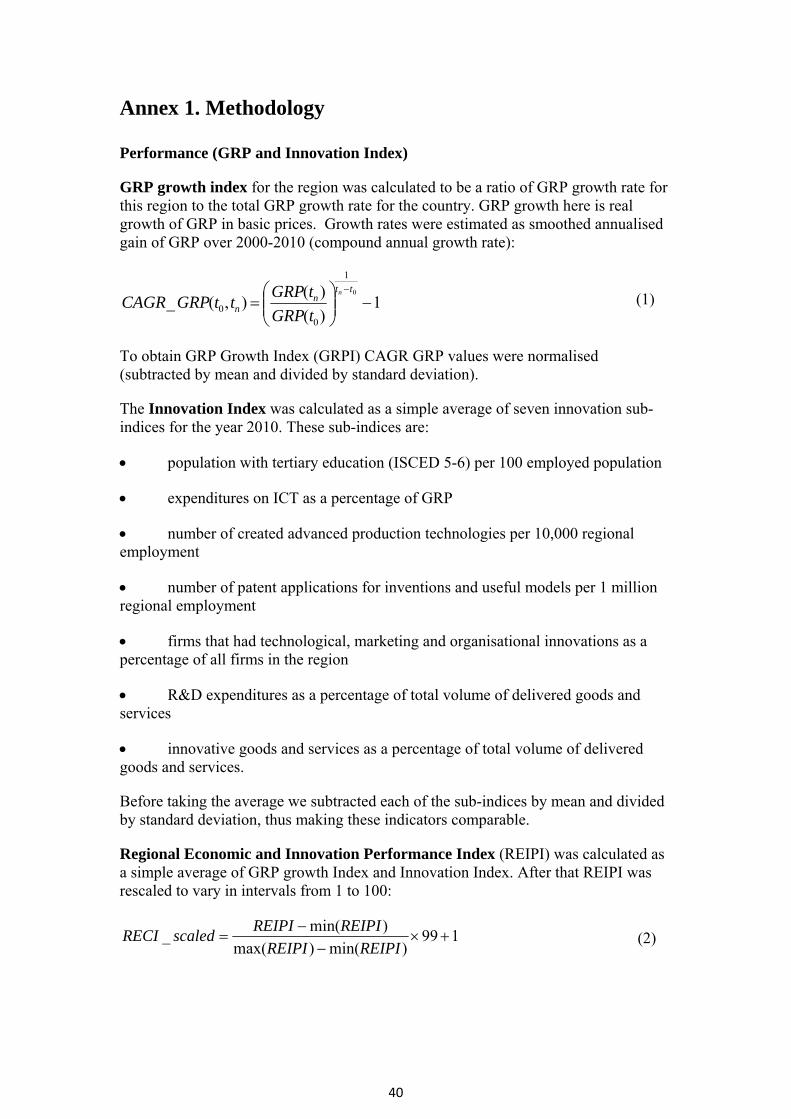
40
Annex 1. Methodology
Performance (GRP and Innovation Index)
GRP growth index for the region was calculated to be a ratio of GRP growth rate for this region to the total GRP growth rate for the country. GRP growth here is real growth of GRP in basic prices. Growth rates were estimated as smoothed annualised gain of GRP over 2000-2010 (compound annual growth rate):
1)(
)(),(_
0
1
00
ttn
n
n
tGRP
tGRPttGRPCAGR (1)
To obtain GRP Growth Index (GRPI) CAGR GRP values were normalised (subtracted by mean and divided by standard deviation).
The Innovation Index was calculated as a simple average of seven innovation sub-indices for the year 2010. These sub-indices are:
population with tertiary education (ISCED 5-6) per 100 employed population
expenditures on ICT as a percentage of GRP
number of created advanced production technologies per 10,000 regional employment
number of patent applications for inventions and useful models per 1 million regional employment
firms that had technological, marketing and organisational innovations as a percentage of all firms in the region
R&D expenditures as a percentage of total volume of delivered goods and services
innovative goods and services as a percentage of total volume of delivered goods and services.
Before taking the average we subtracted each of the sub-indices by mean and divided by standard deviation, thus making these indicators comparable.
Regional Economic and Innovation Performance Index (REIPI) was calculated as a simple average of GRP growth Index and Innovation Index. After that REIPI was rescaled to vary in intervals from 1 to 100:
199)min()max(
)min(_
REIPIREIPI
REIPIREIPIscaledRECI (2)

41
Existing Capabilities (Regional Index of Economic Complexity and Product Complexity Index)
The methodology of economic complexity is taken from Hausmann et al. (2011). Calculations are based on the 2011 and 2002 export structure data provided by the Federal Customs of Russia. The key idea of this concept is to view export structure as an indicator of knowledge possessed by the region. The region is considered to have a complex economy, if it produces many products which can be made by few other regions.
Only the products for which the region has revealed a comparative advantage are taken into consideration. The definition of Revealed Comparative Advantage (RCA) of region c in product p is the following (Balassa, 1986):
pccp
pcp
ccp
cpcp X
X
X
XRCA
,
/ (3)
For the sake of simplicity we will say that region c has RCA in product p, if RCAcp is above 1
The export structure of the regions is represented by matrix Mcp:
._0
;1__1
otherwise
RCAifM
cpcp (4)
Initial database used covered 1158 products in 2002 and 1148 products in 2011 from 97 categories arranged according to the Harmonized Commodity Description and Coding System (services (98-99) were not included), but the M cp matrix was too sparse for further calculations. Therefore, in the resulting database we included only products in which more than 5 regions had RCA above 1(757 products in 2002 and 628 products in 2011). This explains why some product groups, for instance, silk items (50), umbrellas (66), musical instruments (92) and antiques (97)) are not covered by our analyses.
To estimate economic complexity of the region we introduce simple measures of diversity and ubiquity:
ccpp
pcpc
MkUbiquity
MkDiversity
0,
0,
(5)
(6)
Diversity stands for the number of products in which the region c has revealed comparative advantage. Ubiquity is the total number of regions which have RCA in product p. The higher the diversity of the region and the lower the ubiquity of the products it produces, the higher the complexity of its economy.
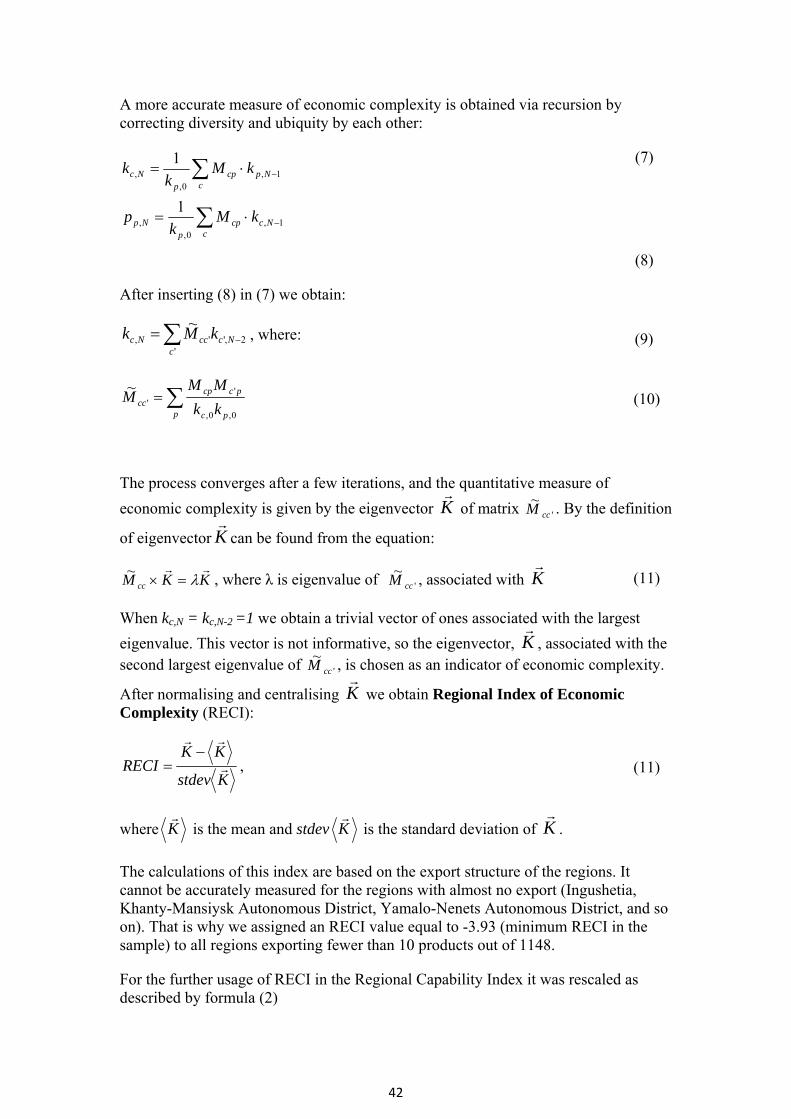
42
A more accurate measure of economic complexity is obtained via recursion by correcting diversity and ubiquity by each other:
cNccp
pNp
cNpcp
pNc
kMk
p
kMk
k
1,0,
,
1,0,
,
1
1
(7)
(8)
After inserting (8) in (7) we obtain:
'
2,'',
~
cNcccNc kMk , where: (9)
p pc
pccpcc kk
MMM
0,0,
''
~ (10)
The process converges after a few iterations, and the quantitative measure of
economic complexity is given by the eigenvector K
of matrix '
~ccM . By the definition
of eigenvector K
can be found from the equation:
KKM cc
~
, where λ is eigenvalue of '
~ccM , associated with K
(11)
When kc,N = kc,N-2 =1 we obtain a trivial vector of ones associated with the largest
eigenvalue. This vector is not informative, so the eigenvector, K
, associated with the second largest eigenvalue of '
~ccM , is chosen as an indicator of economic complexity.
After normalising and centralising K
we obtain Regional Index of Economic Complexity (RECI):
Kstdev
KKRECI
, (11)
where K
is the mean and stdev K
is the standard deviation of K
.
The calculations of this index are based on the export structure of the regions. It cannot be accurately measured for the regions with almost no export (Ingushetia, Khanty-Mansiysk Autonomous District, Yamalo-Nenets Autonomous District, and so on). That is why we assigned an RECI value equal to -3.93 (minimum RECI in the sample) to all regions exporting fewer than 10 products out of 1148.
For the further usage of RECI in the Regional Capability Index it was rescaled as described by formula (2)
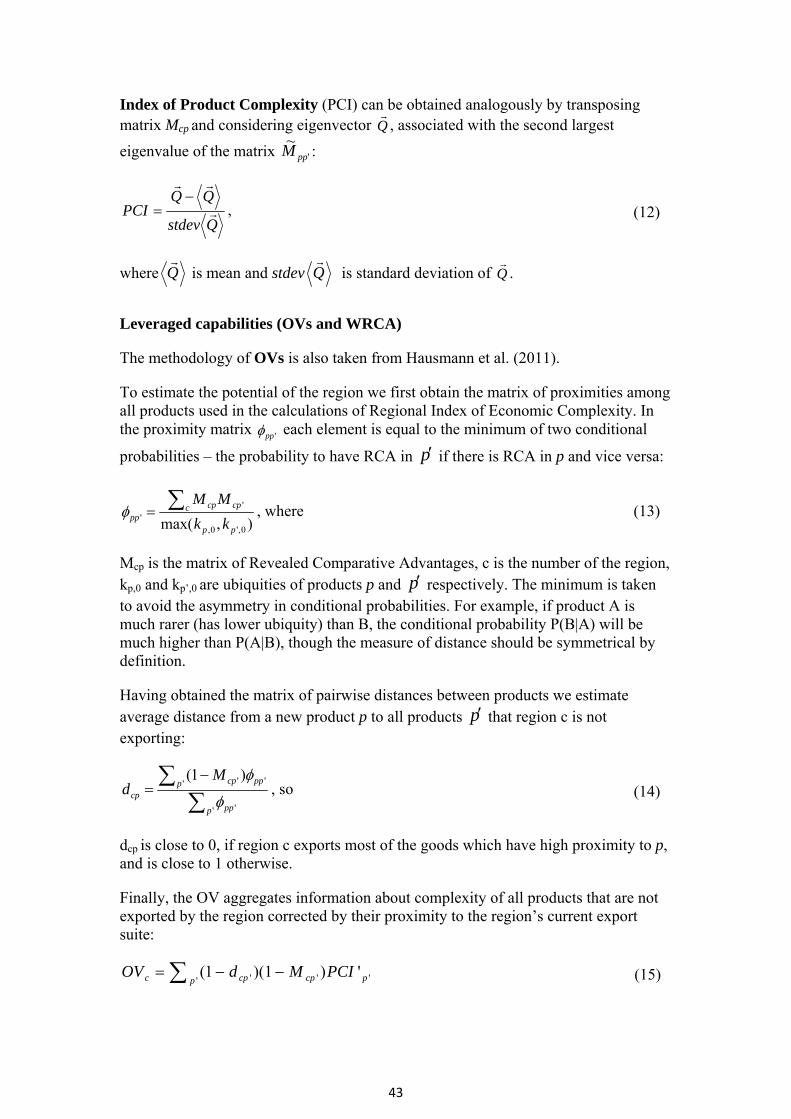
43
Index of Product Complexity (PCI) can be obtained analogously by transposing matrix Mcp and considering eigenvector Q
, associated with the second largest
eigenvalue of the matrix '
~ppM :
Qstdev
QQPCI
, (12)
where Q
is mean and stdev Q
is standard deviation of Q
.
Leveraged capabilities (OVs and WRCA)
The methodology of OVs is also taken from Hausmann et al. (2011).
To estimate the potential of the region we first obtain the matrix of proximities among all products used in the calculations of Regional Index of Economic Complexity. In the proximity matrix 'pp each element is equal to the minimum of two conditional
probabilities – the probability to have RCA in p if there is RCA in p and vice versa:
),max( 0,'0,
''
pp
c cpcppp kk
MM , where (13)
Mcp is the matrix of Revealed Comparative Advantages, c is the number of the region, kp,0 and kp’,0 are ubiquities of products p and p respectively. The minimum is taken to avoid the asymmetry in conditional probabilities. For example, if product A is much rarer (has lower ubiquity) than B, the conditional probability P(B|A) will be much higher than P(A|B), though the measure of distance should be symmetrical by definition.
Having obtained the matrix of pairwise distances between products we estimate average distance from a new product p to all products p that region c is not exporting:
' '
' '' )1(
p pp
p ppcp
cp
Md
, so (14)
dcp is close to 0, if region c exports most of the goods which have high proximity to p, and is close to 1 otherwise.
Finally, the OV aggregates information about complexity of all products that are not exported by the region corrected by their proximity to the region’s current export suite:
' ''' ')1)(1(
p pcpcpc PCIMdOV (15)
44
Note, that PCI’ here is slightly different from that described by (12) and is defined as:
)min(' PCIPCIPCI (16)
Converting PCI to positive scale was done in order to avoid distortions of products with negative complexity that can be exported (due to high proximity) but are not exported by the most successful regions with very high level of export diversification. After conversion described by (16) opportunities of the regions are not decreased by possibility to produce very “simple” products.
Finally, OVs from (15) were normalised by subtracting the mean and dividing by standard deviation and converted to the 0 to 100 scale, as described by (2).
To calculate WRCA score for the region we first took all products in which Russia had RCA (as described by (3), where c stands for countries, not regions) above 0.5 in 2010. The number of WRCAs for region c is the total number of products with PCI (as described by (12)) above 0.5, RCA for region c in Russia above 1 and RCA of Russia in the world above 0.5. This indicator was after that normalised and transferred to the 0 to 100 scale.
Regional Capability Index
Regional Capability Index is a combination of existing capabilities and leveraged capabilities, taken with equal weights:
)(5.05.0 cccc WRCAOVRECIRCI (17)
Economic structure
The economic structure of each region was calculated based on the 2010 GRP structure data by economic sectors for this region. For each region three sectors with the highest shares in the GRP were defined and ranged from the highest to the lowest. Regions which had the same sequence of the most contributing sectors were considered to have similar economic structure. The processing comparative advantage was calculated as a ratio of the processing sector share in the region’s GRP to the processing sector share in total GRP for the country.
Product space algorithm
On the basis of the proximity matrix (formula 14), the product space was constructed by the following algorithms:
1.1. skeleton of the graph: Maximum Spanning Tree algorithm to construct connected graph with (n-1) edges with the maximum total proximity (n – number of products)
1.2. tissue of the graph: added to skeleton all links between products with proximity above 0.5

45
1.3. force algorithm for graph layout to separate clusters of products
2. Calculated matrix of opportunity gains (OG) for all products, included in the final Mcp matrix (ubiquity > 5) - (757*757)-matrix for 2002 and (628*628)-matrix for 2011. OG for product p is the increase in OV (formula 15) for the region, if it starts to produce p:
'''
'' '''
' )1()1(p
pcppcp
p pp
ppcp PCIdPCIMOG
(18)
3. For the selected regional top 100 products, sorted by their OG, were called “missing products” and shown on the product space.
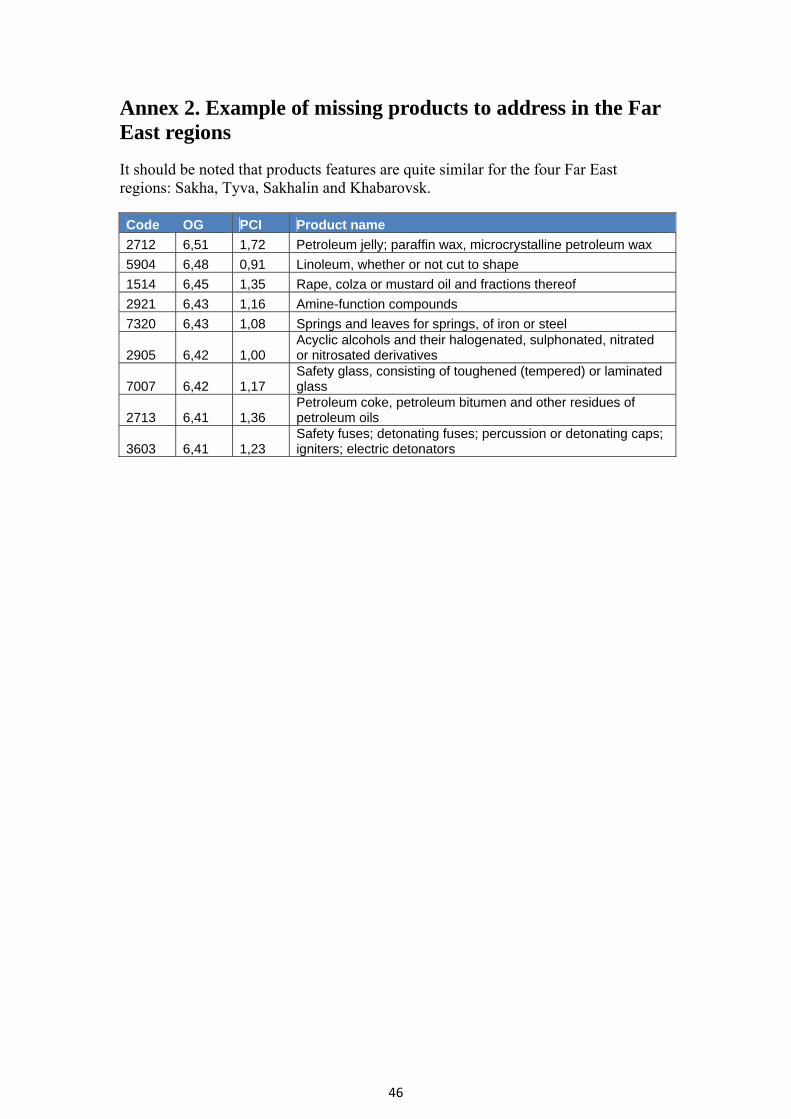
46
Annex 2. Example of missing products to address in the Far East regions
It should be noted that products features are quite similar for the four Far East regions: Sakha, Tyva, Sakhalin and Khabarovsk.
Code OG PCI Product name
2712 6,51 1,72 Petroleum jelly; paraffin wax, microcrystalline petroleum wax
5904 6,48 0,91 Linoleum, whether or not cut to shape
1514 6,45 1,35 Rape, colza or mustard oil and fractions thereof
2921 6,43 1,16 Amine-function compounds
7320 6,43 1,08 Springs and leaves for springs, of iron or steel
2905 6,42 1,00 Acyclic alcohols and their halogenated, sulphonated, nitrated or nitrosated derivatives
7007 6,42 1,17 Safety glass, consisting of toughened (tempered) or laminated glass
2713 6,41 1,36 Petroleum coke, petroleum bitumen and other residues of petroleum oils
3603 6,41 1,23 Safety fuses; detonating fuses; percussion or detonating caps; igniters; electric detonators