Embed Size (px)
Citation preview

NNWWSS OOffffiiccee ooff CClliimmaattee,, WWaatteerr,, aanndd WWeeaatthheerr SSeerrvviicceess MMaayy 22000099 SSiillvveerr SSpprriinngg,, MMaarryyllaanndd
IN THIS ISSUE Improving Probability of Precipitation Forecasts In Western Region 1Weather “bits”: Information Technology 3Social Science and Service Assessments 42009 Storm Data Users Meeting Summary 5Did You Know? 7Ask Chuck: TAF Verification 8 Recent Improvements to the Verification of Convective Warnings at WFO Tallahassee 10 An Innovative Partnership to Help Improve Dissemination And Customer Use of Critical Weather Information 11On the Road Again 13 Wayne’s World: Super Tuesday Tornado Outbreak Service Assessment Report Released 16Contact Information 18
Page 1
the winter to review the progression of PoP forecasts from recent storms. Reviewing events on the regional scale helped to raise awareness of forecasters that were not using the ClimoPoP methodology. The peer pressure generated by these calls increased the number of forecasters using the ClimoPoP methodology in WR. To raise local awareness of the PoP forecast grids, WR SSD developed an internal Advanced Weather Interactive Processing System (AWIPS) webpage that displays the model and forecast PoP and QPF forecasts on a regional scale. Forecast and model data can be viewed backward and forward in time for situational awareness and case studies. The page was designed by WR SSD SCEP student Andrew Murray and can be viewed on an AWIPS workstation web browser at 165.92.200.49:8080.
By David Myrick and Ken Pomeroy, Western Region Headquarters
Over the past year, Western Region (WR) forecast offices implemented a common methodology for creating Probability of Precipitation (PoP) forecasts. The technique involves relating the PoP forecast to the climatological probability of precipitation or “ClimoPoP.” PoP reliability statistics from winter 2007/2008 indicated that WR offices had a significant dry bias for high PoP values (greater than 30%), particularly at longer forecast lead times. Relating the PoP forecast to climatology provides forecasters with a scientific foundation for being more aggressive with their PoPs. Motivating forecasters to adopt a new philosophy for PoP was a major cultural change in Western Region. To promote this effort, WR Scientific Services Division (SSD) held a series of seven conference calls during
Improving Probability of Precipitation Forecasts in Western Region
Continued on next page…
2009

Peak Performance Spring IssueImproving Probability of Precipitation Forecasts in Western Region- Continued from Page 1
Page 2
PoP reliability statistics compiled for the 2008/09 winter season indicate that the ClimoPoP methodology has improved the reliability of WR PoP forecasts. For example, below (Figure 1) are reliability plots for 72 hour PoP forecasts from winter 2007/08 (left panel) and winter 2008/09 (right panel) for the Pocatello, ID county warning area. The dry bias in the official forecast PoP reliability observed during 2007/08 (blue line in left panel) was reduced this past winter (right panel). Similar improvements in PoP reliability were observed at forecast offices across WR. Using
ClimoPoPs as a reference point at Day 7 has also improved PoP grid collaboration. WR SSD plans to continue to look at PoP reliability during the upcoming monsoon and convective seasons. Evaluation of grid based precipitation and snow amount forecasts is planned for next winter. Additional information about the WR grid based verification program including conference call presentations and training modules is available at: http://ww2.wrh.noaa.gov/ssd/digital_services/.
Figure 1: Reliability plots for 72 hour PoP forecasts for the Pocatello, ID county warning area valid January – February 2008 (left panel) and November 2008 – February 2009 (right panel). Official forecast PoP reliability is shown in blue. Reliability statistics were calculated using precipitation analyses from the Northwest and Colorado River Forecast Centers. Images are courtesy of Dean Hazen and Dawn Harmon, WFO Pocatello, ID.

Spring IssuePeak Performance
Highlights: NOAA8203 Verification Begins System Modernization! The Performance Branch began its Life Cycle Management refresh in March 2009, receiving a new database server. Efforts are ongoing to migrate all functionality from our existing database server to the more powerful hardware. More efficient transaction time of database queries, and database redundancy features are our goals over the next few months. Verification Becomes Sole Production System Under NOAA8203! Per our Authority to Operate (ATO) received on September 30, 2008, NOAA8203 has defined and separated system functionalities, leaving Verification as the sole production system. The Warning Decision Training Branch (WDTB) has been subsumed under the Next Generation Radar (NEXRAD) NOAA8900 system, and the Hydrometeorological Information Center (HIC) officially retired its Legacy system in January 2009.
Department of Commerce Issues New IT Security Program Policy! The Department of Commerce (DOC) updated its Information Technology and Services Policy and Planning (ITSPP) in January 2009, superseding its previous release of June 2005. Quick link to the document is: http://csrc.nist.gov/publications/PubsSPs.html Of note, the “Baseline Common Controls,” or “Minimum Implementation Standards”, have increased to 91 current baseline controls vice the 38 contained in the June 2005 publication. New NOAA C&A Templates! The 2009 Certification and Accreditation (C&A) documentation is available. The package templates have changed significantly. New guidance of annual “Continuous Monitoring” is also available at this resource. Recommend IT personnel bookmark the followinglink: https://www.csp.noaa.gov/noaa/security-program/CandA/
Page 3
Anyone out there with a development experience, I encourage you to e-mail me and share the experience! [email protected]

Peak Performance Spring Issue
Page 4
By Dr. Burrell Montz, Binghamton University In May, 2008, I had the privilege of being part of the Service Assessment team for the Mother’s Day Weekend Tornadoes (May 10-11, 2008) in Oklahoma and Missouri. Twenty-one people died as a result of that tornado. The National Weather Service (NWS) put together a team to evaluate why there were so many fatalities despite timely watches and warnings. This placed a heavy emphasis on societal impacts – hence my participation as a social scientist. I am certainly not the first social scientist to be on an assessment team. A quick review on line of previous service assessments shows that Eve Gruntfest was on several service assessment teams following floods in the 1990s, and Betty Morrow was on the Hurricane Charley team. My inclusion on the Mother’s Day Tornado team and its explicit emphasis on societal impacts suggests a revitalization (if that is the right word) of the focus on investigating interactions between NWS and the public. Having never served on an assessment team, I had no idea what to expect. I have been in other situations as the lone social scientist (and the lone woman) among “real” scientists, and my experiences have varied. Much of my time in too many of these situations was spent justifying social science research and methods. However, I already knew one member of the team because we were in the same Weather and Society*Integrated Studies (WAS*IS) class and another was a WAS*IS alum. Of course, it doesn’t take WAS*IS training for NWS folks to appreciate the importance of understanding why and how people respond (or don’t) to warnings. Many address these issues regularly, and some of those who do were part of the team. So, as we arrived in Missouri, and met
to develop our field strategy, and divide tasks, I saw a shared sense of mission along with a mutual respect among members of the team. Two stumbling blocks I encountered involved first, convincing the others that not all social scientists are sociologists, and second, trying to decipher NWS acronyms. Given our limited time in the field, the team split up to perform various tasks. Some team members went to the Weather Forecast Offices (WFOs); others went into the field to interview people along the path of the tornado. For obvious reasons, I was one of the interviewers. I have many years of experience in undertaking post-event interviews and have had variable responses. Some people want to talk to anyone; others are suspicious of the motives; still others don’t want to be part of a “research project.” As a result, what surprised me about this process was how willing people were to talk to us. The number of people who were available near their homes (or what used to be their homes) was limited due to the extent of the damage and field logistics, we did not have one “turn down.” Instead, people were more than willing to talk, with their comments usually prefaced with something along the lines of: “I think you folks in the Weather Service do a great job.” Thus, there was sense of credibility in our work that is not often associated with more academic research. Of course, we also know that, though there is respect for NWS, people do not necessarily do what the NWS recommends. This supports what social scientists have documented many times about the difference between what people say and what people do. As an applied researcher who does a good deal of field work, the activities of the team did not lead to
Continued on next page…
Social Science and Service Assessments

Spring IssuePeak Performance
any big surprises. In the past, I have had to drop what I was doing to get into the field quickly. However, I have not done so with a team consisting of people I had not previously known. One surprise was how quickly and how well the team gelled – which facilitated our development of the report and our recommendations within it. However, what surprised me the most, probably because I have spent the better part of my professional life in Academia, is the bureaucracy and time involved in editing the report and getting it approved for release. Of course, as I reflected on the purpose of service
Social Science and Service Assessments- Continued from Page 4 assessments in general (to make recommendations
that lead to improved operations), and this one in particular (to address societal impacts), I recognize the importance of getting it just right. This was an interdisciplinary effort that required all of the team to work at the boundaries of their areas of expertise. From this social scientist’s perspective, it was well worth the effort. I believe our findings and recommendations are stronger because of it. And, the experience associated with this process has had and will continue to have a significant impact on my thinking, and my research.
Page 5
2009 Storm Data Users Meeting Summary By Brent MacAloney, NWS Headquarters On March 9th and 10th, 2009, the 2009 Storm Data Users Meeting (SDUM) was held at the National Weather Center in Norman, OK. This meeting is held annually and serves as a forum for the National Weather Service (NWS) forecasters and Performance Branch employees to meet with the users of the storm events database. This meeting provides an excellent opportunity to discuss user needs, hear suggestions for software and database improvements, and showcase new technologies being used at the NWS forecast office level in the collection and storage of storm data. There were representatives from the following offices and institutions: NWS Performance Branch (OS52), NWS Fire and Public Weather Services Branch (OS22), NWS Western Region Headquarters (WRH), National Climatic Data Center (NCDC), Storm Prediction Center (SPC), National Severe Storms Laboratory (NSSL), Warning Decision Training Branch (WDTB), WFO Milwaukee (MKX), WFO Omaha (OAX), WFO Glasgow
(GGW), and WFO Little Rock (LZK). Additionally, representatives from the National Center for Atmospheric Research Societal Impacts Program (NCAR SIP), Hydrologic Services Branch (OS31), Central Region Headquarters (CRH), WFO LaCrosse (ARX) and WFO Tallahassee (TAE) participated via conference call and GoToMeeting. In total, there were 23 participants in this year’s meeting. Attendees were given the opportunity to discuss their needs. These needs could have been from the point of entering data into the StormDat program or using the storm events database. These needs were writtenon a white board. As the meeting progressed, additional items were documented. The following list was compiled:
o Damage estimate confidence and enhanced metadata on damage estimates
o Spotters to be added as locations to pick from in the StormDat program
Continued on next page…

Peak Performance Spring Issue
2009 Storm Data Users Meeting Summary- Continued from Page 5
o Radar overlay on the StormDat event entry screen
o Allow users to enter EF-unknown instead of forcing them to assign a value
o Ability to track when and what changes are made to previously entered events for customers, as well as those certifying the data
o Easier entry of zone-based events o StormDat training
The attendees discussed the development plans and requirements for the next-generation StormDat program (StormDat v2.0). Since the
StormDat program was migrated from a local database application to a web-based application in October 2007, the Performance Branch has been keeping track of Storm Data Focal Point (SDFP) requests for enhancements to the software’s functionality, as well as requests from storm events database users regarding the enhancement of information in storm data. The SDUM allowed Performance Branch employees to validate these requirements, with the wide range of attendees. Prior to the Storm Data Users Meeting, several attendees took a leisurely hike (Figure 1).
Page 6
Figure 1: Attendees took a leisurely hike in the Wichita Mountains area of Oklahoma. Pictured from left to right- Greg Carbin (SPC), Kevin Scharfenberg (OS22), Darone Jones (WRH), Kiel Ortega (NSSL), Tiffinay Meyer (NSSL), Stuart Hinson (NCDC), and Brent MacAloney (OS52).
Continued on next page…

Spring IssuePeak Performance 2009 Storm Data Users Meeting Summary- Continued from Page 6 Some of the enhancements that the Performance Branch was able to validate at the SDUM are:
o Easier entry of zone-based events through allowing users to select multiple zones impacted
o Easier entry of county-based events by eliminating the need for events to be broken up into county-based segments. Events will be drawn however they occurred regardless of geo-political boundaries.
o Better assistance in the logging of storm event damage amounts and the addition of a field that allows the SDFP to enter a damage estimate confidence level.
o High resolution logging of tornado, hail, and thunderstorm wind events paths.
o Ability to let users enter “EF-Unknown” as an option in rating tornadoes.
o Radar overlay on storm events mapping interface to assist with the entry of events.
o Enhanced storm data entry support via NWS Chat.
A webpage was created on the Performance Management website outlining all of the planned changes to StormDat v2.0. It is located at: https://verification.nws.noaa.gov/stormdat/news/nextgen.aspx Also discussed at this meeting were topics such as: the state of the Local Storm Report (LSR) program and products, technologies that could be used to improve data collection at storm damage surveys, high resolution storm events, climatological trends in the storm events data, the development on a process in which SDFPs can modify erroneous historical tornado data (back to 1950), and the preliminary results from the National Center for Atmospheric Research (NCAR) Societal Impacts Program (SIP) survey on the storm data entry process. More information on the SDUM including the agenda, a detailed meeting overview, and action items can be found on the Performance Management website at: https://verification.nws.noaa.gov/stormdat/news/meeting.aspx
“Did You Know?” The Performance Branch has set up a "stormdata-talk" listserv for all to join. From here forecasters can discuss items associated with storm data and the StormDat program. Please feel free to use this as a tool to share information with each other or offer suggestions on how we can make the storm data program better. Instructions on how to sign up to participate in this list can be found here: https://verification.nws.noaa.gov/content/storm/stormTalk.aspx The Performance Branch has been working with the NWS Training Division to get some of their training modules in the DOC Learning Management System (LMS). Currently the two training modules available on the LMS are the “Winter Weather Warning Verification Overview” and the “Interpreting TAF Verification Statistics: Impact of TEMPO Forecasts.” More information on how to access these modules can be found here: https://verification.nws.noaa.gov/content/pm/training/modules.aspx
Page 7

Peak Performance Spring Issue
Page 8
categorical verification of ceilings and visibilities. The categories were designed with operational considerations in mind and, in most cases, are similar (but not identical) to the METAR special criteria. We have never considered using 1-minute data because we didn’t think we would get the bang for the buck from 1-minute data. The management of 5-minute data has been challenging enough to the system. If you were in the NWS a couple years ago and remember how long it used to take to get your requests for TAF verification reports answered, you know what I’m talking about. Through more efficient programming and faster servers, the delivery time of your longer requests has been reduced from many hours to minutes. Currently, the acquisition of true 5-minute ASOS data would require us to dial into over 500 ASOS sites daily. Such a technological feat would drastically increase the number of "points of failure" for data acquisition and, in the end, could cost us as much data as we would gain. However, the times are changing, and past limitations need not continue into the future. I just learned that the Meteorological Assimilation Data Ingest System (MADIS) system in Boulder, Colorado, is now receiving 5-minute ASOS data centrally from individual ASOS units in the Northeast US and the western Gulf coast area. Consequently, the possibility for a TAF verification enhancement that incorporates true 5-minute data in the future is not out of the question. We will seriously consider switching to using true 5-minute data once MADIS gets access to all METARs in the entire country. I don’t know if this would open up any legal issues since most of the aviation community only receives the transmitted hourly and special observations in real time, but we will certainly look into the matter. We may also need to add some memory and horsepower to the system to keep it running efficiently. Question 2: Does the NWS receive Surface Weather Observation Stations (AWOS) and Automated Weather Information Systems (AWIS), or other FAA-supported observation system on a 5-minute basis
By Chuck Kluepfel, NWS Headquarters
Kevin Smith (WFO Paducah) Interviews Chuck Kluepfel on TAF Verification – Past and Future Kevin Smith at the Paducah, Kentucky Weather Forecast Office (WFO) asked us some very thoughtful, probing questions about Terminal Aerodrome Forecasts (TAF) verification. They take us back to when we started building the system over five years ago and also take us forward to where we might want to be 5 or 10 years into the future. Here are Kevin’s questions and my responses: Question 1: Although most NWS field offices do not have inexpensive access to five minute Automated Surface Observing System (ASOS) data (usually requires telephone charges for remote sites), how did you decide whether to use 5- or 1-minute data for TAF verification? Answer: We are not yet able do true 5-minute verification of the TAFs, but we have employed a "poor person's" version of it. We only store the hourly and special Aviation Routine Weather Reports (METARs) that are transmitted to the world. We then look for the latest observation every 5 minutes and use it for verification. For example, if an ASOS didn’t transmit any specials during a given hour, we would end up verifying the same hourly observation twelve times for that hour. However, for precipitation and thunderstorm verification, we also store and use the METAR begin- and end-time remarks, which adds some critical temporal resolution to precipitation and thunderstorm events when the weather changes, but special criteria are not met. Having said all of this, please keep in mind, most people are interested in Continued on next page…
AASSKK CCHHUUCCKK!!

Spring IssuePeak Performance Ask Chuck- Continued from Page 8 as well for verification? I know at our own office, we forecast for one TAF site that does not use an ASOS-based observation setup. Answer: We are not aware of any 5-minute data available from AWOS sites. Nonetheless, we use AWOS data for TAF verification. Most AWOS units only provide a new observation every 20 minutes, regardless of whether or not special criteria were met. No specials are issued between each 20-minute report. Just as with the ASOS data, we take the latest observation every 5 minutes and use it. Therefore, AWOS data are inferior to ASOS for verification, but they are better than nothing. Question 3: Although there are many caveats and cautions in using digitized radar, satellite, or other supplementary observing systems within the 5 mile radius of a verifying TAF location, are there any plans in the future to incorporate this data into the TAF verification process, given some of the technical and statistical limitations of a single point ASOS site? Answer: We've not made any attempts in this area. However, the thunderstorms included in the ASOS observations come directly from thunderstorm detection equipment. Terminals that do not have thunderstorm detection equipment contain the remark, Thunderstorm information not available (TSNO) and are not verified for thunderstorms. Such terminals are identified by the TSNO remark near the end of the observation. It is important to remember that we are only tasked with verifying TAFs at the terminal for which they are written. Technically, this means within a 5 mile radius of the center of the airfield. We do not verify any of the vicinity (VC) forecasts (5 to 10 statute miles from the center of the field) or utilize any of the VC observation remarks. They get stored in our database, but we do not use them for verification. Question 4: Given the 5-minute verification profile used for prevailing and/or Temporary/Probability (TEMPO/PROBxx) groups, are there any plans to allow
the use of 15 minute resolution start/end times in TEMPO/PROBxx groups? The use of these higher resolutions start times in prevailing forecasts have always helped to reduce extraneous time periods in which a weather element occurrence may be unjustified. Answer: Changing the TAF code would require interagency (DOC and FAA) and international coordination. Given our ability to forecast the kinds of things that go into TEMPO and PROB groups, it would probably be difficult to make a convincing case that a forecast precision of less than one hour for these groups would benefit flight operations and, therefore, add value to the TAF. In verification, we mainly use the "5-minute data" to look back and forth through the observation record to perform the variability test. Yes, we still do the verification every 5 minutes, but the rules for determining the operational impact forecast are very forecaster friendly when you pass the variability test for a large percentage of the TEMPO valid period. For example, if you forecast TEMPO thunderstorms, and your TEMPO passes the variability test for thunderstorms for the entire valid period of the TEMPO, you do not (and should not) need to receive thunderstorms for the entire valid period to get a perfect verification score for the thunderstorms in that TEMPO. A brief period of thunderstorms during the valid period will do just fine for verification. Plus, that is what is preferable. You do not want it to thunder during an entire TEMPO valid period; for such cases should have had thunderstorms in the prevailing (FM group) forecast! Not surprisingly, you risk failing the variability test if it thunders too long. For greater detail, see the new TAF training module titled, Interpretation of TAF Verification Statistics, the Impact of TEMPO Forecasts. To read the entire interview, go to the Performance Management Website at: https://verification.nws.noaa.gov/content/pm/verif/aviation/Kluep.pdf Page 9

Peak Performance Spring Issue
Recent Improvements to the Verification of Convective Warnings in WFO Tallahassee By Michael A. Jamski, WFO Tallahassee, Florida Issuing convective warnings is one of the most critical functions of a Weather Forecast Office (WFO). From 2004 to 2007, WFO Tallahassee issued an annual average of nearly 300 severe thunderstorm and 100 tornado warnings. Verifying these warnings is vital to the warning process. Tracking this information can be tedious and sometimes nearly impossible in many rural counties. In the WFO Tallahassee County Warning Area (CWA), all counties have a central dispatch, or 24-hour warning point, for their emergency services. These dispatch centers are typically the initial contacts following severe weather events, to ascertain what damage, if any, occurred. Unfortunately, many of the counties throughout the CWA are rural, and their dispatch centers are frequently only aware of damage if it occurs near locations in their respective county seats. In efforts to enhance communication with the emergency management community, increase forecaster confidence, and improve warning verification, a major overhaul of the CWA contacts database was initiated. Using various web searches and information provided by county emergency managers, a contacts page was created for each county, which consists of telephone numbers of law enforcement agencies, road and highway departments, utility companies, and SKYWARN spotters. Accompanying the contacts page was a detailed map of highways, roads, towns, and cities for each county. To ensure the spotter database was accurate for the new verification program, a comprehensive review of all contacts was undertaken. This resulted in many spotters being removed from the active spotter list, primarily due to inaccurate contact data. To recruit new spotters, an online spotter training program
was developed, modeled after several basic spotter training presentations. The training program requires spotters to view a presentation and complete an exam before receiving a certificate of completion. Through this process, a spotter provides contact information to the SKYWARN focal point for inclusion in the contact database. This online training resulted in the addition of 121 spotters to the database between April 2006 and July 2008. The goal of the enhanced verification process is to improve the office’s warning verification statistics, and the overall warning program, by utilizing additional local and state agencies in the CWA, augmenting verification efforts via telephone, and conducting additional damage assessments. To facilitate this objective, an integrative approach is used during each severe weather episode. After a warning is issued, one or more counties are contacted within 10 to 30 minutes of the issuance time to solicit damage reports. Important ground truth reports are conveyed to the warning forecaster. Other sources of ground truth include emergency managers via 800-MHz two-way radio communications, as well as media partners via instant messaging. All calls and reports for warned and unwarned storms are recorded on a severe weather event log, which serves as a reference for future shifts or use during the post event analysis. Follow-up calls are typically made, and sometimes passed on to the next shift to accomplish. To demonstrate the success of the new verification program, the period of record was from July 2004 to September 2007 for all county-based warnings.
Page10
Continued on next page…

Spring IssuePeak Performance
Page11
Recent Improvements to the Verification of Convective Warnings at WFO Tallahassee- Continued from Page 10 Severe thunderstorm and tornado warnings were only verified by confirmed events meeting NWS warning criteria and occurring within the valid periods and counties represented by the warnings. Effective October 1, 2007, WFO Tallahassee began issuing storm-based warnings, which are specifically limited to storms affecting portions of counties, thereby minimizing the impacts on residents outside the
threatened areas. The results of the refined warning verification program were a significant increase in thenumber of warnings issued, events warned, and lower False Alarm Ratio (FAR). To review entire white paper, visit the Performance Management Website at: https://verification.nws.noaa.gov/content/pm/pubs/article/pdf/improvements.pdf
By Amanda Graning, WFO Duluth, Minnesota In June 2007, an eager college student, Matt Taraldsen, (who had just finished his first year at Saint Cloud State University [SCSU] and had a passion for the weather), walked into the National Weather Service (NWS) forecast office in Duluth, MN ready to gain experience and volunteer his time for the summer. He sat down with forecaster Amanda Graning to discuss his career goals, and review a list of projects she kept on hand for students. One project idea, in particular, surfaced that intrigued Matt. This was a project that had blossomed over the past few years while Amanda continued her participation in the Weather and Society*Integrated Studies (WAS*IS) initiative. Website address: http://www.sip.ucar.edu/wasis/ The idea was to develop a short post–event online survey, later to be named the Post Storm Survey (PSS), in an effort to understand how critical winter weather information from the NWS in the form of forecasts, statements, and warnings can better meet the needs of our customers by effectively and accurately conveying a consistent and believable message. By receiving local customer input and becoming familiar with their decision-making process related to hazardous winter weather, NWS forecasters will ultimately be able to craft and issue products that are more effective and salient through enhanced communication.
A team of project partners was established to ensure the survey was scientifically sound and capable of measuring how the public interprets and reacts to critical winter weather information contained in NWS products, web pages, and other sources of available weather information. The team included staff from the NWS Duluth Weather Forecast Office (WFO), professors and researchers at SCSU - ranging across departments from earth science, sociology, statistics and communication, to other members of the WAS*IS community, including societal studies experts and those with surveying experience. After the survey design was complete, work was done to contact broadcast and print media, the Minnesota State Climatologist, and surrounding NWS WFOs to publicize and link to the survey on their respective websites. One unique aspect of the survey was the goal to attract respondents from the broad weather community, and not focus solely on the NWS. Matt’s role was critical in establishing a firm partnership with SCSU, which agreed to sponsor the web-based survey (Figure 1). The team drafted a project proposal that Matt and his advisor, Dr. Anthony Hanson, presented to the University Review Board for approval. It was vital to have the PSS homepage on a university (.edu) website that NWS
Continued on next page…
An Innovative Partnership to Help Improve Dissemination And Customer Use of Critical Weather Information

Peak Performance Spring IssueAn Innovative Partnership to Help Improve Dissemination…… - Continued from Page 11 WFOs could use as a jump page linking to the survey following winter weather events. Since the PSS inception in March 2008, numerous other agencies have joined the project by advertising or posting links to the survey after a winter weather event, including the Minnesota Department of Homeland Security and Emergency Management, Minnesota Public Radio, Minneapolis Star Tribune, StarTribune.com, and the Duluth News Tribune. NWS WFOs that actively participate in the PSS project include Duluth, MN; Twin Cities/Chanhassen, MN; Grand Forks, ND; LaCrosse, WI; Des Moines, IA; and Aberdeen, SD. The complicated nature of a project having large inter-disciplinary and multi-agency participation led to an enormous communications challenge. In order to have a more successful project, a forum was needed to foster strong relationships with both colleagues and the local community. In addition, a central location where anyone could give suggestions, post related topics and articles, sound concerns or comments was desired. The solution became Facebook. A Post Storm Survey group was developed where anyone with a Facebook account could join. Through this vehicle Amanda and Matt have been able to post the latest PSS preliminary results, publicize the PSS, answer questions that arise, and best of all, gain feedback from otherwise closed off or hard to reach resources. As of April 2009, the PSS Facebook group had 67 members that ranged from project partners, various university students and faculty, NWS personnel, those involved/interested in the WAS*IS initiatives, and the general public who have taken the PSS and are interested in the results. Website address: http://www.facebook.com/home.php#/group.php?gid=18181923660&ref=ts
Page12
Figure 1: Matt’s role was critical in establishing a firm partnership with St. Cloud State University, which agreed to sponsor the web-based Post Storm Survey.
During the winter season of 2008-2009, more than 2,700 survey responses were received, and preliminary results have already yielded useful information. For instance, initial findings revealed that majority (52%) of respondents stated they altered their regular daily routine during the winter event because of concerns about road conditions/travel; second only to 19% who cited meteorological terminology, such as heavy snow, sleet or freezing rain, as reason for altering their daily routine. More respondents stated they changed travel plans if a storm occurred during the week, rather than on a weekend. When asked if they felt the storm was typical, most respondents selected “Yes” for each of the events. In addition, although there is a known bias in web-based surveys, respondents did not significantly change the source (NWS webpages, local TV, friends/family, etc.) of their weather information during a winter storm as compared to where they typically sought weather information on a regular basis. The survey findings will help forecasters better communicate the threat of hazardous weather – a cornerstone of the National Weather Service mission. Amanda has put together a slideshow presentation of the survey questions, preliminary results and conclusions that can be viewed at http://www.crh.noaa.gov/Image/dlh/slideshows/PSS_results.pdf The PSS will continue through spring of 2010 when Matt is prepared to graduate. Results from winter of 2008-2009 will be presented by Amanda and Matt at various symposia and conferences this fall.

Spring IssuePeak Performance
On the Road Again...
Traveling in winter always seems to lead to some sort of unexpected adventure. Flight delays, unscheduled overnights in airports, and missed connections always seem to be the name of the game. For that reason, I try to make all of my winter season travel to destinations in the southern part of the United States. If you are going to be stuck somewhere, you might as well get stuck where you can wear shorts! Phoenix, AZ Almost as soon as 2008 was over and it had become 2009, I headed off to Phoenix, AZ for the annual American Meteorological Society (AMS) meeting. This year was different for me though regarding the meeting. Instead of working the exhibition floor, attending presentation sessions, and other work related activities, I only had one thing to do. I was only there to make sure the 2009 WeatherFest event was the most successful WeatherFest to date. For those who are not familiar with the event, WeatherFest is an interactive science and weather fair that is open to the public and free to attend. Its mission is to instill a love for math and science in children of all ages and to spark a young person’s interest in this area so they may consider a career in these and other science and engineering fields. This year, WeatherFest drew nearly 3,000 attendees to the Phoenix Convention Center for the event. My role at this event was to manage the volunteers who generously donate their time to make this such a successful event. Luckily this year I had around 35 volunteers who helped pull this event off without a hitch! Volunteers came from all over the weather enterprise including the National Weather Service, private industry, educational institutions, the local AMS chapter, and some private citizens wanting to lend a hand.
By Brent MacAloney, NWS Headquarters
Page 13
I think I can speak on behalf of the volunteers in saying that working this event is absolutely awesome, extremely gratifying, and downright exhausting! It was a good thing I had the rest of the week to take some leave and relax while spending time with my family in the Phoenix area. The weather was great too—pretty much the upper 70s and 80s the whole time I was there—a total bonus! Albuquerque, NM The end of February had me on a great trip to Albuquerque, NM (ABQ) to conduct a Storm Data / Performance Management workshop with the local office employees, as well as attendees from 4 surrounding offices (Phoenix, Lubbock, Amarillo, and El Paso). ABQ Meteorologist in Charge, Shawn Bennett, had been trying to get me out to Albuquerque for quite some time. For one reason or another, the visit kept getting pushed off. So, I was real pleased that I was finally able to visit the office and help work with the staff to better understand how the tools on the Performance Management website can be used to monitor and improve office forecast and warning performance. The meeting was absolutely awesome. We met in a beautiful room at the Albuquerque International Sunport (Figure 1) with a great turnout of almost 20 people. As usual, there were numerous basic questions regarding verification, how warnings and forecasts are imported for the purpose of monitoring performance, and several “what if” scenarios.
Continued on next page…
“I must say, the National Severe
Weather Workshop is one of the best run weather workshops
out there!”
Peak Performance Spring IssueOn the Road Again- Continued from Page 13
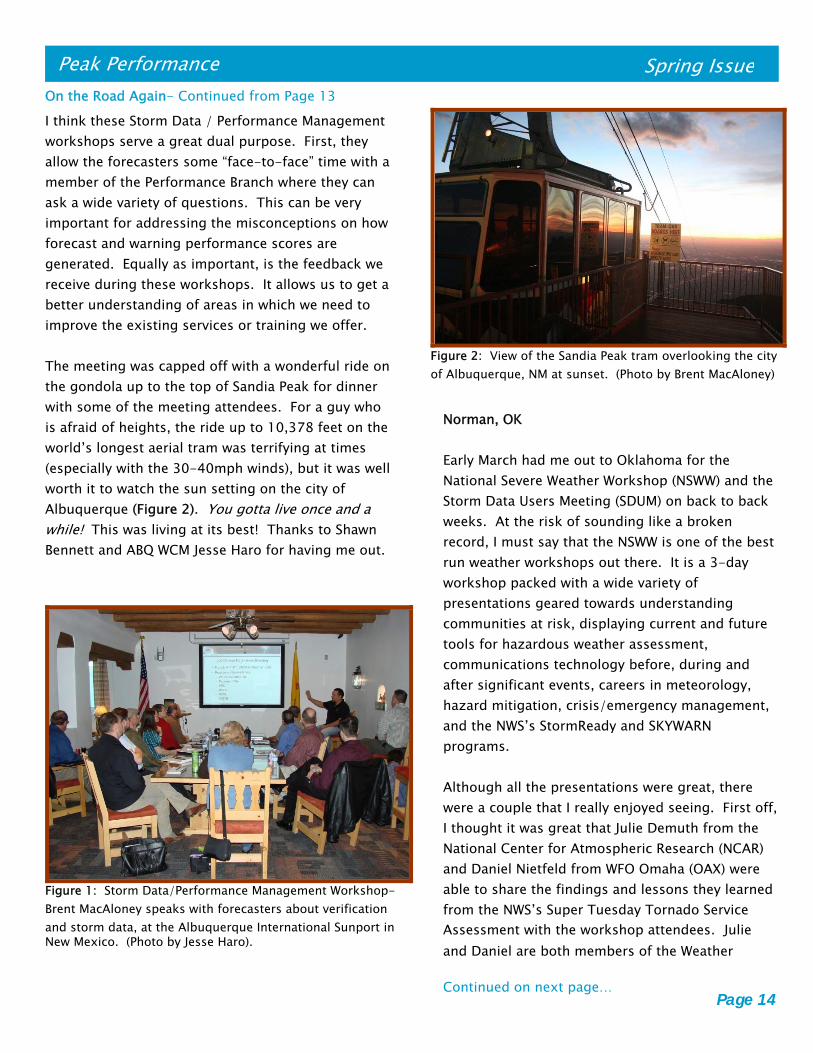
I think these Storm Data / Performance Management workshops serve a great dual purpose. First, they allow the forecasters some “face-to-face” time with a member of the Performance Branch where they can ask a wide variety of questions. This can be very important for addressing the misconceptions on how forecast and warning performance scores are generated. Equally as important, is the feedback we receive during these workshops. It allows us to get a better understanding of areas in which we need to improve the existing services or training we offer. The meeting was capped off with a wonderful ride on the gondola up to the top of Sandia Peak for dinner with some of the meeting attendees. For a guy who is afraid of heights, the ride up to 10,378 feet on the world’s longest aerial tram was terrifying at times (especially with the 30-40mph winds), but it was well worth it to watch the sun setting on the city of Albuquerque (Figure 2). You gotta live once and a while! This was living at its best! Thanks to Shawn Bennett and ABQ WCM Jesse Haro for having me out.
Page 14
Continued on next page…
Figure 2: View of the Sandia Peak tram overlooking the city of Albuquerque, NM at sunset. (Photo by Brent MacAloney)
Figure 1: Storm Data/Performance Management Workshop- Brent MacAloney speaks with forecasters about verification and storm data, at the Albuquerque International Sunport in New Mexico. (Photo by Jesse Haro).
Norman, OK Early March had me out to Oklahoma for the National Severe Weather Workshop (NSWW) and the Storm Data Users Meeting (SDUM) on back to back weeks. At the risk of sounding like a broken record, I must say that the NSWW is one of the best run weather workshops out there. It is a 3-day workshop packed with a wide variety of presentations geared towards understanding communities at risk, displaying current and future tools for hazardous weather assessment, communications technology before, during and after significant events, careers in meteorology, hazard mitigation, crisis/emergency management, and the NWS’s StormReady and SKYWARN programs. Although all the presentations were great, there were a couple that I really enjoyed seeing. First off, I thought it was great that Julie Demuth from the National Center for Atmospheric Research (NCAR) and Daniel Nietfeld from WFO Omaha (OAX) were able to share the findings and lessons they learned from the NWS’s Super Tuesday Tornado Service Assessment with the workshop attendees. Julie and Daniel are both members of the Weather

Spring IssuePeak Performance
On the Road Again- Continued from Page 14 and Society * Integrated Studies (WAS*IS) group, so they were able to bring some experience in looking at societal impacts to the service assessment team. This is a huge step in the right direction for the NWS in assessing its performance in high impact events. I also really enjoyed the presentation given by Jon Zeitler from WFO Austin/San Antonio (EWX). The presentation was called “A Constitution for Personal Flood Safety,” and it was probably one of the best presentations I have ever seen given. Using words from the United States Constitution like “establish justice,” “ensure domestic tranquility,” “provide for common defense, “promote general welfare,” and “secure the blessings of Liberty,” he was extremely effective in getting the audience to think about flood safety and the role they play in keeping people safe and not putting others in harms way due to their actions. For more information on the NSWW and the presentations that were given, please visit the website located at: http://www.norman.noaa.gov/nsww2009/ After the NSWW was over, I had a day of rest before the Storm Data Users Meeting. A group of us took the opportunity to venture out to the Wichita Mountains of Oklahoma for some hiking and rock climbing. Yes I know that the words “mountains” and “Oklahoma” are rarely used in the same sentence, but believe it or not there are actually “hills” there in Oklahoma that the locals can consider mountains. Needless to say, it was a beautiful day hike that I really enjoyed. I even saw some buffalo out there!
Just can’t wait to get back on the
road again!
Page 15
March 9th and 10th were the days the Storm Data Users Meeting was held. There were many great ideas and information that came out of that meeting, which I could never summarize in the “On the Road Again” section of the newsletter. Please go to page 5 for a separate article I wrote on this topic. As for where I’m off to in the future, good question. I’m not sure right now. Oklahoma took a lot out of me and it took me awhile to recover from a bad ear infection that kept me grounded. I’m sure I’ll be able to sneak in a trip or two to write about in the next issue. Until then, take care and enjoy whatever travels you have scheduled! Cheers! Brent
USING FEEDBACK THAT WORKS!
“When performance is measured, performance improves. When
performance is measured and reported back, the rate of improvement
accelerates.”

Peak Performance Spring Issue
Wayne’s W rld
By Wayne Presnell, NWS Headquarters
The much anticipated NWS Service Assessment report, “Super Tuesday Tornado Outbreak of February 5-6, 2008” was officially released on March 9, 2009. This report was highly anticipated because the event was one of the largest tornado outbreaks in recorded history and it is the first time the NWS has analyzed the societal impacts of NWS products and services in a Service Assessment report. The event began during the afternoon of February 5, 2008, while many states were holding Presidential primary elections (Super Tuesday), and continued into the early morning of February 6. Eighty-seven tornadoes occurred in nine states causing 57 fatalities in Arkansas, Tennessee, Kentucky, and Alabama during a 12 hour period. There were five violent Enhanced Fujita (EF) Scale 4 tornadoes: two each in Tennessee and Alabama, and one in Arkansas. The EF4 tornado in Arkansas had a 122-mile continuous damage path. A 158 mph wind gust was observed along the path of this tornado at a home weather station in Zion, Arkansas. An EF3 tornado caused a 51-mile path of destruction from just northeast of Nashville, Tennessee northeast toward the Kentucky border and claimed 22 lives. This is the deadliest tornado in the United States since a tornado in Evansville, Indiana, November 2005, killed 25 people. Early damage estimates were $520 million. This tornado outbreak in the Mid-South and Tennessee Valley caused nearly half of the total
tornado related fatalities in the United States in 2008. There were 57 fatalities during this event (126 total in the U.S. for 2008); the second most in February on record and the largest tornado fatality total since May 31, 1985 (official tornado database begins in 1950). This event also highlights a trend of tornado fatalities over the last 10 years. During the period 1999-2008, Tennessee has had the most tornado related fatalities, 110, and in this event, Tennessee had the most with 31. There were 14 fatalities in Arkansas, 7 in Kentucky, and 5 in Alabama during this event. Another trend exemplified by this tornado outbreak is an increase in tornado fatalities, especially during the winter season, across the Mid-South portion of the country. During the period 1950-2004, most of the tornado fatalities in the United States occurred in an area roughly from Little Rock, Arkansas, to Memphis, Tennessee, to Tupelo, Mississippi, to Birmingham, Alabama. Western Kentucky, western Georgia, and southeastern Missouri are also areas with a high frequency of tornado related fatalities (most occurred during the winter season) during the period 1950-2004. This tornado outbreak was anticipated and forecast days in advance by the NWS. Local Weather Forecast Offices and the Storm Prediction Center (SPC) issued forecast products as much as four days in advance advising of the potential for a widespread tornado outbreak. All of the tornado fatalities occurred within the boundaries of NWS
Super Tuesday Tornado Outbreak Service Assessment Report Released
Page 16
Continued on next page…

Spring IssuePeak Performance
Page17
Super Tuesday Tornado Outbreak Service Assessment Report Released- Continued from Page 16
NWS performance.
• Sixty-three percent of the fatalities in this event occurred in manufactured homes.
• Most of the fatalities in this event occurred at night.
• Most of the areas affected by the deadly tornadoes were heavily forested.
• Over 50 percent of the people interviewed acknowledged that they associate tornado outbreaks with the springtime or summer months. This caused many of them to minimize the threat of this early February outbreak because of their perception that it was too early in the year and outside the “traditional” tornado season.
• Many people interviewed required multiple sources of information throughout their decision making process to assess their personal risk, and a single source of information did not necessarily spur protective action.
• Most of the victims did not have a safe shelter, such as a basement, storm cellar, or safe room, available.
The NWS plans to continue gathering societal impacts information in future Service Assessment reports. The NWS will use this type of information to improve its severe weather products and services; allowing users to make better decisions regarding their safety. Go to: http://www.weather.gov/os/assessments/pdfs/super_tuesday.pdf to view the entire report.
tornado watches and were preceded by NWS tornado warnings. The average SPC tornado watch lead time to the first tornado within the watch was 2 hours. The mean lead time for tornado warnings covering fatalities was 17 minutes. The 2008 Government Performance Results Act (GPRA) goal for tornado warning lead time was 11 minutes. There were several success stories during this event. Parts of Union University in Jackson, Tennessee were devastated by an EF4 tornado, including some of the dormitories, but due to excellent planning and preparedness efforts, there were no fatalities. A tornado struck a high school in Muhlenberg County, Kentucky during a basketball game and due to a good shelter-in-place plan, there were no fatalities. Schools were dismissed in the Memphis City school district early Tuesday afternoon. Normally, buses would have been on the road when tornadoes struck the Memphis area around 5:30 p.m. Central Standard Time if schools had not been let out early. The previous information indicates the NWS performance before and during this event was excellent. Still, a nagging question lingers, ‘why were there so many fatalities when the NWS performance was so good?’ This report attempted to answer that question.
The findings in the report indicated six important factors on why there were so many fatalities during this tornado outbreak despite an overall excellent

Peak Performance Spring Issue
Amanda Graning WFO Duluth, Minnesota [email protected] Michael A. Jamski WFO Tallahassee [email protected] Chuck Kluepfel Performance Branch Verification [email protected] Brent MacAloney Performance Branch Verification [email protected] Dr. Burrell Montz Social Scientist Chair of Geography at Binghamton University [email protected] Dave Myrick Western Region Headquarters Scientific Services Division [email protected] Ken Pomeroy Western Region Headquarters Scientific Services Division [email protected]
Web Links Stats on Demand https://verification.nws.noaa.gov NDFD Verification: https://apps.weather.gov/ndfd-stats/verification/index.htm Real-Time Forecast System: http://www-ad.fsl.noaa.gov/fvb/rtvs/
Page 18
Wayne Presnell Staff Meteorologist Marine Services Branch [email protected]
Jim Rawls Performance Branch Information Technology Specialist [email protected] Freda Walters, Co-Editor and Designer Performance Branch Service Assessment [email protected] Doug Young, Editor Performance Branch Chief [email protected]
CCoonnttrriibbuuttoorrss ttoo tthhiiss SSpprriinngg IIssssuuee iinncclluuddee……
Please consider contributing to our next edition-- Summer 2009
Questions and comments on this publication should be directed to Freda Walters.