Embed Size (px)
Citation preview
Improving Methods for Estimating Livestock
Production and Productivity
Literature Review
Technical Report Series GO-11-2016
April 2016
Improving Methods for Estimating Livestock
Production and Productivity
Literature Review

Drafted By
Dr Jonathan Moss
Dr Philip Morley
Professor Derek Baker
Mr Hussain Al-Moadhen
Miss Rebecca Downie
and
University of New England

Table of contents
Acronyms and Abbreviations……………………………………………………………………………. 5 List of concepts and definition………………………………………………………………………….. 7 Summary………………………………………………………………………………………………………….. 9 1. Livestock in the agricultural statistical system………………………………………………. 11 1.1. Core data and indicators……………………………………………………………………. 12 1.2. The integrated survey framework………………………………………………………. 14 1.3. Available data collection methods……………………………………………………… 16 1.4. Livestock data issues………………………………………………………………………….. 19 2. Livestock production and productivity in the agricultural statistics system…… 23 2.1. Key indicators used……………………………………………………………………………. 23 2.2. Key data underpinning the indicators………………………………………………… 24 2.3. Key surveys for generating livestock production indicators……………….. 29 2.4. Livestock data issues when measuring production and productivity….. 40 3. Pilot country experiences …………………………………………………………………………….. 43 3.1. The country statistical system……………………………………………………………. 43 3.2. Livestock data collected and indicators generated…………………………….. 44 3.3. Relevant issues…………………………………………………………………………………… 55 3.4. Possible improvements………………………………………………………………………. 60 4. Lessons learned and recommendations……………………………………………………….. 65
4.1. Integrated survey framework: step required……………………………………. 65 4.2. Progress towards elements of the integrated framework: lessons learned……………………………………………………………………………………………. 65 4.3. Key conclusions on testing livestock data collection methods and tools………………………………………………………………………………………………… 67 References……………………………………………………………………………………………………….. 69

5
Acronyms and Abbreviations
ABARES Australian Bureau of Agricultural and Resource Economics and Sciences
ABS Australian Bureau of Statistics
AfDB African Development Bank
AMIS Agricultural Market Information System
BPS Badan Pusat Statistik (Indonesia)
CBS Central Bureau of Statistics (Indonesia)
CPI Consumer Price Index
CSA Central Statistical Agency (Ethiopia)
CSO Central Statistics Office (Botswana)
DAHP Department of Animal Health and Production (Botswana)
DCIAS Data Center and Agricultural Information System (Indonesia)
DEFRA Department of Environment, Food and Rural Affairs (United Kingdom)
DGLAH Directorate General of Livestock and Animal Health (Indonesia)
EAs Enumeration Areas
EER Establishment and Enterprise Register
EU European Union
FAO Food and Agriculture Organization
FEAST Feed Assessment Tool
GDP Gross Domestic Product
GPS Global Positioning Service
IAEA International Atomic Energy Agency (Austria)
ICR Intelligent Character Recognition
IDEAL Infectious Diseases of East African Livestock
iSIKHNAS Integrated Sistem Informasi Kesehatan Hewan Nasional (Indonesia)
LDIA Livestock Data Innovation in Africa
LSMS Living Standards Measurement Studies
MAFF Ministry of Agriculture, Forestry and Fisheries (Japan)
MLA Meat and Livestock Australia
MSF Master Sampling Frame
NASS National Agricultural Statistics Service (USA)
NBS National Bureau of Statistics (Tanzania)
NDVI Normalised Difference Vegetation Index
NSS National Statistical Service (Australia)
OCGS Office of Chief Government Statistician (Tanzania)
ODK Open Data Kit
OECD Organisation for Economic Co-operation and Development
PMO-RALG Prime Minister's Office – Regional Administration and Local Governments (Tanzania)
PSU Primary Sampling Unit
SMS Small Message Service

6
TGLP Tribal Grazing Land Plot
USAID United States Agency for International Development
USDA United States Department of Agriculture
VAT Value-Added Tax

7
List of concepts and
definitions
Core livestock
indicators
Livestock indicators required by a country on a regular basis to
properly fulfil its mandated reporting requirements (Sserugga et al.,
2013), such as those required to generate GDP and CPI estimates.
Impact indicator Indicators that provide a measure of the effects of an outcome wider
than the direct and immediate results (Pica-Ciamarra et al., 2014, p.
28). These include both positive and negative effects (Halberg et
al., 2005) and encompasses indicators such as those that capture the
impact of different production systems on the livelihood of the poor
(Dorward et al., 2004).
Input indicator Measures of the quantity (and sometimes the quality) of resources
input into a system.
Master Sampling
Frame (MSF)
A frame that enables selection of different samples (including from
different sampling designs) for specific purposes, e.g. agricultural
surveys, household surveys, and farm management surveys. The
MSF’s distinguishing feature is that it enables samples to be drawn
for several different surveys or different rounds of the same survey,
which makes it possible to avoid building an ad hoc frame for each
survey (or round thereof). In the context of the Global Strategy, an
MSF is a frame or a combination of frames that covers the
population of interest in its entirety, and that enables the linkage of
the farm as an economic unit to the household as a social unit and
both of these to the land as an environmental unit. MSFs are
designed to enable the integration of agriculture into national
statistical systems by establishing a closer link between the results
of different statistical processes and units. (GSARS, 2015)

8
Multiple-frame
approach
Approach based on multiple sampling frames. In the context of
agriculture, this includes the joint use of area and list sampling
frames. The frames are usually not independent of one another;
some of the frame units in one frame may be present in another.
(GSARS, 2015)
Outcome indicator Measures of the broader quantity and quality of results achieved as
a result of the provision of different goods and services. An
example could be the degree that a certain livestock disease has
decreased due to an intervention.
Output indicator Indicators that measure the quantity (and sometimes the quality) of
the outputs generated through the use of inputs.
Area Sampling Frame A set of land elements, which may be either points or segments of
land. The sampling process may involve a single stage or multiple
stages. In most agricultural area frame surveys, the sampling unit is
associated with a holding. (GSARS, 2015)
9
Summary
Timely and accurate data is critically important for the development of food
security programs, agricultural development, poverty reduction policies,
investment strategies and natural disaster responses. A global assessment of
agricultural data found that there has been a decline in both the quantity and
quality of agricultural statistics (World Bank, FAO and UN, 2010). While it
would not be practical (and certainly not economically optimal) for countries to
obtain complete information on agricultural systems from surveys, the
assessment found that many developing countries did not have the capacity to
collect and disseminate even the rudimentary set of agricultural data required to
monitor national trends or to inform international development discussions. The
assessment noted that it is imperative that national agricultural systems move
towards a systematic collection that could enable reliable statistics to be
reported.
Given the often heterogeneous nature of agricultural enterprises, many
recognized difficulties surround the collection of statistics for agriculture.
Collection of data from the livestock section of this industry presents additional
complexities, such as dynamic herd structures and, sometimes, non-sedentary
populations. However, applying an appropriate framework to collect relevant
and high-priority information while avoiding multiple or non-standardized
collection of data by different government agencies has been recognized as an
effective method that can assist in the design and implementation of policies to
promote sustainable livestock sectors (Pica-Ciamarra et al., 2014, p. 29).
The most fundamental item of any statistical data collection of a country’s
livestock is the current number of livestock (FAO, 2005, p. 95; Nsiima et al.,
2013b). The World Bank, FAO and UN (2010, p. 14) have outlined the core
species for which key indicators should be collected, and emphasize that the
five livestock species of cattle, sheep, pigs, goats and poultry account for over
99 per cent of the meat, milk and eggs produced globally (Pica-Ciamarra et al.
2014, p. 12). Although various factors influence satisfaction with the
information collected for these indicators, a systematic approach to the
information and its collection is clearly lacking.
While numerous problems and difficulties may be encountered in the collection
of livestock data, the key problematic subjects cited within this Literature
Review include the capture of data from transhumant populations (of people

10
and animals), inability to identify individual animals, and logistic- and
technological-type problems of data recording and transmission within
reasonable time frames. These topics refer primarily to national-level data, but
a supporting set of difficulties are identified which refer to farm- and enterprise-
level data and efforts by various government entities to establish measures of
performance and associated benchmarks for use in extension and related work.
These include, but are not limited to, reliance on faulty recall, choice of survey
respondent within households, lack of training of enumerators, lack of
standardization of methods and formats, and outdated technical coefficients.
As livestock data is usually a resource-poor activity, the elimination of the
widely reported duplication of collection as part of this framework should be a
priority. Further considerations relating to quality in data collection include
timeliness and punctuality, completeness, comparability and coherence,
accuracy, relevance and reliability. Ideally, the statistical system will also
provide the framework to store and aggregate the livestock data collected, and
to disseminate results and indicators on a timely basis.

11
1
Livestock in the agricultural
statistical system
Timely and accurate agricultural data is of critical importance to numerous
government and non-government stakeholders for the development of food
security programs, agricultural development and poverty reduction policies,
investment strategies, and natural disaster planning and responses. A global
assessment of agricultural data has found that there has been a decline in both
the quantity and quality of agricultural statistics (World Bank, FAO and UN,
2010). While it would not be practical (and certainly not economically optimal)
for countries to obtain complete information on agricultural systems from
surveys, the assessment found that many developing countries did not have the
capacity to collect and disseminate even the rudimentary set of agricultural data
required to monitor national trends or to inform international development
discussions. The assessment noted that it is imperative that national agricultural
systems move towards a systematic collection to report reliable statistics.
It is widely argued that livestock production is underrepresented in GDP
estimates of African nations due to a range of issues. Behnke and Metaferia
(2011) found that livestock production is frequently underrepresented in the
GDP estimates for Ethiopia due to issues associated with deficiencies in data,
data estimation techniques and the conventional rules used as part of the
national accounting system.
Given the often heterogeneous nature of agricultural enterprises, there are many
recognized difficulties surrounding the collection of statistics for agriculture.
Collection of data from the livestock section of this industry presents additional
complexities, such as dynamic herd structures and sometimes non-sedentary
populations. However, applying an appropriate framework to collect relevant
and high priority information while avoiding multiple or non-standardized
collection of data by different government agencies has been recognized as an
effective method that can assist in the design and implementation of policies to
promote sustainable livestock sectors (Pica-Ciamarra et al., 2014, p. 29). A
report by The World Bank, FAO and UN (2010) proposes the use of an
integrated survey framework to ensure that adequate data is collected and

12
disseminated in a timely fashion, while at the same time ensuring the quality
and consistency of the collected data.
1.1. Core data and indicators
1.1.1. Variables and indicators
Indicators are required to inform policy- and decision-making, as well as a
range of other purposes for various government agencies, industry boards,
private sector organizations and livestock producers; indeed, indicators provide
baselines and help to specify given objectives. The variables and indicators
necessary, however, depend on the various stakeholders’ requirements. In
addition, the level of representativeness and the timing between data for
variable collection will vary based on the different stakeholder requirements.
To estimate indicators, especially livestock production indicators, the use of
several variables and/or indicators may be necessary (Sserugga et al., 2013).
Given this reliance on several variables, which may be derived from several
sources as part of an integrated survey framework, it is essential that common
statistical standards are applied to ensure consistent naming of variables and
classification systems (FAO, 2014). The generation of many variables that can
be used to produce indicators may require the conversion of collected statistics
to a different unit of measurement using technical conversion factors or
technical coefficients (Nsiima et al., 2013b).
The following procedure for developing relevant livestock indicators was
proposed by Dorward et al. (2004):
1. Identify the stakeholders, both the client (formal organizations involved
in livestock development such as funding agencies, policymakers,
researchers) and the beneficiary groups, and prioritize their interests and
objectives;
2. Determine where clients’ and beneficiaries’ objectives are compatible;
and
3. Based on these objectives, develop indicators that can be gathered with
sufficient accuracy in a timely and cost-effective manner to appraise or
evaluate the objectives of the client and beneficiary groups at a level
that they accept.
As noted by Pica-Ciamarra et al. (2014, p. 11) there are potentially thousands of
livestock indicators that could be generated if all demand from stakeholders
13
could be met. However, budgetary and resource constraints obliges most
countries, especially developing countries, to prioritize the collection of
livestock data and indicators. In recognition of these constraints, the Global
Strategy report by the World Bank, FAO and UN (2010) recommends that
countries develop a minimum set of core data that should be collected to
improve their agricultural statistical systems. The core livestock data and
indicators are discussed in Section 1.1.2. below.
1.1.2. Core livestock indicators
Core data items should be the first items to be included in a country’s statistical
system and the last to be removed due to budgetary constraints, as these items
enter into a number of indicators required for the monitoring and appraisal of
development projects and food security; they also provide inputs for national
and global accounts of supply and demand for food and other agricultural
products (World Bank, FAO and UN, 2010, p. 13).
The most fundamental item of any statistical data collection of a country’s
livestock is the current number of livestock (FAO, 2005, p. 95; Nsiima et al.,
2013b). The World Bank, FAO and UN (2010, p. 14) have outlined five core
livestock species for which key indicators should be collected. These are:
cattle;
sheep;
pigs;
goats; and
poultry.
Pica-Ciamarra et al. (2014, p. 12) emphasize that these items were suggested
due to their significance to global livestock production, and state that these five
categories account for over 99 per cent of the meat, milk and eggs produced
globally.
Core livestock data and indicators that can be used to calculate livestock
production include (FAO, 2005; World Bank, FAO and UN, 2010; Baker et al.,
2013; Sserugga et al., 2013):
current livestock inventory and annual births;
breed of livestock;
type of production system;
number of animals slaughtered and animal off-take;
14
indicators related to production (i.e. total production quantity of meat,
milk, eggs, wool);
trade-related indicators;
price-related indicators;
animal disease-related indicators (i.e. outbreaks of animal disease,
number of animals affected and number of animals at risk); and
available staff and resources for livestock.
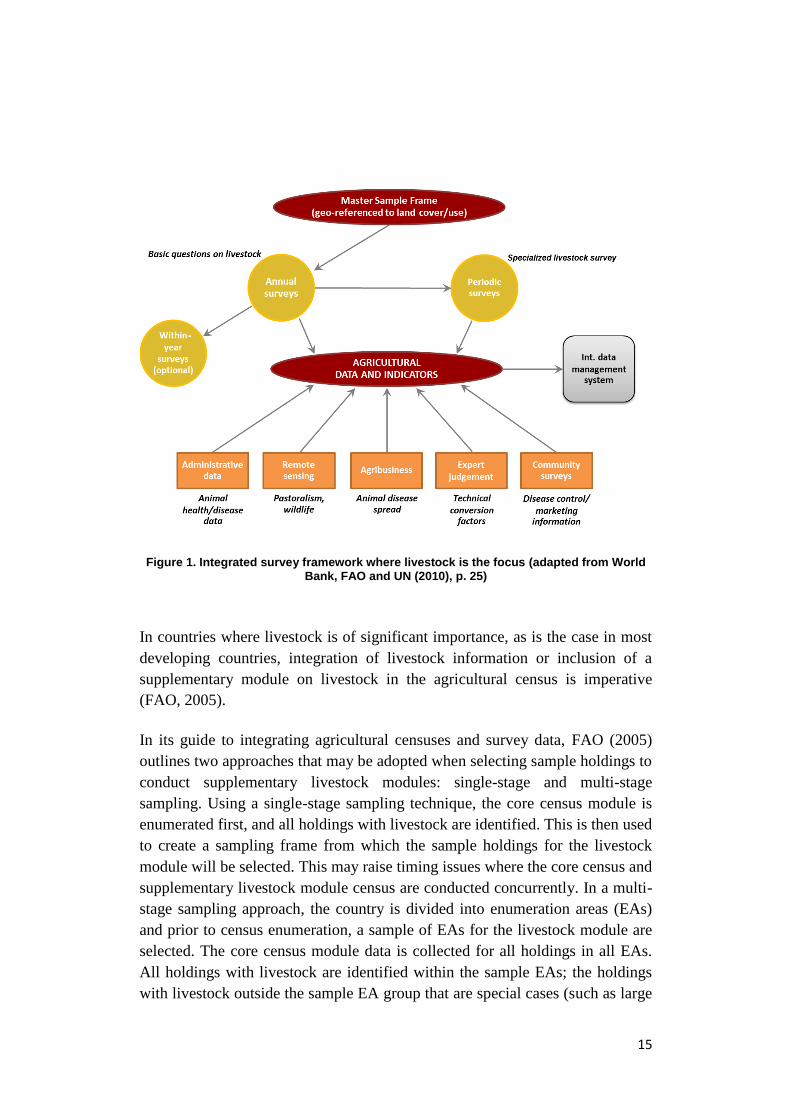
1.2. The integrated survey framework
A review of agricultural livestock collection systems performed by Pica-
Ciamarra et al. (2014) found that no single survey is sufficient to collect even
the most fundamental livestock data to generate reliable estimates of livestock
production and productivity. The authors therefore emphasize the importance of
integrating data from different sources to generate high-quality core livestock
indicators. As numerous government agencies and private organizations often
collect similar data, aggregation of data through an integrated survey
framework can reduce duplication, prevent the release of conflicting statistics,
and ensure that all required data is collected making optimal use of resources. It
is suggested that use of an integrated survey framework will improve data
quality, reduce statistical collection costs and the time burden entailed by
holding constant detailed interviews with respondents, increase the accuracy
and consistency of statistical outputs and enable an improved exploitation of
common tools and analytical methods (FAO, 2014). The World Bank, FAO and
UN (2010) provide a framework for integrating agricultural surveys to increase
the quality of data collection. Pica-Ciamarra et al. (2014) have adapted this with
a specific focus on the collection of livestock production. A schematic diagram
is shown in Figure 1.
15
Figure 1. Integrated survey framework where livestock is the focus (adapted from World Bank, FAO and UN (2010), p. 25)
In countries where livestock is of significant importance, as is the case in most
developing countries, integration of livestock information or inclusion of a
supplementary module on livestock in the agricultural census is imperative
(FAO, 2005).
In its guide to integrating agricultural censuses and survey data, FAO (2005)
outlines two approaches that may be adopted when selecting sample holdings to
conduct supplementary livestock modules: single-stage and multi-stage
sampling. Using a single-stage sampling technique, the core census module is
enumerated first, and all holdings with livestock are identified. This is then used
to create a sampling frame from which the sample holdings for the livestock
module will be selected. This may raise timing issues where the core census and
supplementary livestock module census are conducted concurrently. In a multi-
stage sampling approach, the country is divided into enumeration areas (EAs)
and prior to census enumeration, a sample of EAs for the livestock module are
selected. The core census module data is collected for all holdings in all EAs.
All holdings with livestock are identified within the sample EAs; the holdings
with livestock outside the sample EA group that are special cases (such as large

16
operating units) are also identified. The livestock module is subsequently
applied to all holdings with livestock in the sample EAs and to all special
holdings identified in the non-sample EAs, during core census enumeration.
Sampling is discussed further in Section 0 below.
1.3. Available data collection methods
There are two main data collection methods for estimating livestock production
and productivity (Pica-Ciamarra et al., 2014, p. 60): direct interviews involving
an enumerator visiting a farm or household and asking detailed questions
relating to certain livestock production variables; and visual observations by an
actor (such as an extension officer or market agent) who records variables
relating to livestock production using a semi-structured to structured technique.
A method that is particularly prevalent in developing countries, in which the
majority of livestock is held by a large number of smallholders (as opposed to
the large commercial farms that are commonly found in the developed world) is
that of face-to-face interviews using trained enumerators who administer a set
of formal questions (World Bank, 2012). Section 1.3.1 outlines some possible
methods of collecting and recording livestock production and productivity data.
1.3.1. Methods of data collection and recording
Interviews that are face-to-face and based on set questionnaires;
Interviews conducted on the telephone on the basis of set
questionnaires. While also used as a stand-alone technique, this
collection method is often applied to follow up or to clarify data
collected from previous paper-based surveys;
Mail-out/mail-back paper-based questionnaires. This technique is
commonly favoured, especially in developed countries, where clearly
defined livestock-producing companies can be surveyed at a relatively
low cost;
Web-based survey and data collection forms (Ladner et al., 2000;
NASS, 2009a, 2009e, 2013b). While this technique is often offered
alongside mail-out/mail-back paper-based surveys in developed
countries, the uptake rate of this collection technique by livestock
holders has generally been low (USDA, 2011; Tobin et al., 2012; ABS,
2014b). On the other hand, recording livestock slaughter data
electronically, especially by government inspectors is commonly
employed in developed countries (NASS, 2009d, 2009e);

17
Physically measuring production indicators, such as carcass weight in
abattoirs;
Use of tablets and smartphones (Dillon, 2012; Mille et al., 2015),
especially those equipped with GPS tracking to collect data, have
shown significant potential in reducing the period of time between data
collection and dissemination while also improving data quality (World
Bank, FAO and UN, 2010, p. 20). An account of field data collection
using mobile devices by Mr Absolomon Kihara (ILRI) is provided in
Box 1.
Box 1. Livestock data collection using ODK systems. Account by Mr Absolomon Kihara,
ILRI (paraphrased)
The movement away from paper-based data collection to Open Data Kit (ODK) systems on mobile devices in recent years has streamlined the process of data enumeration and aggregation. The benefits of ODK are numerous; however, there are also certain drawbacks to this type of data collection, in particular having regard to the practical applications of technology in developing countries and rural areas such as those of the pilot countries.
Digital data collection through the use of ODKs provides efficiency at every level of data use, including that of farmers, collectors and analysts, and through to data users. ODKs provide a platform for efficient data collection, collation and analysis without having to involve external facilitators. ODKs are free, easy to use, and can run on any system; in addition, the collector has full control of the entire data collection process and the subsequent use of the material. Data collectors can design their own forms and spreadsheets, which are then made available on the ODK network. These forms and spreadsheets be designed to collect data not only in numerical form, but also to compile data in multiple formats, such as GPS, barcoding, images and audio.
During the GAP analysis, several relevant areas of weakness within the current data systems in the project pilot countries were identified. These include the time delay in providing feedback to farmers on the data they provided to the enumerators. Through the use of ODK software, this temporal delay between data collection and information output to farmers can be drastically reduced. Receiving useful feedback almost immediately is both an incentive for farmers to provide quality data and a rationale on which to base their management decisions to ultimately boost livestock productivity.
An example of ODK application in the field is the development of the Ng’ombe Planner. This is a form of ODK software designed to be compatible with any form of mobile telephone, on which farmers can record daily productive measurements of their dairy cattle. The template was set up with a personalized recording system on which farmers could record their own animal-specific data on milk yield, feed intake and even the occurrence of dip and spray treatments. The Ng’ombe Planner trial was run for seven months. For the first 3.5 months, no feedback was supplied to the farmers on their data inputs and information only flowed in one direction. In the second 3.5 months, the farmer participants were sent personalized notifications or reminders via their mobile phone if they failed to log an activity. They also had access to summarized information of their activity logs to date and were sent sporadic industry-relevant notifications, such as on disease outbreaks. An interesting observation from this trial was that although the activity on the ODK was initially high, with many farmer participants logging activities, this diminished quickly as the first 3.5 months progressed. However, on entry
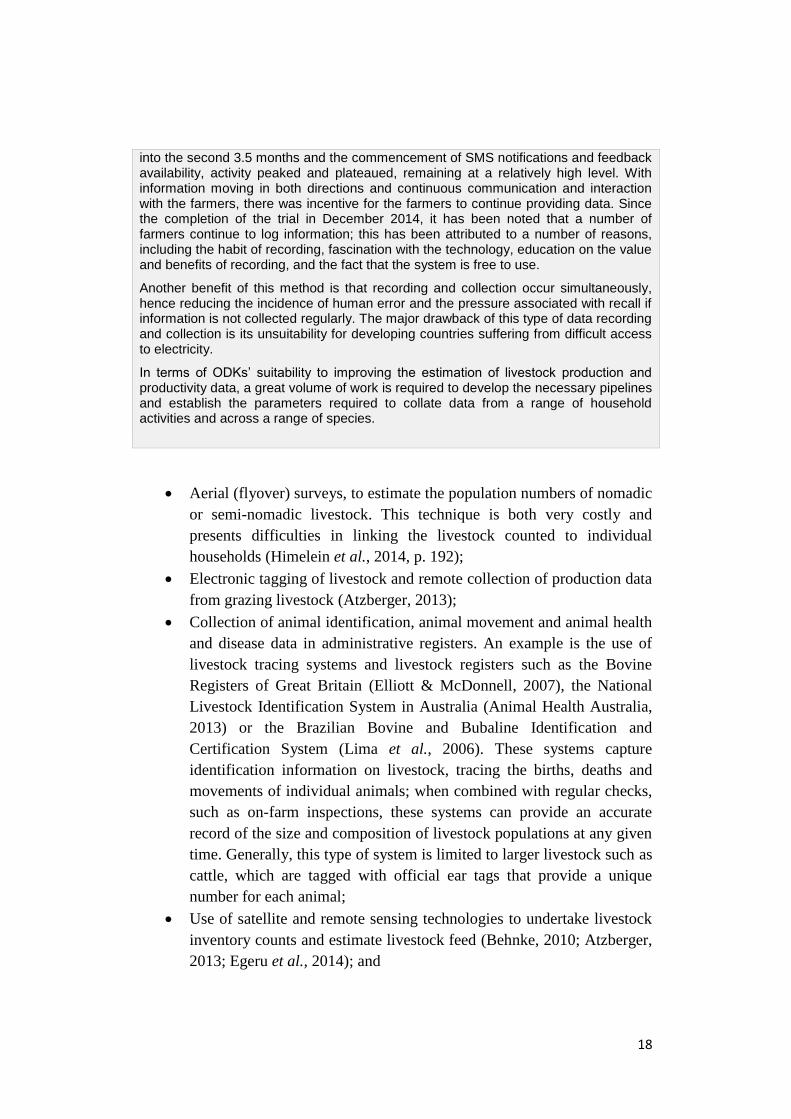
18
into the second 3.5 months and the commencement of SMS notifications and feedback availability, activity peaked and plateaued, remaining at a relatively high level. With information moving in both directions and continuous communication and interaction with the farmers, there was incentive for the farmers to continue providing data. Since the completion of the trial in December 2014, it has been noted that a number of farmers continue to log information; this has been attributed to a number of reasons, including the habit of recording, fascination with the technology, education on the value and benefits of recording, and the fact that the system is free to use.
Another benefit of this method is that recording and collection occur simultaneously, hence reducing the incidence of human error and the pressure associated with recall if information is not collected regularly. The major drawback of this type of data recording and collection is its unsuitability for developing countries suffering from difficult access to electricity.
In terms of ODKs’ suitability to improving the estimation of livestock production and productivity data, a great volume of work is required to develop the necessary pipelines and establish the parameters required to collate data from a range of household activities and across a range of species.
Aerial (flyover) surveys, to estimate the population numbers of nomadic
or semi-nomadic livestock. This technique is both very costly and
presents difficulties in linking the livestock counted to individual
households (Himelein et al., 2014, p. 192);
Electronic tagging of livestock and remote collection of production data
from grazing livestock (Atzberger, 2013);
Collection of animal identification, animal movement and animal health
and disease data in administrative registers. An example is the use of
livestock tracing systems and livestock registers such as the Bovine
Registers of Great Britain (Elliott & McDonnell, 2007), the National
Livestock Identification System in Australia (Animal Health Australia,
2013) or the Brazilian Bovine and Bubaline Identification and
Certification System (Lima et al., 2006). These systems capture
identification information on livestock, tracing the births, deaths and
movements of individual animals; when combined with regular checks,
such as on-farm inspections, these systems can provide an accurate
record of the size and composition of livestock populations at any given
time. Generally, this type of system is limited to larger livestock such as
cattle, which are tagged with official ear tags that provide a unique
number for each animal;
Use of satellite and remote sensing technologies to undertake livestock
inventory counts and estimate livestock feed (Behnke, 2010; Atzberger,
2013; Egeru et al., 2014); and
19
Production of technical conversion factors from expert opinions and
field experiments.
While there are numerous methods of collecting data, an integrated system must
be applied to ensure effective statistic collection; such a system should ensure
the comparability of the livestock indicators collected and limit the collection of
identical indicators by different organizations.
1.4. Livestock data issues
1.4.1. An “ideal” livestock statistical system
An ideal livestock statistical system would capture an optimal set of livestock
indicators, at both national and provincial levels (World Bank, FAO and UN,
2010). The collection of these core livestock indicators would be integrated into
the domestic statistical systems of a country using an MSF.
Livestock holders can be differentiated into three types of livestock holders:
subsistence, commercial and patio production holders. Subsistence livestock
holders will consume most of their livestock outputs, while the majority of
production outputs from commercial holders is sold. Therefore, the ideal
statistical system would differentiate between the type of livestock holder when
data is collected (USAID, 2013a, p. 29).
The ideal statistical system would also provide the framework to store and
aggregate the livestock data collected and to disseminate results and indicators
on a timely basis.
When designing an ‘ideal’ statistical system, it should be noted that even with
access to comprehensive data, there is still a risk that flawed policies may be
developed (Pica-Ciamarra et al., 2014, p. 29). The World Bank, FAO and UN
(2010) outline several main issues that must be considered to ensure that quality
basic agricultural data is collected. These include timeliness and punctuality,
completeness, comparability and coherence, accuracy, relevance and reliability.
Related to these essential properties, and to be avoided, are traits such as the
lack of appropriate data, sampling errors, non-sampling errors, non-appropriate
reference dates and/or enumeration periods and irregular frequency of livestock
data collection.
20
1.4.1.1. Missing data
While the collection of livestock data in some developed countries, such as the
member states of the European Union (EU), is relatively comprehensive and
complete (European Commission, 2014), other countries – especially
developing countries – do not capture an adequate amount of key livestock data
through traditional survey tools. In a review of agricultural sample surveys and
multi-topic household survey questionnaires across several developing
countries, Pica-Ciamarra et al. (2014, pp. 44-45) found that while the data
collected may have been sufficient to estimate some basic descriptive statistics
on livestock ownership, it was rarely adequate for the purpose of providing a
systematic overview of a country’s livestock sector. It was found that the
usefulness of the data was reduced by the fact that information was missing or
limited on livestock husbandry practices and on inputs and outputs such as
breeding practices, feed and water access, production and use of manure and the
use of livestock for draught power. In an investigation of the contribution of
livestock to the economy in Kenya, Behnke (2011) argues that information on
animal draught power and transportation is the single most limiting factor of
data availability. A review by Fabi et al. (2012) found that official data
coverage of primary livestock products such as meat, milk and eggs was only
around 45 per cent of total production in Asia-Pacific countries. Lack of data on
livestock disease status is also a significant issue in much of the developing
world (Thornton, 2010).
1.4.1.2. Sampling
Given time, resource and budgetary constraints, most livestock data must be
derived from samples of the population. Pica-Ciamarra et al. (2014, p. 9)
describe several issues that arise when collecting data from a sample of
livestock producers. These include the fact that spatial and temporal variations
in animal production inputs, such as agro-ecological conditions, may lead to a
livestock distribution that is only partially correlated with the distribution of
rural households or farms. This makes it difficult to select appropriate sampling
points and sampling weights. Sample surveys for the collection of livestock
data will contain larger sampling errors when the data is based on the statistical
unit of agricultural households or on farms that do not possess any livestock.
Due to the considerable spatial variation in livestock, dividing land into
homogenous groups of vegetation type or strata and then optimally allocating
the total sample to the strata can substantially improve the quality and precision

21
of the data collected (Davies, 2009). This is known as stratification, or the use
of sample area frames.
Larger commercial livestock enterprises are often listed in government
registers. The list frame for these types of enterprise are usually derived from
these registers, especially in the developed world (NASS, 2009a; ABARES,
2011). However, these records do not capture unregistered businesses or
smallholders, which are prevalent in much of the developing world. Therefore,
an ideal sampling frame would consider the different enterprise types – such as
large commercial enterprises and subsistence or smallholder livestock holding
by households or smallholders – when ascertaining the best technique for
selecting a sample. This may require use of a multi-frame approach. A multi-
frame approach could derive the sample of the larger enterprises from the list of
business enterprises and use an area frame to derive an adequate sample of
smallholders.
Depending on the level of variation, the sampling of livestock products having
only a low proportion of household or farm produce will require larger sample
sizes to obtain the same level of precision as their more common counterparts.
As such, the World Bank, FAO and UN (2010, p. 15) recommend that minor
and relatively rare commodities be omitted from the frequent surveys and
constrained to 5-to 10-year agricultural or livestock censuses.
1.4.1.3. Frequency and timing
A low frequency of livestock data collection may reduce confidence in
livestock production and productivity measures. Timing and frequency are
important factors when indicators are influenced by seasonality, dynamic by
nature or vary significantly from one year to another (World Bank, FAO and
UN, 2010). Fixed technical conversion factors are often used to produce
livestock estimates for countries and may adequately reflect long-term trends,
but they ignore short-term variations; these may be substantial, especially with
regard to poultry and small livestock, which may experience sharp annual
fluctuations due to disease outbreaks or religious and cultural events (OECD,
2002, p. 183). The reliability of data collected using direct interviews or visual
observation techniques for indicators with high variability and those dependent
on factors outside the households control may be questionable (Pica-Ciamarra
et al., 2014, p. 60). Therefore, the timing of data collection may have to be
considered. Where appropriate, seasonal-adjuster coefficients based on recent
expert estimation may have to be generated and applied. Data collection on the
changes in the livestock and poultry balances must also reflect the reproductive

22
cycles of different animal species. The World Bank, FAO and UN (2010, p. 34)
suggest that data on cattle should be collected annually, semi-annually for pork
and quarterly or even more frequently for poultry and livestock production.
An online global survey of livestock data stakeholders found that the majority
of respondents desire annual livestock data and indicators (Baker et al., 2013).
However, there was found to be a demand for monthly data collection of animal
health and disease indicators.
1.4.2. Issues in integrating collection processes
The first matter to clarify when integrating the collection process is to
have a clearly defined central agency that coordinates, oversees, and
collates data into a central database and disseminates the core
indicators.
The core livestock indicators to be collected will be partly determined
by the various requirements of the stakeholders and users of livestock
data.
Coordination and determination of who should collect what; ensuring
that the doubling-up of data collection is limited. Standardization of
variable definitions and statistical systems along with adequately
training staff in the correct collection of statistical data.
Ensuring that statistical units are the same across all surveys, i.e. a farm
or a household is the same across all surveys.
The time taken between collecting, cleaning, processing and
disseminating results should be kept to a minimum.

23
2
Livestock production and
productivity in the
agricultural statistics
system
Generally, livestock productivity is simply the ratio between the livestock
outputs produced and the inputs used to produce these outputs. In a small
survey of livestock stakeholders, Morgan and Ring (2013) found that
productivity and production were the two most useful types of data for livestock
data users. However, they also found that over 80 per cent of livestock data
users considered productivity and production data either unavailable or, if
available, of low quality.
Traditional survey data is often insufficient to generate accurate estimates of
livestock production in existing systems. In a presentation on recent
advancements in livestock statistics, Okello et al. (2013a) note that even simple
questions such as ‘how much did your cows produce in the last month?’ and
‘what was the average carcass weight of the cattle you slaughtered in the last
six months?’ may not be captured.
2.1. Key indicators used
Four types of indicators can be used to monitor and evaluate livestock
production systems: input, output, outcome and impact indicators (Pica-
Ciamarra et al., 2014, p. 28).
Generally, the input and output indicators are relatively easy to measure and
observe, as they can be collected as part of the regular activities of livestock
holders or agents. On the other hand, outcome and impact indicators may be
more difficult to determine, because they are not as readily measurable and
baselines can be difficult to estimate (Pica-Ciamarra et al., 2014, p. 28).
24
2.2. Key data underpinning the indicators
2.2.1. Outputs
Livestock outputs vary depending on the species. However, FAO (1999)
considers livestock outputs according to the three non-mutually exclusive
general categories outlined below:
Direct-consumption outputs – those livestock outputs that are consumed
directly by the household who produced them and can only be
consumed once. Examples are meat, milk and eggs. As large
proportions of livestock outputs are directly consumed by households in
developing countries, this general category of outputs is of particular
importance (OECD, 2002);
Multiple-use consumption outputs – those outputs that can also be used
as inputs for the production of additional outputs and are used multiple
times. An example given by FAO (1999) is the use of dung to produce
biogas and the residue of this process applied as a fertilizer; and
Sale goods – which, as the name suggests, consists of the livestock
outputs sold to produce income.
Specific outputs are not necessarily simple to estimate. For example, Behnke
(2011) notes that dairy outputs require a complex interaction of multiple
variables: the proportion of cows in the herd, the percentage of those cows that
lactate per year, output per lactation, the level of extraction for human use are
all factors involved in the quantity of milk produced.
2.2.2. Inputs
As with livestock outputs, the inputs vary according to the actual livestock
enterprise. Broadly, the livestock inputs of interest when measuring production
and productivity include (FAO, 1999):
Herd composition, demographics and breeding practices;
Land;
Livestock housing;
Water access;
Veterinary services;
Vaccinations and disease treatments;
Labour; and

25
Livestock feed. An account given by Dr Ben Lukuyu on two possible
data collection tools to assess feed availability is provided in Box 2.
Box 2. FEAST and Techfit: the application of two livestock data collection tools.
Account given by Dr Ben Lukuyu (ILRI) (paraphrased).
The Feed Assessment Tool (FEAST) is a systematic method used to assess the availability and use of feed on a farm or given locality. It is capable of identifying inefficiencies within an agricultural system that may have an impact on the productivity of its livestock. It does not simply take into account the definitive values of nutritive content and herbage mass, but also incorporates economic factors affecting household livelihood, such as labour inputs, seasonality and markets.
In the past, FEAST has been used as a stand-alone tool. However, it has proved to be more beneficial to farmers when used in conjunction with Techfit, a tool used to assess and prioritize the actions suggested by FEAST output information. FEAST is now used as a tool within a process, which allows farmers to observe the transformation of their raw data into quantitative and qualitative feedback information on which sound management decisions can be based. FEAST generates possible ideas, while Techfit prioritizes these ideas; the highest-priority idea is implemented pending a cost-benefit analysis. Farmers are engaged in the process via focus group discussions and reports, which helps to forge stronger links between farmers and advisors; this, in turn, enables development and implementation of a practical action plan.
It terms of application towards improving methods of estimating livestock production and productivity, FEAST and Techfit could be adapted into a mechanism for assessing feed availability and efficiency with which it is used in an extensive grazing system, such as communal grazing. Communal grazing is common within the pilot countries and there have been some difficulties in assessing the utilization of feed and productivity of livestock under these types of operation.
2.2.2.1. Dynamics of the production system
A key input variable is that of livestock demographics. LDIA (2011) noted that
the collection of herd structures and herd composition is of high importance in
understanding livestock production systems. An in-depth survey method called
animal-based monitoring (which entails consistently visiting sample herds at
regular 15- to 30-day intervals over a period of several years, with enumerators
recording exact dates and demographic events that occurred since the last
period) can provide very accurate livestock demographic estimates (Lesnoff et
al., 2011). Data collected under this system includes the number of abortions,
parturitions, births (both stillborn and live births), natural deaths, sales, number
of head slaughtered, gifts, numbers agisted and purchases.
The collection of labour use in livestock systems presents challenges associated
with the difficulties encountered in disaggregating activities such as the
simultaneous feeding and watering of different animal groups (Pica-Ciamarra et
26
al., 2014, p. 49) or the seasonality aspect of labour requirements (Njuki et al.,
2011, p. 20). The disaggregation of labour input data by gender is also
important (World Bank, FAO and UN, 2010, p. 10).
2.2.3. Other
Another factor that can significantly influence livestock production is that of
animal diseases. Livestock diseases can affect the amount of product available
for human consumption, prevent certain regions or even countries from keeping
certain types of livestock, limit the ability to participate in foreign trade and
impact national food security (Chilonda & Otte, 2006). Birhan (2013) claims
that livestock health is one of the most important livestock production issues in
African countries.
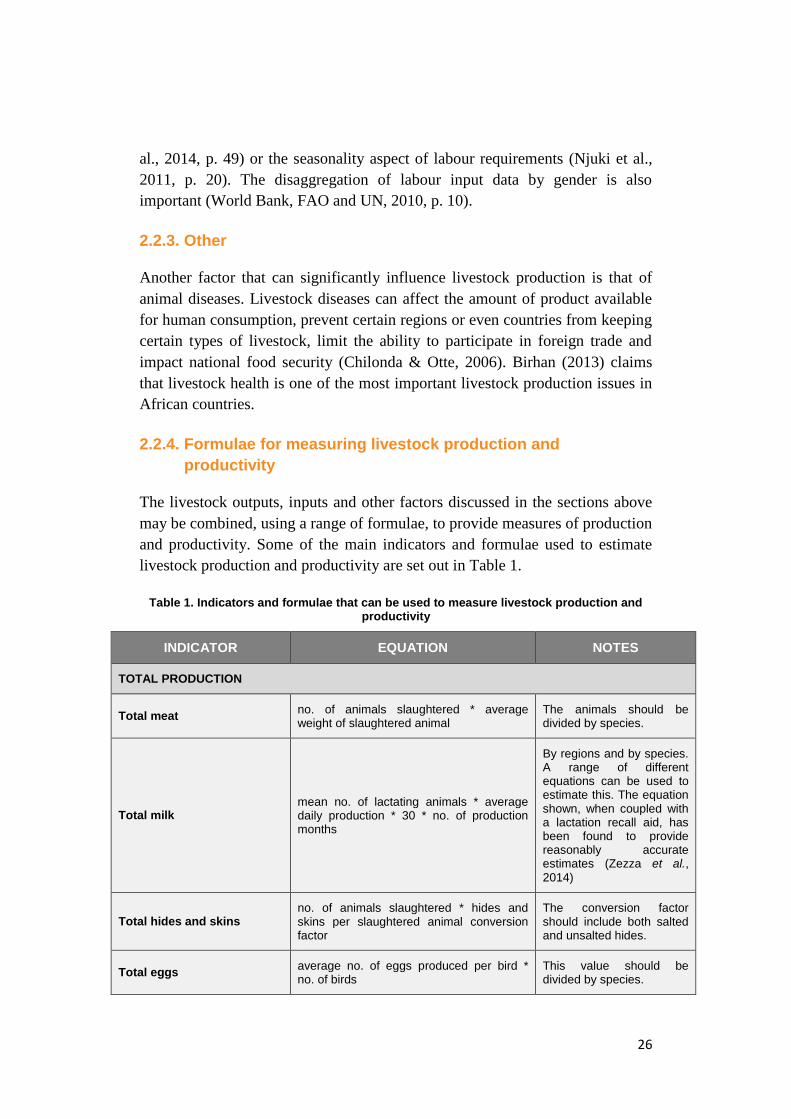
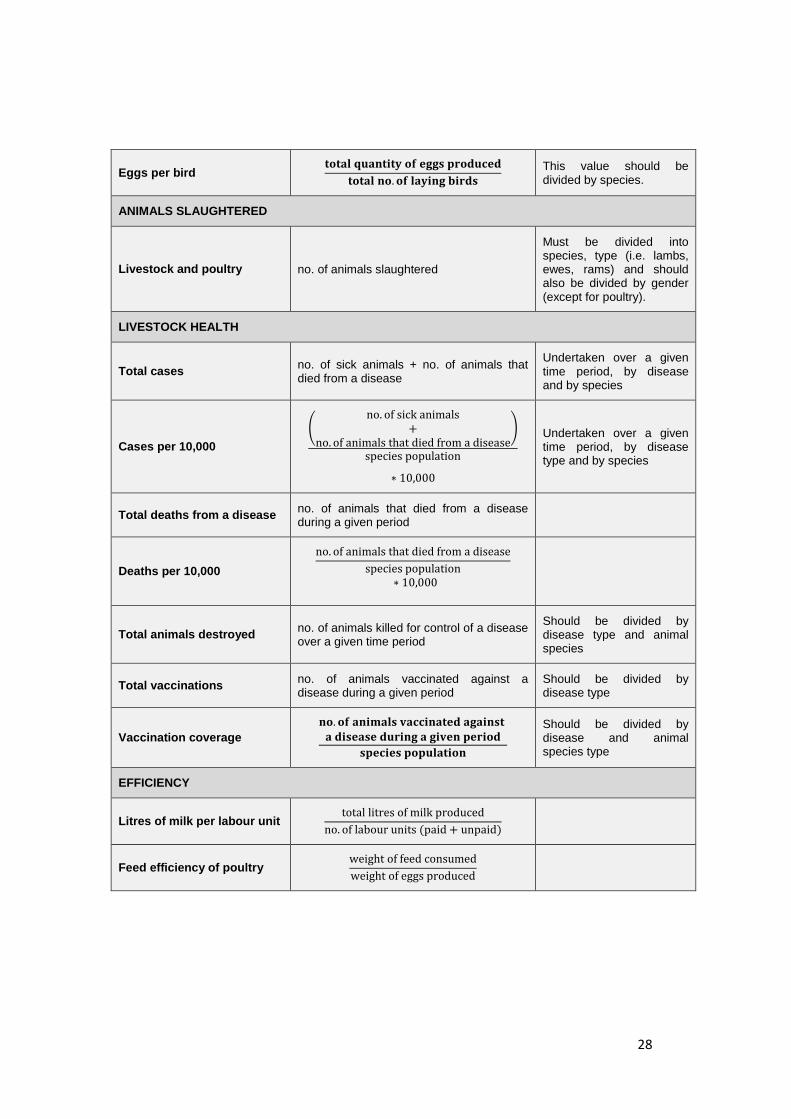
2.2.4. Formulae for measuring livestock production and
productivity
The livestock outputs, inputs and other factors discussed in the sections above
may be combined, using a range of formulae, to provide measures of production
and productivity. Some of the main indicators and formulae used to estimate
livestock production and productivity are set out in Table 1.
Table 1. Indicators and formulae that can be used to measure livestock production and productivity
INDICATOR EQUATION NOTES
TOTAL PRODUCTION
Total meat no. of animals slaughtered * average weight of slaughtered animal
The animals should be divided by species.
Total milk mean no. of lactating animals * average daily production * 30 * no. of production months
By regions and by species. A range of different equations can be used to estimate this. The equation shown, when coupled with a lactation recall aid, has been found to provide reasonably accurate estimates (Zezza et al., 2014)
Total hides and skins no. of animals slaughtered * hides and skins per slaughtered animal conversion factor
The conversion factor should include both salted and unsalted hides.
Total eggs average no. of eggs produced per bird * no. of birds
This value should be divided by species.

27
Total manure production feed intake per adult animal * dry matter digestibility of diet coefficient * population of adult animals
This value should be divided by species. Technical coefficients may have to be used for manure production per adult animal, but will vary based on the production system and feed type.
Total draught power total population of animals * proportion of animals used for draught power * average value of draught power per animal
Behnke (2011, p. 22) notes that the technical coefficient for the value of draught power per animal could be based on the proportion of the value of milk offtake; however, information on this value is scarce.
PRODUCTION DENSITY
Meat quantity of meat
size of agricultural land
Milk total milk produced
size of agricultural land
Eggs total eggs produced
size of agricultural land
PRODUCTION PER ANIMAL
Meat production based on slaughtered animals
total quantity of meat produced by species
total no. of animals slaughtered of this species
Meat production based on all animals
total quantity of meat produced by species
total no. of animals in country or region
Milk production per animal
total milk produced (incl. quantity sold, personally consumed)
total no. of animals (both milkers and dry cows)
Many different forms of milk production per animal exist – i.e. this could be in terms of milk per lactating cow rather than total dairy cows. The equation shown here is based on Murphy and Simpson (2013). This equation does not capture milk production that is suckled by calves.
28
Eggs per bird 𝐭𝐨𝐭𝐚𝐥 𝐪𝐮𝐚𝐧𝐭𝐢𝐭𝐲 𝐨𝐟 𝐞𝐠𝐠𝐬 𝐩𝐫𝐨𝐝𝐮𝐜𝐞𝐝
𝐭𝐨𝐭𝐚𝐥 𝐧𝐨. 𝐨𝐟 𝐥𝐚𝐲𝐢𝐧𝐠 𝐛𝐢𝐫𝐝𝐬
This value should be divided by species.
ANIMALS SLAUGHTERED
Livestock and poultry no. of animals slaughtered
Must be divided into species, type (i.e. lambs, ewes, rams) and should also be divided by gender (except for poultry).
LIVESTOCK HEALTH
Total cases no. of sick animals + no. of animals that died from a disease
Undertaken over a given time period, by disease and by species
Cases per 10,000
(no. of sick animals
+no. of animals that died from a disease
)
species population
∗ 10,000
Undertaken over a given time period, by disease type and by species
Total deaths from a disease no. of animals that died from a disease during a given period
Deaths per 10,000
no. of animals that died from a disease
species population∗ 10,000
Total animals destroyed no. of animals killed for control of a disease over a given time period
Should be divided by disease type and animal species
Total vaccinations no. of animals vaccinated against a disease during a given period
Should be divided by disease type
Vaccination coverage
𝐧𝐨. 𝐨𝐟 𝐚𝐧𝐢𝐦𝐚𝐥𝐬 𝐯𝐚𝐜𝐜𝐢𝐧𝐚𝐭𝐞𝐝 𝐚𝐠𝐚𝐢𝐧𝐬𝐭 𝐚 𝐝𝐢𝐬𝐞𝐚𝐬𝐞 𝐝𝐮𝐫𝐢𝐧𝐠 𝐚 𝐠𝐢𝐯𝐞𝐧 𝐩𝐞𝐫𝐢𝐨𝐝
𝐬𝐩𝐞𝐜𝐢𝐞𝐬 𝐩𝐨𝐩𝐮𝐥𝐚𝐭𝐢𝐨𝐧
Should be divided by disease and animal species type
EFFICIENCY
Litres of milk per labour unit total litres of milk produced
no. of labour units (paid + unpaid)
Feed efficiency of poultry weight of feed consumed
weight of eggs produced

29
2.3. Key surveys for generating livestock production
indicators
As previously mentioned (Section 1.2 above), no single survey collects all the
data required to produce the core livestock production indicators at the requisite
time intervals, which makes it necessary to integrate multiple collection
systems. However, a number of key surveys collect data that can be used to
produce livestock indicators. These include agricultural/livestock censuses,
living standards measurement studies (LSMS), household budget surveys,
administrative record data and a range of other sources (World Bank, 2012).
Agricultural/livestock censuses
The most significant enumeration of livestock statistical data for any given
country occurs through its agricultural census. These are usually conducted
every 10 years, although some countries run one every five years (FAO, 2005).
In some countries, such as India (Ministry of Agriculture, 2014), a specific
livestock census is also routinely conducted. These complete population
enumeration surveys are usually conducted by the National Statistical
Authority, with some collaboration between different Ministries (Pica-Ciamarra
et al., 2014, p. 30). These surveys collect data on livestock numbers by breed
and type (NBS, 2011b; ABS, 2014a; Ministry of Agriculture, 2014) and may
also acquire data on livestock production such as milk, egg and wool
production (IBGE, 2006; Nsiima et al., 2013b). Some countries, such as Canada
and New Zealand, also collect information based on sex and age groups for
large ruminant animals (Statistics Canada, 2010; Statistics NZ, 2012).
However, countries such as England do not capture cattle in their agricultural
census (DEFRA, 2010). This is attributable to the complete capture of this
information using the Bovine Register System outlined in Section 0 above.
Living standards measurement studies (LSMS)
These studies are multi-topic surveys conducted on nationally representative
households over a relatively small sample. In many developing countries, such
as Tanzania (NBS, 2008, 2014a), an agricultural questionnaire collecting
several variables related to livestock production is also included. Due to the
contribution of livestock towards reducing poverty and economic growth, many
countries’ LSMS collect data on livestock ownership, herd dynamics, use of
inputs and the production of livestock products, milk, meat, eggs and dung, and
the draft and transportation services provided by livestock (World Bank,

30
2012).These are conducted over a twelve-month period to account for
seasonality, using face-to-face interview techniques.
Household budget surveys
These surveys are usually conducted on a sample of the population covering
nationally representative households and the different agro-ecological zones
and major regions. These are usually conducted on an annual basis, although
some countries conduct these quarterly (CBS, 2014) and others up to every five
years (NBS, 2011a). The surveys take place through face-to-face interviews
using seven-day recall questions that aim to capture certain details on the sales
of livestock and livestock products. Pica-Ciamarra et al. (2014, p. 34) notes that
sampling errors could arise through this type of survey, as all households are
included as statistical units for this type of survey (not only households with
livestock).
Sample agricultural/livestock surveys
Many countries collect important livestock indicators from sample surveys of
livestock holders. These surveys are conducted using a range of different
collection techniques, including computer-assisted telephone interviews for
Canada’s biannual sample livestock survey (Statistics Canada, 2014), structured
paper-based questionnaires collected by enumerators in Ethiopia’s annual
livestock sample survey (CSA, 2013), to the predominantly online sample
survey of agricultural and horticultural activity in England, which collects
livestock population data on an annual basis (DEFRA, 2014). In the EU’s 28
member states, the collection of livestock indicators from annual or biannual
sample surveys is required by law (European Parliament and Council of the
European Union, 2008). These surveys provide timely data on livestock
production in the years between agricultural/livestock census data collection.
Due to the smaller size of the population surveyed, these surveys are often able
to collect more comprehensive data than agricultural/livestock censuses. For
example, the Ethiopian annual livestock survey – which, as mentioned above,
utilizes a paper-based structured questionnaire technique – collects a
comprehensive range of livestock indicators, including the number of cattle,
sheep, goats and other livestock by age category and productive use, the
number of poultry birds, milk and egg production, livestock diseases,
vaccinations and treatments, the number of births, purchases, sales, slaughters
and deaths, and livestock feed utilisation (CSA, 2013).

31
Livestock administrative record (routine) data
Data collected on a regular basis and at the lowest administrative unit, such as
the village or district level, is sent up the chain to the national statistical
agencies that process and collect various key livestock data and statistics (Baker
& Pica-Ciamarra, 2010). This data is provided on a regular basis, usually either
monthly or quarterly.
Other key sources of livestock data
Although the population and housing census of a country is generally
conducted only every 10 years, this census typically contains a question on the
ownership of livestock. This information can be used to generate specialized
livestock surveys (Pica-Ciamarra et al., 2014, p. 37). In addition, a range of
other sources collect data that may be relevant to determining key livestock
production indicators, including (World Bank, 2012):
one-off livestock surveys
data from experimental stations
market information systems
enterprise surveys
labour force surveys and
service delivery surveys.
Dr Okeyo Mwai (ILRI) provides an account of the application of different data
collection methods: see Box 3.
A summary of the potential sources of core livestock indicator data, along with
the relevance of each source for collecting the indicators, is provided by Pica-
Ciamarra et al. (2014, p. 41) and is replicated in Table 2.

32
Box 3. Application of data collection methods. Account given by Dr Okeyo Mwai (ILRI)
The capture of relevant and quality data depends to a great extent on the application of the data collection methods. Data collection tools vary depending upon the degree of detail and accuracy required of the study. Baseline surveys are a quick, broad-focus type of survey aiming to establish a benchmark. Longitudinal surveys give a more specific evaluation of a situation and are the result of repetitive and consistent study of a random and stratified sample over a given period of time.
The data from baseline surveys helps to generate a general understanding of the relevant situation. It is useful for recognizing areas of inefficiency arising due to productivity constraints, such as breed or feed availability; by focusing on certain indicators, a more specialized assessment of the extent of the inefficiencies affecting the system can be attained.
Longitudinal surveys focus on a randomly selected and stratified sample of producers or households. Data is repeatedly recorded from these random samples over a period of no less than two years. Emphasis is placed on the selection of a random sample, due to a number of surveys tending toward a certain cohort. This cohort generally includes those households that are more physically accessible or have other characteristics that enumerators deem desirable, such as infrastructure, to aid the taking of measurements. The time period limit of no less than two years is selected to ensure that the full scope of a production cycle and the physiological stages of an individual animal are captured. It also increases the likelihood of capturing the full variation of the seasons affecting the environment, or disease outbreaks affecting herd animal performance. This time period also ensures that the occurrence of ‘memorable events’, such as a birth or a death, do not dominate the expression of the data. If the time period is short and happens to include the occurrence of a ‘memorable event’, severe errors in estimating averages may ensue. For example, if the average milk production of an individual cow is measured over a period of time immediately after it giving birth, the average would be much higher than if the average were calculated across its entire lactation cycle or entire productive life.
Continual surveys that require farmers of enumerators to record data frequently may encounter several impediments. These include recite fatigue, which may have a negative effect on data quality if farmers are asked to reproduce the same type of information repeatedly, especially on a daily basis. Practical considerations and a pragmatic rationalization must be applied to evaluate the need to perform daily data collection if weekly or fortnightly collection would suffice.
Experience with data collection is also an advantage, in that certain ‘rules of thumb’ can be applied to collection on particular indicators. These ‘rules of thumb’ can be applied in association with the use of common units of measurement, the people to whom the survey questions are directed, and the length and intensity of data collection required. For example, the rate of change in milk production within the first month of lactation is quite rapid; therefore, weekly recording of milk production is necessary to assess productivity. After a month, however, the rate of change is much slower and easier to predict, which means that monthly data collection would provide a suitable indication of the level of productivity.
Improved accuracy can also be achieved by considering the household person to whom data collection questions are directed. This may differ in terms of gender, household hierarchy or role in the production chain. For example, the women of the household may be privy to certain information, while children may have a clearer recollection of ‘memorable events’ such as the birth or death of an animal.
Another practical consideration is the realization of the added labour necessary for taking measurements. To counter this factor, it is suggested that data collection

33
activities be timed to coincide with regular animal husbandry activities, such as the weighing of animals at weaning or sale time.
Cooperating with livestock keepers is also vital to the production of quality data. Taking the time to explain the purpose of data collection, the added benefits to all parties involved and the ability of new systems to provide instantaneous feedback creates incentives for livestock keepers to keep records. With the shift away from paper-based systems and the increased availability of ‘real-time’ services, livestock keepers can record events as they happen, without having to attempt to recall all farm activity for a given period.
Practical applications of data collection are necessary, and detailed data on individual animals is not always achievable. There is, however, the capacity to evaluate the productivity of a herd through the use of stratified sampling of a herd, which could select a variation of animals based on a single parameter such as age. A young animal, one of average age and one old one could be selected; this would provide a more accurate average than a simple average of the entire herd.
Table 2. Summary of most likely sources of core livestock indicators (adapted from Pica
-Ciamarra et al., 2014, p. 41)
Survey
Agricultural / livestock
census
Agricultural / livestock
sample surveys
Household budget surveys
Living standards
measurement studies
Administrative records
Core indicator
Livestock population ⋆⋆⋆ ⋆⋆ no ⋆ ⋆⋆
Livestock production ⋆ ⋆⋆⋆ no ⋆ ⋆⋆
Market prices ⋆ ⋆⋆⋆ ⋆⋆⋆ ⋆⋆ ⋆⋆⋆
Outbreaks of animal diseases / animals
affected / animals at risk
no no no no ⋆⋆⋆
Liv
esto
ck v
alu
e a
dd
ed
Animal stock, beginning and end of reference period
⋆ ⋆⋆ no ⋆⋆ ⋆⋆⋆
Production, quantity
⋆ ⋆⋆⋆ no ⋆⋆ ⋆⋆
Input, prices no ⋆⋆ no ⋆ no
Production, prices
⋆ ⋆⋆ no ⋆ ⋆⋆⋆

34
Imports / exports
no no no no ⋆⋆
Productivity-related indicators
⋆ ⋆⋆⋆ no ⋆ ⋆
Constraint-related indicators
⋆ ⋆⋆⋆ no ⋆ no
Livestock livelihoods indicators
no ⋆ no ⋆⋆⋆ no
⋆⋆⋆ very likely,
⋆⋆ likely,
⋆ possible
It can be seen from Table 2 that agricultural/livestock sample surveys and
routine administrative records are the most likely source of production and
productivity data concerning livestock. A summary of the key livestock
indicators, the frequency of collection and of the data collection methods for a
sample of developed countries is provided in the following tables.

35
Table 3. The USA’s key surveys, their frequency livestock indicators collected and collection methods from USA
United States of America
Report/Survey
(Frequency) Livestock Data/Indicator Collection Method References
Cattle inventories
(2 times per year)
No. of cattle/milk cows/bulls; no. of heifers held for breeding; no. of cattle/calves raised for meat production; no. of calves born
Main collection method is phone enumeration; however, mail-out/mail-back, web-based and face-to-face interviews are also offered
Morgan and Hollis (2013) and NASS (2009a)
Cattle on feed
(monthly)
Monthly cattle/calves on feed; placement, marketing and other disappearances (deaths, return to grazing, movement to other feedlots)
Phone enumeration is the main method, but due to the repetitive and time-consuming nature, a high number of face-to-face interviews are also conducted with producers (mail out/mail in is also offered)
Morgan and Hollis (2013) and NASS (2009a)
Livestock slaughter
(collected weekly and summarized into monthly reports)
No. of animals slaughtered (by species and class) in federally inspected plants, post-mortem condemnation; daily live and dressed weights
From daily electronic reports from Food Safety and Inspection Service Inspectors
Morgan and Hollis (2013) and NASS (2009d)
Milk production
(monthly surveys are conducted quarterly, with administrative data used to estimate indicators in intervening months)
Monthly milk production, milk produced per cow during the month, average number of milk cows in the herd during the month
Primarily mail-based questionnaires with follow-up phone calls to non-respondents
Morgan and Hollis (2013) and NASS (2013c)
Poultry slaughter
(collected weekly and summarized into monthly reports)
No. of chickens (young and mature), ducks, turkeys and other poultry slaughtered under federal inspection; total live and dressed weights
Electronic records from federal inspectors sent to NASS weekly
Morgan and Hollis (2013) and NASS (2009e)
Hog inventory
(quarterly)
Hog inventory, breeding herd, market hogs, sow farrowing, pig crops, pigs per litter; pigs per litter by size of operation
Mail, telephone interviews, face-to-face interviews and web-based electronic data reporting
Morgan and Hollis (2013) and NASS (2009c)

36
Dairy products
(monthly)
Stocks, shipments, prices received, production of butter, cheese, dry whey, ice cream, non-fat dry milk and all other manufactured dairy products
Mail-based questionnaires are used because of the detailed information required
Morgan and Hollis (2013) and NASS (2009b)
Broiler hatchery
(weekly)
No. of broiler hatcheries, chicks hatched, chicks placed for meat production, chicken and egg inventory, layer
Primarily mail-based questionnaires, with follow-up phone calls to non-respondents
Morgan and Hollis (2013) and NASS (2013a)
Turkey hatchery
(monthly)
Size of laying flock; number of pullets, production and value, eggs/100 layers
Mail-based survey, with phone contact to those hatcheries not completing the questionnaire
Morgan and Hollis (2013) and NASS (2009f)
Turkeys raised
(2 times per year)
Number of poults placed, death loss, number of turkeys raised
Mail-based survey, with phone contact to those hatcheries not completingthe questionnaire
NASS (2009g)
Chicken and egg
(monthly, but some data collected on weekly basis)
Total egg production, forced moulting, chicks hatched, eggs in incubators, replacement breeder, supply flocks.
Mail-based survey with an option to answer questionnaire via a web-based form
Morgan and Hollis (2013) and NASS (2013b)

37
Table 4: Key surveys, their frequency livestock indicators collected and collection methods from Australia
Australia
Report/Survey
(Frequency) Livestock Data/Indicator Collection method References
Agricultural census
(every 5 years)
No. of dairy cows (by age); no. of meat cattle (by age); no. of sheep (by categories: lambs, breeding ewes, and a conglomerate of rams, wethers, hoggets and non-breeding ewes); no. of lambs marked in previous year; no. of ewes mated to produce lambs in previous year; no. of pigs (by breeding boars, breeding sows, gilts and all other pigs); no. of domesticated goats, deer, buffaloes and all other livestock; no. of poultry held and disposed of during previous year (by layer and broiler, ducks and turkeys); egg production for human consumption in previous year; hectares of pasture for grazing; hectare of grain for grazing; irrigation quantity on grazing pastures
Paper mail-out/mail-back questionnaire along with a paper mail-out form detailing how the census could be completed using an electronic form. For the 2010/2011 agricultural census the majority of agricultural businesses (88%) responded by mail.
ABS (2010) and ABS (2014b)
Annual agricultural and grazing industries survey (annually)
Sheep and beef cattle herd size; sheep and cattle sold; sheep and lamb shorn; wool produced; no. of sheep and cattle purchased
Face-to-face interviews with follow-up phone surveys to collect estimated production data for the current financial year (conducted in October each year)
ABARES (2011) and ABARES (2014b)
Annual dairy industry survey
(annually)
Dairy herd composition; beef herd composition; no. of dairy cows; labour used; total milk production; milk yield per cow
Collected from face-to-face interviews
ABARES (2011) and ABARES (2014a)
Poultry and game bird slaughter survey
(quarterly)
No. of chicken slaughtered; dress weight (kg); tonnes of chicken meat produced; N.B. this survey does not take into account poultry slaughtered for pet food
Mail-out/mail-back paper-based forms with additional data collected by phone in follow-up calls
ABS (2008) and NSS (2004)
Livestock slaughter and meat survey
(monthly)
No. of livestock slaughtered (by cattle, calves, sheep, lambs, pigs); meat production (total dressed carcass hot weight [kg])
Data collected directly from abattoirs and other major slaughtering establishments
ABS (2015)

38
Wool and sheepmeat survey
(3 times per year)
Breeding ewes population (by breed type); no. of ewes joined; no. of lambs of hand and expected lamb sales; lamb marking percentages; future intentions of sheep flock (i.e. increase, decrease or maintain current flock size); no. of sheep to be sheared in next 4 months; expected wool production (by age and breed type)
Uses a combination of mail-out/mail-back paper-based forms and online questionnaires
MLA (2014) and MLA (2015)
National Livestock Identification System
(updated constantly)
Individual livestock data including births, deaths and movements of cattle, sheep, goats and pigs through the livestock chain
Uses a machine-readable, radio frequency identification device that captures data on individual stock each time the animal is scanned
(Animal Health Australia, 2013)
National Animal Health Information System (constantly updated)
Range of livestock health indicators including the number of herds/animals affected by major diseases; no. of herds/animals tested for major pests and diseases
Uses an integrated data collection system to collect relevant existing summary data on animal health status from the Commonwealth Government, states and territories and selected non-government agencies as required by Animal Health Australia’s Members
Animal Health Australia (2015) and Animal Health Australia (2014)
39
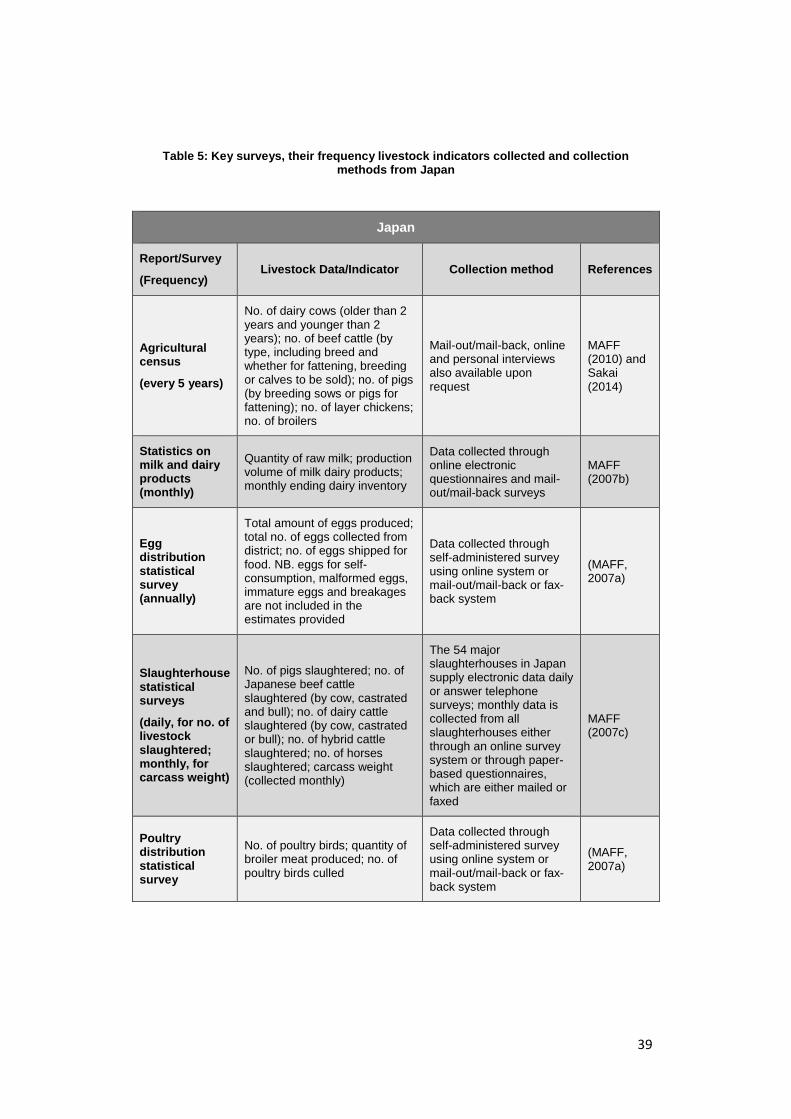
Table 5: Key surveys, their frequency livestock indicators collected and collection methods from Japan
Japan
Report/Survey
(Frequency) Livestock Data/Indicator Collection method References
Agricultural census
(every 5 years)
No. of dairy cows (older than 2 years and younger than 2 years); no. of beef cattle (by type, including breed and whether for fattening, breeding or calves to be sold); no. of pigs (by breeding sows or pigs for fattening); no. of layer chickens; no. of broilers
Mail-out/mail-back, online and personal interviews also available upon request
MAFF (2010) and Sakai (2014)
Statistics on milk and dairy products (monthly)
Quantity of raw milk; production volume of milk dairy products; monthly ending dairy inventory
Data collected through online electronic questionnaires and mail-out/mail-back surveys
MAFF (2007b)
Egg distribution statistical survey (annually)
Total amount of eggs produced; total no. of eggs collected from district; no. of eggs shipped for food. NB. eggs for self-consumption, malformed eggs, immature eggs and breakages are not included in the estimates provided
Data collected through self-administered survey using online system or mail-out/mail-back or fax-back system
(MAFF, 2007a)
Slaughterhouse statistical surveys
(daily, for no. of livestock slaughtered; monthly, for carcass weight)
No. of pigs slaughtered; no. of Japanese beef cattle slaughtered (by cow, castrated and bull); no. of dairy cattle slaughtered (by cow, castrated or bull); no. of hybrid cattle slaughtered; no. of horses slaughtered; carcass weight (collected monthly)
The 54 major slaughterhouses in Japan supply electronic data daily or answer telephone surveys; monthly data is collected from all slaughterhouses either through an online survey system or through paper-based questionnaires, which are either mailed or faxed
MAFF (2007c)
Poultry distribution statistical survey
No. of poultry birds; quantity of broiler meat produced; no. of poultry birds culled
Data collected through self-administered survey using online system or mail-out/mail-back or fax-back system
(MAFF, 2007a)

40
2.4. Livestock data issues when measuring production
and productivity
In addition to the limitations due to inadequate quantity of livestock data and
the sampling issues outlined in Section 0 above, several other issues must be
taken into account when using data to measure livestock production and
productivity. The livestock production system applied by individual farms and
households will have a marked influence on the life cycle, growth and
productivity of animals. Therefore, as the particular system implemented
influences the production and productivity of the livestock, it is important to
collect relevant information on the systems used. While commercial livestock
enterprises tend to keep records of their production process along with the
inputs and outputs, rural households tend not to regularly record this
information. As a result, collection of data from rural households may raise
several issues. Some of these issues relate to memory recall, when adequate
written records are not kept; others relate to the effective capturing and
measuring of any characteristics that may influence the indicator data collected.
Relevant production issues that must be addressed are outlined in Pica-
Ciamarra et al. (2014, p. 9) and include, but are not limited to:
An appropriate recall period for survey questions. Livestock species
have different life cycles and the number of animals may be influenced
by seasonality. The smaller the recall interval required of respondents,
the lower the recall error (Samphantharak & Townsend, 2009, p. 110).
Estimating livestock demographics from data collected on herd size
based on respondent recall at the beginning and at the end of a twelve-
month period can introduce biases, due to seasonality effects and other
dynamics. However, collection of data of this type over extended
periods of time can reduce bias variability (Lesnoff, 2008).
Milk production presents many peculiarities, such as continuous
production, seasonality effects, varying lactating capacity over time and
among a herd, and consumption of some milk by suckling animals
(Behnke, 2011; Zezza et al., 2014). Typically, LSMS surveys in
developing countries ask questions on milk production based on a 12-
month recall period, using simplified questions related to the number of
production months in the previous year and to average milk production
during the production month. Zezza et al. (2014) argue that this
collection method based on recall over a long period of time is not
adequate and leaves results subject to large errors. Questions to collect
milk production data must be framed so as to enable assessment of or

41
accounting for the quantity of milk consumed by young suckling
animals. However, data on this proportion of milk production can be
particularly difficult to capture and the LDIA (2011) notes that it may
be more appropriate to quantify only the milk produced from milking
for sale or personal consumption. Methods such as the use of average
milk per day and lactation curves, where questionnaires ask for the
average amount milked from each animal at three or four different time
reference points (one week, one month, and three and six months after
birth) have been proposed (Zezza et al., 2014).
Quantifying manure production in traditional production systems
requires information on the number of animals and a technical
conversion factor for the amount of manure produced in a given time
period (such as manure per animal per day). Traditional production
systems often exhibit heterogeneous feed consumption patterns, which
result in varying manure production levels. The three main methods for
determining manure production from livestock outlined by IAEA
(2008) include (1) the direct measurement of manure production from
livestock; (2) direct measurement of manure on the ground; and (3)
using input-output measurements where the manure output is estimated
on the basis of the total amount of feed input consumed minus the
content of other products produced, such as milk, eggs or live-weight
gain. These different methods can be expensive, and the indicator
values measured may not capture the full variance or be representative
of manure production in traditional production systems.
An intermediate livestock output product that is often not captured
when determining the productivity and value of livestock is its use for
draught power. The use of livestock for this purpose is often a major
source of energy in agriculture in developing countries (Joshi, 2011;
Metaferia et al., 2011).
As with draught power, the value of transport services provided by
livestock is also often overlooked when measuring livestock
productivity (Metaferia et al., 2011).
Quantifying labour input and the resulting productivity of labour can
often be complicated when mixed-livestock herds are managed by the
same person. Disaggregating and allocating the labour from joint
activities (such as watering of livestock) can be difficult.
Often, a major source of livestock feed is forage from roadside hedges.
Quantifying this important production input is difficult due to spatio-
temporal variations. In addition to the quantity, the quality of forage too
is an important consideration and also exhibits heterogeneity (Angerer,
42
2012). Techniques involving the use of satellite data and data
processing, combined with ground measurements to determine
herbaceous forage quantity, have been developed and tested in Africa
(Egeru et al., 2014).
As noted by Farmer (2010), pastoralists and highland livestock owners
in Ethiopia typically sell their livestock to small traders in bush markets
or primary markets. In these cases, traders purchase animals on a sight
basis, without the use of scales. While experienced traders might be
able to estimate the weight of sheep and goats, and sometimes even the
dressing weight of cattle to a reasonable accuracy, records of these
important production indicators are rarely recorded.
43
3
Pilot country experiences
3.1. The country statistical system
3.1.1. Botswana
The Botswana Central Statistics Office is the principal body in the official
statistical system of the country. Most statistical operations fall under the
mandate of this organization. Although this central office exists, Shangodoyin
and Lasisi (2011) state that there is still a need to formally map out strategic
plans to form an adequate statistical system. Mothibi (2009) outlines some of
the challenges and limitations of the current collection and compilation of
statistics in Botswana. These include a lack of coordination in the collection of
administrative data, and lack of a centralized storage and dissemination facility
for administrative data and non-standardized codes, concepts and definitions
across the country. These limitations of the current system could be reduced by
moving towards an integrated survey framework. In a report on African
statistical systems by the AfDB (2014), Botswana was found to allocate one of
the highest proportion of resources in Africa to the collection of agricultural
statistics as part of their national system.
3.1.2. Tanzania
A policy whereby officers responsible for data collection are under the control
of the the local government authority has meant that the current statistical
system in Tanzania is characterized by decentralization. In 2007, a peer review
of Tanzania’s national statistical system found that while the quality of statistics
collection had been improving, areas such as the timeliness of certain surveys,
the absence of an inventory of data series available from public agencies, the
coordination and processing of routine data systems and the availability of a
centralized dissemination system required further development. Currently,
Tanzania is developing an integrated national statistical system that aims to
deliver reliable and timely statistics in accordance with international standards
and best practices (NBS & OCGS, 2010; Danielewitz, 2014).
44
3.1.3. Indonesia
The national statistical system in Indonesia is an integrated system managed by
the Badan Pusat Statistik (BPS). Statistics are grouped into three types under
the national system and include (1) basic statistics; (2) sector statistics; and (3)
special statistics. Basic statistics are collected by the BPS; sector statistics are
collected by the different ministries, sometimes with input from the BPS; and
special statistics are usually conducted by private research agencies. When
reviewing Indonesia’s statistical framework, Hardjo (2014) found that all global
minimum key variables and global items at the national and provincial levels
for agricultural production were satisfactorily collected, compiled and
published. However, he does point out that the sampling frame methodology
needs updating, based on the 2013 agricultural census. Currently, the framing of
annual agricultural statistics are based on the now-outdated 2003 agricultural
census. Given the turnover in livestock owners that occurs over time, the use of
this old database for sample selection may introduce sampling errors.
3.2. Livestock data collected and indicators generated
A range of different livestock data and indicators are collected in the pilot
countries, at different frequencies and different sample sizes.
3.2.1. Botswana
The primary sources of livestock production data collected in Botswana,
including the frequency of collection, are shown below:
Agricultural census (Statistics Botswana, 2015) – conducted every ten
years;
Agricultural survey report (Statistics Botswana, 2014) – conducted
annually on samples grouped into two sectors; the traditional sector
comprised of subsistence farmers on communal land and the
commercial sector operating on freehold, leasehold or Tribal Grazing
Land Policy (TGLP) farms or ranches solely for commercial purposes.
The traditional sector is administered by enumerators using face-to-face
interviews, and the commercial sector data is collected by paper-based
mail-out questionnaires.
3.2.2. Tanzania
The primary sources of livestock-production data collected in Tanzania (and
collection frequency) include:
45
National census of agriculture (NBS, 2011b) – undertaken every five
years;
National panel survey (NBS, 2014b) – undertaken every two years;
Large-scale farmer reports (Holland, 2012) – compiled annually;
Administrative data collection (Holland, 2012) – collected monthly,
quarter, annually; and
Livestock market price reporting (Mapunda et al., 2011) – weekly.
The livestock indicators produced in these surveys, along with notes on the
sampling and collection methodology, are presented in section 3.2.5.
3.2.3. Indonesia
The primary sources of livestock-production data collected in Indonesia, along
with the frequency of collection, are shown below:
Agricultural census (DGLAH, 2012; Hardjo, 2012) – undertaken every
ten years;
Livestock census (Margono, 2013) – undertaken on an ad hoc basis (last
conducted in 2013);
Poultry business report (BPS, 2009b, p. 88) – conducted annually on all
poultry businesses maintaining more than 2,500 laying hens or
producing at least 19,500 broiler chickens per year;
Dairy cattle business report (BPS, 2009b, p. 89) – undertaken annually
by direct interview on all businesses with more than ten adult dairy
cows;
Large and small livestock company report (BPS, 2009b, p. 90)–
conducted annually on registered livestock businesses using direct
interiew techniques;
National livestock sample survey (BPS, 2009b, p. 436) – undertaken on
a systematic sample of households identified in the household census as
holding livestock; and
Number of animals slaughtered and meat production (FAO, 2010) –
collected monthly from secondary industry and government sources
who report to the central statistics regency.
46
A list of livestock production indicators collected through these surveys in
Indonesia, along with the collection agencies, method of collection and sample
selection, is presented in section 3.2.6.
3.2.4. Livestock data and indicators collected in Botswana
1. Report/Survey & Reference: Agricultural census (CSO, 2008)
Livestock Data/Indicator: Births, deaths and offtake rates for cattle, goats and
sheep; no. of chickens; dairy cattle herd composition; gender of livestock
holders; all livestock indicators divided into traditional and commercial holding
groups.
Frequency (Last Undertaken): 10 years (2004; will be undertaken again in
2015).
Collection Method: Two sectors targeted: traditional subsistence agricultural
holders and commercial agricultural holdings. Collected over three phases: first
two phases were questionnaire-based interviews of traditional sector (livestock
counts and inventory collected in phase two); phase three was a mail-based
questionnaire sent to the commercial sector (has a very high non-response rate,
but follow-ups were conducted).
Collection Agency: Central Statistics Office.
Sample: The Sampling Frame was constructed from the 4,165 EAs demarcated
during the 2001 Population and Housing Census. This excluded all enumeration
areas for cities (Gaborone and Francistown) and towns (Lobatse, Selebi
Phikwe, Orapa, Jwaneng and Sowa). The remaining 3,112 EAs constituted the
sampling frame for traditional or subsistence farming during the 2004
Agricultural Census. This was approximately 75% of the total EAs constructed
in the whole country. A total of 1,202 enumeration areas were selected as
primary sampling units (PSUs). This constituted approximately 39% of the total
agricultural census frame. The 2004 Agricultural Census sampling frame
comprised 211,956 agricultural holdings as enumerated during the 2001
Population and Housing Census. From these holdings, a sample of 24,040
agricultural holdings was estimated. This formed the secondary sampling units
and constituted approximately 11% of the total number of agricultural holdings
in the agricultural census frame. A list of freehold, leased and TGLP farms or
ranches obtained from the Establishment and Enterprise Register (EER) formed
a basis for the commercial-sector sampling frame. This was supplemented by a
list of commercial farms obtained by enumerators during annual agricultural
47
surveys. The Department of Animal Health and Production (DAHP), through its
extension service, also provided a list of farms/ranches.
Other Notes: 135 temporary staff were employed and received 2 weeks prior
training. They were supplemented with 37 Agricultural Statistics Unit
permanent field staff (of which the majority were supervisors). A fixed budget
was approved to contract 172 enumerators (43 teams of four enumerators).
Difficulties were experienced with enumerators’ vehicles continuously breaking
down and generally being unsuitable for the job due to such technical problems.
Dissemination of results: Disseminated in report format.
2. Report/Survey & Reference: Annual agricultural survey (Statistics
Botswana, 2014)
Livestock Data/Indicator: Births, deaths and offtake rates for cattle, goats and
sheep; no. of chickens; dairy cattle herd composition.
Frequency (Last Undertaken): Annually (2014, but last publicly available
report is for 2012).
Collection Method: Data on traditional sector collected from interviews based
on set questionnaires, but mail-out/mail-back questionnaires are used for the
commercial sector.
Collection Agency: Agricultural Statistics Unit, Statistics Botswana.
Sample: Two different frames are used to select the samples. The traditional
sector sampling frame consists of using the list from the previous Housing and
Population Census; the basis of the commercial sector sampling frame is a list
of freehold, leased and TGLP farms or ranches obtained from the Establishment
and Enterprise Register. In 2012, 3,236 agricultural holders from 246 EAs were
sampled and 3,078 responded to the questionnaires (response rate of 95.1%).
Other Notes: Four surveys are conducted at different times during the year. The
first three are for the traditional (subsistence) sector and the fourth covers the
commercial sector.
Dissemination of results: Summarized in a publicly available report format;
however, about 2 years elapse from collection to publication.

48
3. Report/Survey & Reference: Production and farm management survey
Livestock Data/Indicator: No. of broilers; no. of ostriches; no. of pigs; no. of
beef cattle; no. of layer hens; no. of dairy cattle; sex of livestock; breed of
livestock; no. of sick animals; no. of deaths; no. of livestock at risk of disease;
livestock treatment input; labour (by gender and type of work); feed type and
source; livestock feed requirements; production systems used.
Frequency (Last Undertaken): One-off, but updated on an ad hoc basis.
Collection Method: Paper-based questionnaire completed by farmers.
Collection Agency: Various local organizational bodies.
Other Notes: Nine different questionnaire books were used in this survey, each
referring to a different production system.
4. Report/Survey & Reference: District cattle census/vaccination campaign
census
Livestock Data/Indicator: No. of cattle; herd composition; no. of cattle
vaccinated (for anthrax and Q/E); no. of cattle not vaccinated.
Frequency (Last Undertaken): Only during vaccination campaigns.
Collection Method: Data collected by veterinarians while conducting
vaccination campaigns.
Collection Agency: Department of Veterinary Services.
Sample: Data is only collected while the Department of Veterinary Services are
running their vaccination campaigns; data collection is restricted to farms
having animals to be vaccinated.
5. Report/Survey & Reference: Quarterly livestock reports
Livestock Data/Indicator: No. of pigs; no. of dairy cattle; herd composition (for
pigs and dairy cattle).
Frequency (Last Undertaken): Quarterly.

49
3.2.5. Livestock data and indicators collected in Tanzania
1. Report/Survey & Reference: Agricultural census (NBS, 2011b)
Livestock Data/Indicator: No. of livestock owned (in the following categories:
castrated bulls, uncastrated bulls, cows, steers, heifers, male calves, female
calves, male uncastrated goats, male castrated goats, female goats, male kids,
female kids, rams, castrated sheep, female sheep, male lamb, female lamb,
boars, castrated males, sows, male piglets, female piglets, local chickens, layer
chickens, broiler chickens, ducks); milk production from cattle and goats during
dry and rainy seasons; number of milked animals; average milk per animal;
average number of days that animals were milked; livestock diseases in
previous 12 months.
Frequency (Last Undertaken): 5 years (2007/2008).
Collection Method: Paper-based questionnaires, extensively pre-coded to
reduce post-enumeration coding errors, responses to all questions placed in
boxes with one box per character to enable scanning and use of Intelligent
Character Recognition (ICR) technologies to capture data. Enumerators directly
interviewed smallholders and most large-scale farms. Some large-scale farms
were sent questionnaires by post, as most of the required information was based
at these farms’ headquarters.
Collection Agency: National Bureau of Statistics, in collaboration with the a
number of other government agencies.
Sample: Two types of farms were targeted: large- and small-scale farms. Large-
scale farms were fully covered (1,006 farms), small-scale farms were covered
on a sample basis (52,633 rural agricultural households surveyed). There was
also a village/community-level questionnaire to collect farm-gate prices of
commodities produced by the villages.
Other Notes: Paper forms scanned and ICR data capture technology used (very
successful; they suggest that this technology be adopted for future censuses and
surveys). It was noted that enumerators must have good handwriting when ICR
technology is used.
Dissemination of results: Disseminated in report format.
2. Report/Survey & Reference: National panel survey (NBS 2008)
Livestock Data/Indicator: No. of livestock owned in previous 12 months (in the
following categories: bulls, cows, steers, heifers, male calves, female calves,

50
goats, sheep, pigs, chickens, turkeys, rabbits, horses, donkeys); no. of animals
born; no. of animals sold; no. of animals slaughtered; no. of livestock
vaccinated; no. of animals lost to theft; no. of animals lost to disease; cow milk
produced with traditional systems, cow milk produced with improved
production systems; no. of chicken eggs laid with traditional systems; no. of
chicken eggs laid with improved systems.
Frequency (Last Undertaken): Every 2 years (2012/2013)
Collection Method: Face-to-face interviews based on paper questionnaire.
Collection Agency: Tanzania National Bureau of Statistics.
Sample: 3,280 households were surveyed, based on the National Master Sample
Frame; to ensure that it was nationally representative, this was based, in turn, on
the previous Population and Housing Census. Sample size is insufficient to
produce reliable statistics at the regional or district levels.
Dissemination of results: Released on the Tanzania National Bureau of
Statistics website (downloadable free of charge).
3. Report/Survey & Reference: Monthly animal production report (PMO-
RALG, 2015)
Livestock Data/Indicator: No. of livestock slaughtered (in the following
categories: cattle, sheep, goats, pigs, traditional chickens and improved
chicken); no. of livestock affected by diseases; milk produced per month (for
indigenous cattle and improved cattle); animal health treatments; livestock
hides processed; livestock vaccinations; animal husbandry services
implemented.
Frequency (Last Undertaken): Monthly.
Collection Method: Paper-based questionnaire completed at the village level by
extension and veterinary officers.
Collection Agency: Regional Administration and Local Government Officials,
together with Ministry of Livestock and Fisheries.
Other Notes: Indicators for milk production do not take into account the milk
consumed by households. The weights of slaughtered livestock are not
recorded.

51
4. Report/Survey & Reference: Monthly animal health report (PMO-RALG,
2015)
Livestock Data/Indicator: Disease outbreak by type of disease and animal
species (cattle, sheep, goats, donkeys, chickens, ducks, cats and dogs); no. of
animal (by species) affected, treated (by type of treatment and no. of animals
deceased, by type of disease); no. of vaccinations.
Frequency (Last Undertaken): Monthly.
Collection Method: Paper-based questionnaire completed at the village level by
extension and veterinary officers.
Collection Agency: Paper-based questionnaire completed at the village level by
extension and veterinary officers.
3.2.6. Livestock data and indicators collected in Indonesia
1. Report/Survey & Reference: Agricultural census (CBS, 2014)
Livestock Data/Indicator: No. of livestock (by species); no. of poultry
establishments; no. of livestock establishments.
Frequency (Last Undertaken): Every 10 years (2013).
Collection Method: Paper-based, face-to-face interviews with temporary staff
employed as enumerators and department staff acting as supervisors.
Collection Agency: Badan Pusat Statistik (Central Bureau of Statistics).
Sample: Complete enumeration of agricultural households using both a door-to-
door visit to all households in rural and urban villages and a snowballing
method in urban villages.
Other Notes: An issue encountered in enumeration was the refusal, of a number
of respondents, to be interviewed. There was a high proportion of inconsistency
errors due to the failure of enumerators to understand certain concepts,
definitions or the flow of questions, in the questionnaire as well as false
information given by respondents.
Dissemination of results: Results released in print and electronic publications
are available to the public through the BPS website. The data is also packaged
into a publicly available database.

52
2. Report/Survey & Reference: Livestock census (BPS, 2009b)
Livestock Data/Indicator: No. of livestock (for large livestock including cattle
and buffalo, small livestock including goats, sheep and pigs and poultry);
slaughter and meat production; egg production from poultry (including
chickens, quail and ducks) per year; milk production per year; importation,
births and deaths and culling of cattle.
Frequency (Last Undertaken): Ad hoc basis (2013).
Collection Method: Population indicators are collected by means of paper-based
forms filled out by village clerks; the forms are then sent to the district-level
officers who enter the information into a computer.
Collection Agency: Ministry of Agriculture and Central Statistics Agency
(BPS).
Sample: Sample derived from entire archipelago, for households identified in
the Census of Agriculture as having livestock.
Dissemination of results: A national report with findings at the provincial and
district levels is released.
3. Report/Survey & Reference: Poultry business report (BPS, 2009b)
Livestock Data/Indicator: No. of chickens; no. of ducks; labour used;
production type and inputs.
Frequency (Last Undertaken): Annually (2009).
Collection Method: Direct interview techniques.
Collection Agency: Statistics Directorate of Livestock, Fisheries and Forestry.
Sample: Sample derived across entire archipelago, from poultry farms listed as
legal entities with the minimum requirement that they maintain at least 2,500
laying hens or produce a minimum of 19,500 broiler chickens per year.
Dissemination of results: Disseminated in report format.
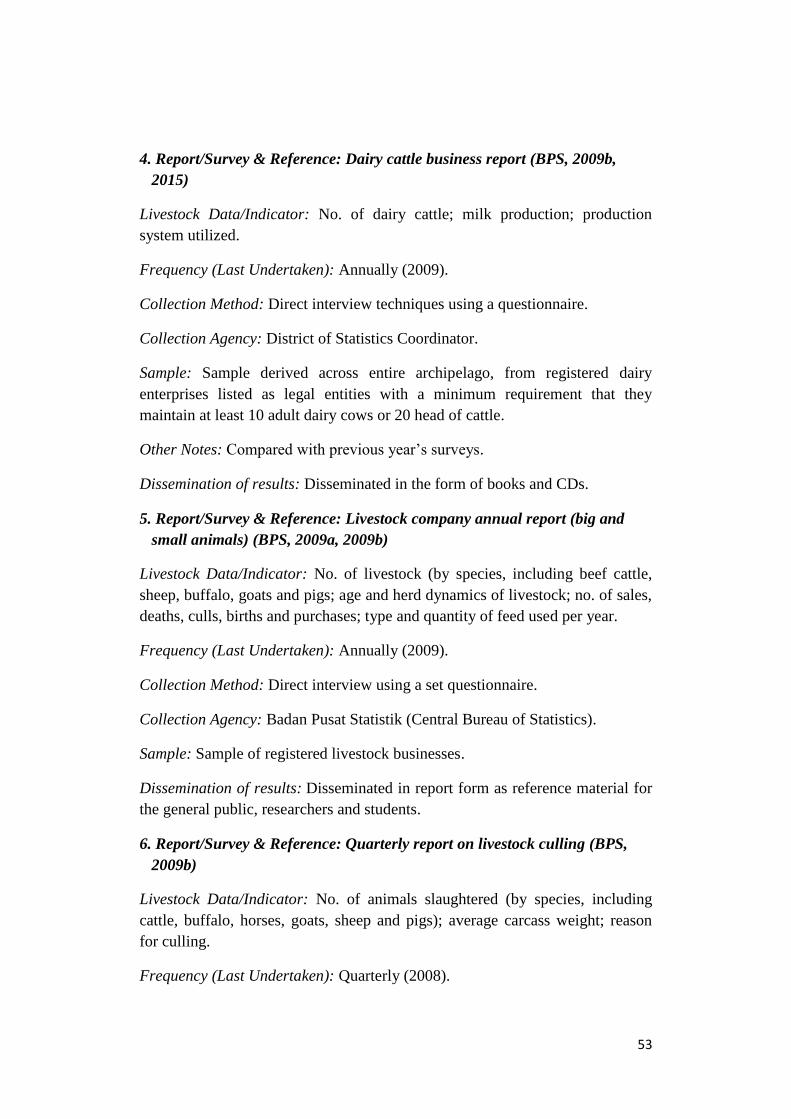
53
4. Report/Survey & Reference: Dairy cattle business report (BPS, 2009b,
2015)
Livestock Data/Indicator: No. of dairy cattle; milk production; production
system utilized.
Frequency (Last Undertaken): Annually (2009).
Collection Method: Direct interview techniques using a questionnaire.
Collection Agency: District of Statistics Coordinator.
Sample: Sample derived across entire archipelago, from registered dairy
enterprises listed as legal entities with a minimum requirement that they
maintain at least 10 adult dairy cows or 20 head of cattle.
Other Notes: Compared with previous year’s surveys.
Dissemination of results: Disseminated in the form of books and CDs.
5. Report/Survey & Reference: Livestock company annual report (big and
small animals) (BPS, 2009a, 2009b)
Livestock Data/Indicator: No. of livestock (by species, including beef cattle,
sheep, buffalo, goats and pigs; age and herd dynamics of livestock; no. of sales,
deaths, culls, births and purchases; type and quantity of feed used per year.
Frequency (Last Undertaken): Annually (2009).
Collection Method: Direct interview using a set questionnaire.
Collection Agency: Badan Pusat Statistik (Central Bureau of Statistics).
Sample: Sample of registered livestock businesses.
Dissemination of results: Disseminated in report form as reference material for
the general public, researchers and students.
6. Report/Survey & Reference: Quarterly report on livestock culling (BPS,
2009b)
Livestock Data/Indicator: No. of animals slaughtered (by species, including
cattle, buffalo, horses, goats, sheep and pigs); average carcass weight; reason
for culling.
Frequency (Last Undertaken): Quarterly (2008).
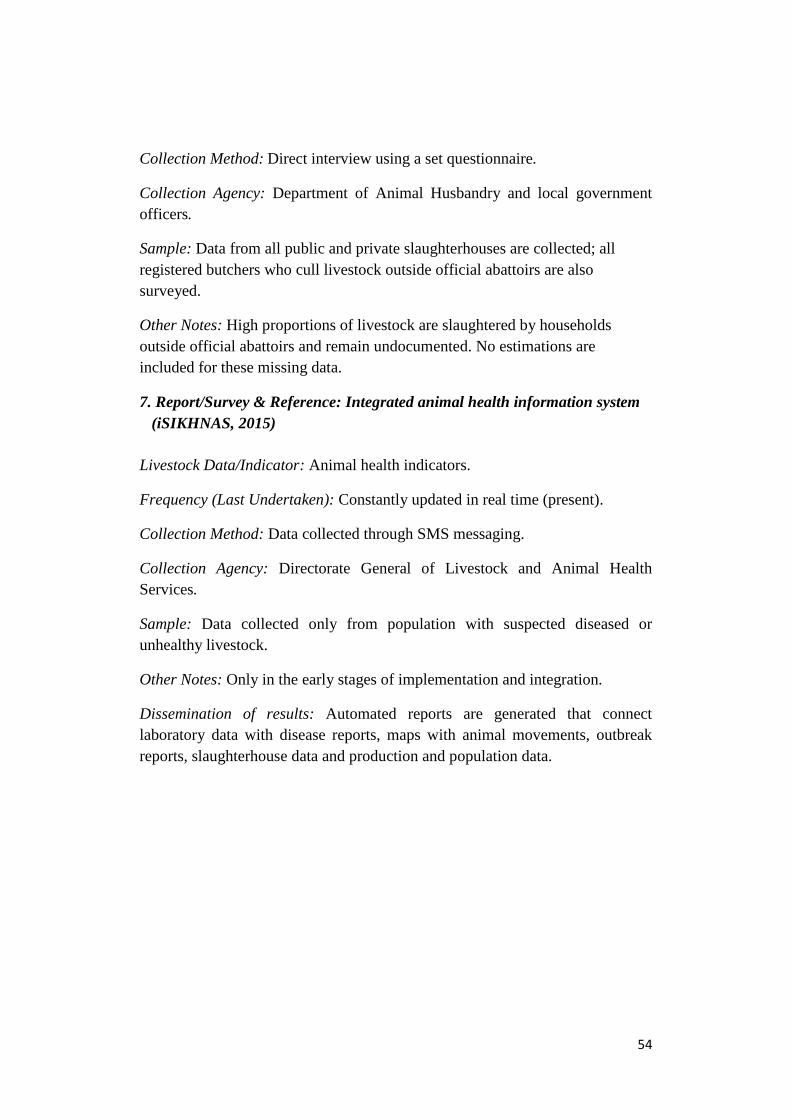
54
Collection Method: Direct interview using a set questionnaire.
Collection Agency: Department of Animal Husbandry and local government
officers.
Sample: Data from all public and private slaughterhouses are collected; all
registered butchers who cull livestock outside official abattoirs are also
surveyed.
Other Notes: High proportions of livestock are slaughtered by households
outside official abattoirs and remain undocumented. No estimations are
included for these missing data.
7. Report/Survey & Reference: Integrated animal health information system
(iSIKHNAS, 2015)
Livestock Data/Indicator: Animal health indicators.
Frequency (Last Undertaken): Constantly updated in real time (present).
Collection Method: Data collected through SMS messaging.
Collection Agency: Directorate General of Livestock and Animal Health
Services.
Sample: Data collected only from population with suspected diseased or
unhealthy livestock.
Other Notes: Only in the early stages of implementation and integration.
Dissemination of results: Automated reports are generated that connect
laboratory data with disease reports, maps with animal movements, outbreak
reports, slaughterhouse data and production and population data.
55
3.3. Relevant issues
Three broad issues are relevant to the methods of collecting and measuring
livestock production and productivity in the pilot countries. These include
problems associated with sampling, the quantity of data available and the
quality of the data collected. The issues are discussed in further detail in
Sections 3.3.1 – 3.3.3 below.
3.3.1. Sampling
As mentioned in Section 0 above, sampling is a major issue when official
livestock statistics are generated from sample surveys. This is particularly
important in countries where the spatial distribution of animals is not strongly
correlated with the distribution of the sampling units (such as rural households
or farm holdings), as occurs in countries with large tracts of arid or semi-arid
areas (Pica-Ciamarra et al., 2014, p. 40). Holland (2012) notes that sample sizes
in Tanzania are often too small to provide accurate representations of the
complexities of livestock systems.
Metaferia et al. (2011) emphasize that the collection of livestock statistics in
many African countries is still at a rudimentary stage. They note that, despite
large proportions of livestock being located in lowland and pastoral areas, the
collection of livestock statistics to date has often been restricted to the sedentary
farming regions. Leta and Mesele (2014) state that there is a significant spatial
variation in livestock production and markets Africa due to access to markets
capacity, availability of feed and water, herd characteristics and topographical
features. Therefore, the sampling frame used when designing surveys must
ensure that these regions and households with livestock are captured.
Indonesia’s livestock production is largely comprised of numerous
smallholders. Due to this structure of livestock holdings, production is highly
fragmented, with an irregular distribution across the entire country (Stanton,
Emms & Sia 2010). Therefore, selection of a satisfactory sample can be
problematic and survey design must ensure that the smallholder-based
production is captured. The majority of cows in Indonesia are owned by
individual farmers, who also account for an estimated 90 per cent of
Indonesia’s milk production (Wright & Meylinah, 2013). However, milk
production from corporate dairy farmers is increasing at a greater rate than that
from individual farmers (Morey, 2011); surveys must be designed to ensure that
both corporate and individual landholders are adequately represented in the
sampling process.

56
3.3.2. Quantity of data
There has been a decline in the quantity of livestock data and indicators
collected that are essential to measure production and productivity (World
Bank, FAO and UN, 2010). In a survey of livestock data users, Pica-Ciamarra
and Baker (2011) found that over 90 per cent of respondents disagreed that
there was sufficient availability of livestock data. In addition to the
unavailability of some livestock indicators, a problem often highlighted by
livestock stakeholders is the fact that most surveys target farm-level and
consumption-related issues and rarely capture information on other factors
along the input and output value chains (Pica-Ciamarra et al., 2014, p. 40).
While data from traditional surveys – such as agricultural/livestock sample
surveys and integrated household surveys – can provide sufficient details to
generate descriptive statistics on livestock ownership and production, Pica-
Ciamarra et al. (2014) found that limited or missing information on husbandry
practices, inputs and outputs severely restricted overall understanding of the
livestock sector.
While the current data collection methods of the pilot countries shown in Tables
above provide estimates of the total production outputs for direct-consumption
outputs such as meat, milk and eggs, it can be seen that some data may be
missing due to the collection technique adopted. For example, when capturing
milk-production data, Tanzania’s monthly production reports do not take into
account the milk consumed by households; in addition, the weights of livestock
slaughtered are not recorded.
Often, the gap in production and productivity data collected arising in
developing countries accounts for the value of livestock where there is a heavy
reliance on animals to plough land for crop production. Metaferia et al. (2011,
p. 7) argue that there is a wide gap in the knowledge on capturing the full value
of services that the livestock sector provides to the cropping sector, in terms of
both the outputs of manure and animal traction. It can be seen in Tables above
that the pilot countries do not regularly capture manure production and collect
limited data on animal draught power.
From the summary of surveys undertaken and livestock indicators collected in
the pilot countries, it can be seen that, with the exception of vaccinations and
disease treatments, there is general deficiency in the collection of livestock
input indicators. Inputs of livestock feed, breeding practices, access to water,
livestock housing and labour are all either captured rarely or absent from the
data collected. As can be seen in Table 1 above, these inputs are necessary to

57
calculate some key livestock productivity indicators. While data on the total
livestock herd is generally captured, herd composition and demographic data is
often only partially collected. For example, Indonesia has eight main beef-cattle
varieties; however, when collecting population data, no information is collected
to enable distinction between the different breeds (East Java Provincial
Livestock Services, 2011, p. 13). The account given by Dr Karen Marshall
(ILRI) on the methods of estimating breed composition of livestock is provided
in Box 4.
Box 4. Methods of estimating breed composition. Account given by Dr Karen Marshall
(ILRI)
Obtaining quality information through use of a questionnaire is greatly dependent on how the questions are structured and how they are asked. Information on breed composition requires a relatively disciplined manner of questioning, as the information on this type of indicator is generally based on observable phenotypic features, which may differ depending upon the observer.
There are several methods to counter discrepancies between the apparent phenotype and the actual genetic composition of an animal. One line of questioning involves obtaining information on the breeding of the dam and sire, to determine the composition of its offspring. The dam is allocated a code dependent on its breed composition, generally limited to ‘indigenous’ or ‘exotic’ categorizations, and the sire is then allocated a code dependent on its breed composition. This results in a much more informative indication of the breed composition of the offspring, and the phenotypic characteristics expressed in the offspring can also be indicative of the percentages of breed types of the paternal and maternal lines.
DNA testing can be used to improve the accuracy of breed composition and is available for all species. It involves taking a DNA sample in the form of hair from the hide of an individual animal. This is then sent to a reputable lab for analysis, which reports on breed compositions in percentage terms. There are several drawbacks to this type of testing: the cost of testing individual samples, or the risk of human error in particular, sample labelling. This method does however highlight the discrepancy between the presumed and the actual breed composition when tested under a phenotype and generational basis.
Another gap in terms of data availability appears to arise from the capture of
statistics relating to informal livestock exports from African countries, in
avoidance of export licences, VAT and livestock quarantine requirements.
USAID (2013b, p. 35) summarizes the estimates of informal livestock exports
given by a range of different sources, including FAO, the Ethiopian Ministry of
Foreign Trade , World Bank and their own estimates. These estimates include a
significant number of livestock: approximately 260,000 head of cattle and
930,000 head of shoats per annum are informally exported from one African
country abroad.

58
Finally, while most issues relate to the insufficient quantity of livestock data in
the pilot countries, inefficiencies in terms of duplication of data collection also
occur. For example, as can be seen in Errore. L'origine riferimento non è
stata trovata. in 2013, both an agricultural census that included livestock and
an ad hoc livestock census were conducted in Indonesia.
3.3.3. Quality of data
In addition to the quantity of data available, where data is collected, the
reliability of this data is often questionable, especially in developing countries
(Catley, 2006; Pica-Ciamarra & Baker, 2011). There is general dissatisfaction
with the quality of the livestock data routinely collected in African countries
(Pica-Ciamarra et al., 2014, p. 37). Disparity exists between the methods
employed by local administrative organizations and the local extension officers
collecting data. Okello et al. (2013b), in an examination of the quality of
livestock data from administrative records, concluded that several factors
contributed to its poor quality, including: the limited electronic collection of
data (the majority being collected with paper-based forms); discontentment of
the extension officers assigned to collect the data due to insufficient resources;
insufficient time to collect the required data; use of extension officers who are
generally not trained in data collection and handling, who collect information
during their daily activities; an absence of formal procedures when collecting
data, and scattered direct observations.
Based on surveys of African nations’ general agricultural statistics system
capability, the AfDB (2014) concluded that Tanzania has strong data
availability but a significant lack of resources to allocate to agricultural
statistics. These resource constraints relate primarily to a shortage of funding
and of adequately trained staff, problems with the reliability of vehicles for
transportation of enumerators to survey livestock holders and a lack of data
collection tools (Holland, 2012). Other key issues noted by Holland (2012)
include requests for too much information, inadequately designed and defined
surveys, the use of data parameters for livestock projections, limited public
dissemination of data and a lack of institutional coordination, which resulted in
duplications of collection efforts and use of different methodologies; this, in
turn yielded inconsistent results. These factors all reduced the integrity of the
livestock data and inferences that could be derived therefrom.
In a paper assessing the value of core livestock technical conversion factors in
Tanzania, Nsiima et al. (2013a) found that many of the important livestock
technical conversion factors used by the Federal Government dated back to the

59
late 1980s and were often adopted from neighbouring countries. Retention of
dated technical conversion factors, especially if production systems are
dynamic or have changed, reduces the quality of the data produced.
The estimation of livestocks’ contribution to Indonesia’s GDP is calculated
using data on livestock population as well as on egg, meat and milk production
(DCAIS, 2013, p. 8). The cost data are based on the cost of production from the
National Livestock Census conducted at least eight years prior. Other issues
include the estimation of feed-use. As highlighted in Section 0, feed-use is an
important input for determining livestock productivity. However, a report by
AMIS (2014) found that the measurement of livestock feed-use in Indonesia
was particularly problematic. This was particularly the case for maize estimates,
the main ingredient in livestock feed. It was found that Indonesia’s central
statistical organization estimated maize production levels at more than twice
those reported by the estimates computed by the USDA, due to the different
estimation techniques employed. Therefore, the use of appropriate estimation
techniques are also important to ensure that quality data is collected.
A large proportion of livestock holders in each of the pilot countries consume a
significant proportion of the outputs produced. In Tanzania, the local
administrative data collection only captures information on the milk sold at
markets; it does not capture the quantity of milk consumed by the livestock
owners (PMO-RALG, 2015). If this routine data alone is used to determine
milk production, there will be a severe underestimation of the amount of milk
produced.
Further comments on the issues relating to the establishment of quality
livestock productivity indicators for determining livestock production and
productivity were provided by Ms Jane Poole (ILRI); her account is provided in
Box 5 below.

60
Box 5. Establishing livestock productivity indicators. Account by Ms Jane Poole (ILRI)
Establishing accurately measurable and comparable livestock productivity indicators is the footing on which to base sound data collection methods.
In terms of livestock, this is best achieved by converting measurements to a common unit, such as Tropical Livestock Units (TLUs). Converting to TLUs enables comparison across species and enterprises. All species are calculated relative to the metabolic weight of 250kg cattle as a common standard.
Well-defined productivity indicators can help to provide information on indicators that are difficult to measure directly. Information on these ‘immeasurable’ indicators can be inferred from other indicators that are measured more easily. For example, the welfare of a household can be inferred from a calculation of its land and domestic and farm assets. To enable comparison across multiple enterprises, species comprising the domestic and farm assets are weighted and then adjusted for age. For instance, younger animals such as calves are weighted more lightly compared to older animals, such as bulls or full-grown cows.
Indicators of productivity vary depending on the species. For example, cattle productivity may depend on a number of factors, each of which contribute to the overall productivity of individuals in the herd, and should be collected as part of a productivity survey. These factors include breed, age at first calving, last calving date, still/live births, calving interval, lactation length and milk production at two points in time (at calving and ‘yesterday’).
Hens are evaluated against similar parameters including breed, number of eggs per clutch, number of clutches in a year and the breeding of replacement layers. Each of these indicators is included to help establish a sense of their reproductive efficiency and hence their productivity throughout their productive life.
Labour is also a vital indicator; however, it is difficult to ascertain for each enterprise. It is highly season-dependent, and a simplified version of its allocation can be calculated using the ‘hours spent for species X and activity Y’
3.4. Possible improvements
3.4.1. Improvements to the sampling approach
Unsurprisingly, increasing the sample size improves the accuracy of livestock
data. However, Bryssinckx et al. (2012) found that the improvement in the
accuracy of data is most pronounced when the initial sample size is relatively
small. Other techniques can also be used to lower sampling errors and to use
available samples more effectively.
Himelein et al. (2014) trialled the use of a random geographic cluster sample
technique in which points in rural areas are randomly selected, circles drawn
around these points and all eligible respondents found within these circles are
interviewed. They found that this technique can help to reduce the
undercounting of livestock of these nomadic populations. However, they did

61
note that problems such as unfavourable terrain and difficult access to suitable
guides can hinder the implementation of this technique.
The use of a differential selection probability between strata with higher
sampling densities in regions with a more variable number of livestock, or
ensuring an even distribution of samples among regions belonging to different
categories are an area in which sampling improvements can be made (Stehman
& Selkowitz, 2010). Bryssinckx et al. (2012) discovered that the use of a two-
stage stratified sample design significantly improved the accuracy of data
collected on cattle numbers. Their first-stage stratification ensured that the areas
selected within districts were proportional to the district size; the second-stage
stratification used normalized difference vegetation index (NDVI) values
collected by remote sensing to categorize areas based on vegetation classes. The
improvements in terms of accuracy from this sample design system were
particularly apparent for lower sample sizes.
3.4.2. Improvements to the quantity of data collected
Several new techniques can be implemented to improve the current collection
of livestock production data in the pilot countries, in terms of quantity.
As noted earlier (Section 1) nomadic and semi-nomadic populations are hard to
capture in traditional household surveys. To help overcome this shortfall,
technological advances that are accessible and not prohibitively expensive
could be included in an integrated livestock survey framework. Due to the
notably early adoption of mobile communications by pastoralists operating
nomadic/semi-nomadic systems, there is a possibility to collect data by means
of this technology on these otherwise underrepresented production systems
(Ojigo & Daborn, 2013). The advent of GPS technology in smartphones also
enables georeferencing the data collected through this method.
Turner and Hiernaux (2002) note that due to the lack of precise quantitative
information on livestock in dryland Africa, scientists have created livestock-
distribution variables based on estimates from non-sedentary livestock models.
The most prominent of these is the piosphere model, which is based on the
assumption that livestock density declines as the distance from livestock
congregation localities, such as watering points, villages and camps, increases.
As a method of monitoring the demographics and structure of cattle herds in
Indonesia, the Ministry of Agriculture has been investigating the development
of an identification and registration system according to which all cattle are
62
registered and provided with scannable identification codes (FAO, 2010)
similar to those commonly used in much of the developed world. Such coding
and tagging of livestock and of production outputs, such as skins and hides, also
provides benefits when collecting animal health information (USAID, 2013b, p.
82).
With technical support from the Australian Government, Indonesia has
implemented an integrated animal health information system: iSIKHNAS,
which operates in real time to collect, manage, report and use data to support
livestock health and production (iSIKHNAS, 2015). This sytem utilizes mobile
phones’ SMS messaging systems to collect livestock health indicators in the
field; these are then automatically combined with a range of data such as
disease reports, maps with animal movements, outbreak reports, and
slaughterhouse data along with production and population data, to generate
automated reports.
3.4.3. Improvements to the quality of data estimates
It is emphasized by de Mel et al. (2009) that most small enterprises in
developing countries do not maintain detailed written records, resulting in the
collection of data based on respondent recall. Surveys relying on respondent
recall inevitably introduce non-sampling errors into the data collected, and the
livestock production and productivity indicators subsequently estimated. The
smaller the recall interval required for respondents, the lower the recall error
(Samphantharak & Townsend, 2009, p. 110). In Botswana, however, is was
noted that the administrators of routine livestock data collection are helping to
enhance on-farm record keeping.
Where livestock conversion coefficients are regularly updated, less data on
livestock production will be required from surveys or administrative records
(Pica-Ciamarra et al., 2014, p. 65) and the quality of livestock indicators
estimated from dated technical coefficient values will increase. As a first step
towards ensuring high data quality and the use of up-to-date conversion
coefficients, an inventory of the current conversion coefficients routinely used
to generate livestock indicators must be compiled.
In the agricultural module of the Tanzanian LSMS survey, questions were not
administered to only one person, such as the household head. Rather, they were
addressed to multiple respondents based on who was most knowledgeable about
individual topics (NBS, 2014a, p. 8). Given that factors such as gender and
position within the household affect the role played in the production of

63
livestock, and that these factors often vary according to a country’s culture,
religion and other socioeconomic variables, this technique will improve the
accuracy of the data collected and could also be applied to other surveys in the
pilot countries, to improve the quality of data collected there.
Okello et al. (2013b) outline some options to improve the quality of routine
livestock data collection. These include training extension officers in the
administration of the questionnaires and in the correct techniques for collecting
data, ensuring that extension officers use a common and consistent collection
and reporting format across all regions, and production of monthly, quarterly
and annual statistical reports by district authorities, to recognize the time
demands on extension officers and veterinary officers who collect the data.
An optimum method of collecting high quality data on the impact of diseases
on livestock is discussed by Dr Henry Kiara (ILRI); his account is provided in
Box 6 below.
64
Box 6. Measuring the impact of disease. Account given by Dr Henry Kiara (ILRI)
The productivity of an animal is maximized when both environmental and internal body conditions are optimum. The incidence of disease can have a negative impact on the productivity of an animal. Disease can cause a decrease in growth rate or milk yield and quality, due either to the direct effect of the disease or to the partitioning of energy: that which would normally be used for production is diverted to combat the pathogen. There are several methods to assess the incidence of disease and its effects. These include a longitudinal study methodology of a cohort of animals over a given period of time, a questionnaire relying on the knowledge and recall ability of livestock keepers and extension officers, and a systematic literature review.
The ILRI IDEAL (Infectious Diseases of East African Livestock) project ran a longitudinal study on a cohort of young cattle by taking growth indicator measurements, such as weight, every five weeks between birth and one year of age. In East Africa, cattle are exposed to a range of pathogens throughout their life; the occurrence of these pathogens is strongly correlated with seasonal fluctuations. The IDEAL study aimed to assess the survival of the calves affected by particular diseases, the interactions of the different diseases and their effect on growth rate. This type of information collection is intensive and costly and is not always representative of the direct effects. In this particular trial, it was found that when certain pathogens co-infected an animal, they had an antagonistic effect on each other and caused the overall effect on the animal to be lesser than if only one pathogen had infected it.
Another method that is regularly adopted to collect information on disease incidence is a questionnaire directed to livestock keepers and extension officers or ‘key informants’. It is difficult to rely on such information when it is recalled over a period of up to one year, where most recent or highly memorable events tend to be recalled with bias. However, in terms of disease incidence, as the yearly pattern is fairly predictable, the questionnaire method has proved relatively accurate when compared with the results of biological blood sampling of livestock for the presence of diseases over the same period. An extension of this method incorporates aspects of participatory epidemiology though the use of workshops and other discussion-based forms of information collection. For this method to be effective, workshops’ participants represent a range of perspectives and include men, women, key informants and service providers, either as a mix or with the holding of multiple workshops to capture individual perspectives without influence from other parties.
A systematic literature review can be an effective method, as it collates the studies of independent parties in the form of research projects and theses. This allows locations that may not have been accessible under one project to be reviewed and external resources to be utilized.
The optimum method of collecting quality data in regard to the impact of disease on animal growth rate and survival would be a combination of the three methods discussed here, to create a dynamic collection mechanism.
65
4
Lessons learned and
recommendations
4.1. Integrated survey framework: steps required
The steps to be undertaken towards building and implementing an integrated
survey for livestock are adapted from the integration of agricultural statistics
outlined by Holland (2012) and the World Bank, FAO and UN (2010), and are
listed below:
First, link a country’s livestock production and productivity plan to the
global strategy framework;
Identify the core livestock indicators required by different stakeholders
along with frequency, level of aggregation and precision required;
Identify appropriate data collection methodologies and which agencies
have the capacity to collect the data;
Given the limited budgets often encountered in developing countries,
prioritize the activities for implementation;
Identify any capacity building and training required by organizations
responsible for implementation; and
Identify the resources needed to successfully implement the data
collection.
In addition, when integrating agricultural and census data, complex statistical
procedures are required to link the data. Data from an agricultural census can
only be linked to population census data through the household unit. Where
more than one agricultural holding occurs per household the linking of data is
complicated (FAO, 2005).
4.2. Progress towards elements of the integrated
framework: lessons learned
This Literature Review has found that there is a significant duplication of data
collection on livestock production indicators between different collection
agencies. This can be attributed to the lack of institutional coordination among
stakeholders and limited access to data. This replication is an inefficient use of

66
limited resources. A clearer delineation of which agencies are responsible for
the collection of what livestock-production indicator data, at what frequency,
and across what sample is required from each country’s central statistics office.
Moving towards an integrated framework will reduce the human- and financial-
resource burdens of collecting data for livestock production indicators. Issues of
under-resourced and inadequately trained staff are still likely to occur,
especially in the collection of administrative data by regional extension officers.
However, if as identified in Section 0 above, specialized training of extension
officers is provided in data collection, the administration of questionnaires, and
the provision of common and consistent collection and reporting formats, this
will help progress towards an integrated framework that collects high-quality
livestock data.
Not all data must be collected in the form of traditional surveys. Numerous
additional livestock data collection methods can be developed to supplement
data collected in these ways. This Literature Review has found that in some
developed countries, items such as cattle herd population and demographics
data are not even collected in traditional surveys, given the introduction of
comprehensive tagging and administrative registers. Therefore, the most
effective data collection methods must be considered when moving towards an
integrated framework.
Data that will not change or become obsolete quickly should be collected in
periodic censuses or surveys. However, variables and indicators that change
often or are used to generate indicators with high variability should be collected
on a more frequent (at least annual) basis. Also, any technical conversion
factors should be updated regularly. Special care must be taken when dated
parameters are used to estimate or project livestock productivity.
The dissemination of livestock data to the public is often limited; therefore, an
integrated framework with a focus on livestock production must ensure the
timely and widespread release of the statistical data collected. In addition, the
transparency of the survey methodologies used to collect livestock data is often
limited. As noted by USAID (2013a), progress towards an integrated
framework requires full transparency of survey and questionnaire
methodologies.

67
4.3. Key conclusions on testing livestock data collection
methods and tools
The first step is to compile a record of all current livestock data collection
methods employed by all stakeholders; this is to ensure that variables and
indicators are not double-counted unnecessarily. However, some duplication of
data collection from multiple sources is not necessarily negative, as it provides
a check and balance against the data assumptions applied (if they are
sufficiently integrated to enable cross-checking against each other). However,
problems could arise as to determining ‘which is the most accurate’, if there is
significant disparity between the indicators collected.
When testing the livestock collection methods, the timing of the collection
methods must be considered and varied according to livestock type, with
consideration for the different reproductive cycles and generational changes.
For example, while the collection of annual data on cattle populations may be
sufficient due to limited generational change, this timing will be insufficient for
poultry populations, where several generations will have cycled through during
this same period of time.
High sampling errors may occur when using sample survey data instead of
more comprehensive survey techniques (FAO, 2005). When assessing livestock
data collection methods, the sample size must be sufficiently large to ensure the
desired level of precision, detail and level of aggregation. These methods must
also be designed such as to enable collection of enough statistically valid
responses to cover the main livestock production methods in the country.
Livestock collection methods must be clear and globally consistent in their
definitions of variables. This is particularly important when coordinating the
collection and integration of data from different sources. The use of consistent
terminology is particularly important in the collection of administrative data
where the collection agent is often untrained in data collection.
Methods of generating livestock data based on conversion technologies must be
validated regularly and modelled on the country/region and production system
for which data is collected. In developing countries, livestock production
variables and indicators are often produced on the basis of outdated and/or
technical coefficients adapted from neighbouring countries (Okello et al.,
2013a).

68
Most surveys are based on the premise of the household head or the agricultural
manager being the sole or major decision maker. In reality, the decision-making
process of agricultural holdings are far more complex. Different household
members may hold different responsibilities and make decisions at different
levels of the strategy ladder (FAO, 2005, p. 24). For example, women in
Ethiopia and Botswana play a minimal role in cattle production (Oladele &
Monkhei, 2008; USAID, 2013b, p. 44). On the other hand, in Indonesia, women
are genereally the primary owners and caretakers of village and backyard
extensive poultry production (Oparinde & Birol, 2008, p. 2). Therefore, when
measuring livestock productivity through interview-based survey methods,
correct identification and targeting of surveys towards the household members
in charge of the target livestock’s production improve estimation accuracy.
69
References
ABARES. 2011. Survey methods and definitions. Australian Bureau of
Agricultural and Resource Economics and Sciences: Canberra, Australia.
ABARES. 2014a. Dairy industry selected physical and financial estimates, by
state. Australian Bureau of Agricultural and Resource Economics and Sciences:
Canberra, Australia.
ABARES. 2014b. Selected physical and financial estimates for broadacres
farms, by industry and state. Australian Bureau of Agricultural and Resource
Economics and Sciences: Canberra, Australia.
ABS. 2008. Poultry and game birds slaughtered. Available at:
http://www.abs.gov.au/AUSSTATS/[email protected]/DSSbyCollectionid/B6493801A
518BD96CA256BD00027FE1A?opendocument. Retrieved 20 January 2015.
ABS. 2010. Agricultural census 2010-11: questionnaire. Australian Bureau of
Statistics: Sydney, NSW, Australia.
ABS. 2014a. 7215.0 - Livestock products, Australia, Sep 2014: explanatory
notes. Available at
http://www.abs.gov.au/Ausstats/[email protected]/0/BFDE9884BEB308D6CA2577DD
001297D8?OpenDocument. Retrieved 20 January 2015.
ABS. 2014b. Australia - 2010-11 agricultural census: explanatory notes.
Available at
http://www.abs.gov.au/AUSSTATS/[email protected]/Lookup/7121.0Explanatory%20
Notes12010-11?OpenDocument. Retrieved 12 January 2015.
ABS. 2015. 7218.0.55.001 - Livestock and meat, Australia: explanatory notes.
Available at
http://www.abs.gov.au/Ausstats/[email protected]/Latestproducts/7218.0.55.001Explan
atory%20Notes1Dec%202014?opendocument&tabname=Notes&prodno=7218.
0.55.001&issue=Dec%202014&num=&view=. Retrieved 3 March 2015.
AfDB. 2014. Country assessment of agricultural statistical systems in Africa:
measuring the capacity of African countries to produce timely, reliable, and
sustainable agricultural statistics. African Development Bank, Abidjan, Côte
d’Ivoire.
70
AMIS. 2014. Improving feed use estimations: data, methodologies and
challenges. Agricultural Market Information System, Mexico.
Angerer, J.P. 2012. Technologies, tools and methodologies for forage
evaluation in grasslands and rangelands. In Coughenour, M. B. & Makkar,
H.P.S. (eds), Conducting national feed assessments. FAO Animal Production
and Health Manual, No. 15. FAO Publication: Rome.
Animal Health Australia. 2013. National Livestock Identification System.
Available at
http://www.animalhealthaustralia.com.au/programs/biosecurity/national-
livestock-identification-system/. Retrieved 3 March 2015.
Animal Health Australia. 2014. Quarterly statistics. Animal Health
Surveillance, 19(2): 23-31.
Animal Health Australia. 2015. National animal health information system.
Available at http://www.animalhealthaustralia.com.au/programs/disease-
surveillance/national-animal-health-information-system/. Retrieved 9 February
2015.
Atzberger, C. 2013. Advances in remote sensing of agriculture: context
description, existing operational monitoring systems and major information
needs. Remote Sensing, 5(2): 949-981.
Baker, D., Morgan, N. & Pica-Ciamarra, U. 2013. Core livestock data and
indicators: results of a stakeholder survey. FAO Publication: Rome.
Baker, D. & Pica-Ciamarra, U. 2010. Routine livestock data in sub-Saharan
Africa: collection and use. FAO Publication: Rome.
Behnke, R. 2010. The contribution of livestock to the economies of IGAD
member states: study findings, application of the methodology in Ethiopia and
recommendations for further work. IGAD LPI Working Paper No. 02-10.
IGAD Livestock Policy Initiative, Odessa Centre, UK.
Behnke, R. 2011. The contribution of livestock to the Kenyan economy. IGAD
Livestock Policy Initiative Working Paper No. 03 - 11. IGAD Livestock Policy
Initiative, Odessa Centre, UK.

71
Behnke, R. & Metaferia, F. 2011. The contribution of livestock to the
Ethiopian economy - part II. IGAD Livestock Policy Initiative Working Paper
No. 02 - 11. IGAD Livestock Policy Initiative, Odessa Centre, UK.
Birhan, M. 2013. Livestock resource potential and constraints in Somali
Regional State, Ethiopia. Global Veterinaria, 10(4): 432-438.
BPS. 2009a. Laporan Tahunan Perusahaan Peternakan Ternak Besar/Kecil
Tahun [Annual report of livestock farms, small-large livestock: questionnaire;
in Bahasa Indonesia]. Badan Pusat Statistik (Central Bureau of Statistics),
Indonesia.
BPS. 2009b. Ringkasan Metadata Kegiatan Statistik [Summary metadata
activity statistics; in Bahasa Indonesia]. Badan Pusat Statistik (Central Bureau
of Statistics), Indonesia.
BPS. 2015. Laporan Tahunan Perusahaan Sapi Perah [Dairy cattle company
annual report] [in Bahasa Indonesia]. Available at
http://sirusa.bps.go.id/sirusa2012/index.php?r=sd/detail&kd=69&th=2007.
Accessed on 16 March 2016
Bryssinckx, W., Ducheyne, E., Muhwezi, B., Godfrey, S., Mintiens, K.,
Leirs, H. & Hendrickx, G. 2012. Improving the accuracy of livestock
distribution estimates through spatial interpolation. Geospatial Health, 7(1):
101-109.
Catley, A. 2006. Use of participatory epidemiology to compare the clinical
veterinary knowledge of pastoralists and veterinarians in East Africa. Tropical
Animal Health and Production, 38(3): 171-184.
CBS. 2014. Survei Sosial Ekonomi Nasional 2014 Triwulan 3 [Enumeration of
national socioeconomic survey (SUSENAS) 2014 third quarter; in Bahasa
Indonesia]. Available at http://nunukankab.bps.go.id/?hal=kegiatan_detil&id=8.
Retrieved 26 January 2015.
Chilonda, P. & Otte, J. 2006. Indicators to monitor trends in livestock
production at national, regional and international levels. Livestock Research for
Rural Development, 18(8).
CSA. 2013. Ethiopia: livestock sample survey 2012-2013 (2005 E.C). Central
Statistical Agency, Ministry of Finance and Economic Development. Ethiopia.

72
CSO. 2008. Revised 2004 Botswana agricultural census report. Central
Statistics Office. Gaborone, Republic of Botswana.
Danielewitz, T. 2014. Tanzania - Development of a national statistical system
for Tanzania: P107722 - implementation status results report: sequence 04.
World Bank Publication: Washington, D.C.
Davies, C. 2009. Area frame design for agricultural surveys. National
Agricultural Statistics Service, United States Department of Agriculture
Publication: Washington, D.C.
DCAIS. 2013. Analisis PDB Sektor PertanianTahun 2013 [Analysis of
agricultural sector GDP: year 2013] [in Bahasa Indonesia]. Data Center and
Agricultural Information System, Ministry of Agriculture. Indonesia.
de Mel, S., McKenzie, D. J. & Woodruff, C. 2009. Measuring microenterprise
profits: must we ask how the sausage is made? Journal of Development
Economics, 88(1): 19-31.
DEFRA. 2010. Survey of agriculture, horticulture and labour - 1 June 2010:
questionnaire. Department of Environment, Food and Rural Affairs. United
Kingdom.
DEFRA. 2014. June survey of agriculture and horticulture: methodology.
Department of Environment, Food and Rural Affairs. United Kingdom.
DGLAH. 2012. Petunjuk Teknis Pengumpulan dan Penyajian Data Peternakan
[Technical guidelines for the collection and presentation of livestock data; in
Bahasa Indonesia]. Directorate General of Livestock and Animal Health.
Jakarta, Indonesia.
Dillon, B. 2012. Using mobile phones to collect panel data in developing
countries. Journal of International Development, 24(4): 518-527.
Dorward, A., Anderson, S., Paz, R., Pattison, J., Vera, E. S., Nava, Y. &
Rushton, J. 2004. A guide to indicators & methods for assessing the
contribution of livestock keeping to livelihoods of the poor. Department of
Agricultural Sciences, Imperial College London Publication: Kent, United
Kingdom.

73
East Java Provincial Livestock Services. 2011. Petunjuk Teknis Pengumpulan
Data Peternakan [Technical instructions: livestock data collection; in Bahasa
Indonesia]. Surabaya, Indonesia.
Egeru, A., Wasonga, O., Kyagulanyi, J., Majaliwa, G. M., MacOpiyo, L. &
Mburu, J. (2014). Spatio-temporal dynamics of forage and land cover changes
in Karamoja sub-region, Uganda. Pastoralism: Research , Policy and Practice,
4(6): 1-21.
Elliott, M. & McDonnell, P. 2007. Request from the UK to use the bovine
registers of Great Britain and Northern Ireland in replacement of statistical
surveys. Surveys, Statistics and Food Economics Division, Department of
Environment, Food and Rural Affairs, United Kingdom.
European Commission. 2014. Eurostat report on the quality of livestock and
meat statistics: outcome of the reporting exercise conducted under Regulation
(EC) No. 1165/2008. Eurostat, Directorate E: Sectoral and regional statistics,
Unit E-1: Agriculture and fisheries. European Commission Publication:
Brussels, Belgium.
Fabi, C., Campeanu, M. & Sakoff, N. 2012. Evaluation of countries
responses to FAO questionnaires. Paper presented at the Twenty-Fourth
Session of the Asia and Pacific Commission on Agricultural Statistics, 8-12
October 2012. Da Lat, Vietnam.
FAO. 1999. Poverty alleviation and food security in Asia: role of livestock.
RAP Publication 1999/4. Food and Agriculture Organization of the United
Nations, Regional Office of Asia and the Pacific. Bangkok.
FAO. 2005. A system of integrated agricultural censuses and surveys. FAO
Publication: Rome.
FAO. 2010. Indonesia country update: current and planned collection of
agricultural statistics. Available at
https://www.google.com/url?q=http://www.fao.org/fileadmin/templates/ess/doc
uments/meetings_and_workshops/APCAS23/documents_OCT10/APCAS-10-
11Indonesia_Ctry_report.doc&sa=U&ei=VCPDVJvcIMOmyAScjIKIBw&ved
=0CAUQFjAA&client=internal-uds-
cse&usg=AFQjCNFsiqvpmN7aOWoYDCbael8YbcAA5w. Retrieved 24
January 2015.

74
FAO. 2014. Technical report on the integrated survey framework. FAO
Publication: Rome.
Farmer, E. 2010. End market analysis of Ethiopian livestock and meat: a desk
study. microREPORT #164. USAID Publication: Washington, D.C.
GSARS. 2015. Handbook on Master Sampling Frames for Agricultural
Statistics, GSARS Publication: Rome. Available at http://gsars.org/handbook-
on-master-sampling-frames-for-agricultural-statistics/. Accessed on 16 March
2016.
Halberg, N., van der Werf, H.M.G., Basset-Mens, C., Dalgaard, R. & de
Boer, I.J.M. 2005. Environmental assessment tools for the evaluation and
improvement of European livestock production systems. Livestock Production
Science, 96(1): 33-50.
Hardjo, S.H. 2012. 2013 census of agriculture in Indonesia. Paper presented at
the Twenty-Fourth Session of the Asia and Pacific Commission on Agricultural
Statistics, 8-12 October 2012. Da Lat, Vietnam.
Hardjo, S.H. 2014. In-depth country assessments: Indonesia experience. Paper
presented at the Twenty-Fifth Session of the Asia and Pacific Commission on
Agricultural Statistics, 18-21 February 2014. Vientiane.
Himelein, K., Eckman, S. & Murray, S. 2014. Sampling nomads: a new
technique for remote, hard-to-reach and mobile populations. Journal of Official
Statistics, 30(2): 191-213.
Holland, T. 2012. Improving agricultural statistics in Tanzania: results of
USDA and FAO-USDA assessments. Paper presented at the Improving Statistics
for Food Security, Sustainable Agriculture and Rural Development: Country
Assessment Workshop, 21 June 2012. Kigali.
IAEA. 2008. Guidelines for sustainable manure management in Asian livestock
production systems. International Atomic Energy Agency Publication: Vienna.
IBGE. 2006. Censo agropecuario 2006: resultados preliminares [in
Portuguese]. Instituto Brasileiro de Geografia e Estatística. Rio de Janeiro,
Brazil.
75
iSIKHNAS. 2015. Indonesian animal health information systems [in Bahasa
Indonesia]. Available at https://www.isikhnas.com/id. Retrieved 9 February
2015.
Joshi, D.D. 2011. Draught animals in Asia. In Myers, M.L. (ed.), Encyclopedia
of Occupational Health and Safety. International Labour Organization
Publication: Geneva, Switzerland.
Ladner, M.D., Wingenbach, G.J. & Raven, M.R. 2000. Internet and paper-
based collection methods in agricultural education research. Journal of
Southern Agricultural Education Research, 52(1), 40-51.
LDIA. World Bank. 2011. Challenges in collecting household level livestock
data in Africa: workshop summary report - Rome, IFAD Headquarters, 30 June
- 1 July 2011. World Bank Publication: Washington D.C.
Lesnoff, M. 2008. Evaluation of 12-month interval methods for estimating
animal-times at risk in a traditional African livestock farming system.
Preventive Veterinary Medicine, 85(1–2): 9-16.
Lesnoff, M., Lancelot, R., Moulin, C.-H., Messad, S., Juanès, X. & Sahut,
C. 2011. Calculation of demographic parameters in tropical livestock herds - a
discrete time approach with LASER animal-based monitoring data. Editions
Quae, CIRAD: Montpellier, France.
Leta, S. & Mesele, F. 2014. Spatial analysis of cattle and shoat population in
Ethiopia: growth trend, distribution and market access. SpringerPlus, 3(1): 310.
Lima, V.M.B., Bornstein, C.T. & Cukierman, H.L. 2006. The Brazilian
bovine traceability system - a critical appraisal. Estudos Sociedade e
Agricultura, 14(1): 49-87.
MAFF. 2007a. 畜産物流通調査の概要 [Overview of livestock products
distribution investigation; in Japanese]. Available at
http://www.maff.go.jp/j/tokei/kouhyou/tikusan_ryutu/gaiyou/index.html#6.
Retrieved 3 March 2015.
MAFF. 2007b. 牛乳乳製品統計調査の概要 [Overview of milk dairy
statistical survey; in Japanese]. Available at
http://www.maff.go.jp/j/tokei/kouhyou/gyunyu/gaiyou/index.html#1. Retrieved
24 February 2015.
76
MAFF. 2007c. [Slaughterhouses statistical survey (daily); in Japanese].
Available at
https://www.seisen.maff.go.jp/seisen/bs04b040md001/BS04B040UC060SC001
-Evt001.do. Retrieved 3 March 2015.
MAFF. 2010. Questionnaire for survey of agriculture and forestry
management entities. Ministry of Agriculture, Forestry and Fisheries. Tokyo.
Mapunda, A., Chassama, J. & Pica-Ciamarra, U. 2011. Livestock market
data: collection, dissemination and use in Tanzania. FAO Publication: Rome.
Margono, H. 2013. Agricultural statistical system, country case: Indonesia.
Paper presented at the First RAP Regional Workshop on Building Training
Resources for Improving Agricultural and Rural Statistics, 5-9 August 2013.
Daejeon, Republic of Korea.
Metaferia, F., Cherenet, T., Gelan, A., Abnet, F., Tesfay, A., Ali, J.A. &
Gulilat, W. 2011. A review to improve estimation of livestock contribution to
the national GDP. Ministry of Finance and Economic Development and
Ministry of Agriculture Publication. Addis Ababa.
Mille, G., Touch, F., Baran, E., Nasielski, J., Saray, S., Tan, S., Tress, J.,
Cheach, M., Khun, S., Men, P. R. & Srey, S. 2015. A digital approach to
surveys in developing countries. In Lee, G. Industrial electronics and
engineering. WIT transactions on engineering sciences. Vol. 93. WIT Press:
Southampton, UK.]
Ministry of Agriculture. Republic of India. 2014. 19th livestock census -
2012: all India report. Department of Animal Husbandry, Dairying and
Fisheries. New Delhi.
MLA. 2014. Australian supply brief: MLA and AWI wool and sheepmeat
survey: June 2014 results. Meat and Livestock Australia Publication: Sydney,
Australia.
MLA. 2015. MLA and AWI wool and sheepmeat survey: February 2015. Meat
and Livestock Australia Publication: Sydney, Australia.
Morey, P. 2011. Dairy industry development in Indonesia. Morelink Asia
Pacific: Victoria, Australia.

77
Morgan, N. & Hollis, S. 2013. Livestock data in the United States: how is it
collected? World Bank Publication: Washington, D.C.
Morgan, N. & Ring, A. (2013). Livestock data survey of participants in the
12th livestock donor group meeting. World Bank Publication: Washington,
D.C.
Mothibi, R.K. 2009. Manufacturing statistics country practices: Botswana.
Paper prepared for the Workshop on Manufacturing Statistics, 4-7 May 2009.
Lusaka.
Murphy, R. & Simpson, G. 2013. Balancing dairy production and profits in
northern Australia. Department of Agriculture, Fisheries and Forestry
Publication: Toowoomba, Queensland, Australia.
NASS. 2009a. Guide to NASS surveys: cattle inventory. Available at
http://nass.usda.gov/Surveys/Guide_to_NASS_Surveys/Cattle_Inventory/index.
asp. Retrieved 1 February 2015.
NASS. 2009b. Guide to NASS surveys: dairy products. Available at
http://nass.usda.gov/Surveys/Guide_to_NASS_Surveys/Dairy_Products/index.a
sp. Retrieved 1 February 2015.
NASS. 2009c. Guide to NASS surveys: hog inventory. Available at
http://nass.usda.gov/Surveys/Guide_to_NASS_Surveys/Hog_Inventory/index.a
sp. Retrieved 1 February 2015.
NASS. 2009d. Guide to NASS surveys: livestock slaughter. Available at
http://nass.usda.gov/Surveys/Guide_to_NASS_Surveys/Livestock_Slaughter/in
dex.asp. Retrieved 1 February 2015.
NASS. 2009e. Guide to NASS surveys: poultry slaughter. Available at
http://nass.usda.gov/Surveys/Guide_to_NASS_Surveys/Poultry_Slaughter/inde
x.asp. Retrieved 1 February 2015.
NASS. 2009f. Guide to NASS surveys: turkey hatchery. Available at
http://nass.usda.gov/Surveys/Guide_to_NASS_Surveys/Turkey_Hatchery/index
.asp. Retrieved 1 February 2015.

78
NASS. 2009g. Guide to NASS surveys: turkeys raised. Available at
http://nass.usda.gov/Surveys/Guide_to_NASS_Surveys/Turkeys_Raised/index.
asp. Retrieved 1 February 2015.
NASS. 2013a. Guide to NASS surveys: broiler hatchery. Available at
http://nass.usda.gov/Surveys/Guide_to_NASS_Surveys/Broiler_Hatchery/index
.asp. Retrieved 1 February 2015.
NASS. 2013b. Guide to NASS surveys: chickens and eggs. Available at
http://nass.usda.gov/Surveys/Guide_to_NASS_Surveys/Chickens_and_Eggs/in
dex.asp. Retrieved 1 February 2015.
NASS. 2013c. Guide to NASS surveys: milk production. Available at
http://nass.usda.gov/Surveys/Guide_to_NASS_Surveys/Milk_Production/index.
asp. Retrieved 1 February 2015.
NBS. 2008. Basic information document: national panel survey (NPS 2008-
2009). National Bureau of Statistics. Dar Es Salaam.
NBS. 2011a. National household budget survey 2007. National Bureau of
Statistics. Dar Es Salaam.
NBS. 2011b. National sample census of agriculture 2007/2008: Volume 1:
Technical and operational report. National Bureau of Statistics. Dar Es Salaam.
NBS. 2014a. National panel survey basic information document 2012-2013.
National Bureau of Statistics. Dar Es Salaam.
NBS. 2014b. Tanzania - National panel survey 2010-2011, wave 2. National
Bureau of Statistics. Dar Es Salaam.
NBS & OCGS. 2010. Tanzania statistical master plan: 2009/10 - 2013/14.
National Bureau of Statistics and Office of Chief Government Statistician. Dar
Es Salaam.
Njuki, J., Poole, J., Johnson, N., Baltenweck, I., Pali, P., Lokman, Z. &
Mburu, S. 2011. Gender, livestock and livelihood indicators. Version 2.
International Livestock Reasearch Institute Publication: Nairobi.
Nsiima, L., Pica-Ciamarra, U., Baker, D. & Gabriel, S. 2013a. Technical
conversion factors for agricultural statistics: expert opinions versus direct

79
measurement in the Tanzania livestock sector. Paper presented at the Sixth
International Conference on Agricultural Statistics, 23-25 October 2013. Rio de
Janeiro, Brazil.
Nsiima, L., Pica-Ciamarra, U., Baker, D. & Simbila, G. 2013b. Technical
conversion factors for agricultural statistics: sank into oblivion? The case of
Tanzania livestock statistics. Paper presented at the 59th ISI World Statistics
Congress, 25-30 August 2013. Hong Kong.
NSS. Commonwealth of Australia. 2004. Poultry and game birds slaughtered,
quarter ending September 2004. Available at
http://www.nss.gov.au/nss/home.NSF/surveylookup/Poultry+and+Game+Birds
+Slaughtered+Quarter+Ending+September+2004+Header+Document?OpenDo
cument. Retrieved 3 February 2015.
OECD. 2002. Measuring the non-observed economy: a handbook.
Organisation for Economic Co-operation and Development Publication: Paris.
Ojigo, D.O. & Daborn, C.J. 2013. Communications and data collection:
lessons from studies in the extensive livestock production areas of Kenya.
Journal of Exotic Pet Medicine, 22(1): 39-45.
Okello, P., Sserugga, J., Nsiima, L., Mwisomba, T., Issa, A. & Pica-
Ciamarra, U. 2013a. Recent advancements in livestock statistics. Paper
presented at the Twenty-Fifth Session of the Asia and Pacific Commission on
Agricultural Statistics, 18-21 February 2014. Vientiane.
Okello, P., Sserugga, J., Pica-Ciamarra, U. & Baker, D. 2013b.
Administrative records for official statistics: food for thought on Uganda's
livestock data. Paper presented at the Sixth International Conference on
Agricultural Statistics. 23-25 October 2013. Rio de Janeiro, Brazil.
Oladele, O. & Monkhei, M. 2008. Gender ownership patterns of livestock in
Botswana. Livestock Research for Rural Development, 20(10).
Oparinde, A. O. & Birol, E. 2008. Impacts of HPAI on rural livelihoods:
conceptual and analytical frameworks. International Food Policy Research
Institute Publication: Washington, D.C.

80
Pica-Ciamarra, U. & Baker, D. 2011. Supply and demand of livestock data in
sub-Saharan Africa: evidence from a stakeholder survey. African Statistical
Newsletter, 5(2), 32-35.
Pica-Ciamarra, U., Baker, D., Morgan, N., Zezza, A., Azzarri, C., Ly, C.,
Nsiima, L., Nouala, S., Okello, P. & Sserugga, J. 2014. Investing in the
livestock sector - why good numbers matter: a sourcebook for decision makers
on how to improve livestock data. International Bank for Reconstruction and
Development/The World Bank Publication: Washington D.C.
PMO-RALG. 2015. Monthly report on agricultural development programme
of a village/ward: questionnaire. Prime Minister's Office - Regional
Administration and Local Governments Publication: Dodoma, Tanzania.
Sakai, M. 2014. Changes in 2015 census of agriculture and forestry in Japan.
Paper presented at the Twenty-fifth Session of the Asia and Pacific
Commission on Agricultural Statistics, 18-21 February 2014. Vientiane.
Samphantharak, K. & Townsend, R.M. 2009. Households as corporate
firms: constructing financial statements from integrated household surveys.
Cambridge University Press: Cambridge, UK.
Shangodoyin, D.K. & Lasisi, T.A. 2011. The role of statistics in national
development with reference to Botswana and Nigeria statistical systems.
Journal of Sustainable Development, 4(3): 131-135.
Sserugga, J., Okello, P. & Pica-Ciamarra, U. 2013. Uganda: identifying and
producing core livestock indicators. FAO Publication: Rome.
Stanton, Emms & Sia. 2010. Competitive industry report on the Indonesian
cattle and goats sectors: opportunities for Canadian animal genetics. (L24).
Paper prepared for the Embassy of Canada in Inonesia and Office of Southeast
Asia Regional Agri-Food trade Commissioner, Agirculture and Agri-Food
Canada.
Statistics Botswana. 2014. 2012 annual agricultural survey report. Gaborone.
Statistics Botswana. 2015. 2015 agricultural census. Available at
http://www.cso.gov.bw/images/agri_census.pdf. Retrieved 27 January 2015.
81
Statistics Canada. 2010. 2011 census of agriculture: questionnaire. Available
at http://www.statcan.gc.ca/sites/default/files/q11-eng.pdf. Retrieved 6 March
2015.
Statistics Canada. 2014. Livestock survey: data sources and methodology.
Available at
http://www23.statcan.gc.ca/imdb/p2SV.pl?Function=getSurvey&SDDS=3460#
a2. Retrieved 3 March 2015.
Statistics NZ. 2012. Agricultural production census: from 1 July 2011 to 30
June 2012: questionnaire. Statistics New Zealand and Ministry for Primary
Industries. Auckland, New Zealand.
Stehman, S.V. & Selkowitz, D.J. 2010. A spatially stratified, multi-stage
cluster sampling design for assessing accuracy of the Alaska (USA) National
Land Cover Database (NLCD). International Journal of Remote Sensing, 31(7):
1877-1896.
The European Parliament and the Council of the European Union. 2008.
Regulation (EC) No 1165/2008 of the European Parliament and of the Council
of 19 Novemeber 2008 concerning livestock and meat statistics and repealing
Council Directives 93/23/EEC, 93/24/EEC and 93/25/EEC.
Thornton, P.K. 2010. Livestock production: recent trends, future prospects.
Philosophical Transactions of the Royal Society B, 365(1554): 2853-2867.
Tobin, D., Thomson, J., Radhakrishna, R. & LaBorde, L. 2012. Mixed-
mode surveys: a strategy to reduce costs and enhance response rates. Journal of
Extension, 50(6), 1-5.
Turner, M. & Hiernaux, P. 2002. The use of herders’ accounts to map
livestock activities across agropastoral landscapes in Semi-Arid Africa.
Landscape Ecology, 17(5): 367-385.
USAID. 2013a. Best practices in agricultural statistics in APEC member
economies: baseline study. United States Agency for International
Development Publication: Washington, D.C.
USAID. 2013b. Value chain analysis for Ethiopia: expanding livestock markets
for the small-holder producers. AGP-Livestock Market Development Project,
USAID Publication: Washington D.C..

82
USDA. 2011. National agricultural statistics service: strategic plan for FY
2010-2015. United States Department of Agriculture, National Agricultural
Statistics Service: Washington, D.C.
World Bank, FAO and UN. 2010. Global strategy to improve agricultural and
rural statistics. Report number 56719-GLB. IBRD/World Bank Publication:
Washington, D.C.
World Bank. 2012. Collecting livestock data: a snapshot of survey methods.
World Bank Publication: Washington, D.C.
Wright, T. & Meylinah, S. 2013. Indonesia dairy and products annual report
2013. Global Agricultural Information Network, USDA Foreign Agricultural
Service: Washington, D.C.
Zezza, A., Federighi, G., Adamou, K. & Hiernaux, P. 2014. Milking the data
: measuring income from milk production in extensive livestock systems --
experimental evidence from Niger. Policy Research working paper.