Embed Size (px)
Citation preview

FAA Hughes Technical Center
Improving In-Service Inspection of Composite Structures
CACRC Inspection Task Group Update Application of Advanced NDI to Composite NDI
Improving In-Service Inspection of Composite Structures
CACRC Inspection Task Group Update Application of Advanced NDI to Composite NDI
All rights reserved. Disclosure of this document or any part thereof
to third parties or the use of any information therein is not permitted
except with prior written permission from the author or Sandia Labs.
Dennis RoachSandia National Labs
FAA Airworthiness Assurance Center

FAA Hughes Technical Center
ITG Team ParticipantsITG Team Participants
CACRC Inspection Task Group Members:
John Hewitt – Airbus (Co-chair)
Jim Hofer - Boeing
Jeff Kollgaard – Boeing
Kirk Rackow - Sandia Labs AANC
Dennis Roach - Sandia Labs AANC (Co-chair)
Glae McDonald - US Airways
Darrell Thornton – UPS
Richard Watkins - Delta Air Lines
Bob Stevens – United Airlines
Eric Bartoletti – American Airlines
Alex Melton - Northwest Airlines
Ana Tocalino - Embraer
Dave Galella, Al Broz, Rusty Jones, Larry Ilcewicz – FAA

FAA Hughes Technical Center
• Industry wide NDI Reference Standards
– Complete (SAE ARP5506 & 5507; DOE report distributed
in June 2004)
• NDI Assessment: Honeycomb Structures
– Experiments completed in early 2007
– DOT report in progress
• NDI Assessment: Solid Laminate Structures
– In process (specimen fabrication completed; exp.
protocols & final implementation planning remains)
• Miscellaneous Ongoing and Planned Studies
– Detection and quantification of weak bonds
– Affect of porosity, repairs & other impediments on NDI
– As required to support main tasks
– Can be initiated to support other task groups
CACRC Inspection Task Group ActivitiesCACRC Inspection Task Group Activities

FAA Hughes Technical Center
Composite Inspections &
Reference Standards
Composite Inspections &
Reference Standards
• Industry-wide composite reference standards developed to support damage assessment & inspection
• SAE Aerospace Recommended Practices (ARP 5605 & 5606) - adopted into Boeing and Airbus NDT Manuals
• Improve inspections of composite structures via introduction of advanced NDI methods
• Provides consistent approach to composite inspections - harmonized approach by OEMs worldwide
Optimized NDT
Reference Standards
Composite Structures on Boeing 787 Aircraft

FAA Hughes Technical Center
Goals of Composite Honeycomb
Flaw Detection Experiments
Goals of Composite Honeycomb
Flaw Detection Experiments
1) how well current inspection techniques are able to reliably find flaws in composite structures
2) the degree of improvements possible through the integration of more advanced NDI techniques and procedures.
Utilize airline inspectors to establish industry-wide performance curves that quantify:
• Statistically relevant and realistic flaw profiles
• Blind application of techniques to study hits, misses,
false calls, and flaw sizing

FAA Hughes Technical Center
What typ
e of flaw
s can
we expe
ct to find
?Myriad of Tap
Test Devices
Tap Testing at Maintenance DepotsTap Testing at Maintenance Depots

FAA Hughes Technical Center
Boeing Manual Tap HammerAirbus Manual Tap Hammer
S-9 Sondicator (LFBT)V-95 Mechanical Impedance Analysis
Conventional NDI Devices

FAA Hughes Technical Center
Wichitech Digital Tap Hammer
Mitsui Woodpecker withDigital Readout
Automated Tap Test Devices
CATT Instrumented
Tap Test System

FAA Hughes Technical Center
CATT Results on 6 Ply Fiberglass
0.25 1
1.75
2.5
3.25 4
4.75
5.5
6.25 7
7.75
8.5
9.25
10
10.75
11.5
12.25
13
13.75
14.5
15.25
16
16.5
15.75
15
14.25
13.5
12.75
12
11.25
10.5
9.75
9
8.25
7.5
6.75
6
5.25
4.5
3.75
3
2.25
1.5
0.75
in.
in.
0.00-0.18
0.18-0.36
0.36-0.54
0.54-0.72
0.72-0.90
0.90-1.09
1.09-1.27
1.27-1.45
1.45-1.63
1.63-1.81
Missed
Missed

FAA Hughes Technical Center
Thermography
MAUS
System
SAM System
Shearography
Wide Area and C-Scan Inspection MethodsWide Area and C-Scan Inspection Methods
PE Phased Array UT
UT Wheel Array
UltraImage Scanner

FAA Hughes Technical Center
MAUS
Image
Shearography
(LTI) Image
Ultrasonic Wheel Array
SAM Image
Thermography
(TWI) Image

FAA Hughes Technical Center
Implementation of Honeycomb
Flaw Detection Experiment
Implementation of Honeycomb
Flaw Detection Experiment

FAA Hughes Technical Center
Airlines, 3rd Party Maintenance and Adv.
NDI Organizations Who Have Participated
Airlines, 3rd Party Maintenance and Adv.
NDI Organizations Who Have Participated
Laser UT (Lock.-Martin)
Computer Aided Tap Tester (ISU)
Microwave Scanner (Evisive)
Thermography (TWI - 2)
Laminography (Digiray)
Shearography (LTI)
Air Coupled UT (ISU)
Structural Anomaly Mapping (Honeywell)
MAUS MIA & Resonance Scanner (Boeing)
Digital Radiography (Digiray)
Phased Array Ultrasonics (NDT Sol’ns)
Acoustography (Imperium)
Terahertz (GMA)

FAA Hughes Technical Center
Cumulative PoD - Woodpecker for All Panel Types
0
0.1
0.2
0.3
0.4
0.5
0.6
0.7
0.8
0.9
1
0 0.5 1 1.5 2 2.5 3
Flaw Size (Dia. in Inches)
Probability of Detection
3 Ply Fiberglass
Cumulative PoD - Woodpecker for All Panel Types
0
0.1
0.2
0.3
0.4
0.5
0.6
0.7
0.8
0.9
1
0 0.5 1 1.5 2 2.5 3
Flaw Size (Dia. in Inches)
Probability of Detection
3 Ply Fiberglass 3 Ply Carbon
Cumulative PoD - Woodpecker for All Panel Types
0
0.1
0.2
0.3
0.4
0.5
0.6
0.7
0.8
0.9
1
0 0.5 1 1.5 2 2.5 3
Flaw Size (Dia. in Inches)
Probability of Detection
3 Ply Fiberglass 3 Ply Carbon 6 Ply Fiberglass
Cumulative PoD - Woodpecker for All Panel Types
0
0.1
0.2
0.3
0.4
0.5
0.6
0.7
0.8
0.9
1
0 0.5 1 1.5 2 2.5 3
Flaw Size (Dia. in Inches)
Probability of Detection
3 Ply Fiberglass 3 Ply Carbon 6 Ply Fiberglass 6 Ply Carbon
Cumulative PoD - Woodpecker for All Panel Types
0
0.1
0.2
0.3
0.4
0.5
0.6
0.7
0.8
0.9
1
0 0.5 1 1.5 2 2.5 3
Flaw Size (Dia. in Inches)
Probability of Detection
3 Ply Fiberglass 3 Ply Carbon 6 Ply Fiberglass 6 Ply Carbon 9 Ply Fiberglass
Cumulative PoD - Woodpecker for All Panel Types
0
0.1
0.2
0.3
0.4
0.5
0.6
0.7
0.8
0.9
1
0 0.5 1 1.5 2 2.5 3
Flaw Size (Dia. in Inches)
Probability of Detection
3 Ply Fiberglass 3 Ply Carbon 6 Ply Fiberglass 6 Ply Carbon 9 Ply Fiberglass 9 Ply Carbon
Performance of Single Device (Woodpecker)
Over Range of Test Specimen Types
Performance of Single Device (Woodpecker)
Over Range of Test Specimen Types

FAA Hughes Technical Center
Performance of Multiple Devices for
A Single Type of Test Specimen
Performance of Multiple Devices for
A Single Type of Test Specimen
Cumulative PoD of All Conventional NDI Devices for 3 Ply Fiberglass
0
0.1
0.2
0.3
0.4
0.5
0.6
0.7
0.8
0.9
1
0 0.5 1 1.5 2 2.5 3
Flaw Size (Dia. in Inches)
Probability of Detection
Airbus Tap Hammer Boeing Tap Hammer LFBT MIA Wichitech DTH Woodpecker

FAA Hughes Technical Center
Conclusions – Composite Honeycomb NDIConclusions – Composite Honeycomb NDI
� 90% POD is not achieved for 1” dia. flaws; at 9 plies it exceeds 2” dia.
�Human factors issues (time, attention to detail, proper deployment)
�Some inspectors marked grids on panel to aid in coverage of inspection
area – most inspectors had good coverage; some followed random
pattern (find small flaws but miss large ones)
�Overall, MIA mode worked well (reliability, repeatability, ease of use)
How are we doing? – Flaw Detection with Conventional NDI
� Improvement in flaw detection ranged from 66% to 72%
� Automated deployment & data presentation/analysis reduces many
human factors concerns (100% coverage; flaw recognition on images)
� Allow for more rapid inspections
� MAUS, Thermography (sizing), Shearography all performed well
How can advanced NDI help? – Flaw Detection with More Sophisticated NDI

FAA Hughes Technical Center
Purpose
• Determine in-service flaw detection capabilities: 1) conventional NDT
methods vs. 2) improvements through use of advanced NDT.
• Optimize laminate inspection procedures.
• Compare results from hand-held devices with results from scanning
systems (focus on A-scan vs. C-scan and human factors issues in
large area coverage).
• Provide additional information on laminate inspections for the
“Composite Repair NDT/NDI Handbook” (ARP 5089).
An Experiment to Assess Flaw Detection
Performance in Composite Laminate Structures
An Experiment to Assess Flaw Detection
Performance in Composite Laminate Structures
A380 Section 19
737 Composite Horiz. Stabilizer

FAA Hughes Technical Center
Specimen Set - Flaw Detection in
Solid Laminate Composites
Specimen Set - Flaw Detection in
Solid Laminate Composites
Thickness Range:
12 – 64 plies

FAA Hughes Technical Center
Thick Laminate With Simple TaperThick Laminate With Simple Taper
Type 2 Specimen
.50"
2.00"
2.00"6.00"
10.00"
19.00"38.00"
22.00"
.625"
8.50"
4.125"
9.75"
5.50"
3.16"
3.50"
.625"
4.125"
38.00"
24.75"
3.19"
2.00" X 2.00" X .125" 6X
20 PLY
20 PLY
12 PLY
12 PLY
32 PLY
32 PLY
.50" STEP
.50" STEP
TYP
0 90
PLY ORIENTATION
UPPER
LOWER
1.50"
9.00"
3.50"
1.50" X 10.00" X .225" THK4X
(AIRBUS)
3.19" X 9.00" X .080" THK2X
(BOEING)

FAA Hughes Technical Center
Composite Laminate FabricationComposite Laminate Fabrication

FAA Hughes Technical Center
Contoured Test Panel with HoneycombContoured Test Panel with Honeycomb
18.00"
2.00"
6.00"
15.00"
20 PLIES(OR AS RECEIVED
PRE-MANUFACTUREDPARTS)
4.00"
2.50"
7.00"
2.50"
3.00" R
FLUSH HEAD FASTENER JOINT
FLAWS TO BE LOCATED INSEPARATION REGIONS (4X)
.250" THICK HONEYCOMB
INITIAL CURE: 85PSI
SEALED & FASTENED AFT SPAR
TAPER OF 10:1
FLUSH HEAD FASTENER JOINT
24 PLIES

FAA Hughes Technical Center
Contoured Test Panel - FabricationContoured Test Panel - Fabrication
Flaws in Aft Spar
Concentric FBH to
Simulate Impact Damage

FAA Hughes Technical Center
• Surface area & no. of flaws req’d (no. of specimens)
vs. time for inspector to complete experiment
� Trial inspections on simulated stabilizer by UA
inspectors – 2.9 to 3.9 ft.2 per hour
Experiment Design & ImplementationExperiment Design & Implementation
Simulated Vertical Stabilizer with Stringers, Rib Sections and Engineered Flaws
Three stringer-to-skin disbonds (yellow)
Two rib to-skin-partial disbonds (blue)

FAA Hughes Technical Center
Phased Array UT Inspection of Vertical Stabilizer Specimen
United Airlines
inspection with hand-
held P-E UT
MAUS – Resonance Mode

FAA Hughes Technical Center
• Process control alone may not ensure satisfactory bond
strength
• Must consider joint degradation - environmental effects of
moisture, aging, stress, fatigue
• Method must be a stiffness-based technique and/or able to
assess material properties
• Wave transmission modes may be sensitive to in-plane
displacements (interfacial changes)
• Requires high sensitivity (S/N) and possibly noise reduction
methods to recognize small changes in bonds
Enhanced Inspection Methods to
Characterize Bonded Joints:
Moving Beyond Flaw Detection to
Quantify Adhesive Strength
Enhanced Inspection Methods to
Characterize Bonded Joints:
Moving Beyond Flaw Detection to
Quantify Adhesive Strength

FAA Hughes Technical Center
Adhesive vs. Cohesive FailureAdhesive vs. Cohesive Failure
Cohesive Fracture of Adhesive Film(Option 6 silane treatment)
Adhesive Failure at Interface(Option 4 no chemical treatment)

FAA Hughes Technical Center
Angle Beam Ultrasonic Spectroscopy (ABUS)Angle Beam Ultrasonic Spectroscopy (ABUS)
• Compare received and transmitted waveforms in frequency domain; study
frequency/amplitude shifts & change in damping in FRF
• Oblique wave (broadband UT beam) introduces shear stress in the bond
line
• Difference between longitudinal wave and shear wave interrogation
-35
-30
-25
-20
-15
-10
-5
0
2 3 4 5 6 7 8
Bad bond
Good bond
Normal incidence reflection coefficient
Frequency (MHz)
Amplitude (dB)
-40
-30
-20
-10
0
0 2 4 6 8
Bad bond
Good bond
10Frequency (MHz)
Amplitude (dB)
Oblique incidence reflection coefficient
Frequency and Amplitude Shifts
Differentiate Bonds
Negligible Affects on Normal
Wave (?)

FAA Hughes Technical Center
Nonlinear UltrasonicsNonlinear Ultrasonics
• Exploit contact nonlinearity in imperfect bonds
• Swept frequency or chaotic drive signals to generate unique
harmonics
• Potential for introducing damage because incident energy levels
must be high
Requires high fidelity to avoid missed/false calls -
signal changes may be small (low S/N)
Good BondWeak Bond

FAA Hughes Technical Center
AANC Weak Bond Specimen ProductionAANC Weak Bond Specimen Production
•Screened mold release
•Diluted mold release
•Poor cure

FAA Hughes Technical Center
TTU of Weak Bond Specimens Show TrendsTTU of Weak Bond Specimens Show Trends
1 2
Pristine -
Best
1 2
30% MR
Dilution70% MR
Dilution
1 2
66% MR
Screen
1 2
33% MR
Screen
1 2
100 MR
1 2
Room
Temp.
1 2

FAA Hughes Technical Center
Conclusions on Weak Bond AssessmentsConclusions on Weak Bond Assessments
• Understanding physics of bond integrity is key – select
proper interrogation method (what do we exploit)
• One NDI method may not detect all sources of weak
bonds
• Several NDI techniques show promise
• Expected low signal-to-noise ratios provide the biggest
impediment; optimized excitation is important . . . .
• Ensure that inspection is truly nondestructive

FAA Hughes Technical Center
QMI
Sonda-007CX
Airscan
T
R
Air Coupled UltrasonicsAir Coupled Ultrasonics
Backside 1
Backside 2
Backside 3
Backside 1
Backside 2
Backside 3
Pixel resolution of 0.1”

FAA Hughes Technical Center
• Works by bathing the material in
microwave energy of an
essentially constant frequency
• The energy is reflected from each
interface of differing dielectric
constants within the specimen
• The reflected energy is
superimposed, creating a signal
that is acquired as an analog
voltage which is digitized
• This signal is sampled at
numerous discrete locations
across the sample to create a 2-D
image
Microwave Scanning (Evisive)Microwave Scanning (Evisive)
Automated scan table
Fiberglass Honeycomb Test Specimen

FAA Hughes Technical Center
Microwave NDI Results for 3 Ply
Fiberglass Panel
Microwave NDI Results for 3 Ply
Fiberglass Panel
Some difficulty with
carbon skin inspections

FAA Hughes Technical Center
• Sample surface is heated with a
pulse of electromagnetic
radiation from a flash lamp
• Heat from the surface diffuses
into the sample and is obstructed
by the presence of a subsurface
defect
• The accumulated heat energy at
the defect causes a transient
nonuniformity in the infrared
radiation
Flir A40 Uncooled IR Camera
Pulsed ThermographyPulsed Thermography
FAA Hughes Technical Center
Pulsed Thermography Inspection
Results for 6 Ply Panels
Pulsed Thermography Inspection
Results for 6 Ply Panels
1
2
3
4
5 6
7
8
9
All flaws detected
Carbon Skin Fiberglass Skin
FAA Hughes Technical Center
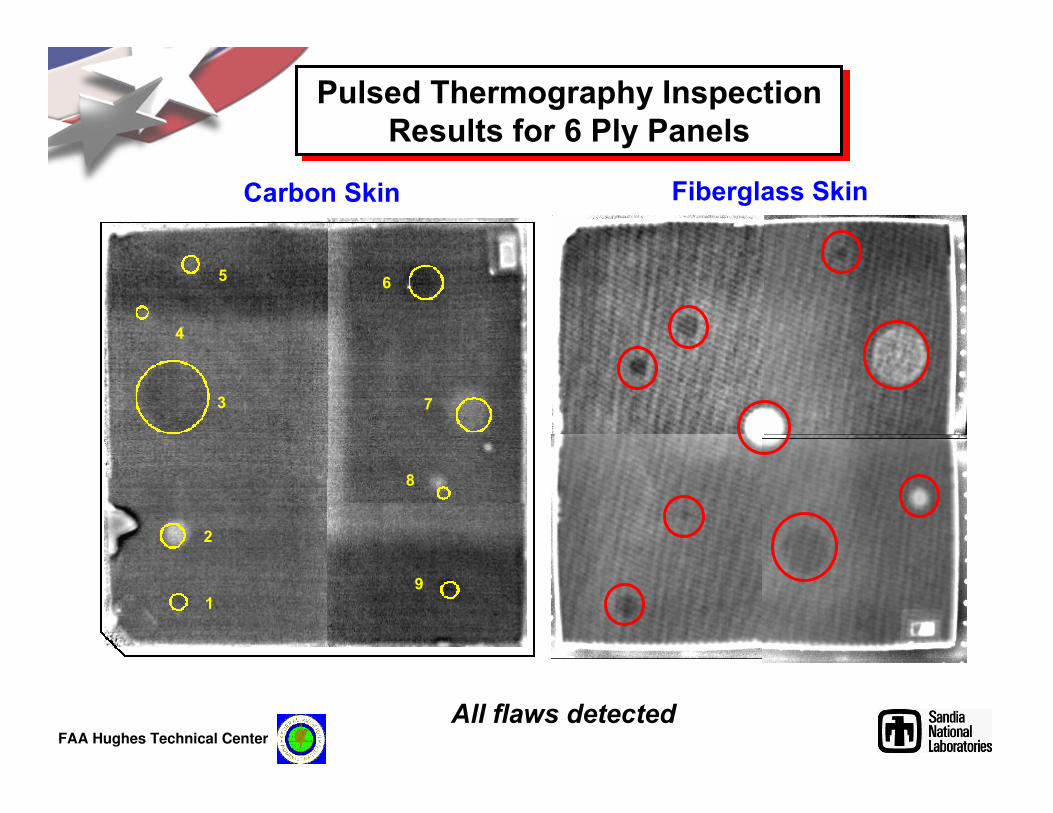
Disbond Detection & Growth Monitoring
with Piezoelectric Sensors
Disbond Detection & Growth Monitoring
with Piezoelectric Sensors
-0.3
-
0.
2
-
0.
1
0.
1
0.
2
0.
3
Voltage (V)
1000 2000 3000 400
0Time (S X 10-7)
Blue = Signal Through Good Bondline Region
Red = Signal Through Disbond Region
0
Piezoelectric Sensor Network
Sensor Data
Actuation Signal
Damage Detection
Damage Identification
Residual Strength Evaluation
Assessment for Continued Use
1 2 3 4
5 6 7 8
9 10 11 12
Sensor/Actuator
Structural Flaw

FAA Hughes Technical Center
Disbond Detection & Growth Monitoring
with Piezoelectric Sensors
Disbond Detection & Growth Monitoring
with Piezoelectric Sensors
Pull tab flawAfter mold release flaw growth(50 KHz inspection)
1.00"5.00"
1.00"
1.00"
MOLD RELEASE (C
REATE
WEAK BOND AREA)
1.00"
6.00"
PULL TAB
(CREATE LAMINATE-TO-
STEEL DISBOND)
3.00"

FAA Hughes Technical Center
CACRC Inspection Task Group Update and Overview on Advanced NDI Methods
for Composites
CACRC Inspection Task Group Update and Overview on Advanced NDI Methods
for Composites
Dennis RoachSandia National Labs
FAA Airworthiness Assurance Center(505)844-6078
All rights reserved. Disclosure of this document or any part thereof
to third parties or the use of any information therein is not permitted
except with prior written permission from the author or Sandia Labs.