Embed Size (px)
Citation preview

i
Improvement of Voltage and Power Flow Control in
the GCC Power Grid by using Coordinated FACTS
Devices
submitted by
Tariq Masood
for the degree of Doctor of Philosophy
of the
University of Bath
Department of Electronic and Electrical Engineering
September, 2012
COPYRIGHT
Attention is drawn to the fact that copyright of this thesis rests with its author. This copy of the thesis
has been supplied on the condition that anyone who consults it is understood to recognize that its
copyright rests with its author and that no quotation from the thesis and no information derived from it
may be published without the prior written consent of the author.
This thesis may be made available for consultation within the University Library and may be
photocopied or lent to other libraries for the purposes of consultation.
Signature of the Author . . . . . . . . . . . . . . . . . . . . …………………………. . . . . . . . .
Tariq Masood

ii
To my beloved late wife (IRSHAD BiBi 1974-2008) for her unmatched support throughout my
educational and professional career from 1984-2008. Unfortunately, I lost my beloved wife in a tragic
road accident on 05/05/2008. This is an irreversible loss for whole my family.
May the departed soul rest in peace. (Ameen)
DEDICATED

iii
I extend my special gratitude to my beloved Mother and Father for their blessed prayers for me
and my family’s continuous success and prosperity every time. Thanks for Almighty Allah bestow
countless blessings for me and my family members.
Special thanks to my newly wife Sajidan Perveen, she did commendable job to bridge the gap as a
new mother in particularly sharing love with a little Master. Abdullah Masood, Ali, Anus, Rehman and
Mehwash Masood and of course new baby Master. Essa Masood.
I also extend my special thanks to my Brothers and Sisters and their family members, Arif &
Rukhsan, Amjad & Khalida, Safdar & Amber and Suriay & Liaqat Ali.
SPECIALTHANKS

vi
First and foremost, this is a great pleasure to thank the many people who have helped me during my
stay in the University of Bath time to time since 2001.
First and foremost, I am very grateful to my supervisors, Professor Dr. Raj K. Aggarwal and Dr. Mil
Redferen, for their kind assistance and valuable discussions over the past three years and for all the
time and efforts have put into this research work in all possible means. I have inspired for their value-
added practical contribution, intellectual support and friendship. They have also shown a lot of
endurance over the period of time. WHEREAS, Professor Raj K. Aggarwal has proven to be beacon
of inspiration like a father and encouragement like a ‘Light in the Tunnel’, without his tireless
supervising efforts and support the completion of this project would undoubtedly not have been
possible. His genuine concerns for all his colleagues and students “wellbeing” and cheerful are highly
appreciated by everyone in the Center for Sustainable Power Distribution research group. It has truly
been an honour for me to have worked with him. I thank Professor Dr. Raj K. Aggarwal and Dr. Mil
Redferen for their guidance and encouragements throughout my time as a Ph.D student at the
University of Bath, Bath, UK.
I am also very much indebted to the Dr. Francis Robinson and Dr. Martin Balchin (Transfer Panel
Accessories’) for their wonderful input on my transfer report. They have thoroughly reviewed and
provided constructive recommendations against the findings to produce a high quality research work. I
would like to pay special gratitude to the Mr. Ken Bateup for carefully proofreading my research work
at University of Bath. This is an exceptional contribution to produce high quality work.
I would also like to thanks to Mr. Nasser J. Al-Kuwari (Manager Production, Dukhan Fields) and Mr.
Adel Amer El-Banna (Asst. Manager Production Optimization, Dukhan Fields) and Mr. Soud J. Al-
Ruwaili (Asst. Manager Operations RG Plant) for their unprecedented support, encouragement and
exceptional endowment throughout my professional and education career with the Qatar Petroleum
since 1997.
I would like to pay my special gratitude to my three mentors from the bottom of my heart, to the
Adjunct Professor Dr. Abdel-Ety Edris, at Santa Clare University-USA and Director/Executive
Advisor at Quanta Technology -USA , Professor Dr. D.P Kothari Director General Raisoni Group of
Institution, Nagpur-India and Professor Dr. Suhail Aftab Qureshi Electrical Engineering Department
at the University of Engineering and Technology Lahore Pakistan for their diligence support, guidance
ACKNOWLEDGEMENTS

v
and time they have provided to read my thesis carefully during the review process. They have
discussed multiple topics time to time and provided me recommendations against the findings in order
to produce a high quality work.
At the last but not least I also pay my special gratitude to all my well-wishers in particularly, Dr. Talib
Hussain Sial (former Admin DG to the President of Pakistan) Advocate. Muhammad Syed. Ch
(Higher Courts Multan, Punjab), Rana Khushi Muhammad (DO Education, Sialkot), Muhammad
Amin.Ch (Deputy Commissioner, Punjab), Muhammad Arshid.Ch (Admin officer at Pakistan Seed
Corporation, Khanewal), and Mahfooz Hussain (Service Manager at the National Car Company Doha
Qatar) for their wonderful moral support and encouragement throughout my educational and
professional career.
I am also very thankful to the Mrs. Dorcas Mumford post graduate officer for her wonderful support
and follow-up to complete my assignments and reports timely related to all aspects of the
postgraduate research programmes at the University of Bath, Bath, UK.

vi
This work presents HVDC/FACTS control device implementation framework in the Gulf cooperative
council’s countries. It comprises of five layers of FACTS control devices (STATCOM, SSSC, UPFC,
HVDC and centralized/De-centralized Control). This five-layer architecture is designed in order to
configure and produce the desired results; based on these outcomes, GCC power system network
control and operational problems can be identified and addressed within the control architecture on
the GCC power grid.
In the context of power FACTS-FRAME, this work is to identify and determine a number of power
systems operational and control problems which are persistent on the GCC power grid e.g. poor
voltage quality (SAG-Swell), poor load flow control, and limited power transfer capacity issues. The
FACTS-FRAME is configured and synthesized by integrating multiple FACTS control devices
(STATCOM, SSSC, UPFC) in parallel at different locations on the GCC power grid in order to meet
stringent power system control and operational requirements with improved power transfer capacity,
controllability and reliability.
The mathematical models are derived to indentify and determine operational constraints on the GCC
power grid by incorporating real-time and estimated data and the acquired desired results. Herein,
FACTS-FRAME is designed to handle distributed computation for intensive power system calculation
by integrating multiple FACTS devices on multiple networks within the GCC power network.
Distributed power flow algorithms are also derived in order to understand and implement centralized
and decentralized control topologies as appropriate. The simulation results indicate the feasibility of
FACTS devices implementation and their potential benefits under current operating conditions on the
GCC power grid.
ABSTRACT

vii
The FACTS technology has been developed to enhance the controllability of the synchronous power
transmission system, thus permitting its operation closer to the stability limits. The basically different
reasons for the existences of HVDC and FACTS have important consequences in the load flow
solutions particularly. Therefore, firstly power electronic based controllers were introduced in the
HVDC power transmission system for two purposes: regulation of power through HVDC link as well as
for modulation to improve power system stability (both angle and voltage). Similarly, the FACTS
controllers can be used to regulate power in critical power transmission lines and ease the congestion
in the electrical power system network by adjusting time-based required shunt and series
compensation. The major contributions of these devices are to provide continuous compensation
within a couple of cycles. That is why the HVDC/FACTS devices have a strong impact to improve load
flow, voltage quality and stability (both angular and voltage).
The first device is known as series compensation (SSSC). This device has a strong impact to improve
stability (power angular and voltage) and is small on load flow and voltage quality. Second device is
known as shunt compensation (STATCOM). This device has a strong impact on voltage quality and
medium positive impact on power system stability (both angular and voltage). The third device is
known as unified power flow control (UPFC/HVDC). As a contribution these devices have a strong
impact on load flow, stability and voltage quality. By implementing these devices on the GCC power
grid, we may witness flowing benefits.
Enhanced existing power system transfer capacity on the GCC power grid
Improved power system controllability and reliability on the GCC power grid
Enhanced power system operational flexibility on the GCC power grid
Addressing various equipment aging factors on the GCC power grid
SIGNIFICANCE OF THIS RESEARCH WORK IN
THE FIELD OF FACTS TECHNOLOGY
viii
List of Figures ------------------------------------------------------------------------------------------------------------------------------------------------------------------------------------------------------------------------------------------------------------------------------------------------------------------------------------------------------------------------------------------------------------------------------------------------------------------------------------------------------------------------------------------------------------------------------------------------------------------------------------------------------------------------------------------------------------------------------------------------------------------------------------------------------------------------------------------------------------------------------------------------------------------------------------------------------------------------------------------------------------------------------------------------------------------------------------------------------------------------------------------------------------------------------------------------------------------------------------------------------------------------------------------------------------------------------------------------------------------------------------------------------------------------------------------------------------------------------------------------------------------------------------------------------------------------------------------------------------------------------------------------------------------------------------------------------------------------------------------------------------------------------------------------------------------------------------------------------------------------------------------------------------------------------------------------------------------------------------------------------------------------------------------------------------------------------------------------------------------------------------------------------------------------------------------------------------------------------------------------------------------------------------------------------------------------------------------------------------------------------------------------------------------------------------------------------------------------------------------------------------------------------------------------------------------------------------------------------------------------------------------
xiii List of Tables xvii List of Abbreviations xviii List of Publications xx 1 Introduction 1.1 Problems to be investigated 1.2 Thesis preface 1.3 Power system’s current operations on the GCC power
grid 1.4 Challenges on the GCC power grid 1.5 Why HVDC/FACTS control devices required at GCC
Grid 1.5.1 STATCOM & SVC controllers operations 1.5.2 SSSC controller operations 1.5.3 Thyristor control series compensator (TCSC) 1.5.4 UPFC controller operations 1.5.5 HVDC Controller operations 1.6 Aim and objective 1.6.1 Thesis structure 1.7 Summary
22 22 22 24
26 27
27 27 28 29 30 30 31 33
2 Literature review 2.1 Introduction 2.2 Scope of literature review 2.2.1 Application of STATCOM control device 2.2.2 Application of SSSC control device 2.2.3 Application of UPFC control device 2.2.4 Application of HVDC power transmission system 2.3 Application of PID controller tuning 2.4 HVDC projects 2.5 FACTS projects 2.6 Summary
34 34 34 35 36 38 39 40 41 42 43
3 Power transmission lines modeling & series/shunt compensation
3.1 Introduction 3.2 Long transmission line model 3.3 Long transmission line compensation 3.4 Shunt compensation of the power transmission system 3.4.1 Shunt compensation 3.4.2 Real and reactive Power 3.4.3 Power swing damping 3.4.4 V&I curves and relationship 3.4.5 Shunt reactive compensation 3.4.6 Degree of shunt compensation 3.4.7 Shunt Capacitive Compensation 3.4.8 STATCOM operations 3.4.9 STATCOM benefits 3.5 Series compensation of the power transmission system 3.5.1 Series capacitive compensation 3.5.2 Degree of series compensation 3.5.3 Series compensation drawback 3.5.4 Voltage profile series compensator at undefined
location 3.5.5 Series compensation mode of operations 3.5.6 Power angle controlled by series compensator
44
44 44 46 46 48 50 51 52 52 52 53 55 55 56 57 58 58 59
59 59
TABLE OF CONTENTS
Contents
ix
3.5.7 Reactive power compensation 3.5.8 Alternate source of voltage injection 3.5.9 SSSC operations 3.5.10 SSSC control sequence 3.5.11 SSSC benefits 3.6 Principle of the series/shunt (UPFC) compensation 3.6.1 UPFC equivalent circuit 3.6.2 UPFC Phasor diagram 3.6.3 UPFC operations 3.6.4 UPF Controller benefits 3.7 Objective of the HVDC transmission line 3.7.1 HVDC link deliverable 3.7.2 VSC based transmission system 3.7.3 HVDC characteristics 3.7.4 Principle of AC/DC/AC conversion 3.7.5 HVDC challenges 3.7.6 Proposed HVDC link 3.7.7 FACTS devices outcomes 3.7.8 HVDC Application 3.7.9 HVDC and FACTS devices benefits 3.7.10 Economics consideration of HVDC and FACTS
devices 3.8 Summary
--------------------------------------------------------------------------------------------------------------------------------------------------------------------------------------------------------------------------------------------------------------------------------------------------------------------------------------------------------------------------------------------------------------------------------------------------------------------------------------------------------------------------------------------------------------------------------------------------------------------------------------------------------------------------------------------------------------------------------------------------------------------------------------------------------------------------------------------------------------------------------------------------------------------------------------------------------------------------------------------------------------------------------------------------------------------------------------------------------------------------------------------------------------------------------------------------------------------------------------------------------------------------------------------------------------------------------------------------------------------------------------------------------------------------------------------------------------------------------------------------------------------------------------------------------------------------------------------------------------------------------------------------------------------------------------------------------------------------------------------------------------------------------------------------------------------------------------------------------------------------------------------------------------------------------------------------------------------------------------------------------------------------------------------------------------------------------------------------------------------------------------------------------------------------------------------------------------------------------------------------------------------------------------------------------------------------------------------------------------------------------------------------------------------------------------------------------------------------------------------------------------------------------------------------------------------------------------------------------------------------------------------------------------------------------------------------------------------------------------------------------------------------------------------------------------------------------------
61 61 62 63 64 64 64 65 65 66 66 67 67 67 67 68 68 69 69 69 71
71
4 FACTS devices tuning and optimization by using PID, PD, PI controllers
4.1 Introduction 4.2 Novel Optimization Control Technique 4.2.1 PID and PI controllers optimization implementation 4.3 PID controller tuning framework 4.4 Control loop tuning methodology 4.4.1 Open loop tuning technique 4.4.2 Closed loop tuning technique 4.4.3 Ultimate method tuning technique 4.4.4 Trial and error tuning technique 4.5 PI Control model simulation technique 4.5.1 STATCOM & UPFC distributed PI control 4.5.2 SSSC distributed PI control 4.6 Observation 4.7 Results and discussion 4.8 Summary
72
72 73 75 78 82 82 82 83 84 86 87 88 89 91 91
5 STATCOM model case study (STATCOM connecting the Qatar and Bahrain in the GCC interconnection)
5.1 Introduction 5.1.1 GCC power system background information 5.1.2 STATCOM Mathematical model 5.1.3 Power system reinforcement plan in between
Qatar and Bahrain 5.1.4 STATCOM model’s distributed control 5.2 STATCOM controller selection process 5.2.1. Criteria Significance WBD: 5.2.2. Assessment criteria 5.2.3. Results review and final decision 5.2.4. Estimation principal rules 5.2.5. WBD strengths 5.2.6. WBD weakness 5.2.7. WBD comparative analysis with GA 5.3 STATCOM model’s case study (Qatar and Bahrain)
93
93 94 96 97
97 98 100 100 101 102 103 103 103 103

Contents
x
5.3.1 STATCOM optimized dynamic response 5.4 Observation 5.4.1 Effectiveness of the STATCOM of the Device 5.5 Results and discussion 5.6 Summary
--------------------------------------------------------------------------------------------------------------------------------------------------------------------------------------------------------------------------------------------------------------------------------------------------------------------------------------------------------------------------------------------------------------------------------------------------------------------------------------------------------------------------------------------------------------------------------------------------------------------------------------------------------------------------------------------------------------------------------------------------------------------------------------------------------------------------------------------------------------------------------------------------------------------------------------------------------------------------------------------------------------------------------------------------------------------------------------------------------------------------------------------------------------------------------------------------------------------------------------------------------------------------------------------------------------------------------------------------------------------------------------------------------------------------------------------------------------------------------------------------------------------------------------------------------------------------------------------------------------------------------------------------------------------------------------------------------------------------------------------------------------------------------------------------------------------------------------------------------------------------------------------------------------------------------------------------------------------------------------------------------------------------------------------------------------------------------------------------------------------------------------------------------------------------------------------------------------------------------------------------------------------------------------------------------------------------------------------------------------------------------------------------------------------------------------------------------------------------------------------------------------------------------------------------------------------------------------------------------------------------------------------------------------------------------------------------------------------------------------------------------------------------------------------------------------------------------------
104 105 106 107 108
6 SSSC model case study(SSSC connecting the Oman and UAE in the GCC interconnection
6.1 Introduction 6.1.1 GCC power system background information 6.1.2 Power System reinforcement plan in between the
Oman and UAE 6.1.3 SSSC mathematical model 6.1.4 SSSC model’s distributed control 6.2 SSSC controller selection process. 6.3 SSSC model’s case study (Oman and UAE) 6.3.1 SSSC optimized dynamic response 6.3.2 Effectiveness of the SSSC device 6.4 Observation 6.5 Results and discussion 6.6 Summary
109
109 111 111
113 115 116 118 119 120 122 122 123
7 UPFC model case study (connecting the KSA and Kuwait in the GCC interconnection)
7.1 Introduction 7.1.1 GCC power system background information 7.1.2 UPFC mathematical model 7.1.3 Power system reinforcement in between the Kuwait
and KSA 7.1.4 UPFC model’s distributed control 7.2 UPFC controller‘s selection process 7.3 UPFC operational strategy 7.3.1 Voltage control 7.3.2 Power flow control 7.3.3 Description of the UPFC circuit 7.4 UPFC operating performance 7.4.1 UPFC changing real power 7.4.2 UPFC changing reactive power. 7.4.3 UPFC changing local bus voltage 7.4.4 UPFC holding unity power factor 7.4.5 UPFC operating in SSSC mode 7.5 Effectiveness of the UPFC control device 7.5.1 Network performance without UPFC 7.5.2 Network performance with UPFC 7.5.2.1 Shunt part of UPFC operations 7.5.2.2 Series part of UPFC operations 7.5.2.3 UPFC device operations 7.6 Results and discussion 7.7 Summary
124
124 125 127
127 128 128 131 131 131 132 133 133 133 134 134 134 135 135 136 136 137 138 139 140
8 HVDC Implementation on the GCC power grid 8.1 Introduction 8.2 HDC Design criteria 8.2.1 HVDC transmission capacity 8.2.2 HVDC system performance 8.3 Design Studies 8.3.1 Design studies review 8.3.2 Reactive power management 8.3.3 Overvoltage control 8.3.4 Insulation coordination 8.4 Main equipment and major technical features
141
141 141 141 142 142 142 142 142 142
Contents
xi
8.4.1 Rectifier operations 8.4.2 Inverter operations 8.4.3 HVDC Equipments and configuration 8.4.3.1 Smooth reactor 8.4.3.2 AC breakers and DC switches 8.4.3.3 AC filters 8.4.3.4 DC filters. 8.5 HVDC model’s circuit description 8.5.1 Station No1. Rectifier control and operations 8.5.1.1 AC side power delivery 8.5.1.2 DC side power delivery 8.5.1.3 DC voltage balanced control loop 8.5.2 Station No 2 Inverter control and operations 8.5.2.1 AC side power delivery 8.5.2.2 DC side power delivery 8.5.2.3 DC voltage balanced control loop 8.6 Results/Conclusion 8.7 Summary
-----------------------------------------------------------------------------------------------------------------------------------------------------------------------------------------------------------------------------------------------------------------------------------------------------------------------------------------------------------------------------------------------------------------------------------------------------------------------------------------------------------------------------------------------------------------------------------------------------------------------------------------------------------------------------------------------------------------------------------------------------------------------------------------------------------------------------------------------------------------------------------------------------------------------------------------------------------------------------------------------------------------------------------------------------------------------------------------------------------------------------------------------------------------------------------------------------------------------------------------------------------------------------------------------------------------------------------------------------------------------------------------------------------------------------------------------------------------------------------------------------------------------------------------------------------------------------------------------------------------------------------------------------------------------------------------------------------------------------------------------------------------------------------------------------------------------------------------------------------------------------------------------------------------------------------------------------------------------------------------------------------------------------------------------------------------------------------------------------------------------------------------------------------------------------------------------------------------------------------------------------------------------------------------------------------------------------------------------------------------------------------------------------------------------------------------------------------------------------------------------------------------------------------------------------------------------------------------------------------------------------------------------------------------------------------------
142 143 145 145 145 146 146 147 148 148 148 149 149 149 150 151 151 152
9 FACTS-FRAME architecture to integrate FACTS
devices on the GCC power grid 9.1 Introduction 9.2 FACTS-FRAME system architecture 9.3 FACTS devices selection process 9.4 FACTS devices optimal location 9.4.1 Location no1 load center (Qatar & Bahrain) 9.4.2 Location no 2 critical substation ( UAE and Oman) 9.4.3 Location no 3 major load center (Kuwait and UAE) 9.5 FACTS devices decentralized control 9.6 FACTS devices Centralized control 9.7 FACT-FRAME case study 9.7.1 STATCOM control device operations 9.7.2 SSSC control device operations 9.7.3 UPFC control device operations 9.7.4 STATCOM, SSSC and UPFC devices distributed
control 9.8 Observations 9.8.1 Integrated STATCOM operations in the FACTS-
FRAME 9.8.2 Integrated SSSC operations in the FACTS-FRAME 9.8.3 Integrated UPFC operations in the FACTS-FRAME 9.9 FACTS controllers integration 9.9.1 FACTS controllers implementation 9.9.2 FACTS frame system architecture input data 9.10 Results and discussion
9.11 Summary
153
153 155 156 156 156 156 157 157 159 161 161 162 163 163
163 163 163 163 169 169 170 170 175 176
10 Significance of this research work 10.1 PI controller configuration parameters selection
process and significance 10.2 Internal and external controls significance 10.3 Operational and maintenance control significance 10.4 FACTS devices selection process & significance 10.5 STATCOM, SSSC & UPFC controllers’ significance
177 177
178 179 179 180
Contents
xii
11 Conclusions 12 Appendices 4.A set 1 PI controller simulation results for 400kV 4.B set 2 PI controller simulation results for 400kV 4.C set 3 PI controller simulation results for 400kV 4.D set 1 PI controller simulation results for 220kV 4.E set 2 PI controller simulation results for 220k 4.F set 3 PI controller simulation results for 220kV 5.A STATCOM control schematic in between the Bahrain & Qatar 6.A SSSC control schematic in between the UAE and Oman 7.A UPFC control schematic in between KSA and Kuwait 9.A Decentralized control schematic 9.B Centralized control schematic 9.C Integrated FACTS-FRAME control schematic 9.D STATCOM, SSSC & UPFC netted control schematic
----------------------------------------------------------------------------------------------------------------------------------------------------------------------------------------------------------------------------------------------------------------------------------------------------------------------------------------------------------------------------------------------------------------------------------------------------------------------------------------------------------------------------------------------------------------------------------------------------------------------------------------------------------------------------------
182 187 187 188 189 190 191 192 194
195
196 197 198 199 200
13 References 14 Index 15 Novelties and Contribution of this thesis 16 Bibliography (Author’s Resume) 17 Author’s Published papers and seminars on FACTS
Technology
201 206 208 211 212
xiii
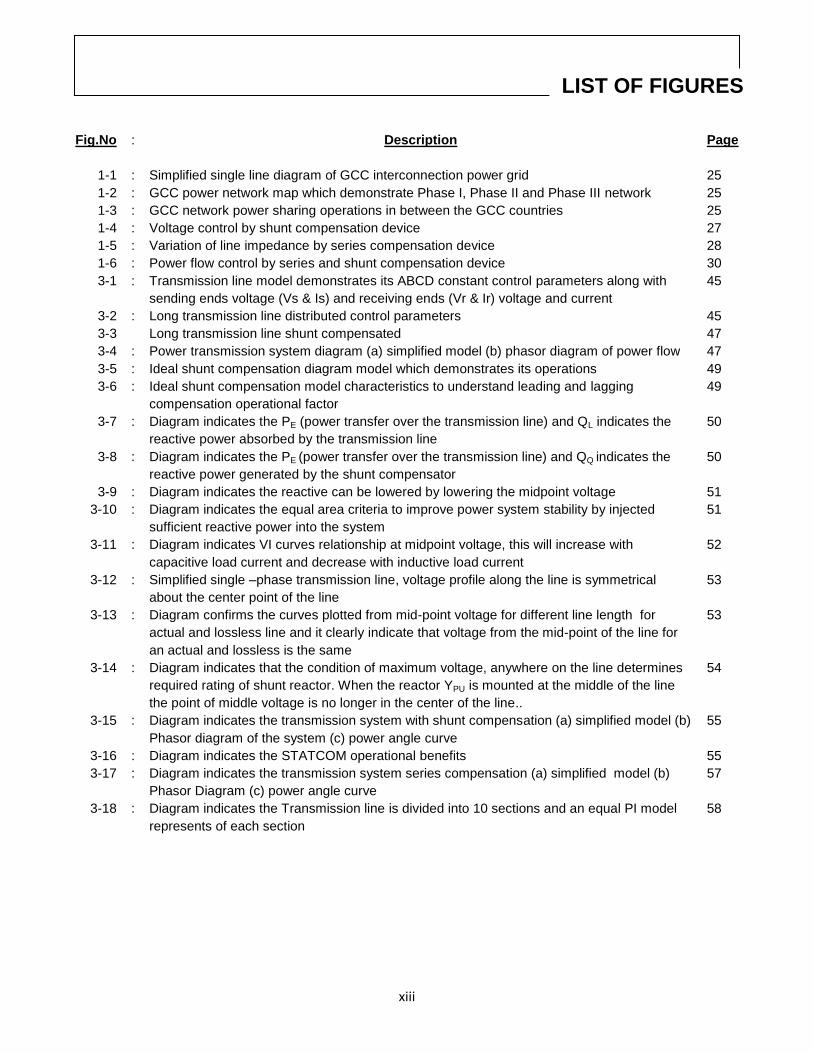
Fig.No : Description
Page
1-1 : Simplified single line diagram of GCC interconnection power grid 25
1-2 : GCC power network map which demonstrate Phase I, Phase II and Phase III network 25
1-3 : GCC network power sharing operations in between the GCC countries 25
1-4 : Voltage control by shunt compensation device 27
1-5 : Variation of line impedance by series compensation device 28
1-6 : Power flow control by series and shunt compensation device 30
3-1 : Transmission line model demonstrates its ABCD constant control parameters along with
sending ends voltage (Vs & Is) and receiving ends (Vr & Ir) voltage and current
45
3-2 : Long transmission line distributed control parameters 45
3-3 Long transmission line shunt compensated 47
3-4 : Power transmission system diagram (a) simplified model (b) phasor diagram of power flow 47
3-5 : Ideal shunt compensation diagram model which demonstrates its operations 49
3-6 : Ideal shunt compensation model characteristics to understand leading and lagging
compensation operational factor
49
3-7 : Diagram indicates the PE (power transfer over the transmission line) and QL indicates the
reactive power absorbed by the transmission line
50
3-8 : Diagram indicates the PE (power transfer over the transmission line) and QQ indicates the
reactive power generated by the shunt compensator
50
3-9 : Diagram indicates the reactive can be lowered by lowering the midpoint voltage 51
3-10 : Diagram indicates the equal area criteria to improve power system stability by injected
sufficient reactive power into the system
51
3-11 : Diagram indicates VI curves relationship at midpoint voltage, this will increase with
capacitive load current and decrease with inductive load current
52
3-12 : Simplified single –phase transmission line, voltage profile along the line is symmetrical
about the center point of the line
53
3-13 : Diagram confirms the curves plotted from mid-point voltage for different line length for
actual and lossless line and it clearly indicate that voltage from the mid-point of the line for
an actual and lossless is the same
53
3-14 : Diagram indicates that the condition of maximum voltage, anywhere on the line determines
required rating of shunt reactor. When the reactor YPU is mounted at the middle of the line
the point of middle voltage is no longer in the center of the line..
54
3-15 : Diagram indicates the transmission system with shunt compensation (a) simplified model (b)
Phasor diagram of the system (c) power angle curve
55
3-16 : Diagram indicates the STATCOM operational benefits 55
3-17 : Diagram indicates the transmission system series compensation (a) simplified model (b)
Phasor Diagram (c) power angle curve
57
3-18 : Diagram indicates the Transmission line is divided into 10 sections and an equal PI model
represents of each section
58
LIST OF FIGURES

List of Figures
xiv
Fig.No : Description
Page
3-19 : Diagram indicates that ideal series compensator is used to provide desired reactive in
order to meet power system operational requirements
59
3-20 : Diagram indicates the capacitive and inductive mode of operations of the series
compensator
60
3-21 : Diagram indicates the real power 0.5pu at 0 load angle, the real power will reverse if the
load angle <30 deg. Only very small amount of power will be transferred in capacitive
mode of operations. And total power will be reverse on inductive mode of operations
61
3-22 : Diagram indicates at 60% compensation the real power 2.6pu and a reactive power
requirement is 7.6pu. And at 10% compensation 0.2pu reactive power will be consumed
to transfer 1.1pu real power
61
3-23 : Diagram indicates the capacitive mode of operations, where the VQ will lag IS at 90 degree
(1.571 rad)
62
3-24 : Diagram indicates the inductive mode of operations, where the VQ will lead IS at 90 degree
(1.571 rad)
62
3-25 : Diagram indicates the SSSC control and operating parameters schematic 63
3-26 : Diagram indicates the SSSC schematic and closed control loop 63
3-27 : Diagram indicates the UPFC control schematic, which contains two SVS one is connected
into series and other connected into shunt to provide unified power flow in series and
shunt mode of operations
64
3-28 : Diagram indicates the UPFC equivalent circuit, the Ppq representing the real power
exchange in between shunt and series branches of UPFC. Vpq represents the voltage
through series compensator and Qpq reactive power injected by the compensator
64
3-29 : Indicates the Phsor diagram (a) shows the voltage regulation operations in the UPFC (b)
shows the line impedance which needs to be varied by compensation (c) phase shifting
through UPFC (d) indicates the UPFC control parameters
65
3-30 : Diagram indicates the UPFC operations in three scenarios, firstly if the load angle is equal
to zero then there is no power transferred from or to the AC system. Secondly, if the load
angle is 30 deg, then the power will be transferred at 1.0pu. thirdly, if the load angle
increased from 30 to 60 degree then the power will be transferred at 1.5pu
66
3-31 : Diagram indicates the conventional schematic of HVDC system, which may proposed in
between the Qatar and kingdom Saudi Arabia
67
3-32 : Diagram indicates all major HVDC and FACTS devices, their schematic and impact on
power transmission system performance. These device are used persuasively to control
three vital parameters (load flow, stability, and voltage quality)
70
3-33 : Diagram indicates the HVDC performance at different lengths of power transmission line
against the HVAC system
70

List of Figures
xv
Fig.No : Description Page
4-1 Function Block of Centralized control 74 4-2 Function Block of decentralized control 74 4-3 Control loop of FACTS device 75 4-4 First transfer function of the FACTS controller 76 4-5 Second transfer function of the FACTS controller 77 4-6 Third transfer function of the FACTS controller 77 4-7 : PI control loop’s Process error Ep against Integral AMPL output 79 4-8 : PI Control Loop Oscillations against the set point 80 4-9 : PD control loop’s process error against the derivative AMPL output 80
4-10 Interacting PID controller 81 4-11 : PI and PID control loops behavior 81 4-12 Process reaction curve 82 4-13 Closed loop tuning diagram 83 4-14 : Ultimate loop tuning method 84 4-15 : curve with no oscillation may not achieve set point (Proportional band is too wide) 84 4-16 : Curve with high oscillation _ is unstable (Proportional band is too low) 84 4-17 Response to a setpoint change typical behavior 85 4-18 : Trial and Error Tuning 85 4-19 : STATCOM & UPFC simulated models results at 400kV transmission line 90 4-20 : SSSC model simulated results at 220kV voltage level 91
5-1 : Simplified STATCOM control schematic to share and control 750MW at the Qatar side
and 600 MW at the Bahrain Side
94
5-2 STATCOM Control simulated model 95
5-3 : Proposed area (shaded) for the STATCOM implementation in between Qatar and
Bahrain
97
5-4 : Wideband Delphi Process Flow Diagram 99
5-5 : Wideband Delphi iteration estimation process 99
5-6 indicates STATCOM four waveforms (a) measured primary and secondary voltage (b)
reactive power (c) measured and reference voltage (d) DC voltage
105
5-7 STATCOM Control parameters (a) measured and reference voltage (b) Iq measured and
Iq reference (c) measured real and reactive power (d) Alpha firing angle control
106
5-8 Receiving end voltages at both side of Bahrain and Qatar without STATCOM (a)
receiving end voltage (b) sending end voltage
107
5-9 Receiving and sending ends improved voltages at both sides of Bahrain and Qatar with
STATCOM (a) receiving end improved voltage (b) sending end improved voltage
107
6-1 Simplified SSSC control schematic share/deliver 400MW power at the Oman side and
900MW at the United Arab Emirates
110
6-2 Proposed area (shaded) for SSSC implementation in between the United Arab Emirates and Oman
112
6-3 simulated SSSC control schematic in between Oman and United Arab Emirates 115
6-4 Network operational trends without SSSC (a) voltage injection (b) Iabc current (c) injection voltage magnitude and reference voltage (d) DC voltage (e) power exchange in between Oman and UAE (f) reactive compensation in between Oman and UAE
121
6-5 indicates the network operational trends with SSSC (a) voltage injection (b) Iabc current (c) injection voltage magnitude and reference voltage (d) DC voltage (e) power exchange in between Oman and UAE (f) reactive compensation in between Oman and UAE
122
List of Figures
xvi
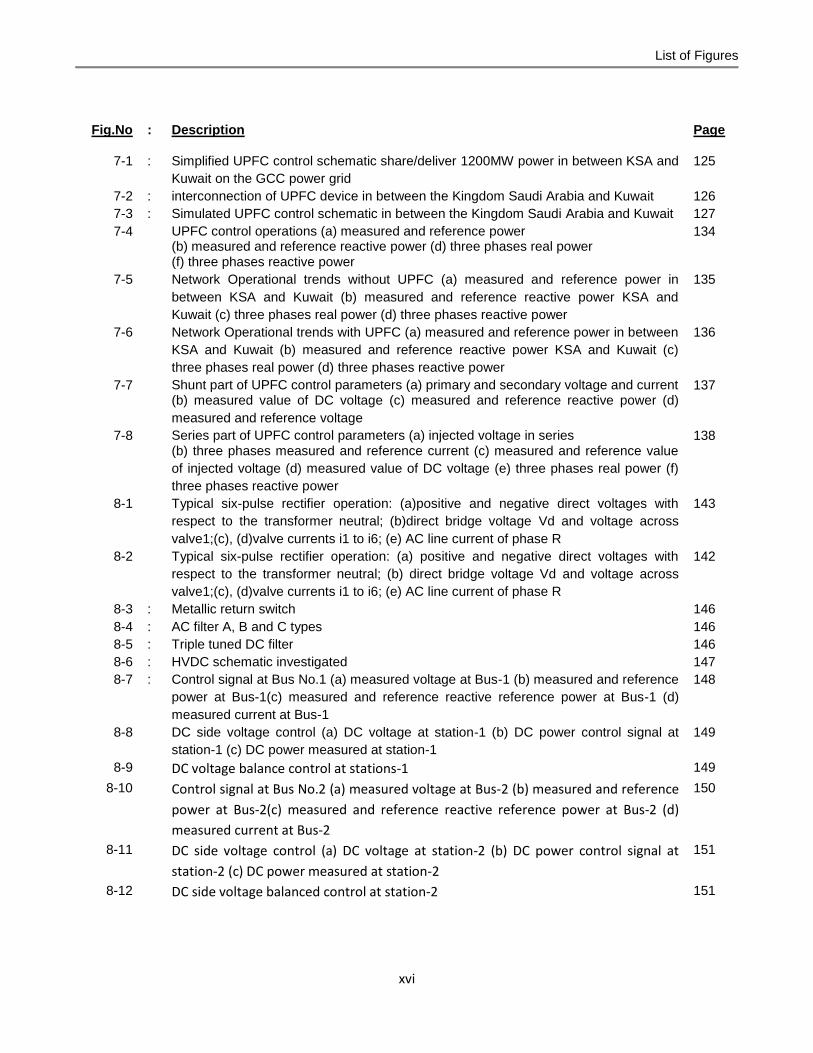
Fig.No : Description Page
7-1 : Simplified UPFC control schematic share/deliver 1200MW power in between KSA and
Kuwait on the GCC power grid
125
7-2 : interconnection of UPFC device in between the Kingdom Saudi Arabia and Kuwait 126
7-3 : Simulated UPFC control schematic in between the Kingdom Saudi Arabia and Kuwait 127
7-4 UPFC control operations (a) measured and reference power (b) measured and reference reactive power (d) three phases real power (f) three phases reactive power
134
7-5 Network Operational trends without UPFC (a) measured and reference power in
between KSA and Kuwait (b) measured and reference reactive power KSA and
Kuwait (c) three phases real power (d) three phases reactive power
135
7-6 Network Operational trends with UPFC (a) measured and reference power in between
KSA and Kuwait (b) measured and reference reactive power KSA and Kuwait (c)
three phases real power (d) three phases reactive power
136
7-7 Shunt part of UPFC control parameters (a) primary and secondary voltage and current (b) measured value of DC voltage (c) measured and reference reactive power (d)
measured and reference voltage
137
7-8 Series part of UPFC control parameters (a) injected voltage in series (b) three phases measured and reference current (c) measured and reference value
of injected voltage (d) measured value of DC voltage (e) three phases real power (f)
three phases reactive power
138
8-1 Typical six-pulse rectifier operation: (a)positive and negative direct voltages with
respect to the transformer neutral; (b)direct bridge voltage Vd and voltage across
valve1;(c), (d)valve currents i1 to i6; (e) AC line current of phase R
143
8-2 Typical six-pulse rectifier operation: (a) positive and negative direct voltages with
respect to the transformer neutral; (b) direct bridge voltage Vd and voltage across
valve1;(c), (d)valve currents i1 to i6; (e) AC line current of phase R
142
8-3 : Metallic return switch 146
8-4 : AC filter A, B and C types 146
8-5 : Triple tuned DC filter 146
8-6 : HVDC schematic investigated 147
8-7 : Control signal at Bus No.1 (a) measured voltage at Bus-1 (b) measured and reference
power at Bus-1(c) measured and reference reactive reference power at Bus-1 (d)
measured current at Bus-1
148
8-8 DC side voltage control (a) DC voltage at station-1 (b) DC power control signal at
station-1 (c) DC power measured at station-1
149
8-9 DC voltage balance control at stations-1 149
8-10 Control signal at Bus No.2 (a) measured voltage at Bus-2 (b) measured and reference
power at Bus-2(c) measured and reference reactive reference power at Bus-2 (d)
measured current at Bus-2
150
8-11 DC side voltage control (a) DC voltage at station-2 (b) DC power control signal at
station-2 (c) DC power measured at station-2
151
8-12 DC side voltage balanced control at station-2 151

List of Figures
xvii
Fig.No : Description Page
9-1 : Proposed FACTS devices implementation on the GCC power grid 155
9-2 : FACTS-FRAME system architecture 156
9-3 : Decentralized or independent control topology of the FACTS devices [Matlab] 158
9-4 : Decentralized STATCOM, SSSC and UPFC control devices control topology on the
GCC power grid
9-5 : Centralized or independent control topology of the FACTS devices [Matlab] 160
9-6 : Integrated STATCOM, SSSC and UPFC control devices on the GCC power grid 161
9-7 : Network operational trends without integrated STATCOM (a) primary and secondary
voltage and current (b) measured value of DC voltage (c) measured and reference
reactive power (d) measured and reference voltage
164
9-8 : Network operational trends with integrated STATCOM (a) primary and secondary
voltage and current (b) measured value of DC voltage (c) measured and reference
reactive power (d) measured and reference voltage
165
9-9 Network operational trends without integrated SSSC (a) injected voltage in series (b)
three phases measured and reference current (c) measured and reference value of
injected voltage (d) measured value of DC voltage (e) three phases real power (f)
three phases reactive power
165
9-10 Network operational trends with integrated SSSC (a) injected voltage in series (b)
three phases measured and reference current (c) measured and reference value of
injected voltage (d) measured value of DC voltage (e) three phases real power (f)
three phases reactive power
167
9-11 Network operational trends without integrated UPFC (a) measured and reference
power (b) measured and reference reactive power (d) three phases real power (f)
three phases reactive power
168
9-12 Network operational trends with integrated UPFC (a) measured and reference power (b) measured and reference reactive power (d) three phases real power (f) three phases reactive power
169
Abbreviations
xviii
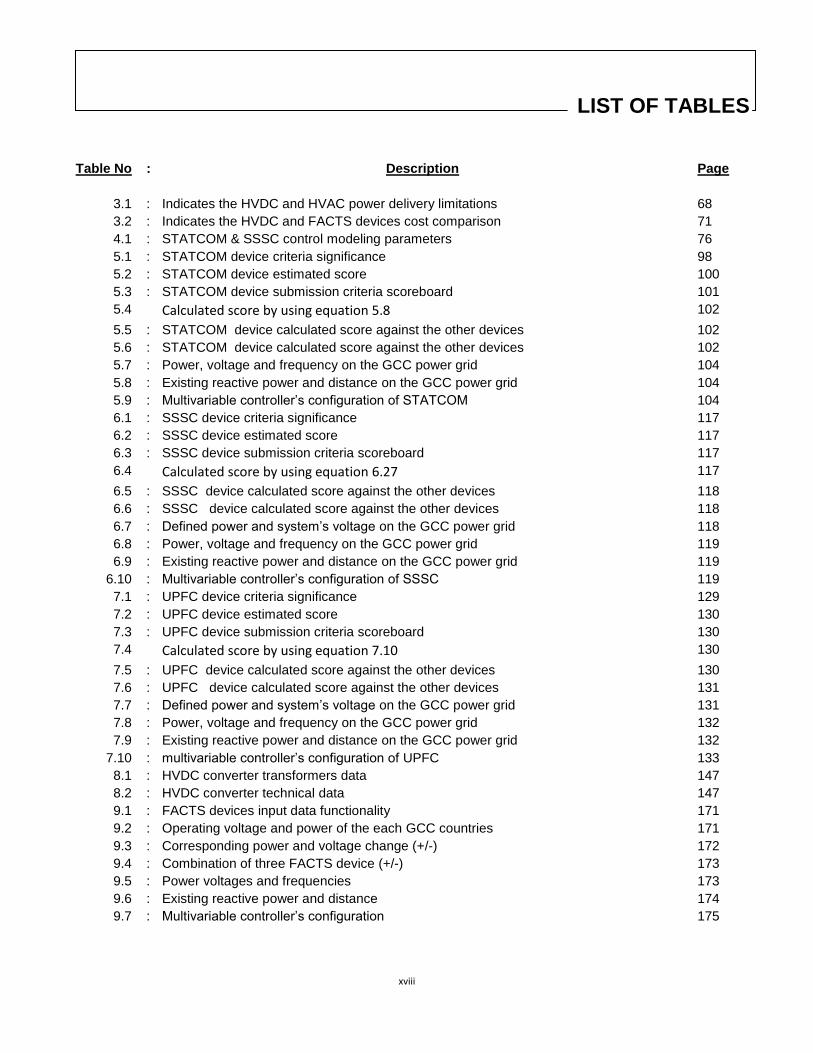
Table No : Description
Page
3.1 : Indicates the HVDC and HVAC power delivery limitations 68
3.2 : Indicates the HVDC and FACTS devices cost comparison 71
4.1 : STATCOM & SSSC control modeling parameters 76
5.1 : STATCOM device criteria significance 98
5.2 : STATCOM device estimated score 100
5.3 : STATCOM device submission criteria scoreboard 101
5.4 Calculated score by using equation 5.8 102
5.5 : STATCOM device calculated score against the other devices 102
5.6 : STATCOM device calculated score against the other devices 102
5.7 : Power, voltage and frequency on the GCC power grid 104
5.8 : Existing reactive power and distance on the GCC power grid 104
5.9 : Multivariable controller’s configuration of STATCOM 104
6.1 : SSSC device criteria significance 117
6.2 : SSSC device estimated score 117
6.3 : SSSC device submission criteria scoreboard 117
6.4 Calculated score by using equation 6.27 117
6.5 : SSSC device calculated score against the other devices 118
6.6 : SSSC device calculated score against the other devices 118
6.7 : Defined power and system’s voltage on the GCC power grid 118
6.8 : Power, voltage and frequency on the GCC power grid 119
6.9 : Existing reactive power and distance on the GCC power grid 119
6.10 : Multivariable controller’s configuration of SSSC 119
7.1 : UPFC device criteria significance 129
7.2 : UPFC device estimated score 130
7.3 : UPFC device submission criteria scoreboard 130
7.4 Calculated score by using equation 7.10 130
7.5 : UPFC device calculated score against the other devices 130
7.6 : UPFC device calculated score against the other devices 131
7.7 : Defined power and system’s voltage on the GCC power grid 131
7.8 : Power, voltage and frequency on the GCC power grid 132
7.9 : Existing reactive power and distance on the GCC power grid 132
7.10 : multivariable controller’s configuration of UPFC 133
8.1 : HVDC converter transformers data 147
8.2 : HVDC converter technical data 147
9.1 : FACTS devices input data functionality 171
9.2 : Operating voltage and power of the each GCC countries 171
9.3 : Corresponding power and voltage change (+/-) 172
9.4 : Combination of three FACTS device (+/-) 173
9.5 : Power voltages and frequencies 173
9.6 : Existing reactive power and distance 174
9.7 : Multivariable controller’s configuration 175
LIST OF TABLES
Abbreviations
xix
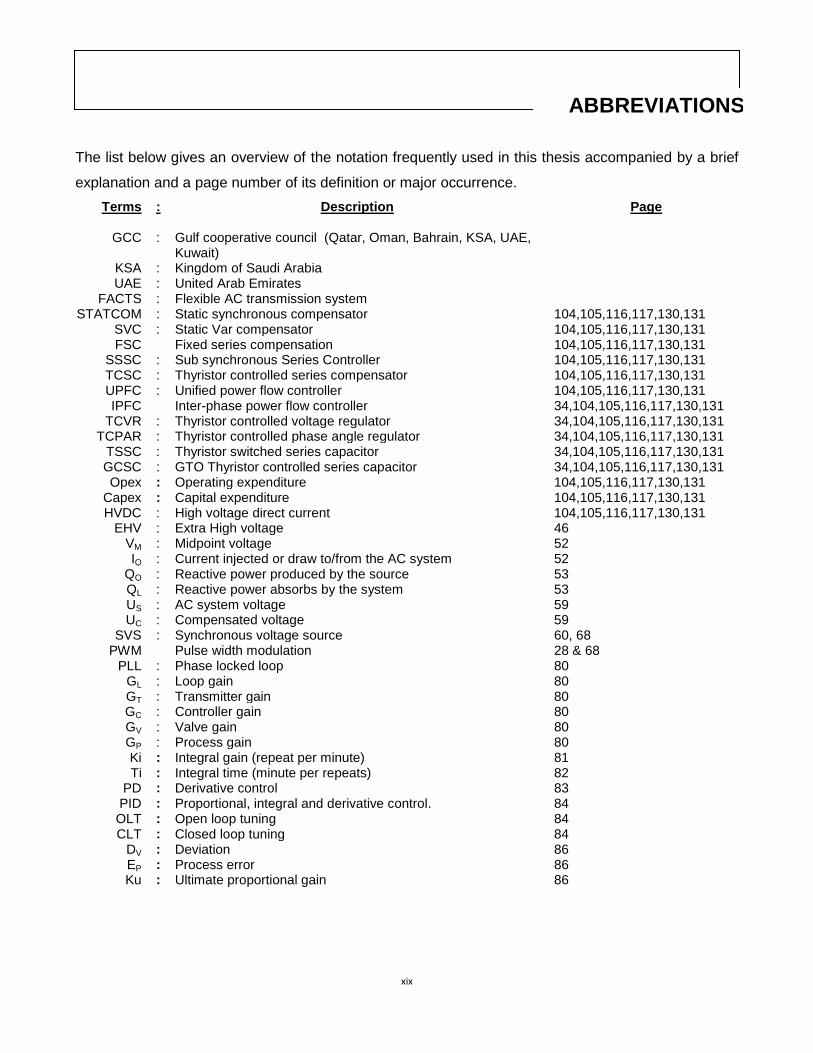
The list below gives an overview of the notation frequently used in this thesis accompanied by a brief
explanation and a page number of its definition or major occurrence.
Terms : Description
Page
GCC : Gulf cooperative council (Qatar, Oman, Bahrain, KSA, UAE, Kuwait)
KSA : Kingdom of Saudi Arabia UAE : United Arab Emirates
FACTS : Flexible AC transmission system STATCOM : Static synchronous compensator 104,105,116,117,130,131
SVC : Static Var compensator 104,105,116,117,130,131 FSC Fixed series compensation 104,105,116,117,130,131
SSSC : Sub synchronous Series Controller 104,105,116,117,130,131 TCSC : Thyristor controlled series compensator 104,105,116,117,130,131 UPFC : Unified power flow controller 104,105,116,117,130,131 IPFC Inter-phase power flow controller 34,104,105,116,117,130,131
TCVR : Thyristor controlled voltage regulator 34,104,105,116,117,130,131 TCPAR : Thyristor controlled phase angle regulator 34,104,105,116,117,130,131
TSSC : Thyristor switched series capacitor 34,104,105,116,117,130,131 GCSC : GTO Thyristor controlled series capacitor 34,104,105,116,117,130,131 Opex : Operating expenditure 104,105,116,117,130,131
Capex : Capital expenditure 104,105,116,117,130,131 HVDC : High voltage direct current 104,105,116,117,130,131
EHV : Extra High voltage 46 VM : Midpoint voltage 52 IQ : Current injected or draw to/from the AC system 52
QQ : Reactive power produced by the source 53 QL : Reactive power absorbs by the system 53 US : AC system voltage 59 UC : Compensated voltage 59
SVS : Synchronous voltage source 60, 68 PWM Pulse width modulation 28 & 68
PLL : Phase locked loop 80 GL : Loop gain 80 GT : Transmitter gain 80 GC : Controller gain 80 GV : Valve gain 80 GP : Process gain 80 Ki : Integral gain (repeat per minute) 81 Ti : Integral time (minute per repeats) 82
PD : Derivative control 83 PID : Proportional, integral and derivative control. 84 OLT : Open loop tuning 84 CLT : Closed loop tuning 84
DV : Deviation 86 EP : Process error 86 Ku : Ultimate proportional gain 86
ABBREVIATIONS

Abbreviations
xx
Terms : Description
Page
CRVSTATCOM : Credible value of STATCOM 98 CRVSSSC : Credible value of SSSC 110 CRVUPFC : Credible value of UPFC 121
Q : Reactive power 53, 54, 70 Iqref : Reactive current reference value 100, 112, 186
Iq_meaure : Reactive current measured value VSC : Voltage source converter 137, 149
CC1 & LC1 : STATCOM’s minimum capacitive and inductive compensation 47, 104, 166,184 CC11 & LC11 : STATCOM’s medium capacitive and inductive compensation 47, 104
CC111 & LC111 : STATCOM’s maximum capacitive and inductive compensation 47, 104 CC2 & LC2 : SSSC’s minimum capacitive and inductive compensation 88, 116
CC22 & LC22 : SSSC’s medium capacitive and inductive compensation 88, 116 CC222 & LC222 : SSSC’s maximum capacitive and inductive compensation 130,131
CC3 & CL3 : UPFC’s minimum capacitive and inductive compensation 130
CC33 & LC33 : UPFC’s medium capacitive and inductive compensation 130
CC333 & LC333 : UPFC’s maximum capacitive and inductive compensation 130
MCCR : Main central control room 154, 151 PWM : Pulse width modulation 28
MTRB : Metallic retune transfer breaker 146 WDB : Wideband Delphi 99
GA : Genetic Algorithm 104 DCS : Distributed Control System (Honeywell control) 144
SCADA : Supervisory control and data acquisition 144
APCS : Advance process control system 144 D1 & D2 Voltage and current measured location series part of the UPFC
device in between Kuwait and KSA 160, 198, 199
D3 & D4 Voltage and current measured location shunt part of the UPFC device in between Kuwait and KSA
160, 198, 199
D5 & D6 Voltage and current measured location of the STATCOM device in between Bahrain and Qatar
160, 198, 199
D8 & D9 Voltage and current measured location of the SSSC device in between Oman and UAE
160, 198, 199
xxi
Tariq Masood, R.K. Aggarwal, S.A. Qureshi, , R.A.J Khan STATCOM and SVC Control Operations
and Optimization during Network Fault Conditions: IEEE International Symposium on Industrial Electronics
Bari_ Italy (04-07 July, 2010).
Online paper link: http://ieeexplore.ieee.org/xpls/abs_all.jsp?arnumber=5636868
Tariq Masood, R.K. Aggarwal, S.A. Qureshi, , R.A.J Khan STATCOM Model against SVC Control Model
Performance Analyses Technique by Matlab: (ICREQP,10 Granada Spain 23-25 March,10). Online paper
link: http://www.icrepq.com/icrepq'10/655-Masood.pdf
Tariq Masood, R.K. Aggarwal, S.A. Qureshi, , R.A.J Khan STATCOM Control Reconfiguration Technique
for Steady State and Dynamic Performance Optimization during Network Fault Conditions: (ICREQP,10
Granada Spain 23-25 March,10). Online paper link: http://www.icrepq.com/icrepq'10/656-Masood.pdf
Tariq Masood, S. A Qureshi, A.j Khan, Nasser Elamedi, Yacob Y.Almulla, S K Shah “Facts Control
Devices (Statcom, Sssc And Upfc) Re-Configuration Techniques By Psim/Matlab” Papers published ICEE2007
on 11-12th
April, 2007 at UET/RCET Lahore _ Pakistan
Online paper link:
http://ieeexplore.ieee.org/xpl/login.jsp?tp=&arnumber=4287295&url=http%3A%2F%2Fieeexplore.ieee.org
%2Fstamp%2Fstamp.jsp%3Ftp%3D%26arnumber%3D4287295
I have also produced numerous of papers on FACTS controllers, three of them are under
consideration by the top ranking IEEE and John Wiley & Sons electrical power system transactions. I
have received reviewer(s) findings and recommendations. These are addressed and approved
successfully by my supervisor.
LIST OF PUBLICATIONS S
22
1.1 Problems to be investigated on the GCC power grid:
The GCC power transmission system is being pushed closer to its thermal and stability limits. The
quality of power delivered has to be maintained which is also of a great concern. In fact power delivery
limitations have many aspects and also involve power transfer between the areas on the GCC power
network. The limitations of the power transmission system network can take numerous forms and may
involve power transfer capability between areas on the GCC Power grid (Kuwait to KSA, Qatar to
Bahrain, UAE to Oman) (referred to here as transmission bottlenecks) or within a single area or region
(referred to here as a regional constraint)[16]. If there is limitation in between single areas or regions
this is also known a regional constraint. The power transmission bottleneck and regional constraints
may include the following characteristics on the Gulf Cooperative Council’s power network [4],[5].
GCC power network Steady-State Power Transfer Limit
GCC power network Dynamic Voltage Limit
GCC power network Transient Stability Limit
GCC power network Power System Oscillation Damping Limit
GCC power network Inadvertent Loop Flow Limit
GCC power network Thermal Limit
GCC power network Short-Circuit Current Limit
Herein, various studies indicate that each transmission system bottleneck and regional constraint may
have one or more of the above mentioned characteristics.
1.2. Thesis Preface:
The principal aim of this research work is to investigate the power system network problems and to
improve utilization of the existing power transmission system infrastructure on the GCC power grid
through the application of advance power transmission control technologies. This research work also
demonstrates comparative results with and without these devices on the GCC power grid. There are
numerous existing problems which are persisting on the GCC power network. In order to understand
and address GCC power network operational problems a long transmission model was developed and
synthesized by incorporating its distributed control parameters. The power system has certain
variables which are directly or indirectly impacted by the control. The voltage, angle and line
impedance can be controlled by using conventional or advance power transmission technologies. The
Introduction
CHAPTER 1
Chapter 1. Introduction
23
GCC power grid’s operational challenges, effectiveness of the shunt and series compensation, cost
effective benefits and comparative analysis are also determined.
New control techniques are also introduced and investigated to control the FACTS devices more
precisely at different locations on the GCC power network. A tailored PI controller configuration is
implemented in order to utilize their operational capabilities based on predefined control limits which
have been demonstrated in this research work. The STATCOM, SSSC and UPFC strategic
reinforcement plan describes with facts and figures on a needs analysis basis. The Wideband Delphi
technique is used to choose and select STATCOM, SSSC & UPFC devices for different locations
based on their operations and control significance criteria on the GCC power grid. The STATCOM,
SSSC & UPFC models’ case studies results demonstrate their operational impacts on the entire GCC
power grid at different locations on the GCC power grid.
These chapters validate the control and operational effectiveness of the STATCOM, SSSC & UPFC
devices with and without being at their proposed locations. In these chapters dynamic responses of
the STATCOM, SSSC, and UPFC devices operations also recorded. Effectively, the STATCOM,
SSSC & UPFC controller’s three control limits have developed and synthesized (+/-) minimum, (+/-),
medium and (+/-) maximum compensation. The STATCOM, SSSC & UPFC, devices start and stop
automatically by considering control combination blocks minimum medium and maximum inductive
and capacitive modes of operations in parallel. These control limits are adjusted by configuring their
corresponding PI control values by using Douglas J. Cooper PID control and optimization techniques
which are then defined and discussed.
The simulation results indicate that these controllers oscillate between +/-2% minimum, +/-4% medium
and +/-%6 maximum at both sides of transmission lines to adjust the reactive power compensation as
required. These control boundaries will communicate to each other and adjust compensation based on
sending and receiving end voltage deviation. These controllers have been configured in such ways to
oscillate and inject or absorb controlled reactive power based on corresponding PI control values of
each operating boundary.
The HVDC application and design criteria are also described on the GCC power grid. The detailed
configuration of FACTS devices’ integration (FACTS-FRAME) are formulated to obtain the desired
results on the GCC power network. This chapter also demonstrates the dynamic capability to improve
voltage profile, power angle and stability margin on the GCC power grid. After successful
implementation, the GCC power network will entirely increase the power system loadability, reduce
the losses and enhance sustainability of the power system performance as determined.
Chapter 1. Introduction
24
Finally, this thesis describes results and discussion in details. This comprises of PI controller selection
process and significance, internal and external control significance, operational and maintenance
control significance, STATCOM, SSSC, UPFC and HVDC devices operational and selection process
significance.
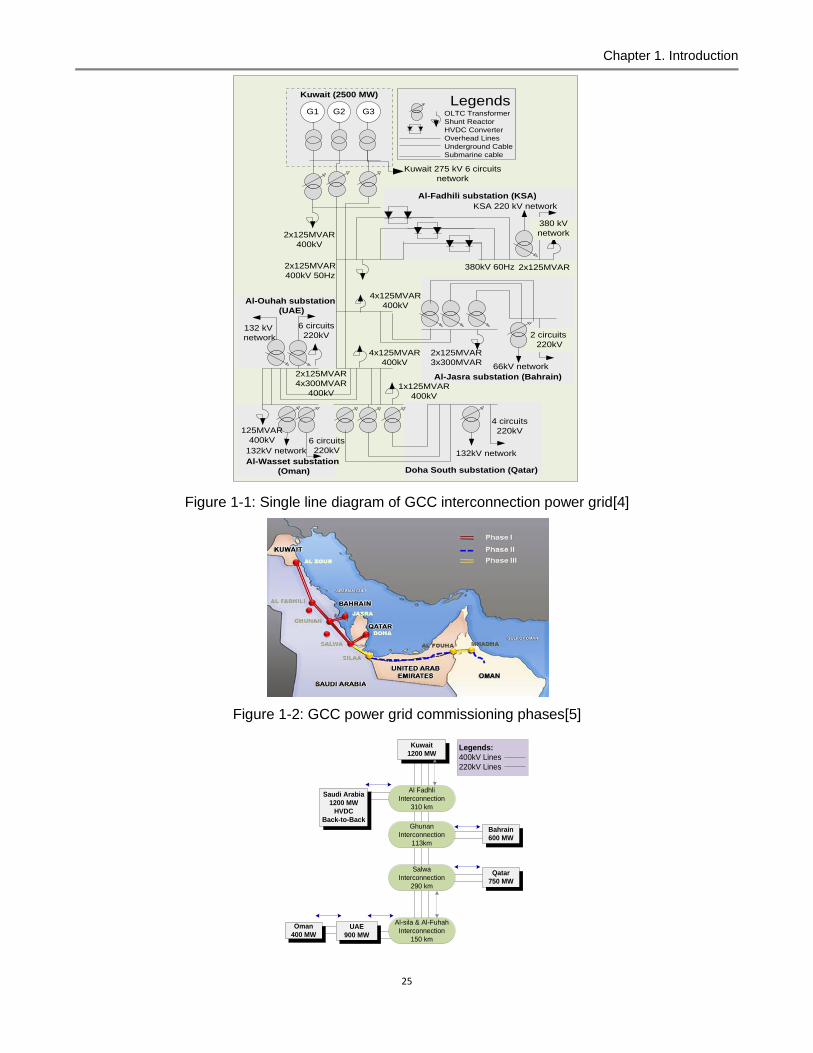
1.3. Power system’s current operations on the GCC power grid:
The GCC power system grid is configured and implemented into eight strategic power system
operational directions in order to meet reliable and sustainable industrial and domestic customers’
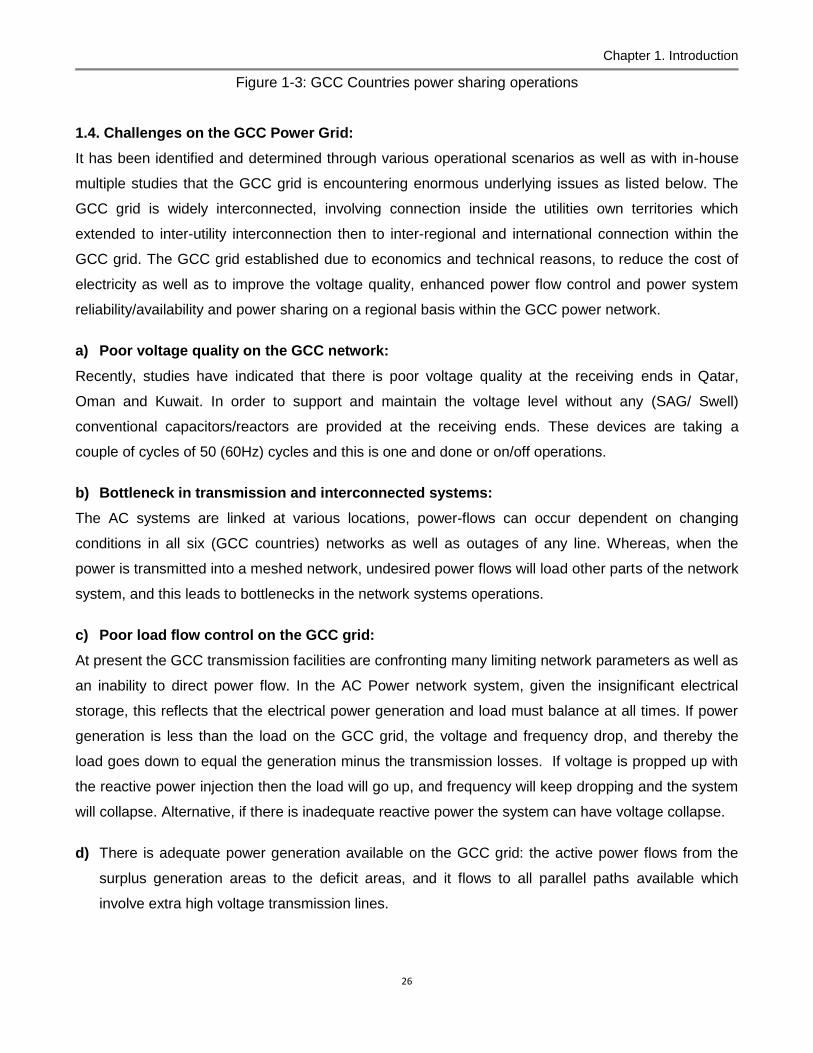
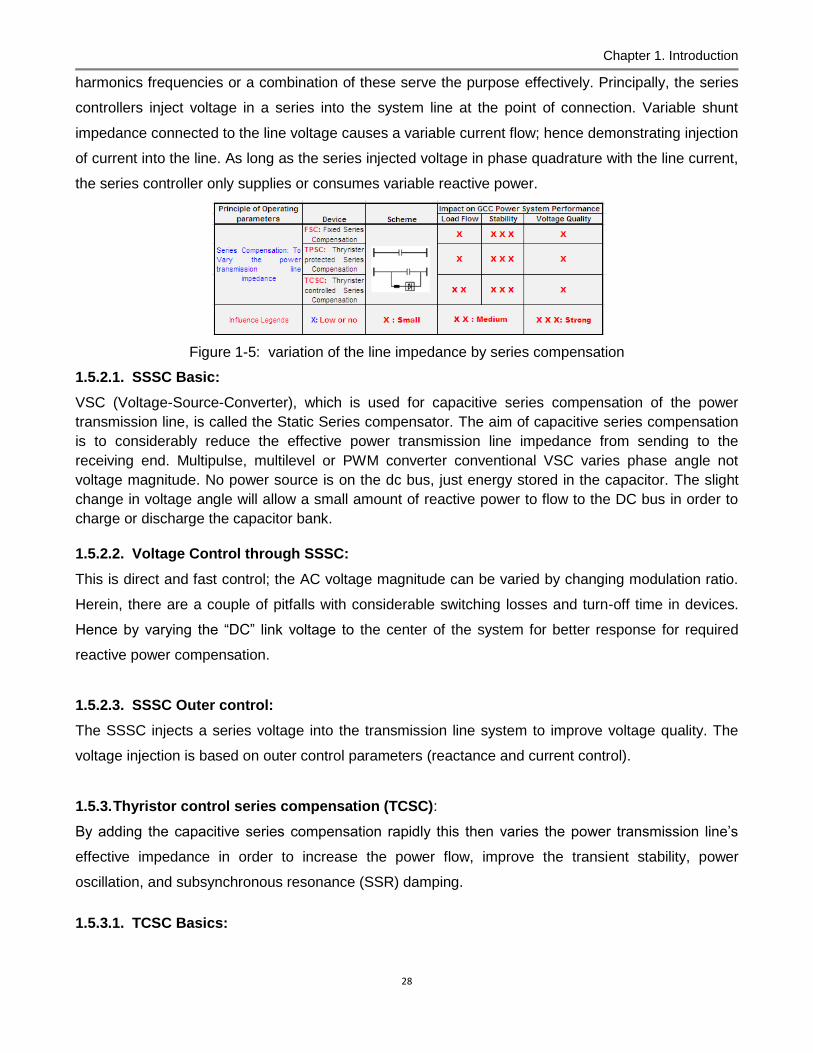
requirements at GCC Power network as shown in Figure 1-1 [3],[4]. Figure 1-2 indicates the GCC
power network commissioning stages[5] and Figure 1-3 shows the power distribution on the GCC
power grid.
i. The system was considered firstly, a double-circuit 400 kV, 50 Hz line stretching from Al Zour
substation (Kuwait) to Ghunan substation into (Saudi Arabia) with an intermediate connection at
Fadhili (Saudi Arabia) and its associated substations.
ii. Secondly, a back-to-back HVDC link introduced as a 380 kV interconnection, 60 Hz, system at
Fadhili into Saudi Arabia in order to develop proper synchronization or communication with other
GCC power systems, which are 50Hz frequency.
iii. Thirdly, a double circuit 400 kV overhead line stretching and partially connected with submarine link
from Ghunan substation to Al Jasra substation in Bahrain along with its associated substations.
iv. Fourthly, a double circuit 400 kV line stretching from Ghunan substation to Salwa substation into
Saudi Arabia along with its associated substations.
v. Fifthly, a double circuit 400 kV line stretching from Salwa substation to Doha South substation into
Qatar and its associated substations.
vi. Sixthly, a double circuit 400 kV, 50 Hz line stretching from Salwa substation to Ghuwaifat
substation in the United Arab Emirates along with its associated substations.
vii. Seventhly, a double and a single circuit 220 kV, 50Hz line stretching from Al Ouhah in the United
Arab Emirates to Al Wasset substation in Oman along with its associated substations; finally, a
centralized control room was established at Ghunan in Saudi Arabia in order to control power
system operations within all GCC countries with a certain degree of precision at different voltage
and shared power perspective.
viii. Furthermore, Figure 1-2 & 1-3 demonstrate the commission phases and power sharing at different
locations on the GCC power network.
Chapter 1. Introduction
25
Kuwait (2500 MW)Legends
OLTC Transformer
Shunt Reactor
HVDC Converter
Overhead Lines
Underground Cable
Submarine cable
Kuwait 275 kV 6 circuits
network
KSA 220 kV network
380 kV
network
380kV 60Hz2x125MVAR
400kV 50Hz
2x125MVAR
400kV
4x125MVAR
400kV
4x125MVAR
400kV
2x125MVAR
3x300MVAR
1x125MVAR
400kV
2 circuits
220kV
66kV network
4 circuits
220kV
132kV network
132 kV
network
132kV network
6 circuits
220kV
6 circuits
220kV
2x125MVAR
4x300MVAR
400kV
125MVAR
400kV
G1 G2 G3
2x125MVAR
Doha South substation (Qatar)
Al-Jasra substation (Bahrain)
Al-Fadhili substation (KSA)
Al-Wasset substation
(Oman)
Al-Ouhah substation
(UAE)
Figure 1-1: Single line diagram of GCC interconnection power grid[4]
Figure 1-2: GCC power grid commissioning phases[5]
Kuwait
1200 MW
Saudi Arabia
1200 MW
HVDC
Back-to-Back
Al Fadhli
Interconnection
310 km
Bahrain
600 MW
Qatar
750 MW
UAE
900 MW
Oman
400 MW
Ghunan
Interconnection
113km
Salwa
Interconnection
290 km
Al-sila & Al-Fuhah
Interconnection
150 km
Legends:
400kV Lines
220kV Lines
Chapter 1. Introduction
26
Figure 1-3: GCC Countries power sharing operations
1.4. Challenges on the GCC Power Grid:
It has been identified and determined through various operational scenarios as well as with in-house
multiple studies that the GCC grid is encountering enormous underlying issues as listed below. The
GCC grid is widely interconnected, involving connection inside the utilities own territories which
extended to inter-utility interconnection then to inter-regional and international connection within the
GCC grid. The GCC grid established due to economics and technical reasons, to reduce the cost of
electricity as well as to improve the voltage quality, enhanced power flow control and power system
reliability/availability and power sharing on a regional basis within the GCC power network.
a) Poor voltage quality on the GCC network:
Recently, studies have indicated that there is poor voltage quality at the receiving ends in Qatar,
Oman and Kuwait. In order to support and maintain the voltage level without any (SAG/ Swell)
conventional capacitors/reactors are provided at the receiving ends. These devices are taking a
couple of cycles of 50 (60Hz) cycles and this is one and done or on/off operations.
b) Bottleneck in transmission and interconnected systems:
The AC systems are linked at various locations, power-flows can occur dependent on changing
conditions in all six (GCC countries) networks as well as outages of any line. Whereas, when the
power is transmitted into a meshed network, undesired power flows will load other parts of the network
system, and this leads to bottlenecks in the network systems operations.
c) Poor load flow control on the GCC grid:
At present the GCC transmission facilities are confronting many limiting network parameters as well as
an inability to direct power flow. In the AC Power network system, given the insignificant electrical
storage, this reflects that the electrical power generation and load must balance at all times. If power
generation is less than the load on the GCC grid, the voltage and frequency drop, and thereby the
load goes down to equal the generation minus the transmission losses. If voltage is propped up with
the reactive power injection then the load will go up, and frequency will keep dropping and the system
will collapse. Alternative, if there is inadequate reactive power the system can have voltage collapse.
d) There is adequate power generation available on the GCC grid: the active power flows from the
surplus generation areas to the deficit areas, and it flows to all parallel paths available which
involve extra high voltage transmission lines.

Chapter 1. Introduction
27
e) Limited power transfer capacity on the GCC grid: The existing GCC AC network is serving with
limited Power Transfer capacity to the neighboring countries. Firstly the long AC transmission lines
have massive losses, secondly the inherently AC network cannot be overloaded.
1.5. Why FACTS control devices needed on the GCC grid:
Through various practical application and research work, it has been indentified and determined that
FACTS devices are offering a time-domain sustainable solution to overcome power transmission
contingences: likewise on the GCC power grid with a degree of precision. FACTS controllers have an
ability to control the interrelated parameters that govern the operations of power transmission systems
which including series impedance, shunt impedance, current, voltage, phase angle and damping of
oscillation at various frequencies below the rated frequency. The FACTS controllers can enable a
power transmission line to run near its thermal capacity limit without endangering the power system
operation, which may lead to transferring maximum power capacity near its thermal limit. The following
FACTS controllers are strong candidates to be implemented to enhance power system operations on
the GCC power grid [6], [7], [8].
1.5.1. STATCOM and SVC:
Static synchronous compensator and SVC controllers are giving a strong impact on voltage quality,
but a medium impact on system stability and negligible impact on load flow control as demonstrated in
Figure 1-4. The shunt controllers’ encompassed variable impedance, variable source or a combination
of these. Principally, the shunt controllers inject current into the system at the point of connection.
Variable shunt impedance connected to the line voltage causes a variable current flow; hence the
demonstrate injection of current into the line. As long as the shunt injected current in phase quadrature
with the line voltage, the shunt controller only supplies or consumes variable reactive power. Other
phase relationship will involve handling real power as well [9], [10].
Figure 1-4: Voltage control shunt compensation
1.5.2. SSSC (Subsynchronous Series Controller):
The series compensator is reducing the line impedance in order to increases the system performance
as demonstrated in Figure 1-5. The series controllers’ encompassed variable impedance (capacitors
and reactors), and power electronic based variable source of main frequency, sub synchronous and
Chapter 1. Introduction
28
harmonics frequencies or a combination of these serve the purpose effectively. Principally, the series
controllers inject voltage in a series into the system line at the point of connection. Variable shunt
impedance connected to the line voltage causes a variable current flow; hence demonstrating injection
of current into the line. As long as the series injected voltage in phase quadrature with the line current,
the series controller only supplies or consumes variable reactive power.
Figure 1-5: variation of the line impedance by series compensation
1.5.2.1. SSSC Basic:
VSC (Voltage-Source-Converter), which is used for capacitive series compensation of the power
transmission line, is called the Static Series compensator. The aim of capacitive series compensation
is to considerably reduce the effective power transmission line impedance from sending to the
receiving end. Multipulse, multilevel or PWM converter conventional VSC varies phase angle not
voltage magnitude. No power source is on the dc bus, just energy stored in the capacitor. The slight
change in voltage angle will allow a small amount of reactive power to flow to the DC bus in order to
charge or discharge the capacitor bank.
1.5.2.2. Voltage Control through SSSC:
This is direct and fast control; the AC voltage magnitude can be varied by changing modulation ratio.
Herein, there are a couple of pitfalls with considerable switching losses and turn-off time in devices.
Hence by varying the “DC” link voltage to the center of the system for better response for required
reactive power compensation.
1.5.2.3. SSSC Outer control:
The SSSC injects a series voltage into the transmission line system to improve voltage quality. The
voltage injection is based on outer control parameters (reactance and current control).
1.5.3. Thyristor control series compensation (TCSC):
By adding the capacitive series compensation rapidly this then varies the power transmission line’s
effective impedance in order to increase the power flow, improve the transient stability, power
oscillation, and subsynchronous resonance (SSR) damping.
1.5.3.1. TCSC Basics:

Chapter 1. Introduction
29
Resonance imposes limits on the firing angle, it also improves boost C or L. and it will also reduce the
impedance values. In fact, the voltage is distorted while TCR conducts (variable impedance model
inaccuracy). Ratio of XL/XC impacts performance (impacts resonance and ratio from 0.1 to 0.3 is ideal)
likewise current implementation of TCSC at Kayenta and Slatt.
1.5.3.2. TCSC Control Loops:
Open loop: fixed firing angle control and reactance control.
Closed loop current control model and reactance control.
Overvoltage protection in TCSC controls (Inductor fully in the circuit (alpha=0) and TCSC looks
inductive.
1.5.3.3. TCSC Reactance control mode of operations:
The TCSC reactance control maintains a fixed reactance through changes in the power system. The
reactance command can be varied from a central operating point or from a further control loop, such
as a damping control.
1.5.3.4. TCSC Current Control options:
Constant current control: to keep current through the line constant through load variations within
the controllable range of TCSC.
Secondly, current tracking control: to keep the line current at a fixed ratio to the total load
current (spread over several lines) within the controllable range TCSC.
1.5.3.5. TCSC External Control:
External control does not really vary with this type of series compensator, but the internal control is a
bit more specific. A variable impedance type compensator is not always seen as voltage injections.
1.5.4. UPFC (Unified Power Flow Controller):
Figure 1-6 indicates that various investigation results validate that the UPFC controller has a strong
impact to enhance Power transmission performance by address voltage quality, load flow control and
power system stability in particular (dynamic stability, transient stability, steady state stability, voltage
collapse, and frequency collapse) in order to meet growing Power delivery operations requirements.
This is combination of series and shunt compensation controllers, which are well controlled and
coordinated the manners or the unified power flow controller with a series and shunt element in order

Chapter 1. Introduction
30
to meet stringent operational requirements on the GCC power grid. Predominantly, the shunt
compensation controllers will inject current into the system through the shunt part of the controller and
the series compensation controller will inject voltage in series in the line through the series part of the
controller. However, the shunt and series controllers are Unified Power Flow Controllers; there can be
a real power exchange through the Power link.
1.5.5. HVDC (High Voltage Direct Current):
There is no reactive power flow on the DC line and there is no technical limit to the distance over
which the power may be transmitted by cables or overhead transmission lines. The limit of the
distance is economic, since the power losses in the transmission lines have become an unacceptable
limit, when the practical conductor is used. Full and fast control of the Power flow, enhancement of the
AC power network (AC Power oscillation damping capability, increased transmission capability in
parallel line) is as demonstrated in Figure 1-6. Herein the HVDC line losses are smaller. It is possible
to bring more power through the DC link without increasing fault level. No reactive compensation for
DC a line is required [23].
Figure 1-6: Load flow control by series/shunt compensation
1.6. Aim and Objective:
To configure and implement HVDC/FACTS control devices on the GCC power grid at large by using
PID (Proportional-Integral-Derivative) control and tuning parameters in order to optimize
HVDC/FACTS devices operations and control with high degree of precision. Firstly, to develop an
independent control model of each FACTS device (STATCOM, SSSC and UPFC) to determine their
operational and control capability on the GCC power grid to address time-based power transmission
system contingencies. In order to validate each model’s results real-time operating data will be
compiled and filtered prior to utilizing at the modeling and simulation stage of each FACTS device.
These results will provide a multiple road map to accomplish the desired research work.
Secondly, to develop a multi variable controller that will be able to communicate and control
STATCOM, SSSC & UPFC devices in an operation at times at different locations on the GCC power
system grid. Develop an optimization technique to determine the composite location of the STATCOM,
SSSC & UPFC devices and their operating parameters, which are delivering or absorbing reactive

Chapter 1. Introduction
31
power compensation to enhance over-all power system network performance accompanying by
reducing the network losses. Validation of this technique will be ascertained against the data obtained
from the GCC water and power development authorities.
This optimization technique will also be extended to develop a Power network in the GCC countries
through an optimization and integration process to enhance and stabilize network performance, and,
in addition to that, to optimize and control the power system flow within two countries or more.
Furthermore as a drawback standpoint of this study, the power exchange ought to be monitored and
examined on a critical basis to take preventive measures for any possible network violation, which
may lead to the potential GCC blackout.
1.6.1. Thesis Structure Outlines as Followed:
Chapter No 1 describes the summary of the proposed project on a needs analysis basis, vision and
mission. Power system operational and control challenges are also explained on the GCC power
network in order to address poor voltage quality (sags & swell), poor load flow control and limited
power transfer capacity issues. It has been also illustrated why FACTS device are vital and viable to
implement the GCC power grid by considering its operational benefits and criticalities.
Chapter No 2 describes four patterns of literature reviews to understand and realize current research
accomplished in the area of FACTS/HVDC devices implementation. In this chapter it has been
focused on STATCOM, SSSC, UPFC, HVDC controller tuning methodology by using optimum P-I-D
tuning parameters. In this respect large numbers of research papers and articles are reviewed
thoroughly to carry out detailed research more practically in order to understand the current research
in these areas that have been accomplished. And to identify the areas where, more research is
required.
Chapter No 3 describes the long transmission line model and its distributed control parameters, as
well as the compensation factor at each section of the defined transmission line on the power grid
network. This chapter demonstrates the shunt compensation of long transmission lines, simplified
model and phasor diagram, ideal shunt compensation characteristic, ideal reactive power
requirements, capacitive and inductive mode of operations through STATCOM. This chapter also
describes the series compensation of long transmission line, simplified SSSC control model and its
application with both capacitive and inductive mode of operations. Furthermore this also describes the
HVDC operational challenges, cost effective benefits, and HVDC current applications in the world at
large. In this chapter the HVDC application, deliverables and long-term benefits are discussed.
Principally how the HVDC system can be implemented to address various power systems operational

Chapter 1. Introduction
32
and control issues related on the GCC power system grid. In this chapter techno-economic analyses
are demonstrated based on the current application of the FACTS/HVDC devices.
Chapter No 4 describes the PI, PD and PID controller application in order to control the STATCOM,
SSSC and UPFC devices operations in multiple directions. In this chapter various PI control models
have been developed and simulated to produce the desired results in order to meet operational
requirements on the GCC power grid.
Chapter No 5 describes the application of STATCOM between Qatar and Bahrain on the GCC power
grid. This chapter is divided into different sections to explain the STATCOM model case study in
sequence. Firstly the GCC power system operational background and problems are discussed on the
GCC power grid, STATCOM selection process, STATCOM case study and reinforcement plan. In the
last section STATCOM model’s dynamic performance and results are presented.
Chapter No 6 describes the application of the SSSC between the United Arab Emirates and Oman on
the GCC grid. This chapter is divided into different sections to explain in sequence, firstly the GCC
power system operational background and problems, SSSC device selection process, SSSC case
study and the reinforcement plan are discussed. In the last section SSSC model’s dynamic response
and results are demonstrated.
Chapter No.7 describes the application of the UPFC between the KSA and Kuwait on the GCC grid.
This chapter is divided into different sections to explain in sequence, firstly the GCC power system
operational background; UPFC reinforcement plan, UPFC device selection process, and UPFC case
study are discussed. In the last section UPFC model’s dynamic response and results are
demonstrated.
Chapter No.8 describes the application of HVDC on the GCC grid, design criteria, design study
reviews, HVDC system description, rectifiers operations, inverters operations are discussed. In the
second section of this chapter, the HVDC schematic, HVDC system analysis, power delivery model of
long transmission line, intertie link results are demonstrated.
.
Chapter No.9 describes the implementation of tailored-made various FACTS devices by using the
new technique “FACTS-FRAME” which indicates robust integration control topology. In this chapter
also identified and determined are the existing intertie link and its viabilities on the GCC countries
power network. This chapter also demonstrates how the STATCOM, SSSC and UPFC devices are
communicating to each other in order to share reactive power compensation requirements at different

Chapter 1. Introduction
33
locations in the GCC countries. Each device adjusts the (+/-) capacitive and inductive compensation
factor based on provided sixth control limits. These control limits are operating by its corresponding PI
control values. This chapter also describes that the FACTS-FRAME has a great potential to run all
three FACTS device in parallel jointly (centralized control) or independently (de-centralized control) as
per power system operational requirements.
Chapter No.10 demonstrates the significance of this research work in different perspectives. These
significances are categorized in order: firstly, discussed PI controller configuration parameters
selection process, secondly, internal and external control parameters, thirdly, operations and routine
maintenance, fourthly devices selection process, and lastly devices control and operations
significances.
Lastly, this work is concluded by presenting the development of five layers of inter-related FACTS-
FRAME architecture. The FACTS-FRAME demonstrates the centralized and decentralized control
system to integrate all three devices at different locations on the GCC power grid. It also illustrates the
major potential economical benefits as well as the technical impact to improve power transmission
network performance by implementing the centralized and decentralized control system operations on
the GCC power grid.
1.7. Summary:
This chapter describes the vision and mission of FACTS devices application in the GCC Power grid,
and how various FACTS devices can be implemented. There has also been indentified and
determined the successful application of proposed devices by learning from the various referred
materials published. Hence, this chapter framework aims to analyze and design various options of
FACTS devices as well as implementation in a specific domain on the GCC Countries in order to
address all sorts of current or underlying Power system issues with a degree of precision.
This chapter also presents electrical power system challenges in the GCC countries at large.
Herewith, a large amount of control and operating data has been collected and compiled, reviewed
and understood, which is related to current application of FACTS devices in the world at large.
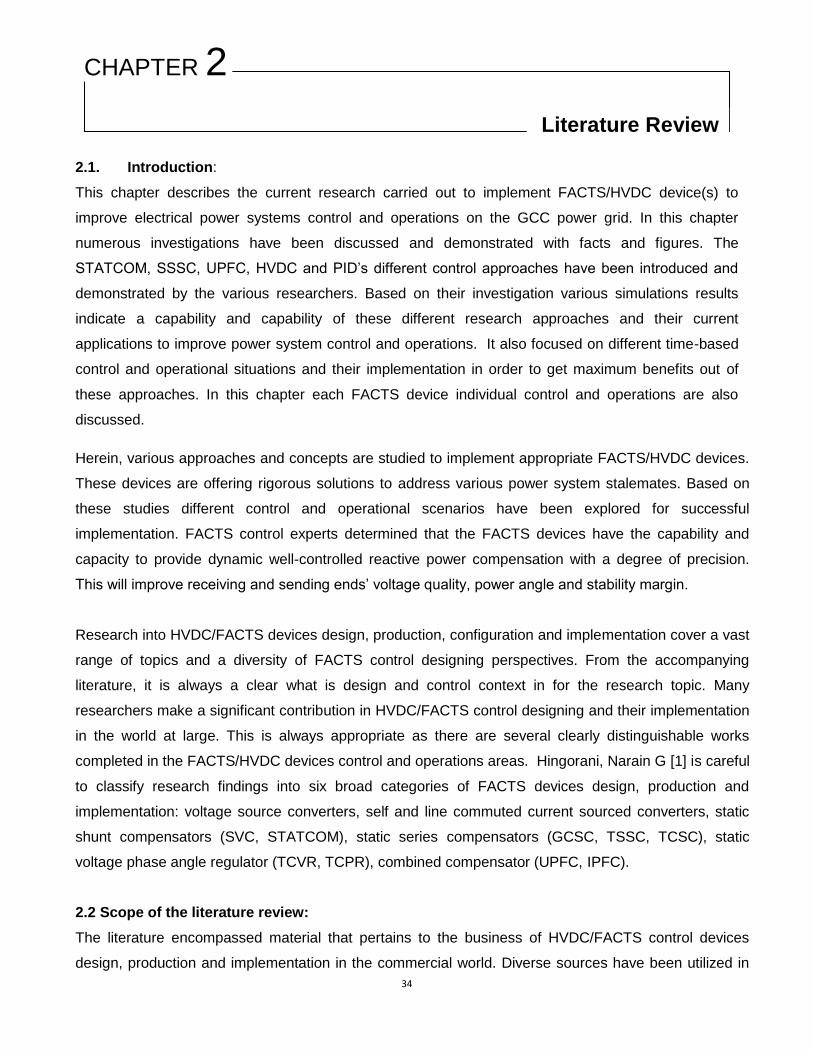
34
2.1. Introduction:
This chapter describes the current research carried out to implement FACTS/HVDC device(s) to
improve electrical power systems control and operations on the GCC power grid. In this chapter
numerous investigations have been discussed and demonstrated with facts and figures. The
STATCOM, SSSC, UPFC, HVDC and PID’s different control approaches have been introduced and
demonstrated by the various researchers. Based on their investigation various simulations results
indicate a capability and capability of these different research approaches and their current
applications to improve power system control and operations. It also focused on different time-based
control and operational situations and their implementation in order to get maximum benefits out of
these approaches. In this chapter each FACTS device individual control and operations are also
discussed.
Herein, various approaches and concepts are studied to implement appropriate FACTS/HVDC devices.
These devices are offering rigorous solutions to address various power system stalemates. Based on
these studies different control and operational scenarios have been explored for successful
implementation. FACTS control experts determined that the FACTS devices have the capability and
capacity to provide dynamic well-controlled reactive power compensation with a degree of precision.
This will improve receiving and sending ends’ voltage quality, power angle and stability margin.
Research into HVDC/FACTS devices design, production, configuration and implementation cover a vast
range of topics and a diversity of FACTS control designing perspectives. From the accompanying
literature, it is always a clear what is design and control context in for the research topic. Many
researchers make a significant contribution in HVDC/FACTS control designing and their implementation
in the world at large. This is always appropriate as there are several clearly distinguishable works
completed in the FACTS/HVDC devices control and operations areas. Hingorani, Narain G [1] is careful
to classify research findings into six broad categories of FACTS devices design, production and
implementation: voltage source converters, self and line commuted current sourced converters, static
shunt compensators (SVC, STATCOM), static series compensators (GCSC, TSSC, TCSC), static
voltage phase angle regulator (TCVR, TCPR), combined compensator (UPFC, IPFC).
2.2 Scope of the literature review:
The literature encompassed material that pertains to the business of HVDC/FACTS control devices
design, production and implementation in the commercial world. Diverse sources have been utilized in
Literature Review
CHAPTER 2

Chapter 2. Literature review
35
this research but the coverage of this review has been designed to provide insight in HVDC/FACTS
control devices design production, configuration and implementation specifically.
2.2.1 STATCOM application:
Metin D., and Ali Ozturk [35] studied to identify and determine the optimal point for the STATCOM
compensator for static voltage stability. IEEE-14 buses system was utilized for analysis and simulation
purposes. The results indicate that the static voltage instability can be improved drastically without and
constraints. S. Zheng, and S. Fang [37] demonstrated the application of three-phase VSI-based
distributed STATCOM. The results indicate that control strategy is very promising and providing
required static compensation performance as well as tremendous dynamic response. Rajive, and
Vinay [36], introduced and illustrated the utilization of a PV solar plant as STATCOM in order to
manage reactive power compensation based on load variation. This is very much evident that the PV
solar system has the potential to be utilized as a STATCOM device. S.Teleke, B.Gudimetla [38],
demonstrated the application of STATCOM to address power quality issues at a refinery which
consists of large numbers of induction motors. The results indicate promising improvement in power
system operations as well as witnessed economic benefits. A. Nazarloo, S. H. Hosseini, E. Babaei
[25], introduced and demonstrated a new control technique of STATCOM control and operations. The
prime aim of this research work is to mitigate the power system quality issues and improve distribution
system performance under all types of fault conditions line to line, fault double to ground fault.
T. Fuji, K. Tema [40] demonstrated the application of 450MVA STATCOM to improve voltage profile
and stability of the power system network. It also diminished the over-voltage effect due to the Ferranti
phenomenon and outage fault at heavy load conditions. Juan C, Johan David Elizondo Nagy [33],
demonstrated the application of STATCOM and Battery Energy storage System and their benefits to
improve the power system network operations. The results indicate that the power system still
survives under the severe contingency conditions. H. M. Pirouz, M. T. Bina [31], introduced new
control topology to compensate and control unbalanced and nonlinear medium voltage presence of
load and source harmonics at the power system network. At the same time the DC capacitor voltage
was also controlled more precisely. M. Bhaskar, S.S.Dash, & C.Subramani [34], introduced and
demonstrated a STATCOM controller to help in balancing the dynamic load of the power system
network. As a control strategy, if line current is less than presumed the STATCOM will generate the
compensating current which will be taken by the load without any constraints. G. ZHAO, J. LIU[29],
introduced and integrated phase and amplitude control into STATCOM control strategies. And detailed
analysis indicates very promising results to improve the STATCOM and system performance.
Chapter 2. Literature review
36
Ibrahim B., and Sad El-Marcy[28], introduced detailed model of the STATCOM consist of two six-pulse
converters by using ATP draw analysis software. Based on this technique each part of STATCOM can
be determined. Chunyan, Zhenjiang[27] introduced new technique of online monitoring and fault
diagnostic system in order to settling the decision problems of system reliability, safety and
maintenance..
D. Innuzzi and Lauria[32], introduced and demonstrated the voltage source inverter (STATCOM) and
its integrated variable load. They focused on dynamic performance and stability margin of the system
at different control strategies. Shu-Jen Steven [39], investigated reactive power compensation mode of
operations and operating strategies in order to improve voltage quality by utilizing STATCOM device..
G. Reed and J. Paserba[26], investigated and explained the STATCOM model rated ±100 MVA at
138 kV, which offers power system operations and control with a high degree of reliability that is
obtained by using new design configuration of modular converter. This system also comprises cooling
system, step-up transformer, filter banks and switchgear in order to secure power system operations
and control (SDG & E Taleg, ±100 MVA). G. Reed and J. Paserba, explained STATCOM rated
±43MVA at 115 kV, control model’s application and its long-term benefits. It also indicates that
STATCOM has capacity and capability to provide dynamic compensation of power system network.
2.2.2 Application of SSSC control device:
M. Faridi & H. Maeiiat [45] investigated the active and reactive power as well as the damping power
system oscillation in the transient mode. The results indicate the effectiveness of the SSSC in
controlling power flow and achieved the desired value of reactive and active power as well as damping
oscillation. A.D. Falehi and A. Doroudi [41] introduced and investigated a complementary damping
controller for the SSSC (Static Synchronous Series Compensator) to improve the power system
stability. Genetic Algorithm optimization technique was also investigated and produced very promising
results which support the study. Cao Taibin & Qian Bifu [43], investigated the constant voltage control
of SSSC and also determined its characteristics. Herein a multi-order nonlinear system is used to
design the controller. Finally, the results prove that the control strategy is very much viable and robust.
Xiang Zheng, and Chao Wang [53], investigated subsybchrnous resonance (SSR) in the series
compensated power system. The proposed control strategy of the SSSC active damping control will
mitigate the SSR component. The adopted technique has very vigilant future in the power system. S.
Khani, M. Sadeghi, S.H. Hosseini[52], investigated the selection process of the SSSC by using genetic
Algorithms. The prime contribution of the SSSC is for damping control in order to improvement power
system dynamic response and its stability. Based on these configurations the desired results were
obtained.
Chapter 2. Literature review
37
G. Abdollahi Sarvi & M. Tavakoli Bina [44], investigated the application of SSSC to determine its
switching functions and with small changes in these functions at different states of SSSC simulations.
The results indicate some improvement in the transient and steady states of the power system
operations. M. Sedighizadeh , M.Toulabi[47], demonstrated the application of SSSC to provide an
additional damping in the power system. During any disturbance in the power system the machine in
that system will oscillate and clear the disturbance and the transient energy becomes zero. This will
settle at a stable operations point. R.K Pandy and NK Singh [49] demonstrated a new design
technique of SSSC damping controller with a level of relative stability. The results indicate the
effectiveness of the new control model.
S. Jamali, A. Kazemi [50], [51] demonstrated the effects of inter phase, phase to phase and three-fault
during SSSC device operations and investigated the impact of SSSC. The results indicate the
effectiveness of SSSC during fault conditions by varying the line impedance. M. Khederzadeh, and A.
Salemnia [46], investigated the application of a distance relay for the protection of the transmission
line in the presence of SSSC. The results indicate improvement of distance relay protection system
performance at different fault conditions. Ali Ajami and mehdi, [42] investigated controlling the injected
voltage in order to control the required reactive power compensation. For the injected voltage a
separate DC current control is applied which produced a fast dynamic response and a high quality of
current and voltage waveforms. Paivel Zunfiiga and Juan Ramirez [48], investigated to identify SSSC
operations based on 46-pulse VSC (voltage source converter). They have presented a detailed
analysis of 48-pulse VSC configuration and its operations without any ambiguity. Based on SSSC
voltage with reference to the current flow through as well as the DC capacitor charge and discharge
the procedure was also explained in their research work. Xiao. P. Zhang [53] investigated the SSSC
control device multi-functional control for power flow analysis. This can be formulated for steady state
control based on the following reasons (to control active and reactive power, voltage at the bus,
impedance reactance) this research investigation indicates very good results. Javier Chivite-
Zabalzaand Miguel Rodríguez[56], investigated SSSC (Static Synchronous Series Compensator)
power electronic based device that has the capability and the capacity to control power flow through a
power transmission network. The primary aim of this research work is to enlarge the stability region of
the conventional power system network. The research indicates very promising results informing of a
power system improvement with an enhanced stability area. M. R. Banaei[57] described the SSSC
voltage source converter connected (coupled) with a transformer to provide series compensation to
the transmission line. As per research it indicates that the power flow in the line decreases when the
injected voltage in the line emulates an inductive reactance. Alternatively, the power flow increases
when the injected voltage emulates capacitive reactance in series in the transmission line. Hernandez,
P. Eguia, [54], describes the composite approach to identify and determine the series line
Chapter 2. Literature review
38
compensation by using SSSC. In order to meet the required compensation synchronous voltage
source can be used to provide controllable series compensation. It also investigated the idea/concept
that the external DC power supply can provide another source of compensation if there is voltage drop
across the resistive component of the line impedance. S. Adeghzadeh & M. Ehsan investigated that
application of FACTS devices to increase power transmission system loadability. This may be
constrained by a transient stability limit. The model results show that by using the proposed method to
increase power transfer in the network this then leads to an improved transient stability limit. This
research was carried out at the Sharif University of Technology in Iran.
2.2.3 Application of UPFC control device:
Suppakarn Chansareewittaya and Peerapol Jirapong [67] introduced and demonstrated TSSA (Tabu
Search and Simulated Annealing) with search space-managing methods to determine the optimal
location of UPFC device for implementation in order to enhance power transfer capacity form the
transmission line. Ch. Chengaiah R. V. s. Satyanarayanl [58] introduced how UPFC controller’s can
raise the stability limit of the power transmission system. They have also witnessed single and double
transmission line systems performance by implementing UPFC device. S. L. Silva Lima & E. H.
Watanabe [66] introduced and demonstrated new and simple structure to control the transmission line
voltage precisely. The UPFC configuration allows for controlling the line voltage at given point of the
circuit very easy without any constraints. Juan Li & Kun Wang [63] introduced and demonstrated a
nodal power injection model of the UPFC control device for three phase power flow calculation. They
have used decoupling compensation theory to measure three phases power flow. The model
simulation indicates very promising results. Rajive Tiwari, K.R.Niazi, & Vikas [65] Gupta introduced
and illustrated a novel model control approach for enhancing voltage stability margin of the power
system. This is an innovative approach where real power exchange of the shunt and series
compensators is decoupled with each other. Jia-jun LIU & Ying QI [61] introduced and demonstrated
a new scheme of the power transmission which can integrate the function of the power system
synchronization and the UPFC. The model simulation indicates desired results. Chia Chu & Hung Chi
[49] introduced and illustrated energy functionality of the UPFC control model for improving transient
stability of network preserving power systems. The UPFC control model simulation indicates very
promising results. Mojtaba Khederzadeh [64] demonstrated the UPFC controller’s operating
characteristics on the power transmission line and positive impact of distance protective relays. He
also focused on the series injected voltage magnitude and phase angle on the performance of
protective relays at different fault conditions. D. W. Lee and S. I. Moon [60] introduced and
demonstrated coordinated control algorithm of the UPFC control device. The primary aim of this
algorithm is to stringent control the voltage level to avoid any inverter capacity limit problem. The
simulation process indicates the desired results.

Chapter 2. Literature review
39
Yixin Ni & Zhenyu Huang, investigated UPFC with power frequency model with its dc link. In this study
shunt and series components are also discussed. The UPFC control strategies have a very strong
impact on power transmission network performance. The simulation test results indicate that the UPFC
device has a strong impact to control constant power flow through power transmission network. In
addition to that constant series compensation is very useful for first swing stability as well as for
providing additional control, which is very effective in damping inter-area power oscillation. Li LI,
Zongxiang LU, Arui [69], investigated a UPFC control device integrates properties in order to meet shunt
and series compensation of power transmission network. These properties can be altered in order to
increase power transfer capability and stability. This research indicates that by implementing new
control strategies there is significant improvement in power transfer capability and stability. Kazemi, S.
Jamali, H. Shateri [68], investigated that the Unified Power Flow Controller (UPFC) has capability to
control the line impedance, phase angle and reactive power in the power system transmission network.
The UPFC simulation results indicate improved power system stability by providing proper operations
block. Effectively, improper UPFC operations can deteriorate the power system stability.
Kazemi, S. Jamali, [68] also investigated the UPFC effects to increase power transfer capacity through
the power system network. In fact, UPFC has capacity and capability to control three parameters of
power system operations independently. The simulation results indicate reasonable power transfer
through the network after adjusting and optimizing its defined control parameters. M. Boyra∗ and J.-L.
Thomas[70], investigated the UPFC performance during the network fault condition. Primary aim of this
research is to observe the UPFC behavior and its capability to compensate the transmission line in
order to secure reactive power and active power flow and diminish the fall-off of the bus voltage if there
is ground fault. However, the simulation results indicate very promising response of UPFC under typical
fault condition. M. Kenan [72] investigates the UPFC reactive power and voltage balance in the power
transmission network. In order to determine these issues two control schemes have discussed one
conventional and other nonconventional. In the first scheme the shunt converter control the UPFC
voltage and DC link voltage along with series converter controls the transmission line reactive and real
power. In the non-conventional scheme the shunt converter provides reactive power and maintains the
DC bus voltage and the series converter controls the real power and the UPFC bus voltage. The results
indicate that conventional control gives good performance and unconventional control topology will
enhance UPFC operations performance.
2.2.4. Application of HVDC power transmission system
Yong Li & Zhiwen Zhang, [80] introduced and demonstrated new HVDC transmission system to
deliver bulk power. They have also introduced new converters transformers as well as inductive filters.
Simulation results indicate that the HVDC technology is very effective and efficient. Qing Zhong, Yao

Chapter 2. Literature review
40
Zhang & Lingxue Lin [76] introduced and illustrated a study on HVDC Light for its enhancement of
AC/DC hybrid transmission system and multi-infeed HVDC system. Simulation results indicate that the
HVDC light is more effective and efficient compared to conventional HVDC. D.T. Oyedokun & K. A
Folly [74] introduced and illustrate the new configuration of HVDC and hybrid HVAC and HVDC power
transmission line and the effect of DC faults on the transient stability of a Multi-Machine Power System
with a two transmission line.
Chunyi Guo, and Chengyong Zhao [73] introduced and demonstrated a double-infeed HVDC (high
Voltage Direct Current) power system, combining a conventional HVDC transmission and voltage-
source converter based VSC-HVDC technology. Simulation results indicate that DI-HVDC technology
has a great potential compared to a conventional HVDC system. Yan Liu, Zhe Chen [78] introduced
and illustrated a general model of dual in-feed HVDC system by applying Voltage Source Converter -
HVDC, which can be used as an element in large multi in-feed HVDC system. The simulation results
indicate that the double in-feed HVDC system has better control compared to a single in-feed HVDC
system.
Yong Li, & Zhiwen Zhang [78] introduced and demonstrated new circuit topology of the traditional
current source converter based on the HVDC transmission system, along with a new inductive filtering
method. Simulation results indicate that this topology maintains the stable operating performance and
represents the good fault-recovery ability when suffering the typical faults. Y.P. Li, D.G. Wang, A. P.
Hu [77] introduced and illustrated an HVDC control and protection real-time simulation system based
on a SIMADYN platform in line with practical HVDC projects. Simulation study results indicate that the
RTDS tool is very viable to measure and design control and protection system. Hongtao Wang &
Chengming [75] introduced and illustrated a HVDC power system restoration procedural approach to
enhance power system controllability, stability and reliability. The simulation results indicate that the
HVDC system has a great effect on power system operations.
2.2.5 Application of PID controller tuning:
Chiha, J. Ghabi and N. Liouane [89] investigated and demonstrated new technique tuning of PID
controller by using Multi objective Differential Evolution. Simulation results indicate that a new tuning
method has a better control system performance compared with the conventional approach. Yingjian
Xu, & Wei Zhang introduced and illustrated a first order plus dead time (FOPDT) control parameters
technique. By using this method desired results were achieved. The simulation results indicate its
simplicity and accuracy. ZOU Dexuan & GAO Liqun introduced and demonstrated a new technique of
PID controller optimization robustness by using MGHS (modified global harmony search algorithm).
Therefore, experiments’ results indicate that MGHS has a great potential to improve PID controller
optimization process.
Chapter 2. Literature review
41
Maryam Khoie & Karim Salahshoor [94] investigated and demonstrated a Genetic-AIS (artificial
Immune System) algorithm for PID controller tuning by using a multi-objective optimization framework.
Simulation results indicate the robustness of the PID controller response without any constraints.
Yanzhu Zhang & Jingjiao Li [95] introduced and illustrated a Genetic Algorithm to design of fractional
order of PID controller to enahnce PID controller response and accuracy. Simulation results indicate
robustness of the PID controller. Jyh-Cheng & Sheng-Wen Lin [93] introduced and demonstrated a
design concept of PID controller for a process based on inverse response and time delay. Whereas,
the analytical tuning rule for PID control parameters is developed and synthesized. Simulation results
indicate the superiority of the proposed design technique.
B.Nagaraj & N.Murugananth[87] investigated and demonstrated a soft computing technique to
enahnce the PID controller response and robustness with a degree of precision. Simulation results
indicate that the using of a soft computing technique for the PID controller improves the performance
of the process on time-base without any limitations. Bin Zuo & Jing Li [88] introduced and
demonstrated discrete-time extremum seeking algorithm based on annealing recurrent neural
network(EAA-ARNN) for PID controller’s auto tuning purposes. Firstly, there was introduced the
integral squared error (ISE) and secondly, the discrete-time ESA-ARNN. Simulation results indicate
that ESA-ARNN have a performance to enahnce PID controller robustness. Jie Li & Jingkuan Gong
[91] introduced and demonstrated a Genetic Algorithm and PSO (particle swarm optimization) to
enahnce PID controller capability with a degree of precision. In addition, PFO (particle filter
Optimization) was also introduced to achieve a better performance while reducing the computation
complexity. Simulation results indicate the effectiveness of the proposed algorithm.
2.3. HVDC Projects:
2.3.1 World first HVDC link in Australia
Direct Link rated capacity 180MW/65km underground cable, from Queensland to New South Wales,
in 2000.
“Murray Link rated capacity of 200MW/180KM underground cable, from south Australia to New
South Wales, in 2002.
Basslink rated capacity 480MW/360km underground, undersea and overhead line, from Tasmania
Island to Victoria.
2.3.2. First Merchant HVDC link in US:
Cross sound project rated capacity of 330MW/40Km sea cable, from Connecticut to Long island.
Lake Erie project rated capacity 990MW/145km from Ontario IMO to PJM.
Harbor Cable project rated capacity 660MW/40KM, from PJM to new jersey ISO.
Multi terminal 3- Bipoles link rated capacity 9000MW, from Illinois to California.

Chapter 2. Literature review
42
2.3.3. Trans Canada HVDC links in Canada:
The HVDC link 2000MW/ 1600KM, from Low cost generation in oil sands region to north Alberta
[165-169].
Brian Gemmell (IEEE PES Dallas 2003) described that the HVAC with FACTS devices Series and
shunt compensation. These devices are operating in two modes of control operations fixed and
variable control mode. The variable control mode will provide précis slow and fast switching
operations either stepped or continuous variation.
2.4. FACTS projects:
Phase shifting transformer (Quad Booster) is implemented with rating 2950MVA, 400kV in order to inject
quadrature voltage in series and phase varied by Tapchanger. Thyristor controlled Series Capacitor
(TCSC) implemented 202Mvar, 500kV at Slatt/BPA and 108Mar, 500kV Imperatriz and Serra da
Mesa/Electobras. Static Var Compensator is shunt connected, which encompassed a/the? Thyristor
controlled reactor (TCR), Thyristor Switched capacitor (TSC), and Fixed Capacitor (FC). STATCOM
based on IGBT and GTO in order to meet continuous variable compensation +/- 75 Mvar (0-225 Mvar
Installation Range) response time <100ms and >98% availability. Following projects are in operations
without any constraints. The first high-power STATCOM in the United States was commissioned in late
1995 at the sullian substation of the Tennesse Valley Authority (TVA) for transmission line
compensation (Nominal capacity +/- 100 Mvar Short term capacity +/- 120 Mvar, Transmission line
voltage 161kV and converter output voltage 5.1kV, GTO rating 4.5 4KA(peak). The first Unified Power
Flow controller in the world, with totaling rating of +/- 300 MVA, was commissioned in mid-1998 at the
Inez Station of the American Electric Power (AEP) in Kentucky for voltage support and power flow
control.
The first lesson was learnt from the materials that the reshaping of energy deregulation of the electricity
market, the conventional concepts and practices of electrical power systems operations and
management has been changed. These are leading to a power system stalemate (deadlock) in demand
versus supply as well as constraint on quality issues. To resolve these issues an introduction of flexible
AC transmission system (FACTS) technology came into existence in the digital era.
The second lesson was learnt from the review materials that the FACTS devices are contributing
dynamically to control the power flow in the network, which reduces the flow in heavily loaded lines and
also provides an instrumental approach for increasing and shifting the loadability of the network along
with low system losses, improved stability of network and reduced cost of power production in multi
aspects. The third lesson was learnt from the materials, it is important to identify and determine the
optimum location of STATCOM, SSSC and UPFC devices because of their considerable
implementation costs. Henceforth, an optimal location of FACTS devices and multiple controls have also
been determined with and without considering the investment cost of FACTS devices and their impact

Chapter 2. Literature review
43
on the generation, transmission and distribution systems. This is very important to build-up an effective
algorithm to identify and assess the optimal location of FACTS devices and their controls based on the
economic saving (reduction of FACTS devices installation) and their impact on existing system
operational stability as well as reduction in energy losses. In various papers it has also addressed the
importance of the different types of FACTS devices and implementation at different locations of the
power system to get maximum benefits out of these.
2.5. Summary
The following are the main standpoints the previous work did not investigate fully or partially and this
work will be addressed. The primary contribution of this research work is to investigate the STATCOM,
SSSC and UPFC devices impact on the GCC power grid. This research work also demonstrates
comparative results with and without these devices on the GCC power grid
a. Firstly it describes the research study benefits, the GCC power grid background and the
STATCOM, SSSC and UPFC strategic reinforcement plan.
b. Secondly it describes the significance of the STATCOM, SSSC & UPFC selection process and
each device-weighted score by using the Wideband Delphi technique.
c. Thirdly it demonstrates the STATCOM, SSSC & UPFC models case studies results and its
operational impacts at all sides on the GCC power grid by using PI new configuration control
parameters. This section also indicates the effectiveness with and without the STATCOM, SSSC &
UPFC at their proposed locations and also shows the dynamic response of the STATCOM, SSSC,
UPFC operations.
d. Fourthly it also discusses selection process results, controller significance and the STATCOM,
SSSC & UPFC impact in detail on the GCC power grid.
e. Based on the above-mentioned literature reviewed, the PID controller was configured to meet
power system operational requirements on the GCC power grid.
44
3.1. Introduction
In this chapter a power transmission line model was developed in order to identify and determine
various important operating and control parameters. These are very viable in order to tailor different
FACT/HVDC devices as appropriate to serve the purpose, which will be implemented at various
locations on the GCC power grid. This chapter discusses long transmission lines’ basic principal,
operating parameters and compensation levels and how these could be obtained by putting its
operational and security criticalities into consideration. Hereby, a simple shunt and series
compensation technique was adopted to develop STATCOM and SSSC models to implement in order
to provide appropriate shunt and series compensation in the GCC power grid as applicable. This
chapter also describes UPFC control and operational parameters, which is providing an adequate
compensation to the power long transmission lines by putting its operational and security criticalities
into consideration. Hereby a simple Unified Power Flow Control compensation technique was adopted
to develop a UPFC control model and to implement it in order to provide an appropriate shunt and
series compensation by using Unified Power Flow Controller on the GCC Power grid as applicable.
Furthermore, this chapter illustrates the viabilities of HVDC transmission system for bulk power
transfer and HVDC link and their applications in the GCC Power grid if applied. Herein HVDC
operations and characteristics are also described.
3.2. Long transmission lines model:
The power transmission line comprises of three distributed parameters, inductance, capacitance and
resistance. Each section of the transmission line has its own inductance, capacitance and resistance.
These parameters are very important and complicated from a calculation standpoint to develop an
accurate mathematical model. But the accuracy is very important to analyze long transmission line’s
transient and high frequency effects. In order to establish main principles of the power transmission
line by using good approximated models which are easy to setup or deal with. In this study, there will
be a determination of the physical dimensions of the power transmission line by assessing inductance
and capacitance values. These derived values will be used to establish a simple model to describe the
long transmission line operations.
Power Transmission Lines Modeling & Series/Shunt Compensation
CHAPTER 3
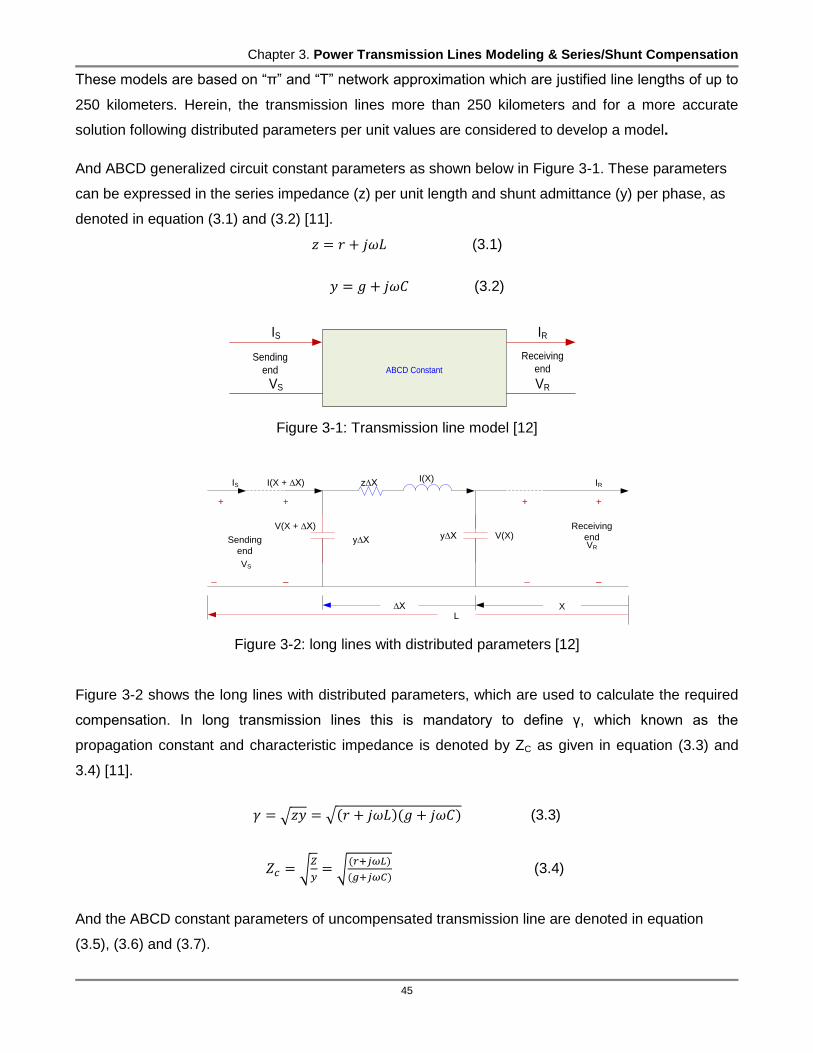
Chapter 3. Power Transmission Lines Modeling & Series/Shunt Compensation
45
These models are based on “π” and “Τ” network approximation which are justified line lengths of up to
250 kilometers. Herein, the transmission lines more than 250 kilometers and for a more accurate
solution following distributed parameters per unit values are considered to develop a model.
And ABCD generalized circuit constant parameters as shown below in Figure 3-1. These parameters
can be expressed in the series impedance (z) per unit length and shunt admittance (y) per phase, as
denoted in equation (3.1) and (3.2) [11].
(3.1)
(3.2)
ABCD Constant
IRIS
VS VR
Sending
end
Receiving
end
Figure 3-1: Transmission line model [12]
Sending
end
VS
IS IR
VR
Receiving
end
I(X + ∆X)
V(X + ∆X)
y∆X
z∆X I(X)
y∆X V(X)
∆X XL
_ _ _ _
+ + + +
Figure 3-2: long lines with distributed parameters [12]
Figure 3-2 shows the long lines with distributed parameters, which are used to calculate the required
compensation. In long transmission lines this is mandatory to define γ, which known as the
propagation constant and characteristic impedance is denoted by ZC as given in equation (3.3) and
3.4) [11].
(3.3)
(3.4)
And the ABCD constant parameters of uncompensated transmission line are denoted in equation
(3.5), (3.6) and (3.7).

Chapter 3. Power Transmission Lines Modeling & Series/Shunt Compensation
46
(3.5)
(3.6)
(3.7)
Henceforth, by controlling shunt and series compensation, a significant improvement in the power
transfer within acceptable voltage limit can be achieved. Consequently, the formulated sequence can
be used to examine the A and B parameters of a compensated transmission line as denoted in
equation (3.8) and (3.9).
(3.8)
(3.9)
Where:
Z= total series impedance of the transmission line
Y= Total shunt admittance of the line
3.3. Long transmission line’s compensation
To compensate for long transmission lines, it is essential to divide the line into various sections by
using compensation at each section. This controls the voltage profile and facilitates switching and
reduces short circuit currents. Typical 500kV, 1000km scheme may be used a compensation totaling
of 1200Mvar. Hence this is desirable to implement shunt and series compensation at intermediate
points as well as at the ends of the lines.
3.4. shunt compensation of the power transmission system:
The study indicates an increase in line length results in an increase in shunt capacitance. Therefore,
this is very important to provide some external devices or control methodology to inform of shunt
compensation to reduce this parameter. The line charging current becomes quite significant when the
line is slightly loaded, it means when there is a sudden loss of load. Effectively, there is excessive
capacitive power (generation of leading VAR) that causes the voltage to rise at different points along
with the transmission line. This is obviously an undesired operating condition. Based on these
consensuses this problem is overcome by using shunt compensation. In practice, due to economic
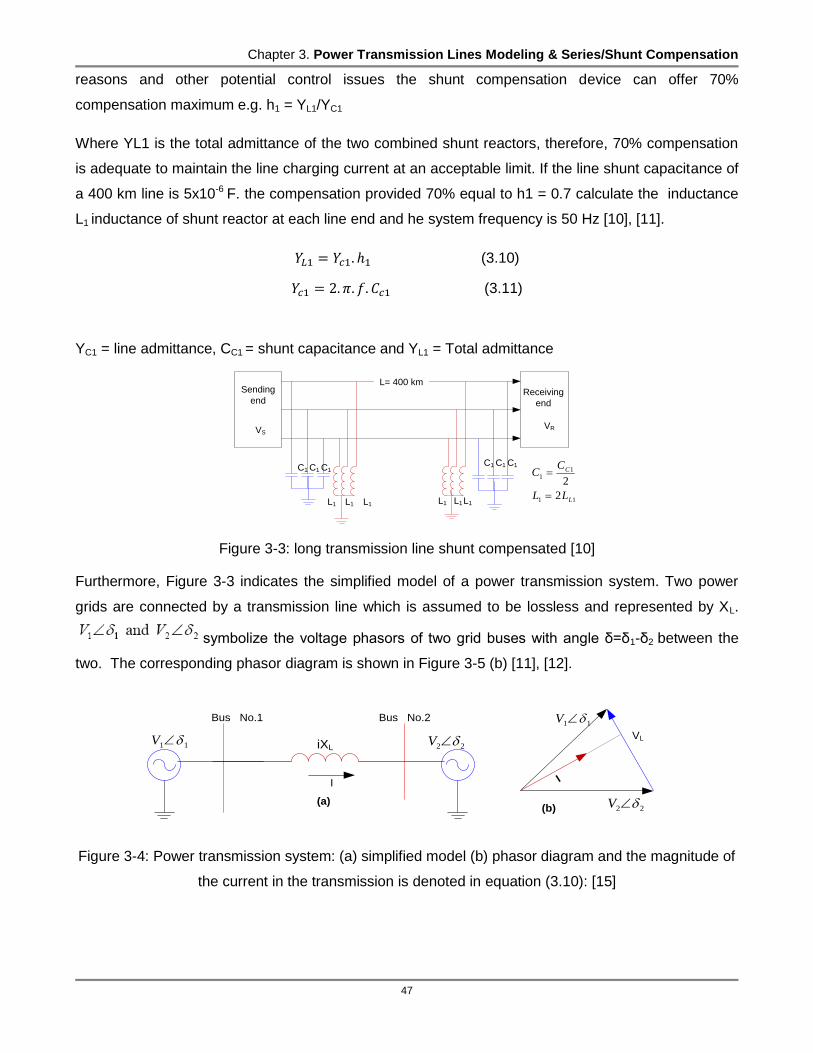
Chapter 3. Power Transmission Lines Modeling & Series/Shunt Compensation
47
reasons and other potential control issues the shunt compensation device can offer 70%
compensation maximum e.g. h1 = YL1/YC1
Where YL1 is the total admittance of the two combined shunt reactors, therefore, 70% compensation
is adequate to maintain the line charging current at an acceptable limit. If the line shunt capacitance of
a 400 km line is 5x10⁻⁶ F. the compensation provided 70% equal to h1 = 0.7 calculate the inductance
L1 inductance of shunt reactor at each line end and he system frequency is 50 Hz [10], [11].
(3.10)
(3.11)
YC1 = line admittance, CC1 = shunt capacitance and YL1 = Total admittance
VR
Receiving
end
Sending
end
VS
L= 400 km
C1 C1 C1
L1L1L1
C1 C1 C1
L1L1L111
11
2
2
L
C
LL
CC
Figure 3-3: long transmission line shunt compensated [10]
Furthermore, Figure 3-3 indicates the simplified model of a power transmission system. Two power
grids are connected by a transmission line which is assumed to be lossless and represented by XL.
symbolize the voltage phasors of two grid buses with angle δ=δ1-δ2 between the
two. The corresponding phasor diagram is shown in Figure 3-5 (b) [11], [12].
iXL11 V22 V
Bus No.1 Bus No.2
I I
VL
22 V
11 V
(a)(b)
Figure 3-4: Power transmission system: (a) simplified model (b) phasor diagram and the magnitude of
the current in the transmission is denoted in equation (3.10): [15]

Chapter 3. Power Transmission Lines Modeling & Series/Shunt Compensation
48
(3.12)
The active and reactive components of the current flow at Bus No. 1 as denoted in equation (3.13)
,
(3.13)
The active and reactive power at Bus No. 1 as denoted in equation (3.14)
,
(3.14)
Similarly, the active and reactive components of the current flow at Bus No. 2
as denoted in equation (3.15).
,
(3.15)
The active and reactive power at Bus No. 2 as denoted in equation in (3.16).
,
(3.16)
Equation (3.14) indicates the active and reactive power/currents which can be regulated by controlling
voltage, phase angle and line impedance of the transmission line. As Figure 3-4 indicates, the active
power will reach the maximum when the phase angle at degree. Practically, a small angle is
used to keep the system stable from the transient and dynamic oscillation. Generally, the
compensation is divided into shunt and series mode of operations as per power system smooth
operations without any constraint.
3.4.1 Shunt compensation:
A device that is connected in parallel with a transmission line is called a shunt compensator. It is
referred to as a compensator since it compensates for the reactive power in the ac power system to.
a) Improve the voltage profile
b) Improve the power-angle characteristics
c) Improve the stability margin
d) Provide damping to power oscillations

Chapter 3. Power Transmission Lines Modeling & Series/Shunt Compensation
49
Figure 3-5 indicates the ideal shunt compensator as an ideal current source that supplies only reactive
power and no real power. It is connected at the midpoint of a lossless line to support the voltage [12].
IS IR
VS VR
VM
X/2 X/2
IQ
Figure 3-5: Ideal shunt compensator:[12]
VM
V
Leading Lagging
IQ
Figure 3-6: Ideal shunt compensator characteristics [12]
Figure 3-6 shows the ideal voltage-current characteristics of an ideal shunt compensator in which the
midpoint voltage is held constant irrespective of the current injected. It will hold constant voltage
irrespective of current injected or draw IQ is lagging/leading does not matter. The injected current must
have phase Quadrature with the midpoint voltage to meet the proper compensation requirements. As
a result the real power injected by the compensator will be zero.
(3.17)
Equation (3.16) indicates VS sending-end voltage, VR receiving end voltage and VM Midpoint voltage,
which are denoted in Figure 3-7.
(3.18)
IR current received at the receiving-end and IS indicates the current injected by the source, which are
expressed in Figure 5-5
(3.19)
Equation (3.17) indicates IQ current that is injected into transmission line by the compensator at mid
point as indicated in Figure 3-6.
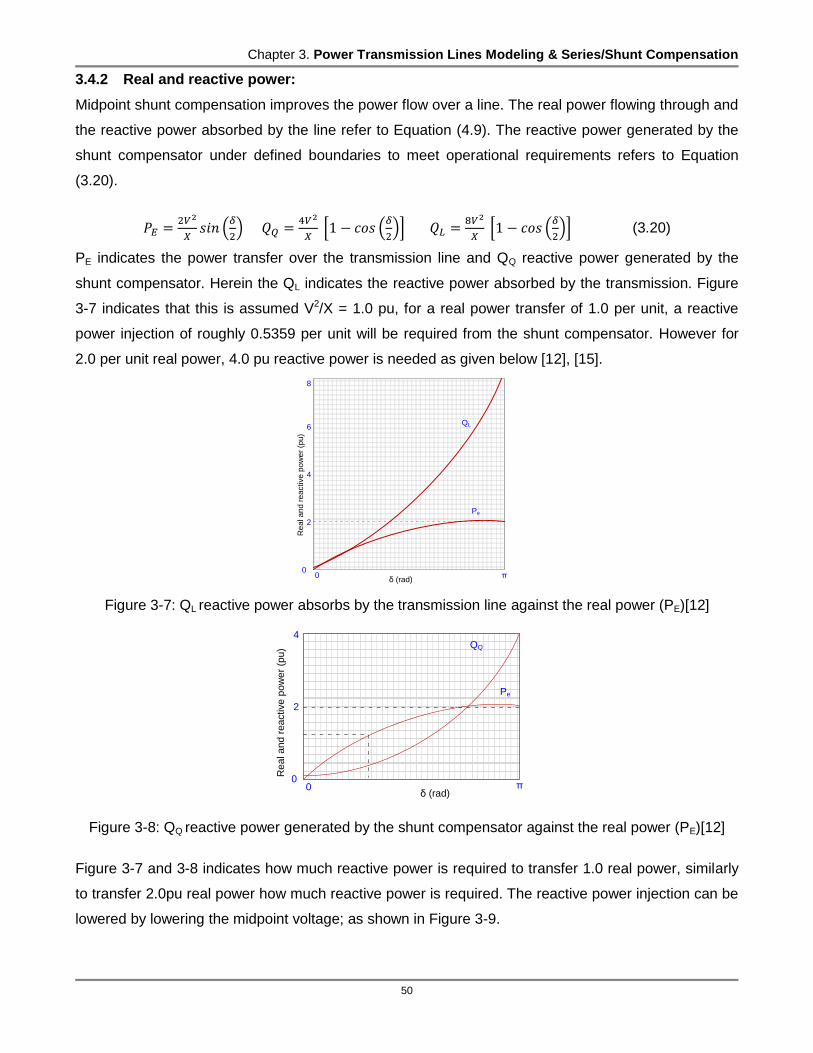
Chapter 3. Power Transmission Lines Modeling & Series/Shunt Compensation
50
3.4.2 Real and reactive power:
Midpoint shunt compensation improves the power flow over a line. The real power flowing through and
the reactive power absorbed by the line refer to Equation (4.9). The reactive power generated by the
shunt compensator under defined boundaries to meet operational requirements refers to Equation
(3.20).
(3.20)
PE indicates the power transfer over the transmission line and QQ reactive power generated by the
shunt compensator. Herein the QL indicates the reactive power absorbed by the transmission. Figure
3-7 indicates that this is assumed V2/X = 1.0 pu, for a real power transfer of 1.0 per unit, a reactive
power injection of roughly 0.5359 per unit will be required from the shunt compensator. However for
2.0 per unit real power, 4.0 pu reactive power is needed as given below [12], [15].
0π0
δ (rad)
4
Re
al a
nd
re
active
po
we
r (p
u)
QL
2
6
8
Pe
Figure 3-7: QL reactive power absorbs by the transmission line against the real power (PE)[12]
0π0
δ (rad)
4
Re
al a
nd
re
active
po
we
r (p
u) QQ
2
Pe
Figure 3-8: QQ reactive power generated by the shunt compensator against the real power (PE)[12]
Figure 3-7 and 3-8 indicates how much reactive power is required to transfer 1.0 real power, similarly
to transfer 2.0pu real power how much reactive power is required. The reactive power injection can be
lowered by lowering the midpoint voltage; as shown in Figure 3-9.

Chapter 3. Power Transmission Lines Modeling & Series/Shunt Compensation
51
0
Reactive power (pu)
Re
al P
ow
er
(pu)
1 2 3 4
0.5
1.0
1.5
2.0
|VM| = 1.0 pu
|VM| = 0.9 pu
|VM| = 0.95 pu
Figure 3-9: reactive power requirements [12]
Figure 3-10 indicates the stability improvement during power generation. The A1 shaded area
indicates the acceleration and A2 the de-acceleration during power generation based on
Pm(mechanical Power). In the second portion A3 indicates the acceleration area and A4 indicates the
small de-acceleration area based on Pm (mechanical Power), which is providing a large margin
because sufficient reactive power is being injected by the shunt compensator, and it is transferring
more real power without endangering the power system stability[19], [20].
00
δ (rad)
1
2
δcrδ0 δmax
Sin δ
A1
A2
Pm
00
δ (rad)
1
2
δcrδ1 δ2
2Sin (δ/2)
A3
A4
Pm
Figure 3-10: stability improvement based on equal criteria methodology [12]
3.4.3 Power swing damping:
PM is the mechanical power input. However the electrical power Pe is defined as a function of the load
angle and the magnitude of the voltage at the midpoint. These are the integrated factors which can
alter the power transmitted over a transmission line for constant voltage at the two ends.
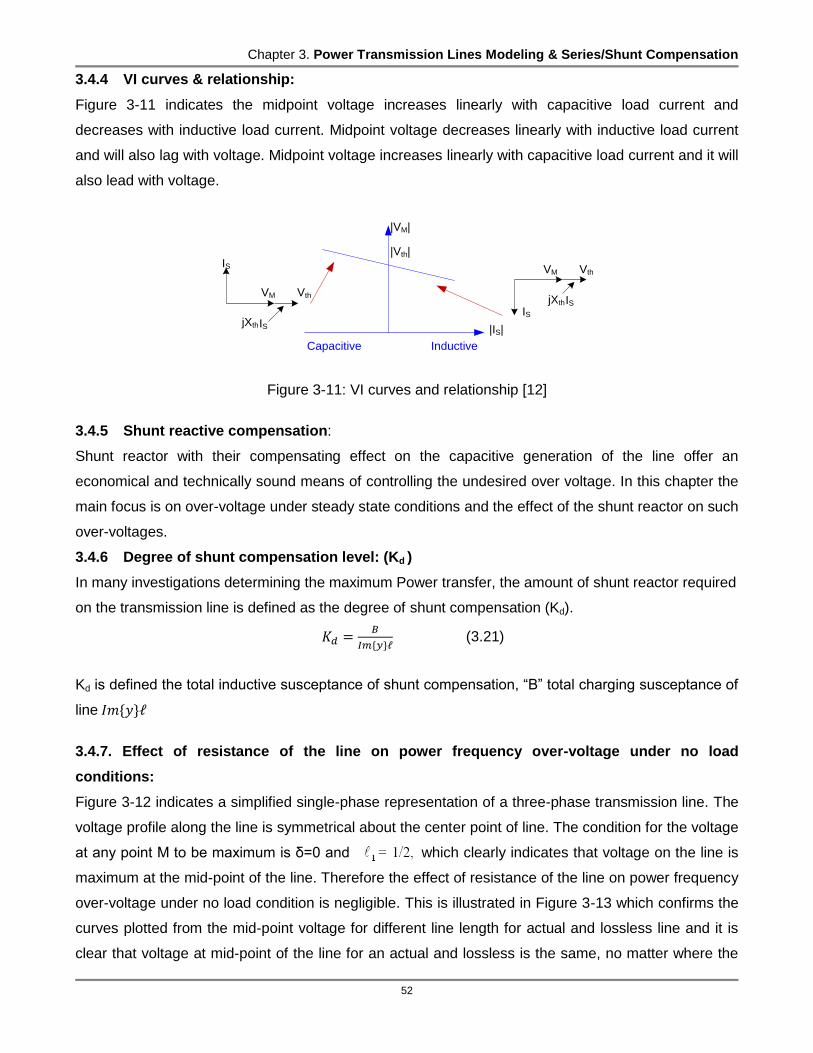
Chapter 3. Power Transmission Lines Modeling & Series/Shunt Compensation
52
3.4.4 VI curves & relationship:
Figure 3-11 indicates the midpoint voltage increases linearly with capacitive load current and
decreases with inductive load current. Midpoint voltage decreases linearly with inductive load current
and will also lag with voltage. Midpoint voltage increases linearly with capacitive load current and it will
also lead with voltage.
|VM|
|Vth|
Capacitive Inductive
|IS|
IS
IS
VM Vth
VM Vth
jXthIS
jXthIS
Figure 3-11: VI curves and relationship [12]
3.4.5 Shunt reactive compensation:
Shunt reactor with their compensating effect on the capacitive generation of the line offer an
economical and technically sound means of controlling the undesired over voltage. In this chapter the
main focus is on over-voltage under steady state conditions and the effect of the shunt reactor on such
over-voltages.
3.4.6 Degree of shunt compensation level: (Kd )
In many investigations determining the maximum Power transfer, the amount of shunt reactor required
on the transmission line is defined as the degree of shunt compensation (Kd).
(3.21)
Kd is defined the total inductive susceptance of shunt compensation, “B” total charging susceptance of
line
3.4.7. Effect of resistance of the line on power frequency over-voltage under no load
conditions:
Figure 3-12 indicates a simplified single-phase representation of a three-phase transmission line. The
voltage profile along the line is symmetrical about the center point of line. The condition for the voltage
at any point M to be maximum is δ=0 and which clearly indicates that voltage on the line is
maximum at the mid-point of the line. Therefore the effect of resistance of the line on power frequency
over-voltage under no load condition is negligible. This is illustrated in Figure 3-13 which confirms the
curves plotted from the mid-point voltage for different line length for actual and lossless line and it is
clear that voltage at mid-point of the line for an actual and lossless is the same, no matter where the
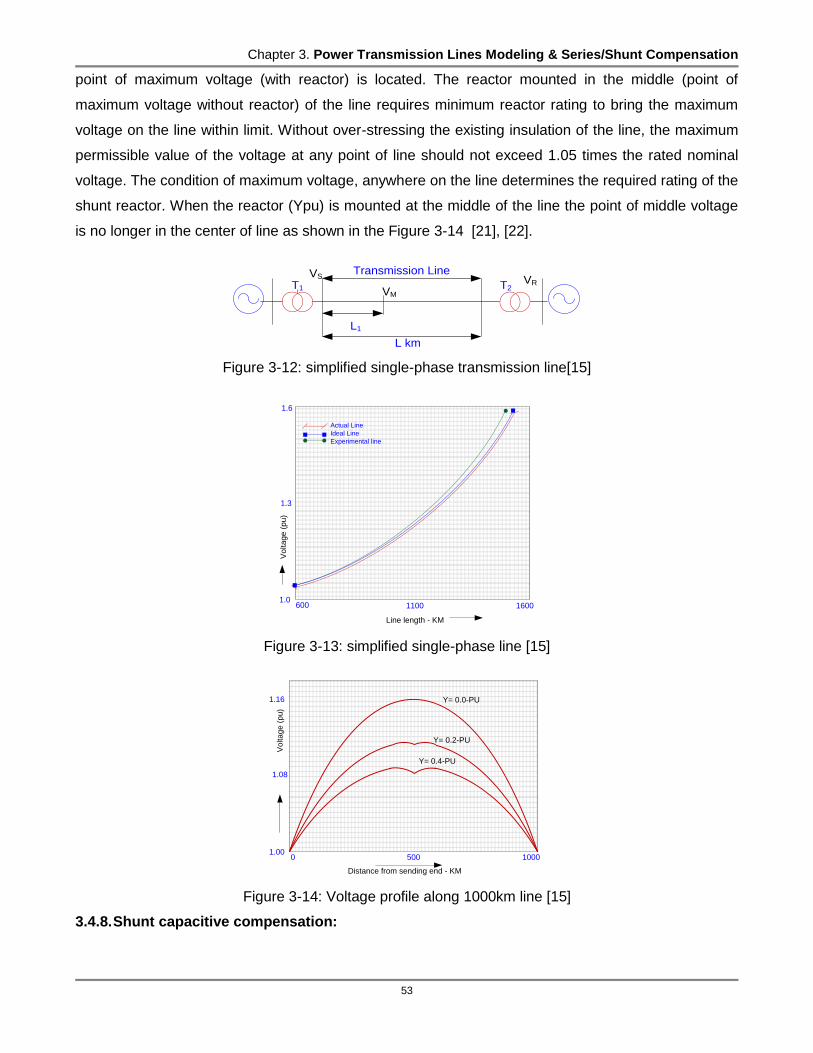
Chapter 3. Power Transmission Lines Modeling & Series/Shunt Compensation
53
point of maximum voltage (with reactor) is located. The reactor mounted in the middle (point of
maximum voltage without reactor) of the line requires minimum reactor rating to bring the maximum
voltage on the line within limit. Without over-stressing the existing insulation of the line, the maximum
permissible value of the voltage at any point of line should not exceed 1.05 times the rated nominal
voltage. The condition of maximum voltage, anywhere on the line determines the required rating of the
shunt reactor. When the reactor (Ypu) is mounted at the middle of the line the point of middle voltage
is no longer in the center of line as shown in the Figure 3-14 [21], [22].
Transmission Line
L km
VS VR
VM
L1
T1 T2
Figure 3-12: simplified single-phase transmission line[15]
1.0600
Line length - KM
1.3
Vo
lta
ge
(p
u)
Actual Line
Ideal Line
Experimental line
16001100
1.6
Figure 3-13: simplified single-phase line [15]
1.000
1.08
Vo
lta
ge
(p
u)
Distance from sending end - KM
1000500
1.16 Y= 0.0-PU
Y= 0.2-PU
Y= 0.4-PU
Figure 3-14: Voltage profile along 1000km line [15]
3.4.8. Shunt capacitive compensation:

Chapter 3. Power Transmission Lines Modeling & Series/Shunt Compensation
54
In order to eliminate the phenomenon of SSR, in the connection, the utilities have considered the use
of capacitive compensation as an alternative means of increasing transmission capacity. The prime
benefit claimed by the shunt capacitance compensation is that it is possible to maintain nodal voltage
at a nominal value through the injection of reactive power along the line. Another benefit is its
capability to extend the steady state stability and improve damping when in conjunction with static
VAR Controller. VR and send VS reactive Power PR, and real Power QR at the receiving end of the line,
the required capacitive MVAR at the receiving end for a specified load can be easily computed. The Q
value of the capacitor can be obtained as defined in equation (3.22).
(3.22)
(3.23)
Figure 3-15 shows the simplified model of a power transmission system with shunt compensation. The
voltages at two buses are assumed equal as V, and the phasor angle between them is δ. The
transmission line is assumed lossless and represented by the reactance XL. At the mid-point of the
transmission line, a controlled capacitor C is shunt connected. The voltage magnitude at the
connection point is maintained as V.
iXL/2 iXL/2
I1 I2
I C
2
SV 2
RV
Bus No.1 Bus No.2
(a)
Figure 3-15: Transmission system with shunt compensation: (a) simplified model (b) phasor
diagram (c) Power angle curve [15]
The active powers at bus 1 and 2 are equal as indicated in equation (3.24)
(3.24)

Chapter 3. Power Transmission Lines Modeling & Series/Shunt Compensation
55
The reactive power injected (QC) denoted in equation (3.25)
(3.25)
The transmitted power can be significantly increased, and the peak
point shifts from . The operation margin and the system stability are increased by
shunt compensation. The reactive power compensation at the end of redial line is especially effective
in enhancing voltage stability [23], [24].
3.4.9. STATCOM Operations:
1. A STATCOM consists of a SVS that is supplied by a dc storage capacitor Cdc as demonstrated in
Figure3-16.
2. The SVS is connected in shunt with the ac system bus through a coupling transformer with a
leakage reactance of XT.
3. If θ= φ, then the direction of the flow of purely reactive current Iq will depend on the voltage
magnitudes V1 and V2.
4. If V1 > V2 then the current flows from the ac system to the SVS and the converter absorbs
reactive (inductive) power.
5. If V2 > V1 then the current flows from SVS to the ac system and the converter generates reactive
(capacitive) power for the ac system.
6. However pure reactive injection or absorption is neither possible nor desirable.
7. Since the converter is supplied by a dc capacitor, the voltage across the capacitor will fall if the
STATCOM is not lossless.
8. The dc capacitor voltage can be regulated by replenishing the losses due to switching and in the
coupling transformer circuit by drawing power from the ac system.
9. Therefore φ must lag θ by a small amount such that the dc capacitor voltage is held constant.
10. In a multi-step converter, the fundamental component of the output voltage is determined by the
magnitude of the dc capacitor voltage.
11. Therefore the voltage magnitude V2 can be increased or decreased vice-versa the magnitude of V1
by charging or discharging the dc capacitor through the control of φ. This makes the control loop
slow.
12. Pulse width modulation (PWM) can effectively be used in a multilevel converter. This has a better
control response.
13. In a sinusoidal PWM, the fundamental component of the output voltage magnitude can be
changed by changing either the capacitor voltage or the modulation index.
14. The capacitor voltage imbalance problem in diode-clamped topology makes its use restrictive.
Alternatively flying capacitor topology can be used.
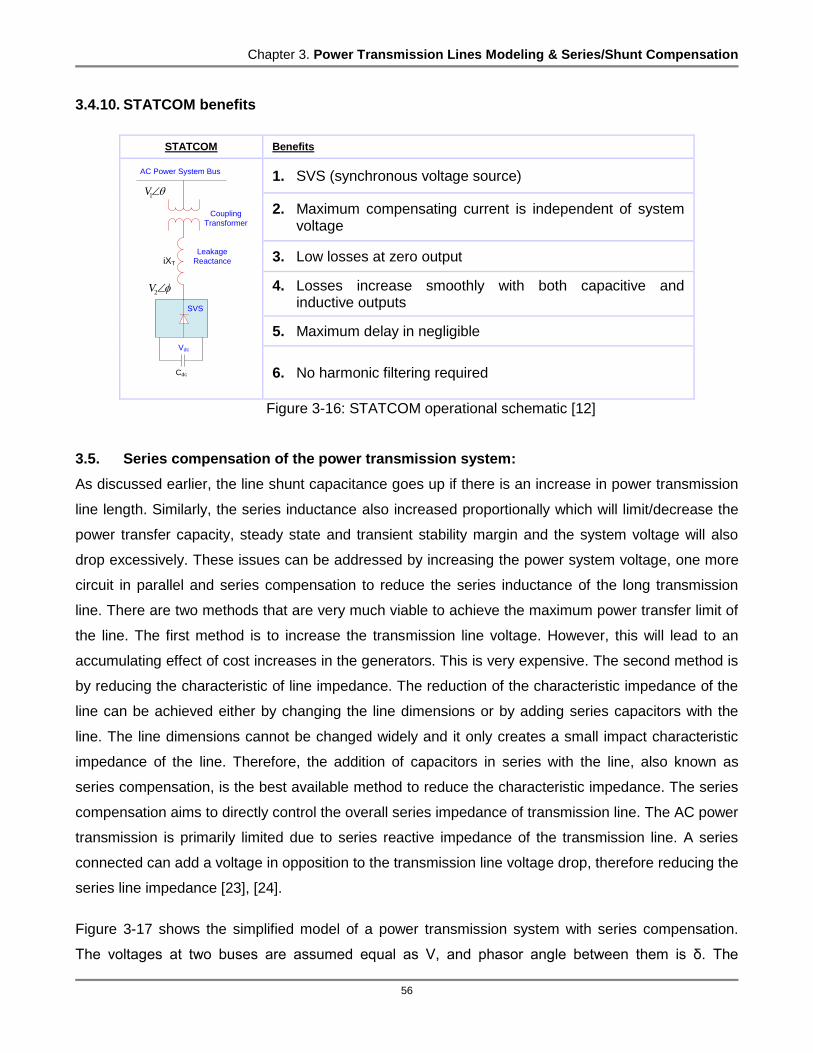
Chapter 3. Power Transmission Lines Modeling & Series/Shunt Compensation
56
3.4.10. STATCOM benefits
STATCOM Benefits
iXT
Cdc
1V
2V
AC Power System Bus
Coupling
Transformer
Leakage
Reactance
SVS
Vdc
1. SVS (synchronous voltage source)
2. Maximum compensating current is independent of system voltage
3. Low losses at zero output
4. Losses increase smoothly with both capacitive and inductive outputs
5. Maximum delay in negligible
6. No harmonic filtering required
Figure 3-16: STATCOM operational schematic [12]
3.5. Series compensation of the power transmission system:
As discussed earlier, the line shunt capacitance goes up if there is an increase in power transmission
line length. Similarly, the series inductance also increased proportionally which will limit/decrease the
power transfer capacity, steady state and transient stability margin and the system voltage will also
drop excessively. These issues can be addressed by increasing the power system voltage, one more
circuit in parallel and series compensation to reduce the series inductance of the long transmission
line. There are two methods that are very much viable to achieve the maximum power transfer limit of
the line. The first method is to increase the transmission line voltage. However, this will lead to an
accumulating effect of cost increases in the generators. This is very expensive. The second method is
by reducing the characteristic of line impedance. The reduction of the characteristic impedance of the
line can be achieved either by changing the line dimensions or by adding series capacitors with the
line. The line dimensions cannot be changed widely and it only creates a small impact characteristic
impedance of the line. Therefore, the addition of capacitors in series with the line, also known as
series compensation, is the best available method to reduce the characteristic impedance. The series
compensation aims to directly control the overall series impedance of transmission line. The AC power
transmission is primarily limited due to series reactive impedance of the transmission line. A series
connected can add a voltage in opposition to the transmission line voltage drop, therefore reducing the
series line impedance [23], [24].
Figure 3-17 shows the simplified model of a power transmission system with series compensation.
The voltages at two buses are assumed equal as V, and phasor angle between them is δ. The
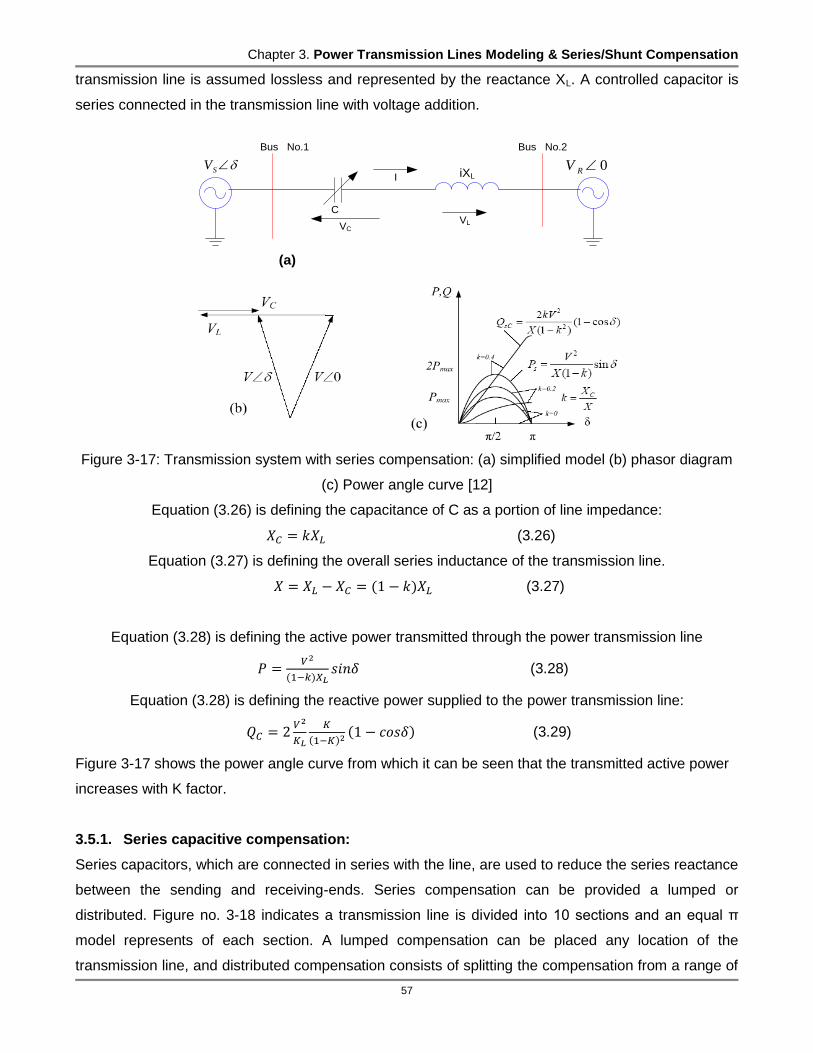
Chapter 3. Power Transmission Lines Modeling & Series/Shunt Compensation
57
transmission line is assumed lossless and represented by the reactance XL. A controlled capacitor is
series connected in the transmission line with voltage addition.
iXLI
C
SV 0RV
Bus No.1 Bus No.2
(a)
VCVL
Figure 3-17: Transmission system with series compensation: (a) simplified model (b) phasor diagram
(c) Power angle curve [12]
Equation (3.26) is defining the capacitance of C as a portion of line impedance:
(3.26)
Equation (3.27) is defining the overall series inductance of the transmission line.
(3.27)
Equation (3.28) is defining the active power transmitted through the power transmission line
(3.28)
Equation (3.28) is defining the reactive power supplied to the power transmission line:
(3.29)
Figure 3-17 shows the power angle curve from which it can be seen that the transmitted active power
increases with K factor.
3.5.1. Series capacitive compensation:
Series capacitors, which are connected in series with the line, are used to reduce the series reactance
between the sending and receiving-ends. Series compensation can be provided a lumped or
distributed. Figure no. 3-18 indicates a transmission line is divided into 10 sections and an equal π
model represents of each section. A lumped compensation can be placed any location of the
transmission line, and distributed compensation consists of splitting the compensation from a range of

Chapter 3. Power Transmission Lines Modeling & Series/Shunt Compensation
58
locations from 1 to 10. In comparison, between two types of series compensation, a lumped
compensation gives better results than a distributed compensation from the point of view obtaining the
maximum power transfer [35], [36], [37].
Figure 3-18: Transmission line compensated [15]
3.5.2. Degree of series compensation:
The percentage or degree of series compensation is used to analyze the transmission line with the
required addition of series capacitors. It is defined as the fraction of capacitive reactance XC and
inductive reactance of the line as computed in equation (3.29)
(3.30)
Since the objective is to identify and examine the amount of series capacitor on the line, therefore, it
will be useful to define the degree of compensation as required in the total line impedance, which is
computed in equation (3.30):
(3.31)
3.5.3. Series Compensation Drawback:
One major drawback of series capacitor compensation is that special proactive devices are required to
protect the capacitor or bypass the high current produced when a short circuit occurs. Also, the
inclusion of series capacitor establishes a reasonant circuit that can oscillate the frequency below the
normal synchronous frequency when stimulated by disturbance. This phenomenon is referred to as a
subsynchronous resonance (SSR). A device which is connected in series with the transmission line or
system is called a series compensator. Herewith, we will analyze how series compensator effects the
system parameters as listed below.
a) Voltage profile-
b) System power angle characteristics-
c) Stability margin-
d) and damping of power oscillations-

Chapter 3. Power Transmission Lines Modeling & Series/Shunt Compensation
59
The ideal series compensator is used to provide reactive power not real power as demonstrated in
Figure 3-19. The installation of series compensator is not very much crucial it can be placed anywhere
in the transmission line.
ISIR
VS VR
XVQ
Figure 3-19: Ideal Series compensator [12]
3.5.4. Voltage profile series compensator at undefined location:
The series voltage must be injected in such way that the series compensator does not absorb any real
power in the steady state operation as defined in equation (3.32).
(3.32)
a) Where λ is a proportionality constant
The compensation ratio is is called the compensator level. If the compensator level is 50% than
the . Lambda is also called the line impedance as given in the equation (3.32). Equation (3.33),
(3.34) and (3.35) indicate the sending and receiving ends voltage as well as sending current [23], [24].
(3.33)
(3.34)
(3.35)
3.5.5. Series compensator mode of operations:
Equation (3.35) expressed the pure capacitive mode of operation of compensator device. This is also
called the capacitive mode of operations:
(3.36)
Equation no.3.36 expressed the pure inductor mode of operation of compensator device. This is called
the inductive mode of operations:
(3.37)
3.5.6. Power angle control by series compensation:
The real and reactive powers at the sending and receiving ends as well as the required reactive power
are calculated as formulated below.
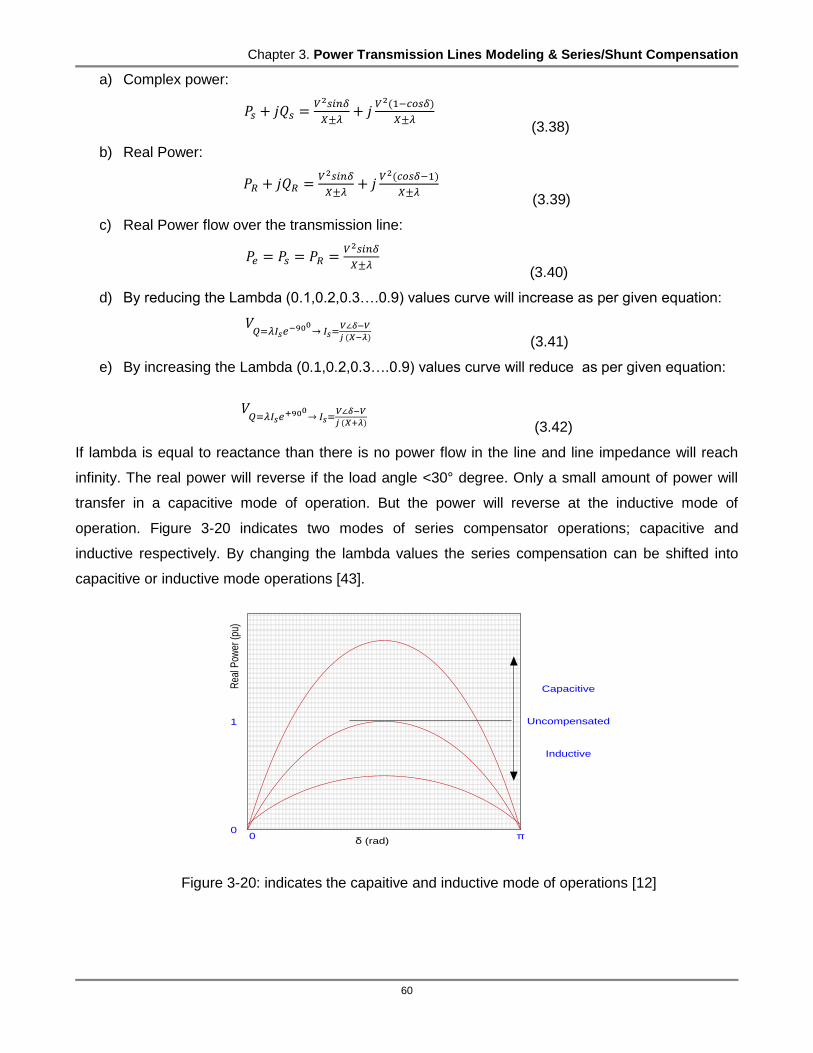
Chapter 3. Power Transmission Lines Modeling & Series/Shunt Compensation
60
a) Complex power:
(3.38)
b) Real Power:
(3.39)
c) Real Power flow over the transmission line:
(3.40)
d) By reducing the Lambda (0.1,0.2,0.3….0.9) values curve will increase as per given equation:
(3.41)
e) By increasing the Lambda (0.1,0.2,0.3….0.9) values curve will reduce as per given equation:
(3.42)
If lambda is equal to reactance than there is no power flow in the line and line impedance will reach
infinity. The real power will reverse if the load angle <30° degree. Only a small amount of power will
transfer in a capacitive mode of operation. But the power will reverse at the inductive mode of
operation. Figure 3-20 indicates two modes of series compensator operations; capacitive and
inductive respectively. By changing the lambda values the series compensation can be shifted into
capacitive or inductive mode operations [43].
0π0
δ (rad)
1
Rea
l Pow
er (
pu)
Capacitive
Uncompensated
Inductive
Figure 3-20: indicates the capaitive and inductive mode of operations [12]
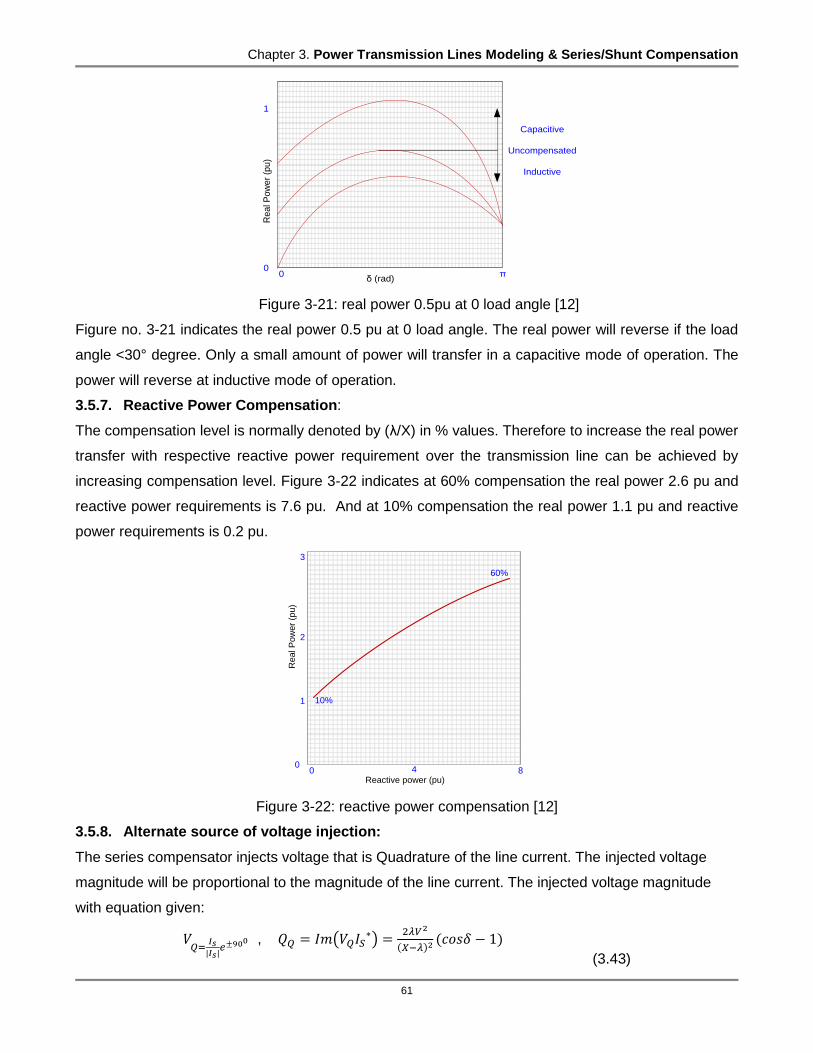
Chapter 3. Power Transmission Lines Modeling & Series/Shunt Compensation
61
0π0
δ (rad)
1
Re
al P
ow
er
(pu
)
Capacitive
Uncompensated
Inductive
Figure 3-21: real power 0.5pu at 0 load angle [12]
Figure no. 3-21 indicates the real power 0.5 pu at 0 load angle. The real power will reverse if the load
angle <30° degree. Only a small amount of power will transfer in a capacitive mode of operation. The
power will reverse at inductive mode of operation.
3.5.7. Reactive Power Compensation:
The compensation level is normally denoted by (λ/X) in % values. Therefore to increase the real power
transfer with respective reactive power requirement over the transmission line can be achieved by
increasing compensation level. Figure 3-22 indicates at 60% compensation the real power 2.6 pu and
reactive power requirements is 7.6 pu. And at 10% compensation the real power 1.1 pu and reactive
power requirements is 0.2 pu.
080
Reactive power (pu)
1
Re
al P
ow
er
(pu)
60%
2
3
10%
4
Figure 3-22: reactive power compensation [12]
3.5.8. Alternate source of voltage injection:
The series compensator injects voltage that is Quadrature of the line current. The injected voltage
magnitude will be proportional to the magnitude of the line current. The injected voltage magnitude
with equation given:
, ∗
(3.43)
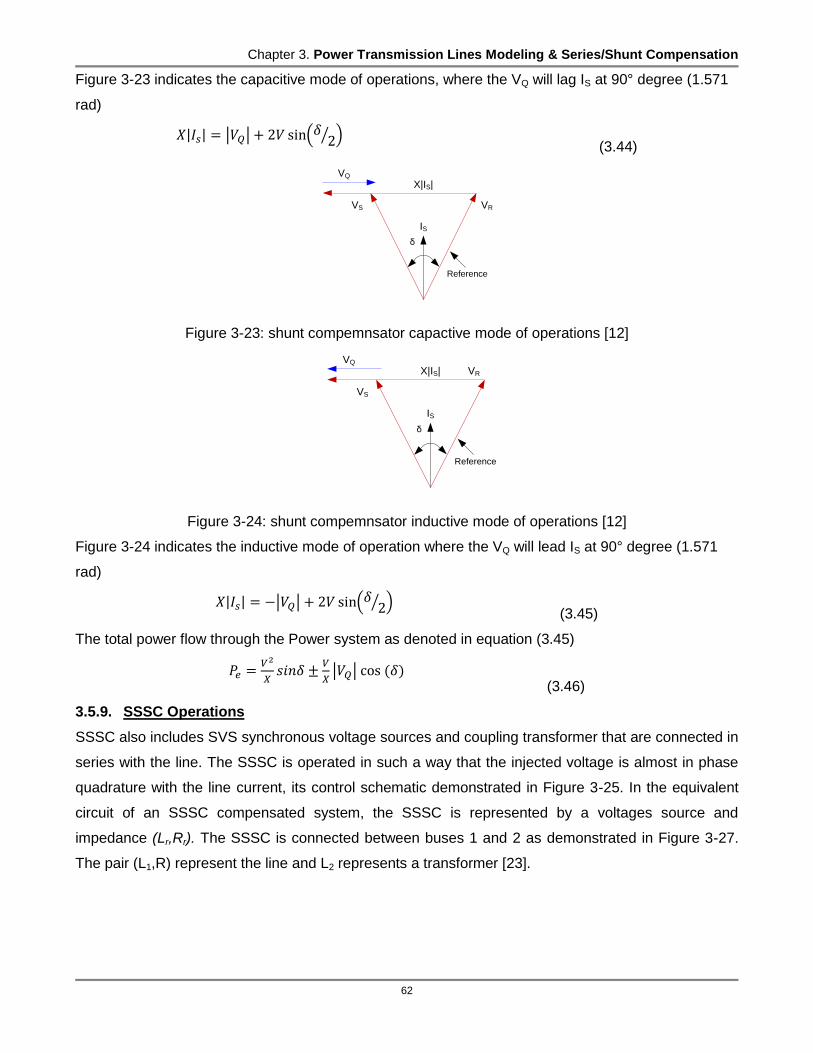
Chapter 3. Power Transmission Lines Modeling & Series/Shunt Compensation
62
Figure 3-23 indicates the capacitive mode of operations, where the VQ will lag IS at 90° degree (1.571
rad)
(3.44)
VS VR
VQ
IS
X|IS|
δ
Reference
Figure 3-23: shunt compemnsator capactive mode of operations [12]
VS
VR
VQ
IS
X|IS|
δ
Reference
Figure 3-24: shunt compemnsator inductive mode of operations [12]
Figure 3-24 indicates the inductive mode of operation where the VQ will lead IS at 90° degree (1.571
rad)
(3.45)
The total power flow through the Power system as denoted in equation (3.45)
(3.46)
3.5.9. SSSC Operations
SSSC also includes SVS synchronous voltage sources and coupling transformer that are connected in
series with the line. The SSSC is operated in such a way that the injected voltage is almost in phase
quadrature with the line current, its control schematic demonstrated in Figure 3-25. In the equivalent
circuit of an SSSC compensated system, the SSSC is represented by a voltages source and
impedance (Lr,Rr). The SSSC is connected between buses 1 and 2 as demonstrated in Figure 3-27.
The pair (L1,R) represent the line and L2 represents a transformer [23].

Chapter 3. Power Transmission Lines Modeling & Series/Shunt Compensation
63
1 2
Generator
- +
L1 R
iLQ+ -
Lr Rr
L2 Infinite bus
SSSC
Figure 3-25: SSSC control schematic [12]
X K
Xtref + X
r +
Vdcref +
Vd
c -
θd
+
Magnitude and
Angle calculator| I L
| θir +
Phase Locked Loop
(PLL)
+
θp
i LD
i LQ
D-Q
TransformationiL
v1
θL +
+
-900
θfref + θf
PI controller
Figure 3-26: SSSC schematic and control loop [12]
3.5.10. SSSC control sequence (Figure 3-26)
An instantaneous 3-phase set of line voltages at bus 1 is used to calculate the angle θ that is
phase locked to the phase-a of the line voltage.
An instantaneous 3-phase set of measured line currents is first decomposed into real and reactive
components.
The amplitude and the relative angle of the line current θir are then calculated.
The phase locked angle θP and θir are added to obtain the angle θl which is the angle of the line
current.
There are two control loops
Since the SSSC voltage must lag the line current by 90°, a fixed angle equal to -90° is added to θl
to obtain θfref
In the auxiliary loop, the reactance demand Xtref is added to Xr of SSSC.
The sum is multiplied by the magnitude of the line current and a constant to obtain Vdcref .
The error between Vdcref and the actual value of Vdc is passed through a PI controller to obtain Vd.
This quantity is then added to θfref to obtain θf of the inverter.
The PI controller retains the charge on the dc capacitor by injecting a voltage nearly in quadrature
with the line current.
The real power exchange between the ac system and SSSC takes place if the injected voltage is
not in quadrature with the line current, which either charges or discharges the dc capacitor.
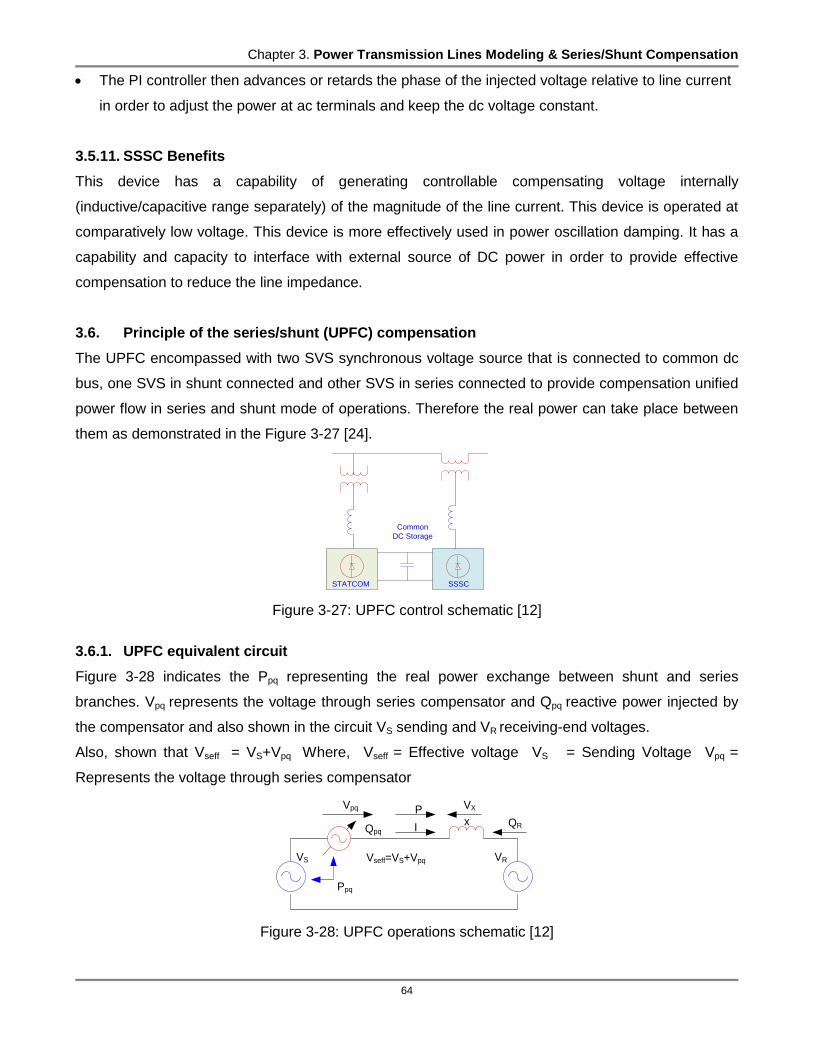
Chapter 3. Power Transmission Lines Modeling & Series/Shunt Compensation
64
The PI controller then advances or retards the phase of the injected voltage relative to line current
in order to adjust the power at ac terminals and keep the dc voltage constant.
3.5.11. SSSC Benefits
This device has a capability of generating controllable compensating voltage internally
(inductive/capacitive range separately) of the magnitude of the line current. This device is operated at
comparatively low voltage. This device is more effectively used in power oscillation damping. It has a
capability and capacity to interface with external source of DC power in order to provide effective
compensation to reduce the line impedance.
3.6. Principle of the series/shunt (UPFC) compensation
The UPFC encompassed with two SVS synchronous voltage source that is connected to common dc
bus, one SVS in shunt connected and other SVS in series connected to provide compensation unified
power flow in series and shunt mode of operations. Therefore the real power can take place between
them as demonstrated in the Figure 3-27 [24].
Common
DC Storage
SSSCSTATCOM
Figure 3-27: UPFC control schematic [12]
3.6.1. UPFC equivalent circuit
Figure 3-28 indicates the Ppq representing the real power exchange between shunt and series
branches. Vpq represents the voltage through series compensator and Qpq reactive power injected by
the compensator and also shown in the circuit VS sending and VR receiving-end voltages.
Also, shown that Vseff = VS+Vpq Where, Vseff = Effective voltage VS = Sending Voltage Vpq =
Represents the voltage through series compensator
QR
VS VR
I
Vseff=VS+Vpq
xP VXVpq
Qpq
Ppq
Figure 3-28: UPFC operations schematic [12]

Chapter 3. Power Transmission Lines Modeling & Series/Shunt Compensation
65
3.6.2. UPFC phasor diagram:
Figure 3-29(a) indicates the Voltage regulation operations in UPFC. In the second Figure 3.29(b)
indicates the Line impedance compensation and management in the UPFC controller. In the third
Figure 3-29(c) phase shifting expressed in UPFC controller and in the Figure 3-29(d) indicates UPFC
control parameters [45-47].
Figure 3-29: UPFC Phasor diagram [12]
3.6.3. UPFC operations:
Figure 3-30 expressed the UPFC operations summary in three scenarios, firstly, there is no power
transfer, if the load angle is kept at 0 degree, secondly, if the load angle is adjusted at 30 degree, then
the power will be transferred at 1.0pu. Thirdly if the load angle increased from 30 to 60 degree, then
the power capacity will be increased from 1pu to 1.5 pu. Henceforth, the UPFC has a capability of
transmitting power in either direction [81], [82].
P: can be negative and positive
Q: can be positive and negative as well.
1
0.5
-0.5
-1-0.5 0.5 1-1
δ =0
0
0
QR
P
1
0.5
-0.5
-1-0.5 0.5 1-1
δ =30
0
0
QR
P

Chapter 3. Power Transmission Lines Modeling & Series/Shunt Compensation
66
1
0.5
-0.5
-1-0.5 0.5 1-1
δ =90
0
0
QR
P
Figure 3-30: UPFC operations at various angles [12]
3.6.4. UPFC controller benefits:
• Investigation shows that the UPFC has an exceptional capability to control independently the real
and reactive power flow at any transmission angle.
• The sending and receiving end voltages are provided by independent power systems that are able
to supply and absorb real power without any internal angular change.
• In practice, the situation will be different depending on the change in load angle
3.7. HVDC application on the GCC power grid:
HVDC transmission is widely recognized as being advantageous for long-distance, bulk power
delivery, asynchronous interconnections and long submarine cable crossings. The number of HVDC
projects committed or under consideration globally has increased in recent years reflecting a renewed
interest in this mature technology. New converter designs have broadened the potential range of
HVDC transmission to include applications for underground, offshore, economic replacement of
reliability-must-run generation, and voltage stabilization. Developments include higher transmission
voltages up to ± 800 kV, capacitor-commutated converters (CCC) for weak system applications and
voltage-sourced converters (VSC) with dynamic reactive power control. This broader technology range
has increased the potential HVDC applications and contributed to the recent growth of HVDC
transmission. Figure 3-33 shows the ± 400 kV HVDC transmission line for the 2000 MW HVDC Power
Project between KSA and Qatar as demonstrated in Figure 3-31 [1], [2].
Harmonic
Filters
Harmonic
Filters
Transformer Transformer
InverterRectifier
Idc+

Chapter 3. Power Transmission Lines Modeling & Series/Shunt Compensation
67
Figure 3-31: HVDC link from KSA to Qatar
3.7.1. HVDC link deliverables
Power flow on HVDC transmission systems accurately regulated, Constant Power, Constant
frequency, reactive power control, AC voltage control. The most important aspect of HVDC is fast and
stable controllability and bi-directional power flow at a given setting.
3.7.2. VSC based Transmission system -HVDC
HVDC accurately regulating Real and Reactive Power control, Dynamic Voltage Regulation. Also,
providing Modular, expandability, and Black Startup Capability.
3.7.3. HVDC Characteristics:
There is no reactive power flow on DC line and there is no technical limit to the distance over which
the power may be transmitted by cables or overhead transmission lines. The limit of the distance is
economic, since the power losses in the transmission lines reach an unacceptable limit, when the
practical conductor is used. HVDC power transmission line comprises with following benefits: (1) Full
and fast control of the Power flow (2) No contribution toward short circuit level; (smooth control with
VSC transmission) (3) Line losses are smaller. It is possible to bring more power through DC link
without increasing fault level. (4) No reactive compensation for DC lines is required [82].
3.7.4. Principle of AC/DC/AC conversion:
In the converter stations two series connected 6 pulse converters (12-pulse bridge) consisting of
valves and converters transformers are used to convert AC to DC to AC. A smoothing reactor in the
DC circuit is also introduced to reduce harmonics distortions in the DC line and possible transient
overcurrent. AC and DC filter are used to clean the harmonics currents into AC and DC circuits. By
varying firing angle “Alpha” DC voltage can be controlled between two limits +VE and –VE.
AC to DC rectifier (rectifier operations 0° < α < 90°)
DC to AC inverter (Inverter Operations 90° < α <180°)
Extinction angle σ = 180-α
Maximum DC voltage when the “Alpha” is zero.
In the DC transmission system, the transmitted power is α difference in Vs and Vr and hence can be
controlled by changing the VsDC and VrDC. Current can flow only one direction with given settings.
Power is transported from rectifier to inverter and by altering the voltage the power flow direction is
reversed [111].

Chapter 3. Power Transmission Lines Modeling & Series/Shunt Compensation
68
Inverter station is so controlled by Vd1 and Vd2, changing the angle of αmin =5° , αmax =15°±3°
γmin=15°. To reduce the reactive power requirements by increasing Vd or reducing the α [77],[78]
3.7.5. HVDC/FACTS devices Challenges:
a) High Cost and value of HVDC:
b) Complexity of HVDC schemes/Circuits:
c) Dispatch and control of HVDC schemes:
d) Integration of HVDC with in an AC network
e) AC Harmonics filters
f) DC Harmonics filters
g) Operations of HVDC with ground return: The cost of HVDC is higher if it is permissible to operate
with a single/HV metallic conductor. The power losses in the transmission line during earth return
operations almost half of the LV metallic return conductor. Stability of network with multi in-feed at
HVDC: If the HVDC were used for many more applications in a network then the issue of
interaction between multiple HVDC schemes would become increasingly important [63], [64].
3.7.6. Proposed HVDC/FACTS devices link:
The prime objective on the GCC grid is to transfer bulk (1200MW) power from The Kingdom of Saudi
Arabia to Kuwait and Qatar through the HVDC link. In addition to that, the HVDC link is also
recommended to communicate with other GCC countries at different frequencies and voltages. After
that the DC power was distributed to Kuwait 1500MW and 1500MW to Qatar equally. Hence to
improve the Kuwaiti side power system a STATCOM device was recommended and simulated to meet
Power system operational requirements as per defined parameters by the Kuwaiti power system
authority. The UPFC also recommended delivering 2000MW power from UAE to Oman to meet both
sides’ power system operational requirements. All three models have been simulated successfully.
The amount of Power that can be reliability transmitted over an AC and DC transmission systems
depend on the transmission voltage as tabulated below [76].
Table 3.1 indicates the HVDC/HVAC Power delivery limitations:
HVDC SYSTEM HVAC SYSTEM
Voltage MW Voltage MW
+/- 70kV 1100 MW 69kV 50-100
+/- 320kV 1200 MW 115kV 15-350
+/-400 kV 3100 MW 230kV 300-450
+/- 600 kV 6300 MW 345kV 1000-2050
500kV 2000-3000
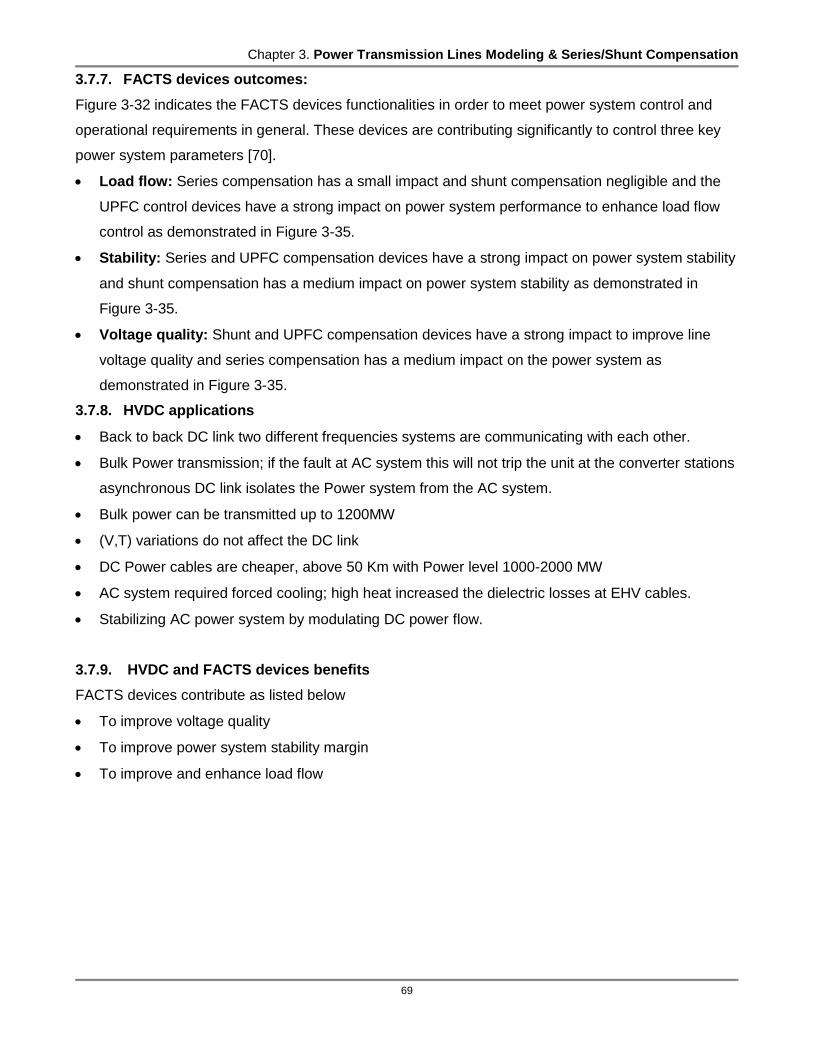
Chapter 3. Power Transmission Lines Modeling & Series/Shunt Compensation
69
3.7.7. FACTS devices outcomes:
Figure 3-32 indicates the FACTS devices functionalities in order to meet power system control and
operational requirements in general. These devices are contributing significantly to control three key
power system parameters [70].
Load flow: Series compensation has a small impact and shunt compensation negligible and the
UPFC control devices have a strong impact on power system performance to enhance load flow
control as demonstrated in Figure 3-35.
Stability: Series and UPFC compensation devices have a strong impact on power system stability
and shunt compensation has a medium impact on power system stability as demonstrated in
Figure 3-35.
Voltage quality: Shunt and UPFC compensation devices have a strong impact to improve line
voltage quality and series compensation has a medium impact on the power system as
demonstrated in Figure 3-35.
3.7.8. HVDC applications
Back to back DC link two different frequencies systems are communicating with each other.
Bulk Power transmission; if the fault at AC system this will not trip the unit at the converter stations
asynchronous DC link isolates the Power system from the AC system.
Bulk power can be transmitted up to 1200MW
(V,T) variations do not affect the DC link
DC Power cables are cheaper, above 50 Km with Power level 1000-2000 MW
AC system required forced cooling; high heat increased the dielectric losses at EHV cables.
Stabilizing AC power system by modulating DC power flow.
3.7.9. HVDC and FACTS devices benefits
FACTS devices contribute as listed below
To improve voltage quality
To improve power system stability margin
To improve and enhance load flow
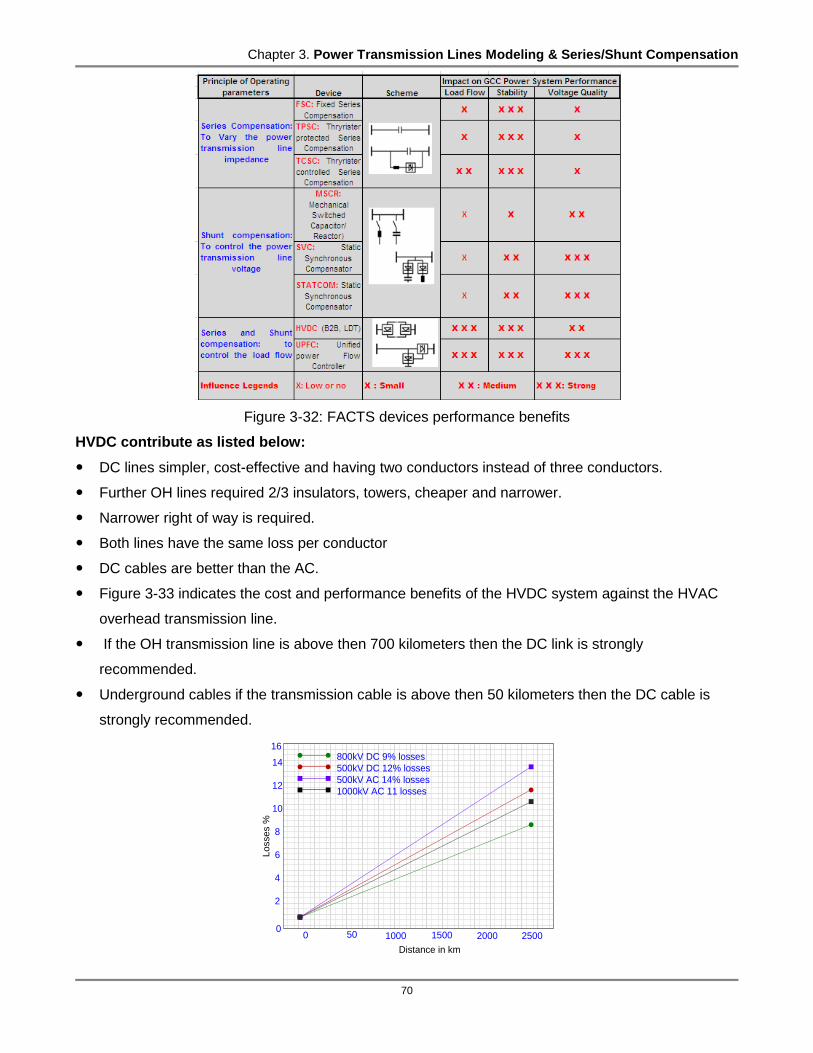
Chapter 3. Power Transmission Lines Modeling & Series/Shunt Compensation
70
Figure 3-32: FACTS devices performance benefits
HVDC contribute as listed below:
DC lines simpler, cost-effective and having two conductors instead of three conductors.
Further OH lines required 2/3 insulators, towers, cheaper and narrower.
Narrower right of way is required.
Both lines have the same loss per conductor
DC cables are better than the AC.
Figure 3-33 indicates the cost and performance benefits of the HVDC system against the HVAC
overhead transmission line.
If the OH transmission line is above then 700 kilometers then the DC link is strongly
recommended.
Underground cables if the transmission cable is above then 50 kilometers then the DC cable is
strongly recommended.
00
Lo
sse
s %
800kV DC 9% losses
500kV DC 12% losses
500kV AC 14% losses
1000kV AC 11 losses
50 1000 1500 2000 2500
14
12
10
8
6
4
2
16
Distance in km

Chapter 3. Power Transmission Lines Modeling & Series/Shunt Compensation
71
Figure 3-33: HVDC and HVAC comparative Analysis
Figure 3-33 indicates that 800kV DC transmission line has 9% losses for 2500KM, whereas 500kV DC
line is carrying 12% losses. As a result, it reflects that high DC voltage has less transmission losses
compared to 500kV DC line. Figure3-36 also indicates a similar pattern that 500kV AC transmission
line has 14% losses, whereas 1000kV AC line is carrying 11% losses. As a result, it reflects that high
AC voltage transmission line has less transmission losses compared to 500kV AC line [70-74]
3.7.10. Economic consideration of HVDC and FACTS devices
Given below Table 3.2 is briefly indicating a comparison cost analysis of HVDC against FACTS
devices to meet sustainable operational requirements [1].
Table 3.2 HVDC/FACTS devices cost comparison
No Throughput-MW HVDC 2 terminals FACTS
1 200 MW 40-50 Million Dollars 5-10 million Dollars
2 500 MW 75-100 Million Dollars 10-20 Million Dollars
3 1000 MW 120-170 Million Dollars 20-30 Million Dollars
4 2000 MW 200-300 Million Dollars 30-50Million Dollars
3.8. Summary
The GCC power grid encompassed six countries and each country power transmission is behaving
differently at different locations on the GCC power grid. Herewith, based on their current operating
parameters FACTS/HVDC devices control systems are configured in order to meet shunt and series
compensation on the GCC power grid. Firstly this chapter describes the EHV power transmission line
model and its operating and control parameters. Secondly, shunt and series compensation and its
operating and control parameters viabilities and criticalities are demonstrated effectively. Insofar,
shunt and series compensation capacitive and inductive modes of operations are also described
thoroughly. It has been also identified and determined how to transfer maximum real power through
the power transmission line and, the amount of shunt or series reactive power compensation is
required.
Secondly, this chapter describes the series compensation and its operating parameters viabilities and
criticalities. Herein both capacitive and inductive modes of operations are described by putting its
security and operational criticalities into consideration. It has been also identified and determined that
to transfer maximum power, the amount of series reactor is required on transmission line as defined
by the degree of shunt/series compensation. Thirdly, this chapter also described the UPFC and HVDC
operational versatility at different operating angles on the GCC power grid. This chapter also
demonstrates the techno economic analyses respectively.
72
4.1 Introduction
The proposed work is a control loop optimization technique, which has been adopted to fine-tune and
optimize various FACTS devices (STATCOM, SSSC, and UPFC,) performance by using Douglass J.
Cooper PID, PD, PI controller constant and variable control parameters at different locations on the
GCC power grid during any undesired operating condition. The primary objective is to identify,
determine and address vulnerable areas and operating boundaries of different control loops of target
FACTS devices that are in operation at a time to enhance or sustain along with its existing operational
performance. These devices will directly or indirectly impact on network performance (improving
voltage quality, power flow and power stability) by providing time based adequate reactive power
compensation when required.
The research work is organized as follows: after the introduction section, controller optimization
technique, the PID, PD, PI controller scope, tuning framework and controllers’ features are described
in Sections 4.2, 4.3, 4.4 & 4.5. The PID, PI, PD controllers tuning methodology, simulated models,
observation and results/conclusion are presented in sections 4.6, 4.7 4.8 and 4.9. To establish and
implement various PID and PI control loops tuning and optimization techniques are used in order to
enhance power system’s controllability and strong communication links in between the STATCOM,
SSSC & UPFC devices at different location on the GCC power grid. Listed below are the 10 control
domains that need to be understood prior to executing any tuning process in order to obtain the
desired results.
1) Define constant and variable control parameters for tuning purposes which are used to control
STATCOM, SSSC, and UPFC devices operations.
2) Define and determine the tuning purpose of controller’s in electrical control system operations.
3) Define and determine the STATCOM, SSSC, and UPFC devices operations response against the
control response.
4) Determine the importance of a quarter-wave decay ratio curve as it relates to controller tuning.
5) Determine the different waveforms result against the process operational changes
6) List the preliminary steps for tuning a controller response
7) Difference between “open loop" and “closed loop" tuning.
8) How to become familiar with the open loop tuning.
9) How to become familiar with trial and error method of tuning used in a closed loop.
FACTS controllers tuning and optimization by using PID, PD, PI configuration parameters
CHAPTER 4

Chapter 5. The STATCOM Connection Between Qatar and Bahrain
73
10) How to become familiar with ultimate method of tuning used in closed loop.
The tuning method is to adjust the control parameters (gain/proportional band, integral gain/reset, and
derivative gain/rate) at optimum values in order to produce desired and proper control response to fix
electrical power process upset. The process upset is occurring whenever there is a large disturbance
caused by a sudden change on the process input; process load and process set point. However in
order to obtain below mentioned process dynamics it is very important to properly tune the controller
to meet the operational requirements.
1) Minimize or eliminate power system control deviations.
2) Maintain power system’s operational stability.
3) Ensure power system operations safety and security.
4) Maintain generation, transmission and distribution demands without any constraint.
4.2. Novel Optimization Control Technique (Douglass J. Cooper)
This work presents the novelty of PID and PI feedback controllers in order to establish centralized or
de-centralized control of the FACTS devices by using a D.J. Cooper optimization technique. Figures 4-
1 & 4-2 indicate the centralized and de-centralized control function blocks. PID and PI controllers can
also be used when the device displays non-self-regulating behavior at different locations on the GCC
power grid. By implementing a sensitive process control based method this will help to distribute the
control signal to operate and maintain all three devices in parallel operations at time to establish
centralized control or independently to establish de-centralized control topologies. These controllers
can deliver robust and sustainable distributed control based on their disturbance rejection
performance on the GCC power grid. Based on the D.J. Cooper optimization technique PID and PI
controllers can be configured and retuned as illustrated [13].
PID and PI controllers compute a controller output (COP) value as per defined sample time “T” to the
final control element to adjust the gating response of the converters. The calculated output from the
PID & PI controllers algorithm is influenced by the controllers error e(t) and optimized tuning
parameters. Firstly, the PID controller comprises of three tuning parameters P, I and D which need to
readjust at their optimum value in order to obtain sustainable controller response. PID controller is
complicated with added challenges to tune and design controller to attain an optimum response to
meet stringent operational requirements on the GCC power grid. Secondly, the PI controller comprises
of two parameters P & I, these also need to readjust at their optimum value to obtain sustainable
controller response. This is a simple and straightforward tuning technique as adopted in [20],[21]. The
equation below (4.1) and (4.2) demonstrate how to obtain an optimum response of the PID and PI
controller [20].

Chapter 5. The STATCOM Connection Between Qatar and Bahrain
74
Equation (4.1) and (4.2) demonstrate optimized response of the PID and PI controllers.
(4.1)
Where:
COP= controller output signal, COPbias =set by bumpless transfer function (controller bias)
SP = setpoint, PV= process variable, kc = a tuning parameter, controller gain value, Ti = a tuning
parameter, reset time, Td= a tuning parameter, derivative time.
(4.2)
Where:
COP= controller output signal, COPbias =set by bumpless transfer function (controller bias or null
value), e(t) = controller operational error (SP-PV) SP = setpoint, PV= process variable, kc = a tuning
parameter, controller gain value, Ti = a tuning parameter, reset time, Td= a tuning parameter,
derivative time.
Figure 4-1 Function block of centralized control loop [Matlab]
Figure 4-2 individual function block of de-centralized control loop [Matlab]
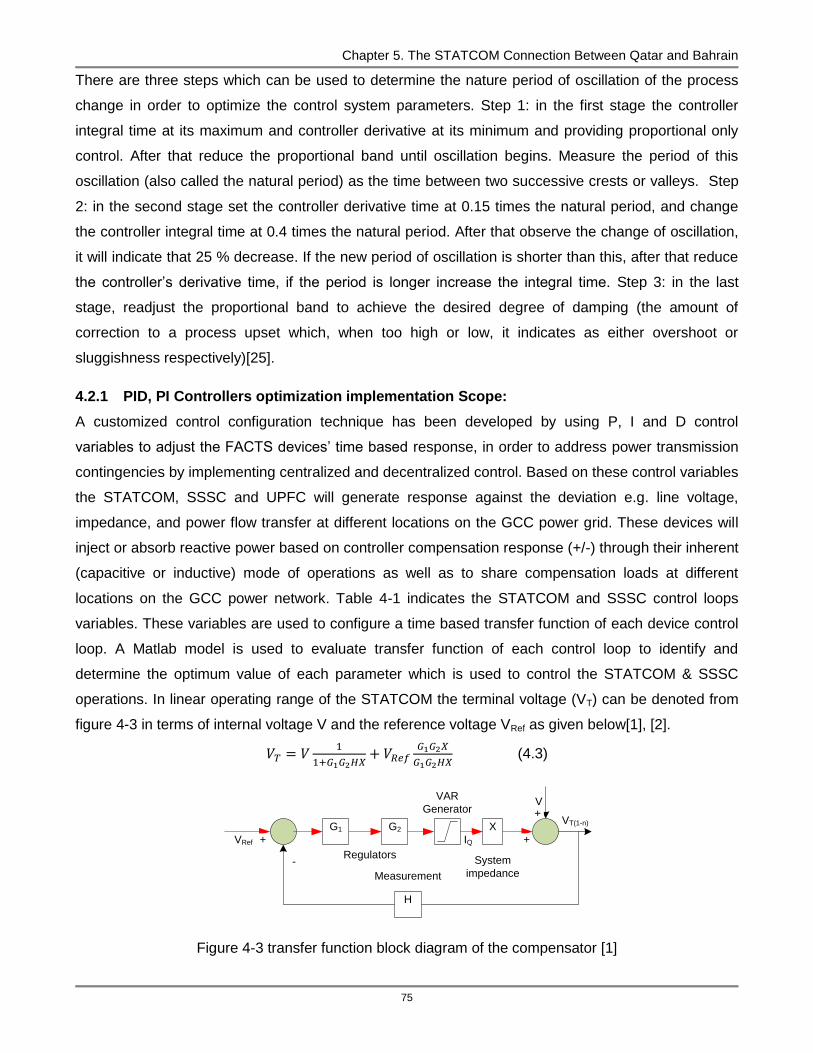
Chapter 5. The STATCOM Connection Between Qatar and Bahrain
75
There are three steps which can be used to determine the nature period of oscillation of the process
change in order to optimize the control system parameters. Step 1: in the first stage the controller
integral time at its maximum and controller derivative at its minimum and providing proportional only
control. After that reduce the proportional band until oscillation begins. Measure the period of this
oscillation (also called the natural period) as the time between two successive crests or valleys. Step
2: in the second stage set the controller derivative time at 0.15 times the natural period, and change
the controller integral time at 0.4 times the natural period. After that observe the change of oscillation,
it will indicate that 25 % decrease. If the new period of oscillation is shorter than this, after that reduce
the controller’s derivative time, if the period is longer increase the integral time. Step 3: in the last
stage, readjust the proportional band to achieve the desired degree of damping (the amount of
correction to a process upset which, when too high or low, it indicates as either overshoot or
sluggishness respectively)[25].
4.2.1 PID, PI Controllers optimization implementation Scope:
A customized control configuration technique has been developed by using P, I and D control
variables to adjust the FACTS devices’ time based response, in order to address power transmission
contingencies by implementing centralized and decentralized control. Based on these control variables
the STATCOM, SSSC and UPFC will generate response against the deviation e.g. line voltage,
impedance, and power flow transfer at different locations on the GCC power grid. These devices will
inject or absorb reactive power based on controller compensation response (+/-) through their inherent
(capacitive or inductive) mode of operations as well as to share compensation loads at different
locations on the GCC power network. Table 4-1 indicates the STATCOM and SSSC control loops
variables. These variables are used to configure a time based transfer function of each device control
loop. A Matlab model is used to evaluate transfer function of each control loop to identify and
determine the optimum value of each parameter which is used to control the STATCOM & SSSC
operations. In linear operating range of the STATCOM the terminal voltage (VT) can be denoted from
figure 4-3 in terms of internal voltage V and the reference voltage VRef as given below[1], [2].
(4.3)
G2
VRef + IQ
X
+
G1
H
Measurement
System
impedance
+VVAR
Generator
-
VT(1-n)
Regulators
Figure 4-3 transfer function block diagram of the compensator [1]
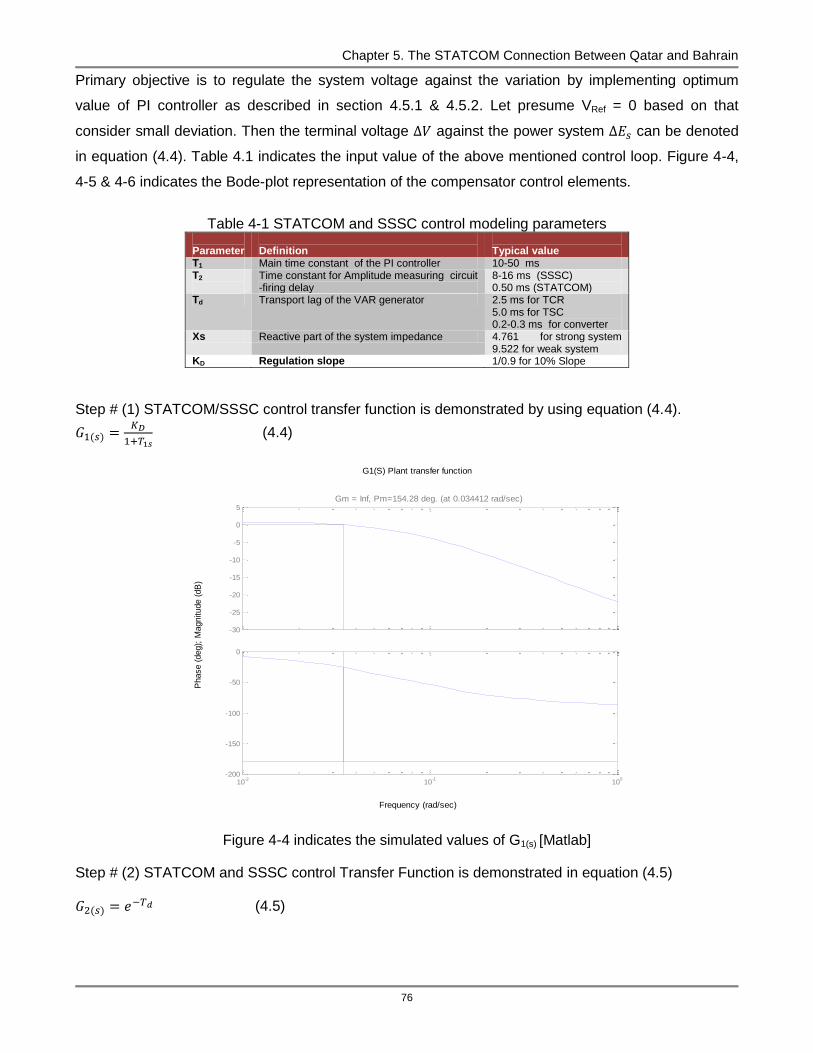
Chapter 5. The STATCOM Connection Between Qatar and Bahrain
76
Primary objective is to regulate the system voltage against the variation by implementing optimum
value of PI controller as described in section 4.5.1 & 4.5.2. Let presume VRef = 0 based on that
consider small deviation. Then the terminal voltage against the power system can be denoted
in equation (4.4). Table 4.1 indicates the input value of the above mentioned control loop. Figure 4-4,
4-5 & 4-6 indicates the Bode-plot representation of the compensator control elements.
Table 4-1 STATCOM and SSSC control modeling parameters
Parameter
Definition
Typical value
T1 Main time constant of the PI controller 10-50 ms T2
Time constant for Amplitude measuring circuit -firing delay
8-16 ms (SSSC) 0.50 ms (STATCOM)
Td Transport lag of the VAR generator 2.5 ms for TCR 5.0 ms for TSC 0.2-0.3 ms for converter
Xs Reactive part of the system impedance 4.761 for strong system 9.522 for weak system
KD Regulation slope 1/0.9 for 10% Slope
Step # (1) STATCOM/SSSC control transfer function is demonstrated by using equation (4.4).
(4.4)
Figure 4-4 indicates the simulated values of G1(s) [Matlab]
Step # (2) STATCOM and SSSC control Transfer Function is demonstrated in equation (4.5)
(4.5)
Frequency (rad/sec)
Phase (
deg);
Magnitude (
dB
)
G1(S) Plant transfer function
-30
-25
-20
-15
-10
-5
0
5
Gm = Inf, Pm=154.28 deg. (at 0.034412 rad/sec)
10-2
10-1
100
-200
-150
-100
-50
0

Chapter 5. The STATCOM Connection Between Qatar and Bahrain
77
Figure 4-5 indicates the simulated values of G2(s) [Matlab]
Step # (3) STATCOM/SSSC Control function is demonstrated in equation (4.6).
(4.6)
Figure 4-6 indicates the simulated value of H(s) [Matlab]
Frequency (rad/sec)
Phase (
deg);
Magnitude (
dB
)
G2(S) Transfer Function
0
5
10
15
20
From: U(1)
10-1
100
101
0
20
40
60
80
100
To: Y
(1)
Frequency (rad/sec)
Phase (
deg);
Magnitude (
dB
)
H(s) Transfer Function feedback control Block
-14
-12
-10
-8
-6
-4
-2
0
Gm = Inf, Pm=180 deg. (at 0 rad/sec)
101
102
103
-80
-60
-40
-20
0

Chapter 5. The STATCOM Connection Between Qatar and Bahrain
78
This is a final control function of STATCOM & SSSC control block for implementation which is
demonstrated in equation (4.7)
(4.7)
4.3. PID, PD, PI Controller Tuning Framework:
A. Determine the Control Loop Characteristics
By using knowledge of open and closed control loop tuning and optimization characteristics, controller
mode principles and adjustment methods, operation of the control system can be observed and
examined to obtain high a level of operational accuracy. Based on these observations the tuning of
control parameters enables the controller to compensate for load changes or disturbances to eliminate
error (deviation). A controller must be tuned to match the process dynamics by implementing the
following parameters’ control values at an optimum level to achieve the required objective [17].
a) Understand the integral control action ( I )
b) Understand how the error can be eliminated in a PI-controller
c) Define integral gain and integral time.
a) Understand the derivative control action ( D )
b) Understand how the error can be eliminated in a PD-controller
c) Define derivative gain and derivative time.
Purpose:
1. To increase sensitivity of the control. 2. To provide better control of a process by reducing the time lag in a control system.
Merits of these parameters are:
A. Better control of the primary variable.
B. Primary variable will be less affected by disturbance.
C. Faster recovery from disturbance.
D. Reduce the effective magnitude of time lag.
B. Integral control (I)
Integral action avoids the offset created in proportional control only by bringing the output back to the
set point. It is an automatic rebalancing of the electrical power system operations, which operates as
long as an error exists. Therefore, integral control responds to the duration of the error as well as its
magnitude and direction. This is never used alone; rather, it is combined with proportional control. The
main purpose of integral control is to eliminate the offset or the steady-state error. This is also referred
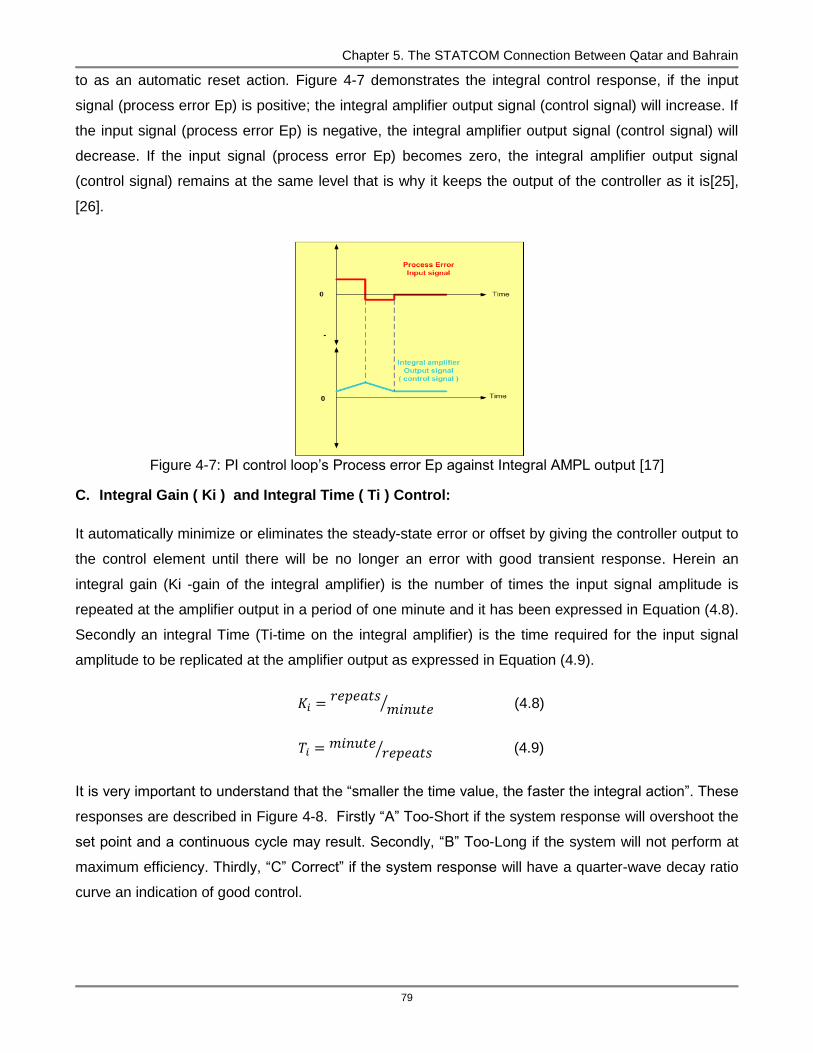
Chapter 5. The STATCOM Connection Between Qatar and Bahrain
79
to as an automatic reset action. Figure 4-7 demonstrates the integral control response, if the input
signal (process error Ep) is positive; the integral amplifier output signal (control signal) will increase. If
the input signal (process error Ep) is negative, the integral amplifier output signal (control signal) will
decrease. If the input signal (process error Ep) becomes zero, the integral amplifier output signal
(control signal) remains at the same level that is why it keeps the output of the controller as it is[25],
[26].
Figure 4-7: PI control loop’s Process error Ep against Integral AMPL output [17]
C. Integral Gain ( Ki ) and Integral Time ( Ti ) Control:
It automatically minimize or eliminates the steady-state error or offset by giving the controller output to
the control element until there will be no longer an error with good transient response. Herein an
integral gain (Ki -gain of the integral amplifier) is the number of times the input signal amplitude is
repeated at the amplifier output in a period of one minute and it has been expressed in Equation (4.8).
Secondly an integral Time (Ti-time on the integral amplifier) is the time required for the input signal
amplitude to be replicated at the amplifier output as expressed in Equation (4.9).
(4.8)
(4.9)
It is very important to understand that the “smaller the time value, the faster the integral action”. These
responses are described in Figure 4-8. Firstly “A” Too-Short if the system response will overshoot the
set point and a continuous cycle may result. Secondly, “B” Too-Long if the system will not perform at
maximum efficiency. Thirdly, “C” Correct” if the system response will have a quarter-wave decay ratio
curve an indication of good control.
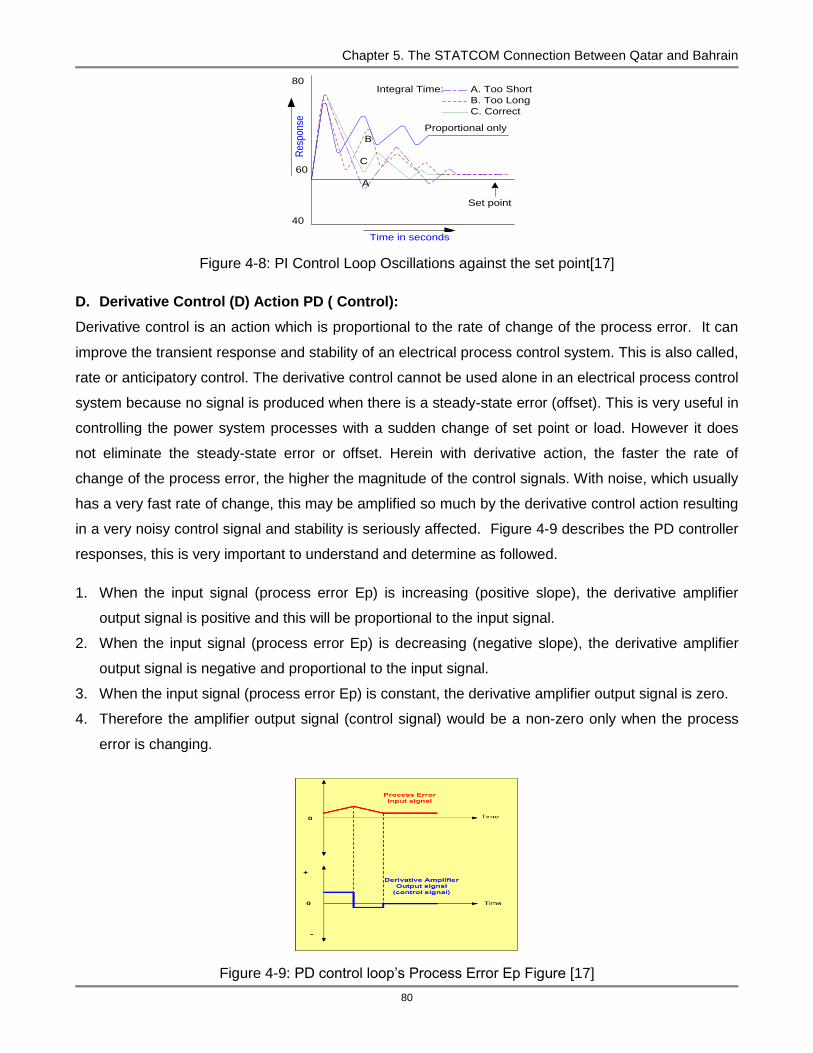
Chapter 5. The STATCOM Connection Between Qatar and Bahrain
80
Time in seconds
Res
pons
e
80
60
40
A. Too Short
B. Too Long
C. Correct
Integral Time:
A
B
C
Set point
Proportional only
Figure 4-8: PI Control Loop Oscillations against the set point[17]
D. Derivative Control (D) Action PD ( Control):
Derivative control is an action which is proportional to the rate of change of the process error. It can
improve the transient response and stability of an electrical process control system. This is also called,
rate or anticipatory control. The derivative control cannot be used alone in an electrical process control
system because no signal is produced when there is a steady-state error (offset). This is very useful in
controlling the power system processes with a sudden change of set point or load. However it does
not eliminate the steady-state error or offset. Herein with derivative action, the faster the rate of
change of the process error, the higher the magnitude of the control signals. With noise, which usually
has a very fast rate of change, this may be amplified so much by the derivative control action resulting
in a very noisy control signal and stability is seriously affected. Figure 4-9 describes the PD controller
responses, this is very important to understand and determine as followed.
1. When the input signal (process error Ep) is increasing (positive slope), the derivative amplifier
output signal is positive and this will be proportional to the input signal.
2. When the input signal (process error Ep) is decreasing (negative slope), the derivative amplifier
output signal is negative and proportional to the input signal.
3. When the input signal (process error Ep) is constant, the derivative amplifier output signal is zero.
4. Therefore the amplifier output signal (control signal) would be a non-zero only when the process
error is changing.
Figure 4-9: PD control loop’s Process Error Ep Figure [17]

Chapter 5. The STATCOM Connection Between Qatar and Bahrain
81
E. Proportional plus Integral plus Derivative (P I D) Controller:
Sections 4.5 has illustrated the tuning methodology and section 4.6 explained the PI controller
behavior and configuration perspective in multidimensional to meet FACTS controller’s operational
requirements as described. This section is focused on PID controller behavior and various response in
order to maintain operational requirements more accurately, what explained in PI and PD controllers’.
It has been also learned that output of PID controller is a linear combination of P, (proportional) I
(integral) and D (derivative) modes of control system. Herein the PID controller encompassed
multifaceted operational features to all aspects of electrical power system operations. However, the
PID controller responses are identified and determined in order to obtain process control objectives
more precisely comparable to PI and PD controllers (Direction, Magnitude, Duration, and change). It
has been learned that the PID controller is offering two types of strategic control operations. Figure 4-
10 explained the Interacting PID control topology, it demonstrates when both D and I control actions
are performing in series. This is called a series configuration at the first part of the PID control
topology.
Figure 4-10: Interacting PID Controller [17]
Figure 4-11 Control Loop Oscillations; this is an indication of good control which is being
demonstrated by using (PI) proportional-integral control and (PID) proportional-Integral-derivative
control.
Time
Re
sp
on
se
Proportional-Integral (PI) Control
Proportional-Integral (PI) Control
Figure 4-11: PI and PID control loops behavior [17]
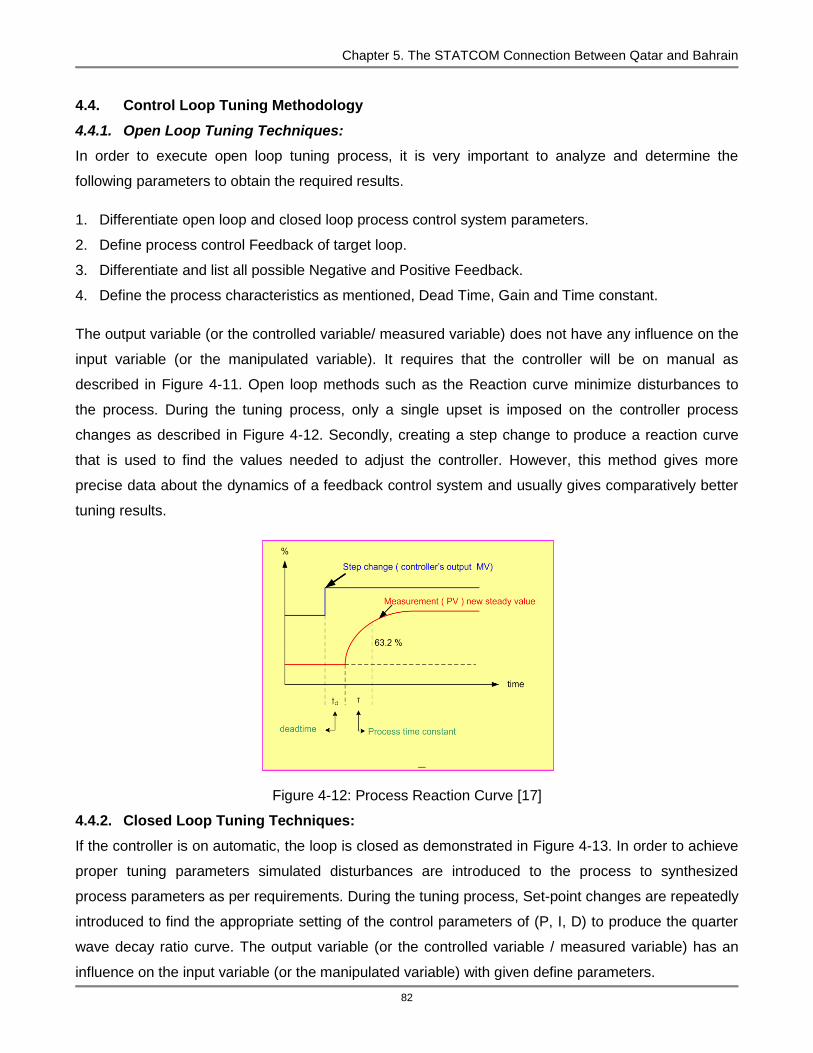
Chapter 5. The STATCOM Connection Between Qatar and Bahrain
82
4.4. Control Loop Tuning Methodology
4.4.1. Open Loop Tuning Techniques:
In order to execute open loop tuning process, it is very important to analyze and determine the
following parameters to obtain the required results.
1. Differentiate open loop and closed loop process control system parameters.
2. Define process control Feedback of target loop.
3. Differentiate and list all possible Negative and Positive Feedback.
4. Define the process characteristics as mentioned, Dead Time, Gain and Time constant.
The output variable (or the controlled variable/ measured variable) does not have any influence on the
input variable (or the manipulated variable). It requires that the controller will be on manual as
described in Figure 4-11. Open loop methods such as the Reaction curve minimize disturbances to
the process. During the tuning process, only a single upset is imposed on the controller process
changes as described in Figure 4-12. Secondly, creating a step change to produce a reaction curve
that is used to find the values needed to adjust the controller. However, this method gives more
precise data about the dynamics of a feedback control system and usually gives comparatively better
tuning results.
Figure 4-12: Process Reaction Curve [17]
4.4.2. Closed Loop Tuning Techniques:
If the controller is on automatic, the loop is closed as demonstrated in Figure 4-13. In order to achieve
proper tuning parameters simulated disturbances are introduced to the process to synthesized
process parameters as per requirements. During the tuning process, Set-point changes are repeatedly
introduced to find the appropriate setting of the control parameters of (P, I, D) to produce the quarter
wave decay ratio curve. The output variable (or the controlled variable / measured variable) has an
influence on the input variable (or the manipulated variable) with given define parameters.

Chapter 5. The STATCOM Connection Between Qatar and Bahrain
83
Figure 4-13: Close Loop Tuning Diagram [17]
4.4.3. Ultimate Method Tuning Technique
This is a closed loop tuning method with the controller in an automatic control mode, there is a
continuous sustained oscillation result. In this procedure firstly, there is the identification of Ultimate
proportional gain ( Ku), which is the initial setting of proportional gain to produce the continuous
sustained oscillation. Secondly there is the identification of an Ultimate period ( Pu) which is the period
resulted on the continuous sustained oscillation, basically the time between successive peaks as
demonstrated in Figure 4-14.
Firstly, there is the recording of all the controller settings so if there are any unexpected constraint
produced these can be returned as they are. Secondly, there is the adjustment of the integral and
derivative control values to their minimum setting and the putting of the controller in an automatic
control mode of operations and an adjustment of the proportional gain to a point where a set-point
change will cause a small oscillating response. Observe the process response as soon as an upset is
observed return to set-point. In the first attempt, if the response curve damps out, as in Figure 4-15,
the gain is too low (proportional band is too wide).
Increasing the gain (or narrow the proportional band), imposes a set-point change and observe the
response. In the second attempt, if the response curve over-oscillates as in the Figure 4-16, the gain
is too high (proportional band is too low). One should adjust the gain to a lower setting (or the
proportional band to a wider value). One should continue to make adjustment to the proportional band
until the process response curve produces a continuous sustained oscillating response for three or
four cycles. The proportional setting that produces this process response is the ultimate gain or
ultimate proportional band. One should determine the ultimate period. This value is determined by
timing in minutes, the interval between the peaks or by calculating the intervals from the divisions on
the graph of a continually oscillating process response [89], [90].
Controlled
Variable
Manipulated
Variable
Reference
VariableSP or
Measured
variable
Or Process
value
Input
variable
Output
variable
Process
Mesurement
Controller
Final Control
Element

Chapter 5. The STATCOM Connection Between Qatar and Bahrain
84
Time in seconds
Re
spo
nse
80
60
40
Ultimate
Period
Figure 4-14: Ultimate Loop Tuning Method [17]
Time in seconds
Re
sp
on
se
80
60
40
Figure 4-15: curve with no oscillation may not achieve set point [17]
Time in seconds
Re
sp
on
se
80
60
40
Figure 4-16: curve with high oscillation _ is unstable [17]
4.4.4. Trial and Error Tuning Method
As electrical power control system engineer, one should tune the FACTS control devices control loops
by using trial and error method in order to achieve set-point changes. Herein, it has been observed
that once a loop is tuned properly to good set point response, the responses to upsets are usually very
sluggish. It also witnessed that a good set point tuning does not automatically result in good recovery
from upsets. Wherein, these upset usually the source of off-spec product and its inconsistency. There
is a well-known controller tuning criterion which demonstrates a decay ratio of ¼ following a set point
change as a power system operations requirement. This is also known as quarterly-wave decay.
Principally, if a control loop is oscillating due to set point change each forthcoming peak variation

Chapter 5. The STATCOM Connection Between Qatar and Bahrain
85
should be one-fourth of the previous peak. This oscillation could be negative or positive on the same
side of the set point. On each half cycle of the controller oscillation, the amplitude of difference of the
oscillation should be decreased by roughly one-half, which indicates the total decrease one-fourth for
a full cycle as indicated in Figure 4-17. Figure 4-18 described the nine shades of decay ratio matrix,
which demonstrates (PI) control parameters suppose to be changed in order to meet set-point
changes at different location on the GCC power grid. This is strongly recommended to use modern
tools to analyze a loop to identify and determine operational barriers, which are limiting strategic and
precise operations. Herewith, there are three steps can be used to determine the nature period of
oscillation of the process change. Each box of the matrix shows typical response curve. Response
curve’s decay ratio and period are compared with a curve in the matrix based on the deviation fine
tuning adjustments are recommended.
The horizontal rows indicates period
The top row indicates the curves with a period of less than
times the integral.
The bottom row indicates the curves with a period of more than
times the integral.
Vertical rows in the matrix represent the decay ratio, from less than a quarter-wave in the left side,
to more than quarter-wave in the right column.
Time
Re
sp
on
se
Decay Ratio = B/ASet-point
Figure 4-17: Response to a set point change typical behavior
Decrease
Integral Time
Increase gainReduce
Integral Time
Reduce
Integral Time
Reduce Gain
Increase gainTuning is OK Reduce Gain
Increase
Integral Time
Increase gainIncrease
Integral Time
Increase
Integral Time
<¼ or No Overshoot ¼ > ¼ Excessive oscilation
Period
<1.5 Ti
>1.5 Ti
<2.5 Ti
>2.5 Ti
Setpoint
1 4
P<1.5Ti
Figure 4-18: Decay Ratio Matrix [17]
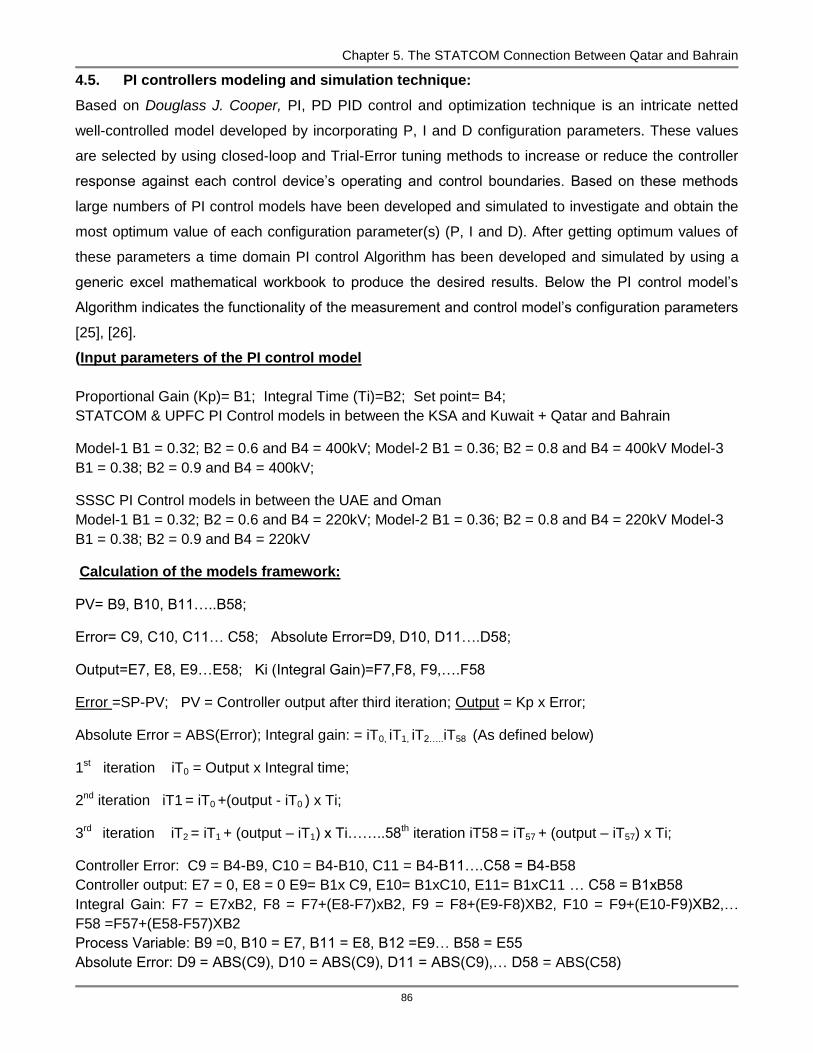
Chapter 5. The STATCOM Connection Between Qatar and Bahrain
86
4.5. PI controllers modeling and simulation technique:
Based on Douglass J. Cooper, PI, PD PID control and optimization technique is an intricate netted
well-controlled model developed by incorporating P, I and D configuration parameters. These values
are selected by using closed-loop and Trial-Error tuning methods to increase or reduce the controller
response against each control device’s operating and control boundaries. Based on these methods
large numbers of PI control models have been developed and simulated to investigate and obtain the
most optimum value of each configuration parameter(s) (P, I and D). After getting optimum values of
these parameters a time domain PI control Algorithm has been developed and simulated by using a
generic excel mathematical workbook to produce the desired results. Below the PI control model’s
Algorithm indicates the functionality of the measurement and control model’s configuration parameters
[25], [26].
(Input parameters of the PI control model
Proportional Gain (Kp)= B1; Integral Time (Ti)=B2; Set point= B4;
STATCOM & UPFC PI Control models in between the KSA and Kuwait + Qatar and Bahrain
Model-1 B1 = 0.32; B2 = 0.6 and B4 = 400kV; Model-2 B1 = 0.36; B2 = 0.8 and B4 = 400kV Model-3
B1 = 0.38; B2 = 0.9 and B4 = 400kV;
SSSC PI Control models in between the UAE and Oman
Model-1 B1 = 0.32; B2 = 0.6 and B4 = 220kV; Model-2 B1 = 0.36; B2 = 0.8 and B4 = 220kV Model-3
B1 = 0.38; B2 = 0.9 and B4 = 220kV
Calculation of the models framework:
PV= B9, B10, B11…..B58;
Error= C9, C10, C11… C58; Absolute Error=D9, D10, D11….D58;
Output=E7, E8, E9…E58; Ki (Integral Gain)=F7,F8, F9,….F58
Error =SP-PV; PV = Controller output after third iteration; Output = Kp x Error;
Absolute Error = ABS(Error); Integral gain: = iT0, iT1, iT2…..iT58 (As defined below)
1st iteration iT0 = Output x Integral time;
2nd iteration iT1 = iT0 +(output - iT0 ) x Ti;
3rd iteration iT2 = iT1 + (output – iT1) x Ti……..58th iteration iT58 = iT57 + (output – iT57) x Ti;
Controller Error: C9 = B4-B9, C10 = B4-B10, C11 = B4-B11….C58 = B4-B58
Controller output: E7 = 0, E8 = 0 E9= B1x C9, E10= B1xC10, E11= B1xC11 … C58 = B1xB58
Integral Gain: F7 = E7xB2, F8 = F7+(E8-F7)xB2, F9 = F8+(E9-F8)XB2, F10 = F9+(E10-F9)XB2,…
F58 =F57+(E58-F57)XB2
Process Variable: B9 =0, B10 = E7, B11 = E8, B12 =E9… B58 = E55
Absolute Error: D9 = ABS(C9), D10 = ABS(C9), D11 = ABS(C9),… D58 = ABS(C58)

Chapter 5. The STATCOM Connection Between Qatar and Bahrain
87
Appendix 4.A, 4.B, 4.C, 4.D, 4.E and 4.F illustrates the 58 rows and six columns (A, B, C, D, E & F) of
excel mathematical workbook sheet. B1, B2, & B3 rows indicate the inputs of the PI control
mathematical model-1. A6, B6, C6, D6, E6, & F6 columns indicate the six main calculations
parameters of the PI control mathematical simulation model. These six parameters are calculated
carefully based on the formulas as given in the above Algorithm. The workbook sheet is configured in
an automatic mode by plugging in P, I, and Set point inputs. Based on control deviation the workbook
sheet will automatically simulate and produce the results. These values are identified and determined
by using Closed-Loop and Trial & Error tuning methods of the PI control model [20].
4.5.1. STATCOM & UPFC distributed PI control:
A PI controller’s detailed calculations are performed and mathematical model developed and
synthesized by incorporating new set of PI configuration values as demonstrated in Appendix 5.A &
7.A in order to control the 400kV line voltage of the AC power system in between the Qatar and
Bahrain as well as KSA and Kuwait on the GCC power network. In the first model (Appendix 9.A) both
STATCOM and UPFC PI controllers are configured by incorporating first set of P & I values(P=0.32; I=
0.6 and SP=400kV) to inject and absorb minimum reactive power based on +/- 2% deviations. Based
on this deviation the PI control model oscillated and took 21 iterations to stabilize the control loop by
adjusting the minimum reactive power compensation as demonstrated in Appendices 5.A & 7.A.
In the second model (Appendix 9.B) both STATCOM and UPFC PI controllers are configured by
incorporating 2nd set of P & I values (P=0.36; I= 0.8 SP=400kV) to inject and absorb medium reactive
power +/- based on +/- 4% deviations. Based on this deviation the PI control model oscillated and took
19 iterations to stabilize the control loop by adjusting the medium reactive power compensation as
demonstrated in Appendices 5.A and 7.A.
In the third model (Appendix 9.C) both STATCOM and UPFC PI controllers are configured by
incorporating 3rd set of P & I values (P=0.38; I= 0.9 SP=400kV) to inject and absorb medium reactive
power based on +/- 6% deviations. Based on this deviation the PI control model oscillated and took 24
iterations to stabilize the control loop by adjusting the medium reactive power compensation as
demonstrated in Appendices 5.A and 7.A.
PI controller of Shunt converter: The shunt converter is implemented to inject or absorb reactive
power from the transmission line in between Bahrain and Qatar. There are two current
components; one is real current to balance the real power of the series converter and other is
reactive current to maintain the desired level of (capacitive and inductive) based on converter
design capacity.
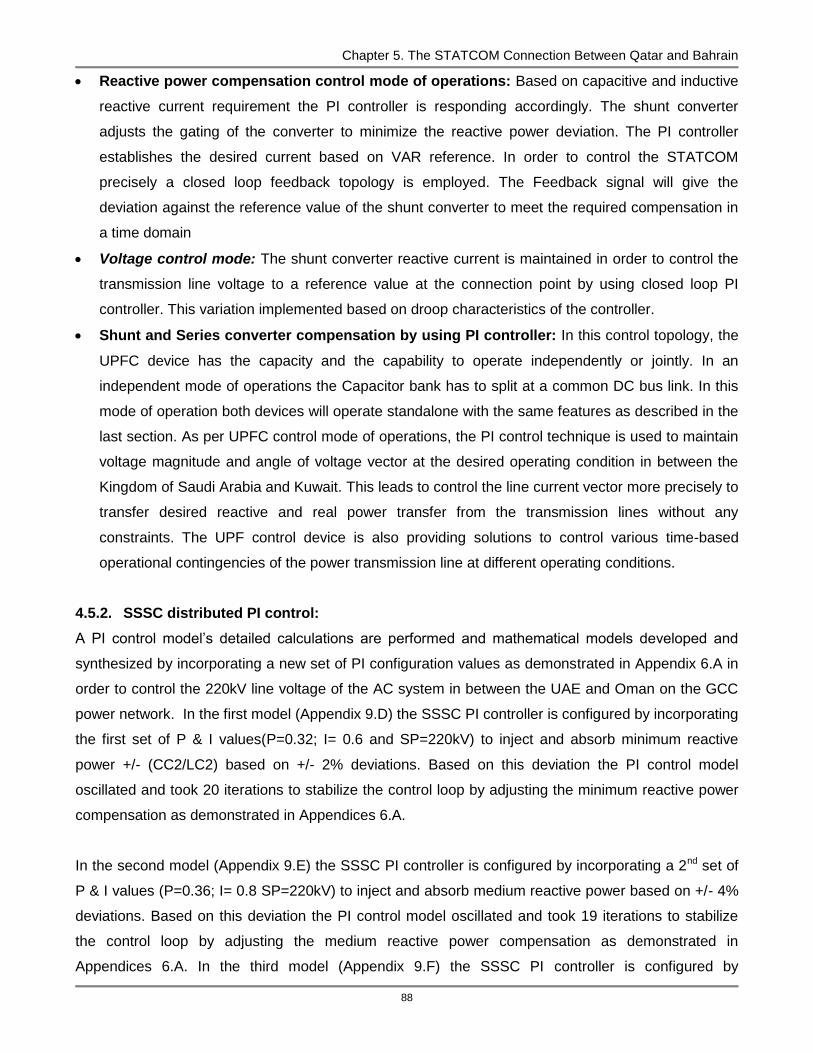
Chapter 5. The STATCOM Connection Between Qatar and Bahrain
88
Reactive power compensation control mode of operations: Based on capacitive and inductive
reactive current requirement the PI controller is responding accordingly. The shunt converter
adjusts the gating of the converter to minimize the reactive power deviation. The PI controller
establishes the desired current based on VAR reference. In order to control the STATCOM
precisely a closed loop feedback topology is employed. The Feedback signal will give the
deviation against the reference value of the shunt converter to meet the required compensation in
a time domain
Voltage control mode: The shunt converter reactive current is maintained in order to control the
transmission line voltage to a reference value at the connection point by using closed loop PI
controller. This variation implemented based on droop characteristics of the controller.
Shunt and Series converter compensation by using PI controller: In this control topology, the
UPFC device has the capacity and the capability to operate independently or jointly. In an
independent mode of operations the Capacitor bank has to split at a common DC bus link. In this
mode of operation both devices will operate standalone with the same features as described in the
last section. As per UPFC control mode of operations, the PI control technique is used to maintain
voltage magnitude and angle of voltage vector at the desired operating condition in between the
Kingdom of Saudi Arabia and Kuwait. This leads to control the line current vector more precisely to
transfer desired reactive and real power transfer from the transmission lines without any
constraints. The UPF control device is also providing solutions to control various time-based
operational contingencies of the power transmission line at different operating conditions.
4.5.2. SSSC distributed PI control:
A PI control model’s detailed calculations are performed and mathematical models developed and
synthesized by incorporating a new set of PI configuration values as demonstrated in Appendix 6.A in
order to control the 220kV line voltage of the AC system in between the UAE and Oman on the GCC
power network. In the first model (Appendix 9.D) the SSSC PI controller is configured by incorporating
the first set of P & I values(P=0.32; I= 0.6 and SP=220kV) to inject and absorb minimum reactive
power +/- (CC2/LC2) based on +/- 2% deviations. Based on this deviation the PI control model
oscillated and took 20 iterations to stabilize the control loop by adjusting the minimum reactive power
compensation as demonstrated in Appendices 6.A.
In the second model (Appendix 9.E) the SSSC PI controller is configured by incorporating a 2nd set of
P & I values (P=0.36; I= 0.8 SP=220kV) to inject and absorb medium reactive power based on +/- 4%
deviations. Based on this deviation the PI control model oscillated and took 19 iterations to stabilize
the control loop by adjusting the medium reactive power compensation as demonstrated in
Appendices 6.A. In the third model (Appendix 9.F) the SSSC PI controller is configured by

Chapter 5. The STATCOM Connection Between Qatar and Bahrain
89
incorporating a 3rd set of P & I values (P=0.38; I= 0.9 SP=220kV) to inject and absorb medium reactive
power based on +/- 6% deviations. Based on this deviation the PI control model oscillated and took 24
iterations to stabilize the control loop by adjusting the medium reactive power compensation as
demonstrated in Appendices 6.A.
On-time domain simulation results are very much encouraging and validating the PI controller
robustness. Based on these results and effective integration, a multiple portal of the controller has
been developed and synthesized which is leading to run all three devices in parallel or independently
to overcome any type of power transmission line contingences at different locations on the GCC
power network as demonstrated in Appendix 9.D. These models are developed based on worst case
scenarios to investigate most optimum PI control parameters to manipulate and adjust reactive power
compensation as per defined three control limits, but in the real world these models will demonstrate
different operating and control boundaries based on voltage and power deviation on the sending and
receiving ends of the AC power system. In the first case if the deviation is larger than the controller,
needs big step size to inject or absorb reactive power to minimize the deviation and stabilize the
control loop. In the second case, if the deviation is smaller than the controller it will take a small step
size to inject and absorb reactive power to minimize the deviation at the AC power system. By
dividing and distributing the PI controller operating and control ranges into three small limits this will
provide tangible and ultimate control on reactive power compensation with small step size without any
constraints. This will also lead to make the controller response considerably faster.
PI Controller of Series Converter:
Principally the series converter injects the voltage in series with in-line to maintain voltage magnitude
and angle of the voltage vector in between Oman and the United Arab Emirates. In fact voltage
injections in the line directly or indirectly control the power flow through the transmission line. Closed
loop control topology is implemented to maintain required voltage injection and angle of the voltage
vector more tangible to achieve the desired results. However, the results indicate that this approach
has a great potential to enhance controller dynamic performance at a minimum cost and time, and it
may stabilize the control loop within 10-15 iteration (iterations?). This is an instrumental concept to
address a wide range of power system stability issues and control integration without any additional
control support on the GCC power network.
4.6. Observations: In this study a PI controller is implemented to control and optimize FACTS control devices at different
locations on the GCC power grid. Figure 4-19 shows the responses of three models at different P and
I values. The first waveform (blue trace) indicates that the control loop stabilizes after 21 iterations and
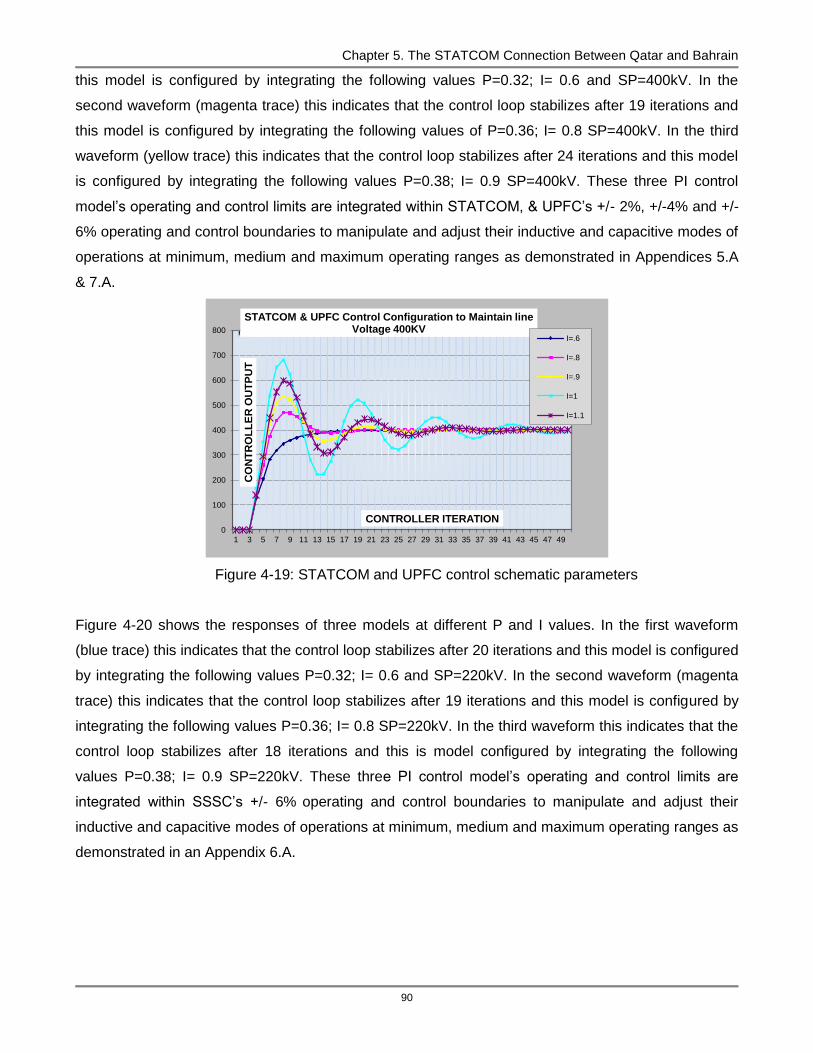
Chapter 5. The STATCOM Connection Between Qatar and Bahrain
90
this model is configured by integrating the following values P=0.32; I= 0.6 and SP=400kV. In the
second waveform (magenta trace) this indicates that the control loop stabilizes after 19 iterations and
this model is configured by integrating the following values of P=0.36; I= 0.8 SP=400kV. In the third
waveform (yellow trace) this indicates that the control loop stabilizes after 24 iterations and this model
is configured by integrating the following values P=0.38; I= 0.9 SP=400kV. These three PI control
model’s operating and control limits are integrated within STATCOM, & UPFC’s +/- 2%, +/-4% and +/-
6% operating and control boundaries to manipulate and adjust their inductive and capacitive modes of
operations at minimum, medium and maximum operating ranges as demonstrated in Appendices 5.A
& 7.A.
Figure 4-19: STATCOM and UPFC control schematic parameters
Figure 4-20 shows the responses of three models at different P and I values. In the first waveform
(blue trace) this indicates that the control loop stabilizes after 20 iterations and this model is configured
by integrating the following values P=0.32; I= 0.6 and SP=220kV. In the second waveform (magenta
trace) this indicates that the control loop stabilizes after 19 iterations and this model is configured by
integrating the following values P=0.36; I= 0.8 SP=220kV. In the third waveform this indicates that the
control loop stabilizes after 18 iterations and this is model configured by integrating the following
values P=0.38; I= 0.9 SP=220kV. These three PI control model’s operating and control limits are
integrated within SSSC’s +/- 6% operating and control boundaries to manipulate and adjust their
inductive and capacitive modes of operations at minimum, medium and maximum operating ranges as
demonstrated in an Appendix 6.A.
0
100
200
300
400
500
600
700
800
1 3 5 7 9 11 13 15 17 19 21 23 25 27 29 31 33 35 37 39 41 43 45 47 49
CO
NT
RO
LL
ER
OU
TP
UT
CONTROLLER ITERATION
STATCOM & UPFC Control Configuration to Maintain line Voltage 400KV
I=.6
I=.8
I=.9
I=1
I=1.1

Chapter 5. The STATCOM Connection Between Qatar and Bahrain
91
Figure 4-20: SSSC control schematic parameters
4.7. Results and Discussion:
After the implementing of these control models control values in Chapter 10 very promising results are
obtained. Firstly, the FACTS devices operations and control parameters are synthesized individually to
determine each device response independently based on control deviation. This is called the de-
centralized control system topology. In the second phase, all FACTS devices are integrated to share
the operational load and control systems automatically as per capacity and defined control limitations.
This is also known as centralized control system topology. Based on our findings, it has observed that
PI control technique played a vital and vigorous role to manipulate FACTS devices control and
operations independently and jointly in order to meet growing operational requirements on the GCC
power grid.
4.8. Summary:
The principal drive of this research work is to formulate a pragmatic approach in order to fine-tune and
optimize FACTS devices time-based operations and control at different locations on the GCC power
grid. In fact, constant and variable controls parameters are adjusted to manipulate FACTS devices
operations in multi-dimensions to serve the purpose more convincingly. The control loops simulation
and mathematical derived results indicate that a lot of improvements have been witnessed of the
FACTS devices operations and control. In this chapter PID and PI controllers’ response(s) are
discussed. To enhance these controller responses various tuning methodologies viabilities are
explained. By using Douglas J. Cooper’s PID controller optimization technique optimum tuning
parameters are selected and mathematically simulated. These simulation results are illustrated in
appendices 4.A, 4.B, 4.C, 4.D, 4.E and 4.F. These results indicate effectiveness of tuning parameters
to adjust the FACTS devices time-domain response based on operating parameters deviation (line
voltage impedance and phase angle). Based on these tuning parameters, three control limits are
0
50
100
150
200
250
300
350
400
1 3 5 7 9 11 13 15 17 19 21 23 25 27 29 31 33 35 37 39 41 43 45 47 49
CO
NT
RO
LL
ER
OU
TP
UT
CONTROLLER ITERATION
Line Voltage in Between Kuwait and Kingdom Saudi Arabia 220KV
I=.6
I=.8
I=.9
I=1
I=1.1

Chapter 5. The STATCOM Connection Between Qatar and Bahrain
92
designed for each FACTS device to inject or absorb reactive power compensation as per electrical
power system operational requirements on the GCC power grid. These control limits with
corresponding PI values are demonstrated in appendices 5.A, 6.A, and 7.A.

Chapter 5. The STATCOM Connection Between Qatar and Bahrain
93
5.1. Introduction:-
This research work presents a nontraditional control and operation of a STATCOM connecting Qatar
and Bahrain in the Gulf Cooperative Council Interconnection. A new optimization technique has been
adopted to optimize the various process control parameters that contribute notably to control
STATCOM device operations in a power system network during any undesired condition. This work
will also demonstrate precisely STATCOM control parameters, improving the STATCOM performance
at different transmission contingencies. The simulation is performed by taking into account STATCOM
operating and control parameters; hereby the STATCOM controller is configured in a strategic way to
optimize the control model by adjusting control and operating parameters precisely under both a
steady and a dynamic state. The optimization process results are clearly indicating that the
introduction of the STATCOM device in the right location of the system increases the loadability,
reduces the losses and enhances the sustainability of the power system performance through
optimization process. The new STATCOM control optimization technique can thus be effectively used
for this type of optimization process. The GCC region has become a hub of major economic growth in
the world. It is providing financial support and incentives to the GCC countries. Hereby, it has
witnessed population growth and large scale industrial activities in the GCC countries. This has led to
increased demand for electricity. Based on various analyses, we determined that the current demand
for the GCC power consumption is about 60 GW and it is projected that it will reach 180 GW within
next 25 years. In order to maintain a reliable, sustainable, and well-controlled power transfer between
the GCC countries, it has been decided to interconnect the GCC countries. The interconnection is
divided into two basic segmental links, neighboring to neighboring and common-link topologies. Firstly,
Oman and The United Arab Emirates are interconnected through neighbor-to-neighbor control
topologies. Secondly, Qatar, Bahrain, Saudi Arabia and Kuwait are interconnected through common-
link control topology and this is also known as the Northern System. In the third stage common-link
topology demonstrates UAE national grid and Oman northern grid interconnection; this is known as
southern systems. Thirdly, southern and northern power systems are connected through hybrid link
control topology. However, to improve these interconnected topologies, a large numbers of studies
have been conducted to determine the technical and economical viability of the interconnection. The
studies also demonstrate areas that require additional control devices. FACTS controllers are,
therefore, strong candidates as technology options. Applications of FACTS controllers will deliver the
following benefits [1], [2].
i) Increased power transfer capability in the GCC power grid.
The STATCOM connection between Qatar and Bahrain within the GCC interconnection
CHAPTER 5
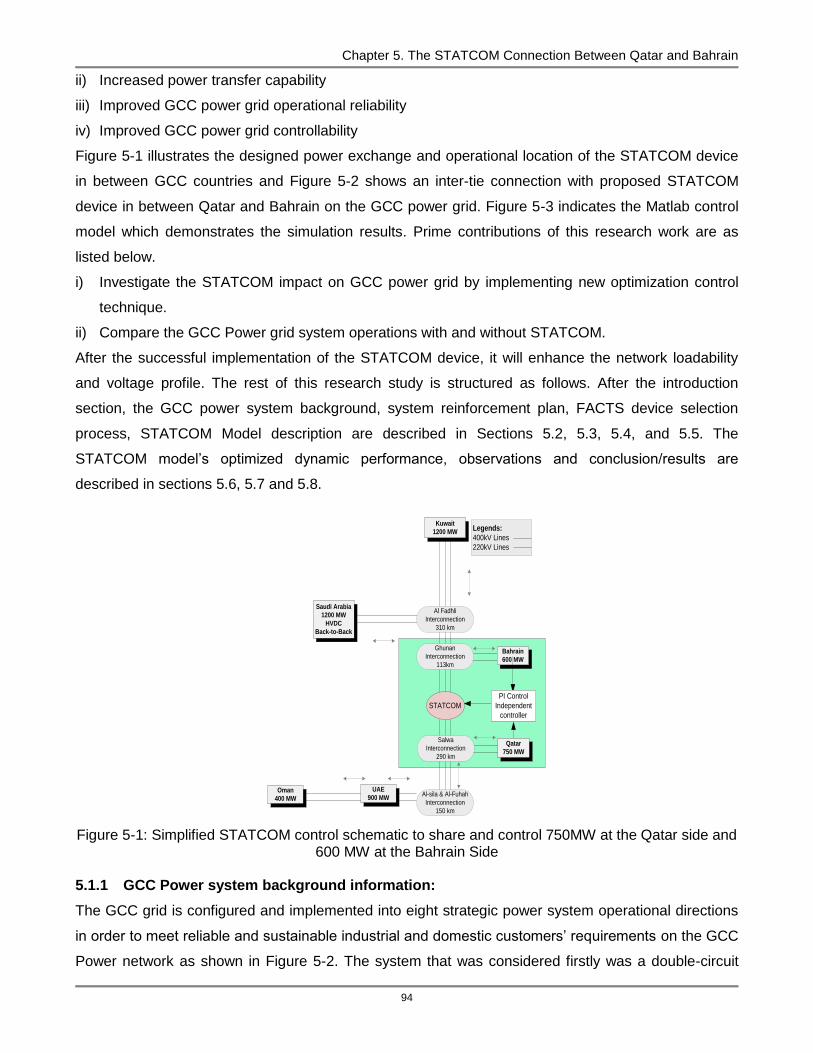
Chapter 5. The STATCOM Connection Between Qatar and Bahrain
94
ii) Increased power transfer capability
iii) Improved GCC power grid operational reliability
iv) Improved GCC power grid controllability
Figure 5-1 illustrates the designed power exchange and operational location of the STATCOM device
in between GCC countries and Figure 5-2 shows an inter-tie connection with proposed STATCOM
device in between Qatar and Bahrain on the GCC power grid. Figure 5-3 indicates the Matlab control
model which demonstrates the simulation results. Prime contributions of this research work are as
listed below.
i) Investigate the STATCOM impact on GCC power grid by implementing new optimization control
technique.
ii) Compare the GCC Power grid system operations with and without STATCOM.
After the successful implementation of the STATCOM device, it will enhance the network loadability
and voltage profile. The rest of this research study is structured as follows. After the introduction
section, the GCC power system background, system reinforcement plan, FACTS device selection
process, STATCOM Model description are described in Sections 5.2, 5.3, 5.4, and 5.5. The
STATCOM model’s optimized dynamic performance, observations and conclusion/results are
described in sections 5.6, 5.7 and 5.8.
Al Fadhli
Interconnection
310 km
Bahrain
600 MW
UAE
900 MW
Ghunan
Interconnection
113km
Salwa
Interconnection
290 km
Al-sila & Al-Fuhah
Interconnection
150 km
Legends:
400kV Lines
220kV Lines
PI Control
Independent
controller
Qatar
750 MW
STATCOM
Saudi Arabia
1200 MW
HVDC
Back-to-Back
Kuwait
1200 MW
Oman
400 MW
Figure 5-1: Simplified STATCOM control schematic to share and control 750MW at the Qatar side and 600 MW at the Bahrain Side
5.1.1 GCC Power system background information:
The GCC grid is configured and implemented into eight strategic power system operational directions
in order to meet reliable and sustainable industrial and domestic customers’ requirements on the GCC
Power network as shown in Figure 5-2. The system that was considered firstly was a double-circuit

Chapter 5. The STATCOM Connection Between Qatar and Bahrain
95
400 kV, 50 Hz line stretching from Al Zour substation (Kuwait) to Ghunan substation into (Saudi
Arabia) with an intermediate connection at Fadhili (Saudi Arabia) and its associated substations.
Secondly, a back-to-back HVDC link was introduced as a 380 kV interconnection, 60 Hz, system at
Fadhili into Saudi Arabia in order to develop proper synchronization or communication with other GCC
power systems, which are 50Hz frequency. Thirdly, a double circuit 400 kV overhead line stretching
and partially connected with a submarine link from Ghunan substation to Al Jasra substation in
Bahrain along with its associated substations. Fourthly, a double circuit 400 kV line stretching from
Ghunan substation to Salwa substation into Saudi Arabia along with its associated substations. Fifthly,
a double circuit 400 kV line stretching from Salwa substation to Doha South substation into Qatar and
its associated substations. Sixthly, a double circuit 400 kV, 50 Hz line stretching from Salwa substation
to Ghuwaifat substation in the United Arab Emirates along with its associated substations. Seventhly,
a double and a single circuit 220 kV,50Hz line stretching from Al Ouhah united Arab Emirates to Al
Wasset substation in Oman along with its associated substations; finally, a centralized control room
was established at Ghunan in Saudi Arabia in order to control power system operations within all GCC
countries with a certain degree of precision at different voltage and shared power perspectives [4],[5].
Kuwait (2500 MW)Legends
OLTC Transformer
Shunt Reactor
HVDC Converter
Overhead Lines
Underground Cable
Submarine cable
Kuwait 275 kV 6 circuits
network
KSA 220 kV network
380 kV
network
380kV 60Hz2x125MVAR
400kV 50Hz
2x125MVAR
400kV
4x125MVAR
400kV
4x125MVAR
400kV
2x125MVAR
3x300MVAR
1x125MVAR
400kV
2 circuits
220kV
66kV network
4 circuits
220kV
132kV network
132 kV
network
132kV network
6 circuits
220kV
6 circuits
220kV
2x125MVAR
4x300MVAR
400kV
125MVAR
400kV
G1 G2 G3
2x125MVAR
Doha South substation (Qatar)
Al-Jasra substation (Bahrain)
Al-Fadhili substation (KSA)
Al-Wasset substation
(Oman)
Al-Ouhah substation
(UAE)
STATCOM
Device
Location
Figure 5-2: Proposed area (shaded) for the STATCOM implementation in between Qatar and Bahrain
5.1.2. STATCOM Mathematical Model

Chapter 5. The STATCOM Connection Between Qatar and Bahrain
96
Figure 5-3 indicates the simulated model of the STATCOM device. The STATCOM is a voltage-
sourced-converter (VSC)-based shunt-connected device on the GCC power grid. This device is
injecting a current of variable magnitude in quadrature with the line voltage. Primary aim of this device
to inject and absorb reactive power based on required transmission line compensation [9]. An
equivalent circuit for the STATCOM is shown in Figure 5-2. The loop equations for the circuit may be
written in vector form as.
(5.1)
Where Rs and Ls represented the STATCOM transformer losses, Eabc presents the inverter ac side’s
phase voltage, Vabc presents the power system-side phase voltages, and abci presents the phase
currents. The STATCOM output is denoted in equation 5.2.
(5.2)
Where Vdc is the voltage across the dc capacitor, k is the modulation gain, and α is the injected
voltage phase angle. By defining a proper synchronous reference frame, the dynamic model can be
simplified[9]. The reference frame coordinate is defined in which the d- axis is always coincident with
the instantaneous system voltage vector and the q-axis is in quadrature with it. By transforming the
system model to this reference frame, the STATCOM equations at bus 1 can be written as
(5.3)
(5.4)
(5.5)
Where di and qi are injected qd STATCOM currents, Vdc is the voltage across the dc capacitor, Rdc
represents the switching losses, Rs and Ls are the coupling transformer resistance and inductance,
respectively, and the STATCOM rms bus voltage is iiV . The power balance equations at the
STATCOM bus are
(5.6)
(5.7)
Where the summation terms represent the power flow equations, ij ijY is the (i, j) element of the
admittance matrix, and ‘n’ is the number of buses in the system. The first set of terms indicates the
active and reactive powers injected by the STATCOM. The control objective for the STATCOM is to
provide independent reactive power support and to maintain constant dc capacitor voltage. This is the
best accomplished by regulating the PWM switching commands to alter the modulation index and
phase angle. The input signals dcV and Q are compared against reference values and used to
compute the error signals in di & qi . A PI-based control is then used to produce the controls signals k.

Chapter 5. The STATCOM Connection Between Qatar and Bahrain
97
In reality, both the firing angle α and modulation gain k are impacted by the changes in di & qi .
However, since α is more strongly correlated to changes in qi and k is more strongly correlated to
changes in di , the cross coupling terms can be neglected )0( qd kK leading to a decoupled
control approach[8],[9].
Figure 5-3: STATCOM control schematic in between Qatar and Bahrain [Matlab]
5.1.3. Power system reinforcement plan in between the Qatar and Bahrain:
Various analyses were carried out to identify and determine the system requirements at both ends of
transmission system. In this study, the Qatar substation site is selected for the STATCOM installation
for the following reasons: The first strategic approach as defined in Figure 5-3 is based on the fact that
Bahrain and Qatar have an interconnection with industrial and domestic consumers at Doha South
substation (Qatar) and Al-Jasra Substation (Bahrain). Further investigation identified that some power
system oscillations may exist on their systems, and consequently, also on the consumers’ side of the
system. This effectively means that in between the Qatar and Bahrain locations, there is an
opportunity to utilize the ability of the STATCOM to damp all types of existing and potential future
oscillations. The second strategic approach also defined in Figure 5-3 is based on the fact that the
main transmission line coming out from KSA and Kuwait 400kV bus is exposed to an increase in
voltage levels during light load conditions due to the inherent shunt capacitance of the 400kV
transmission line. Likewise, the 220kV bus is exposed to a reduction in voltage levels during peak load
conditions on both sides of Bahrain and Qatar. The Doha South substation (Qatar) and Al-Jasra
Substation (Bahrain) sites are the best locations on the Qatar and Bahrain network where the total
symmetrical range of the reactive output from the STATCOM, from full inductive to full capacitive,
could be utilized without applying fixed capacitors [4], [5].
5.1.4. STATCOM model’s distributed control:

Chapter 5. The STATCOM Connection Between Qatar and Bahrain
98
Appendix 5.A introduced and demonstrated the STATCOM control model’s three distributed control
limits which are designed to maintain minimum +/-2% medium +/-4%, and maximum +/-6% against the
corresponding deviation of each control limit. These deviations are compensated at three operating
limits by adjusting STATCOM control device with corresponding P & I control values as stated in
Appendix 5.A Table. The STATCOM control device oscillates based on corresponding P & I value of
each limit in between +/-2% +/-4% and +/-6% deviations at both sides (receiving and sending ends) of
transmission lines to adjust reactive power compensation. These control boundaries are customized
and synthesized by providing P &I configuration values. These values are enabling the control system
to communicate each limit accurately and adjust the reactive power compensation respectively at
defined locations on the GCC power grid. These control boundaries will effectively operate when more
than one FACTS device will be in operations at different location on the GCC power grid. These will
also communicate to each other based on voltage, impedance, angle and power flow deviation at
sending and receiving ends of the Qatar and Bahrain power system facilities [6], [7].
5.2. STATCOM controller’s selection process (WDB)
The estimated values are providing a positive indicator to understand how long and what resources
are needed to assess the credibility of the FACTS controllers on the GCC power grid. In this study a
Wideband Delphi technique has been used to evaluate various experts input from Academia and
Industry. This is a simple iteration technique which is used to establish each segment estimated value
as demonstrated in Table 5.1. Based on WBD technique 12 essential areas of FACTS devices have
been selected to identify and determine the operational and control reliability as well as feasibility on
the GCC power grid [14].
TABLE 5.1: STATCOM DEVICE CRITERIA SIGNIFICANCE
S.No Criteria Weight (%)
S.No Criteria Weight (%)
1 Control Significance
15 7 Refuse disposal
5
2 Control Integration
10 8 Monitoring equipment
5
3 Design Capacity
5 9 Simulation results
5
4 Reliability 10 10 Capex 10
5 Maintenance frequency
15 11 Opex 10
6 Availability for field trial
5 12 Post Installation Support
5
Total 100
These essential areas are (i) control significance: FACTS devices have a robust control to meet the
desired compensation of the power system network within a few cycles on the GCC power grid. (ii)
Control integration: FACTS device has the capacity and capability to communicate and maintain
parallel operations with other devices on the GCC power grid. (iii) FACTS devices design capacity:
based on their design capability how much each device can manage the reactive power compensation
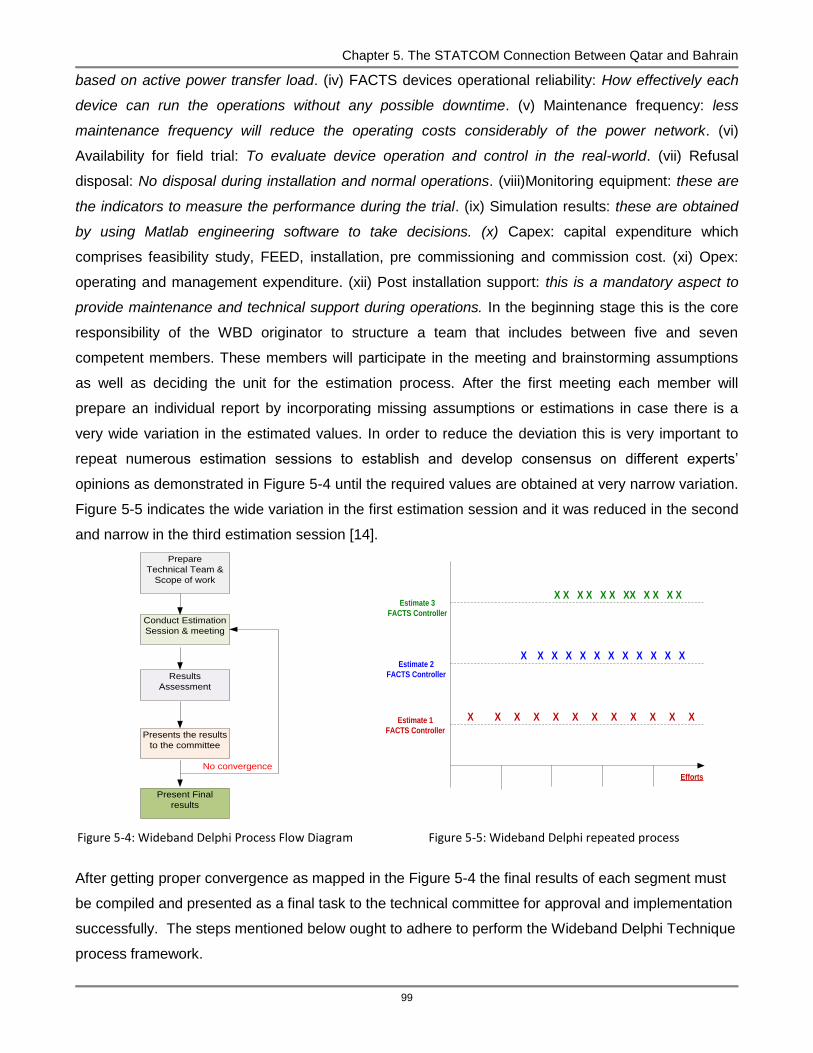
Chapter 5. The STATCOM Connection Between Qatar and Bahrain
99
based on active power transfer load. (iv) FACTS devices operational reliability: How effectively each
device can run the operations without any possible downtime. (v) Maintenance frequency: less
maintenance frequency will reduce the operating costs considerably of the power network. (vi)
Availability for field trial: To evaluate device operation and control in the real-world. (vii) Refusal
disposal: No disposal during installation and normal operations. (viii)Monitoring equipment: these are
the indicators to measure the performance during the trial. (ix) Simulation results: these are obtained
by using Matlab engineering software to take decisions. (x) Capex: capital expenditure which
comprises feasibility study, FEED, installation, pre commissioning and commission cost. (xi) Opex:
operating and management expenditure. (xii) Post installation support: this is a mandatory aspect to
provide maintenance and technical support during operations. In the beginning stage this is the core
responsibility of the WBD originator to structure a team that includes between five and seven
competent members. These members will participate in the meeting and brainstorming assumptions
as well as deciding the unit for the estimation process. After the first meeting each member will
prepare an individual report by incorporating missing assumptions or estimations in case there is a
very wide variation in the estimated values. In order to reduce the deviation this is very important to
repeat numerous estimation sessions to establish and develop consensus on different experts’
opinions as demonstrated in Figure 5-4 until the required values are obtained at very narrow variation.
Figure 5-5 indicates the wide variation in the first estimation session and it was reduced in the second
and narrow in the third estimation session [14].
Prepare
Technical Team &
Scope of work
Conduct Estimation
Session & meeting
Results
Assessment
Presents the results
to the committee
Present Final
results
No convergence
Estimate 1
FACTS Controller
Estimate 2
FACTS Controller
Estimate 3
FACTS Controller
X X X X X X X X X X X X
X X X X X X X X X X X X
X X X X X X XX X X X X
Efforts
Figure 5-4: Wideband Delphi Process Flow Diagram Figure 5-5: Wideband Delphi repeated process
After getting proper convergence as mapped in the Figure 5-4 the final results of each segment must
be compiled and presented as a final task to the technical committee for approval and implementation
successfully. The steps mentioned below ought to adhere to perform the Wideband Delphi Technique
process framework.
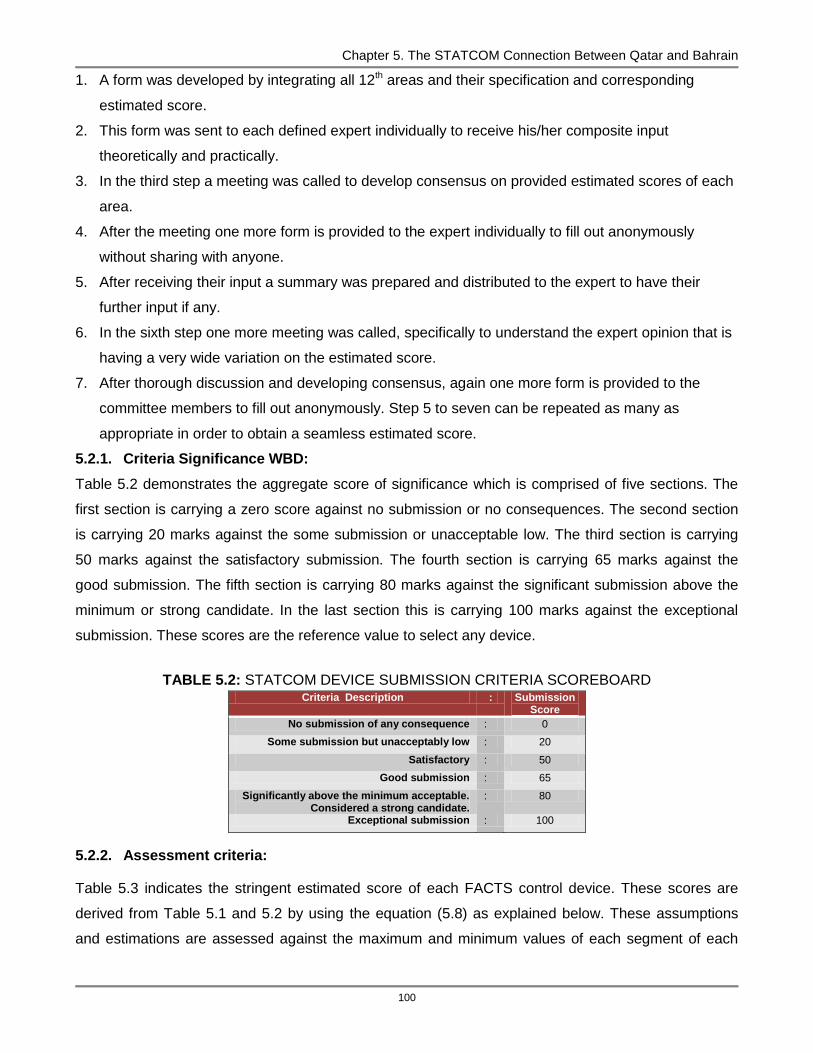
Chapter 5. The STATCOM Connection Between Qatar and Bahrain
100
1. A form was developed by integrating all 12th areas and their specification and corresponding
estimated score.
2. This form was sent to each defined expert individually to receive his/her composite input
theoretically and practically.
3. In the third step a meeting was called to develop consensus on provided estimated scores of each
area.
4. After the meeting one more form is provided to the expert individually to fill out anonymously
without sharing with anyone.
5. After receiving their input a summary was prepared and distributed to the expert to have their
further input if any.
6. In the sixth step one more meeting was called, specifically to understand the expert opinion that is
having a very wide variation on the estimated score.
7. After thorough discussion and developing consensus, again one more form is provided to the
committee members to fill out anonymously. Step 5 to seven can be repeated as many as
appropriate in order to obtain a seamless estimated score.
5.2.1. Criteria Significance WBD:
Table 5.2 demonstrates the aggregate score of significance which is comprised of five sections. The
first section is carrying a zero score against no submission or no consequences. The second section
is carrying 20 marks against the some submission or unacceptable low. The third section is carrying
50 marks against the satisfactory submission. The fourth section is carrying 65 marks against the
good submission. The fifth section is carrying 80 marks against the significant submission above the
minimum or strong candidate. In the last section this is carrying 100 marks against the exceptional
submission. These scores are the reference value to select any device.
TABLE 5.2: STATCOM DEVICE SUBMISSION CRITERIA SCOREBOARD Criteria Description : Submission
Score
No submission of any consequence : 0
Some submission but unacceptably low : 20
Satisfactory : 50
Good submission : 65
Significantly above the minimum acceptable. Considered a strong candidate.
: 80
Exceptional submission : 100
5.2.2. Assessment criteria:
Table 5.3 indicates the stringent estimated score of each FACTS control device. These scores are
derived from Table 5.1 and 5.2 by using the equation (5.8) as explained below. These assumptions
and estimations are assessed against the maximum and minimum values of each segment of each
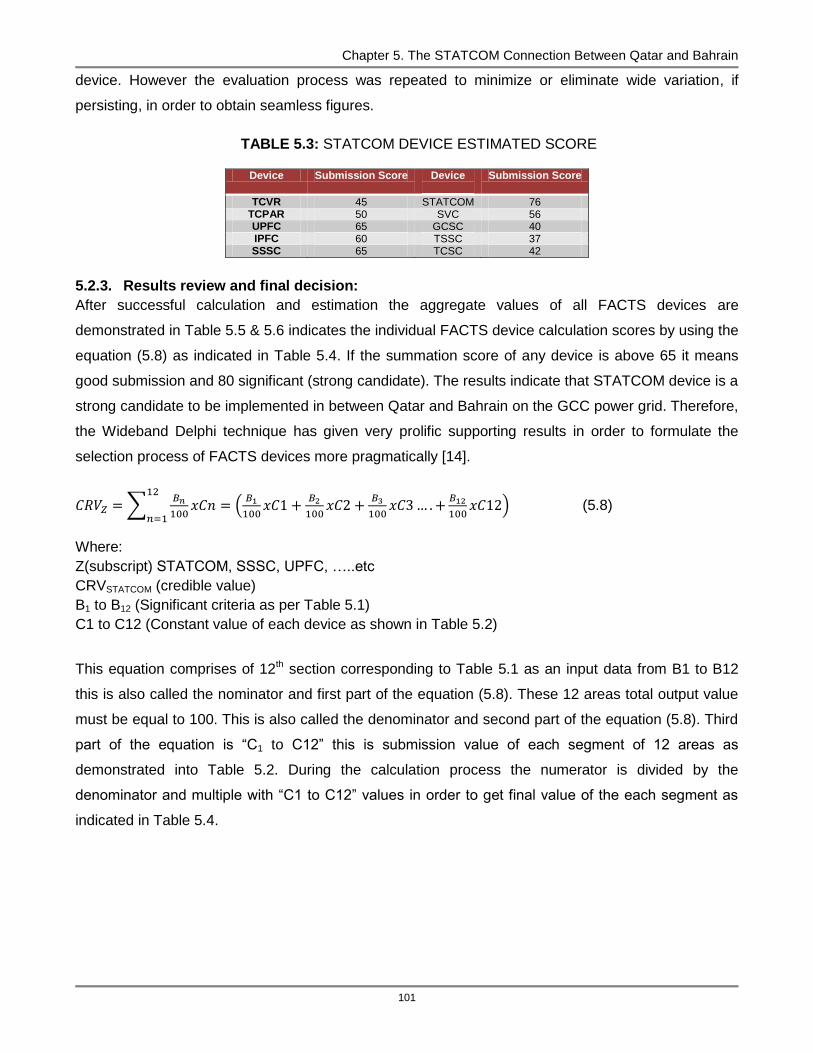
Chapter 5. The STATCOM Connection Between Qatar and Bahrain
101
device. However the evaluation process was repeated to minimize or eliminate wide variation, if
persisting, in order to obtain seamless figures.
TABLE 5.3: STATCOM DEVICE ESTIMATED SCORE
Device Submission Score Device
Submission Score
TCVR 45 STATCOM 76 TCPAR 50 SVC 56 UPFC 65 GCSC 40 IPFC 60 TSSC 37 SSSC 65 TCSC 42
5.2.3. Results review and final decision:
After successful calculation and estimation the aggregate values of all FACTS devices are
demonstrated in Table 5.5 & 5.6 indicates the individual FACTS device calculation scores by using the
equation (5.8) as indicated in Table 5.4. If the summation score of any device is above 65 it means
good submission and 80 significant (strong candidate). The results indicate that STATCOM device is a
strong candidate to be implemented in between Qatar and Bahrain on the GCC power grid. Therefore,
the Wideband Delphi technique has given very prolific supporting results in order to formulate the
selection process of FACTS devices more pragmatically [14].
(5.8)
Where:
Z(subscript) STATCOM, SSSC, UPFC, …..etc
CRVSTATCOM (credible value)
B1 to B12 (Significant criteria as per Table 5.1)
C1 to C12 (Constant value of each device as shown in Table 5.2)
This equation comprises of 12th section corresponding to Table 5.1 as an input data from B1 to B12
this is also called the nominator and first part of the equation (5.8). These 12 areas total output value
must be equal to 100. This is also called the denominator and second part of the equation (5.8). Third
part of the equation is “C1 to C12” this is submission value of each segment of 12 areas as
demonstrated into Table 5.2. During the calculation process the numerator is divided by the
denominator and multiple with “C1 to C12” values in order to get final value of the each segment as
indicated in Table 5.4.
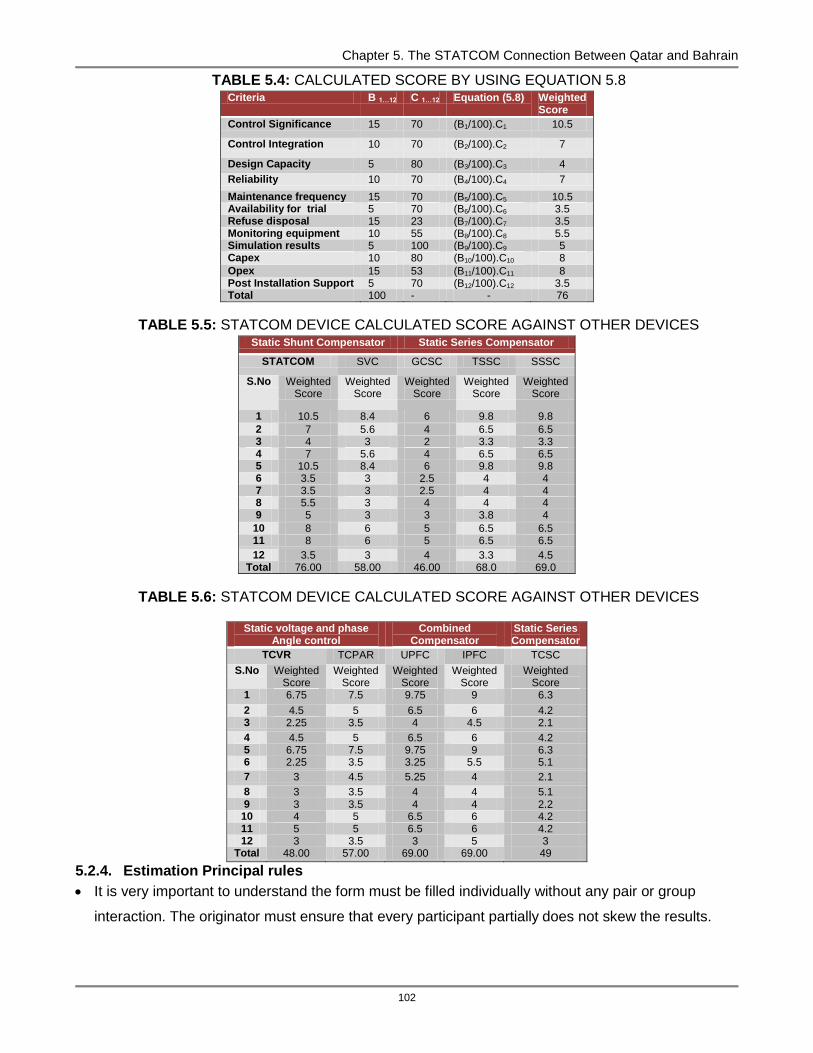
Chapter 5. The STATCOM Connection Between Qatar and Bahrain
102
TABLE 5.4: CALCULATED SCORE BY USING EQUATION 5.8 Criteria B 1…12 C 1…12 Equation (5.8) Weighted
Score
Control Significance 15 70 (B1/100).C1 10.5
Control Integration 10 70 (B2/100).C2 7
Design Capacity 5 80 (B3/100).C3 4
Reliability 10 70 (B4/100).C4 7
Maintenance frequency 15 70 (B5/100).C5 10.5 Availability for trial 5 70 (B6/100).C6 3.5 Refuse disposal 15 23 (B7/100).C7 3.5 Monitoring equipment 10 55 (B8/100).C8 5.5 Simulation results 5 100 (B9/100).C9 5 Capex 10 80 (B10/100).C10 8
Opex 15 53 (B11/100).C11 8 Post Installation Support 5 70 (B12/100).C12 3.5 Total 100 - - 76
TABLE 5.5: STATCOM DEVICE CALCULATED SCORE AGAINST OTHER DEVICES Static Shunt Compensator Static Series Compensator
STATCOM SVC GCSC TSSC SSSC
S.No Weighted Score
Weighted Score
Weighted Score
Weighted Score
Weighted Score
1 10.5 8.4 6 9.8 9.8
2 7 5.6 4 6.5 6.5 3 4 3 2 3.3 3.3 4 7 5.6 4 6.5 6.5 5 10.5 8.4 6 9.8 9.8 6 3.5 3 2.5 4 4 7 3.5 3 2.5 4 4 8 5.5 3 4 4 4 9 5 3 3 3.8 4
10 8 6 5 6.5 6.5 11 8 6 5 6.5 6.5
12 3.5 3 4 3.3 4.5 Total 76.00 58.00 46.00 68.0 69.0
TABLE 5.6: STATCOM DEVICE CALCULATED SCORE AGAINST OTHER DEVICES
Static voltage and phase Angle control
Combined Compensator
Static Series Compensator
TCVR TCPAR UPFC IPFC TCSC
S.No Weighted Score
Weighted Score
Weighted Score
Weighted Score
Weighted Score
1 6.75 7.5 9.75 9 6.3
2 4.5 5 6.5 6 4.2 3 2.25 3.5 4 4.5 2.1
4 4.5 5 6.5 6 4.2 5 6.75 7.5 9.75 9 6.3 6 2.25 3.5 3.25 5.5 5.1
7 3 4.5 5.25 4 2.1
8 3 3.5 4 4 5.1 9 3 3.5 4 4 2.2 10 4 5 6.5 6 4.2 11 5 5 6.5 6 4.2 12 3 3.5 3 5 3
Total 48.00 57.00 69.00 69.00 49
5.2.4. Estimation Principal rules
It is very important to understand the form must be filled individually without any pair or group
interaction. The originator must ensure that every participant partially does not skew the results.
Chapter 5. The STATCOM Connection Between Qatar and Bahrain
103
The originator (estimator) must neglect any external influence factor, the principal objective is to
develop consensus between the technical team members on realistic values rather than what the
originator wants to hear.
The originator must indicate the characteristic that influences their values; this will help to build a
transparent worksheet.
The originator must define the time limit, this will help focus, and continuity and progress.
5.2.5. Wideband Delphi Strengths
This is a very simple technique that does not require estimation experts. This process is very
composite and prolific so everyone can participate actively in the assigned responsibilities. The
estimated values are produced based on strong consensus through a number of iteration sessions.
This will help to eliminate individual error if they persist. The expert comparative judgment will provide
an effective driving force to produce high quality results [14].
5.2.6. Wideband Delphi Weaknesses
The originator must be strong technical and managerially. This is very important to determine the
competence of the participants.
5.2.7. WBD and GA technique comparative analysis
WBD technique has unlimited capability and capacity to incorporate multiple parameters as input for
the evaluation purpose. It will produce high quality results satisfactory based on input data being used.
GA is also called the ranked based selection process to evaluate various selection process
parameters based on reservation and grouping calculation. It will produce the results satisfactorily no
matter what input signal is being used during the grouping calculation process. GA uses time-based
parameters to evaluate system performance e.g. processing time, setup time and study handling time
etc. Conclusively, the WDB technique is a prolific approach comparatively GA to determine seamless
selection process. This technique may be used for other purposes as well [18], [19].
5.3. STATCOM model’s case study (Qatar & Bahrain):
Table 5.7, 5.8 and 5.9 demonstrate the STATCOM input data that is used to develop and simulate the
STATCOM control model. A 500-Mvar STATCOM is implemented in between Qatar and Bahrain to
regulate voltage on a three-bus 400kV in order to meet long transmission system operational
requirements. Effectively, in normal operational conditions the STATCOM device adjusts the VSC
(voltage source converter) output to maintain its voltage in phase with the AC system voltage in
between the Qatar and Bahrain. The STATCOM device generates or absorbs the reactive power
based on VSC (voltage source converter) output voltage. It is very important to understand the amount
of reactive power based on converter output voltage magnitude and coupling transformer leakage
reactance.

Chapter 5. The STATCOM Connection Between Qatar and Bahrain
104
The slight change in voltage angle will allow a small amount of reactive power to flow to the DC bus in
order to charge or discharge capacitor bank. Figure 5-6 & 5-7 indicate 1200 MW power delivered into
the shared GCC Power grid. As per the graph below the transmission line voltage and reactive current
are well controlled by implementing an optimized control technique with high degree of precision.
During a simulation process it was observed that the reactive current was oscillating form 0.1 to 0.3
second to maintain reference reactive current to main certain level of voltage level. During the
optimization process reactive power was dropped for 0.07 second and ramped up for 0.05 seconds.
Momentarily, it was gradually dropped in order to maintain reference reactive power. To maintain
STATCOM optimized operations, the thyristor firing angle is also in a tight controlled mode.
Additionally, the thyristor firing angle also indicates a couple of alpha peaks momentarily during ramp
up or ramp down to maintain reactive power compensation for the long transmission line [15].
TABLE 5.7: POWER, VOLTAGE AND FREQUENCY
Countries
Power Exchange, Voltage & Frequency
To the Qatar or from Qatar to main transmission line
750MW, 400kV, 50Hz
To the Bahrain or from Bahrain to main transmission line
600MW, 400kV, 50Hz
TABLE 5.8: EXISTING REACTIVE POWER AND DISTANCE
Existing Power System
Reactive Power
Distance
Reactive Power Demand at Al-Ghunan substation KSA
500MVAR Al Fadhili substation (KSA) to Al-Ghunan Substation (KSA) =114
Km Reactive Power Demand at Al
Jasra substation Bahrain 850MVAR Al-Ghunan Substation (KSA) to
Slawa Substation (Qatar) = 288Km Reactive Power demand at Al-
Salwa Substation 500MVAR Slawa Substation (Qatar) to Doha
South Substation = 97Km Reactive Power demand at
Doha South Substation 250MVAR
TABLE 5.9: MULTIVARIABLE CONTROLLER’S CONFIGURATION OF THE STATCOM
STATCOM LOCATION: Shunt connected at Salwa substation in between Bahrain and
Doha
Iq regular: Kp 12dB; Ki: 0.015 dB
CC1 and LC1 = minimum compensation capacitive or inductive
(VC voltage change from 1 to 2%)
Rated STATCOM: +/- 500 MVAR Ref V: 1.0 pu (400kV) CC11 and LC11 = medium compensation capacitive or inductive (VC voltage change from 2% to 4%)
P (proportional): 0.32, 0.36, 0.38, 0.42 I (integral) 0.6, 0.8, 0.9, 1.1
D (derivative): none
Droop: 0.033pu/100MVA; Kp:14dB; Ki: 3500dB
CC111 and LC111 = full compensation capacitive or inductive (VC voltage
change from 4-6%)
5.3.1. STATCOM optimized dynamic response:
Figure 5-6 indicates voltage control mode of the STATCOM and it adjusts the converter voltage
against the reference voltage (Vref=1.0). The controller’s voltage droop of the regulator is maintained
at 0.04pu/100VA. In normal operational conditions the STATCOM changes its operating point from
capacitive to inductive (+/-500MVAR) mode of operations. The STATCOM converter output voltage
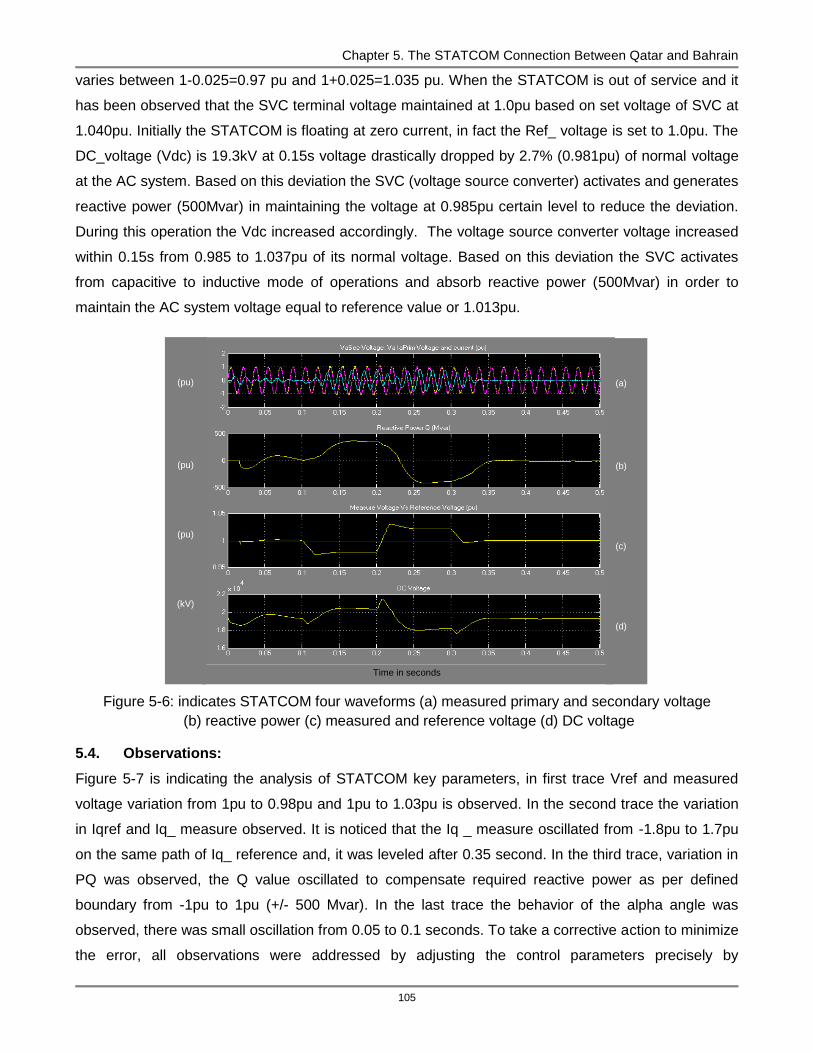
Chapter 5. The STATCOM Connection Between Qatar and Bahrain
105
varies between 1-0.025=0.97 pu and 1+0.025=1.035 pu. When the STATCOM is out of service and it
has been observed that the SVC terminal voltage maintained at 1.0pu based on set voltage of SVC at
1.040pu. Initially the STATCOM is floating at zero current, in fact the Ref_ voltage is set to 1.0pu. The
DC_voltage (Vdc) is 19.3kV at 0.15s voltage drastically dropped by 2.7% (0.981pu) of normal voltage
at the AC system. Based on this deviation the SVC (voltage source converter) activates and generates
reactive power (500Mvar) in maintaining the voltage at 0.985pu certain level to reduce the deviation.
During this operation the Vdc increased accordingly. The voltage source converter voltage increased
within 0.15s from 0.985 to 1.037pu of its normal voltage. Based on this deviation the SVC activates
from capacitive to inductive mode of operations and absorb reactive power (500Mvar) in order to
maintain the AC system voltage equal to reference value or 1.013pu.
Time in seconds
Figure 5-6: indicates STATCOM four waveforms (a) measured primary and secondary voltage
(b) reactive power (c) measured and reference voltage (d) DC voltage
5.4. Observations:
Figure 5-7 is indicating the analysis of STATCOM key parameters, in first trace Vref and measured
voltage variation from 1pu to 0.98pu and 1pu to 1.03pu is observed. In the second trace the variation
in Iqref and Iq_ measure observed. It is noticed that the Iq _ measure oscillated from -1.8pu to 1.7pu
on the same path of Iq_ reference and, it was leveled after 0.35 second. In the third trace, variation in
PQ was observed, the Q value oscillated to compensate required reactive power as per defined
boundary from -1pu to 1pu (+/- 500 Mvar). In the last trace the behavior of the alpha angle was
observed, there was small oscillation from 0.05 to 0.1 seconds. To take a corrective action to minimize
the error, all observations were addressed by adjusting the control parameters precisely by
(a)
(b)
(c)
(d)
(pu)
(pu)
(pu)
(kV)

Chapter 5. The STATCOM Connection Between Qatar and Bahrain
106
(a)
(b)
(c)
(d)
(pu)
(pu)
(pu)
(pu)
considering adequate safety and security margins. Figure 5-9 is indicating sending and receiving end
voltages at both sides of the STATCOM, which was controlled precisely to optimize STATCOM
operations in order to deliver sustainable and reliable 1200 MW power into the GCC Power grid [21].
Time of Seconds
Figure 5-7: STATCOM Control parameters (a) measured and reference voltage
(b) Iq measured and Iq reference (c) measured real and reactive power (d) Alpha firing angle control
5.4.1. Effectiveness of the STATCOM control device
Figure 5-8 indicates the receiving and sending ends voltage without STATCOM at Bahrain and Qatar.
Figure 5-9 shows the improved voltage with STATCOM at both the receiving and sending ends of
Bahrain and Qatar. These results were obtained after implementation of PID new configuration control
parameters. Figure 5-5 also demonstrates the STATCOM effectiveness as given below. In the first
trace, the waveforms show Vref (magenta trace) and measured voltage (yellow trace) variation from
1pu to 0.98pu and 1pu to 1.03pu. In the second trace, the variations in Iqref (magenta trace) and
Iq(yellow trace) waveforms are observed. It is noticed that the measured Iq _ oscillated from -1.8pu to
1.7pu on the same path of Iq_ reference and, it then leveled to a steady state value after 0.35 s. In
the third trace, a variation in real and reactive powers P and Q are observed; the Q value oscillates to
compensate the required reactive power as per defined boundary from -1pu to 1pu(+/- 500 Mvar). In
the last trace, the behavior of alpha angle is observed; in this case, there is small oscillation from 0.05
to 0.1 s. In order to enforce a corrective action to minimize the error, all observations are addressed by
(Deg)
Time in Seconds
(pu)
(pu)
(pu)
(deg)

Chapter 5. The STATCOM Connection Between Qatar and Bahrain
107
adjusting the control parameters precisely by considering adequate safety and security margins [19],
[20].
Time in seconds
Figure 5-8: Receiving end voltages at both side of Bahrain and Qatar without STATCOM (a) receiving end voltage (b) sending end voltage
Time in seconds
Figure 5-9: Receiving and sending ends improved voltages at both sides of Bahrain and Qatar with STATCOM (a) receiving end improved voltage (b) sending end improved voltage
5.5. Results and Discussion
(a)
(b)
(c)
(d)
(pu)
(pu)
(a)
(b)
(c)
(d)
(pu)
(pu)
Chapter 5. The STATCOM Connection Between Qatar and Bahrain
108
The STATCOM control model has been developed into three distributed control limits which are
defined to adjust reactive power: minimum, medium and maximum. This controller oscillates between
+/- 2, 4 and 6% at both sides of transmission lines to adjust reactive power compensation as required.
These control boundaries will communicate and adjust reactive power compensation based on
sending and receiving ends voltage deviation. The controller will oscillate and inject or absorb
controlled reactive power based on corresponding PI controller values of each operating boundary as
demonstrated in Appendix 5.A. These control boundaries will effectively operate when more than one
FACTS device will be in operation at different locations on the GCC power grid. These will
communicate to each other based on voltage, impedance, angle and power deviation at sending and
receiving ends. Based on the above discussion various investigations have been carried-out by
introducing new control and tuning parameters further discussed in chapter no.9. A simulation
technique validated and its results to share 600MW power on the Bahrain and 750MW on the Qatar
network. In order to meet industrial and domestic loads operational requirements were establish at
various operating conditions. The results also show that STATCOM is versatile equipment with
outstanding dynamic capability to improve the voltage profile, power angle and stability margin in
between Qatar and Bahrain. Based on these results, STATCOM is a very strong candidate to be
implemented on the GCC power grid. It also exhibits a positive impact on neighboring countries’ power
system operations on the
5.6. Summary:
In this chapter, the STATCOM device model demonstrates its impact in between Qatar and Bahrain to
improve power system’s control and operations on the GCC power grid. After providing adequate
compensation through the STATCOM device the Qatar power network will share 750MW power and
the Bahrain power network will share 600MW without any restraint. Based on these improvements the
GCC power grid has the capability and capacity to share 1200MW power from KSA and 1200MW
power from Kuwait to meet industrial and domestic loads requirements at different atmospheric
(summer/winter) operating conditions on the GCC power grid. Hereby the GCC power system
background and viabilities are also addressed as well as the STATCOM reinforcement plan. In
addition to that, the STATCOM model’s new control optimization and device selection techniques are
described in detail as well as its prompt application in order to resolve various control and operational
issues precisely. Based on this control technique three control limits along with corresponding PI
values are incorporated into the STATCOM model and simulated as demonstrated in appendix 5.A.
These control techniques are providing a lot of confidence to operate the STATCOM device
independently or jointly (integrated) as discussed in Chapter 9.
109
6.1 Introduction:-
The proposed work is a novel design and controllability optimization technique which has been
implemented prudently to simulate the SSSC control operations in order to identify and determine
various control parameters which are contributing considerably to control the SSSC device operations
in multiple directions in a power system network at different locations on the GCC power grid during
any undesired conditions. In order to maximize utilization of the SSSC control device operations on
the GCC power grid, hereby SSSC control parameters are reconfigured in different strategic ways to
optimize the SSSC model performance by adjusting its control parameters more tangibly under both
steady and dynamic states. Herein the SSSC device operational controllability results are clearly
indicating that the introduction of SSSC device in between the Oman and United Arab Emirates
network will reasonably enhance the power system loadability, diminish the losses and improve
sustainability of the power system performance throughout the GCC power grid. Hereafter, new
SSSC control device optimization techniques can thus be successfully used for this type of
optimization process. This research work demonstrates prolific and composite simulated results; these
are extracted after application of an SSSC control device with total rating +/-250MVAR in between
Oman and The United Arab Emirates at optimum location no.3. The optimum location has been
recognized and examined on the GCC power grid by carrying out a wide-range of complex power
system studies and surveying. In order to control the SSSC operations at different location(s), a novel
control technique was implemented to communicate with other FACTS devices within the GCC power
grid, by considering operations and control system parameters’ criticalities. A multi-variable controller
was developed and synthesized by considering all control parameters at a micro level, which has the
ability to communicate and control all FACTS devices (STATCOM, SSSC, and UPFC) which are in
operation at different locations’ time domains in the GCC power grid. Hence, an optimization
technique was configured to recognize and assess each FACTS device(s) available to provide
required compensation to enhance the over-all network performance, simultaneous with reducing the
network losses. The GCC power grid encompassed four segments; i) the first segment demonstrates
power system facilities in between Kuwait and Saudi Arabia, ii) the second segment demonstrates in
between Qatar and Bahrain, electrical power facilities, iii) the third segment demonstrates in between
Oman and United Arab Emirate, electrical power facilities and iv) the fourth segment focuses on the
HVDC link to synchronize the Kingdom of Saudi Arabia to the entire GCC power grid due to it 60Hz
frequency (Note that all GCC countries Power system is operating at 50 Hz frequency except the
kingdom of Saudi Arabia) Herein, Figure 6-1 illustrates the designed power exchange between GCC
The SSSC Connection between Oman and United Arab Emirates within the GCC Interconnection
CHAPTER 6
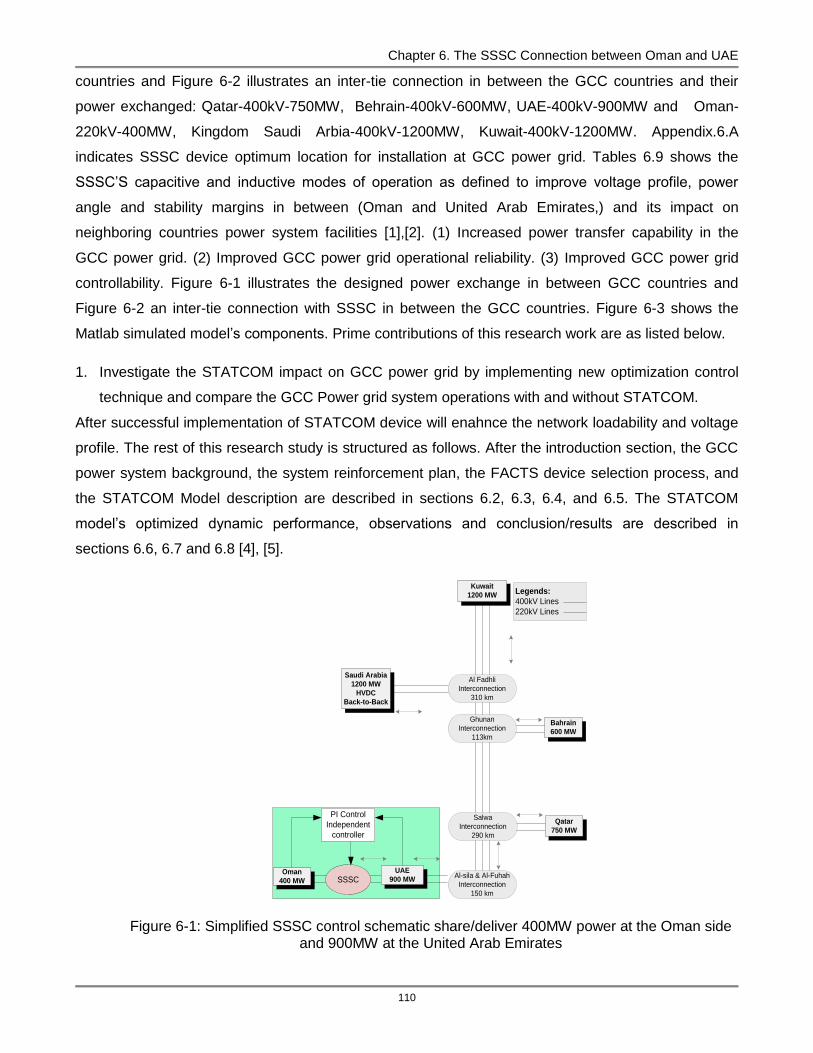
Chapter 6. The SSSC Connection between Oman and UAE
110
countries and Figure 6-2 illustrates an inter-tie connection in between the GCC countries and their
power exchanged: Qatar-400kV-750MW, Behrain-400kV-600MW, UAE-400kV-900MW and Oman-
220kV-400MW, Kingdom Saudi Arbia-400kV-1200MW, Kuwait-400kV-1200MW. Appendix.6.A
indicates SSSC device optimum location for installation at GCC power grid. Tables 6.9 shows the
SSSC’S capacitive and inductive modes of operation as defined to improve voltage profile, power
angle and stability margins in between (Oman and United Arab Emirates,) and its impact on
neighboring countries power system facilities [1],[2]. (1) Increased power transfer capability in the
GCC power grid. (2) Improved GCC power grid operational reliability. (3) Improved GCC power grid
controllability. Figure 6-1 illustrates the designed power exchange in between GCC countries and
Figure 6-2 an inter-tie connection with SSSC in between the GCC countries. Figure 6-3 shows the
Matlab simulated model’s components. Prime contributions of this research work are as listed below.
1. Investigate the STATCOM impact on GCC power grid by implementing new optimization control
technique and compare the GCC Power grid system operations with and without STATCOM.
After successful implementation of STATCOM device will enahnce the network loadability and voltage
profile. The rest of this research study is structured as follows. After the introduction section, the GCC
power system background, the system reinforcement plan, the FACTS device selection process, and
the STATCOM Model description are described in sections 6.2, 6.3, 6.4, and 6.5. The STATCOM
model’s optimized dynamic performance, observations and conclusion/results are described in
sections 6.6, 6.7 and 6.8 [4], [5].
Al Fadhli
Interconnection
310 km
Bahrain
600 MW
UAE
900 MWOman
400 MW
Ghunan
Interconnection
113km
Salwa
Interconnection
290 km
Al-sila & Al-Fuhah
Interconnection
150 km
Legends:
400kV Lines
220kV Lines
SSSC
PI Control
Independent
controller
Qatar
750 MW
Saudi Arabia
1200 MW
HVDC
Back-to-Back
Kuwait
1200 MW
Figure 6-1: Simplified SSSC control schematic share/deliver 400MW power at the Oman side
and 900MW at the United Arab Emirates
Chapter 6. The SSSC Connection between Oman and UAE
111
6.1.1. GCC Power System Background Information:
The GCC power system facilities are configured and implemented into 8 strategic ways to meet
reliable and sustainable industrial and domestic power system requirements at the Gulf Corporative
Council power network as shown in Figure 6-2. Firstly, a double-circuit 400 kV, 50 Hz line stretching
from Al Zour (Kuwait) to Ghunan (Saudi Arabia) with an intermediate connection at Fadhili (Kingdom
Saudi Arabia) and its associated power system facilities was installed. Secondly, a back-to-back
HVDC link introduced as a 380 kV interconnection, 60 Hz, system at Fadhili (KSA) in order to
maintain proper synchronization or communication with other GCC power systems, which are
operating at 50Hz frequency was also installed. Thirdly, a double circuit 400 kV overhead line
stretching and partially connected with submarine link from Ghunan (KSA) to Al Jasra (Bahrain) along
with its associated power system facilities was installed. Fourthly, a double circuit 400 kV line
stretching from Ghunan (KSA) to Salwa (QATAR) into Saudi Arabia along with its associated
substations was installed. Fifthly, a double circuit 400 kV line stretching from Salwa (Qatar) to Doha
South and its associated facilities was installed. Sixthly, a double circuit 400 kV, 50 Hz line stretching
from Salwa (Qatar) to Ghuwaifat (United Arab Emirates) along with its associated power system
facilities was installed. Seventhly, a double and a single circuit 220 kV,50Hz line stretching from Al
Ouhah (United Arab Emirates) to Al Wasset ( Oman) along with its associated substations was
installed. Finally, a centralized control room was established at Ghunan (KSA) in order to control
power system operations within all GCC countries with a certain degree of precision at different
voltage and shared power perspective [4], [5].
6.1.2. Power System reinforcement plan in between the Oman and UAE:
In order to initiate a proper power system reinforcement plan, multiple studies at different voltage
levels have been completed to determine the power system operational requirements at both sides of
the United Emirates and Oman. This study reveals the Oman and United Arab Emirates substation
sites are selected for the SSSC installation for the following reasons: firstly as demonstrated in the
GCC power system background, Oman and the United Arab Emirates have an interconnection with
industrial and domestic consumers at Al-Fuhah (United Arab Emirates) and Al-Wasset (Oman) power
facilities. Based on the power authorities investigation report which identified that a couple of stability
issues may exist on their systems, and consequently, also on the consumers’ side of the system. This
is very much viable to utilize the ability of the SSSC to improve all types of existing and potential
stability issues in between Oman and the United Arab Emirates’ power system facilities. The second
strategic approach, as demonstrated in Figure 6-2, shows the main transmission line coming out from
KSA, Kuwait, Qatar, Bahrain, the United Arab Emirates 400kV bus is exposed to an increase in
voltage levels during light load conditions due to the inherent shunt capacitance of the 400kV
transmission line. Likewise, the 220kV bus is exposed to a reduction in voltage levels during peak load

Chapter 6. The SSSC Connection between Oman and UAE
112
conditions on both sides of United Arab Emirates and Oman. The Al-Fuhah substation (UAE) and Al-
Wasset Substation (Oman) sites are the best locations on the Oman and United Arab Emirates
network where the total symmetrical range of the reactive output from the SSSC, from full inductive to
full capacitive, could be utilized without applying fixed capacitors
Kuwait (2500 MW)Legends
OLTC Transformer
Shunt Reactor
HVDC Converter
Overhead Lines
Underground Cable
Submarine cable
Kuwait 275 kV 6 circuits
network
KSA 220 kV network
380 kV
network
380kV 60Hz2x125MVAR
400kV 50Hz
2x125MVAR
400kV
4x125MVAR
400kV
4x125MVAR
400kV
2x125MVAR
3x300MVAR
1x125MVAR
400kV
2 circuits
220kV
66kV network
4 circuits
220kV
132kV network
132 kV
network
132kV network
6 circuits
220kV
6 circuits
220kV
2x125MVAR
4x300MVAR
400kV
125MVAR
400kV
G1 G2 G3
2x125MVAR
Doha South substation (Qatar)
Al-Jasra substation (Bahrain)
Al-Fadhili substation (KSA)
Al-Wasset substation
(Oman)
Al-Ouhah substation
(UAE)
SSSC
Device
Location
Figure 6-2: Proposed area (shaded) for SSSC implementation in between the
United Arab Emirates and Oman
6.1.3. SSSC Mathematical Model
Figure 6-3 shows an SSSC simulated model at the midpoint of the transmission line on the GCC
power grid. The transmission line is modeled with lumped impedances. The voltages
and are midpoint voltages on each side of the SSSC, and the represents the
voltage injected by the controller [9]. The SSSC model is similar to that of STATCOM.
(6.1)
(6.2)
(6.3)

Chapter 6. The SSSC Connection between Oman and UAE
113
Where and are the terminal voltages of the SSSC. Therefore, the power balanced
equations at the sending end of the SSSC at bus 1 are given as:
(6.4)
(6.5)
And at the receiving end at bus 2 (power balance equations)
(6.6)
(6.7)
The PWM switching is used to govern the switching, then
(7.8)
(7.9)
Herein, k and are the PWM modulation gain and phase shift. The modulation gain k is proportional
to the modulation index ma and ktr which are determined by the modulation method and the serial
transformer winding ratio. The range of are constrained by the steady-state reactive power
capabilities of the controller. The Phasor diagram of the SSSC; where it has been assumed that
The phase shift α is referenced to since it is not practical to synchronize
the injected voltage to the system reference. This diagram can be used as a basis from which to
derive a control approach. If losses are neglected, then the injected powers Pinj and Qinj, and the output
powers Pout and Qout can be denoted as follows:
(6.10)
δ θ
(6.11)
(6.12)
(6.13)
(6.14)
(6.15)
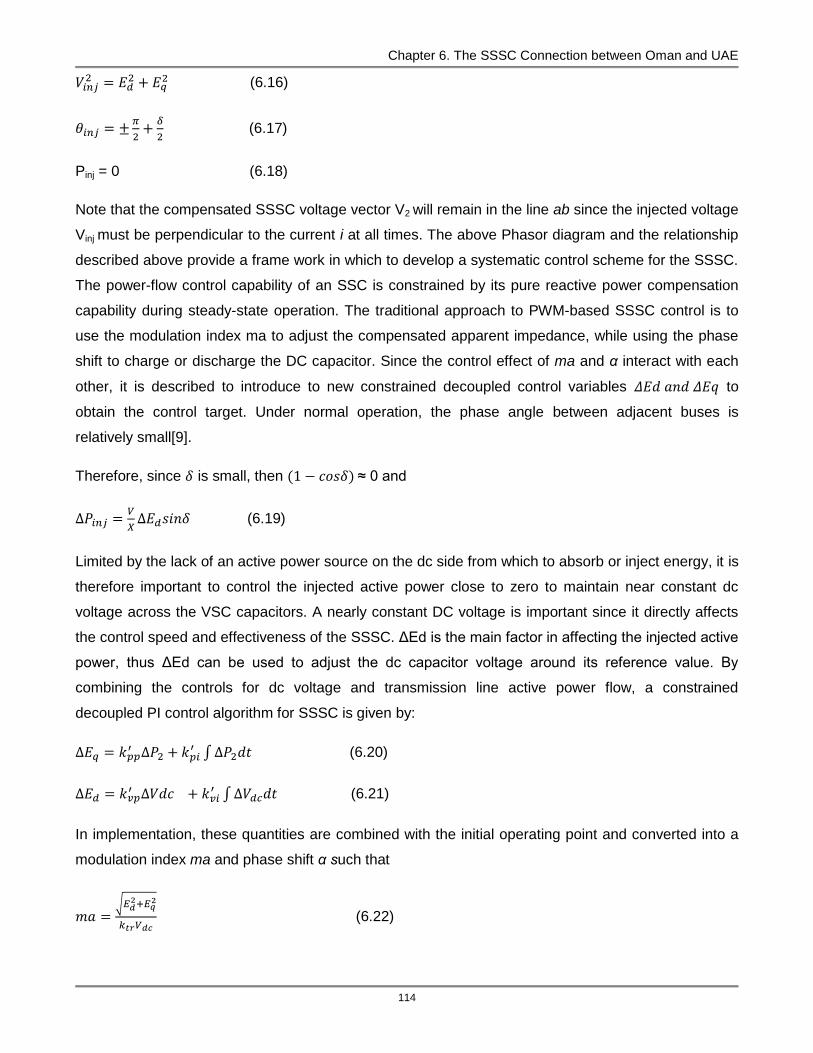
Chapter 6. The SSSC Connection between Oman and UAE
114
(6.16)
(6.17)
Pinj = 0 (6.18)
Note that the compensated SSSC voltage vector V2 will remain in the line ab since the injected voltage
Vinj must be perpendicular to the current i at all times. The above Phasor diagram and the relationship
described above provide a frame work in which to develop a systematic control scheme for the SSSC.
The power-flow control capability of an SSC is constrained by its pure reactive power compensation
capability during steady-state operation. The traditional approach to PWM-based SSSC control is to
use the modulation index ma to adjust the compensated apparent impedance, while using the phase
shift to charge or discharge the DC capacitor. Since the control effect of ma and α interact with each
other, it is described to introduce to new constrained decoupled control variables to
obtain the control target. Under normal operation, the phase angle between adjacent buses is
relatively small[9].
Therefore, since is small, then ≈ 0 and
(6.19)
Limited by the lack of an active power source on the dc side from which to absorb or inject energy, it is
therefore important to control the injected active power close to zero to maintain near constant dc
voltage across the VSC capacitors. A nearly constant DC voltage is important since it directly affects
the control speed and effectiveness of the SSSC. ΔEd is the main factor in affecting the injected active
power, thus ΔEd can be used to adjust the dc capacitor voltage around its reference value. By
combining the controls for dc voltage and transmission line active power flow, a constrained
decoupled PI control algorithm for SSSC is given by:
(6.20)
(6.21)
In implementation, these quantities are combined with the initial operating point and converted into a
modulation index ma and phase shift α such that
(6.22)

Chapter 6. The SSSC Connection between Oman and UAE
115
(6.23)
Where Eq = Eq0 + ΔEq, Ed = Edo + ΔEd, (6.24)
Eq0= ktr ma0 Vdc sin(α + θ1) (6.25)
Ed0= ktr ma0 Vdc cos(α + θ1) (6.26)
Figure 6-3: simulated SSSC control schematic in between Oman and United Arab Emirates
6.1.4. SSSC model’s distributed control:
Appendix 6.A introduced and demonstrated that the SSSC control model’s three distributed control
limits are defined as minimum, medium and maximum. These deviations are compensated at three
operating limits by adjusting the SSSC control device with corresponding P & I control values as
stated in Appendix 6.A Table. The SSSC control device oscillates based on the corresponding P & I
value of each limit in between at +/-2%, +/-4% and +/-6% deviation at both sides of the transmission
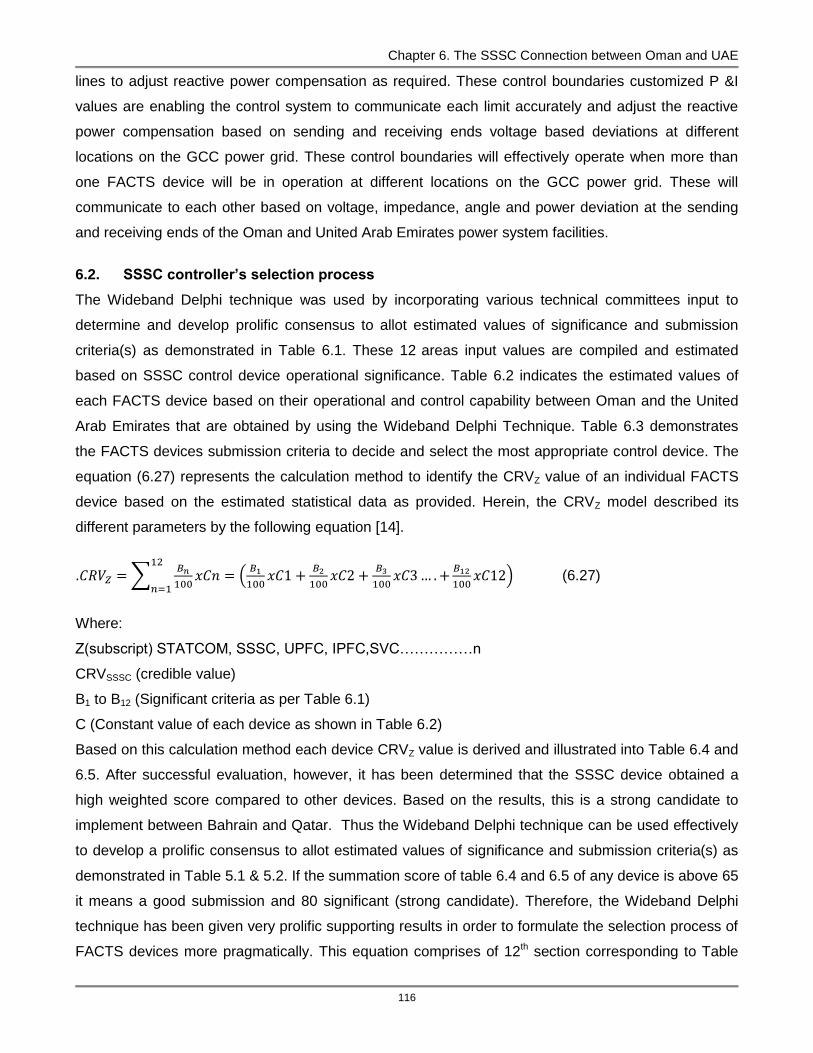
Chapter 6. The SSSC Connection between Oman and UAE
116
lines to adjust reactive power compensation as required. These control boundaries customized P &I
values are enabling the control system to communicate each limit accurately and adjust the reactive
power compensation based on sending and receiving ends voltage based deviations at different
locations on the GCC power grid. These control boundaries will effectively operate when more than
one FACTS device will be in operation at different locations on the GCC power grid. These will
communicate to each other based on voltage, impedance, angle and power deviation at the sending
and receiving ends of the Oman and United Arab Emirates power system facilities.
6.2. SSSC controller’s selection process
The Wideband Delphi technique was used by incorporating various technical committees input to
determine and develop prolific consensus to allot estimated values of significance and submission
criteria(s) as demonstrated in Table 6.1. These 12 areas input values are compiled and estimated
based on SSSC control device operational significance. Table 6.2 indicates the estimated values of
each FACTS device based on their operational and control capability between Oman and the United
Arab Emirates that are obtained by using the Wideband Delphi Technique. Table 6.3 demonstrates
the FACTS devices submission criteria to decide and select the most appropriate control device. The
equation (6.27) represents the calculation method to identify the CRVZ value of an individual FACTS
device based on the estimated statistical data as provided. Herein, the CRVZ model described its
different parameters by the following equation [14].
.
(6.27)
Where:
Z(subscript) STATCOM, SSSC, UPFC, IPFC,SVC……………n
CRVSSSC (credible value)
B1 to B12 (Significant criteria as per Table 6.1)
C (Constant value of each device as shown in Table 6.2)
Based on this calculation method each device CRVZ value is derived and illustrated into Table 6.4 and
6.5. After successful evaluation, however, it has been determined that the SSSC device obtained a
high weighted score compared to other devices. Based on the results, this is a strong candidate to
implement between Bahrain and Qatar. Thus the Wideband Delphi technique can be used effectively
to develop a prolific consensus to allot estimated values of significance and submission criteria(s) as
demonstrated in Table 5.1 & 5.2. If the summation score of table 6.4 and 6.5 of any device is above 65
it means a good submission and 80 significant (strong candidate). Therefore, the Wideband Delphi
technique has been given very prolific supporting results in order to formulate the selection process of
FACTS devices more pragmatically. This equation comprises of 12th section corresponding to Table

Chapter 6. The SSSC Connection between Oman and UAE
117
6.1 as an input data from B1 to B12 this is also called the nominator and first part of the equation
(6.27). These 12 areas total output value must be equal to 100. This is also called the denominator
and second part of the equation (6.27). Third part of the equation is “C1 to C12” this is submission
value of each segment of 12 areas as demonstrated into Table 6.2. During the calculation process the
numerator is divided by the denominator and multiple with “C1 to C12” values in order to get final
value of the each segment as indicated in Table 6.4. (See section 5.2 for further details about the
WBD)
TABLE 6.1: SSSC DEVICES CRITERIA SIGNIFICANCE
S.No Criteria Weight (%)
S.No Criteria Weight (%)
1 Control Significance
15 7 Refuse Disposal
5
2 Control Integration
10 8 Monitoring Equipment
5
3 Design Capacity
5 9 Simulation Results
5
4 Reliability 10 10 Capex 10
5 Maintenance frequency
15 11 Opex 10
6 Availability for field trial
5 12 Post Installation Support
5
Total 100
TABLE 6.2: SSSC DEVICE ESTIMATED SCORE
Device Submission Score Device
Submission Score
TCVR 46 STATCOM 68 TCPAR 49 SVC 57 UPFC 63 GCSC 41 IPFC 59 TSSC 36 SSSC 74.3 TCSC 43
TABLE 6.3: FACTS DEVICES SUBMISSION CERITERIA SCOREBOARD
Criteria Description : Submission Score
No submission of any consequence : 0 Some submission but unacceptably
low : 20
Satisfactory : 50
Good submission : 65
Significantly above the minimum acceptable. Considered a strong
candidate.
: 80
Exceptional submission : 100
TABLE 6.4: CALCULATED SCORE BY USING EQUATION 6.27
Criteria B 1…12 C 1…12 Equation (5.8) Weighted Score
Control Significance 15 67
(B1/100).C1 10
Control Integration 10 90
(B2/100).C2 9
Design Capacity 5 96 (B3/100).C3 4.8
Reliability 10 95
(B4/100).C4 9.5
Maintenance frequency 15 60 (B5/100).C5 9

Chapter 6. The SSSC Connection between Oman and UAE
118
Availability for trial 5 98 (B6/100).C6 4.9 Refuse disposal 5 96 (B7/100).C7 4.8 Monitoring equipment 5 96 (B8/100).C8 4.8 Simulation results 5 94 (B9/100).C9 4.7 Capex 10 85 (B10/100).C10 8.5
Opex 10 95 (B11/100).C11 9.5 Post Installation Support 5 96 (B12/100).C12 4.8 Total 100 - - 74.3
TABLE 6.5: SSSC DEVICES CALCULATED SCORE AGAINST THE OTHER DEVICES
Static Shunt Compensator Static Series Compensator
STATCOM SVC GCSC TSSC SSSC
S.No Weighted Score
Weighted Score
Weighted Score
Weighted Score
Weighted Score
1 7.8 6.7 4.8 4.1 10 2 8.2 7 5 4.3 9 3 6.1 5.2 3.7 3.2 4.8 4 7.5 6.4 4.6 4 9.5 5 6.8 5.8 4.2 3.6 9 6 4.4 3.8 2.7 3 4.9 7 5.4 4.6 3.3 3 4.8 8 5.1 4.4 3.1 3 4.8 9 4.4 3.8 3.5 2.5 4.7
10 4.4 3.8 3.5 3 8.5 11 4.5 3.5 3 3 9.5
12 4.4 4 3.5 3.3 4.8 Total 69.0 59.0 45 40 74.3
TABLE 6.6: SSSC DEVICES CALCULATED SCORE AGAINST THE OTHER DEVICES
Static voltage and phase Angle control
Combined Compensator
Static Series Compensator
TCVR TCPAR UPFC IPFC TCSC
S.No Weighted Score
Weighted Score
Weighted Score
Weighted Score
Weighted Score
1 5.3 5.7 7.2 6.8 4.9
2 5.6 5.9 7.6 7.1 5.2 3 4.2 4.5 5.7 6 3.9
4 5.1 5.4 6.9 6.5 4.7 5 4.7 5 6.3 5.9 4.3 6 3 3.2 4.5 4.5 2.8
7 4 4 5 4.7 3.4
8 4 3.7 4.7 4.4 3.3 9 3 4 4.5 4 3.5 10 3 4 4.3 4 3 11 3 3.5 3.8 4 2.6 12 3 3.1 3.5 4 2.4
Total 48 52 65 62 44
TABLE 6.7: DEFINED POWER AND SYSTEM’S VOLTAGE
Country Id
Country Name
Power ID
Mw Voltage ID
Line Voltage kV
C1 Kuwait PC1 1200 V1 400 C2 Saudi Arabia PC2 1200 V2 400 C3 Bahrain PC3 600 V3 400 C4 Qatar PC4 750 V4 400 C5 Oman PC5 400 V5 220
C6 United Arab Emirates
PC6 900 V6 400
C6 United Arab Emirates
PC7 400 V7 220
6.3. SSSC model’s case study (Oman & United Arab Emirates):

Chapter 6. The SSSC Connection between Oman and UAE
119
Table 6.8, 6.9 and 6.10 indicates the SSSC input data that is used to develop and simulate the SSSC
control model. A 250-Mvar SSSC control model was developed to adjust converter output voltage in
order to maintain the 220kV AC system long transmission line in Oman and the United Arab Emirates.
In the steady operation of SSSC control device maintain the Voltage source converter’s fundamental
components in-phase with the AC system in between Oman and UAE. In the first scenario if the
converter output voltage is higher than the system voltage than the SSSC generates the reactive
power to increase the system voltage against the reference value. If the AC system voltage is higher
than the converter output voltage than the SSSC absorbs reactive power from the system to reduce
the voltage. It has been identified and determined that the amount of reactive power depends on the
VSC voltage magnitude and on the transformer leakage reactance. The voltage source converter
components are controlled by varying the DC bus voltage. In order to charge or discharge the
capacitor bank of the SSSC the VSC (Voltage source converter) is temporarily phase shifted to flow
active power to the capacitor bank. Figure 6-4 Illustrates the 400 MW power exchanged between
Oman and the United Arab Emirates into the shared GCC Power grid. As shown by the waveforms,
the transmission line voltage and reactive current are well controlled by implementing the optimized
control technique with a high degree of precision [45], [59]
TABLE 6.8: POWER, VOLTAGE AND FREQUENCEY
Countries
Power Exchange,
Voltage & Frequency
To/from Oman power transmission network 400MW, 220kV, 50Hz To/from United Arab Emirates transmission network 900MW, 220kV, 50Hz
TABLE 6.9: EXISTING REACTIVE POWER AND DISTANCE
Existing Power System
Reactive Power
Distance
Reactive Power Demand at Al-Ghunan substation KSA
500MVAR Al Fadhili substation (KSA) to Al-Ghunan Substation (KSA) =114
Km Reactive Power Demand at Al
Jasra substation Bahrain 850MVAR Al-Ghunan Substation (KSA) to
Slawa Substation (Qatar) = 288Km Reactive Power demand at Al-
Salwa Substation 500MVAR Slawa Substation (Qatar) to Doha
South Substation = 97Km Reactive Power demand at
Doha South Substation 250MVAR
TABLE 6.10: MULTIVARIABLE CONTROLLER’S CONFIGURATION OF THE SSSC
SSSC LOCATION: Series connected at Al-wasset substation in between
Oman and United Arab Emirates
Iq regular: Kp 12dB;
Ki: 35dB
CC2 and LC2 = minimum compensation capacitive or
inductive (VC voltage change from 1 to 2%)
Rated SSSC: +/- 250 MVAR
Ref V: 1.0 pu (220kV)
CC22 and LC22 = medium compensation capacitive or
inductive (VC voltage change from 2% to 4%)
P (proportional): 0.32 , 0.42 and 0.52 I (integral) 0.6, 0.8, 0.9, 1.1
D (derivative): none
Droop: 0.033pu/100MVA;
Kp:14dB; Ki: 3500dB
CC222 and LC222 = full compensation capacitive or
inductive (VC voltage change from 4-6%)

Chapter 6. The SSSC Connection between Oman and UAE
120
6.3.1. SSSC optimized dynamic response:
Figure 6-4 shows the operations of the SSSC, and it controls the AC system voltage against the set
reference voltage 1.0 pu. Effectively to control the deviation the regulator is maintaining voltage droop
0.035 pu/100 VA. Based on the voltage deviation the SSSC device changes its operating point from
full capacitive or inductive (+/-250Mvar) as demonstrated into Figure 6-5. The first waveform of the
SSSC controller in voltage control mode and demonstrate voltage variation between 0.95 to 1.05 pu.
The VSC (voltage source converter) is set at 1.045pu, which maintain SVC terminal voltage 1.0pu and
the SSSC controller is out of operation. Initially the SSSC is floating at zero current and the reference
voltage set at 1.0pu and the DC bust voltage is 20kV. After 0.15s the voltage drastically decreased by
2.7% (0.982pu) of the normal voltage of the AC system. Based on the deviation the SSSC actives and
inject 250Mvar to the AC system in order to maintain 0.985pu of the normal voltage. After 45ms the
DC bus voltage increased accordingly and the AC system voltage also reached at 1.05pu within 0.3s
of its normal voltage. Based on this the deviation the SSSC activates and absorb reactive power
250Mvar from the AC system in order to maintain theca system voltage 0.95pu [47].
It has also been observed that the SSSC current changed from capacitive to inductive within one
cycle. After 0.65s the voltage source converter (VSC) set back to normal value based on the deviation.
The second waveform indicates the phase Iabc current during the above-mentioned SSSC operations.
i) The third waveform indicates the magnitude of voltage injected against the reference voltage.
ii) The third waveform indicates the measured DC voltage (15kV/Maximum) during the inductive or
capacitive mode of SSSC operations.
iii) The fourth waveform indicates the Real power being exchanged in between United Arab Emirates
and Oman during SSSC operations.
iv) The fourth waveform indicates the required reactive power being injected in between United Arab
Emirates and Oman during SSSC operations.
In Figure 6-5, it can be seen that both sides of network voltages are improved which are controlled
precisely to optimize SSSC operations in order to exchange the required power from both sides of the
United Arab Emirates and Oman on the GCC power grid.
6.3.2. Effectiveness of the SSSC control device:
Figure 6-4 indicates the receiving ends voltage without SSSC in between the United Arab Emirates
and Oman. Figure 6-5 shows the improved voltage with SSSC at both receiving ends at the United
Arab Emirates and Oman.. These results obtained after implementation of PID new configuration
control parameters. Figure 6-5 further demonstrates the SSSC effectiveness on the GCC power grid.

Chapter 6. The SSSC Connection between Oman and UAE
121
(pu)
(pu)
(pu)
(kV)
MW
Mvar
(f)
In the first trace, the waveforms show Vref (magenta trace) and measured voltage (yellow trace)
variation from 1pu to 0.98pu and 1pu to 1.03pu. In the second trace, the variations in Iqref (magenta
trace) and Iq(yellow trace) waveforms are observed. It is noticed that the measured Iq _ oscillated
from -1.8pu to 1.7pu on the same path of Iq_ reference and, it then leveled to a steady state value
after 0.35 s.
In the third trace, a variation in real and reactive powers P and Q are observed; the Q value oscillates
to compensate the required reactive power as per defined boundary from -1pu to 1pu(+/- 250 Mvar).
In the last trace, the behavior of alpha angle is observed; in this case, there is small oscillation from
0.05 to 0.1 s. In order to enforce a corrective action to minimize the error, all observations are
addressed by adjusting the control parameters precisely by considering adequate safety and security
margins [36], [37].
Time in seconds
Figure 6-4: Network operational trends without SSSC (a) voltage injection (b) Iabc current (c) injection voltage magnitude and reference voltage (d) DC voltage
(e) power exchange in between Oman and UAE (f) reactive compensation in between Oman and UAE
(a)
(b)
(c)
(d)
(e)
(f)
(f)
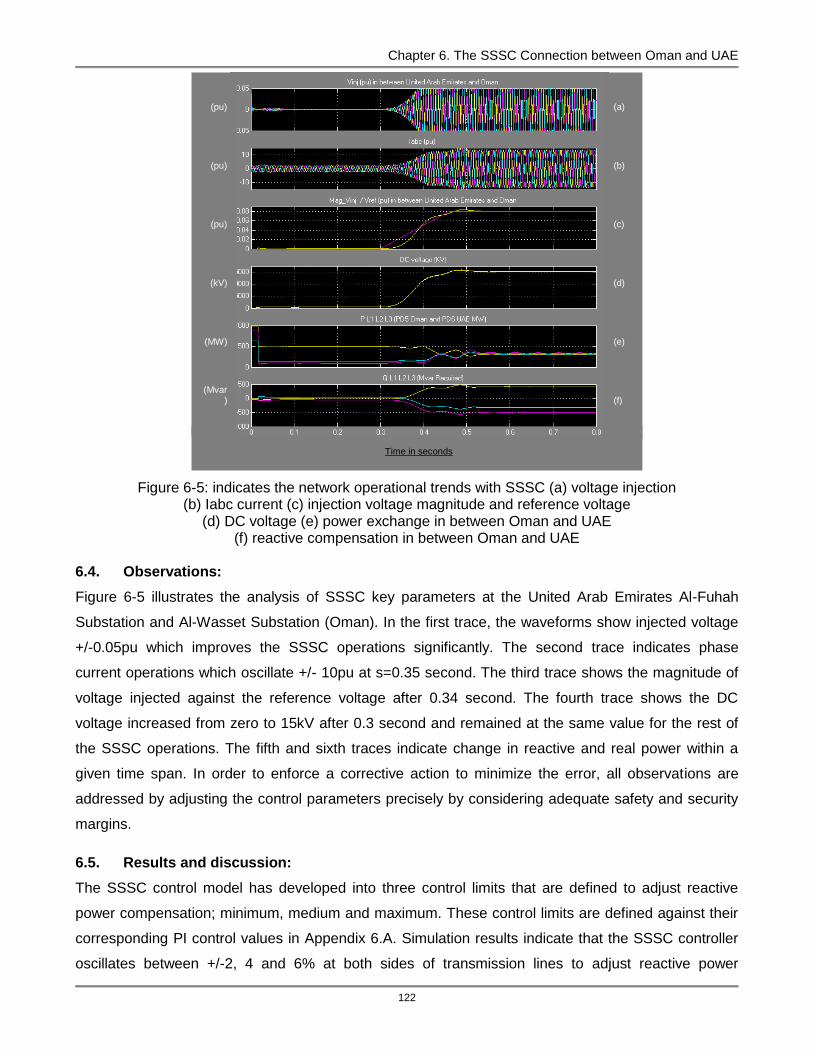
Chapter 6. The SSSC Connection between Oman and UAE
122
Time in seconds
Figure 6-5: indicates the network operational trends with SSSC (a) voltage injection
(b) Iabc current (c) injection voltage magnitude and reference voltage (d) DC voltage (e) power exchange in between Oman and UAE
(f) reactive compensation in between Oman and UAE
6.4. Observations:
Figure 6-5 illustrates the analysis of SSSC key parameters at the United Arab Emirates Al-Fuhah
Substation and Al-Wasset Substation (Oman). In the first trace, the waveforms show injected voltage
+/-0.05pu which improves the SSSC operations significantly. The second trace indicates phase
current operations which oscillate +/- 10pu at s=0.35 second. The third trace shows the magnitude of
voltage injected against the reference voltage after 0.34 second. The fourth trace shows the DC
voltage increased from zero to 15kV after 0.3 second and remained at the same value for the rest of
the SSSC operations. The fifth and sixth traces indicate change in reactive and real power within a
given time span. In order to enforce a corrective action to minimize the error, all observations are
addressed by adjusting the control parameters precisely by considering adequate safety and security
margins.
6.5. Results and discussion:
The SSSC control model has developed into three control limits that are defined to adjust reactive
power compensation; minimum, medium and maximum. These control limits are defined against their
corresponding PI control values in Appendix 6.A. Simulation results indicate that the SSSC controller
oscillates between +/-2, 4 and 6% at both sides of transmission lines to adjust reactive power
(pu)
(pu)
(pu)
(kV)
(MW)
(Mvar)
(a)
(b)
(c)
(d)
(e)
(f)
Chapter 6. The SSSC Connection between Oman and UAE
123
compensation as required. These control boundaries will communicate and adjust reactive power
based on sending and receiving ends voltage deviation. The controller will oscillate and inject or
absorb controlled reactive power based on corresponding PI controller values of each operating
boundary as demonstrated in Appendix 6.A. These control boundaries will effectively operate when
more than one FACTS device will be in operation at different locations on the GCC power grid in order
to share 900 MW power from UAE and 400 MW power from Oman. These will communicate to each
other based on voltage, impedance, angle and power deviation at the sending and receiving ends of
the AC power system.
The prime aim of the SSSC application in the GCC power grid transmission line compensation is the
subject of considerable interest. The results show that SSSC is a versatile equipment with outstanding
dynamic capability, as aforementioned, and is able to provide reliable continuous control to the power
transmission line current, provide dynamic control of power flow, reduce fault current, damps SSR
oscillation, improves the voltage profile, the power angle and the stability margin between Oman and
the United Arab Emirates. Based on these results, SSSC is a very strong candidate to be
implemented on the GCC power grid. It also exhibits a positive impact on neighboring countries’ power
system operations on the GCC power grid.
6.6. Summary:
In this chapter, the SSSC device model demonstrates its strong impact on stability and medium impact
on power flow between Oman and the United Arab Emirates. The Oman power network shares the
400MW power and United Arab Emirates power network shares the 900MW.
Collectively, this device will enhance power system stability and power flow in order to share 900MW
power from the United Arab Emirates and 400MW power from Oman to meet industrial and domestic
loads requirements at different atmospheric (summer/winter) operating conditions on the GCC power
grid. Hereby, the GCC power system background and viabilities are also addressed as well as the
SSSC reinforcement plan. In addition to that, the SSSC control model’s new control optimization and
device selection techniques are described in detail and its application in order to resolve various
control and operational issues precisely. Based on these control techniques three control limits along
with corresponding PID new control values are incorporated into the SSSC model and simulated as
demonstrated in appendix 6.A. These control techniques are providing a lot of confidence to operate
SSSC device independently or jointly (integrated) as further discussed in chapter 9.
124
7.1. Introduction:-
The proposed work is a non-traditional novel optimization technique that has been adopted to optimize
the various UPFC control and operating parameters that contribute notably to control UPFC device
operations in a power system network during any undesired condition. The UPFC controller is a
strong candidate to provide a full dynamic control of Power transmission operating parameters:
voltages, line impedance, and phase angle. Herein, the UPFC applications are investigated to analyze
viability in order to improve the power transmission control and enhance operational performance from
one grid to another grid at the GCC power system. This research presents a novel control and
operation of a UPFC connecting the Kingdom of Saudi Arabia (KSA) and Kuwait in the Gulf
Cooperative Council Interconnection. The proposed control optimizes UPFC control parameters,
improving the UPFC performance at different transmission contingencies. The credibility of the
proposed control is evaluated through a set of time simulations. The results have clearly shown an
increase of the loadability, reduction of the losses and enhancement of the sustainability on the GCC
Interconnection. The GCC region has become a hub of major economic growth in the world. It is
providing financial support and incentives to the GCC countries. Hereby, it has witnessed population
growth and large scale industrial activities in the GCC countries. This has led to increased demand for
electricity. Based on various analyses, we determined that the current demand for GCC power
consumption is about 60 GW and it is projected that it will reach 180 GW within next 25 years. In order
to maintain a reliable, sustainable, and well-controlled power transfer between the GCC countries, it
has been decided to interconnect the GCC countries. The interconnection is divided into two basic
segmental links, neighbor-to-neighbor and common-link topologies. Firstly, Oman and the United Arab
Emirates are interconnected through neighbor-to-neighbor control topologies. Secondly, Qatar,
Bahrain, Saudi Arabia and Kuwait are interconnected through common-link control topology and this is
also known as the Northern System. In the third stage common-link topology demonstrates UAE
national grid and Oman northern grid interconnection; this is known as southern systems. Thirdly,
southern and northern power systems are connected through hybrid link control topology. However, to
improve these interconnected topologies, a large numbers of studies have been conducted to
determine the technical and economical viability of the interconnection. The studies also demonstrate
areas that require additional control devices. FACTS controllers are, therefore, strong candidates’
technology options. Applications of FACTS Controllers will result into the following benefits [1], [2]. (1)
Enhanced Power Transfer capability in the GCC power grid. (2) Enhanced the GCC power grid’s
The UPFC connecting the Kingdom of Saudi Arabia and Kuwait in the GCC interconnection
CHAPTER 7

Chapter 8 HVDC Case Study
125
operational reliability. (3) Enhanced the GCC power grid’s controllability. Figure 7-1 illustrates the
designed power exchange in between the GCC countries and Figure 7-2 indicates the location of
UPFC and an inter-tie connection in between the GCC countries and Figure 7-3 shows the simulated
model of the UPFC device. Prime contributions of this research work are as listed below.
i) Investigate the UPFC impact on GCC power grid with new PID controller optimization technique.
ii) Investigate the GCC power grid operations with and without UPFC control device
The rest of this research case study is structured as follows. In section, 7.2 and 7.3 GCC power
system background and UPFC reinforcement plan are described. In section 7.4, 7.5, 7.6 UPFC Model
description, operational strategy and operating performance are described. In section 7.7, 7.8
discussion, and conclusion are presented.
Al Fadhli
Interconnection
310 km
Bahrain
600 MW
UAE
900 MWOman
400 MW
Ghunan
Interconnection
113km
Salwa
Interconnection
290 km
Al-sila & Al-Fuhah
Interconnection
150 km
Legends:
400kV Lines
220kV Lines
Qatar
750 MW
SSSC
STATCOMUPFC
PI Control
Independent
controller
Saudi Arabia
1200 MW
HVDC
Back-to-Back
Kuwait
1200 MW
Figure 7-1: location of UPFC device in between the Kingdom Saudi Arabia and Kuwait
7.1.1. GCC interconnection background:
The GCC power grid is designed to operate in eight strategic directions to meet sustainability and
operational reliability requirements as demonstrated in Figure 7-2. The first section is a double-circuit
400 kV, 50 Hz line stretched from Al Zour (Kuwait) to Ghunan (KSA) with an intermediate connection
at Fadhili (KSA) power facilities. The second section is a back-to-back HVDC tie interconnecting the
380 kV, 60 Hz, system at Fadhili in the KSA. The third section is a double circuit 400 kV overhead line
stretched and partially connected with a submarine cable from Ghunan (KSA) substation to Al Jasra
(Bahrain). The fourth section is a double circuit 400 kV line stretched from Ghunan (KSA) to Salwa
(Qatar) along with its associated substations. The fifth section is a double circuit 400 kV line stretched
from Salwa (Qatar) and its associated substations. The sixth section is a double circuit 400 kV, 50 Hz
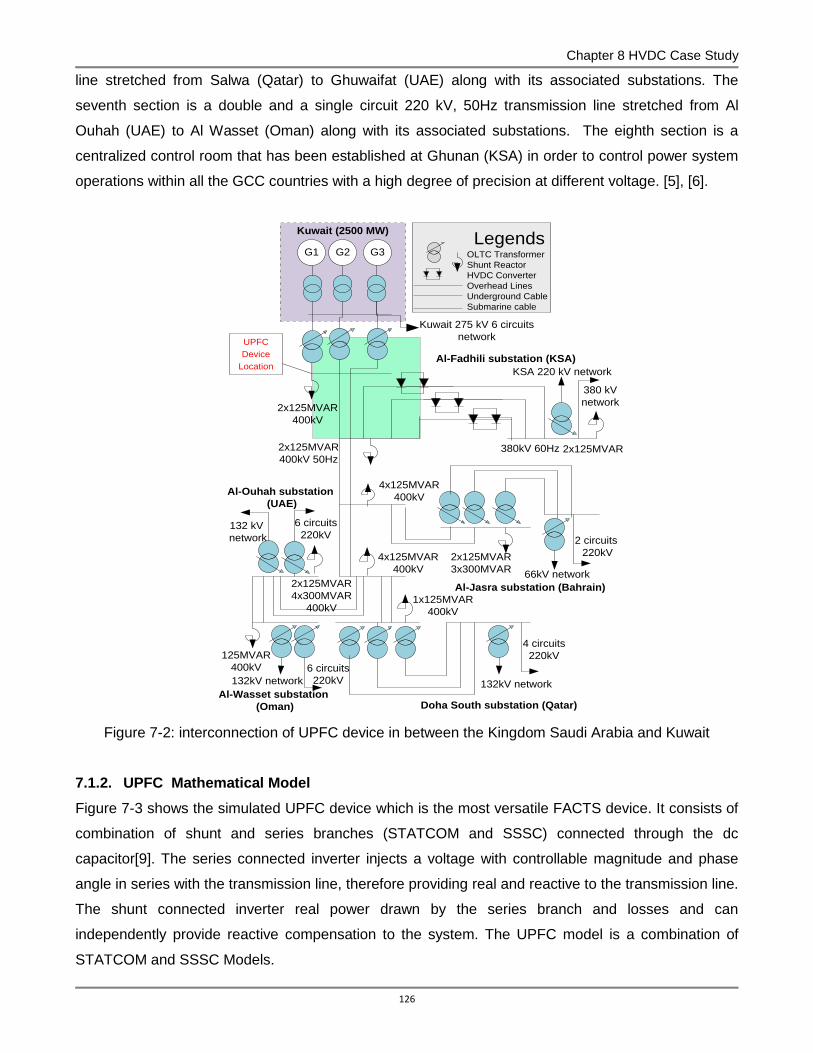
Chapter 8 HVDC Case Study
126
line stretched from Salwa (Qatar) to Ghuwaifat (UAE) along with its associated substations. The
seventh section is a double and a single circuit 220 kV, 50Hz transmission line stretched from Al
Ouhah (UAE) to Al Wasset (Oman) along with its associated substations. The eighth section is a
centralized control room that has been established at Ghunan (KSA) in order to control power system
operations within all the GCC countries with a high degree of precision at different voltage. [5], [6].
Kuwait (2500 MW)Legends
OLTC Transformer
Shunt Reactor
HVDC Converter
Overhead Lines
Underground Cable
Submarine cable
Kuwait 275 kV 6 circuits
network
KSA 220 kV network
380 kV
network
380kV 60Hz2x125MVAR
400kV 50Hz
2x125MVAR
400kV
4x125MVAR
400kV
4x125MVAR
400kV
2x125MVAR
3x300MVAR
1x125MVAR
400kV
2 circuits
220kV
66kV network
4 circuits
220kV
132kV network
132 kV
network
132kV network
6 circuits
220kV
6 circuits
220kV
2x125MVAR
4x300MVAR
400kV
125MVAR
400kV
G1 G2 G3
2x125MVAR
Doha South substation (Qatar)
Al-Jasra substation (Bahrain)
Al-Fadhili substation (KSA)
Al-Wasset substation
(Oman)
Al-Ouhah substation
(UAE)
UPFC
Device
Location
Figure 7-2: interconnection of UPFC device in between the Kingdom Saudi Arabia and Kuwait
7.1.2. UPFC Mathematical Model
Figure 7-3 shows the simulated UPFC device which is the most versatile FACTS device. It consists of
combination of shunt and series branches (STATCOM and SSSC) connected through the dc
capacitor[9]. The series connected inverter injects a voltage with controllable magnitude and phase
angle in series with the transmission line, therefore providing real and reactive to the transmission line.
The shunt connected inverter real power drawn by the series branch and losses and can
independently provide reactive compensation to the system. The UPFC model is a combination of
STATCOM and SSSC Models.
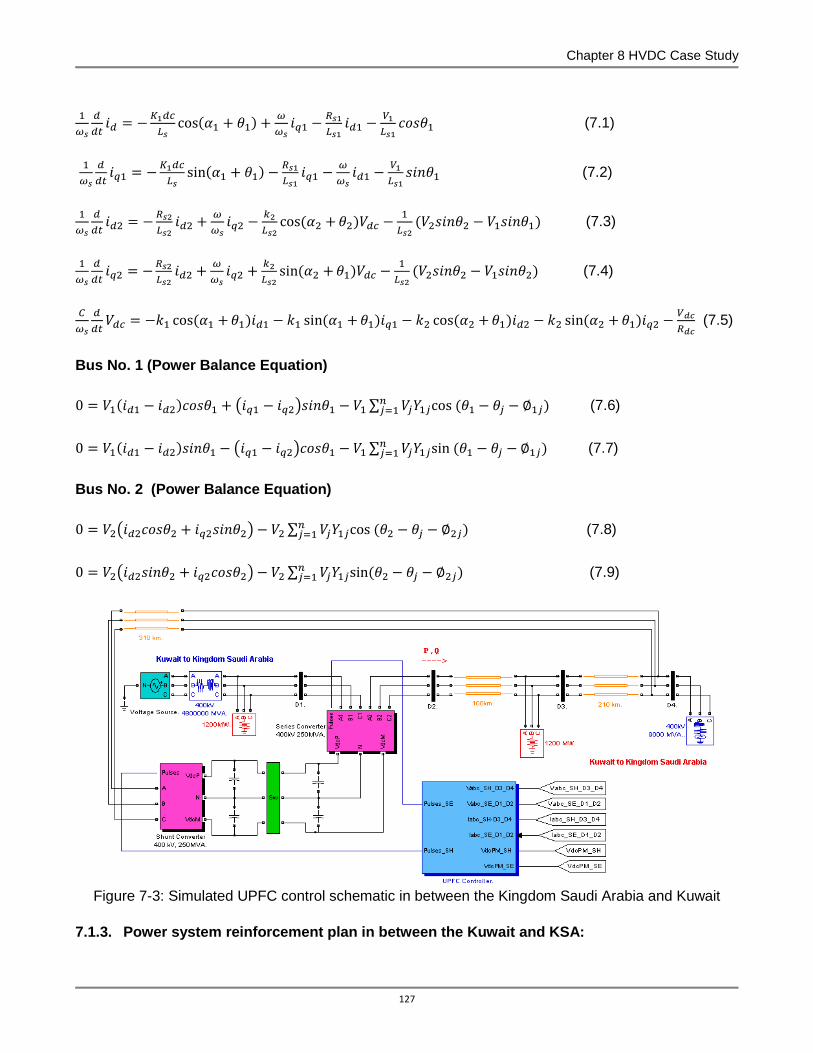
Chapter 8 HVDC Case Study
127
(7.1)
(7.2)
(7.3)
(7.4)
(7.5)
Bus No. 1 (Power Balance Equation)
(7.6)
(7.7)
Bus No. 2 (Power Balance Equation)
(7.8)
(7.9)
Figure 7-3: Simulated UPFC control schematic in between the Kingdom Saudi Arabia and Kuwait
7.1.3. Power system reinforcement plan in between the Kuwait and KSA:

Chapter 8 HVDC Case Study
128
Various analyses have been carried out to identify and determine the system requirements. In this
study, recommendations have been provided against the findings to resolve system normal, single
contingency and double contingency system problems in the downstream Kingdom of Saudi Arabia
area. The comprehensive reinforcement plan for the Kingdom of Saudi Arabia area includes the
following [5], [6]:
i) High capacity 10,000MVA, 400kV line in between Kuwait and Kingdom of Saudi Arabia stations
ii) A 500 MVA UPFC at the Kingdom of Saudi Arabia station fully utilize the high capacity of 400kV
line to the GCC power grid, provide dynamic voltage support and control several mechanical
switched capacitors in the area.
iii) Series reactors to constrain loading on existing thermal-limited facilities
7.1.4. UPFC model’s distributed control
In the Appendix 7.A the introduced and demonstrated UPFC control model’s three distributed control
limits are minimum, medium and maximum control and operational deviation. These deviations are
compensated at three operating limits by adjusting UPFC control device with corresponding P & I
control values as stated in Appendix 7.A. The SSSC control device oscillates based on corresponding
P & I value of each limit in between at +/-2%, +/-4% and +/-6% deviation at both sides of transmission
lines to adjust reactive power compensation as required. These control boundaries customized P & I
values which are enabling the control system to communicate each limit accurately and adjust the
reactive power compensation based on sending and receiving ends voltage based deviations at
different locations on the GCC power grid. These control boundaries will effectively operate when
more than one FACTS device will be in operation at a different location on the GCC power grid. These
will communicate to each other based on voltage, impedance, angle and power deviation at sending
and receiving ends of the Kingdom Saudi Arabia and Kuwait power system facilities.
7.2. UPFC controller’s selection process
The Wideband Delphi technique was used by incorporating various technical committees input to
determine and develop prolific consensus to allot estimated values of significance and submission
criteria(s) as demonstrated in Table 7.1. These 12th areas input values are compiled and estimated
based on UPFC control device operational significant. Table 7.2 indicates the estimated values of
each FACTS device based on their operational and control capability in between the Kingdom Saudi
Arabia and Kuwait that are obtained by using the Wideband Delphi Technique. Table 7.3
demonstrates the FACTS devices submission criteria to decide and select an appropriate control
device. The equation (7.1) represents the calculation method to identify CRVZ value of individual
FACTS device based on their estimated statistical data as provided. Herein, CRVZ model described its
different parameters by the following equation [14].
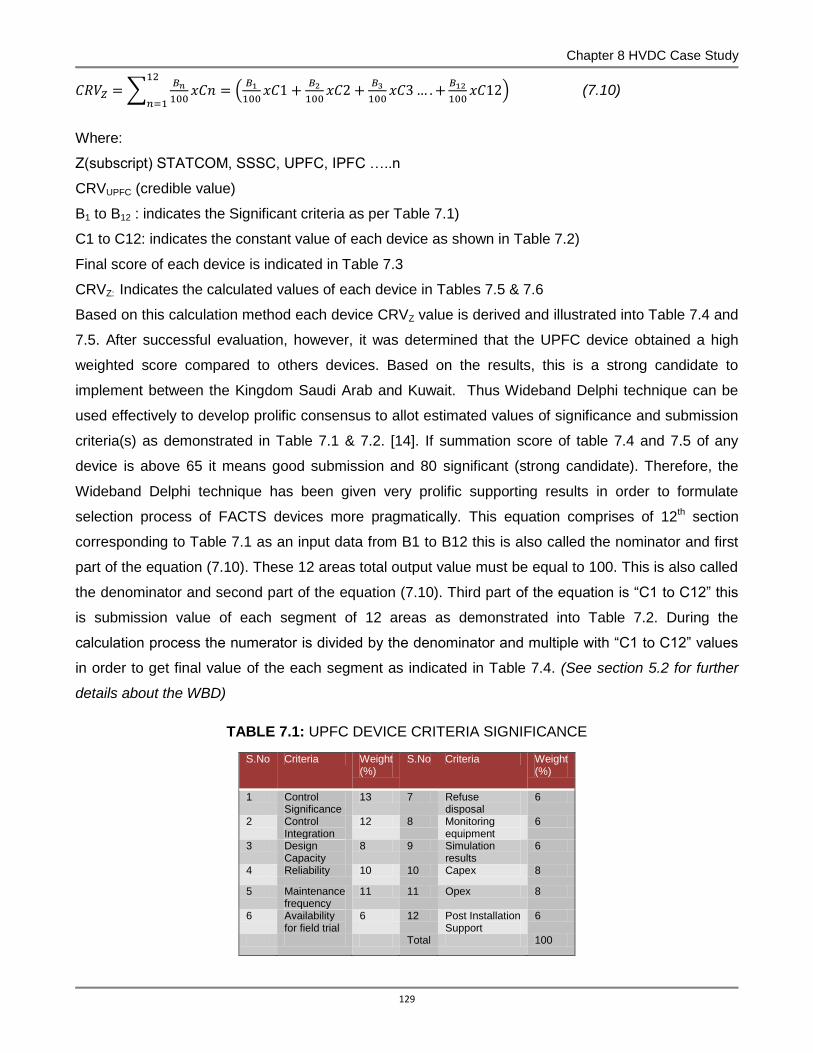
Chapter 8 HVDC Case Study
129
(7.10)
Where:
Z(subscript) STATCOM, SSSC, UPFC, IPFC …..n
CRVUPFC (credible value)
B1 to B12 : indicates the Significant criteria as per Table 7.1)
C1 to C12: indicates the constant value of each device as shown in Table 7.2)
Final score of each device is indicated in Table 7.3
CRVZ: Indicates the calculated values of each device in Tables 7.5 & 7.6
Based on this calculation method each device CRVZ value is derived and illustrated into Table 7.4 and
7.5. After successful evaluation, however, it was determined that the UPFC device obtained a high
weighted score compared to others devices. Based on the results, this is a strong candidate to
implement between the Kingdom Saudi Arab and Kuwait. Thus Wideband Delphi technique can be
used effectively to develop prolific consensus to allot estimated values of significance and submission
criteria(s) as demonstrated in Table 7.1 & 7.2. [14]. If summation score of table 7.4 and 7.5 of any
device is above 65 it means good submission and 80 significant (strong candidate). Therefore, the
Wideband Delphi technique has been given very prolific supporting results in order to formulate
selection process of FACTS devices more pragmatically. This equation comprises of 12th section
corresponding to Table 7.1 as an input data from B1 to B12 this is also called the nominator and first
part of the equation (7.10). These 12 areas total output value must be equal to 100. This is also called
the denominator and second part of the equation (7.10). Third part of the equation is “C1 to C12” this
is submission value of each segment of 12 areas as demonstrated into Table 7.2. During the
calculation process the numerator is divided by the denominator and multiple with “C1 to C12” values
in order to get final value of the each segment as indicated in Table 7.4. (See section 5.2 for further
details about the WBD)
TABLE 7.1: UPFC DEVICE CRITERIA SIGNIFICANCE
S.No Criteria Weight (%)
S.No Criteria Weight (%)
1 Control Significance
13 7 Refuse disposal
6
2 Control Integration
12 8 Monitoring equipment
6
3 Design Capacity
8 9 Simulation results
6
4 Reliability 10 10 Capex 8
5 Maintenance frequency
11 11 Opex 8
6 Availability for field trial
6 12 Post Installation Support
6
Total 100
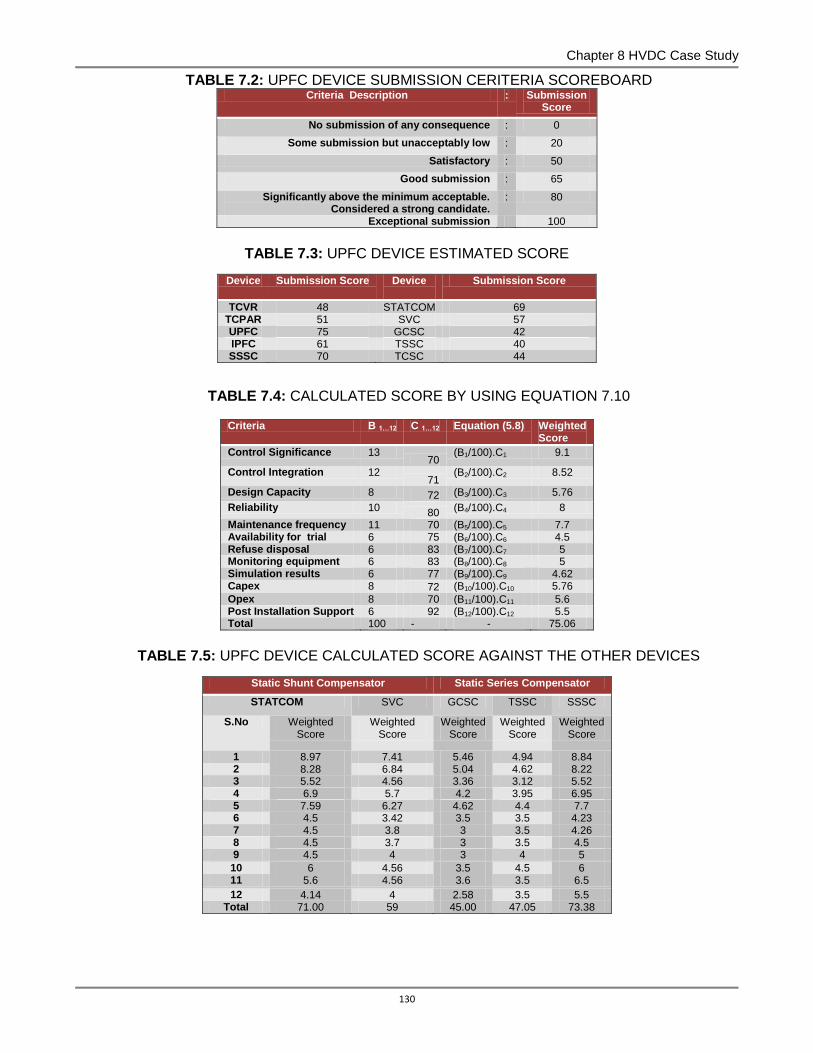
Chapter 8 HVDC Case Study
130
TABLE 7.2: UPFC DEVICE SUBMISSION CERITERIA SCOREBOARD Criteria Description : Submission
Score
No submission of any consequence : 0
Some submission but unacceptably low : 20
Satisfactory : 50
Good submission : 65
Significantly above the minimum acceptable. Considered a strong candidate.
: 80
Exceptional submission 100
TABLE 7.3: UPFC DEVICE ESTIMATED SCORE
Device Submission Score Device
Submission Score
TCVR 48 STATCOM 69 TCPAR 51 SVC 57 UPFC 75 GCSC 42 IPFC 61 TSSC 40 SSSC 70 TCSC 44
TABLE 7.4: CALCULATED SCORE BY USING EQUATION 7.10
Criteria B 1…12 C 1…12 Equation (5.8) Weighted Score
Control Significance 13 70
(B1/100).C1 9.1
Control Integration 12 71
(B2/100).C2 8.52
Design Capacity 8 72 (B3/100).C3 5.76
Reliability 10 80
(B4/100).C4 8
Maintenance frequency 11 70 (B5/100).C5 7.7 Availability for trial 6 75 (B6/100).C6 4.5 Refuse disposal 6 83 (B7/100).C7 5 Monitoring equipment 6 83 (B8/100).C8 5 Simulation results 6 77 (B9/100).C9 4.62 Capex 8 72 (B10/100).C10 5.76
Opex 8 70 (B11/100).C11 5.6 Post Installation Support 6 92 (B12/100).C12 5.5 Total 100 - - 75.06
TABLE 7.5: UPFC DEVICE CALCULATED SCORE AGAINST THE OTHER DEVICES
Static Shunt Compensator Static Series Compensator
STATCOM SVC GCSC TSSC SSSC
S.No Weighted Score
Weighted Score
Weighted Score
Weighted Score
Weighted Score
1 8.97 7.41 5.46 4.94 8.84 2 8.28 6.84 5.04 4.62 8.22 3 5.52 4.56 3.36 3.12 5.52 4 6.9 5.7 4.2 3.95 6.95 5 7.59 6.27 4.62 4.4 7.7 6 4.5 3.42 3.5 3.5 4.23 7 4.5 3.8 3 3.5 4.26 8 4.5 3.7 3 3.5 4.5 9 4.5 4 3 4 5
10 6 4.56 3.5 4.5 6 11 5.6 4.56 3.6 3.5 6.5
12 4.14 4 2.58 3.5 5.5 Total 71.00 59 45.00 47.05 73.38

Chapter 8 HVDC Case Study
131
TABLE 7.6: UPFC DEVICE CALCULATED SCORE AGAINST THE OTHER DEVICES
Static voltage and phase Angle control
Combined Compensator
Static Series Compensator
TCVR TCPAR UPFC IPFC TCSC
S.No Weighted Score
Weighted Score
Weighted Score
Weighted Score
Weighted Score
1 5.85 6.5 9.1 7.8 5.59
2 5.46 6.03 8.52 7.23 5.19 3 3.68 4.04 5.76 4.84 3.48
4 4.65 5.08 8 6.08 4.38 5 5.17 5.61 7.7 6.71 4.84 6 2.85 3.85 4.5 3.68 2.66
7 2.88 3.09 5 3.69 2.67
8 2.91 3.5 5 4 3.5 9 2.94 3,5 4.62 4 3 10 3.96 5.5 5.76 5.5 3.62 11 4 5.8 5.6 5 3.64 12 3.85 6 5.5 4.5 2.75
Total 48.38 55.19 75.06 63.19 45.19
TABLE 7.7: DEFINED POWER AND SYSTEM’S VOLTAGE
Country ID
Country Name
Power ID
Mw Voltage ID
Line Voltage kV
C1 Kuwait PC1 1200 V1 400 C2 Saudi Arabia PC2 1200 V2 400 C3 Bahrain PC3 600 V3 400 C4 Qatar PC4 750 V4 400 C5 Oman PC5 400 V5 220
C6 United Arab Emirates
PC6 900 V6 400
C6 United Arab Emirates
PC7 400 V7 220
7.3. UPFC model operational strategy:
7.3.1. Voltage control:
During system disturbances, mechanically switched shunt capacitor banks and associated control are
generally slow to react, whereas it offered a vulnerable control. To resolve such a situation, UPFC
offered predetermined a reactive power margin to maximize the shunt converter’s dynamic reactive
power reserve for system contingency conditions. However, it ensures that the controllable reactive
power range of shunt converter from (-250 to +250 Mvar) i.e. a maximum control range of 500MVar is
available at all times to compensate for dynamic system disturbances [44], [45].
7.3.2. Power flow control:
With the system facilities at the Kingdom of Saudi Arabia station, the 400kV line loading is to be
maintained at a level that would minimize the system losses. The study indicates that during peak or
near peak load conditions a 1200 MW line loading will minimize the losses. The UPFC therefore is
required to reduce the line loading by injecting reactive power. Hence reactive power flow and
directions are monitored to maintain the dynamic reactive power margin of the shunt inverter. Series
power flow control becomes more important during contingency conditions. Under severe contingency

Chapter 8 HVDC Case Study
132
conditions, the UPFC controlled Kingdom of Saudi Arabia station line will be capable of transferring
1200 MW [47], [48].
7.3.3. Description of the UPFC circuit:
Table 7.8, 7.9, & 7.10 indicates the UPFC input data that is used to develop and simulate the UPFC
device between KSA and Kuwait. The UPFC controller for the Kingdom of Saudi Arabia station was
designed to meet the above mentioned system requirements, to provide fast reactive shunt
compensation with a total control range of +/-500MVAR and control the power flow in the 400kV high
capacity transmission line, forcing the transmitted power under contingency conditions up to 1200
MW. In order to increase the system reliability and provide flexibility for future system changes, the
UPFC controller has to be configured in such way to allow self-sufficient operations of the shunt
converter as an independent STATCOM and series converter as an independent Static Synchronous
Compensator. These converters can be coupled to deliver either shunt only or series only
compensation over a double-control range. Effectively, the actual control algorithms that govern the
instantaneous operations of both converters are performed in the real-time control that employs
multiple digital signal processors. The real time controller communicates the pole via the valve
interface.
TABLE 7.8: POWER, VOLTAGE AND FREQUENCEY
Countries Power Exchange, Voltage & Frequency
Power exchanged from Kuwait to main transmission line 1200MW, 400kV, 50Hz Power exchanged from Kingdom Saudi Arabia to main
transmission line 1200MW, 400kV, 60Hz
DC link to convert 60Hz to 50 Hz
frequency
TABLE 7.9: EXISTING REACTIVE POWER AND DISTANCE
Existing Power System
Reactive Power
Distance
Reactive Power Demand in the KSA (Al-Ghunan substation)
500Mvar KSA (Al Fadhili substation to Al-Ghunan Substation) within KSA =114 KM
Reactive Power Demand in the Bahrian (Al Jasra substation)
850Mvar KSA (Al-Ghunan Substation to Slawa substation) in the (Qatar) = 288KM
Reactive Power demand in the KSA (Al-Salwa Substation)
500Mvar Qatar (Slawa Substation to Doha South Substation) within Qatar = 97KM
Reactive Power demand in the Qatar (Doha South Substation)
250Mvar Qatar (Slawa Substation)

Chapter 8 HVDC Case Study
133
TABLE 7.10: MULTIVARIABLE CONTROLLER’S CONFIGURATION OF THE UPFC
UPFC LOCATION: connected at Al-Fadhili substation in between KSA and Kuwait
Iq regulator: Kp: 10 dB;
Ki 34 dB
CC3 and LC3= minimum compensation capacitive or inductive
(VC voltage change from 0 to 3.5%)
Rated UPFC: +/- 500 MVAR DC balance regulator ;
Kp: 0.0017 dB; Ki:0.017 dB
Ref_V: 1.0 pu (400kV)
CC33 and LC33 = medium compensation capacitive or inductive
(VC voltage change from 3.5 to 7.0%)
P (proportional gain) = 0.55 and 1.32
I(integral time) = 0.65, 0.85, 0.95, 1.01, 1.15
D (derivative time) None
Droop: 0.033 pu/100MVA;
Kp:15dB; Ki: 3400/3600 dB
CC333 and LC333 = full compensation capacitive or inductive (VC voltage change from 7.0 to 10%)
7.4. UPFC operating performance:
7.4.1. Case 1: UPFC changing real power (p):
In this case the UPFC indicates zero injected voltage and the real power flow on the line near the
“natural” 1200 MW from Kuwait Station as indicated in Figure 7-4. The shunt converter is regulating
the Kingdom of Saudi Arabia bus to 1.0 pu by generating required reactive power to the power
transmission system. The prime objective for this case is to maintain the Kingdom of Saudi Arabia bus
voltage and line Q unchanged while there are big step changes in the line real power. The UPFC is
firstly controlled to raise the line power to 1200 MW by injecting a voltage of about 0.78 pu in
quadrature (lagging) with the Kingdom of Saudi Arabia bus voltage. In the meantime to satisfy the
required conditions, the shunt converter drops capacitive output to about 90 Mavr and the series
converter delivers 160MVar capacitive to the line [60].
7.4.2. Case 2: UPFC changing reactive power (Q):
The main objective of this control is to adjust the Kingdom of Saudi Arabia bus voltage at 1.0pu and
keep the line real power, (p) constant while causing large steps in the line reactive power, Q. In the
first swing the UPFC reference Q is changed from +250 Mvar to -250Mvar as indicated in Figure 7-4.
After observing, 200Mvar is being received from the line compared with the 200Mvar delivered to the
line initially. The UPFC forces the change by injecting about 0.05 pu voltage roughly in anti-phase with
V1. The line voltage V2 is as a result reduced in magnitude by about 4.5%. In the second step, the Q
reference is taken to +500 Mvar (500Mvar to the line). In this time the injected voltage is in phase with
V1 so that V2 is increased by 4.5%. The final step reduces the Q reference to zero [23],[24].

Chapter 8 HVDC Case Study
134
(pu)
(pu)
(MW)
(Mvar)
(a)
(b)
(c)
(d)
Time in seconds
Figure 7-4: UPFC control operations (a) measured and reference power (b) measured and reference reactive power (d) three phases real power
(f) three phases reactive power
7.4.3. Case 3: changing local bus voltage:
Figure 7-4 indicates the local bus voltage reference is stepped from an initial value of 0.95 pu to 1.05
pu and back to 0.95. The UPFC successfully holds the line P and Q constant (using very small
changes in injected voltage). While the shunt converter goes from initially output of 120 Mvar to
220Mvar capacitive to 0 Mvar and back to 120 Mvar.
7.4.4. Case 4: UPFC holding unity power factor:
It is very interesting to drive a line at unity power factor, which makes it possible to deliver the largest
amount of real power into the line for the lowest current. This should result in the most efficient use of
the line from a thermal point of view.
7.4.5. Case 5: series converter operating in SSSC mode:
Figure 7-8 indicates the series converter injects into the line essentially in a quadrature with the
prevailing line current. The injection angle deviates from true quadrature to draw real power from the
line for converter losses to charge and discharge the DC bus capacitor bank. By means of the
quadrature voltage injection, the SSSC is able to raise or lower the line current. But it cannot
independently alter the P & Q.
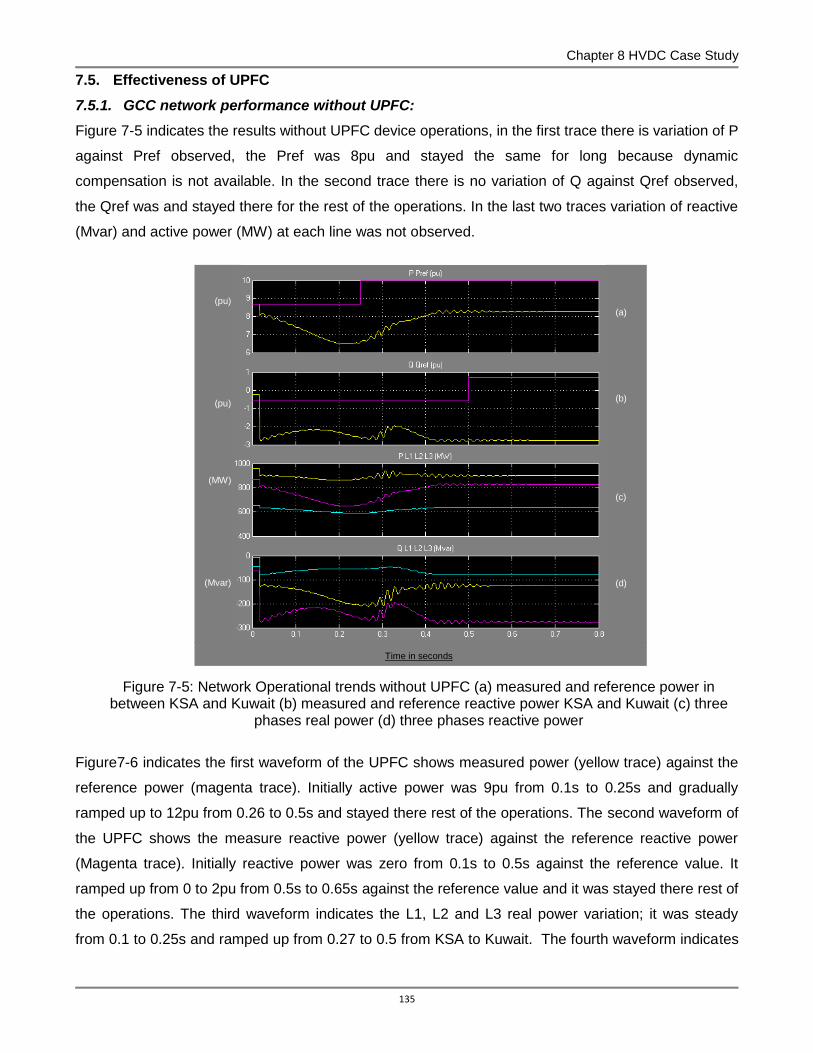
Chapter 8 HVDC Case Study
135
(pu)
(pu)
(MW)
(Mvar)
7.5. Effectiveness of UPFC
7.5.1. GCC network performance without UPFC:
Figure 7-5 indicates the results without UPFC device operations, in the first trace there is variation of P
against Pref observed, the Pref was 8pu and stayed the same for long because dynamic
compensation is not available. In the second trace there is no variation of Q against Qref observed,
the Qref was and stayed there for the rest of the operations. In the last two traces variation of reactive
(Mvar) and active power (MW) at each line was not observed.
Time in seconds
Figure 7-5: Network Operational trends without UPFC (a) measured and reference power in
between KSA and Kuwait (b) measured and reference reactive power KSA and Kuwait (c) three phases real power (d) three phases reactive power
Figure7-6 indicates the first waveform of the UPFC shows measured power (yellow trace) against the
reference power (magenta trace). Initially active power was 9pu from 0.1s to 0.25s and gradually
ramped up to 12pu from 0.26 to 0.5s and stayed there rest of the operations. The second waveform of
the UPFC shows the measure reactive power (yellow trace) against the reference reactive power
(Magenta trace). Initially reactive power was zero from 0.1s to 0.5s against the reference value. It
ramped up from 0 to 2pu from 0.5s to 0.65s against the reference value and it was stayed there rest of
the operations. The third waveform indicates the L1, L2 and L3 real power variation; it was steady
from 0.1 to 0.25s and ramped up from 0.27 to 0.5 from KSA to Kuwait. The fourth waveform indicates
(a)
(b)
(c)
(d)

Chapter 8 HVDC Case Study
136
(pu)
(pu)
(MW)
(Mvar)
the L1, L2 and L3 reactive power variation it was steady from 0.1 to 0.55s and ramped up from 0.57 to
0.65 from KSA to Kuwait.
Time in seconds
Figure 7-6: Network Operational trends with UPFC (a) measured and reference power in between KSA and Kuwait (b) measured and reference reactive power KSA and Kuwait (c) three phases real
power (d) three phases reactive power
7.5.2. Network performance with UPFC:
7.5.2.1. Shunt part of UPFC:
Figure 7-7 is demonstrating the STATCOM operations results in UPFC, in the first trace there is
variation of Vs and Vp voltage at coupling transformer, but significant change observed in Ip primary
side current in following pattern (0.5pu to -0.5pu), (0.2pu to -0.2pu), and (1.0pu to -1.0pu). In the
second trace variation in the Vdc voltage observed, it spiked from 0.001 to 0.1 second dropped at
20kV for 0.55 seconds and rise up to 22kV and stayed there to continue rest of operations. In the third
trace variation in Q_ measure and Q_ ref observed. The Q_ measure shows variation from -0.35pu to
-1.0pu and again oscillated after 0.5 seconds as reactive power demand increased from -0.35pu to
0.85pu and stayed there to continue the rest of the operations. In the last trace, variation in Vref
against V_ measure observed, the V_ measure shows spike 1.01pu within 0.1 second and dropped at
0.99pu in 0.5 second and stayed there to continue the rest of the operations [62].
(a)
(b)
(c)
(d)

Chapter 8 HVDC Case Study
137
(pu)
(kV)
(pu)
(pu)
Time in seconds
Figure 7-7: Shunt part of UPFC control parameters (a) primary and secondary voltage and current (b) measured value of DC voltage (c) measured and reference reactive power (d) measured and
reference voltage
7.5.2.2. Series part of UPFC:
Figure 7-8 is showing the SSSC operations results in UPFC, in the first trace there is variation of Vinj
voltage injected in series, the magnitude was -0.03 to 0.03 for 0.25 seconds and gradually increased
up to -0.08pu to 0.08pu, and then stayed at -0.07 to 0.07 to continue the rest of the operations. In the
second trace variation in Iabc observed, there is small slight dent (0.85pu-0.85pu) for 0.1 to 0.3
second and rise up (0.105pu to -0.105pu) for 0.3 to 0.5 and then dropped at (10pu to -10pu) stayed
there for rest of the operations. In the third trace variation of Mag _Vinj and Vref observed, the Vref
changed from 0pu to 0.75pu for 0.1 to 0.3 second and stayed there for the rest of the operations.
Similarly, Vinj varied from 0pu to 0.04pu for 0.1 to 0.3 second and stayed at 0.05pu rest of the
operations. In the fourth trace Vdc voltage observed, it spiked up to 22kV for 0.001 to 0.1 second and
dropped at 20kV and stayed there to continue the rest of the operations. In the last two traces
variation of reactive (Mvar) and active power (MW) at each line was observed [24].
(a)
(b)
(c)
(d)
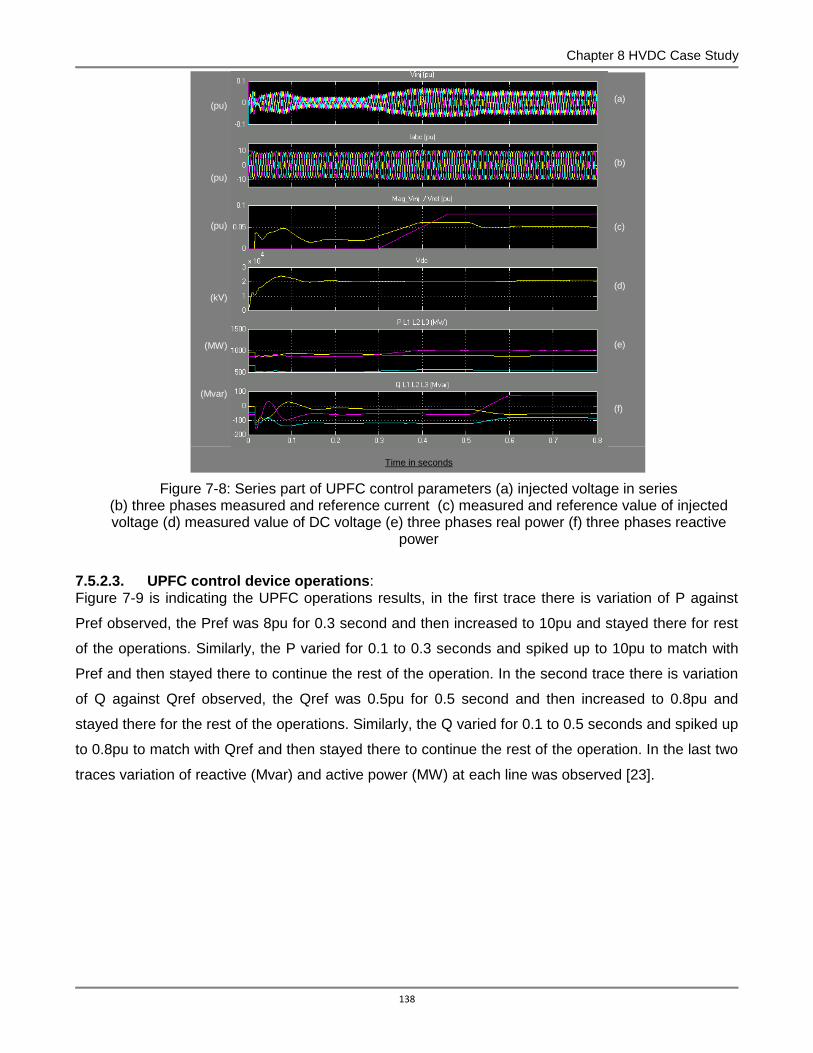
Chapter 8 HVDC Case Study
138
(pu)
(pu)
(pu)
(kV)
(MW)
(Mvar)
Time in seconds
Figure 7-8: Series part of UPFC control parameters (a) injected voltage in series (b) three phases measured and reference current (c) measured and reference value of injected voltage (d) measured value of DC voltage (e) three phases real power (f) three phases reactive
power
7.5.2.3. UPFC control device operations: Figure 7-9 is indicating the UPFC operations results, in the first trace there is variation of P against
Pref observed, the Pref was 8pu for 0.3 second and then increased to 10pu and stayed there for rest
of the operations. Similarly, the P varied for 0.1 to 0.3 seconds and spiked up to 10pu to match with
Pref and then stayed there to continue the rest of the operation. In the second trace there is variation
of Q against Qref observed, the Qref was 0.5pu for 0.5 second and then increased to 0.8pu and
stayed there for the rest of the operations. Similarly, the Q varied for 0.1 to 0.5 seconds and spiked up
to 0.8pu to match with Qref and then stayed there to continue the rest of the operation. In the last two
traces variation of reactive (Mvar) and active power (MW) at each line was observed [23].
(a)
(b)
(c)
(d)
(e) (f)
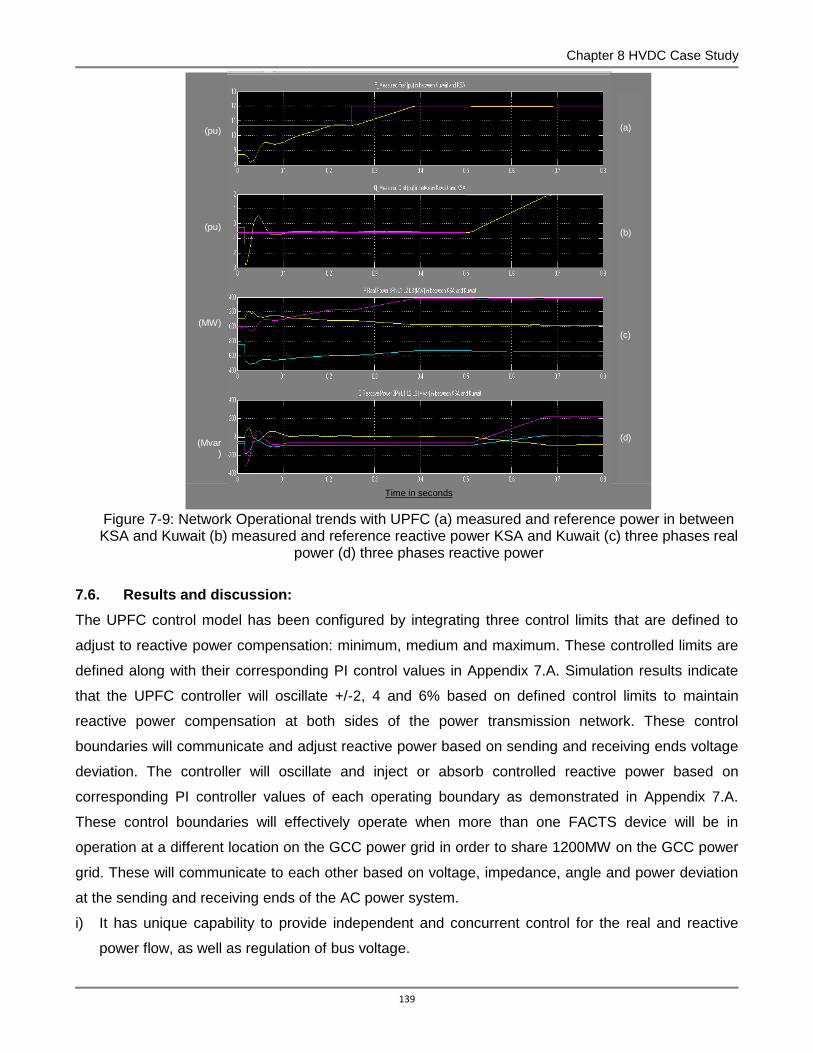
Chapter 8 HVDC Case Study
139
(pu)
(pu)
(MW)
(Mvar)
Time in seconds
Figure 7-9: Network Operational trends with UPFC (a) measured and reference power in between KSA and Kuwait (b) measured and reference reactive power KSA and Kuwait (c) three phases real
power (d) three phases reactive power
7.6. Results and discussion:
The UPFC control model has been configured by integrating three control limits that are defined to
adjust to reactive power compensation: minimum, medium and maximum. These controlled limits are
defined along with their corresponding PI control values in Appendix 7.A. Simulation results indicate
that the UPFC controller will oscillate +/-2, 4 and 6% based on defined control limits to maintain
reactive power compensation at both sides of the power transmission network. These control
boundaries will communicate and adjust reactive power based on sending and receiving ends voltage
deviation. The controller will oscillate and inject or absorb controlled reactive power based on
corresponding PI controller values of each operating boundary as demonstrated in Appendix 7.A.
These control boundaries will effectively operate when more than one FACTS device will be in
operation at a different location on the GCC power grid in order to share 1200MW on the GCC power
grid. These will communicate to each other based on voltage, impedance, angle and power deviation
at the sending and receiving ends of the AC power system.
i) It has unique capability to provide independent and concurrent control for the real and reactive
power flow, as well as regulation of bus voltage.
(a)
(b)
(c)
(d)
Chapter 8 HVDC Case Study
140
ii) It has a flexibility to run independently STATCOM and SSSC compensation, as well as for the
regulation of bus voltage.
iii) The successful UPFC installation at the Kingdom of Saudi Arabia bus has also proven the concept
of operating two or more voltage sources converters from a common dc bus, enabling the
converters to exchange real power among them and thus being capable of providing two
dimensional compensation by injecting real power as well as reactive power into the transmission
line to validate its practical implementations.
7.7. Summary:
In this chapter, the UPFC device model demonstrates its strong impact voltage quality, power flow and
power stability in order to share 1200MW power from the Kingdom Saudi Arabia and 1200MW power
from the Kuwait power network on the GCC grid to meet industrial and domestic loads requirements at
different atmospheric (summer/winter) operating conditions. Hereby the GCC power system
background and viabilities are also addressed as well as the UPFC reinforcement plan. In addition to
that, the UPFC control model new control optimization and device selection techniques are described
in detail and its application in order to resolve various control and operational issues precisely.
Based on these control techniques three control limits along with corresponding PID new control
values are incorporated into the UPFC model and simulated as demonstrated in appendix 7.A. These
control techniques are providing a lot of confidence to operate the UPFC device independently or
jointly (integrated) as further discussed in chapter 9. In this chapter the simulation results show the
uniqueness of the UPFC. This model also demonstrates the pragmatic impact of the UPFC between
Kuwait and the Kingdom of Saudi Arabia. The promising results demonstrated by the UPFC reveal the
major practical advantages that can be obtained by this technology in order to implement in the GCC
power grid. It has the unique capability to provide independent and synchronized control for the real
and reactive power flow, as well as regulating the set bus voltage. It has a flexibility to run
independently STATCOM and SSSC compensation and enhanced control to regulate the bus voltage.
The successful installation of the UPFC device between Kuwait and the Kingdom of Saudi Arabia has
also proven the concept of operating two or more voltage sources converters from a common dc bus,
enabling the converters to exchange real power among them and thus being capable of providing two
dimensional compensation by injecting real power as well as reactive power into the transmission line
to validate its practical implementation.
Chapter 8 HVDC Case Study
141
8.1. Introduction
The Capacitor Commutated Converter (CCC) is a new type of HVDC converter topology which shows
promising results for use in long-distance transmission lines. This technology is, thus, a potential
candidate for use in HVDC transmission to deliver bulk power. The transmission line performance
evaluations are presented using Matlab. The results demonstrate the superior performance of a CCC
link, when connected to a very weak AC system in terms of increased transmission capacity and
improved stability of the AC network on the GCC power grid. The following areas have been
discussed in this chapter to implement HVDC on the GCC power grid.
A. HVDC design criteria
B. Design Studies review
C. HVDC Description
D. Rectifier operations
E. Inverter operations
F. HVDC equipments
G. HVDC Simulated model
H. Results/Discussion
8.2. Design criteria:
8.2.1. Transmission capacity:
A Bipolar DC link is rated for continuous power to transmit 1200MW (+/- 400kV 3000A) at the DC
terminal rectifier converter station. HVDC can be operated in a bipolar or monploar mode with ground
or metallic returns. The DC transmission system permits 120 minute over-laod of 1.1 pu of rated
power without a redundant cooling system in service and up to 1.2 pu with a redundant cooling system
[1], [2], [3].
8.2.2. System performance:
In order to ensure high-level system reliability and availability with minimal downtime, fast fault
detection, effective repair and maintenance strategies as well as fault-tolerance control system and
redundancy. The converter stations designs to loss 21-23 MW per station at 1200 MW power
transmission. At rated transmission capacity the main loss sources are within the converter station’s
converter valves and transformers. Performance requirements for Dc system response, reactive
power exchange with ac system, overvoltage control, ac voltage distortion equivalent disturbing
current on the dc side, radio interference and audible noise have been considered in the system
design [23].
HVDC Implementation on the GCC power grid
CHAPTER 8
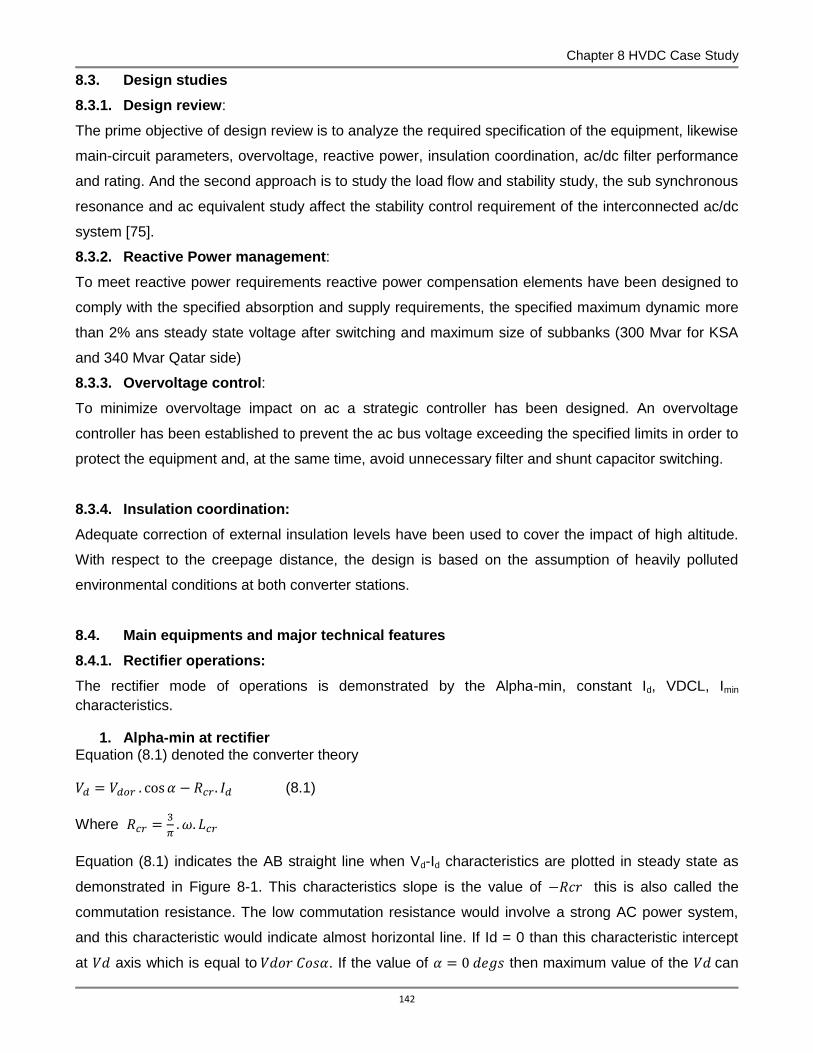
Chapter 8 HVDC Case Study
142
8.3. Design studies
8.3.1. Design review:
The prime objective of design review is to analyze the required specification of the equipment, likewise
main-circuit parameters, overvoltage, reactive power, insulation coordination, ac/dc filter performance
and rating. And the second approach is to study the load flow and stability study, the sub synchronous
resonance and ac equivalent study affect the stability control requirement of the interconnected ac/dc
system [75].
8.3.2. Reactive Power management:
To meet reactive power requirements reactive power compensation elements have been designed to
comply with the specified absorption and supply requirements, the specified maximum dynamic more
than 2% ans steady state voltage after switching and maximum size of subbanks (300 Mvar for KSA
and 340 Mvar Qatar side)
8.3.3. Overvoltage control:
To minimize overvoltage impact on ac a strategic controller has been designed. An overvoltage
controller has been established to prevent the ac bus voltage exceeding the specified limits in order to
protect the equipment and, at the same time, avoid unnecessary filter and shunt capacitor switching.
8.3.4. Insulation coordination:
Adequate correction of external insulation levels have been used to cover the impact of high altitude.
With respect to the creepage distance, the design is based on the assumption of heavily polluted
environmental conditions at both converter stations.
8.4. Main equipments and major technical features
8.4.1. Rectifier operations:
The rectifier mode of operations is demonstrated by the Alpha-min, constant Id, VDCL, Imin
characteristics.
1. Alpha-min at rectifier Equation (8.1) denoted the converter theory
(8.1)
Where
Equation (8.1) indicates the AB straight line when Vd-Id characteristics are plotted in steady state as
demonstrated in Figure 8-1. This characteristics slope is the value of this is also called the
commutation resistance. The low commutation resistance would involve a strong AC power system,
and this characteristic would indicate almost horizontal line. If Id = 0 than this characteristic intercept
at axis which is equal to . If the value of then maximum value of the can

Chapter 8 HVDC Case Study
143
be obtained and the rectifier is in theory diod converter. Practically, it has been identified that a
minimum value this is an important to ensure that the converters valves have a
minimum positive voltage to turning on their operations; the hatched areas indicate this characteristic
at the rectifier operations as demonstrated in the Figure 8-1[23].
2. Constant Id at rectifier operations It has been identified and determined that the converter valves have limited thermal inertia which
cannot carry large amount of current over their rated value for any extended period of time. The
converter can carry a maximum Imax = 1.2 pu as the upper limit for the current carrying capacity of the
converters valves. Figure 8.1 indicates the current “BC” straight line characteristic and
its zone of operations.
3. VDCL at rectifier operations If the AC power system voltage at the rectifier bus operations reduced due to some perturbation, the
VDCL (Voltage-Dependent-Current-Limit) is a limitation forced by the AC power system to maintain
the DC power flow. Figure (8.1) indicates that the system will utilize straight line DC’ instead of slope
line “CD” in order to improve the system sustainability.
4. Imin at rectifier operations Current chopping phenomenal can be occurred due to any sort of discontinuous current operations
with its sequential. This could lead the endanger DC voltage in the systemIn order to avoid such
scenario Imin must be maintained in between 0.2-0.3 pu.
Alpha-min limit
Imax limit
R
U T
A
B
C
D
E
0.2 1.0 pu 1.2 pu
IdoiIdor
1.0 pu
Id
Current error
region
Constant Id
VDCL
S
S
S’P
0Imin
Vd
Figure 8-1: Static Vd- Id characteristics [3].
8.4.2. Inverter operations
The inverter mode of operations is demonstrated by the Gamma-min, constant current, Alpha-min,
current error region characteristics.
1. Gamma-min at inverter operations

Chapter 8 HVDC Case Study
144
Equation (8.2) denoted the inverter theory of operations
(8.2)
Where
Figure 8-1 indicates the SR line which defines the inverter operations and this is also called the
constant extinction angle (CEA) control mode. The slope of this line defines the strength of the AC
power system at inverter side. Herein, the minimum extinction angle (gamma) option is utilized
normally in order to maintain seamless operations at inverter side.
2. Constant current at inverter operations Figure 8-1 indicates the ST line which defines the constant current characteristics at the inverter. In
order to maintain an exceptional and seamless operations of the DC link at cross-over point “P” line of
the rectifier and inverter. The current margin in between inverter and converter should be
which can be expressed in equation (8.3).
(8.3)
Where: Current orders given:
The current demand by the inverter is less than the rectifier; therefore the margin typically maintained
0.1pu. In order to prevent current harmonics which may superimposed on the DC current, the
magnitude of the current margin kept large which avoid rectifier and inverter constant current mode
interaction. This is also called the current margin control method.
3. Alpha-min at inverter operations Figure 8-1 indicates the TU line which defines the Alpha-min characteristics at the inverter side of
operations. The is maintained in order to limit the inverter into the rectifier
operations even transiently. When Id=0 the Alpha-min (100-110 degrees) value will ensure minimum
dc voltage at the inverter for a fast start up of the DC link.
4. Current error region at inverter operations In order to avoid any power system instability due to multiple operating points of the weak AC system
at the inverter side a modification has been made often to the inverter characteristics of the PS’ line in
Figure 8-1 during the current margin period. This modification is illustrated in Figure 8-1a & b in this
explanation VDCL characteristics are eliminated to make it simple. Firstly in rectifier operations two
control modes are considered: alpha-min (line-AB) and constant current (line-BC). This mode of
control is forced by the natural characteristics of the rectifier ac system and the converter valves which
have an ability to operate at alpha angel equal to zero. In this limit the rectifier acts as diod rectifier.
However a minimum positive voltage is required before firing the valves in order to ensure conduction
so the is normally forced. Secondly in inverter operations two control modes are

Chapter 8 HVDC Case Study
145
considered: gamma-min (line-PQ) and constant current (line-QR). The cross-over point ‘X’ of the
rectifier and inverter characteristics defines the operating point of the DC link. Furthermore, constant-
current characteristics are also used at the inverter side of operations. The current demand by the
inverter is less than the rectifier ; therefore the current margin typically maintained 0.1pu. In
order to prevent current harmonics which may superimposed on the DC current, the magnitude of the
current margin kept large which avoid rectifier and inverter constant current mode interaction. This is
also called the current margin control method [23].
P
R
A
B
C
Idoi
Idor
Id
S
Y X
0
Imin
Vd
P
R
A
B
C
Idoi
Idor
Id
S
Y X
0
Imin
Vd
(b)(a)
Figure 8-2: Static Vd- Id characteristics (a) unmodified (b) modified [3].
8.4.3. HVDC Equipment and Configuration
8.4.3.1 Smoothing reactor: The smooth reactors contain following configuration
Inductance 270 mH
Rated voltage: 500 kV
Rated current 3000A
Insulation level: 1550kV LIWL to ground
Insulation level: 1675kV LIWL to terminal to terminal
8.4.3.2. AC breakers and DC switches:
In order to limit the inrush current from AC filter and converter transformer and related stress
equipment the AC breaker must be equipped with synchronous switching. The equipment rating is
based on maximum inrush without synchronous closing. MTRB metallic retune transfer breakers and
metallic return switches are located in the DC yards. The converter stations are designed to allow the
transfer ground return operations to metallic return and vice versa up to dc current 4kVa without
interruption of transmission lines. Figure 8-3 indicates the principle arrange of MTRB.

Chapter 8 HVDC Case Study
146
RPLP
CP
Arrester
DCHSS
Figure 8-3: metallic return switch [3]
8.4.3.3. AC filters:
In order to meet the system performance requirements the compensation equipments comprises 3 A-
type filters 4 B-type filter and 4-C-shunts introduces at KSA and 4 A-type filters 4 B-type filter and 5-C-
shunts introduces at Qatar side. A triple tuned AC filter offers various advantages as indicated in
Figure 8-4.
L1
L2
R1
C2
C1
Fac1
A
DT 11/13
L1
L2
R1
C2
C1
Fac1
B
TT 03/24/36
R2L3C3Fac2
L1
C1
Fac1
C
Shunt C
Figure 8-4: AC filter A,B, and C types [3]
8.4.3.4. DC filters:
Triple tuned DC filter are introduced to reduce the harmonic current in DC line. Due to triple tuned
design a simple and redundant DC filter is used as indicated in Figure 8-5.
L1
L2
C2
C1
Fdc1
L3 C3
Fdc2
Fdc2
L1
L2
C2
C1
Fdc1
L3 C3
Fdc2
Fdc2
Figure 8-5: Triple tuned DC filters [3]
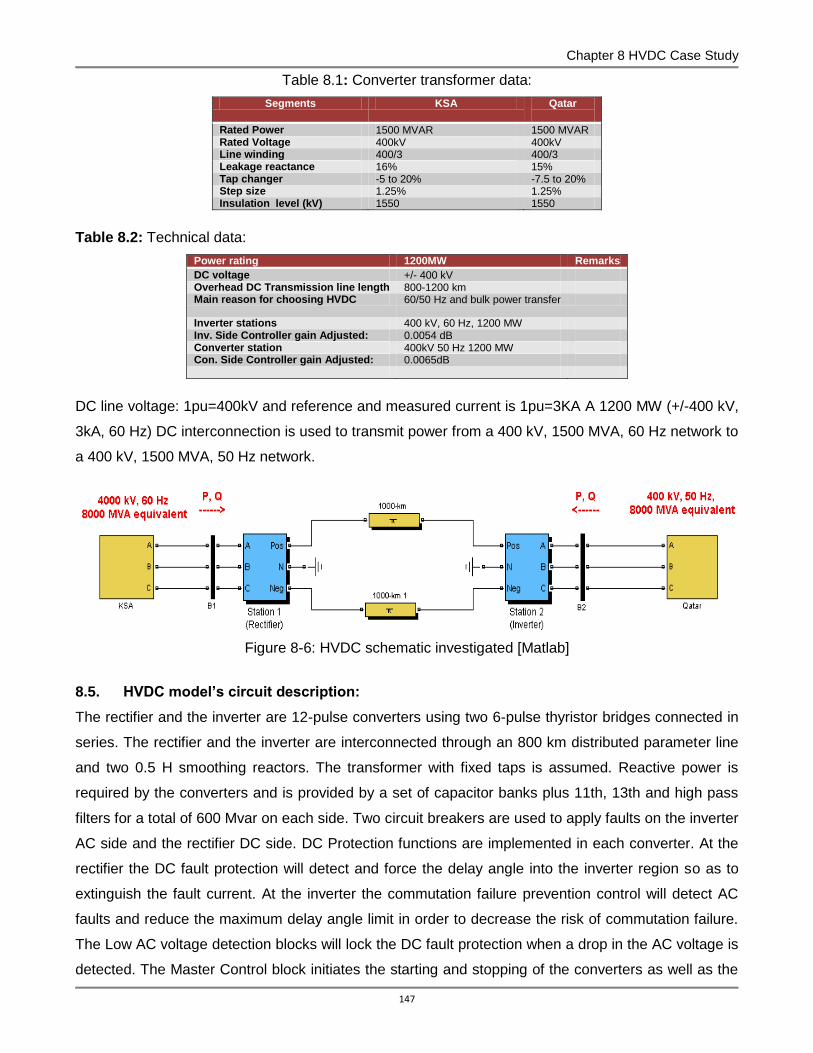
Chapter 8 HVDC Case Study
147
Table 8.1: Converter transformer data:
Segments KSA Qatar
Rated Power 1500 MVAR 1500 MVAR Rated Voltage 400kV 400kV Line winding 400/3 400/3 Leakage reactance 16% 15% Tap changer -5 to 20% -7.5 to 20% Step size 1.25% 1.25% Insulation level (kV) 1550 1550
Table 8.2: Technical data:
Power rating 1200MW Remarks
DC voltage +/- 400 kV Overhead DC Transmission line length 800-1200 km Main reason for choosing HVDC 60/50 Hz and bulk power transfer
Inverter stations 400 kV, 60 Hz, 1200 MW Inv. Side Controller gain Adjusted: 0.0054 dB Converter station 400kV 50 Hz 1200 MW Con. Side Controller gain Adjusted: 0.0065dB
DC line voltage: 1pu=400kV and reference and measured current is 1pu=3KA A 1200 MW (+/-400 kV,
3kA, 60 Hz) DC interconnection is used to transmit power from a 400 kV, 1500 MVA, 60 Hz network to
a 400 kV, 1500 MVA, 50 Hz network.
Figure 8-6: HVDC schematic investigated [Matlab]
8.5. HVDC model’s circuit description:
The rectifier and the inverter are 12-pulse converters using two 6-pulse thyristor bridges connected in
series. The rectifier and the inverter are interconnected through an 800 km distributed parameter line
and two 0.5 H smoothing reactors. The transformer with fixed taps is assumed. Reactive power is
required by the converters and is provided by a set of capacitor banks plus 11th, 13th and high pass
filters for a total of 600 Mvar on each side. Two circuit breakers are used to apply faults on the inverter
AC side and the rectifier DC side. DC Protection functions are implemented in each converter. At the
rectifier the DC fault protection will detect and force the delay angle into the inverter region so as to
extinguish the fault current. At the inverter the commutation failure prevention control will detect AC
faults and reduce the maximum delay angle limit in order to decrease the risk of commutation failure.
The Low AC voltage detection blocks will lock the DC fault protection when a drop in the AC voltage is
detected. The Master Control block initiates the starting and stopping of the converters as well as the
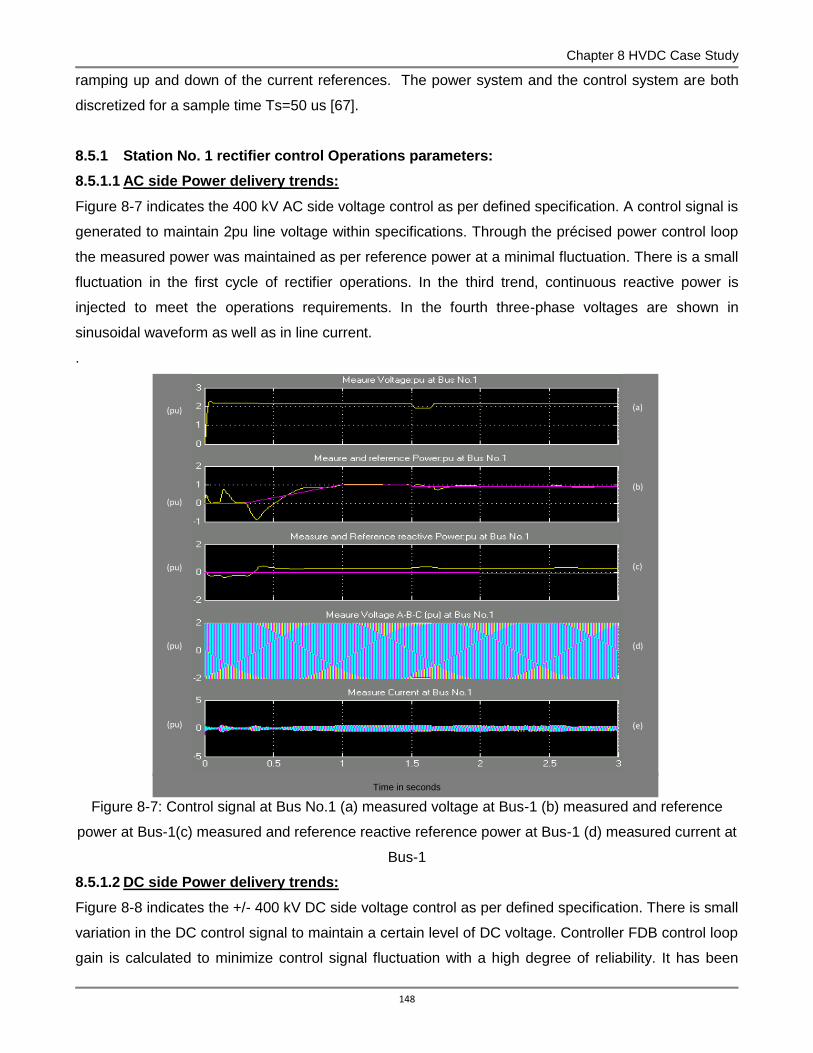
Chapter 8 HVDC Case Study
148
ramping up and down of the current references. The power system and the control system are both
discretized for a sample time Ts=50 us [67].
8.5.1 Station No. 1 rectifier control Operations parameters:
8.5.1.1 AC side Power delivery trends:
Figure 8-7 indicates the 400 kV AC side voltage control as per defined specification. A control signal is
generated to maintain 2pu line voltage within specifications. Through the précised power control loop
the measured power was maintained as per reference power at a minimal fluctuation. There is a small
fluctuation in the first cycle of rectifier operations. In the third trend, continuous reactive power is
injected to meet the operations requirements. In the fourth three-phase voltages are shown in
sinusoidal waveform as well as in line current.
.
Time in seconds
Figure 8-7: Control signal at Bus No.1 (a) measured voltage at Bus-1 (b) measured and reference
power at Bus-1(c) measured and reference reactive reference power at Bus-1 (d) measured current at
Bus-1
8.5.1.2 DC side Power delivery trends:
Figure 8-8 indicates the +/- 400 kV DC side voltage control as per defined specification. There is small
variation in the DC control signal to maintain a certain level of DC voltage. Controller FDB control loop
gain is calculated to minimize control signal fluctuation with a high degree of reliability. It has been
(pu)
(pu)
(pu)
(pu)
(pu)
(a) (b) (c) (d) (e)

Chapter 8 HVDC Case Study
149
also observed that there is a slight variation in DC power delivery. Further tuning is recommended to
minimize the variation.
Time in seconds
Figure 8-8: DC side voltage control (a) DC voltage at station-1 (b) DC power control signal at station-1 (c) DC power measured at station-1
8.5.1.3 DC voltage balanced control loop at station No. 1:
Figure 8-9 indicates a small fluctuation in control signal to balance DC voltage at the rectifier side. The
control loop gain has been adjusted to meet rectifier operational requirements with a high degree of
accuracy. It has been observed at nearly +/- 0.02 pu. Further investigation is still going on to improve
existing control loop operations.
Time in second
Figure 8-9: (a) DC voltage balance control at stations-1
8.5.2 Station No. 2 Inverter control operations parameters:
8.5.2.1 AC side Power delivery trends:
Figure 8-10 indicates the inverter operation to convert 400kV DC to 500kV AC side voltage control as
per defined specification. A control signal is generated to maintain 2pu line voltage within
(pu)
(pu)
(pu)
(a) (b) (c)
(pu)
(a)

Chapter 8 HVDC Case Study
150
specifications. Through the précised power control loop the measured power was maintained as per
reference power at a minimal fluctuation. In the third trend, continuous reactive power is injected to
meet the inverters operations requirements. In the fourth three-phase voltages are shown in sinusoidal
waveform as well as line current.
Time in seconds
Figure 8-10: Control signal at Bus No.2 (a) measured voltage at Bus-2 (b) measured and reference
power at Bus-2(c) measured and reference reactive reference power at Bus-2 (d) measured current at
Bus-2
8.5.2.2 DC side Power delivery trends:
Figure 8-11 indicates the +/- 400kV DC side voltage control as per defined specification. There is
negligible variation in the DC control signal to maintain a certain level of DC voltage. Controller FDB
control loop gain is calculated to minimize control signal fluctuation with a high degree of accuracy. It
has been also observed that there is a slight variation in DC power delivery. Further tuning is
recommended to minimize the variation.
(pu)
(pu)
(pu)
(pu)
(pu)
(a) (b) (c) (d) (e)

Chapter 8 HVDC Case Study
151
Time in seconds
Figure 8-11: DC side voltage control (a) DC voltage at station-2 (b) DC power control signal at station-
2 (c) DC power measured at station-2
8.5.2.3 DC voltage balanced control loop at station No. 2:
Figure 8-12 indicates small fluctuation in control signal to balance DC voltage at rectifier side. The
control loop gain has been adjusted to meet rectifier operational requirements with a high degree of
accuracy. It has been observed at nearly +/- 0.02 pu. Further investigation is still going on to improve
existing control loop operations..
Time in seconds
Figure 8-12: DC side voltage balanced control at station-2
8.6 Results and discussion:
The HVDC control model has been configured by integrating with STATCOM, SSSC & UPFC devices.
By carrying out a careful study, it has been determined that the HVDC inform of back-to-back –
STATCOM will add the value to the AC power system to regulate the power and modulation (power
angle and voltage). During this study, it was also identified that the KSA power facilities are operating
(pu)
(pu)
(pu)
(a) (b) (c)
(pu)
(a)

Chapter 8 HVDC Case Study
152
at 60Hz and the rest of all the GCC countries are operating at 50Hz. Therefore back-to-back DC link
has an instrumental approach to develop a communication link between the two frequencies: the KSA
and the rest of the GCC countries. A study (studies) also indicates that the HVDC system is a very
viable solution to deliver bulk power through a long transmission line from KSA to rest of the GCC
power network. The supplied power system DC link has the capacity and capability to share 1200MW
power on the GCC power network. This solution is also very economical and providing a well-
controlled power transmission flow through the DC link. Principal drive of the HVDC model is to
develop a program to identify and determine to transfer (1200MW, 400kV, 60 Hz) power from KSA
generation to the GCC grid (400kV, 50Hz). A power system analysis shows the results that are very
convincing, as anticipated, by using a power system simulation package that also evaluates the effect
of compensation on the transmission line to obtain the following objectives:
- Identify and determine the required system frequency to maintain the system voltage.
- Identify and determine the maximum power transfer limit that may be transmitted under different
conditions.
- Investigate the influence of various factors such as line length, load power factor and reactive
power requirements to maintain maximum power transfer capability.
In general, various investigations have been carried-out to validate simulation technique and its results
by sharing 1200MW power from the KSA power generation system on the GCC power network to
meet industrial and domestic loads operational requirements at various atmospheric operating
conditions. As a result, very much promising outcomes have been achieved during this study.
8.7 Summary:
The HVDC model demonstrates the impact on the GCC power grid in order to deliver 1200MW power
from Saudi Arabia on the GCC power grid to meet industrial and domestic loads operational
requirements at different atmospheric conditions. Hereby Power system transmission capacity, system
reinforcement and design criteria have been addressed in this chapter by putting GCC Power grid
security and operational criticalities into consideration. In addition to that, reactive power management,
overvoltage control, insulation coordination as well as rectifiers and inverter operations are also
described in this chapter. Furthermore, smoothing reactor, breakers, DC switches, harmonic (AC+ DC)
filters technicalities are also addressed in detail.
153
9.1. Introduction:
FACTS-FRAME encompassed various interconnected layers of control and operations in the GCC
power grid. The first layer describes the geographical positions of the each GCC country. The second
layer describes the geographical location of each FACTS device and their static and dynamic
operational data requirements for application. The third layer describes the selection process of the
required FACTS device based on its capability and capacity to overcome power transmission system’s
contingences on the GCC power grid. The fourth layer describes the communication interface to
integrate STATCOM, SSSC and UPFC with each other. The fifth layer describes the control pattern of
each FACTS device. These control patterns are configured to accelerate and de-accelerate
converter(s) gating response based on each devices time-based capability and capacity to inject and
absorb reactive power in capacitive or inductive modes of operation of the AC power system. A new
technique was introduced and demonstrated to adjust reactive power compensation in three modes of
operations (minimum, medium and maximum) based on vital operating and control parameters
deviation. To maintain these three controls and operating boundaries the PI controller’s response is
configured and integrated to reduce or eliminate the operating and control deviation. If deviation is +/-
2% the controller will inject or absorb minimum reactive power for +/- 4% medium reactive power and
for +/- 6% maximum reactive power. The simulation results indicate that this control technique has a
great potential to enhance the FACTS control devices robustness and strong integration with a degree
of precision.
Herein, large numbers of research papers and material are reviewed thoroughly related to the electrical
power system control and operations at micro-level to produce high quality results as well as by putting
in massive 18 years industrial experience in the field of instrumentation and control system
engineering. Whereas, the last 18 years of instrumentation and control system engineering experience
has been obtained practically by practicing and customizing different types of industrial applications in
instrumentation and control systems, likewise DCS, SCADA and APCS control systems that are largely
commissioned by the Honeywell, ABB and Yokogawa companies. The principal aim of this work is to
customize FACTS control devices operational framework for multipurpose on the GCC power grid
(Qatar, KSA, Oman, Bahrain, Kuwait and UAE). This framework architecture comprises of five layers
of FACTS control devices (STATCOM, SSSC and UPFC) as demonstrated in Figure 9-2. This five-
layer architecture is designed for its future growth and reusability so that more complex power system
operational problems can be addressed within control architecture after its successful implementation.
FACTS-FRAME Architecture to Integrate FACTS Devices on the GCC Power Grid
CHAPTER 9

Chapter 10. FACTS-FRAME
154
These five of layers framework-architecture, named “FACTS-FRAME”, demonstrate how various
FACTS devices control systems are communicating to with other and controlling various FACTS
devices at different locations on the GCC power grid in order to address time based operational
contingencies on the GCC power grid. The FACTS-FRAME is designed to handle complicated and
distributed computation for intensive power system calculation and implementation on multiple power
systems distributed networks. The FACTS-FRAME has the capacity and capability to identify and
determine various complex power system problems which are persisting on the GCC power grid: poor
voltage quality, poor load flow control, limited power transfer capacity and power system stability
issues.
In order to address these issues steady state mathematical models have been derived by considering
current operational and security criticalities in order to indentify and determine different operational
and control scenarios on the GCC power grid. Distributed power flow algorithms have also been
developed in order to understand and implement FACTS devices to get maximum benefits. Based on
FACTS devices applications very promising results can be obtained by establishing integrated multiple
FACTS devices FACTS-FRAME network on the GCC power grid. Listed below major benefits may be
witnessed by developing and implementing strategic FACTS-FRAME on the GCC power grid
[1],[2],[3].
a) Increasing power transfer capacity, controllability and operational reliability on the GCC power
network.
b) Reducing new Line Construction and preserving the Environment on the GCC power network.
c) Enhancing power system operational stability, voltage control and addressing Retiring/aging
Transmission Assets on the GCC power network.
Figure 9-1 illustrates a designed power exchange and also shows an inter-tie connection with
STATCOM, SSSC & UPFC in between the GCC countries. Prime contributions of this research work
are as listed below.
a) Investigate the impact of integrated FACTS devices (STATCOM, SSSC & UPFC) with new PI
control parameters and its operating technique on the GCC power network.
b) Compare the power system network with and without FACTS devices (STATCOM, SSSC &
UPFC) application at different locations on the GCC power network.
Successful implementation of the FACTS-FRAME will increase the network loadability and the
enhanced voltage profile at different locations on the GCC power grid. The rest of this chapter is
organized as follows. In section 9.2, 9.3 FACTS-FRAME system overview, FACTS FRAME
architecture. In section 9.4, 9.5 FACTS FRAME configurations FACTS FRAME case study. In section
9.6 and 9.7 FACTS-FRAME effectiveness (observations) and results are presented.
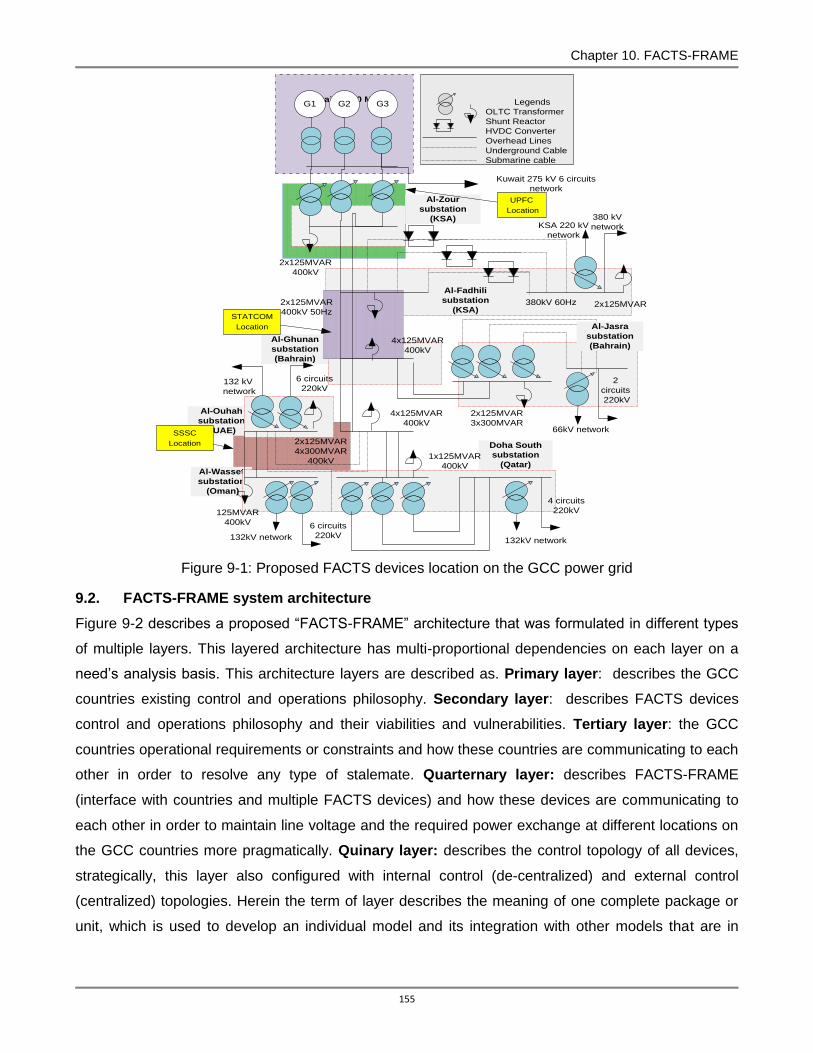
Chapter 10. FACTS-FRAME
155
Al-Wasset
substation
(Oman)
Al-Ouhah
substation
(UAE)
Doha South
substation
(Qatar)
Al-Ghunan
substation
(Bahrain)
Kuwait (2500 MW) Legends
OLTC Transformer
Shunt Reactor
HVDC Converter
Overhead Lines
Underground Cable
Submarine cable
Kuwait 275 kV 6 circuits
network
KSA 220 kV
network
380 kV
network
380kV 60Hz2x125MVAR
400kV 50Hz
2x125MVAR
400kV
4x125MVAR
400kV
4x125MVAR
400kV
2x125MVAR
3x300MVAR
1x125MVAR
400kV
2
circuits
220kV
66kV network
4 circuits
220kV
132kV network
132 kV
network
132kV network
6 circuits
220kV
6 circuits
220kV
2x125MVAR
4x300MVAR
400kV
125MVAR
400kV
G1 G2 G3
2x125MVAR
Al-Jasra
substation
(Bahrain)
Al-Fadhili
substation
(KSA) STATCOM
Location
Al-Zour
substation
(KSA)
UPFC
Location
SSSC
Location
Figure 9-1: Proposed FACTS devices location on the GCC power grid
9.2. FACTS-FRAME system architecture
Figure 9-2 describes a proposed “FACTS-FRAME” architecture that was formulated in different types
of multiple layers. This layered architecture has multi-proportional dependencies on each layer on a
need’s analysis basis. This architecture layers are described as. Primary layer: describes the GCC
countries existing control and operations philosophy. Secondary layer: describes FACTS devices
control and operations philosophy and their viabilities and vulnerabilities. Tertiary layer: the GCC
countries operational requirements or constraints and how these countries are communicating to each
other in order to resolve any type of stalemate. Quarternary layer: describes FACTS-FRAME
(interface with countries and multiple FACTS devices) and how these devices are communicating to
each other in order to maintain line voltage and the required power exchange at different locations on
the GCC countries more pragmatically. Quinary layer: describes the control topology of all devices,
strategically, this layer also configured with internal control (de-centralized) and external control
(centralized) topologies. Herein the term of layer describes the meaning of one complete package or
unit, which is used to develop an individual model and its integration with other models that are in
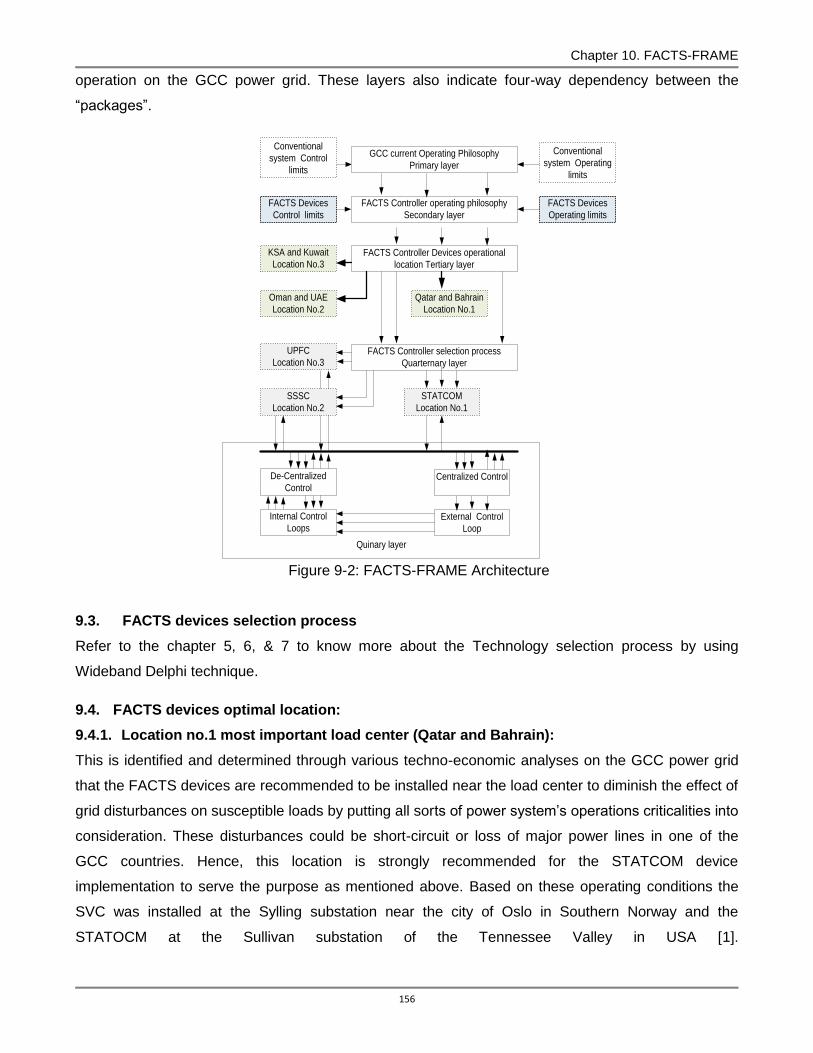
Chapter 10. FACTS-FRAME
156
operation on the GCC power grid. These layers also indicate four-way dependency between the
“packages”.
Figure 9-2: FACTS-FRAME Architecture
9.3. FACTS devices selection process
Refer to the chapter 5, 6, & 7 to know more about the Technology selection process by using
Wideband Delphi technique.
9.4. FACTS devices optimal location:
9.4.1. Location no.1 most important load center (Qatar and Bahrain):
This is identified and determined through various techno-economic analyses on the GCC power grid
that the FACTS devices are recommended to be installed near the load center to diminish the effect of
grid disturbances on susceptible loads by putting all sorts of power system’s operations criticalities into
consideration. These disturbances could be short-circuit or loss of major power lines in one of the
GCC countries. Hence, this location is strongly recommended for the STATCOM device
implementation to serve the purpose as mentioned above. Based on these operating conditions the
SVC was installed at the Sylling substation near the city of Oslo in Southern Norway and the
STATOCM at the Sullivan substation of the Tennessee Valley in USA [1].
Quinary layer
FACTS Controller operating philosophy
Secondary layer
FACTS Controller selection process
Quarternary layer
FACTS Devices
Operating limits
FACTS Devices
Control limits
Conventional
system Operating
limits
Conventional
system Control
limits
FACTS Controller Devices operational
location Tertiary layer
KSA and Kuwait
Location No.3
Oman and UAE
Location No.2
Qatar and Bahrain
Location No.1
UPFC
Location No.3
STATCOM
Location No.1
External Control
Loop
GCC current Operating Philosophy
Primary layer
Internal Control
Loops
De-Centralized
ControlCentralized Control
SSSC
Location No.2
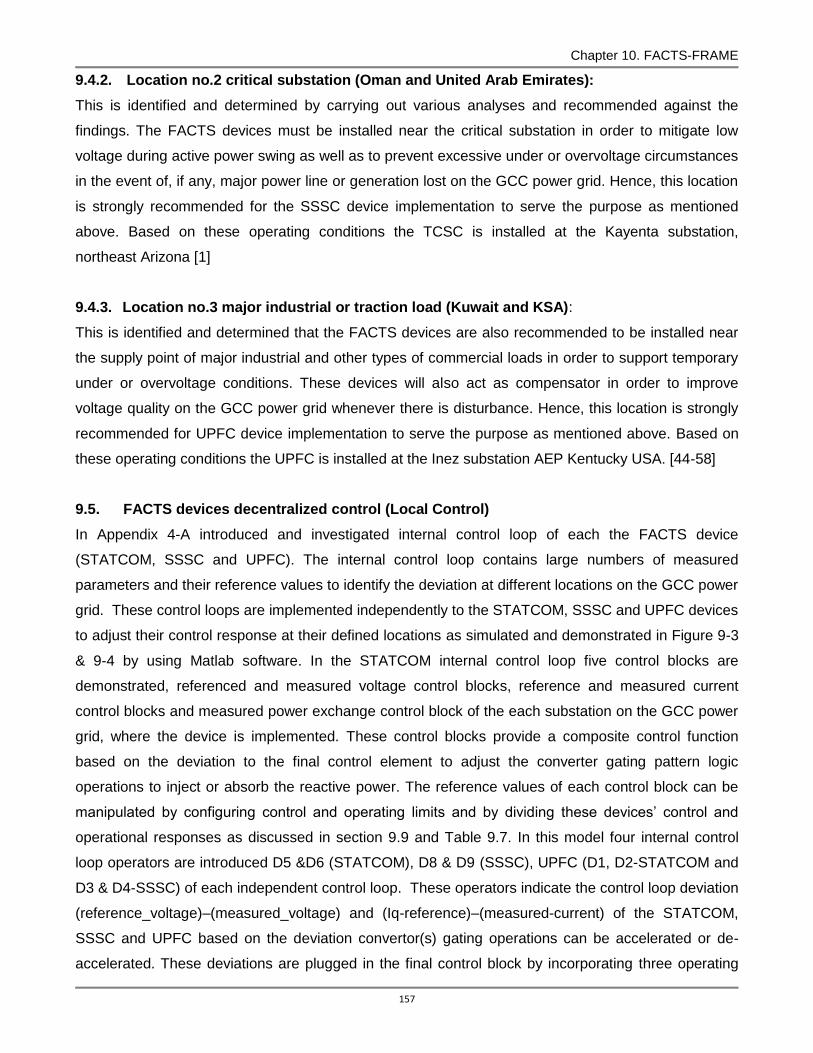
Chapter 10. FACTS-FRAME
157
9.4.2. Location no.2 critical substation (Oman and United Arab Emirates):
This is identified and determined by carrying out various analyses and recommended against the
findings. The FACTS devices must be installed near the critical substation in order to mitigate low
voltage during active power swing as well as to prevent excessive under or overvoltage circumstances
in the event of, if any, major power line or generation lost on the GCC power grid. Hence, this location
is strongly recommended for the SSSC device implementation to serve the purpose as mentioned
above. Based on these operating conditions the TCSC is installed at the Kayenta substation,
northeast Arizona [1]
9.4.3. Location no.3 major industrial or traction load (Kuwait and KSA):
This is identified and determined that the FACTS devices are also recommended to be installed near
the supply point of major industrial and other types of commercial loads in order to support temporary
under or overvoltage conditions. These devices will also act as compensator in order to improve
voltage quality on the GCC power grid whenever there is disturbance. Hence, this location is strongly
recommended for UPFC device implementation to serve the purpose as mentioned above. Based on
these operating conditions the UPFC is installed at the Inez substation AEP Kentucky USA. [44-58]
9.5. FACTS devices decentralized control (Local Control)
In Appendix 4-A introduced and investigated internal control loop of each the FACTS device
(STATCOM, SSSC and UPFC). The internal control loop contains large numbers of measured
parameters and their reference values to identify the deviation at different locations on the GCC power
grid. These control loops are implemented independently to the STATCOM, SSSC and UPFC devices
to adjust their control response at their defined locations as simulated and demonstrated in Figure 9-3
& 9-4 by using Matlab software. In the STATCOM internal control loop five control blocks are
demonstrated, referenced and measured voltage control blocks, reference and measured current
control blocks and measured power exchange control block of the each substation on the GCC power
grid, where the device is implemented. These control blocks provide a composite control function
based on the deviation to the final control element to adjust the converter gating pattern logic
operations to inject or absorb the reactive power. The reference values of each control block can be
manipulated by configuring control and operating limits and by dividing these devices’ control and
operational responses as discussed in section 9.9 and Table 9.7. In this model four internal control
loop operators are introduced D5 &D6 (STATCOM), D8 & D9 (SSSC), UPFC (D1, D2-STATCOM and
D3 & D4-SSSC) of each independent control loop. These operators indicate the control loop deviation
(reference_voltage)–(measured_voltage) and (Iq-reference)–(measured-current) of the STATCOM,
SSSC and UPFC based on the deviation convertor(s) gating operations can be accelerated or de-
accelerated. These deviations are plugged in the final control block by incorporating three operating

Chapter 10. FACTS-FRAME
158
and control ranges +/- 2, +/-4, and +/-6% compensation factors. Based on these factors the control
devices are customized to adjust the controllers’ reactive power compensation. After defining and
configuring, each control device response as discussed above, these controllers will adjust their
convertor(s) gating logic pattern operations based on (D5 &D6), (D8 & D9), (D1 & D2) and (D3 & D4)
operators’ deviations and are being calculated during the simulation process individually and
independently. This is also known as a de-centralized control system to control and monitor the device
locally at their locations. The internal control system will be responsible for controlling the line voltage
and power flow locally. This loop will also introduce two modes of operations’ capacitive and inductive
based on deviation to control each device locally. This is an integral part of the converter. The main
function of this control loop is to operate the power switches to generate fundamental output voltage
waveforms based on deviation as discussed above.
Figure 9-3: decentralized STATCOM, SSSC and UPFC control devices control topology on the GCC power grid [Matlab]

Chapter 10. FACTS-FRAME
159
Figure 9-4: decentralized or independent control topology of the FACTS devices [Matlab]
9.6. FACTS devices external/master control (Centralized Control)
In Appendix 9.B there was introduced and investigated an external control loop that is communicating
to all FACTS devices (STATCOM, SSSC & UPFC) in parallel operations through internal control loops
of each device. The external control loop is controlling the devices based on the mean value of the
deviation of all FACTS devices from different locations that are measured by the internal control loop
in real-time operations. The primary function of this controller is to communicate an internal control
loop to receive and send instructions based on defined operating and control boundaries of each
device. The internal control loop is connected to each device and evaluating the deviations by
comparing reference and measured value(s) of (line voltage, impedance and phase angle). All four
internal control loops will deliver their control deviation inform of D5 &D6 (STATCOM), D8 & D9
(SSSC), UPFC (D1, D2-STATCOM and D3 & D4-SSSC) deviations operators as inputs to the external
control loop as simulated and demonstrated in Figure 9-5 & 9-6.
After getting all four inputs the external control loop will calculate the mean value and generate control
action to the final control elements parallel to all devices. Based on the input signals intensity, these
devices will inject or absorb shared reactive power compensation 420Mvar minimum at +/-2%
deviation, 840Mvar at +/-4% deviation medium and 1250Mvar at +/-6% deviation, maximum.
This shared reactive power will penetrate automatically within a fraction of second equally into the
GCC power grid to overcome any operational contingencies. This is known as a centralized control
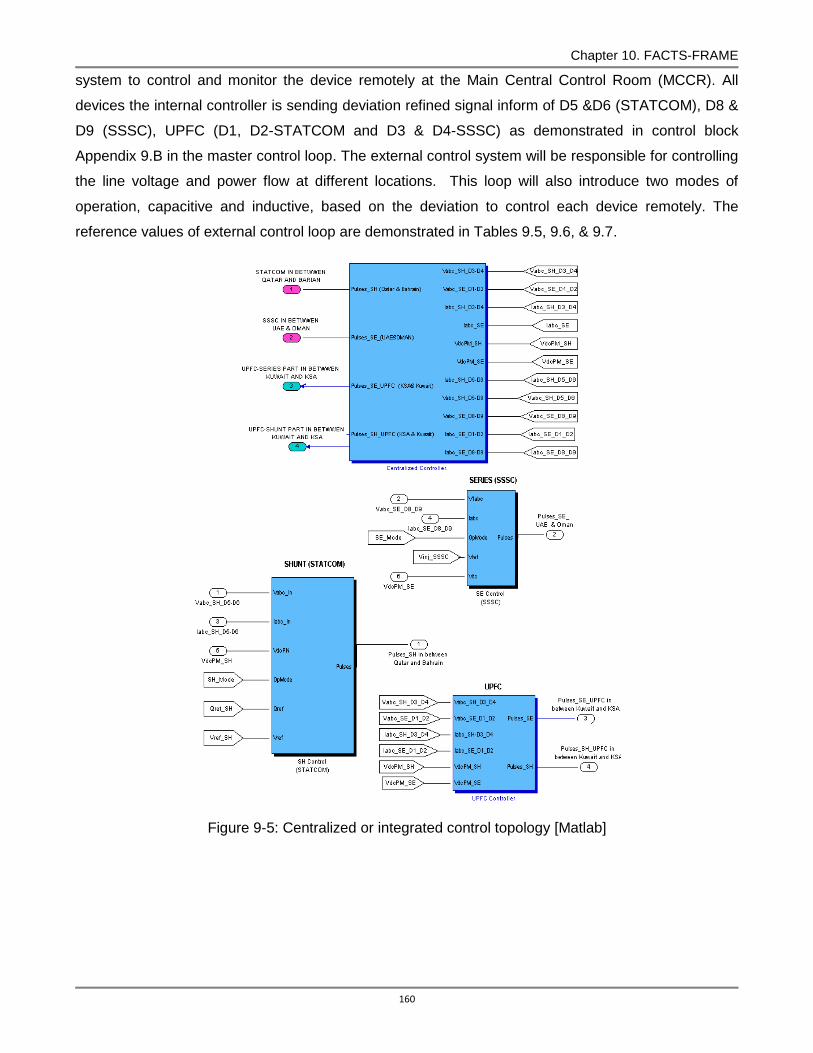
Chapter 10. FACTS-FRAME
160
system to control and monitor the device remotely at the Main Central Control Room (MCCR). All
devices the internal controller is sending deviation refined signal inform of D5 &D6 (STATCOM), D8 &
D9 (SSSC), UPFC (D1, D2-STATCOM and D3 & D4-SSSC) as demonstrated in control block
Appendix 9.B in the master control loop. The external control system will be responsible for controlling
the line voltage and power flow at different locations. This loop will also introduce two modes of
operation, capacitive and inductive, based on the deviation to control each device remotely. The
reference values of external control loop are demonstrated in Tables 9.5, 9.6, & 9.7.
Figure 9-5: Centralized or integrated control topology [Matlab]
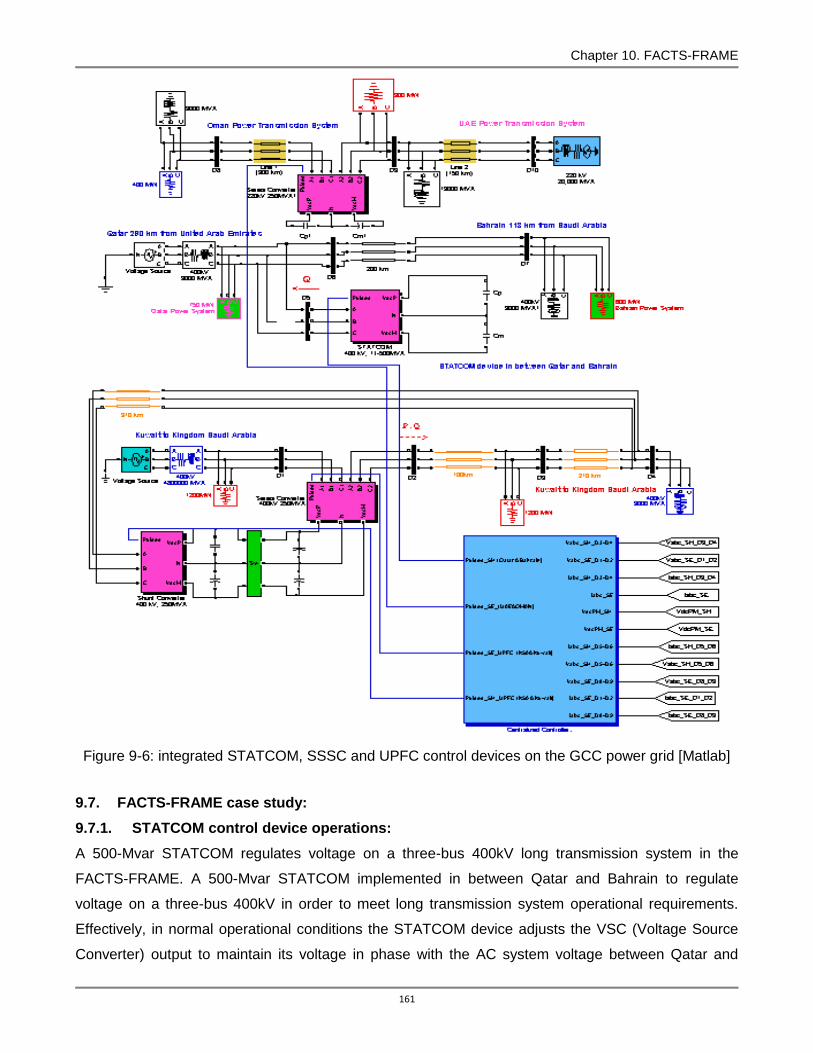
Chapter 10. FACTS-FRAME
161
Figure 9-6: integrated STATCOM, SSSC and UPFC control devices on the GCC power grid [Matlab]
9.7. FACTS-FRAME case study:
9.7.1. STATCOM control device operations:
A 500-Mvar STATCOM regulates voltage on a three-bus 400kV long transmission system in the
FACTS-FRAME. A 500-Mvar STATCOM implemented in between Qatar and Bahrain to regulate
voltage on a three-bus 400kV in order to meet long transmission system operational requirements.
Effectively, in normal operational conditions the STATCOM device adjusts the VSC (Voltage Source
Converter) output to maintain its voltage in phase with the AC system voltage between Qatar and

Chapter 10. FACTS-FRAME
162
Bahrain. The STATCOM device generates or absorbs the reactive power based on VSC (voltage
source converter) output voltage. It is very important to understand that the amount of reactive based
on converter output voltage magnitude and coupling transformer leakage reactance. The slight change
in voltage angle will allow a small amount of reactive power to flow to the DC bus in order to charge or
discharge capacitor bank. Appendices 1 & 2 illustrate 750 MW power exchanged by Qatar and 600
MW by Bahrain on the GCC Power grid [20], [21]. During the STATOCM operations the switches are
synchronized with supply voltage from the GCC power grid (V). This assumed to be sinusoidal of
frequency ω. Therefore the fundamental component, rms can be achieved as given below equation
(9.1)
(9.1)
If E1 > V the STATCOM device draws a capacitive reactive current in between Bahrain and Qatar (D5
& D6) on the GCC power grid as indicated in Figure 9-4 and 9-6. Whereas it will be in inductive from of
operations if E1 < V.
9.7.2. SSSC control device operations:
A 250-Mvar SSSC regulates voltage on a three-bus 220-kV long transmission system in the FACTS-
FRAME. A 250-Mvar SSSC controller adjusts converter output voltage in order to maintain 220kV AC
system long transmission line between Oman and United Arab Emirates. In the steady operation of
the SSSC control device, it maintains the Voltage source converter’s fundamental components in-
phase with the AC system between Oman and the UAE. In the first scenario if the converter output
voltage is higher than the system voltage than the SSSC generates the reactive power to increase the
system voltage against the reference value. If the AC system voltage is higher than the converter
output voltage than the SSSC absorbs reactive power from the system to reduce the voltage. It has
been identified and determined that the amount of reactive power depends on the VSC voltage
magnitude and on the transformer leakage reactance. The voltage source converter components are
controlled by varying the DC bus voltage. In order to charge or discharge the capacitor bank of the
SSSC the VSC (Voltage source converter) is temporarily phase shifted to flow active power to the
capacitor bank. This VSC voltage lag or lead produces a temporary flow of active power which results
in an increase or a decrease of capacitor voltages. Appendices 1 & 2 illustrate 400MW power from or
to Oman and 900MW from or to the United Arab Emirates on the GCC Power grid. As shown by the
waveforms, the transmission line voltage and reactive current are well controlled by implementing the
optimized control technique with a high degree of precision.
∗ ∗ (9.2)
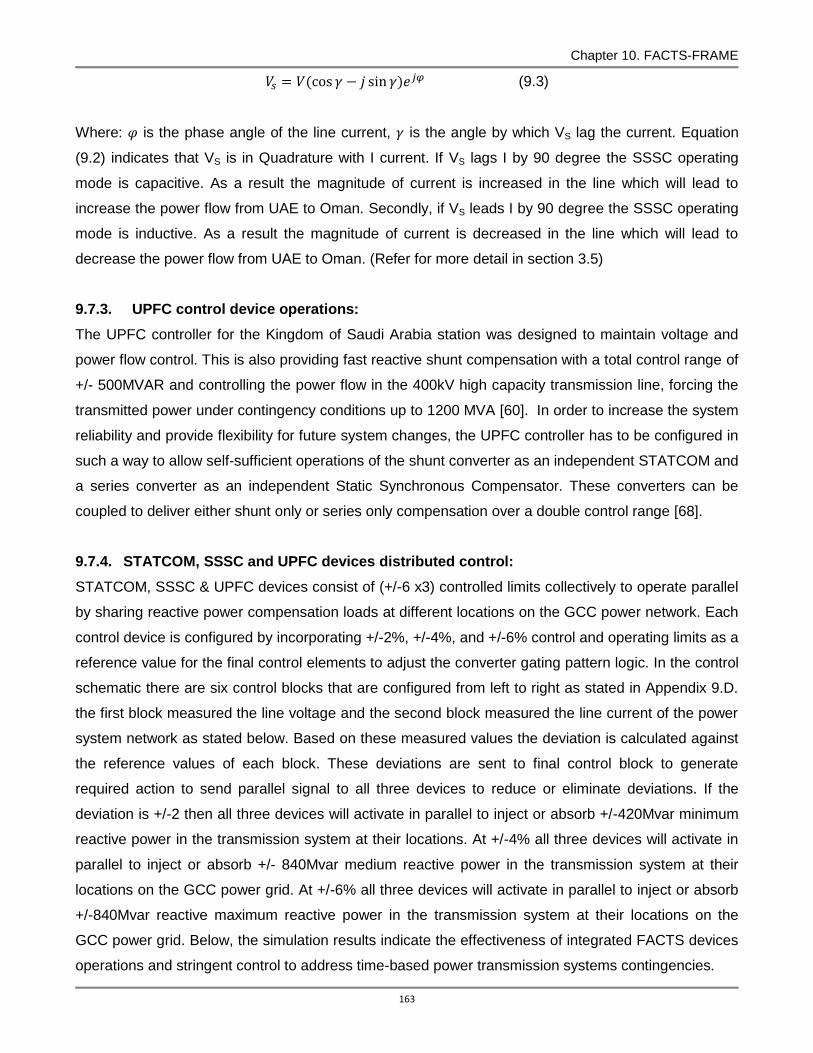
Chapter 10. FACTS-FRAME
163
(9.3)
Where: is the phase angle of the line current, is the angle by which VS lag the current. Equation
(9.2) indicates that VS is in Quadrature with I current. If VS lags I by 90 degree the SSSC operating
mode is capacitive. As a result the magnitude of current is increased in the line which will lead to
increase the power flow from UAE to Oman. Secondly, if VS leads I by 90 degree the SSSC operating
mode is inductive. As a result the magnitude of current is decreased in the line which will lead to
decrease the power flow from UAE to Oman. (Refer for more detail in section 3.5)
9.7.3. UPFC control device operations:
The UPFC controller for the Kingdom of Saudi Arabia station was designed to maintain voltage and
power flow control. This is also providing fast reactive shunt compensation with a total control range of
+/- 500MVAR and controlling the power flow in the 400kV high capacity transmission line, forcing the
transmitted power under contingency conditions up to 1200 MVA [60]. In order to increase the system
reliability and provide flexibility for future system changes, the UPFC controller has to be configured in
such a way to allow self-sufficient operations of the shunt converter as an independent STATCOM and
a series converter as an independent Static Synchronous Compensator. These converters can be
coupled to deliver either shunt only or series only compensation over a double control range [68].
9.7.4. STATCOM, SSSC and UPFC devices distributed control:
STATCOM, SSSC & UPFC devices consist of (+/-6 x3) controlled limits collectively to operate parallel
by sharing reactive power compensation loads at different locations on the GCC power network. Each
control device is configured by incorporating +/-2%, +/-4%, and +/-6% control and operating limits as a
reference value for the final control elements to adjust the converter gating pattern logic. In the control
schematic there are six control blocks that are configured from left to right as stated in Appendix 9.D.
the first block measured the line voltage and the second block measured the line current of the power
system network as stated below. Based on these measured values the deviation is calculated against
the reference values of each block. These deviations are sent to final control block to generate
required action to send parallel signal to all three devices to reduce or eliminate deviations. If the
deviation is +/-2 then all three devices will activate in parallel to inject or absorb +/-420Mvar minimum
reactive power in the transmission system at their locations. At +/-4% all three devices will activate in
parallel to inject or absorb +/- 840Mvar medium reactive power in the transmission system at their
locations on the GCC power grid. At +/-6% all three devices will activate in parallel to inject or absorb
+/-840Mvar reactive maximum reactive power in the transmission system at their locations on the
GCC power grid. Below, the simulation results indicate the effectiveness of integrated FACTS devices
operations and stringent control to address time-based power transmission systems contingencies.

Chapter 10. FACTS-FRAME
164
9.8. Observations:
9.8.1. Integrated STATCOM operations in the FACTS-FRAME:
Figure 9-7 is demonstrating the network response without STATCOM operations. Figure 9-8 indicates
the network behavior with STATCOM, and in the first trace there is variation of Vs and Vp voltage at
coupling transformer, but significant change observed in Ip primary side current in following pattern
(1.0 pu to -1.0pu), (0.5pu to -0.5pu), and (1.5pu to -1.5pu). In the second trace variation in the Vdc
voltage observed, it spiked from 0.007 to 0.2 second dropped at 22kV for 0.55 seconds and rose up to
21kV and stayed there to continue the rest of the operations. In the third trace the variation in Q_
measure and Q_ ref was observed. The Q_ measure shows variation from -0.35pu to -1.0pu and
again oscillated after 0.5 seconds as reactive power demand increased from -0.35pu to 0.85pu and
stayed there to continue rest of operations. In the last trace, variation in Vref against V_ measure
observed, the V_ measure shows spike 1.01pu within 0.1 second and dropped at 0.99pu in 0.5
second and stayed there to continue rest of operations. The STATCOM model demonstrates very
strong impact on GCC power grid in order to achieve following benefits. Figure 9.3 and Figure 9.4
indicate the power flow improvement profile at receiving before and after the STATCOM (switched off
and on).
750 MW power exchanged at Doha South Substation Qatar
600MW power exchanged at Al-Jasra substation Bahrain
Improved power flow in between Qatar and Bahrain
Meeting industrial and domestic load requirements at different atmospheric conditions without any
constraint.
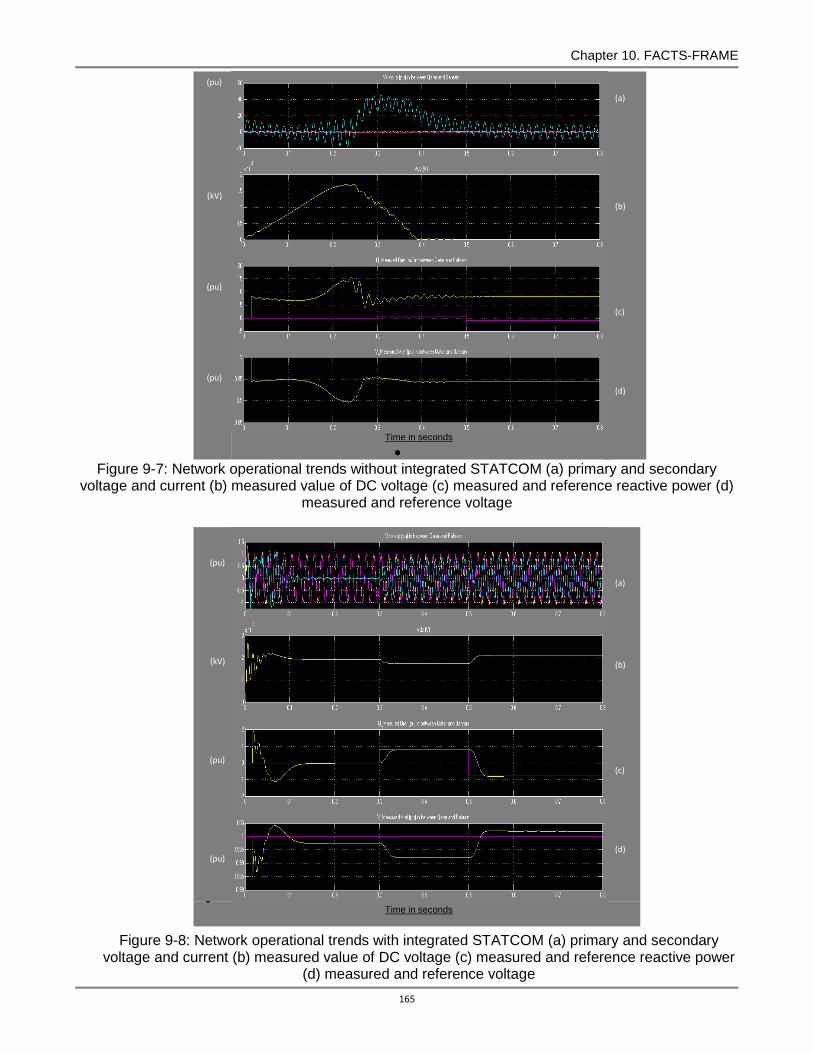
Chapter 10. FACTS-FRAME
165
Time in seconds
Figure 9-7: Network operational trends without integrated STATCOM (a) primary and secondary
voltage and current (b) measured value of DC voltage (c) measured and reference reactive power (d) measured and reference voltage
Time in seconds
Figure 9-8: Network operational trends with integrated STATCOM (a) primary and secondary
voltage and current (b) measured value of DC voltage (c) measured and reference reactive power (d) measured and reference voltage
(a)
(b)
(c)
(d)
(pu)
(kV)
(pu)
(pu)
(a)
(b)
(c)
(d)
(pu)
(kV)
(pu)
(pu)

Chapter 10. FACTS-FRAME
166
9.8.2. Integrated SSSC operations in the FACTS-FRAME
Figure 9-9 indicates the network response without SSSC operations between Oman and the United
Arab Emirates. Figure 9-10 is showing the SSSC operations results in integrated FACTS-FRAME. I In
the first trace there is variation of Vinj voltage injected in series, the magnitude was -0.02pu to 0.02pu
for 0.35 seconds and gradually increased up to -0.09pu to 0.09pu, and then stayed at -0.08 to 0.08 for
continue rest of operations. In the second trace variation in Iabc observed, there is small slight dent
(1.0pu-1.0pu) for 0.1 to 0.35 second and a rise up (1.05pu to -1.05pu) for 0.35 to 0.8 and it then
stayed there for rest of the operations. In the third trace variation of Mag _Vinj and Vref was observed,
the Vref changed from 0pu to 0.85pu for 0.3 to 0.44 second and stayed there for the rest of the
operations. In the fourth trace Vdc voltage was observed, it spiked up to 18kV for 0.03 to 0.43 second
and stayed there to continue th erest of the operations. In the last two traces variation of reactive
(Mvar) and active power (MW) at each line was observed. The SSSC model demonstrates very strong
impact in between Oman and UAE in the GCC power grid in order to achieve following benefits.
Figure 9-5 and 9-6 indicate the voltage profile at receiving end before and after the SSSC (switched
off and on)
400 MW power exchanged at Al‐wasset Substation Oman
900MW power exchanged at Al‐Ouhah substation UAE.
Improved load flow in between Oman and UAE
Meeting industrial and domestic load requirements at different atmospheric conditions without any
constraint.
Chapter 10. FACTS-FRAME
167
Time in seconds
Figure9-9: Network operational trends without integrated SSSC (a) injected voltage in series (b)
three phases measured and reference current (c) measured and reference value of injected voltage (d) measured value of DC voltage (e) three phases real power (f) three phases reactive
power
Time in seconds
(a)
(b)
(c) (d) (e) (f)
(pu)
(pu)
pu)
(kV)
(MW)
(Mvar)
(a)
(b)
(c) (d) (e) (f)
(pu)
(pu)
(pu)
(kV)
(MW)
(Mvar)
Chapter 10. FACTS-FRAME
168
Figure 9-10: Network operational trends with integrated SSSC (a) injected voltage in series (b)
three phases measured and reference current (c) measured and reference value of injected voltage (d) measured value of DC voltage (e) three phases real power (f) three phases reactive
power
9.8.3. Integrated UPFC operations in the FACTS-FRAME
Figure 9-11 indicates the network response without UPFC operations between Kuwait and KSA.
Figure 9-12 demonstrates the network response with UPFC operations in the FACTS-FRAME. In the
first trace there is variation of P against Pref observed, the Pref was 5pu for 0.25 second and then
increased to 12pu and stayed there for rest of the operations.
Similarly, the P varied for 0.25 to 0.55 seconds and spiked up to 12pu to match with Pref and then
stayed there to continue the rest of the operation. In the second trace there is variation of Q against
Qref observed, the Qref was -0.2pu for 0.5 second and then increased up to 2pu and stayed there for
the rest of the operations. Similarly, the Q varied for 0.001 to 0.15 seconds and spiked up to 2pu after
0.7 seconds to match with Qref and then stayed there to continue the rest of the operation. In the last
two traces variation of reactive (Mvar) and active power (MW) at each line was observed.
The SSSC model demonstrates very strong impact in between Oman and UAE in the GCC power grid
in order to achieve following benefits. Figure 9-7 and 9-8 indicate the voltage profile at receiving end
before and after the SSSC (switched off and on)
1200 MW power exchanged at Al‐Fadhili Substation KSA on the GCC power grid
1200MW power exchanged at Al‐Zour substation UAE on the GCC power grid
Improved load flow in between KSA and Kuwait
Meeting industrial and domestic load requirements at different atmospheric conditions without any
constraint.
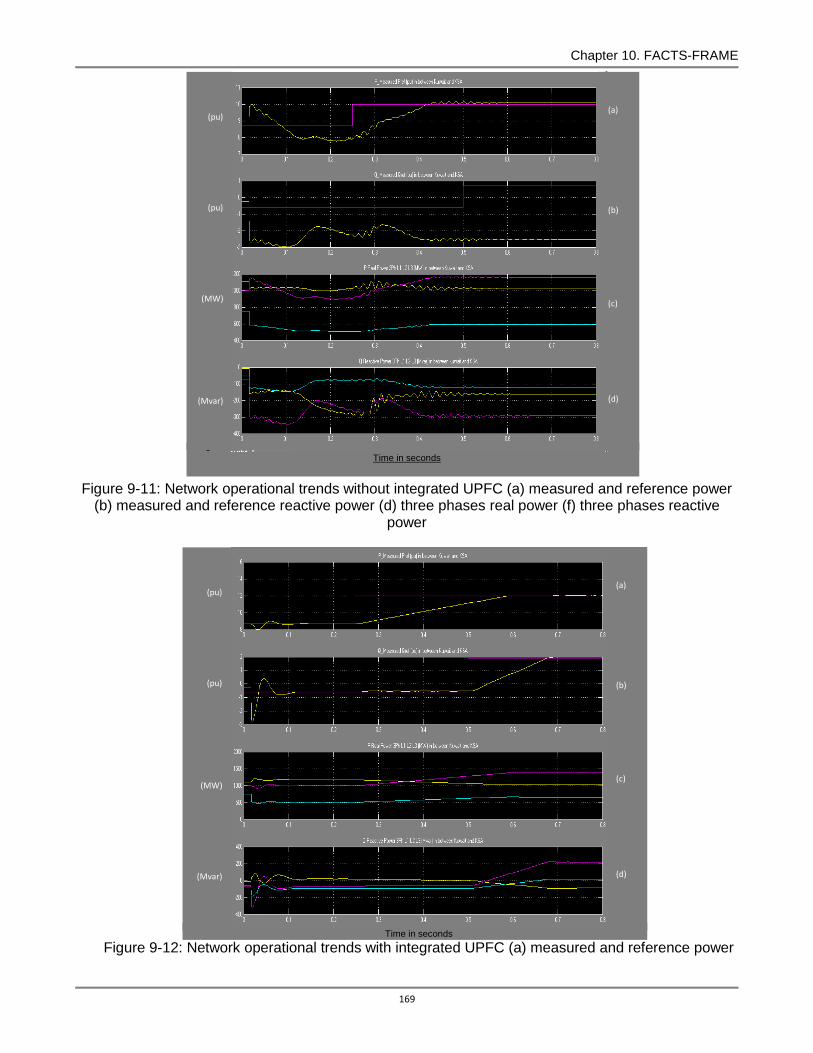
Chapter 10. FACTS-FRAME
169
Time in seconds
Figure 9-11: Network operational trends without integrated UPFC (a) measured and reference power
(b) measured and reference reactive power (d) three phases real power (f) three phases reactive power
Time in seconds
Figure 9-12: Network operational trends with integrated UPFC (a) measured and reference power
(pu)
(pu)
(MW)
(Mvar)
(a)
(b)
(c)
(d)
(pu)
(pu)
(MW)
(Mvar)
(a)
(b)
(c)
(d)
Chapter 10. FACTS-FRAME
170
(b) measured and reference reactive power (d) three phases real power (f) three phases reactive power
9.9. FACTS controllers integration
In order to establish the FACTS-FRAME baseline, it is very important to build its control and
operational capacity and capability. Table 9.1 indicates the classified data into two categories e.g.
Static and Dynamic Data to analyze the intensity and suitability of this data. This data is incorporated
as reference operating and control ranges as input values into the control blocks of the internal and
external control loops.
Table 9.2 shows country ID, power ID voltage ID against the defined power and voltage values e.g. V5
and V9 indicates the 220kV voltage at C5 and C9 (Oman and United Arab Emirates) the rest of the
GCC power system is operating at 400kV and 50Hz. These IDs and values are plugged-in control
block 1 & 3 as reference values of the internal and external (master) control loops as shown in
appendices 9.A & 9.B. These control blocks will determine the deviation against the measured values
for final action for internal or external control loops. The measured values are fetched from different
locations on the GCC power grid at different operating conditions. Table 9.3 shows the power change
IDs, voltage change IDs, country IDs and stations IDs e.g. VC1 (-/+) 0- 0.55% to VC9 (-/+) 4.46-
5.02%. On a similar pattern: PC1 (-/+) 2% to PC9 (-/+) 18%. These are the controller reference values
which are plugged into block 5 from left to right internal and external control loops of an appendix 9.A
and 9.B, based on the deviation the controller will act. Table 9.3 also illustrates the small step size of
variation to determine operational viability of each device during the compensation mode of
operations. Table 9.4 indicates the STATCOM, SSSC & UPFC parallel operations in capacitive and
inductive mode of operations. It also shows the corresponding PI control value of each control action.
These values are plugged in control blocks external (master) and internal (slave) control loops of
appendix.9.A & 9.B to enforce required compensation by considering STATCOM and SSSC & UPFC
controllers action from minimum to maximum at a small step size to the AC system on the GCC power
grid.
9.9.1. FACTS controllers implementation
Based on Table 9.3, if the VC1 to VC9 are greater than the converter voltage, than the STATCOM,
SSSC & UPFC will absorb reactive power from the AC power system parallel by employing three
controls and operating limits. Hence the converter current is perpendicular to the converter voltage if
the VC1 to VC9 are lesser/greater than the converter voltage, than the STATCOM, SSSC & UPFC will
generate/ absorb reactive power to the AC power system. Based on new research, there are three
limits that have developed each FACTS’ devices (minimum, medium and maximum). By implementing
this approach, there are numerous benefits that can be witnessed. In the first control scenario all three
of the control devices have a large margin to generate or absorb reactive power compensation without

Chapter 10. FACTS-FRAME
171
overloading the system. Secondly, the control system will generate a quicker response at a minimum
compensation factor based on the deviation. All three FACTS devices will share the compensation
load by injecting or absorbing 420Mvar reactive power and this will enhance power system stability
and reliability considerably [79], [80]. Based on these input PI controller configured to maintain these
three limits more precisely as demonstrated in Chapter no.9 and calculated PI controllers values are
depicted in appendices 7 to 13 of the same chapter.
1) If the deviation is small (-/+2%) than all three FACTS devices will be on capacitive or inductive
mode of operations at six control patterns at different locations.
2) If the deviation is medium (-/+4%) than all three FACTS devices will be on capacitive or inductive
mode of operations at six control patterns at different locations.
3) If the deviation is bigger (-/+6) than all three FACTS devices will be on capacitive or inductive
mode of operations at six control patterns at different control locations.
These devices will activate automatically against the defined voltage and power transfer deviation
demonstrated at S1/C1, S7/C7 and S6/C6 (substation-ID/country-ID) in Table 9.3 and 9.4.
9.9.2. FACTS-FRAME system architecture input data
These layers are communicating to each other as per defined operating and control boundaries as
stated in Table 9.1 to 9.7.
Table 9.1 demonstrates FACTS devices input data functionalities. This contains two types of data one
is static and other dynamic. Firstly, the static data comprises of each country IDs, substation IDs,
operational zones, and FACTS devices operating status (on and off). Mainly, the static data covered
various operational properties on the GCC power grid operational devices. Secondly the dynamic data
contains control deviation from a different location as well as three control patterns of FACTS devices
to adjust the converter gating response.
TABLE 9.1: FACTS DEVICES INPUT DATA FUNCTIONALITY
Table Name Data-Type Purpose Consequence If Data Not Present
GCC STATIC Contains a list (ID numbers, Name, zone and station) on the GCC. Each Country is assigned to a particular
function
Reference Data - Mandatory
FACTS_STATCOM
DYNAMIC Contains shunt controller, current injection in phase with the line voltage into system at the point of connection
only supply or consumes reactive power
strong impact on voltage control medium impact on system
stability and load flow control
FACTS_SSSC DYNAMIC Contains series controller, voltage injection into with the line current quadture of the AC system at the point of connection, AC voltage magnitude can be varied by
changing modulation ratio
Strong impact to increase system performance by reducing the line
impedance
FACTS_UPFC DYNAMIC Contains series voltage and shunt current compensation controllers
strong impact to enhance power transmission performance,
voltage, load flow and stability
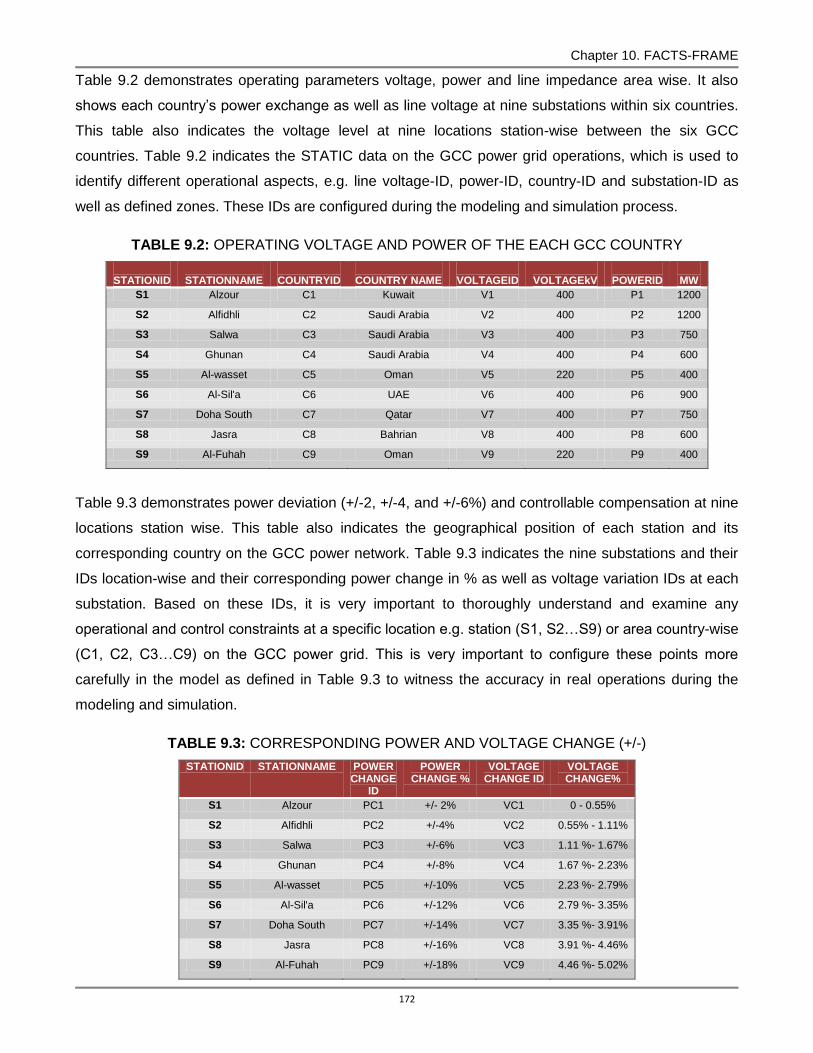
Chapter 10. FACTS-FRAME
172
Table 9.2 demonstrates operating parameters voltage, power and line impedance area wise. It also
shows each country’s power exchange as well as line voltage at nine substations within six countries.
This table also indicates the voltage level at nine locations station-wise between the six GCC
countries. Table 9.2 indicates the STATIC data on the GCC power grid operations, which is used to
identify different operational aspects, e.g. line voltage-ID, power-ID, country-ID and substation-ID as
well as defined zones. These IDs are configured during the modeling and simulation process.
TABLE 9.2: OPERATING VOLTAGE AND POWER OF THE EACH GCC COUNTRY
STATIONID
STATIONNAME
COUNTRYID
COUNTRY NAME
VOLTAGEID
VOLTAGEkV
POWERID
MW
S1 Alzour C1 Kuwait V1 400 P1 1200
S2 Alfidhli C2 Saudi Arabia V2 400 P2 1200
S3 Salwa C3 Saudi Arabia V3 400 P3 750
S4 Ghunan C4 Saudi Arabia V4 400 P4 600
S5 Al-wasset C5 Oman V5 220 P5 400
S6 Al-Sil'a C6 UAE V6 400 P6 900
S7 Doha South C7 Qatar V7 400 P7 750
S8 Jasra C8 Bahrian V8 400 P8 600
S9 Al-Fuhah C9 Oman V9 220 P9 400
Table 9.3 demonstrates power deviation (+/-2, +/-4, and +/-6%) and controllable compensation at nine
locations station wise. This table also indicates the geographical position of each station and its
corresponding country on the GCC power network. Table 9.3 indicates the nine substations and their
IDs location-wise and their corresponding power change in % as well as voltage variation IDs at each
substation. Based on these IDs, it is very important to thoroughly understand and examine any
operational and control constraints at a specific location e.g. station (S1, S2…S9) or area country-wise
(C1, C2, C3…C9) on the GCC power grid. This is very important to configure these points more
carefully in the model as defined in Table 9.3 to witness the accuracy in real operations during the
modeling and simulation.
TABLE 9.3: CORRESPONDING POWER AND VOLTAGE CHANGE (+/-)
STATIONID STATIONNAME POWER CHANGE
ID
POWER CHANGE %
VOLTAGE CHANGE ID
VOLTAGE CHANGE%
S1 Alzour PC1 +/- 2% VC1 0 - 0.55%
S2 Alfidhli PC2 +/-4% VC2 0.55% - 1.11%
S3 Salwa PC3 +/-6% VC3 1.11 %- 1.67%
S4 Ghunan PC4 +/-8% VC4 1.67 %- 2.23%
S5 Al-wasset PC5 +/-10% VC5 2.23 %- 2.79%
S6 Al-Sil'a PC6 +/-12% VC6 2.79 %- 3.35%
S7 Doha South PC7 +/-14% VC7 3.35 %- 3.91%
S8 Jasra PC8 +/-16% VC8 3.91 %- 4.46%
S9 Al-Fuhah PC9 +/-18% VC9 4.46 %- 5.02%

Chapter 10. FACTS-FRAME
173
Table 9.4 demonstrates the STATCOM, SSSC and UPFC three control limits and corresponding PI
control values. These PI control values are incorporated to adjust STATCOM, SSSC & UPFC
converters gating responses into three control limits to generate/absorb reactive power compensation
((+/-2, +/-4, and +/-6%) at different location on the GCC power grid. Table 9.4 indicates the individual
and joint control operations of all three FACTS devices. In this table nine control patterns of three
FACTS devices are demonstrated in chronological order. Each control pattern indicates its defined
control and operating limits. These control limits have three operating and control ranges likewise +/-
2, +/-4, and +/-6%. In the first control range all the three devices will generate a minimum response in
parallel operation, on the second control range medium and on the third control range these devices
will be on full capacitive or inductive mode of parallel operations. Effectively, these three devices will
share the load and provide reactive power compensation +/-420Mvar at minimum deviation and +/-
840Mvar at medium deviation and 1250Mvar at maximum deviation. These distributed control limits
provide an excellent flexible in-parallel operation of these devices without any constraint or
overloading of the system.
TABLE 9.4: COMBINATIONS OF THREE FACTS DEVICES (+/-)
DEVICE ID
DEVICE NAME
COUNTRYID STATIONID
CAPACTIVIE CONTROL ID
P (POR)
I (INT)
REFERENCE VOLTAGE(kV)
MEASURED VOLTAGE (kV)
ERROR IN %
ST STATCOM S1/C1 CC1/LC1 0.32 0.6 440 437.58 +/-2%
ST STATCOM S1/C1 CC11/LC11 0.36 0.8 440 435.12 +/-4%
ST STATCOM S1/C1 CC111/LC111 0.38 0.9 440 432.66 +/-6%
SS SSSC S7/C7 CC2/LC2 0.32 0.6 440 427.74 +/-2%
SS SSSC S7/C7 CC22/LC22 0.36 0.8 440 425.28 +/-4%
SS SSSC S7/C7 CC222/LC222 0.38 0.9 440 422.82 +/-6%
UP UPFC S6/C6 CC3/LC2 0.32 0.6 440 417.90 +/-2%
UP UPFC S6/C6 CC33/LC22 0.36 0.8 440 415.44 +/-4%
UP UPFC S6/C6 CC333/LC333 0.38 0.9 440 412.98 +/-6%
Table 9.5 indicates the line voltage, power and frequency at different locations on the GCC power grid.
This contains six countries (Qatar, Bahrain, Oman, Kuwait, KSA and United Arab Emirates). Table 9.5
demonstrates operating parameters that are measured at different locations on the GCC power grid.
These parameters are very important to configure and simulate steady or dynamic control models by
integrating FACTS devices. This table indicates that the GCC power grid divided into six subsystems
based on the GCC power system’s operational requirements. Firstly, the Qatar power system is
connected to the GCC 400kV, 50Hz power grid at the Doha south substation to share 750MW.
Secondly, the Bahrain power system is connected to the GCC 400kV, 50Hz power grid at Al-ghunan
substation to share 600MW. Thirdly, the UAE power system is connected to the GCC 400kV 50Hz
power grid at Salwa substation to share 900MW. Fourthly, the Oman power system is connected to
the GCC 220kV 50Hz power grid at Al-Sila substation in the UAE to share 400MW. Fifthly, the KSA
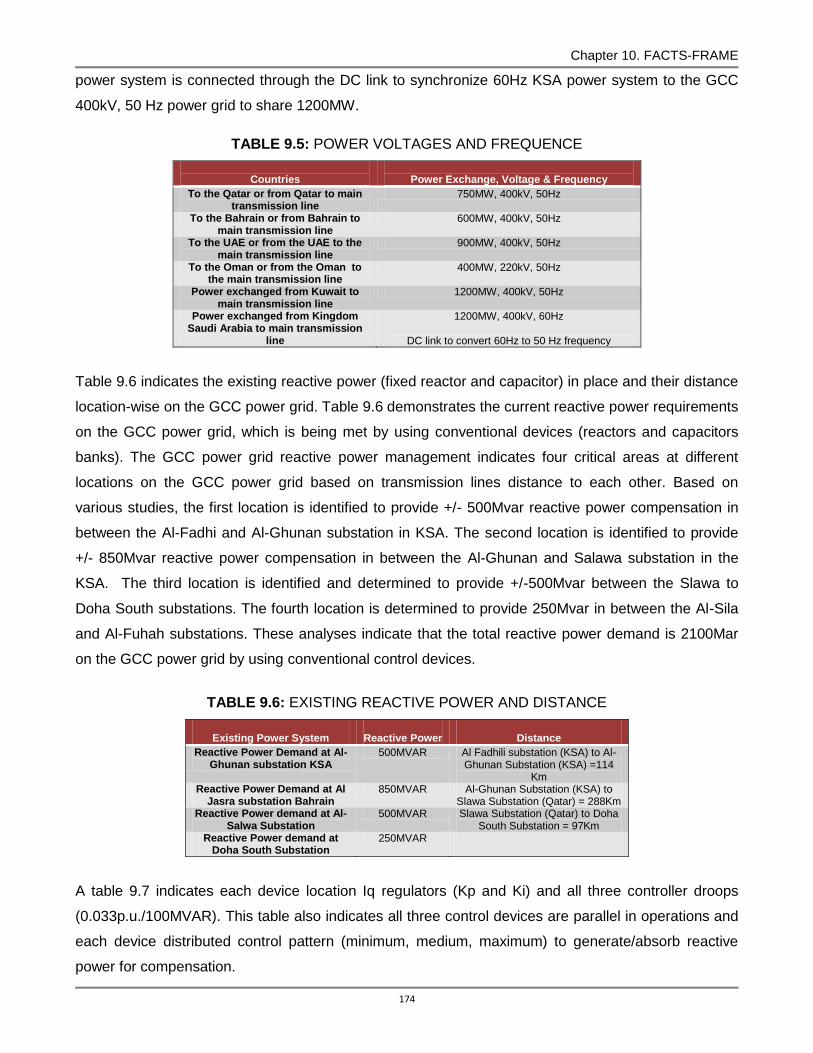
Chapter 10. FACTS-FRAME
174
power system is connected through the DC link to synchronize 60Hz KSA power system to the GCC
400kV, 50 Hz power grid to share 1200MW.
TABLE 9.5: POWER VOLTAGES AND FREQUENCE
Countries
Power Exchange, Voltage & Frequency
To the Qatar or from Qatar to main transmission line
750MW, 400kV, 50Hz
To the Bahrain or from Bahrain to main transmission line
600MW, 400kV, 50Hz
To the UAE or from the UAE to the main transmission line
900MW, 400kV, 50Hz
To the Oman or from the Oman to the main transmission line
400MW, 220kV, 50Hz
Power exchanged from Kuwait to main transmission line
1200MW, 400kV, 50Hz
Power exchanged from Kingdom Saudi Arabia to main transmission
line
1200MW, 400kV, 60Hz
DC link to convert 60Hz to 50 Hz frequency
Table 9.6 indicates the existing reactive power (fixed reactor and capacitor) in place and their distance
location-wise on the GCC power grid. Table 9.6 demonstrates the current reactive power requirements
on the GCC power grid, which is being met by using conventional devices (reactors and capacitors
banks). The GCC power grid reactive power management indicates four critical areas at different
locations on the GCC power grid based on transmission lines distance to each other. Based on
various studies, the first location is identified to provide +/- 500Mvar reactive power compensation in
between the Al-Fadhi and Al-Ghunan substation in KSA. The second location is identified to provide
+/- 850Mvar reactive power compensation in between the Al-Ghunan and Salawa substation in the
KSA. The third location is identified and determined to provide +/-500Mvar between the Slawa to
Doha South substations. The fourth location is determined to provide 250Mvar in between the Al-Sila
and Al-Fuhah substations. These analyses indicate that the total reactive power demand is 2100Mar
on the GCC power grid by using conventional control devices.
TABLE 9.6: EXISTING REACTIVE POWER AND DISTANCE
Existing Power System
Reactive Power
Distance
Reactive Power Demand at Al-Ghunan substation KSA
500MVAR Al Fadhili substation (KSA) to Al-Ghunan Substation (KSA) =114
Km Reactive Power Demand at Al
Jasra substation Bahrain 850MVAR Al-Ghunan Substation (KSA) to
Slawa Substation (Qatar) = 288Km Reactive Power demand at Al-
Salwa Substation 500MVAR Slawa Substation (Qatar) to Doha
South Substation = 97Km Reactive Power demand at
Doha South Substation 250MVAR
A table 9.7 indicates each device location Iq regulators (Kp and Ki) and all three controller droops
(0.033p.u./100MVAR). This table also indicates all three control devices are parallel in operations and
each device distributed control pattern (minimum, medium, maximum) to generate/absorb reactive
power for compensation.
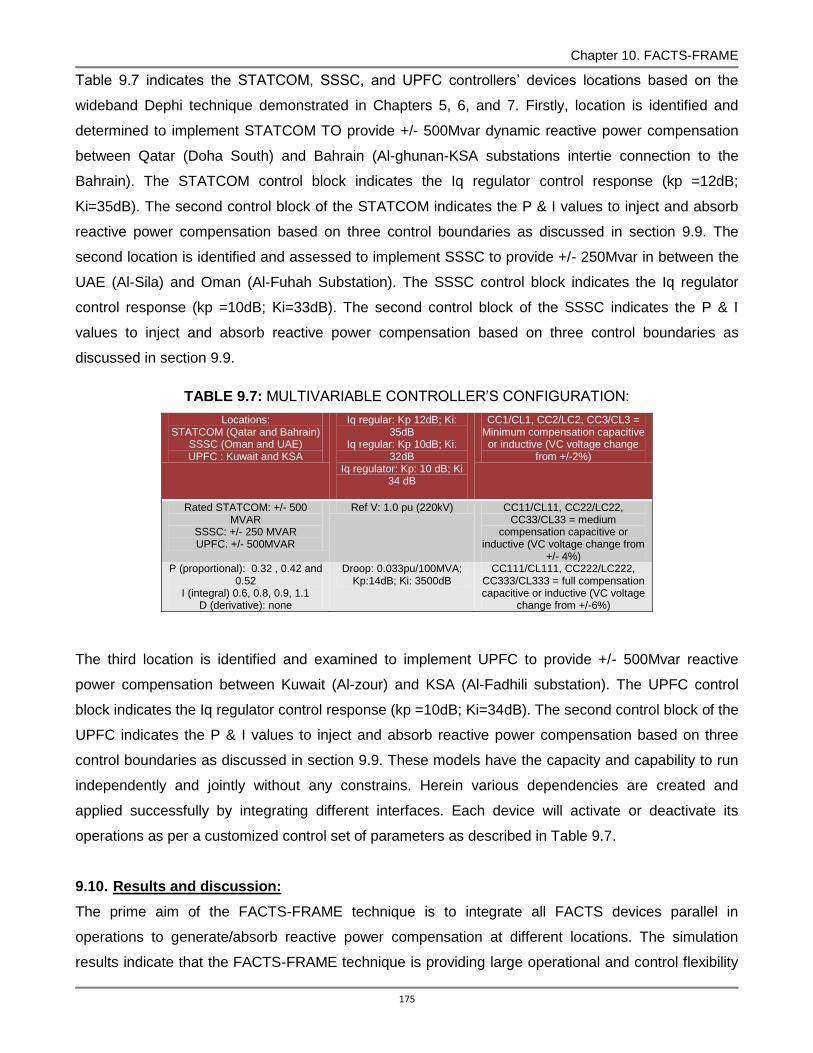
Chapter 10. FACTS-FRAME
175
Table 9.7 indicates the STATCOM, SSSC, and UPFC controllers’ devices locations based on the
wideband Dephi technique demonstrated in Chapters 5, 6, and 7. Firstly, location is identified and
determined to implement STATCOM TO provide +/- 500Mvar dynamic reactive power compensation
between Qatar (Doha South) and Bahrain (Al-ghunan-KSA substations intertie connection to the
Bahrain). The STATCOM control block indicates the Iq regulator control response (kp =12dB;
Ki=35dB). The second control block of the STATCOM indicates the P & I values to inject and absorb
reactive power compensation based on three control boundaries as discussed in section 9.9. The
second location is identified and assessed to implement SSSC to provide +/- 250Mvar in between the
UAE (Al-Sila) and Oman (Al-Fuhah Substation). The SSSC control block indicates the Iq regulator
control response (kp =10dB; Ki=33dB). The second control block of the SSSC indicates the P & I
values to inject and absorb reactive power compensation based on three control boundaries as
discussed in section 9.9.
TABLE 9.7: MULTIVARIABLE CONTROLLER’S CONFIGURATION:
Locations: STATCOM (Qatar and Bahrain)
SSSC (Oman and UAE) UPFC : Kuwait and KSA
Iq regular: Kp 12dB; Ki: 35dB
Iq regular: Kp 10dB; Ki: 32dB
Iq regulator: Kp: 10 dB; Ki 34 dB
CC1/CL1, CC2/LC2, CC3/CL3 = Minimum compensation capacitive or inductive (VC voltage change
from +/-2%)
Rated STATCOM: +/- 500 MVAR
SSSC: +/- 250 MVAR UPFC: +/- 500MVAR
Ref V: 1.0 pu (220kV) CC11/CL11, CC22/LC22, CC33/CL33 = medium
compensation capacitive or inductive (VC voltage change from
+/- 4%) P (proportional): 0.32 , 0.42 and
0.52 I (integral) 0.6, 0.8, 0.9, 1.1
D (derivative): none
Droop: 0.033pu/100MVA; Kp:14dB; Ki: 3500dB
CC111/CL111, CC222/LC222, CC333/CL333 = full compensation capacitive or inductive (VC voltage
change from +/-6%)
The third location is identified and examined to implement UPFC to provide +/- 500Mvar reactive
power compensation between Kuwait (Al-zour) and KSA (Al-Fadhili substation). The UPFC control
block indicates the Iq regulator control response (kp =10dB; Ki=34dB). The second control block of the
UPFC indicates the P & I values to inject and absorb reactive power compensation based on three
control boundaries as discussed in section 9.9. These models have the capacity and capability to run
independently and jointly without any constrains. Herein various dependencies are created and
applied successfully by integrating different interfaces. Each device will activate or deactivate its
operations as per a customized control set of parameters as described in Table 9.7.
9.10. Results and discussion:
The prime aim of the FACTS-FRAME technique is to integrate all FACTS devices parallel in
operations to generate/absorb reactive power compensation at different locations. The simulation
results indicate that the FACTS-FRAME technique is providing large operational and control flexibility
Chapter 10. FACTS-FRAME
176
on the GCC power grid without any constraints. FACTS devices’ integration provides numerous
benefits. If there is a small (+/-2%) deviation on power transfer or voltage quality all three devices will
generate/absorb time-based reactive power in parallel to eliminate the deviation. On the same control
pattern if the deviation is medium (+/-4%) on power flow and voltage quality, all three devices will
activate and generate/absorb reactive power compensation respectively. Lastly, if the deviation is
large (+/-6%) on the power flow and voltage quality, all three devices will activate and generate/absorb
reactive power compensation accordingly.
By this technique one of the devices can be isolated for maintenance purpose for the long- or short-
term basis or backup without disturbing network operations at different locations. This will also
increase the uptime of the various equipments without any genuine or spurious trips. The results show
that FACTS-FRAME has a versatile capability by integrating all FACTS devices to provide reliable,
continuous control of the transmission line current, provide dynamic control of power flow, reduce fault
current, damps SSR oscillation, improve the voltage profile, power angle and stability margin on the
GCC power grid. It also exhibits a positive impact on neighboring countries’ power system operations
on the GCC power grid.
9.11. Summary:
In this chapter, a multi-variable controller was developed which will be able to communicate and
control all FACTS devices (STATCOM, SSSC, and UPFC) that are in operation at any one time. An
optimization technique was developed to identify and determine the composite location of the FACTS
devices and their operating parameters, which are providing reactive power compensation as
appropriate to enhance over-all network performance and reducing the network losses. The results
indicate massive improvement if all devices are parallel in operation at different locations on the GCC
power grid. In order to share an appropriate power (real or reactive), different combinations of FACTS
devices and their corresponding PI controllers have been developed and implemented to obtain very
promising results. Based on study STATCOM, SSSC and UPFC models are customized to serve the
purpose. Furthermore as a drawback standpoint of this study, the power exchange ought to be
monitored and examined on a critical basis to take preventive measures for any possible network
violation, which may lead to the GCC blackout.

177
10.1 PI Controller Configuration Parameters Selection Process & Significance:
The STATCOM, SSSC and UPFC control devices’ parallel operational responses are customized by
using P & I configuration parameters. These parameters are identified and implemented to share the
control responses into three operating and control limits to adjust minimum, medium and maximum
reactive power compensation in both capacitive and inductive mode of operations. A first set of PI
control model’s detailed calculations are performed and a mathematical model developed and
synthesized by incorporating a new set of PI configuration values as demonstrated in Appendix 5.A
6.A & 7.A. Firstly, to control the 400kV power transmission line voltage of the AC power system
between the Qatar and Bahrain as well as KSA and Kuwait, secondly 220kV power transmission line
voltage of the AC power system between the Oman and United Arab Emirates on the GCC power
network.
On a time-domain simulation results are very encouraging and validating the PI controller robustness.
Based on these results and effective integration, a multiple portal of the controller was developed and
synthesized which is leading to run all three devices in parallel or independently to overcome any type
of power transmission line contingences at different location(s) on the GCC power network as
simulated and demonstrated in Appendix 9.D
These models are developed based on worst case scenarios to investigate most optimum PI control
parameters to manipulate and adjust reactive power compensation as per defined three control limits,
but in the real world these models will demonstrate different operating and control boundaries based
on voltage and power deviation on the sending and receiving ends of the AC power system. In the first
case, if the deviation is large then the controller needs a big step size to inject or absorb reactive
power to minimize the deviation and stabilize the control loop. In the second case, if the deviation is
small then the controller will take a small step size to inject and absorb reactive power in order to
minimize the deviation on the AC power system. By dividing and distributing the PI controller
operating and control parameters to integrate into three small limits (operating ranges) which will
provide tangible and ultimate control on reactive power compensation with small step size without any
constraints. This will also lead to making the controller response faster. However, the results indicate
that this approach has a great potential to enhance controller dynamic performance at a minimum cost
and it may stabilize the control loop within 10-15 iteration. This is an instrumental concept to address a
wide range of power system stability issues and control integration without any additional control
support on the GCC power network.
CHAPTER 10
Significance of this Research Work
Chapter 10. Significance of this research work
178
10.2 Internal and External Controls Significance:
In order to control the STATCOM, SSSC and UPFC devices individually and jointly (integrated) a well-
controlled- five-layers mesh distributed control system was developed to manipulate and adjust the
reactive power compensation based on line voltage, impedance, phase angle and power flow
deviation at different locations on the GCC countries, this is also called the FACTS-FRAME as shown
in Figure 9-1 and 9-2. In the first layer of control, all existing parameters on the GCC power grid are
incorporated independently into internal control of the FACTS-FRAME. In the second layer of control,
the STATCOM, SSSC and UPFC devices control and operating parameters are incorporated. In the
third layer of control, the GCC countries defined operational limitation and required reactive power
compensations are incorporated as shown in Tables 9.1 to 9.7. In the fourth layer of the control,
STATCOM, SSSC and UPFC devices integration and independency of the control topologies are
incorporated. In the fifth layer a distributed control system is introduced with two control patterns
decentralized & centralized as demonstrated in Appendices 9.A (internal control) and 9.B (external
control). Firstly, the decentralized control is implemented to control the STATCOM, SSSC & UPFC
devices operations independently and locally based on their operating and control parameters
deviation (voltage, impedance and power flow) at their locations. Chapters 5, 6 and 7 reveal the
individual FACTS devices simulation results that are very much encouraging and promising.
After successful implementation, the decentralized control system will provide independent FACTS
devices operations but at limited control and operating margins. These devices will offer well-
controlled load flow, power stability by series compensation and voltage quality by shunt
compensation at different locations on the GCC power grid. In fact, this type of control topology did not
offer a control flexibility to share the operational load and to carry out routine maintenance from time to
time. For routine maintenance of any FACTS device, it is very important to isolate partially or fully the
certain power system facilities for a certain period of time if there is no backup.
Secondly, the centralized control system offers an excellent control flexibility and robustness. The
centralized control is implemented to control the STATCOM, SSSC & UPFC devices operations
collectively and remotely, based on their operating parameters deviation (voltage, impedance, angle,
power flow). Chapter 9 demonstrates the integrated FACTS devices operational results which are very
encouraging and promising. Through a centralized control system numerous benefits can be
witnessed after its successful application. This system will provide parallel FACTS devices at a wide
operating margin. The centralized control system will make available well-controlled load flow, power
stability by series compensation and voltage quality by shunt compensation at different locations on
the GCC power grid. Furthermore, this type of control topology has great potential to share the

Chapter 10. Significance of this research work
179
operational load and to perform routine maintenance from time to time without any system downtime
and process ambiguity by isolating any device from the power system.
10.3 Operational and Maintenance Control Significance:
These both centralized and decentralized control topologies have a great potential to run these
devices in a multiple mode of operations without any constraints. By implementing centralized control
topology, numerous benefits can be witnessed during this operation. Firstly, in summer case, there is
high power demand from the domestic and industrial consumers on the GCC countries. In order to
meet high power demands all three devices will operate parallel to meet wide-range of operational
requirements at different locations on the GCC power grid in real-time operations. The centralized
controller has a capability to link or delink the relevant device(s) (STATCOM, SSSC & UPFC) to inject
or absorb reactive power as well as to increase or reduce the real power transfer to meet the AC
power system requirements. This is also known as extensive flexible power system operations.
The second capability of this controller is to share the reactive power load in between two or three
devices as per the AC power system needs. In winter case, there is low power demand from the
domestic and industrial consumers on the GCC countries. The simulation results indicate that at off-
peak power demand two FACTS devices parallel operations can provide adequate reactive power
compensation to the AC power transmission system on the GCC power grid and the other device can
be on standby mode as a spinning reserve or can be isolated for maintenance purpose. In this
operational scenario the most important and critical part is to select the most optimum combination of
these devices e.g. STATCOM-SSSC or UPFC-STATCOM or UPFC-SSSC. During this combination
one device will be on standby mode all the time and it will resume its operations only in an emergency
case. After long run of any two devices combination one of them can be isolated for schedule or
preventive maintenance by replacing standby device. This type of maintenance operational strategy
will provide maximum uptime of the power system without any type of downtime by implementing
predictive and proactive corrective maintenance strategic programmes. In order to implement these
programmes effectively, the SAP and MAXIMA industrial applications have been implemented in many
companies. First type of maintenance strategy is a predictive maintenance. This is also called the
Time-Based-Maintenance (TBM) which is costly but more effective. Second type of maintenance
strategy is a proactive corrective maintenance. This is also called the Condition-Based-Maintenance
“run to failure” (RTF) which is cheaper and effective. This type of operational strategy also provides
monetary benefit to the company as well as wide range of operational flexibility.
10.4 FACTS Devices Selection Process’s Significance
Chapter 10. Significance of this research work
180
Based on comprehensive feedback received from the highly skilled personnel from industry and
academia, a strong portal is developed for the STATCOM, SSSC & UPFC. These inputs are
integrated by using Wideband Delphi technique in order to investigate, generate and allocate near
optimal values of significant and submission criteria(s) as established in Tables 5.1, 5.2 and 5.3 for the
STATCOM, Tables 6.1, 6.2, 6.3 for the SSSC and 7.1, 7.2, 7.3 for the UPFC. As the results are
demonstrated in the tables which indicate the strengths of each FACTS device based on 12 areas
criteria significance. The STATCOM is a first candidate to be installed in between the Qatar and
Bahrain on the GCC power grid. The STATCOM has a great potential to diminish the effect of grid
disturbance and susceptible on load near the load center. The SSSC is a second candidate to be
installed in between the UAE and Oman on the GCC power grid. The SSSC has a great potential to
be installed near the critical substation in order to mitigate low voltage during active power swing as
well as to prevent excessive under or overvoltage circumstances in the event of if any major power
line or generation lost on the GCC power grid. The UPFC is a third candidate to be installed in
between the KSA and Oman on the GCC power grid. The SSSC has a great potential to be installed
near the supply point of major industrial and other types of commercial loads in order to support
temporary under or overvoltage conditions. These devices will also act as compensator in order to
improve voltage quality on the GCC power grid whenever there is disturbance.
10.5 STATCOM, SSSC & UPFC Controllers Integration Significance:
These devices consist of 18 controlled limits collectively to operate in parallel by sharing reactive
power compensation loads at different locations on the GCC power network. Each device comprises 6
operating and control; limits three positive (+2, +4, +6) and three negative (-2, -4, -6). Which split each
limit’s corresponding capacitive and inductive compensation factor? These limits are operating on a
small step size to inject or absorb reactive power based on each control limit’s corresponding PI
control parameters. These controllers control and operate boundaries and their corresponding PI
values are configured by using the Cooper Douglas control technique as discussed in Chapter 9. The
corresponding PI control values are simulated and are against each control limit to (+/-) to accelerate
or de-accelerate the STATCOM, SSSC & UPFC operations in order to meet required reactive power
compensation at defined locations on the GCC power grid.
Furthermore, these control limits are plugged into internal control loop’s calculation blocks as
described in Appendix 9.A. These blocks have been configured by incorporating reference values
against the measured variables of voltage, current and firing angle. After getting the measured
variable from different locations on the GCC power grid, these control blocks are calculating the
operational and control deviation by using reference values against the measured variables. Based on
the identified deviation the control blocks will determine the required reactive power compensation at
each operational point and generate a signal (+/-). If the control and operational deviation is small +/-

Chapter 10. Significance of this research work
181
2% than the FACTS controller will adjust minimum its converter gating response with its minimum
corresponding PI control values in order to meet minimum reactive power compensation. If the
deviation is medium +/-4% than the FACTS controller will adjust its medium gating response with its
medium corresponding PI values to meet medium compensation to the power system network.
Similarly, if the deviation is large +/- 6% than the FACTS controller will adjust maximum its converter
gating response with it maximum corresponding PI control value in order to meet maximum reactive
power compensation on the GCC network.
182
This thesis presents the development of five inter-related works (geographical position of each
country, location of each device, each device selection process, integrated communication interface of
STATCOM, SSSC & UPFC, and control pattern of each FACTS device). A framework for
implementation of the aforementioned FACTS devices on the GCC power grid has been investigated
in order to achieve the following benefits:
Increased power transfer capability and capacity in the GCC power grid.
Improved GCC power grid operational reliability
Improved GCC power grid controllability
Enhanced angular and voltage stability
In this research work long transmission lines basic principals are discussed, operating parameters and
compensation level and how these could be obtained by putting its operational and security criticalities
into consideration is also discussed. Hereby, simple shunt and series compensation techniques are
adopted to develop STATCOM, SSSC and UPFC models for implementation in order to provide
appropriate shunt and series compensation in the GCC power grid as applicable.
The STATCOM control device connection between the Qatar and Bahrain: shunt compensation and
its operating parameters viabilities and criticalities are investigated. By using a STATCOM control
device both capacitive and inductive modes of operations are demonstrated by putting its control and
operational criticalities into consideration. Simulation results indicate the effectiveness of the
STATCOM control device between Qatar and Bahrain. A detailed STATCOM model is designed,
configured and implemented between Qatar and Bahrain on the GCC power grid. In this study, two
new techniques are introduced and their effectiveness is demonstrated. Firstly, the STATCOM device
selection process was introduced by implementing the Wideband Delphi methodology and another
technique is used to share STATCOM control device operations into three control limits; this is known
as a Douglas Cooper PID controller’s optimization. The primary aim of the STATCOM device selection
and implementation purpose is to enhance voltage quality between Qatar and Bahrain and it has a
medium-positive impact on power system stability that has been obtained by implementing a new
control technique. In this technique three control limits are investigated and synthesized to share the
STATCOM operational response in order to provide reactive power compensation in shunt based on
the power transmission network operating parameters deviation (+/-). If the deviation is small, from (+/-
) 2%, the STATCOM device will activate in order to inject/absorb minimum reactive power
CHAPTER 11
Conclusions

Chapter 11. Conclusions
183
compensation. Secondly, if the deviation is medium (+/-) 4%, the STATCOM device will activate to
inject/absorb medium reactive power compensation and the maximum compensation will activate if
the deviation is above (+/-) 6%.
The SSSC control device connection between Oman and the United Arab Emirates: series
compensation and its operating parameters viabilities and criticalities are investigated. By using SSSC
both capacitive and inductive modes of operations are demonstrated by putting its control and
operational criticalities into consideration. Simulation results indicate the effectiveness of the SSSC
control device between Oman and the United Arab Emirates. A detailed SSSC model is designed,
configured and implemented between Oman and the United Arab Emirates on the GCC power grid. In
this case study, two new techniques are introduced and their effectiveness is demonstrated. Firstly,
the SSSC device selection process introduced by implementing the Wideband Delphi methodology
and another technique is used to share SSSC control device operations into three control limits; this is
known as a Douglas Cooper PID controller’s optimization. The primary aim of the SSSC device
selection and implementation purpose is to enhance power system stability between Oman and the
United Arab Emirates and it has a small impact on voltage quality and power flow which has been
obtained by implementing the aforementioned new control technique.
In this technique, three control limits are investigated and synthesized to share the SSSC operational
response to provide reactive power compensation in series based on power transmission network
operating parameters deviation (+/-). If the deviation is small (+/-) 2%, the SSSC device will activate to
inject/absorb minimum reactive power compensation. Secondly, if the deviation is medium (+/-) 4%,
the SSSC device will activate to inject/absorb medium reactive power compensation and the
maximum compensation will activate if the deviation is (+/-) 6%.
The UPFC control device connection between the KSA and Kuwait: unified power flow controller
(Series and shunt) compensation and its operating parameters viabilities and criticalities are
investigated. By using UPFC both capacitive and inductive modes of operations are demonstrated by
putting its control and operational criticalities into consideration. Simulation results indicate the
effectiveness of the UPFC control device between the KSA and Kuwait. A detailed UPFC model is
designed, configured and implemented between the KSA and Kuwait on the GCC power grid. In this
study, two new techniques are introduced and their effectiveness is demonstrated. Firstly, the SSSC
device selection process introduced by implementing Wideband Delphi methodology and another
technique is used to share UPFC control device operations into three control limits. The primary aim of
the UPFC device selection and implementation is to enhance power system stability, voltage quality
and load flow between the KSA and Kuwait that has been obtained by implementing the
aforementioned new control technique.
Chapter 11. Conclusions
184
In this technique three control limits are investigated and synthesized to share the UPFC operational
response to provide reactive power compensation based on power transmission network operating
parameters deviation (+/-). If the deviation is small (+/-) 2%, the UPFC device will activate to
inject/absorb minimum reactive power compensation. Secondly, if the deviation is (+/-) 4%, the UPFC
device will activate to inject/absorb medium reactive power compensation and the maximum
compensation will activate if the deviation is (+/-) 6%.
The PI, PID controller tuning and configuration: the developed work is an unconventional control loop
optimization technique, which has been adopted to fine-tune, optimize and share STATCOM, SSSC
and UPFC controls by using PID, PD, PI controller constant and variable configuration parameters to
adjust these devices operations at different locations on the GCC power grid during any undesired
operating conditions. The primary aim is to identify, determine and address vulnerable areas and
operating boundaries of different control loops of target FACTS devices that are in operation at a
particular time to sustain and enhance the performance of the power system. These devices will
directly or indirectly impact on network performance (improving voltage quality, power flow and power
stability) by providing time based adequate reactive power compensation whenever required.
Three different control and operating boundaries are identified and determined for each device to
inject or absorb minimum, medium or maximum reactive power on the GCC power grid. To validate
this technique, six control models are developed and simulated by incorporating ‘P’ and ‘I’
configuration parameters. Simulation results indicate the effectiveness of PI control parameters to
“divide and rule” the control operations of each device. Each control boundary is carrying its
corresponding P & I values to adjust each device’s response accordingly.
The FACTS-FRAME architecture: FACTS-FRAME is developed and configured by integrating various
layers of control and operations in the GCC power grid. The first layer describes the geographical
positions of the each GCC country. The second layer describes the geographical location of each
FACTS device(s) and their static and dynamic operational data requirements for application. The third
layer describes the selection process of required FACTS device based on its capability and capacity to
overcome power transmission system’s contingences on the GCC power grid. The fourth layer
describes the communication interface to integrate STATCOM, SSSC and UPFC to each other. The
fifth layer describes the control pattern of each FACTS device. These patterns are configured based
on each device’s time based capability and capacity to inject and absorb reactive power
(capacitive/inductive) mode of operations of the AC power system. A new technique is introduced and
it demonstrates reactive power compensation in three modes of operations (minimum, medium and
Chapter 11. Conclusions
185
maximum) based on control deviation. To maintain these three control boundaries the PI controller’s
response is configured and integrated based on deviations. If deviation is (+/-) 2% the controller will
inject or absorb minimum reactive power for (+/-) 4% medium reactive power and for (+/-) 6%
maximum reactive power.
During this study, it has been also identified that the KSA power facilities are operating at 60Hz and
the rest of the countries are operating at 50Hz. Therefore back-to-back DC link is an instrumental
approach to develop an asynchroniz communication link between the two frequencies; the KSA and
rest of the GCC countries. The major power generation facilities are installed in the KSA and Kuwait.
The study also indicates that the HVDC system is a very viable solution to deliver bulk power through
a long transmission line from the KSA to the rest of the GCC countries. After successful
implementation of DC-link at the al-Fidlhali substation the KSA is sharing 1200MW power on the GCC
power grid. This solution is also very economical and providing well-controlled power transmission
flow from the KSA to rest of the GCC countries.
Based on the aforementioned outcomes, a multi-variable controller has been developed and
implemented to communicate and provide distributed control to all FACTS devices (STATCOM,
SSSC, and UPFC) that are in operation parallel at time by implementing a centralized control system
as discussed earlier in a sequence. During centralized control all three devices’ response will be
adjusted parallel based on power transmission network operating parameters deviation (+/-) 2%, (+/-)
4%, and (+/-) 6% to inject/absorb reactive power compensation. As a conclusion, after successful
implementation of the centralized control system the following benefits can be witnessed convincingly
on the GCC power grid.
1. Reduction in installation and operational cost on the GCC power grid
2. Maximum uptime of the power system network on the GCC power grid
3. One device can be isolated during off-peak/peak for maintenance or overhauling purposes
4. One device can be on a standby or backup mode of operations for emergency purposes
5. More flexible operations without overloading any area, region or device
6. More reliable by sharing rapid reactive power compensation as per network system needs.
7. Providing adequate and wide-range stability margins on the GCC power grid.
8. Providing one window operations at minimum manpower
9. Shared and more flexible protection control topologies can be established
10. Well-controlled unified power flow on the GCC power network without any constraints.

Chapter 11. Conclusions
186
During decentralized control all three devices’ converter gating response will be adjusted
independently based on their defined location power transmission network operating parameters
deviation (+/-) 2%, (+/-) 4%, and (+/-) 6% to inject/absorb reactive power compensation. As a
conclusion the decentralized control system may acquire the following outcomes.
1. High installation and operational cost
2. Potential of the power network violation area or region-wise which may lead to the downtime of
particular equipment, area or region.
3. No alternate for maintenance or overhauling of the device that may lead to downtime of particular
equipment, area or region.
4. No flexible operations sometimes overloading individual areas, regions or devices
5. Providing an adequate stability margin on their individual operations-based power transmission
network operating parameters deviation.
Future work on the GCC power grid:
1. Further investigation is required to identify and determine a potential network violation incurred
due to FACTS devices implementation that may lead to GCC blackout.
2. As a drawback of this study, the power exchange ought to be monitored and examined on a critical
basis to take preventative measures for any possible network violation in order to prevent any
possible blackout of the whole GCC countries.
3. When all HVDC/FACTS devices are in operations through centralized control (Protection control
topology functionality and constraint on the GCC power grid to be determined).
4. When all three HVDC/FACTS devices are in operations independently through decentralized
control (Protection control topology functionality and constraint on the GCC power grid to be
determined.
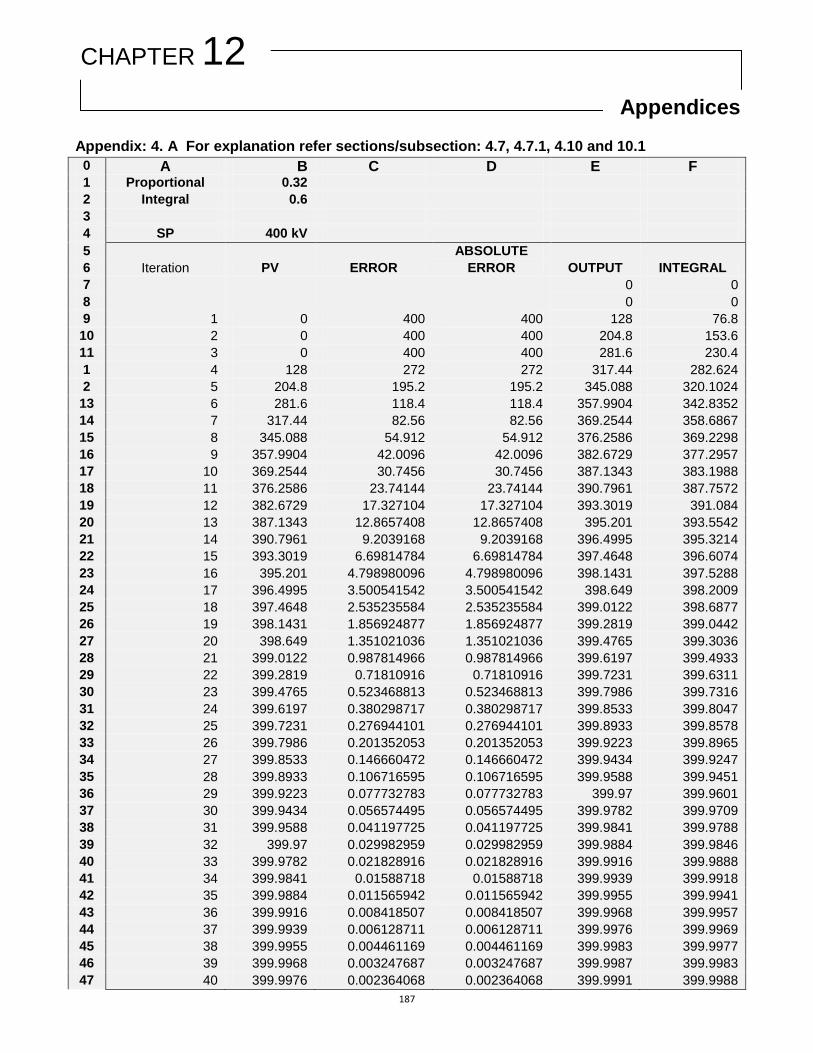
187
Appendix: 4. A For explanation refer sections/subsection: 4.7, 4.7.1, 4.10 and 10.1
0 A B C D E F 1 Proportional 0.32
2 Integral 0.6
3
4 SP 400 kV
5 ABSOLUTE
6 Iteration PV ERROR ERROR OUTPUT INTEGRAL
7 0 0
8 0 0
9 1 0 400 400 128 76.8
10 2 0 400 400 204.8 153.6
11 3 0 400 400 281.6 230.4
1 4 128 272 272 317.44 282.624
2 5 204.8 195.2 195.2 345.088 320.1024
13 6 281.6 118.4 118.4 357.9904 342.8352
14 7 317.44 82.56 82.56 369.2544 358.6867
15 8 345.088 54.912 54.912 376.2586 369.2298
16 9 357.9904 42.0096 42.0096 382.6729 377.2957
17 10 369.2544 30.7456 30.7456 387.1343 383.1988
18 11 376.2586 23.74144 23.74144 390.7961 387.7572
19 12 382.6729 17.327104 17.327104 393.3019 391.084
20 13 387.1343 12.8657408 12.8657408 395.201 393.5542
21 14 390.7961 9.2039168 9.2039168 396.4995 395.3214
22 15 393.3019 6.69814784 6.69814784 397.4648 396.6074
23 16 395.201 4.798980096 4.798980096 398.1431 397.5288
24 17 396.4995 3.500541542 3.500541542 398.649 398.2009
25 18 397.4648 2.535235584 2.535235584 399.0122 398.6877
26 19 398.1431 1.856924877 1.856924877 399.2819 399.0442
27 20 398.649 1.351021036 1.351021036 399.4765 399.3036
28 21 399.0122 0.987814966 0.987814966 399.6197 399.4933
29 22 399.2819 0.71810916 0.71810916 399.7231 399.6311
30 23 399.4765 0.523468813 0.523468813 399.7986 399.7316
31 24 399.6197 0.380298717 0.380298717 399.8533 399.8047
32 25 399.7231 0.276944101 0.276944101 399.8933 399.8578
33 26 399.7986 0.201352053 0.201352053 399.9223 399.8965
34 27 399.8533 0.146660472 0.146660472 399.9434 399.9247
35 28 399.8933 0.106716595 0.106716595 399.9588 399.9451
36 29 399.9223 0.077732783 0.077732783 399.97 399.9601
37 30 399.9434 0.056574495 0.056574495 399.9782 399.9709
38 31 399.9588 0.041197725 0.041197725 399.9841 399.9788
39 32 399.97 0.029982959 0.029982959 399.9884 399.9846
40 33 399.9782 0.021828916 0.021828916 399.9916 399.9888
41 34 399.9841 0.01588718 0.01588718 399.9939 399.9918
42 35 399.9884 0.011565942 0.011565942 399.9955 399.9941
43 36 399.9916 0.008418507 0.008418507 399.9968 399.9957
44 37 399.9939 0.006128711 0.006128711 399.9976 399.9969
45 38 399.9955 0.004461169 0.004461169 399.9983 399.9977
46 39 399.9968 0.003247687 0.003247687 399.9987 399.9983
47 40 399.9976 0.002364068 0.002364068 399.9991 399.9988
Appendices
CHAPTER 12
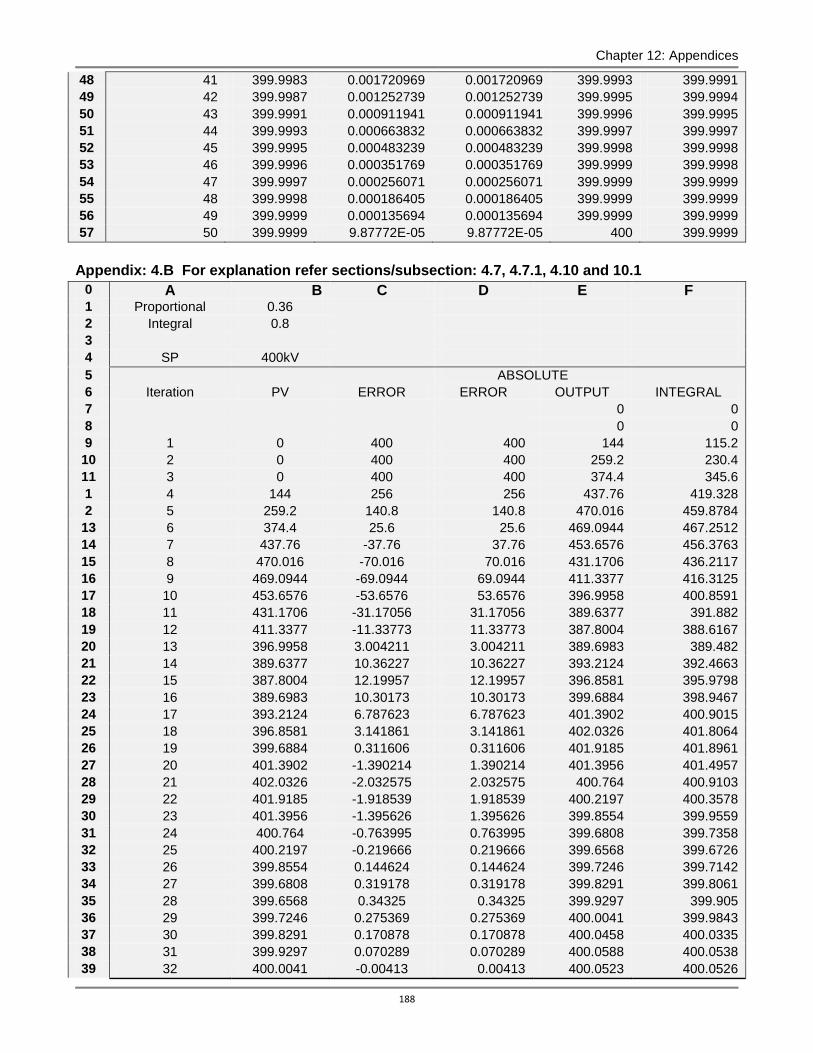
Chapter 12: Appendices
188
48 41 399.9983 0.001720969 0.001720969 399.9993 399.9991
49 42 399.9987 0.001252739 0.001252739 399.9995 399.9994
50 43 399.9991 0.000911941 0.000911941 399.9996 399.9995
51 44 399.9993 0.000663832 0.000663832 399.9997 399.9997
52 45 399.9995 0.000483239 0.000483239 399.9998 399.9998
53 46 399.9996 0.000351769 0.000351769 399.9999 399.9998
54 47 399.9997 0.000256071 0.000256071 399.9999 399.9999
55 48 399.9998 0.000186405 0.000186405 399.9999 399.9999
56 49 399.9999 0.000135694 0.000135694 399.9999 399.9999
57 50 399.9999 9.87772E-05 9.87772E-05 400 399.9999
Appendix: 4.B For explanation refer sections/subsection: 4.7, 4.7.1, 4.10 and 10.1
0 A B C D E F 1 Proportional 0.36
2 Integral 0.8
3
4 SP 400kV
5 ABSOLUTE
6 Iteration PV ERROR ERROR OUTPUT INTEGRAL
7 0 0
8 0 0
9 1 0 400 400 144 115.2
10 2 0 400 400 259.2 230.4
11 3 0 400 400 374.4 345.6
1 4 144 256 256 437.76 419.328
2 5 259.2 140.8 140.8 470.016 459.8784
13 6 374.4 25.6 25.6 469.0944 467.2512
14 7 437.76 -37.76 37.76 453.6576 456.3763
15 8 470.016 -70.016 70.016 431.1706 436.2117
16 9 469.0944 -69.0944 69.0944 411.3377 416.3125
17 10 453.6576 -53.6576 53.6576 396.9958 400.8591
18 11 431.1706 -31.17056 31.17056 389.6377 391.882
19 12 411.3377 -11.33773 11.33773 387.8004 388.6167
20 13 396.9958 3.004211 3.004211 389.6983 389.482
21 14 389.6377 10.36227 10.36227 393.2124 392.4663
22 15 387.8004 12.19957 12.19957 396.8581 395.9798
23 16 389.6983 10.30173 10.30173 399.6884 398.9467
24 17 393.2124 6.787623 6.787623 401.3902 400.9015
25 18 396.8581 3.141861 3.141861 402.0326 401.8064
26 19 399.6884 0.311606 0.311606 401.9185 401.8961
27 20 401.3902 -1.390214 1.390214 401.3956 401.4957
28 21 402.0326 -2.032575 2.032575 400.764 400.9103
29 22 401.9185 -1.918539 1.918539 400.2197 400.3578
30 23 401.3956 -1.395626 1.395626 399.8554 399.9559
31 24 400.764 -0.763995 0.763995 399.6808 399.7358
32 25 400.2197 -0.219666 0.219666 399.6568 399.6726
33 26 399.8554 0.144624 0.144624 399.7246 399.7142
34 27 399.6808 0.319178 0.319178 399.8291 399.8061
35 28 399.6568 0.34325 0.34325 399.9297 399.905
36 29 399.7246 0.275369 0.275369 400.0041 399.9843
37 30 399.8291 0.170878 0.170878 400.0458 400.0335
38 31 399.9297 0.070289 0.070289 400.0588 400.0538
39 32 400.0041 -0.00413 0.00413 400.0523 400.0526

Chapter 12: Appendices
189
40 33 400.0458 -0.045819 0.045819 400.0361 400.0394
41 34 400.0588 -0.05882 0.05882 400.0182 400.0224
42 35 400.0523 -0.052273 0.052273 400.0036 400.0074
43 36 400.0361 -0.036075 0.036075 399.9944 399.997
44 37 400.0182 -0.018199 0.018199 399.9904 399.9917
45 38 400.0036 -0.003616 0.003616 399.9904 399.9907
46 39 399.9944 0.005608 0.005608 399.9927 399.9923
47 40 399.9904 0.009562 0.009562 399.9958 399.9951
48 41 399.9904 0.009553 0.009553 399.9985 399.9978
49 42 399.9927 0.007274 0.007274 400.0004 399.9999
50 43 399.9958 0.004236 0.004236 400.0014 400.0011
51 44 399.9985 0.001485 0.001485 400.0017 400.0016
52 45 400.0004 -0.000446 0.000446 400.0014 400.0014
53 46 400.0014 -0.001447 0.001447 400.0009 400.001
54 47 400.0017 -0.001677 0.001677 400.0004 400.0005
55 48 400.0014 -0.001409 0.001409 400 400.0001
56 49 400.0009 -0.00092 0.00092 399.9998 399.9999
57 50 400.0004 -0.000421 0.000421 399.9997 399.9997
Appendix: 4.C For explanation refer sections/subsection: 4.7, 4.7.1, 4.10 and 10.1
0 A B C D E F 1 Proportional 0.38
2 Integral 0.9
3
4 SP 400kV
5 ABSOLUTE
6 Iteration PV ERROR ERROR OUTPUT INTEGRAL
7 0 0
8 0 0
9 1 0 400 400 152 136.8
10 2 0 400 400 288.8 273.6
11 3 0 400 400 425.6 410.4
1 4 152 248 248 504.64 495.216
2 5 288.8 111.2 111.2 537.472 533.2464
13 6 425.6 -25.6 25.6 523.5184 524.4912
14 7 504.64 -104.64 104.64 484.728 488.7043
15 8 537.472 -137.472 137.472 436.465 441.6889
16 9 523.5184 -123.5184 123.5184 394.7519 399.4456
17 10 484.728 -84.728 84.728 367.249 370.4686
18 11 436.465 -36.46496 36.46496 356.6119 357.9976
19 12 394.7519 5.248096 5.248096 359.9919 359.7925
20 13 367.249 32.75104 32.75104 372.2379 370.9933
21 14 356.6119 43.38806 43.38806 387.4808 385.832
22 15 359.9919 40.00811 40.00811 401.0351 399.5148
23 16 372.2379 27.76215 27.76215 410.0644 409.0095
24 17 387.4808 12.51922 12.51922 413.7668 413.291
25 18 401.0351 -1.035113 1.035113 412.8977 412.937
26 19 410.0644 -10.06442 10.06442 409.1125 409.495
27 20 413.7668 -13.76676 13.76676 404.2636 404.7868
28 21 412.8977 -12.89769 12.89769 399.8856 400.3757
29 22 409.1125 -9.112545 9.112545 396.913 397.2593
30 23 404.2636 -4.263623 4.263623 395.6391 395.8011
31 24 399.8856 0.114363 0.114363 395.8446 395.8402
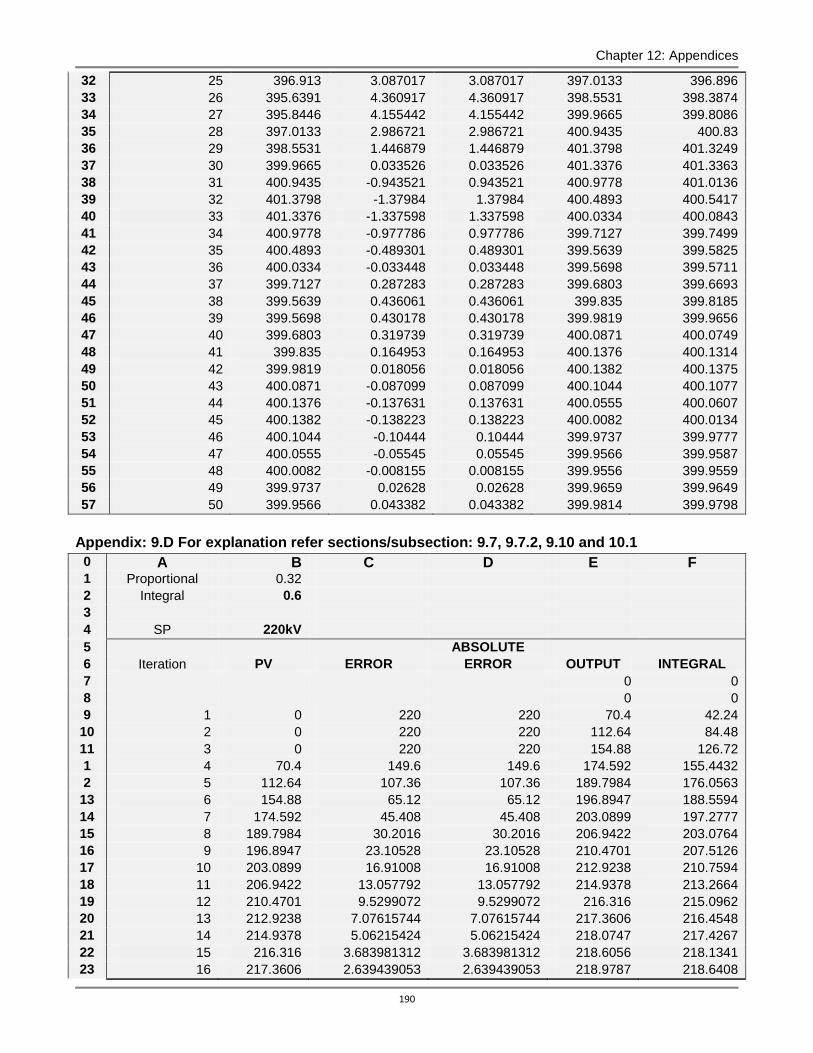
Chapter 12: Appendices
190
32 25 396.913 3.087017 3.087017 397.0133 396.896
33 26 395.6391 4.360917 4.360917 398.5531 398.3874
34 27 395.8446 4.155442 4.155442 399.9665 399.8086
35 28 397.0133 2.986721 2.986721 400.9435 400.83
36 29 398.5531 1.446879 1.446879 401.3798 401.3249
37 30 399.9665 0.033526 0.033526 401.3376 401.3363
38 31 400.9435 -0.943521 0.943521 400.9778 401.0136
39 32 401.3798 -1.37984 1.37984 400.4893 400.5417
40 33 401.3376 -1.337598 1.337598 400.0334 400.0843
41 34 400.9778 -0.977786 0.977786 399.7127 399.7499
42 35 400.4893 -0.489301 0.489301 399.5639 399.5825
43 36 400.0334 -0.033448 0.033448 399.5698 399.5711
44 37 399.7127 0.287283 0.287283 399.6803 399.6693
45 38 399.5639 0.436061 0.436061 399.835 399.8185
46 39 399.5698 0.430178 0.430178 399.9819 399.9656
47 40 399.6803 0.319739 0.319739 400.0871 400.0749
48 41 399.835 0.164953 0.164953 400.1376 400.1314
49 42 399.9819 0.018056 0.018056 400.1382 400.1375
50 43 400.0871 -0.087099 0.087099 400.1044 400.1077
51 44 400.1376 -0.137631 0.137631 400.0555 400.0607
52 45 400.1382 -0.138223 0.138223 400.0082 400.0134
53 46 400.1044 -0.10444 0.10444 399.9737 399.9777
54 47 400.0555 -0.05545 0.05545 399.9566 399.9587
55 48 400.0082 -0.008155 0.008155 399.9556 399.9559
56 49 399.9737 0.02628 0.02628 399.9659 399.9649
57 50 399.9566 0.043382 0.043382 399.9814 399.9798
Appendix: 9.D For explanation refer sections/subsection: 9.7, 9.7.2, 9.10 and 10.1
0 A B C D E F 1 Proportional 0.32
2 Integral 0.6
3
4 SP 220kV
5 ABSOLUTE
6 Iteration PV ERROR ERROR OUTPUT INTEGRAL
7 0 0
8 0 0
9 1 0 220 220 70.4 42.24
10 2 0 220 220 112.64 84.48
11 3 0 220 220 154.88 126.72
1 4 70.4 149.6 149.6 174.592 155.4432
2 5 112.64 107.36 107.36 189.7984 176.0563
13 6 154.88 65.12 65.12 196.8947 188.5594
14 7 174.592 45.408 45.408 203.0899 197.2777
15 8 189.7984 30.2016 30.2016 206.9422 203.0764
16 9 196.8947 23.10528 23.10528 210.4701 207.5126
17 10 203.0899 16.91008 16.91008 212.9238 210.7594
18 11 206.9422 13.057792 13.057792 214.9378 213.2664
19 12 210.4701 9.5299072 9.5299072 216.316 215.0962
20 13 212.9238 7.07615744 7.07615744 217.3606 216.4548
21 14 214.9378 5.06215424 5.06215424 218.0747 217.4267
22 15 216.316 3.683981312 3.683981312 218.6056 218.1341
23 16 217.3606 2.639439053 2.639439053 218.9787 218.6408

Chapter 12: Appendices
191
24 17 218.0747 1.925297848 1.925297848 219.2569 219.0105
25 18 218.6056 1.394379571 1.394379571 219.4567 219.2782
26 19 218.9787 1.021308682 1.021308682 219.605 219.4743
27 20 219.2569 0.74306157 0.74306157 219.7121 219.617
28 21 219.4567 0.543298231 0.543298231 219.7908 219.7213
29 22 219.605 0.394960038 0.394960038 219.8477 219.7971
30 23 219.7121 0.287907847 0.287907847 219.8893 219.8524
31 24 219.7908 0.209164294 0.209164294 219.9193 219.8926
32 25 219.8477 0.152319255 0.152319255 219.9413 219.9218
33 26 219.8893 0.110743629 0.110743629 219.9572 219.9431
34 27 219.9193 0.08066326 0.08066326 219.9689 219.9586
35 28 219.9413 0.058694127 0.058694127 219.9773 219.9698
36 29 219.9572 0.042753031 0.042753031 219.9835 219.978
37 30 219.9689 0.031115972 0.031115972 219.988 219.984
38 31 219.9773 0.022658749 0.022658749 219.9913 219.9884
39 32 219.9835 0.016490627 0.016490627 219.9936 219.9915
40 33 219.988 0.012005904 0.012005904 219.9954 219.9938
41 34 219.9913 0.008737949 0.008737949 219.9966 219.9955
42 35 219.9936 0.006361268 0.006361268 219.9975 219.9967
43 36 219.9954 0.004630179 0.004630179 219.9982 219.9976
44 37 219.9966 0.003370791 0.003370791 219.9987 219.9983
45 38 219.9975 0.002453643 0.002453643 219.9991 219.9987
46 39 219.9982 0.001786228 0.001786228 219.9993 219.9991
47 40 219.9987 0.001300238 0.001300238 219.9995 219.9993
48 41 219.9991 0.000946533 0.000946533 219.9996 219.9995
49 42 219.9993 0.000689007 0.000689007 219.9997 219.9996
50 43 219.9995 0.000501568 0.000501568 219.9998 219.9997
51 44 219.9996 0.000365107 0.000365107 219.9999 219.9998
52 45 219.9997 0.000265782 0.000265782 219.9999 219.9999
53 46 219.9998 0.000193473 0.000193473 219.9999 219.9999
54 47 219.9999 0.000140839 0.000140839 219.9999 219.9999
55 48 219.9999 0.000102523 0.000102523 220 219.9999
56 49 219.9999 7.46315E-05 7.46315E-05 220 220
57 50 219.9999 5.43275E-05 5.43275E-05 220 220
Appendix: 4.E For explanation refer sections/subsection: 4.7, 4.7.2, 4.10 and 10.1
0 A B C D E F 1 Proportional 0.36
2 Integral 0.8
3
4 SP 220kV
5 ABSOLUTE
6 Iteration PV ERROR ERROR OUTPUT INTEGRAL
7 0 0
8 0 0
9 1 0 220 220 79.2 63.36
10 2 0 220 220 142.56 126.72
11 3 0 220 220 205.92 190.08
1 4 79.2 140.8 140.8 240.768 230.6304
2 5 142.56 77.44 77.44 258.5088 252.9331
13 6 205.92 14.08 14.08 258.0019 256.9882
14 7 240.768 -20.768 20.768 249.5117 251.007
15 8 258.5088 -38.5088 38.5088 237.1438 239.9164
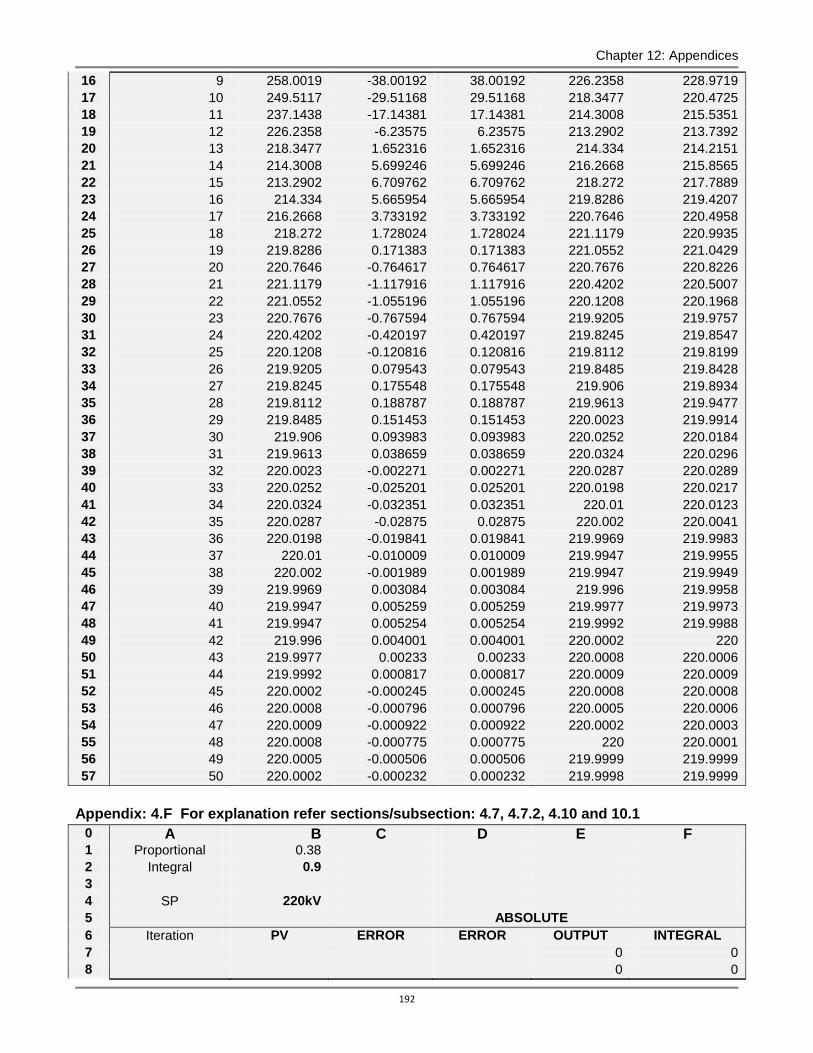
Chapter 12: Appendices
192
16 9 258.0019 -38.00192 38.00192 226.2358 228.9719
17 10 249.5117 -29.51168 29.51168 218.3477 220.4725
18 11 237.1438 -17.14381 17.14381 214.3008 215.5351
19 12 226.2358 -6.23575 6.23575 213.2902 213.7392
20 13 218.3477 1.652316 1.652316 214.334 214.2151
21 14 214.3008 5.699246 5.699246 216.2668 215.8565
22 15 213.2902 6.709762 6.709762 218.272 217.7889
23 16 214.334 5.665954 5.665954 219.8286 219.4207
24 17 216.2668 3.733192 3.733192 220.7646 220.4958
25 18 218.272 1.728024 1.728024 221.1179 220.9935
26 19 219.8286 0.171383 0.171383 221.0552 221.0429
27 20 220.7646 -0.764617 0.764617 220.7676 220.8226
28 21 221.1179 -1.117916 1.117916 220.4202 220.5007
29 22 221.0552 -1.055196 1.055196 220.1208 220.1968
30 23 220.7676 -0.767594 0.767594 219.9205 219.9757
31 24 220.4202 -0.420197 0.420197 219.8245 219.8547
32 25 220.1208 -0.120816 0.120816 219.8112 219.8199
33 26 219.9205 0.079543 0.079543 219.8485 219.8428
34 27 219.8245 0.175548 0.175548 219.906 219.8934
35 28 219.8112 0.188787 0.188787 219.9613 219.9477
36 29 219.8485 0.151453 0.151453 220.0023 219.9914
37 30 219.906 0.093983 0.093983 220.0252 220.0184
38 31 219.9613 0.038659 0.038659 220.0324 220.0296
39 32 220.0023 -0.002271 0.002271 220.0287 220.0289
40 33 220.0252 -0.025201 0.025201 220.0198 220.0217
41 34 220.0324 -0.032351 0.032351 220.01 220.0123
42 35 220.0287 -0.02875 0.02875 220.002 220.0041
43 36 220.0198 -0.019841 0.019841 219.9969 219.9983
44 37 220.01 -0.010009 0.010009 219.9947 219.9955
45 38 220.002 -0.001989 0.001989 219.9947 219.9949
46 39 219.9969 0.003084 0.003084 219.996 219.9958
47 40 219.9947 0.005259 0.005259 219.9977 219.9973
48 41 219.9947 0.005254 0.005254 219.9992 219.9988
49 42 219.996 0.004001 0.004001 220.0002 220
50 43 219.9977 0.00233 0.00233 220.0008 220.0006
51 44 219.9992 0.000817 0.000817 220.0009 220.0009
52 45 220.0002 -0.000245 0.000245 220.0008 220.0008
53 46 220.0008 -0.000796 0.000796 220.0005 220.0006
54 47 220.0009 -0.000922 0.000922 220.0002 220.0003
55 48 220.0008 -0.000775 0.000775 220 220.0001
56 49 220.0005 -0.000506 0.000506 219.9999 219.9999
57 50 220.0002 -0.000232 0.000232 219.9998 219.9999
Appendix: 4.F For explanation refer sections/subsection: 4.7, 4.7.2, 4.10 and 10.1
0 A B C D E F 1 Proportional 0.38
2 Integral 0.9
3
4 SP 220kV
5 ABSOLUTE
6 Iteration PV ERROR ERROR OUTPUT INTEGRAL
7 0 0
8 0 0

Chapter 12: Appendices
193
9 1 0 220 220 83.6 75.24
10 2 0 220 220 158.84 150.48
11 3 0 220 220 234.08 225.72
1 4 83.6 136.4 136.4 277.552 272.3688
2 5 158.84 61.16 61.16 295.6096 293.2855
13 6 234.08 -14.08 14.08 287.9351 288.4702
14 7 277.552 -57.552 57.552 266.6004 268.7874
15 8 295.6096 -75.6096 75.6096 240.0557 242.9289
16 9 287.9351 -67.93512 67.93512 217.1135 219.6951
17 10 266.6004 -46.6004 46.6004 201.9869 203.7577
18 11 240.0557 -20.05573 20.05573 196.1366 196.8987
19 12 217.1135 2.886453 2.886453 197.9955 197.8859
20 13 201.9869 18.01307 18.01307 204.7308 204.0463
21 14 196.1366 23.86343 23.86343 213.1144 212.2076
22 15 197.9955 22.00446 22.00446 220.5693 219.7331
23 16 204.7308 15.26918 15.26918 225.5354 224.9552
24 17 213.1144 6.885573 6.885573 227.5717 227.3101
25 18 220.5693 -0.569312 0.569312 227.0937 227.1154
26 19 225.5354 -5.535431 5.535431 225.0119 225.2222
27 20 227.5717 -7.57172 7.57172 222.345 222.6327
28 21 227.0937 -7.09373 7.09373 219.9371 220.2067
29 22 225.0119 -5.0119 5.0119 218.3021 218.4926
30 23 222.345 -2.344992 2.344992 217.6015 217.6906
31 24 219.9371 0.062899 0.062899 217.7145 217.7121
32 25 218.3021 1.69786 1.69786 218.3573 218.2928
33 26 217.6015 2.398505 2.398505 219.2042 219.1131
34 27 217.7145 2.285493 2.285493 219.9816 219.8947
35 28 218.3573 1.642697 1.642697 220.5189 220.4565
36 29 219.2042 0.795784 0.795784 220.7589 220.7287
37 30 219.9816 0.018439 0.018439 220.7357 220.735
38 31 220.5189 -0.518937 0.518937 220.5378 220.5575
39 32 220.7589 -0.758912 0.758912 220.2691 220.298
40 33 220.7357 -0.735679 0.735679 220.0184 220.0464
41 34 220.5378 -0.537782 0.537782 219.842 219.8624
42 35 220.2691 -0.269116 0.269116 219.7602 219.7704
43 36 220.0184 -0.018396 0.018396 219.7634 219.7641
44 37 219.842 0.158005 0.158005 219.8241 219.8181
45 38 219.7602 0.239834 0.239834 219.9093 219.9002
46 39 219.7634 0.236598 0.236598 219.9901 219.9811
47 40 219.8241 0.175857 0.175857 220.0479 220.0412
48 41 219.9093 0.090724 0.090724 220.0757 220.0722
49 42 219.9901 0.009931 0.009931 220.076 220.0756
50 43 220.0479 -0.047904 0.047904 220.0574 220.0593
51 44 220.0757 -0.075697 0.075697 220.0305 220.0334
52 45 220.076 -0.076023 0.076023 220.0045 220.0074
53 46 220.0574 -0.057442 0.057442 219.9855 219.9877
54 47 220.0305 -0.030498 0.030498 219.9761 219.9773
55 48 220.0045 -0.004485 0.004485 219.9756 219.9758
56 49 219.9855 0.014454 0.014454 219.9813 219.9807
57 50 219.9761 0.02386 0.02386 219.9898 219.9889
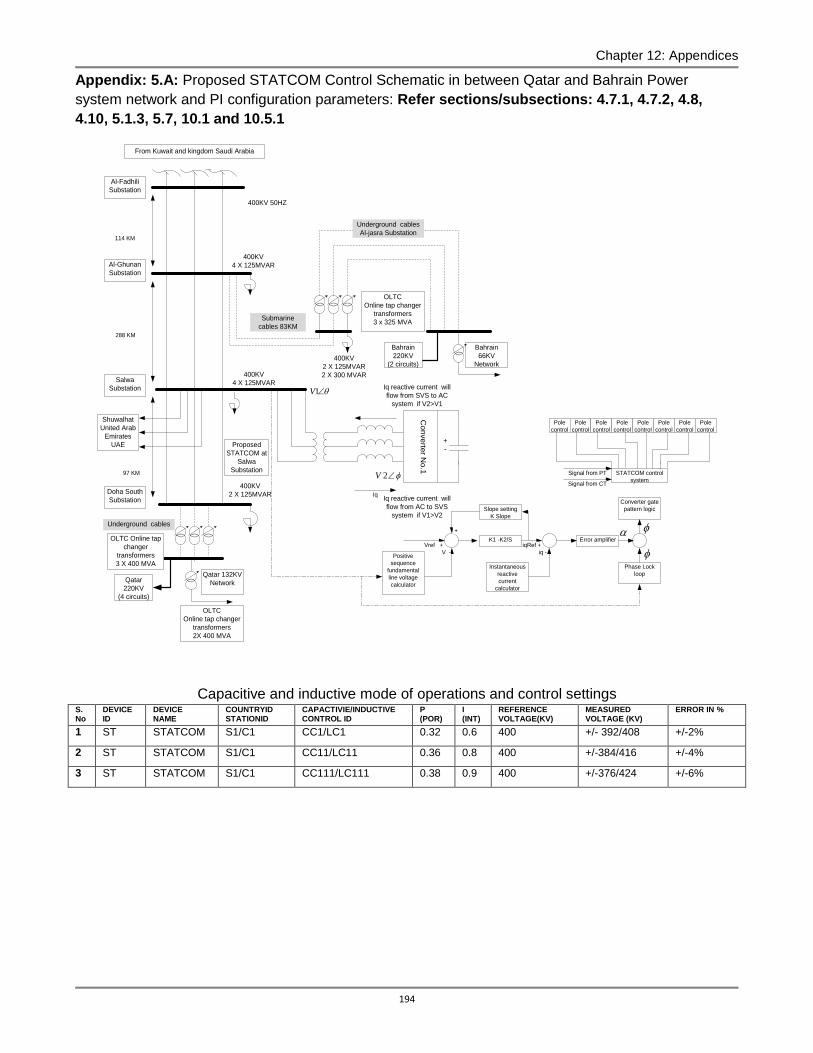
Chapter 12: Appendices
194
Appendix: 5.A: Proposed STATCOM Control Schematic in between Qatar and Bahrain Power
system network and PI configuration parameters: Refer sections/subsections: 4.7.1, 4.7.2, 4.8,
4.10, 5.1.3, 5.7, 10.1 and 10.5.1
Al-Fadhili
Substation
+
-
400KV 50HZ
400KV
2 X 125MVAR
400KV
4 X 125MVAR
IqIq reactive current will
flow from AC to SVS
system if V1>V2
1V
2V
Proposed
STATCOM at
Salwa
Substation
From Kuwait and kingdom Saudi Arabia
Al-Ghunan
Substation
114 KM
Co
nve
rter N
o.1
Iq reactive current will
flow from SVS to AC
system if V2>V1
Salwa
Substation
288 KM
Doha South
Substation
OLTC
Online tap changer
transformers
3 x 325 MVA
Bahrain
66KV
Network
Bahrain
220KV
(2 circuits)
Submarine
cables 83KM
Underground cables
Al-jasra Substation
400KV
4 X 125MVAR
OLTC Online tap
changer
transformers
3 X 400 MVA
Qatar 132KV
NetworkQatar
220KV
(4 circuits)
Underground cables
OLTC
Online tap changer
transformers
2X 400 MVA
400KV
2 X 125MVAR
2 X 300 MVAR
97 KM
Shuwalhat
United Arab
Emirates
UAE
Positive
sequence
fundamental
line voltage
calculator
Slope setting
K Slope
K1 -K2/S
Instantaneous
reactive
current
calculator
Error amplifier
Converter gate
pattern logic
Phase Lock
loop
Vref + iqRef +
+
iq -V -
STATCOM control
system
Pole
control
Pole
control
Pole
control
Pole
control
Pole
control
Pole
control
Pole
control
Pole
control
Signal from CT
Signal from PT
Capacitive and inductive mode of operations and control settings S. No
DEVICE ID
DEVICE NAME
COUNTRYID STATIONID
CAPACTIVIE/INDUCTIVE CONTROL ID
P (POR)
I (INT)
REFERENCE VOLTAGE(KV)
MEASURED VOLTAGE (KV)
ERROR IN %
1 ST STATCOM S1/C1 CC1/LC1 0.32 0.6 400 +/- 392/408 +/-2%
2 ST STATCOM S1/C1 CC11/LC11 0.36 0.8 400 +/-384/416 +/-4%
3 ST STATCOM S1/C1 CC111/LC111 0.38 0.9 400 +/-376/424 +/-6%
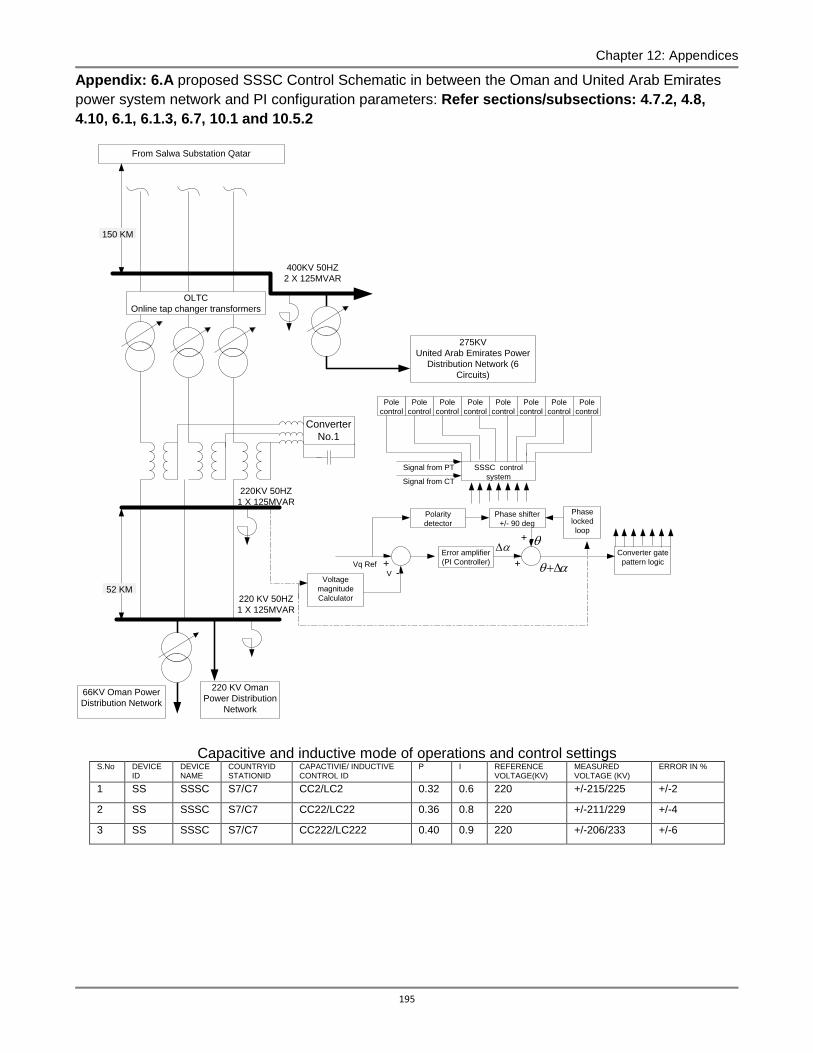
Chapter 12: Appendices
195
Appendix: 6.A proposed SSSC Control Schematic in between the Oman and United Arab Emirates
power system network and PI configuration parameters: Refer sections/subsections: 4.7.2, 4.8,
4.10, 6.1, 6.1.3, 6.7, 10.1 and 10.5.2
275KV
United Arab Emirates Power
Distribution Network (6
Circuits)
220 KV 50HZ
1 X 125MVAR
52 KM
OLTC
Online tap changer transformers
220KV 50HZ
1 X 125MVAR
220 KV Oman
Power Distribution
Network
66KV Oman Power
Distribution Network
SSSC control
system
Pole
control
Pole
control
Pole
control
Pole
control
Pole
control
Pole
control
Pole
control
Pole
control
Signal from CT
Signal from PT
Converter
No.1
Voltage
magnitude
Calculator
Polarity
detector
Error amplifier
(PI Controller) Vq Ref + +
V -
Phase shifter
+/- 90 deg
Phase
locked
loop+
Converter gate
pattern logic
From Salwa Substation Qatar
400KV 50HZ
2 X 125MVAR
150 KM
Capacitive and inductive mode of operations and control settings S.No DEVICE
ID DEVICE NAME
COUNTRYID STATIONID
CAPACTIVIE/ INDUCTIVE CONTROL ID
P I REFERENCE VOLTAGE(KV)
MEASURED VOLTAGE (KV)
ERROR IN %
1 SS SSSC S7/C7 CC2/LC2 0.32 0.6 220 +/-215/225 +/-2
2 SS SSSC S7/C7 CC22/LC22 0.36 0.8 220 +/-211/229 +/-4
3 SS SSSC S7/C7 CC222/LC222 0.40 0.9 220 +/-206/233 +/-6
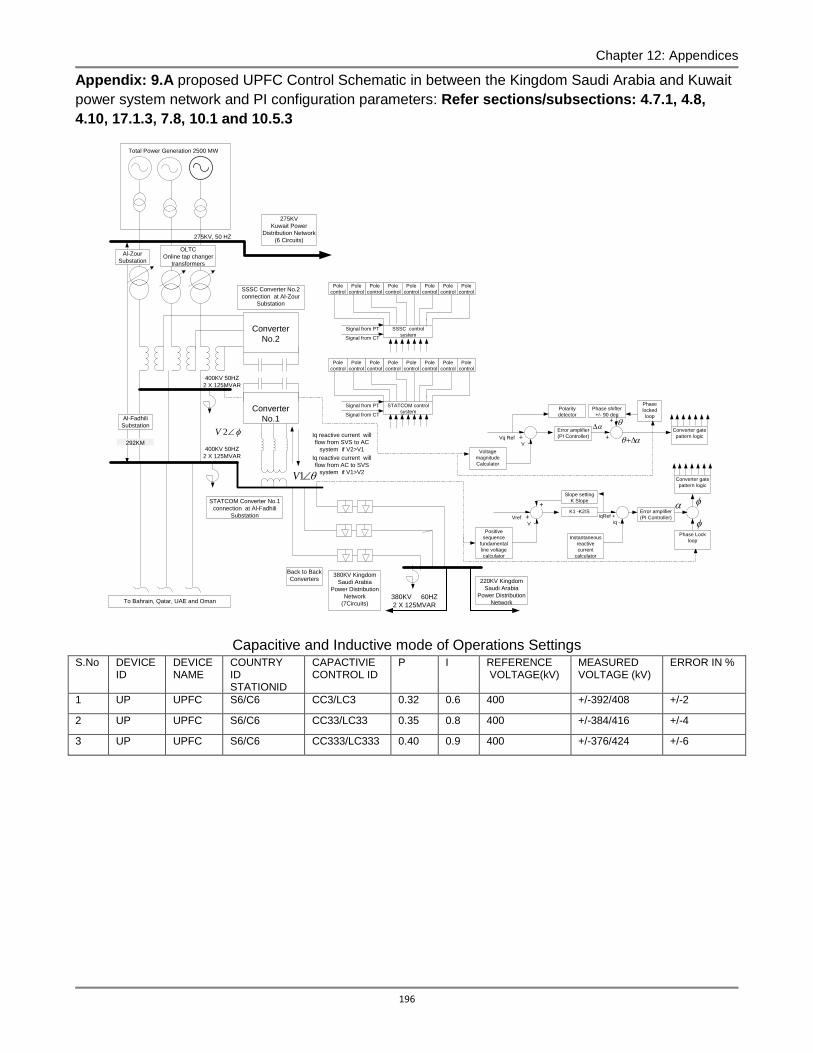
Chapter 12: Appendices
196
Appendix: 9.A proposed UPFC Control Schematic in between the Kingdom Saudi Arabia and Kuwait
power system network and PI configuration parameters: Refer sections/subsections: 4.7.1, 4.8,
4.10, 17.1.3, 7.8, 10.1 and 10.5.3
275KV
Kuwait Power
Distribution Network
(6 Circuits)
Converter
No.1
Total Power Generation 2500 MW
275KV, 50 HZ
SSSC Converter No.2
connection at Al-Zour
Substation
400KV 50HZ
2 X 125MVAR
292KM
OLTC
Online tap changer
transformers
380KV 60HZ
2 X 125MVAR
400KV 50HZ
2 X 125MVAR
220KV Kingdom
Saudi Arabia
Power Distribution
Network
380KV Kingdom
Saudi Arabia
Power Distribution
Network
(7Circuits)
Iq reactive current will
flow from SVS to AC
system if V2>V1
Iq reactive current will
flow from AC to SVS
system if V1>V21V
2V
STATCOM Converter No.1
connection at Al-Fadhili
Substation
Back to Back
Converters
To Bahrain, Qatar, UAE and Oman
Positive
sequence
fundamental
line voltage
calculator
Slope setting
K Slope
K1 -K2/S
Instantaneous
reactive
current
calculator
Error amplifier
(PI Controller) Vref + iqRef +
+
iq -V -
SSSC control
system
Pole
control
Pole
control
Pole
control
Pole
control
Pole
control
Pole
control
Pole
control
Pole
control
Signal from CT
Signal from PTConverter
No.2
STATCOM control
system
Pole
control
Pole
control
Pole
control
Pole
control
Pole
control
Pole
control
Pole
control
Pole
control
Signal from CT
Signal from PT
Phase Lock
loop
Voltage
magnitude
Calculator
Polarity
detector
Error amplifier
(PI Controller) Vq Ref + +
V -
Phase shifter
+/- 90 deg
Phase
locked
loop+
Converter gate
pattern logic
Converter gate
pattern logic
Al-Zour
Substation
Al-Fadhili
Substation
Capacitive and Inductive mode of Operations Settings S.No DEVICE
ID DEVICE NAME
COUNTRY ID STATIONID
CAPACTIVIE CONTROL ID
P
I REFERENCE VOLTAGE(kV)
MEASURED VOLTAGE (kV)
ERROR IN %
1 UP UPFC S6/C6 CC3/LC3 0.32 0.6 400 +/-392/408 +/-2
2 UP UPFC S6/C6 CC33/LC33 0.35 0.8 400 +/-384/416 +/-4
3 UP UPFC S6/C6 CC333/LC333 0.40 0.9 400 +/-376/424 +/-6
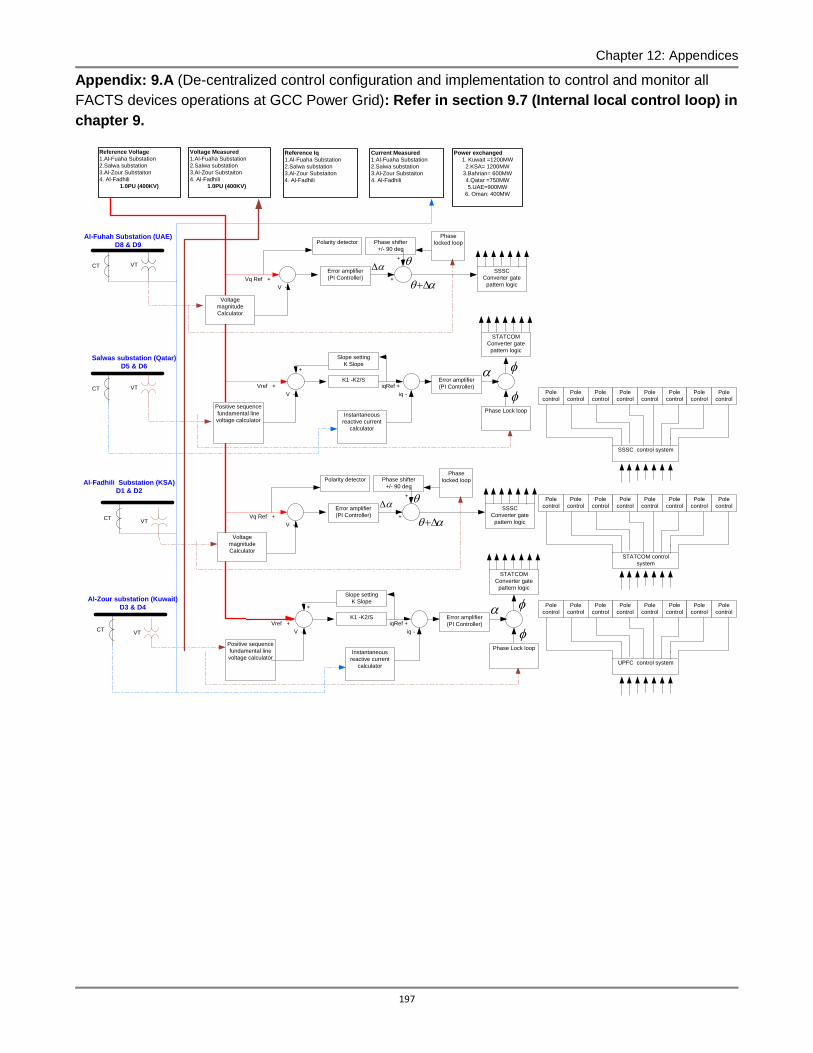
Chapter 12: Appendices
197
Appendix: 9.A (De-centralized control configuration and implementation to control and monitor all
FACTS devices operations at GCC Power Grid): Refer in section 9.7 (Internal local control loop) in
chapter 9.
Positive sequence
fundamental line
voltage calculator
Slope setting
K Slope
K1 -K2/S
Instantaneous
reactive current
calculator
Error amplifier
(PI Controller) Vref + iqRef +
+
iq -V -
UPFC control system
Pole
control
Pole
control
Pole
control
Pole
control
Pole
control
Pole
control
Pole
control
Pole
control
Phase Lock loop
Polarity detector
Error amplifier
(PI Controller) Vq Ref + +
V -
Phase shifter
+/- 90 deg
Phase
locked loop
+
SSSC
Converter gate
pattern logic
STATCOM
Converter gate
pattern logic
Slope setting
K Slope
K1 -K2/S
Instantaneous
reactive current
calculator
Error amplifier
(PI Controller) Vref + iqRef +
+
iq -V -
Phase Lock loop
Polarity detector
Error amplifier
(PI Controller) Vq Ref + +
V -
Phase shifter
+/- 90 deg
Phase
locked loop
+
SSSC
Converter gate
pattern logic
STATCOM
Converter gate
pattern logic
CT VT
Salwas substation (Qatar)
D5 & D6
Al-Zour substation (Kuwait)
D3 & D4
CTVT
Al-Fadhili Substation (KSA)
D1 & D2
CTVT
CT VT
Al-Fuhah Substation (UAE)
D8 & D9
STATCOM control
system
Pole
control
Pole
control
Pole
control
Pole
control
Pole
control
Pole
control
Pole
control
Pole
control
SSSC control system
Pole
control
Pole
control
Pole
control
Pole
control
Pole
control
Pole
control
Pole
control
Pole
control
Voltage Measured
1.Al-Fuaha Substation
2.Salwa substation
3.Al-Zour Substaiton
4. Al-Fadhili
1.0PU (400KV)
Reference Voltage
1.Al-Fuaha Substation
2.Salwa substation
3.Al-Zour Substaiton
4. Al-Fadhili
1.0PU (400KV)
Current Measured
1.Al-Fuaha Substation
2.Salwa substation
3.Al-Zour Substaiton
4. Al-Fadhili
Power exchanged
1. Kuwait =1200MW
2.KSA= 1200MW
3.Bahrian= 600MW
4.Qatar =750MW
5.UAE=900MW
6. Oman: 400MW
Reference Iq
1.Al-Fuaha Substation
2.Salwa substation
3.Al-Zour Substaiton
4. Al-Fadhili
Voltage
magnitude
Calculator
Positive sequence
fundamental line
voltage calculator
Voltage
magnitude
Calculator

Chapter 12: Appendices
198
Appendix: 9.B (Centralized control configuration and implementation to control and monitor all
FACTS devices operations at GCC Power Grid): Refer in section 9.8 (External or remote control
loop) in chapter 9.
Slope setting
K Slope
K1 -K2/S
Instantaneous
reactive current
calculator
Error amplifier
(PI Controller)+ iqRef +
+
iq -V -
UPFC control system
Pole
control
Pole
control
Pole
control
Pole
control
Pole
control
Pole
control
Pole
control
Pole
control
Phase Lock loop
Polarity detector
+ +
V -
Phase
locked loop
+
SSSC
Converter gate
pattern logic
STATCOM
Converter gate
pattern logic
Slope setting
K Slope
Instantaneous
reactive current
calculator
Error amplifier
(PI Controller) + iqref +
+
iq -V -
Phase Lock loop
Polarity detector
+ +
V -
Phase shifter
+/- 90 deg
Phase
locked loop
+
SSSC
Converter gate
pattern logic
STATCOM
Converter gate
pattern logic
CT VT
Salwas substation (Qatar)
D5 & D6
Al-Zour substation (Kuwait)
D1 & D2
CTVT
Al-Fadhili Substation (KSA)
D3 & D4
CTVT
CT VT
Al-Fuhah Substation (UAE)
D8 & D9
SSSC control system
Pole
control
Pole
control
Pole
control
Pole
control
Pole
control
Pole
control
Pole
control
Pole
control
Voltage
magnitude
Calculator
VD1
VD2
Voltage
magnitude
Calculator
VD3
VD4
BLOCK.9B
|(VD1+VD2)|=Add/2
|(VD3+VD4)|=Add/2
Error amplifier
(PI Controller)
BLOCK.9A
|(VD1+VD3)|=Add/2
|(VD2+VD4)|=Add/2
K1 -K2/S
BLOCK.8
|(VD3+VD2)|=Add/2
|(VD4+VD1)|=Add/2
Positive sequence
fundamental line
voltage calculator
BLOCK.7
|(VD1+VD4)|=Add/2
|(VD2+VD3)|=Add/2
Error amplifier
(PI Controller)
Positive sequence
fundamental line
voltage calculator
BLOCK.1
Voltage Measured
1.Al-Fuaha Substation
2.Salwa substation
3.Al-Zour Substaiton
4. Al-Fadhili
1.0PU (400KV)
BLOCK.3
Reference Voltage
1.Al-Fuaha Substation
2.Salwa substation
3.Al-Zour Substaiton
4. Al-Fadhili
1.0PU (400KV)
BLOCK.2
Current Measured
1.Al-Fuaha Substation
2.Salwa substation
3.Al-Zour Substaiton
4. Al-Fadhili
BLOCK.5
Power exchanged
1. Kuwait =1200MW
2.KSA= 1200MW
3.Bahrian= 600MW
4.Qatar =750MW
5.UAE=900MW
6. Oman: 400MW
BLOCK.4
Reference Iq
1.Al-Fuaha Substation
2.Salwa substation
3.Al-Zour Substaiton
4. Al-Fadhili
STATCOM control
system
Pole
control
Pole
control
Pole
control
Pole
control
Pole
control
Pole
control
Pole
control
Pole
control
Phase shifter
+/- 90 deg
BLOCK.6
Final Control block
VD1 (Voltage Deviation)
VD2 (Voltage Deviation)
VD3 (Voltage Deviation)
ID1 (current Deviation)
ID2 (current Deviation)
ID3 (current Deviatio

Chapter 12: Appendices
199
Appendix: 9.C (STATCOM, SSSC and UPFC devices are integrated stringently to improve power
system’s operations at GCC power grid). Refer in section 9.9 in chapter 9.
275KV
Kuwait Power
Distribution
Network (6
Circuits)
Converter No.1
Total Power Generation 2500 MW
275KV, 50 HZ
SSSC Converter No.2
connection at Al-Zour
Substation
400KV 50HZ
2 X 125MVAR
292KM
OLTC
Online tap
changer
transformers
380KV 60HZ
2 X 125MVAR
400KV 50HZ
2 X 125MVAR
220KV Kingdom
Saudi Arabia
Power
Distribution
Network
380KV Kingdom
Saudi Arabia
Power
Distribution
Network
(7Circuits)
Iq reactive current
will flow from SVS to
AC system if V2>V1Iq reactive current
will flow from AC to
SVS system if
V1>V21V
2V
STATCOM Converter
No.1 connection at Al-
Fadhili Substation
Back to
Back
Converters
Positive
sequence
fundament
al line
voltage
calculator
Slope
setting
K SlopeK1 -K2/S
Instantane
ous
reactive
current
calculator
Error
amplifier
(PI
Controller)
Vref +
iqRe
f +
+
iq
-
V -
SSSC control
system
Pole
contr
ol
Pole
contr
ol
Pole
contr
ol
Pole
contr
ol
Pole
contr
ol
Pole
contr
ol
Pole
contr
ol
Pole
contr
ol
Signal from
CT
Signal from
PT
Converter No.2
STATCOM
control system
Pole
contr
ol
Pole
contr
ol
Pole
contr
ol
Pole
contr
ol
Pole
contr
ol
Pole
contr
ol
Pole
contr
ol
Pole
contr
ol
Signal from
CT
Signal from
PT
Phase
Lock loop
Voltage
magnitude
Calculator
Polarity
detector
Error
amplifier
(PI
Controller)
Vq Ref
+
+
V -
Phase
shifter
+/- 90 deg
Phase
locked
loop
+
Converter
gate
pattern
logic
Converter
gate
pattern
logic
Al-Zour
Substatio
n
Al-Fadhili
Substatio
n
Al-Fadhili
Substation
+
-
400KV 50HZ
400KV
2 X 125MVAR
400KV
4 X 125MVAR
IqIq reactive current will
flow from AC to SVS
system if V1>V2
1V
2V
Proposed
STATCOM at
Salwa
Substation
Al-Ghunan
Substation
114 KM
Co
nve
rter N
o.1
Iq reactive current will
flow from SVS to AC
system if V2>V1
Salwa
Substation
288 KM
Doha South
Substation
OLTC
Online tap changer
transformers
3 x 325 MVA
Bahrain
66KV
Network
Bahrain
220KV
(2 circuits)
Submarine cables
83KM
Underground cables
Al-jasra Substation
400KV
4 X 125MVAR
OLTC Online tap
changer
transformers
3 X 400 MVA
Qatar 132KV
NetworkQatar
220KV
(4 circuits)
Underground cables
OLTC
Online tap changer
transformers
2X 400 MVA
400KV
2 X 125MVAR
2 X 300 MVAR
97 KM
Shuwalhat
United Arab
Emirates
UAE
Positive
sequence
fundamental
line voltage
calculator
Slope setting
K Slope
K1 -K2/S
Instantaneou
s reactive
current
calculator
Error
amplifier
Converter
gate pattern
logic
Phase Lock
loop
Vref
+
iqRef
+
+
iq -V -
STATCOM control
system
Pole
contro
l
Pole
contro
l
Pole
contro
l
Pole
contro
l
Pole
contro
l
Pole
contro
l
Pole
contro
l
Pole
contro
l
Signal from CT
Signal from PT
275KV
United Arab Emirates Power
Distribution Network (6 Circuits)
220 KV 50HZ
1 X 125MVAR
52 KM
OLTC
Online tap changer transformers
220KV 50HZ
1 X 125MVAR
220 KV Oman
Power Distribution
Network
66KV Oman Power
Distribution Network
SSSC control
system
Pole
contro
l
Pole
contro
l
Pole
contro
l
Pole
contro
l
Pole
contro
l
Pole
contro
l
Pole
contro
l
Pole
contro
l
Signal from CT
Signal from PT
Converter
No.2
Voltage
magnitude
Calculator
Polarity
detector
Error amplifier
(PI Controller) Vq Ref + +
V -
Phase shifter
+/- 90 deg
Phase
locked
loop+
Converter
gate pattern
logic
Al Sila
Substation
From Salwa
Substation
Qatar
400KV 50HZ
2 X 125MVAR
Al-Fuhah
Substation
150 KM
UPFC in between Kuwait and
kingdom Saudi Arabia
STATCOM in between Qatar
and Bahrain
SSSC in between Oman and
united Arab Emirates

Chapter 12: Appendices
200
Appendix: 9.D (FACTS-FRAME control schematic) Refer section/subsections 4.7.2, 9.12.4, 10.1
Al Fadhli
Interconnection
310 km
Bahrain
600 MW
UAE
900 MWOman
400 MW
Ghunan
Interconnection
113km
Salwa
Interconnection
290 km
Al-sila & Al-Fuhah
Interconnection
150 km
Legends:
400kV Lines
220kV Lines
SSSC
Qatar
750 MW
STATCOM
SSSC
STATCOMUPFC
RTU
Remote
Telemetry Unit
Saudi Arabia
1200 MW
HVDC
Back-to-Back
Kuwait
1200 MW
Voltage Measured
1.Al-Fuaha Substation
1.0pu (220KV)
2.Salwa substation
3.Al-Zour Substaiton
4. Al-Fadhili
1.0PU (400KV)
Current Measured
1.Al-Fuaha Substation
2.Salwa substation
3.Al-Zour Substaiton
4. Al-Fadhili
Power exchanged
1. Kuwait =1200MW
2.KSA= 1200MW
3.Bahrian= 600MW
4.Qatar =750MW
5.UAE=900MW
6. Oman: 400MW
Reference Iq
1.Al-Fuaha Substation
2.Salwa substation
3.Al-Zour Substaiton
4. Al-Fadhili
RTU
Remote
Telemetry Unit
RTU
Remote
Telemetry Unit
Reference Voltage
1.Al-Fuaha Substation
1.0pu (220KV)
2.Salwa substation
3.Al-Zour Substaiton
4. Al-Fadhili
1.0PU (400KV)
Final Control Block:
VD1 (Voltage Deviation)
VD2 (Voltage Deviation)
VD3 (Voltage Deviation)
ID1 (current Deviation)
ID2 (current Deviation)
ID3 (current Deviation)
201
[1] Higorani and Gyugyi “Understanding FACTS Technology” (Concept and Technology of Flexible AC Transmission Systems) ISBN 0-7803-3455-8, pp 1-429 published by IEEE press in 2000 (445 Hoes Lane P.O Box 1331 NJ 08855-1331. USA
[2] Enrique Acha, Claudio R. Fuerte and Hugo Ambriz-Perez “ FACTS Modeling and Simulation in Power Network” ISBN 0-470-85271-2, pp 1-403 published in 2004 by John Wiley & Sons ltd West Sussex PO19 8SQ, England
[3] J. Arrillaga Y.H. Liu and N.R. Watson “ Flexible Power Transmission” The HVDC Option ISBN 978-0-470-05688-2(HB), pp 1-175 published in 2007 by John Wiley & Sons ltd West Sussex PO19 8SQ, England
[4] Al-Mohaisen, S. Sud, “Status and development on the GCC interconnection project: CIGREE Panel Session, Doha, Qatar November 27-29, 2005, pp 1-6
[5] Al-Asaad & Al-Mohaisen, “GCC power grid: transforming the GCC power sector into major energy trading market” Cigree Conference, Abu Dhabi November, 27-29, 2006, pp 1-8
[6] Tariq Masood, R.K. Aggarwal, S.A. Qureshi, , R.A.J Khan “STATCOM and SVC Control Operations and
Optimization during Network Fault Conditions”: published in IEEE ISIE,2010 Conference 04-07 July,2010 at Bari Italy, pp 1088-1091
[7] Tariq Masood, R.K. Aggarwal, S.A. Qureshi, , R.A.J Khan “STATCOM Model against SVC Control Model
Performance Analyses Technique by Matlab” published in ICREQP,10 Conference on 23-25 March,2010 at Granada Spain, pp 1-8
[8] Tariq Masood, R.K. Aggarwal, S.A. Qureshi, , R.A.J Khan “STATCOM Control Reconfiguration Technique
for Steady State and Dynamic Performance Optimization during Network Fault Conditions” published in ICREQP,10 Conference on 23-25 March,2010 at Granada Spain, pp1-5
[9] Tariq Masood, S.A. Qureshi “FACTS Control Devices (STATCOM, SSSC and UPFC) Re-Configuration Techniques By using PSIM/MATLAB” published in IEEE-ICEE on 9-12
th April, 2007 at Lahore Pakistan, pp
1-6 [10] Raj K. Aggarwal, Brian Bolton “Power System Fundamental” Module 1 section no 8 transmission line
characteristics, published by the University of Bath in 2006, pp, 8-1 to 8-27 [11] Raj K. Aggarwal, Makeen Elketab “Power system simulation and analysis” Module 6 section no. 2 Long line
transmission” shunt/series compensation revised version published by the University of Bath in 2000, pp, 2-1 to 2-37
[12] Arvindam Ghosh listed below lectures delivered on 23-26 June, 2003 published by PSERC, managed by Lead University and Arizona State University © 2010 Board of the University of Wisconsin System (1) Problems with bulk power transmission and shunt compensation, pp 1-40 (2) series compensation of transmission system and other FACTS controllers, pp1-50 (3) power quality, custom power & network reconfiguring devices, pp 1-45 (4) Distribution STATCOM, Dynamic voltage restorer (DVR) and Unified Power Quality Conditioner (UPQC), 1-35
[13] Douglas J. Cooper “Practical Process Control Proven Methods and Best Practices for Automatic PID Control” by using optimization Technique published on website, 2006-2008, (http://www.controlguru.com)
[14] Andrew Stellman & Jennifer Greene “Applied software in project management” by using wideband Delphi estimation technique, Chapter ISBN: 0-596-00948-8 published in May 1, 2005.
[15] Kim Sin Pang, “Required Shunt Compensation for an EHV Transmission line” thesis published by The University of Queensland Australia in 22
nd May 2003.
[16] John J. Paserba, “How FACTS Controllers Benefit AC Transmission Systems” published in Transmission and distribution and exposition 2003 IEEE PES pp.991-998.
[17] Tariq Masood & Hamad Al-Baker “Procedure for PID, PD, PI Loop Performance Monitoring, Tuning & Optimization” QPR-PDD-010 published in September, 2012 by Qatar Petroleum.
[18] M.k. Tiwari and S.K.Tiwari “A Genetic Algorithm Based Approach to Solve Process Plan Selection Problems” published IEEE conference and proceeding, pp 281-284
[19] Liu Changliang, Liu Jizhen “The Application of Genetic Algorithm In Model Identification” published in IEEE proceeding TENCON’02, pp 1261-1264
[20] Roland S. Burns “Advance Control Engineering” published in 2001 by Butterworth- Heinemann (ISBN 0 7506 51008). Pp-464
[21] Muhammad H. Rashid “Power Electronics Handbook” published in 2001 by Academic press (Harcourt Science and Technology), pp -892.
References
References
202
[22] Fraidoon Mazda “Power Electronics Handbook” third edition published by Newnes, 2003 ISBN 0 7506 2926 6, pp-450.
[23] Vija K. Sood “HVDC and FACTS Controllers” published by Kluwer Academic Publisher in 2004 e-book ISBN 1-4020-7891-9, pp-294
[24] K. R. Padiyar “ FACTS Controllers in Power Transmission and Distribution” published New Age International in 2007 ISBN- 978-81-224-2541-3; pp-532
[25] R. Howard and D. J. Cooper “A Novel Pattern-Based Approach for Diagnostic Controller Performance Monitoring” published in Elsevier Journal in 2009
[26] R. Rice and D. J. Cooper “A Rule Based Design Methodology for the Control of Non Self-Regulating Processes” published in Elsevier Journal in 2004
STATCOM PUBLICATIONS [27] A. Nazarloo, S. H. Hosseini, E. Babaei, “Flexible D-STATCOM Performance as a Flexible Distributed
Generation in Mitigating Faults” published in 2011-2nd
power electronics drive systems and technologies conference, pp.568-573.
[28] Gregory reed, John Paserba, Masatoshi Takeda, Yoshihiro Hamasaki, Lauri Thomas, George Smith “The VELCO STATCOM-Based transmission system Project” Pg 1109-115 IEEE-
[29] Chunyan, Zhenjiang, ‘Online Monitoring and Fault Diagnose System of STATCOM” published in IPEMC2009, pp 2345-1348.
[30] Ebrahim Badran, M. El-Shamoty, and Saad El-Morcy, 2009 “A Phase-Controlled STATCOM Benchmark Model for Power System Studies using ATPdraw” 978-1-4244-5844-8/09/26 ©2009 IEEE pp. 532-536.
[31] G. ZHAO, J. LIU “An Analysis on the Influence of Interface Inductor to STATCOM system with Phase and Amplitude Control and Corresponding Design Considerations” 978-1-4244-4783-1/10/25 ©2010 IEEE, pp. 1633- 1639.
[32] Guopeng ZHAO & Jinjun LIU “An Analysis on the Influence of Interface Inductor to STATCOM system with Phase and Amplitude Control and Corresponding Design Considerations” 978-1-4244-4783-1/10/©2010 IEEE pp 1633-1640.
[33] H. M. Pirouz, M. Tavakoli Bina, “New Transformerless Medium-Voltage STATCOM based on Half-Bridge Cascaded Converters” 978-1-4244-5971-1/10 ©2010 IEEE, pp.129-134
[34] Iannuzzi, Lauria and Pagano “Advanced STATCOM Control for Stand Alone Induction Generator Power Sources” published in SPEEDAM-2008 (International Symposium on Power Electronics, Electrical Drives, Automation and Motion) Pp. 59-65.
[35] Juan Castaneda, Johan David Elizondo Nagy “Application of STATCOM with Energy Storage for Wind Farm Integration”, 978-1-4244-6547-7/10 © 2010 IEEE, pp. 1-6
[36] M.Bhaskar, S.S.Dash, & C.Subramani, “NON LINEAR CONTROL OF STATCOM” “2010-International Conference on Recent Trends in Information, Telecommunication and Computing” pp.190-195
[37] Metin D., M. Kenan DOG, Dinçer M., Salih T., and Ali Ozturk, “investigation of the Best Placement for Voltage Stability by STATCOM” pp. i-117- i-121
[38] Rajive, K. Varmma, Shriram and Vinay, “Novel application of a PV solar Plant as STATCOM during Night and day in a Distribution Utility network”, 978-1-61284-788-7/11 ©2011 IEEE, pp. 1-8
[39] S. Zheng, H.Tang, and S. Fang, “Research on D-STATCOM with Direct Current Control Strategy and Its PSCAD/EMTDC Simulation” 2011 Chinese Control and Decision Conference (CCDC) 978-1-4244-8738-7/11 ©2011 IEEE, pp 2813-2818
[40] S.Teleke, A. Yazdani B.Gudimetla, “Application of STATCOM for Power Quality Improvement” 978-1-61284-788-7/11 ©2011 IEEE, pp. 1-6
[41] Shu Steven and Y. Chang “Dynamic and Unbalance Voltage Compensation Using STATCOM” IEEE-2008. [42] T. Fuji, K. Tema, “450MVA GCT-STATCOM for stability improvement and over-voltage suppression”
published in 2010 Power Electronics conference, pp.1766-1772. SSSC PUBLICATIONS: [43] A.D. Falehi and A. Doroudi “Coordinated design of PSSs and SSSC-based damping controller based on GA
optimization technique for damping of power system multi-mode oscillations” published in 2011 2nd
Power Electronics, drive system and technology conference, pp. 199-205
[44] Ali Ajami and mehdi “Modeling and State Feedback Controller of SSSC Based Current Source Converter” 978-0-7695-3925-6/09© 2009 IEEE
[45] Cao Taibin & Qian Bifu, “The Design of Nonlinear Control Strategy for SSSC Based on Constant Voltage Control” 978-1-4244-9600-6/11©2011 IEEE, pp 30-33
[46] G. Abdollahi Sarvi & M. Tavakoli Bina SSSC circuit model for three-wire systems coupled with Delta-connected transformer¸978-1-4244-4813-5/10/ ©2010 IEEE, pp 1-5

References
203
[47] M. Faridi & H. Maeiiat “Power System Stability Enhancement Using Static Synchronous Series Compensator (SSSC)” 978-1-61284-840-2/11/©2011 IEEE, pp. 387-392
[48] M. Khederzadeh, and A. Salemnia “Impact of SSSC on the Digital Distance Relaying, 978-1-4244-4241-6/0 ©2009 IEEE.
[49] M. Sedighizadeh , M.Toulabi,2009 “Damping Improvement by SSSC and STATCOM in a Part of Iran Electrical Network”, IEEE-Power Delivery Journal.
[50] Pável Zúñiga-Haro “Harmonic Modeling of Multi-pulse SSSC” 978-1-4244-2235-7/09/©2009 IEEE, pp 1-8 [51] R.K Pandy and NK Singh “Optimal Power Oscillation Damping with SSSC” IEEE-Power Delivery Journal. [52] S. Jamali, A. Kazemi, “Measured Impedance by Distance Relay for Inter Phase Faults in Presence of
SSSC” 978-1-4244-3811-2/09/©2009 IEEE [53] S. Jamli “Adaptive Distance Protection in Presence of SSSC on a Transmission Line” 978-1-4244-5940-
7/10/©2010 IEEE, pp 1-7 [54] S. Khani, M. Sadeghi, S.H. Hosseini, “Optimal Design of SSSC Damping Controller to Improve Power
System Dynamic Stability Using Modified Intelligent Algorithms” 978-1-4244-5971-1/10/©2010 IEEE, pp. 393-397
[55] Xiang Zheng, and Chao Wang “Active Damping Controller Design for SSSC to Mitigate Subsynchronous Resonance 978-1-4244-6551-4/10/©2010 IEEE
[56] Hernandez, P. Eguia, Dynamic simulation of a SSSC for power flow control during transmission network Contingencies” 978-1-4244-8417-1/11/©2011, pp 1-6
[57] Javier Chivite-Zabalza & Miguel Rodríguez “Power Quality Analysis of a Synchronous Static Series Compensator (SSSC) Connected to a High Voltage Transmission Network” 978-1-4244-6551-4/10/©2010 IEEE, pp 1-8
[58] Javier Chivite-Zabalzaand Miguel Rodríguez “Power Quality Analysis of a Synchronous Static Series Compensator (SSSC) Connected to a High Voltage Transmission Network”, 978-1-4244-6551-4/10/©2010 IEEE, pp. 1-8
[59] M. R. Banaei “Enhancement of Power System Stability by Means of SSSC and STATCOM: A Comparative Study” pp I-348 to I-352
UPFC PUBLICATIONS: [60] Ch. Chengaiah R. V. s. Satyanarayanl “Power Flow Assessment In Transmission Lines Using Simulik
Model With UPFC” 978-1-4673-0210-4/12/©2012 IEEE, pp 151-157. [61] Chia Chu & Hung Chi “Energy Function Based Neural Networks UPFC for Transient Stability Enhancement
of Network-Preserving Power Systems” 978-1-4244-5309-2/10/©2010 IEEE, pp 2766-2769 [62] D. W. Lee and S. I. Moon “A Study on Coordinated Control of UPFC and Voltage Compensators Using
Voltage Sensitivity” published in IEEE Power delivery transaction, 2008, pp1-8. [63] Jia-jun & Mei-juan XUE “The Implementation of A New Scheme based on integrated functions of back-to-
back Power Grid Synchronization Parallel and UPFC”, 978-1-4244-6255-1/11/©2011 IEEE, pp 1-3. [64] Jose.P.Theratti and P.C.Panda “Damping of Power System Oscillations using an Advanced Unified Power
Flow Controller” 978-1-4577-0001-9/11/©2011 IEEE pp 126-132. [65] Juan Li, Kun Wang “Model and Method for Power Flow Calculation of Three Phases Power System with
UPFC” 978-1-4244-8165-1/11/ ©2011 IEEE, pp 245-249. [66] Mojtaba Khederzadeh, UPFC Operating Characteristics Impact on Transmission Line Distance Protection”
published in IEEE Power delivery transaction, 2008, pp 1-6. [67] Rajive Tiwari, K.R.Niazi, & Vikas Gupta Decoupled Power Exchange Model of UPFC to Enhance Voltage
Stability Margin of Power Systems, 978-1-4577-1002-5/11/©2011 IEEE, pp1-8. [68] S. L. Silva Lima, E. H. Watanabe “UPFC Based On Single-Phase Converters For Voltage Control” 978-1-
4577-1646-1/11/ ©2011 IEEE pp 107-113 [69] Suppakarn Chansareewittaya and Peerapol Jirapong “Total Transfer Capability Enhancement with Optimal
Number of UPFC Using Hybrid TSSA” 978-1-4673-2025-2/12©2012 IEEE, pp1-5 [70] Kazemi, S. Jamali, H. Shateri “Voltage Inversion due to UPFC Presence on Second Circuit of Double
Circuit Transmission Line Causing Distance Relay Mal-Operation” 978-1-4244-1666-0/08/©2008 IEEE, pp 384-390
[71] Li LI, Zongxiang LU, Arui QIU “Research on the Index System to Evaluate Power System Steady State Security with UPFC” 978-1-4244-5721-2/10 ©2010 IEEE, pp 486-491
[72] M. Boyra∗ and J.-L. Thomas “Size comparison of MVDC and D-UPFC for MV distribution network interconnection” 978-1-4244-4987-3/10/©2010 IEEE, pp 245-251
[73] M. Karbalaye Zadeh V. Khatami “A Fuzzy Control Strategy to Damp Multi Mode Oscillations of Power System Considering UPFC” IEEE power Journal.

References
204
[74] M. Kenan DÖŞOĞLU & Ayşen BASA ARSOY “Investigation of Transient Stability of Multi Machine Power Systems with Multiple UPFC” © 2011 IEEE pp I-137 to I-141
HVDC PUBLICATIONS: [75] Chunyi Guo, and Chengyong Zhao, “Supply of an Entirely Passive AC Network Through a Double-Infeed
HVDC System” 0885-8993/ © 2010 IEEE pp 2836-2840 [76] D.T. Oyedokun & K. A. Folly “Effect of Converter DC fault on the Transient Stability of a Multi-Machine
Power System with HVDC Transmission lines” 978-1-4244-3919-5/09/©2009 IEEE pp 1-6 [77] Hongtao Wang & Chengming He “Stability Mechanism Analysis of HVDC Control System for Power System
Restoration Using HVDC” 978-1-4577-0365-2/11/ ©2011 IEEE pp 433-438 [78] Qing Zhong, Yao Zhang & Lingxue Lin “Study of HVDC Light for Its Enhancement of AC/DC
Interconnected Transmission Systems” ©2008 IEEE. Pp 1-10 [79] Y.P. Li, D.G. Wang “Real-time Simulation Study on HVDC Control and Protection” 978-1-4244-5940-711
0/©20 10 IEEE pp 1-6 [80] Yan Liu, Zhe Chen “Short Circuit Ratio Analysis of Multi-infeed HVDC System with a VSC-HVDC Link” 978-
1-61284-972-0/11/©2011 IEEE pp 949-955 [81] Yan Liu, Zhe Chen, “Transient Voltage Stability Analysis and Improvement of A Network with different
HVDC Systems” 978-1-4577-1002-5/11/©2011 IEEE pp 1-6 [82] Yong Li & Zhiwen Zhang, “Study on Steady- and Transient-State Characteristics of a New HVDC
Transmission System Based on an Inductive Filtering Method” 0885-8993/© 2011 IEEE pp 1976-1980 [83] Yong LI, Longfu LUO, Kazuo Nakamura “Transient Response Characteristics of New HVDC Transmission
System Based on New Converter Transformer” 978-7-900714-13-8/08/ ©2008DRPT pp 1873-1878 [84] M Ramesh, & A. Jaya Laxmi, “Fault Identification in HVDC using Artificial Intelligence – Recent Trends and
Perspective” 978-1-4673-0449-8/12/©2012 IEEE, pp 1-6 [85] Nagesh Prabhu, and K. R. Padiyar, “Investigation of Subsynchronous Resonance With VSC-Based HVDC
Transmission Systems” 0885-8977/ © 2008 IEEE , pp 433-441 [86] Nguyen-Mau & K. Rudion, “HVDC Application for Enhancing Power System Stability” ©2011 IEEE pp 1-6 [87] Nima Mossadegh & R.K. Aggarwal “Management and Viability of Multi-Terminal HVDC for Offshore
Renewable Energy Networking” UPEC2010 31st Aug - 3rd Sept 2010 pp 1-6 [88] Paulo Fischer de Toledo, Jiuping Pan, “Case Study of a Multi-Infeed HVDC System” 978-1-4244-1762-9/08/
©2008 IEEE pp 1-7
PID CONTROLLER TUNING PUBLICATIONS: [89] B.Nagaraj & N.Murugananth “A Comparative Study of PID Controller Thning Using GA, EP, PSO and ACO”
978-1-4244-7770-8/10/ ©2010 IEEE, pp, 305-313. [90] Bin Zuo & Jing Li “PID Controller Tuning by Using Extremum Seeking Algorithm Based on Annealing
Recurrent Neural Network” 201O 3rd International Symposium on Knowledge Acquisition and Modeling, pp 132-135.
[91] Chiha, J. Ghabi and N. Liouane “TUNING PID CONTROLLER WITH MULTI-OBJECTIVE DIFFERENTIAL EVOLUTION” Proceedings of the 5th International Symposium on Communications, Control and Signal Processing, ISCCSP 2012, Rome, Italy, 2-4 May 2012 pp 1-10
[92] Gang Fu, Dapeng Shi and Shimin Zhao “An IMC-PID controller tuning strategy based on the DE and NLJ hybrid algorithm” 978-1-4244-4246-1/09/©2009 IEEE pp 307-311
[93] Jie Li & Jingkuan Gong “PID Controller Tuning using Particle Filtering Optimization, 978-1-4244-6044-1110/©2010 IEEE, pp 66-70
[94] Jyh-Cheng & Sheng-Wen Lin “PID Controller Tuning Based on Smith-Type Compensator for Second-Order Processes with Inverse Response and Time” Delay” Proceedings of 2011 8th Asian Control Conference (ASCC) Kaohsiung, Taiwan, May 15-18, 2011, pp 1147-1152
[95] Jyh-Cheng Jeng*, Sheng-Wen Lin “PID Controller Tuning Based on Smith-Type Compensator for Second-Order Processes with Inverse Response and Time Delay” © 2009 IEEE pp 1147-1151
[96] Maryam Khoie Ali Khaki Sedigh Karim Salahshoor PID Controller Tuning using Multi-Objective Optimization based on Fused Genetic-Immune Algorithm and Immune Feedback Mechanism, Proceedings of the 2011 IEEE International Conference on Mechatronics and Automation August 7 - 10, Beijing, China, pp 2459-2464.
[97] Yanzhu Zhang & Jingjiao Li “Fractional-order PID Controller Tuning Based on Genetic Algorithm”, 978-1-61284-109-0/11/©2011 IEEE, pp 764-767
[98] Yingjian Xu, Daxiao Wang, Shaoqin Lin, Wei Zhang ”A Simple PID Controller Tuning Strategy for First Order plus Dead Time Model” 978-1-4577-0321-8/11/ ©2011 IEEE, pp. 3514- 3517

References
205
[99] ZOU Dexuan & GAO Liqun “A Modified Global Harmony Search Algorithm for Robust PID Controller Tuning” Proceedings of the 30th Chinese Control Conference July 22-24, 2011- China, pp 2158-2163.
[100] Akihiro Oi, Chikashi Nakazawa, Tetsuro Matsui “Development of PSO-based PID Tuning Method” International Conference on Control, Automation and Systems 2008 Oct. 14-17, 2008 in COEX, Seoul, Korea, pp 1917-1922
[101] Akira Yoshida & Shinji Kanagawa “PID Controller Tuning Based on the Covariance Matrix Adaptation Evolution Strategy” PR0002/09/0000-2982 © 2009 SICE pp 2982-2986
[102] B.Nagaraj & N.Murugananth “A Comparative Study of PID Controller Thing Using GA, EP, PSO and ACO” 978-1-4244-7770-8/10/ ©2010 IEEE, pp, 305-313.
[103] Bin Zuo & Jing Li “PID Controller Tuning by Using Extremum Seeking Algorithm Based on Annealing Recurrent Neural Network” 201O 3rd International Symposium on Knowledge Acquisition and Modeling, pp 132-135
[104] Chiha, J. Ghabi and N. Liouane “Tuning Pid Controller With Multi-Objective Differential Evolution” Proceedings of the 5th International Symposium on Communications, Control and Signal Processing, ISCCSP 2012, Rome, Italy, 2-4 May 2012 pp 1-10
[105] Gang Fu, Dapeng Shi and Shimin Zhao “An IMC-PID controller tuning strategy based on the DE and NLJ hybrid algorithm” 978-1-4244-4246-1/09/ ©2009 IEEE pp 307-312
[106] Jie Li & Jingkuan Gong “PID Controller Tuning using Particle Filtering Optimization, 978-1-4244-6044-1110/©2010 IEEE, pp 66-70
206
A lumped compensation,62 HVDC applications, 72 Ac filter, 139 HVDC Characteristics, 73 Accuracy, 29, 41, 42 HVDC/FACTS devices Challenges, 74 Active and reactive power, 13, 14, 17 HVDC/HVAC Power delivery limitations, 74 Adaptive tune, 81 Improve the power-angle characteristics, 51 Aggregate capacitive/inductive response, 198 Improve the stability margin , 51 Architecture, 33, 147 Improve voltage profile, 51 Back to back HVDC link, 42 Increase power transfer, 39 Capacitive and Inductive output, 60 Integral control, 82 Centralized control, 98, 121, 153 Integral gain, 82 Changing the modulation ratio, Integral time, 82 Characteristic impedance of the line, 60 Internal control, 149 Closed loop current control,29 Inverter control operations, 143 Commissioning phases, 25 Layers, 147 Configuration, 37 Line impedance, 150 Constant Power, constant frequency, 40 Loop gains, 80 Control Loop Characteristics , 82 lossless and represented, 50 Control loops tuning and optimization, 79 Low losses at zero output, 60 Controllability, 79, 97 Maximum angle of firing, 138 Conventional and other nonconventional, 149 maximum power transfer limit, 146 Converter topology, 135 Medium impact on system stability, 167 Current tracking control, 35 Midpoint of a lossless line, 51 Damping and voltage improvement, 29 Modular Converter, 37 DC filters, 139 Multi variable controller, 108 De- Centralized control, 156 Multifaceted operational features, 84 Derivative control, 30, 81 Negligible impact on load flow,27 Deteriorate the power system stability, 40 Network performance, 31 Determine that current demand, N-feedback, 80 Dimensional compensation, 142 Offset, 81 Distributed compensation consists, 62 Open loop fixed firing angle control,29 Distributed parameters, 46 Operating angle, 78 Economic consideration, 77 Operational scenarios, 159 Enhanced stability area, 38 SSSC selection process, 110 Estimated values of significance, 99 SSSC System reinforcement plan, 109 External control, 149 Stability issues, 26 FACTS, 149 Stability margin, 26 FACTS-FFRAME, 147 STATCOM effectiveness, 101 FACTS-FRAME case study, 159 STATCOM model study, 99 FACTS-FRAME major components, 149 STATCOM operations, 101 Feed forward, 81 STATCOM Optimized Dynamic, 100 Full dynamic control, 120 STATCOM selection process, 98 GCC power grid, 121, 122 Static Synchronous Series Compensator, 107 Optimal location, 153 Step-up transformer, 37 Optimization and integration process, 31 Strong impact on power system stability, 75 Optimization technique, 31, 37, 78 Strong impact on voltage control, 167 P-feedback, 80 Subsynchronous Series Controller, 27 Phase angle, 81 successive peaks, 86 Phase Quadrature, 27, 28,53 Sustainable solution, 27 Phase Quadrature with midpoint, 52 System collapse, 32 Phase shift, 43 Technique validated, 102 PI control model simulation technique, 87 Transmission capacity ,135 PI Controller of Series Converter , 91 Typical voltage and current waveform, 136 PI controller of Shunt converter, 89 UPFC compensation, 69 PID control, 92 UPFC description, 138 Potential candidate , 135 UPFC effectiveness, 124
Index
Index
207
Power interconnection, 135 UPFC operating performance 123 Power swing damping, 55 UPFC operations, 158 Power system stability, 75 UPFC selection process, 121 Principle of AC/DC/AC Conversion, 73 UPFC System reinforcement plan, 120 process dynamics, 80 Various operational, 150 process error Ep, 83 VI Curves & relationship, 55 product and its inconsistency, 86 Voltage control mode, 89 Propagation constant, 47 Voltage level, 98 proportional band is too low, 80 voltage magnitude,100 Proportional control, 81 Voltage profile, 102 Provide damping to power oscillations , 51 Voltage source converter, 112 quarter wave decay ratio curve, 79 Voltage source converter, 112 Reactance and current control, 28 Wideband Delphi technique, 99, 111, 122,154, Reactive power flow on DC system, 28 Reactive power management, 136 Rectifier control operations, 141 security criticalities into consideration, 175 Segmental links, 96 Series Compensation Drawback ,63 Series compensation, 63 Series compensator mode of operations 64 Series configuration, 84 Series controller voltage injection, 167 Shunt Reactive Compensation, 56 Smooth control with VSC, 30 SSSC effectiveness, 113 SSSC operations, 68 SSSC Optimized Dynamic Response, 111

208
In the past, there were large numbers of research papers published related to FACTS devices
operations, control and protection systems at different levels. In this research work FACTS controller
based three novelties have been introduced and described as below.
The first novelty of this research work is a FACTS-FRAME that has been introduced to integrate a
centralized and decentralized control system to operate the STATCOM, SSSC & UPFC control
devices at different locations on the GCC power grid. The simulation results demonstrate that this
centralized controller has a capacity and capability to adjust STATCOM, SSSC and UPFC devices
operating parameters to maintain all three devices operations in parallel in order to meet time-based
required reactive power compensation on the GCC power grid.
Similarly, the decentralized controller has a capacity and capability to adjust the STATCOM, SSSC
and UPFC devices operating parameters to maintain all three devices operations independently in
order to meet time-based required reactive power compensation at their define location on the GCC
power grid. The primary aim of both control topologies is to address time based power transmission
system contingences on the GCC power grid. The second novelty of this work is to operate these
devices seamlessly through three control limits which have been introduced based on PI controller’s
three sets of tuning parameters by using a D. J. Cooper control optimization technique. Based on
these parameters each FACTS controller will adjust compensation (capacitive & inductive), in three
control limits firstly minimum +/- 2%, secondly medium +/- 4%, thirdly maximum +/- 6%. These control
limits have demonstrated robust operations at different locations on the GCC power grid. The third
novelty of this work is the FACTS devices selection process by using the WBD iteration based value
estimation technique.
This is a simple technique which has a substantial potential particularly for technology selection
processes compare to genetic algorithm selection processes. In the WBD selection process proved
practical and theoretical parameters are applied. These are used for assessments to identify and
determine the estimated value credibility of each parameter in order for the right decision to be made
by the technical committee. This is the main strength of the WBD selection process technique which
used proved practical results. But it is very tedious and difficult to find the right people for the
assessment and technical committee. This is a weakness of the WBD technique. Listed below
chapters indicates the contribution of this thesis.
Chapter no 1 in this chapter we have
1. Provided Power transmission system network problems 2. Provided GCC power transmission current operations 3. Provided challenges on the GCC power grid 4. Provided why HVDC and FACTS devices needed.
Chapter no 2 in this chapter we have
1. Provided STATCOM, SSSC and UPFC application in the world 2. Provided Current project in operations of HVDC and FACTS controllers
Chapter no 3 in this chapter we have
1. Provided long transmission line model, its characteristics 2. Provided line inductive and capacitive reactance
Novelties and Contributions of this thesis
Contributions of the thesis
209
3. Provided line inductance balance for three phase line 4. Provided basic principle of shunt compensation 5. Provide shunt inductive and capacitive mode of compensation 6. Provided degree of shunt compensation 7. STATCOM mode of operations 8. STATCOM Benefits 9. Provided basic principle of series compensation 10. Provide series inductive and capacitive mode of compensation 11. Provided degree of series compensation 12. SSSC mode of operations 13. SSSC benefits 14. Provided basic principle of UPFC compensation 15. UPFC operations 16. UPFC benefits 17. Provided objective of HVDC transmission line 18. HVDC link deliverables 19. Provided challenges of HVDC 20. Provided FACTS devices outcomes 21. HVDC outcomes 22. Provided Economics consideration of FACTS devices and HVDC 23. Provided HVDC and FACTS devices benefits
Chapter no 4 in this chapter we have
1. Provided PID, PI, PD controller scope of functionality 2. Provided PI controllers tuning framework 3. Provided PI controller simulation technique
Chapter no 5 in this chapter we have
1. Provided STATCOM application reinforcement plan in between Qatar and Bahrain 2. Provided STATCOM controller selection process 3. Provided STATCOM model results 4. Provided network response with and without STATCOM
Chapter no 6 in this chapter we have
1. Provided SSSC application reinforcement plan in between UAE and Oman 2. Provided SSSC controller selection process 3. Provided SSSC model results 4. Provided network response with and without SSSC
Chapter no 7 in this chapter we have
1. Provided UPFC application reinforcement plan in between KSA and Kuwait 2. Provided UPFC controller selection process 3. Provided UPFC model results 4. Provided network response with and without UPFC
Chapter no 8 in this chapter we have
1. Provided HVDC design criteria 2. Provided transmission capacity of HVDC 3. Provided performance of HVDC system 4. Provided Rectifier control and operations 5. Provided inverter control and operations
Chapter no 9 in this chapter we have
1. Provided FACTS-FRAME Architecture 2. Provided FACTS-FRAME configuration 3. Provided FACTS devices optimal locations 4. Provided internal and external control of the FACTS devices 5. Provided FACTS controller integration and results
Contributions of the thesis
210
Chapter no 10 in this chapter we have 1. Provided PI controller configuration parameters selection process & significance 2. Provided Internal and external controls significance: 3. Provided Operational and maintenance control significance 4. Provided FACTS devices selection process & significance 5. Provided STATCOM, SSSC & UPFC controllers significance
Chapter no 11 in this chapter we have presented A framework for implementation of FACTS devices on the GCC power grid has been investigated to achieve following benefits:
1. Increased power transfer capability on the GCC power grid. 2. Increased power transfer capability 3. Improved GCC power grid operational reliability 4. Improved GCC power grid controllability

211
Tariq Masood (SM’03) received the M.Eng in Electrical power system
engineering from the University of Bath, Bath, UK., in 2007 and proceeding to
Ph.D. in Electrical power system (FACTS/HVDC control devices) from the
University of Bath, Bath, UK. He is a Chartered Engineer and Senior Member
of the IEEE-USA and Member of the IET-UK. He is also certified member of the
CET International USA and registered member of the ASCET (American
Society of Certified Engineers and Technicians) USA. He has also delivered numerous lectures on
FACTS Technology at IEEE Qatar Section and various Universities including University of Bath, Bath,
UK. He is also Lean Six-Sigma Green belt certified. He joined the Qatar Petroleum since 1997 where
he is currently Production Data analyst. He is/has been on several production department technical
and management committees’ member. He has published 15 technical papers in IEEE Conference,
Honeywell Users group and other International Conferences. He is the Secretary/Treasurer of the
IEEE Qatar Section. He received several awards in recognition of his outstanding performance and
dedication to improve Qatar Petroleum production operations and control. He was the secretary for the
GCC oil producing companies (QP-Qatar, PDO-Oman ARAMCO-Saudi Arabia, KOC-Kuwait,
TATWEER-Bahrain, and ADNOC-United Arab Emirates) Production and Maintenance Technical
Committee in 2008 and 2011.
Bibliography

212
1. Tariq Masood, R.K. Aggarwal, S.A. Qureshi, , R.A.J Khan STATCOM and SVC Control Operations and Optimization during Network Fault Conditions: IEEE International Symposium on Industrial Electronics Bari_ Italy (04-07 July, 2010).
2. Tariq Masood, R.K. Aggarwal, S.A. Qureshi, , R.A.J Khan STATCOM Model against SVC Control Model Performance Analyses Technique by Matlab: (ICREQP,10 Granada Spain 23-25 March,10).
3. Tariq Masood, R.K. Aggarwal, S.A. Qureshi, , R.A.J Khan STATCOM Control Reconfiguration Technique for
Steady State and Dynamic Performance Optimization during Network Fault Conditions: (ICREQP,10 Granada Spain 23-25 March,10).
4. Tariq Masood, S. A Qureshi, A.j Khan, Nasser Elamedi, Yacob Y.Almulla, S K Shah “Facts Control Devices (Statcom, Sssc And Upfc) Re-Configuration Techniques By Psim/Matlab” Papers published ICEE2007 on 11-12th April, 2007 at UET/RCET Lahore _ Pakistan
Seminars delivered on FACTS Technology following University:
1. University of Bath, Bath, UK in May 03, 2010
2. Texas A & M University, Qatar Campus in October 11, 2012
3. Qatar University, Doha Qatar, October 14, 2012
4. Texas Tech University, Lubbock, USA in November 05, 2012
Published papers and Seminars