Embed Size (px)
Citation preview

IMPROVEMENT OF POWER QUALITY
USING PWM TECHNIQUES
NIRAJ KUMAR , Associate professor R.K Gupta
Dept. of Electrical Engineering
Gyan Vihar School of Engg & Technology
Jaipur, Rajsthan
Abstract- The main purpose of this paper is to improve the power quality by using PWM Techniques and also discussed the effect of
harmonics. This paper is explain the power quality in term of definitions, causes and effect. To improve the fundamental peak voltage and
harmonics reduction be use many configuration of PWM techniques. In addition detail comparison of all configuration in term of THD, FET and
dominating harmonics element. The PWM technique is minimize the harmonics and also eliminate the harmonics. The PWM technique is
represent by a simple algebraic equation. This paper result describe on the basis of MATLAB simulation
Index Terms - Power quality, PWM Technique, THD, Harmonics, FET.
1 INTRODUCTION
Power quality is a mechanism used to describe electric
power that rotates an electric load and load’s demand
properly work with the electric power. With not a proper
power, an electrical device or load may fail or not operate
at all. There are many reason of poor quality power. Power
quality refers mainly to maintenance of the ac waveform at
rated frequency, undistorted balance at rated voltage.
Power quality is defined in different –different term by
different-different people. There are many confusion in the
meaning of ‘power quality’ not at least because power is a
synonyms of ‘electricity’ in American English it also called
energy transport per unit of time. In a simple word power
quality is a set of electrical limits that permits a part of
equipment to work in a manner without loss of
performance [4].
Power quality is one of the important part in the present
time .power quality performance is very thoughtful to the
quality of power supply. Power quality problem is occurs
between non-standard voltage and current or frequency.
When the results are failure with the end use of equipments
the major problem in power quality is voltage sag.
In the use of highly solid state switching device the power
quality issues and problem are consider in these device. For
non sinusoidal current flow through the transmission lines,
distribution, wide spread of power semiconductor switches
are utilized [1]. Mostly power electronic load is causes of
voltage distortions, harmonics and distortion. There are
many problem occurs causes of power quality like as
system equipment does not work, computer data loss,
memory loss of sensitive equipment such as computer,
programming logic controls, and protection [1]. Most
affecting part of distribution system is voltage sag and
swell. It is also wide spread power quality issue affecting
specially industries where involved losses can be reach
very high values. Voltage sags are caused by faults
elsewhere in the system. They have received special
attention now because spectacular failure have highlighted
the problem that result from the performance of computer
controlled loads and adjustable speed drives during these
voltage sags/swells. Sags/swells can cause components
over heating or destruction. Sags/swells not only cause
considerable productivity loss but there are also hard to
control. Sag /swell are events of short duration but high
impact. Voltage sag and swell is the 10% to 90% problem
of power quality especially in industry [2]. The main causes
of voltage sags are short circuits, lightning strokes, inrush
currents, and swell can also occur due to single line to
ground fault on the system, which can result in a temporary
voltage will be rise on the phases [3].
II Types of power quality problem
Different people say gives different-different definition.
Some definitions are defined here.
A. Voltage sags (or dips )
Voltage sag is occurs for short duration these duration
is 0.5cycle to 1 minute and also reduction in rms
voltage. In the normal voltage level will be decrease
10 to 90% of the nominal voltage.
International Journal of Scientific & Engineering Research, Volume 6, Issue 10, October-2015 ISSN 2229-5518
76
IJSER © 2015 http://www.ijser.org
IJSER

I)Causes : whenever load end side draw heavy current
suddenly than fault will be associated on transmission
or distribution network, also fault in consumer’s
installation.
II) Consequences: Tripping of connectors and
electromechanical relay based on micro controller these are
(PSc, PLCs, etc) [4].
B. Long interruptions:
Total interruption in the electrical supply in the
long time interval these durations are greater than 1
to 2 seconds.
I)Causes: component failure in power system network
lines striking, poles, fire , human error, Failure of
insulation.
II)Concequences: Stoppage of all component.
Fig 1 Long interruption
C. Voltage Spike
It is very fast changing of voltage for durations
from a few microseconds to few milliseconds.
These changes reach thousand of volts, in low
voltage [4].
I)Causes :Lightning arrestors is natural phenomena,
switching problem, power factor correction
capacitor, sudden remove of heavy load.
II)Concequences: Damage of equipment and out of
insulation on materials, data processing errors
,electromagnetic interference or information losses.
Fig 2 Voltage spike
D .Voltage swell
This voltage is momentary increase at power frequency
with the duration of more than one cycle less than few
seconds is called voltage swell.
I)Causes:Start/ stop of heavy Loads, badly regulated
transformers.
II)Concequences: flickering of lighting and screens,
data loss, damage of sensitive equipment, if the voltage
will be more high.
Fig 3 voltage swell
E. Harmonic distortion:
In the voltage or current waveform is distorted in a
period. Their waveform is the sum of different sine
wave with different magnitude and phase that are
multiples of power-system frequency.
I)Causes:- Arc furnaces electric machines working
above the magnetic saturation, welding machines,
rectifiers, All non linear loads, switch power supplies,
high efficiency lighting.
International Journal of Scientific & Engineering Research, Volume 6, Issue 10, October-2015 ISSN 2229-5518
77
IJSER © 2015 http://www.ijser.org
IJSER

II)Consequences: neutral overloading in 3 phase
systems, overheating of all cables and equipment, loss
of efficiency in electrical machines, electromagnetic
interference with communication system, tripping of
thermal protection, errors in measures when using
average reading meters.
Fig 4 Harmonic distortion
F. Voltage fluctuation
It is a type of series random voltage variations. The
Variation does not excess the range of 0.9 to 1.1p.u. the
Oscillation occurs in voltage and amplitude modulated
by a signal with frequency of 0to 30HZ.
I)Causes: Frequently start/stop of electric motors,
Oscillating loads, arc furnace.
II) Consequences: the most important is the flickering of
lighting and screens.
Voltage quality is the variation of the voltage from the
ideal. It is a single frequency sine wave of constant
amplitude and frequency. Current quality is also
concerned with the variation of the current from the
ideal case. It is again a single frequency sine wave of
constant amplitude and frequency. Current sine wave is
in phase with voltage.
Fig 6 Waveform shape (a) Voltage and current
waveform for linear load (b) Voltage and current
waveform for non linear load (c) waveform with
symmetric harmonic component.
III) INTRODUCE ABOUT HARMONICS
Nowadays due to increase the usage of non-linear load
its main reason is harmonics. Non-linear load is a type
of load in which current is not proportional to the
applied voltage. Different non-linear loads will have
different voltage –current characteristics.
Fig 7 Comparison of linear and non-linear VI
characteristics
In this graph a slight increase voltage can cause the
current to double. Distorted wave is the sum of pure sine
wave in which frequency of each sinusoid is an integer
multiple of fundamental frequency (50Hz). Earlier odd
harmonics components (3rd
, 5th , 7
th ) are the most
effective of the system.
A Voltage and current distortion
Source of harmonic current waveform is distorted
because of the non-linear loads. Distorted currents
passing through the linear circuits so voltage distortion
International Journal of Scientific & Engineering Research, Volume 6, Issue 10, October-2015 ISSN 2229-5518
78
IJSER © 2015 http://www.ijser.org
IJSER
will be occur. There have no control on the load in the
over voltage distortion.
In the power system the same load in two different
locations in two different voltage distortion value.
B. Even Harmonics
Even harmonics (2nd
, 4th , 6
th ) are likely occurs in
electrical system. Non linear loads normally generate
odd harmonics. When positive and negative half cycle
waveform is in similar shape in the non-linear load.
Fourier series contain only odd harmonics.
C. Odd harmonics
Odd harmonics (3rd
, 5th &7
th ) is common in power
system. It is not controlled. Each odd harmonics is
arranged with a harmonics sequence component
(positive, negative, and zero) . phase sequence is very
important because its effect of the harmonics on the
operation of electric equipment.
Harmonics Component
1 Positive
3 Zero
5 Negative
7 Positive
9 Zero
11 Negative
13 Positive
TABLE 1 Harmonics and their corresponding sequence
component
IV RESULT
There are many method to improved the power quality
by PWM converter. All the PWM techniques has been
simulated in MATLAB Software and show the result by
waveform its FET. The different configuration of the
PWM technique like Multi pulse PWM, Unipolar PWM
Parameter Peak
fundamental
THD % Dominating
Harmonics
Square Wave 1.261Vdc 48.3
3rd
,5th ,7
th
Multi Pulse
PWM
1.245Vdc 38.5
3rd
,5th
,7th
Uni polar
PWM
.866Vdc 3.76 43rd
and 45th
Trapeozoidal
PWM
1.05Vdc 38.5 3rd
,5th ,7
th
Selective
Harmonics
1.18Vdc 4.8 27th
Modified
PWM
.866Vdc 3.76 43rd
and 45th
Ac PWM 1.10Vdc 22.35 19th ,21
st
TABLE 2 Comparison of PWM Techniques
Fig 9(a) Multi pulse PWM i/p & o/p waveform
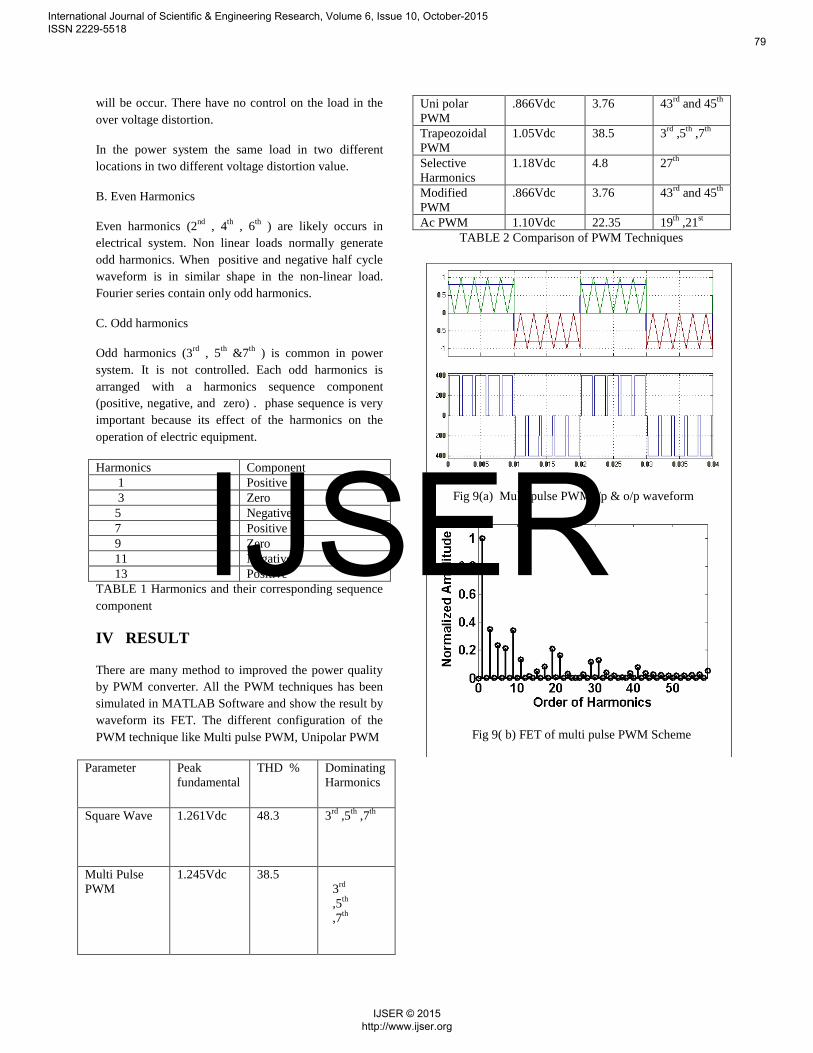
Fig 9( b) FET of multi pulse PWM Scheme
International Journal of Scientific & Engineering Research, Volume 6, Issue 10, October-2015 ISSN 2229-5518
79
IJSER © 2015 http://www.ijser.org
IJSER

Fig 10(a) Trapezoidal PWM i/p &o/p
Waveform
Fig 10(b) FET Of Trapezoidal PWM scheme
Fig 11(a) Ac Voltage i/p & O/p Waveform
Fig 11(b) FET of AC Voltage PWM Scheme
Fig 12(a) Unipolar PWM i/p & O/p Waveform
Fig 12(b) FET of Unipolar PWM Scheme
International Journal of Scientific & Engineering Research, Volume 6, Issue 10, October-2015 ISSN 2229-5518
80
IJSER © 2015 http://www.ijser.org
IJSER

Fig 13(a) Modified SPWM i/p & o/p waveform
Fig 13(b) FET of modified PWM Scheme
Fig 14(a) Selective harmonics elimination i/p & o/p
waveform
Fig 14(b) FET of selective harmonics elimination
PWM Scheme
V CONCULISION
There are many paper will be view in PWM and the
simulated on the MAT LAB. PWM technique is very
useful method of improving the power quality. There
are many method will be consider here and discussed
output waveform of these method.
Output of all PWM techniques are modified in
all SPWM technique is the best method. The Peak
fundamental output is 0.8 P.U. the THD is well below
the limit is 3.79% and dominating harmonics lie
between 43rd
and 45th order of harmonics.
VI ACKNOWLEDGEMENT
The author wish thank to everyone who have directly or
indirectly spotted for the completion of the work there
valuable comments and suggestion has greatly improve
the quality of paper.
REFERENCES
[1]. Chellali Benachaiba, Brahim Ferdi ―Voltage Quality
Improvement Using DVR‖ Electrical Power Quality and
Utilization, Journal Vol. XIV, No. 1, 2008.
[2]. Dash P.K., Panigrahi B.K., and Panda G., ―Power quality
analysis using S-transform‖, IEEE Trans. On Power Delivery,
vol. 18, no. 2, pp. 406–411, 2003.
.
[3] Bose, B.K. “ Modern Power Electronics and Drive
System”
[4]. Shalini Bajpai ―Power Quality Improvement Using Ac
To Ac PWM Converter for Distribution Line‖ International
Journal of Computational Engineering Research, Vol. 03, Issue
7, July 2013.
[5] W. Mack Grady, Surya Santoso, “Understanding
Power
System Harmonics” IEEE Power Engineering Review,
November 2001.
International Journal of Scientific & Engineering Research, Volume 6, Issue 10, October-2015 ISSN 2229-5518
81
IJSER © 2015 http://www.ijser.org
IJSER