Embed Size (px)
Citation preview
O p e r a t i o n s E x c e l l e n c e, Vol. 9, No 1, 2017
34
IMPROVEMENT OF BUSINESS PROCESS MODELING IN SMALL AND MEDIUM INDUSTRIES (SMIS) TO SUSTAIN IN GLOBAL ECONOMIC COMPETITION
Agung Haryono1, Erry Rimawan2
Master of Industrial Engineering Program, Universitas Mercu Buana Jakarta Corresponding author: [email protected], [email protected]
Abstract
The objective of this research is to analyze how Business Process Modelling (BPM) can be develop and improve in SMIs. Business Process Modeling have been the one of important strategy adopted by organizations around the world especially in Small and Medium Industries to sustain in global economic competition 2017. Successful implementation of these depends on applicability and business functional process effectiveness. BPM success also depends on organizational Business Process Improvement (BPI). This paper presents a benchmark process of BPM in Small and Medium Industry (SMI) perspectives especially in Steel fabricator SMI. And it creates new BPM in other SMI to become lean business in organizational structural. It includes a review of financial performance in SMI to decrease business process cost and get higher profit, findings of research accomplished via interviews with people in board of director and shareholder. Keywords: benchmarking, business process modeling, small and medium industry, financial performance, non-financial performance.
1 Introduction
The acceleration of the pace economy and competition in today's global competition era spurred the perpetrators attempt to adapt and improve the systems and strategies in improving the durability and the competitiveness of its business. The situation in Indonesia's economy is forcing entrepreneurs to adapt in answering any challenges that arise today. Strategies in maintaining the competitiveness of undertakings is a major key in surviving and increasing the competitiveness of businesses. Many companies are already falling and stop doing activities since eroded by the economic situation in Indonesia. Minimum wage increases, the coefficient of living, rising energy costs and a rise in other operating costs as well as weakening demand for the supply of which imposes price fluctuations of raw materials, resulting in a weakening of the competitiveness of an enterprise and endurance especially the Small and Medium Industry (SMI). This did not escape the competition between ASEAN countries in MEA 2017 and next 2018 requiring SMI should settled themselves in the face of new competition conditions, although the competition at the same time is a business opportunity. SMI could not survive if they don't do any improvement or innovation strategy business model. The SMI which has limited resources and manpower should implement the strategy of innovation to keep the sources that is more diverse than the desires of the market and fundamental insights about the external factors compared to prepare all of the resources and capabilities of its own. SMIs have an important function in many countries. They should implement their business to produce high quality product and services to compete and sustain in their business (Vrande et al., 2009). Each time the global crisis afflicting one of the parts of the world, the question that often arises is how strength the national economy and the perpetrators of the Small and Medium Enterprises (SMEs) able to survive from the fierce? No exception this year when Greece and some other European countries are being hit by debt crisis, the question back to the forefront in various public spaces across the country (Yun and Mohan, 2012). To maintain competitiveness and sustainability of SMI required an understanding of the strategy and business model that is applicable and appropriate in the process of implementation. Business Process Modeling (BPM) is a method of improving the efficiency and quality of an organization, it is derived from the value of a business, but the method can be applied in the activities of an organization. BPM techniques focus on mapping and process flow of work to make it more easily understood, analyzed and carried out repairs. Process flow diagram is the key method of BPM that explaining the structure and flow of the business process of an organization that starts from the beginning of the flow up to finish (Widiarto, 2015) .

O p e r a t i o n s E x c e l l e n c e, Vol. 9, No 1, 2017
35
2 Literature Review An understanding of the business processes should not be separated from the understanding of the production process. According to (Harrington, 1995), that the production process is any process related to the physical contact between hardware and software (raw materials into finished goods) where the output is a product that will be delivered to the customer until the products were already completed in the packing. Harrington defines the business process as a service of process or process which became a supporter of the production process. For examples the booking process (order), the process of payment (payroll), nor the manufacturing design process. It is said that a business process is composed of activities grouped by using the resources that belong to the organization as support in achieving the objectives of the organization. Defining the business process as a series of activities to change some of the input into the output added value to the consumer. This definition took the emphasis to the behavior of the input and output of a business process by first stating the initial condition/input (precondition) and the condition of the end/output (post condition). The process described in the abstract as a step of a series of activities. The definition of above business processes can be illustrated in a process that is clear, but also complex. A business process simple explained that when a request will process product (order) received, then the invoice/billing letter is sent, the payment (payment) is received, and the product ordered will be sent. The above activity is the activity of a business processes. Because business process performed by the organization according to the above definition of the flagellum, then the order of the sequence of activities in a controlled business process management that in a centralized software implemented by organizations that do production (Yahaya et al., 2012). Partial productivity is output ratio to one of input ratio (Sousa-Poza et al., 2009).
3 Method
Research methodology This research using the method of Workflow Reengineering Methodology (WRM), according to the (David, 1990; Monk & Wagner, 2009). Methods are following stages; Phase-1; build vision and objectives: step-1: identify a need for process improvement, step-2: establish change leadership role, step-3: introduce automated workflow management technology, step-4: brief, educate and train a change team, step-5: identify business cycle, step-6: create an organizational vision, step-7: analyze the project environment. Phase-2; identifying existing process: step-1: catalogue business products, step-2: identify business process, step-3: select a process for implementation and improvement, step-4: construct a work breakdown structure. Phase-3; identifying process improvements: step-1: consider the customer’s requirements, step-2: benchmark against industry competitors, step-3: specify performance goals, step-4: construct new workflow models. Phase-4; build prototype: step-1: realize prototype objectives, step-2: determine the prototype functions, step-3: build a prototype, step-4: evaluate and test the prototype, the researcher will not use all phase and step of these methods because the overall method of the suitable with the condition of resources on SMI are examined in order to be compatible and applicable to implemented. The existing BPM will analyze using financial performance survey and the improvement result will create a new BPM to implement in Senopati Sejati, PT, which have a typical business core also as a one group of SMI owner. Value analysis Value indicator for this research performance are using financial performance value and nonfinancial performance value. Financial performance measured by economic value added which contain of order volume value, gross profit and net profit. Nonfinancial performance measured by productivity performance ratio which contain of order volume ratio, job conflict ratio, rework ratio, purchase failure ratio and incorrect information ratio, these indicators are buildup from root cause analysis to short and find key performance indicator. Logical framework This research logical framework divided into several sections of flow figure below;

O p e r a t i o n s E x c e l l e n c e, Vol. 9, No 1, 2017
36
Figure 1. Logical Framework
Source: Haryono, 2017
Calculation formula Formula-1 Formula and calculation analysis for financial performance Gross Profit = Order Value – Total Cost [Rp.] Net Profit = Gross Profit – Over Head Cost (After Tax) [Rp.] Gross Margin Ratio = (Gross Profit / Order Value) x 100% [%] Net Margin Ratio = (Net Profit / Order Value) x 100% [%] Indicator-1; Formula-2
POq OOR = ---- x 100% TTq
When OOR = Order Omzet Ratio [%]; POq = Purchase Order quantity [Pc]; TTq = Total Tender quantity [Pc] Indicator-2; Formula-3
OJq JCR = ---- x 100% TJq
When; JCR = Job Conflict Ratio [%]; OJq = Overlap Job [Pc]; TJq = Total Job [Pc] Indicator-3; Formula-4
RJq RR = ---- x 100% TJq
When; RR = Re-work Ratio [%]; RJq = Re-work Job quantity [Pc]; TJq = Total Job quantity [Pc]

O p e r a t i o n s E x c e l l e n c e, Vol. 9, No 1, 2017
37
Indicator-4; Formula-5
Rq PFR = ---- x 100% TP
When; PFR = Purchase Failure Ratio [%]; Rq = Return quantity [Pc]; TP = Total Purchases [Pc] Indicator-5 Formula-6
IIq IIR = ---- x 100% TI
When: IIR = Incorrect Information Ratio [%]; IIq = Incorrect Information quantity [Pc]; TI = Total Informations [Pc]
4 Results and Discussion
Using organization existing data, researcher scheme the flow of BPM in CIX, PT and draw in a flow diagram. The following below is an existing flow of business processes model (BPM) in CIX, PT.
Figure 2. Business Process Model PT. CIX Sources: Survey in CIX, PT Year 2013-2016
VENDOR / CUSTOMER
MARKETING
ENGINEERING TEAM (SURVEYOR,ESTIMATOR,DESIGN&DR
AFTER, RESOURCES PLANNING)
BOD
ACCOUNTING
TAX
CONSULTANT
HRD
PROCUREMENT/PURCHASER
IN TERNAL HRANALYSIS
TECHNICAL APPROVAL
AGREEMENT
INVOICE
PROMOTE/PRESENT
TECHNICAL ANALYSIS
SU PPLIER-1
MRP/BOM, CONSUMABLE, EQUIPMENT, NDT,CERTIFIED
SU PPLIER-2 SU PPLIER-3
SUBCONT.
OUTSOURCHING
PAYROLL
BPJS
e-SPTINQUIRY QUOTE
FABRICATION
IN STALLATION
MAINTENAN CE
SCHEDULE
CONTRACT (PO/WO)
BANK
SHARE HOLDER
ADMIN/SECRETARY
WORKSHOP
CONTRACT (PO/WO)
ACCEPTANCE

O p e r a t i o n s E x c e l l e n c e, Vol. 9, No 1, 2017
38
Case Study In the course of business using business process flow in Figure 2 obtained data of financial statements in the form of annual income statement in the period 2014 going phenomenon that CIX, PT gaining a considerable turnover for the small and medium industry level achieves IDR 5,439,355,706 with gross profit before tax and overhead amounting to IDR 1,213,074,802 (22.3% of total turnover), but after tax cut, the costs and overhead of the acquired net profit to IDR 157,306,240 compared with the value obtained is much smaller turnover only 2.89%. Similarly, in the previous year, by 2013 the turnover of CIX, PT amounting to IDR 4,391,452,142 with gross profit before tax, fees and overhead amounting to IDR 1,163,385,740 (26.5% of total turnover), but after the cut in taxes, fees and overhead net profit gained to IDR 204,548,680 (4.66% of the total turnover). The phenomenon indicates that the operational costs of the company along with other overhead is very high. It also occurs on the recapitulation of the financial statements of the period before 2013 and the end of year 2015 that not shown all in this paper cause of some confidential data. Business process improvement From the results of a survey conducted by researcher against the company CIX, PT then obtained data in accordance with the stages of appropriate methods of Monk & Wagner (2009) (Sousa-Poza, 2009). The researcher will not use all of these methods because the overall method of the suitable with the condition of resources on SMI are examined in order to be implemented and applicable in Senopati Sejati, PT. The data result shown detailed as follows; Phase-1: Build vision and objectives Step-1: Identify a need for process improvement: Have to define existing flow process of organizations (see Pig. 1). From flow process data required a more effective structural alternatively. It must be realized that the cycle process flow that is too widened resulting in high processing fees. Step-2: Establish change leadership role in order to support upper management (board of directors and owner of the company) in the process of change is very importance and success key. Create the principle of openness in the upper management. Step-3: Introduce automated workflow management technology, it mean that all types of work flow process must have added value. Flow process must be mapped based on value chain analysis and compatible with SMI resources. Step-4: Brief, educate and train a change team by identification of changes in flow process is done by the top management has to understand the principle of the change in the development of SMI base on resources capability and organization capacity. Step-5: Identify business cycle: Marketing division was ineffective because many were taken over and on support by engineering team, this is due to limitations regarding technical insights from marketing team. Between accounting and Payroll are frequent overlapping of work. Between HRD and Engineering often happens wrong perceptions about the needs of human resources required base on job specification requirement. Between procurement and engineering common misperception regarding technical specifications. The information delivered by the admin and Secretary of the Board of Directors to upper management is often an error occurred because of lack of technical insight, employment contract and the customer specifications requirement. Workshop and Logistic are very high investment and it was very high cost expenses, Step-6: Create an organizational vision by Creating a business model that is lean and effective. Increase the added value and decrease costs. Step-7: Analyze the project environment; the environment of research area are SMI’s industrial estate, place layout, safety and other environment affecting will not describe in this research to focus in structural of BPM.

O p e r a t i o n s E x c e l l e n c e, Vol. 9, No 1, 2017
39
Phase-2: Identifying existing process Step-1: Catalog business products; CIX, PT and Senopati Sejati, PT have a typical core business, the product and services called ‘project’ and divided into three kind of type (fabrication project, installation project and maintenance project). All fabrication project type usually EtO model (Engineering to Order) which has custom designed as customer technical requirement that refer to technical standard requirement (such as ASME, NFPA, ASTM, SNI, ISO, etc.). Installation project have many variant scope of works depend on site project requirement and specification, it could be installation of the product which have been fabricated by self or sometime could be installation project only, it depend on project requirement. Maintenance project usually called shutdown project, this activity usually doing in weekend days or holiday when customer’s factory in shutdown or break position, time limitation very strictly importance in this kind of project. Step-2: Identify business process; in Figure 2 shown that the overall activity start from the customer requirement in the inquiry form receipt by marketing division. Marketing send all of tender/bidding include technical requirement specification to engineering team to analyze, technical calculation, safety calculation and estimates all of resources into bill of quantity, specification catalog, until pricing to quotation form to submit in project tender/bidding. After win the tender/bidding and receipt purchase order (for product) or work order (for services) all of requirement document submit to all of department in organization to prepare each resources in each division. Workshop is the centre of main activity to make a product and prepare for installation and maintenance project. HR responsible for fulfill all of human resources needed as per engineering qualification, procurement have responsible to selecting and purchase all of project need. When the product finish, QC pass, packaging and deliver to customer, then customer receipt with acceptance letter approval for invoicing document reference. Step-3: Select a process for implementation and improvement; this research focus in department organization structural of business process (marketing, engineering, procurement, HRD, workshop, accounting & payroll), Step-4: Construct a work breakdown structure; working structural flow explained in step 2 and shown in fig. 2, all division/department controlled and organize directly by board of director via general manager which have direct marketing, engineering manager, HR manager, workshop manager, accounting manager and overall organization activity. Phase-3: Identifying process improvements Step-1: Consider the customer’s requirements: In this study the customer is the owner of the company, researchers and other SMI, Step-2: Benchmark against industry competitors: SMI in similar industries in the structural processes that do almost the same BPM with CIX, PT however difference in magnitude of the scale of the industry. In this research CIX, PT is representative of other typical organization. Step-3: Specify performance goals: Target: reduce annual operating costs. Purpose: Can be implemented on a Senopati Sejati, PT and compatible to resources. Step-4: Construct new workflow models: Marketing division was ineffective because many were taken over and on support by engineering team, this is due to limitations regarding technical insights from marketing team. The condition analysis of the board of directors of Senopati Sejati decided to remove the division of marketing and create some of the engineering team as a marketing engineer (1st added value). Between accounting and payroll are frequent overlapping of work. The Analysis of the board of directors of Senopati Sejati, PT, decided to merge payroll and accounting into one section in the admin division (2nd added value). Between HRD and engineering often happens wrong perceptions about the needs of human resources required qualification. The analysis of the board of directors of SS, PT, decided to combine the HRD divisions in engineering and become Human Resources Engineer (3rd added value). Between procurement and engineering common misperception regarding the technical specifications. The analysis of the board of directors of SS, PT, decided to combine procurement in the division of engineering personnel
O p e r a t i o n s E x c e l l e n c e, Vol. 9, No 1, 2017
40
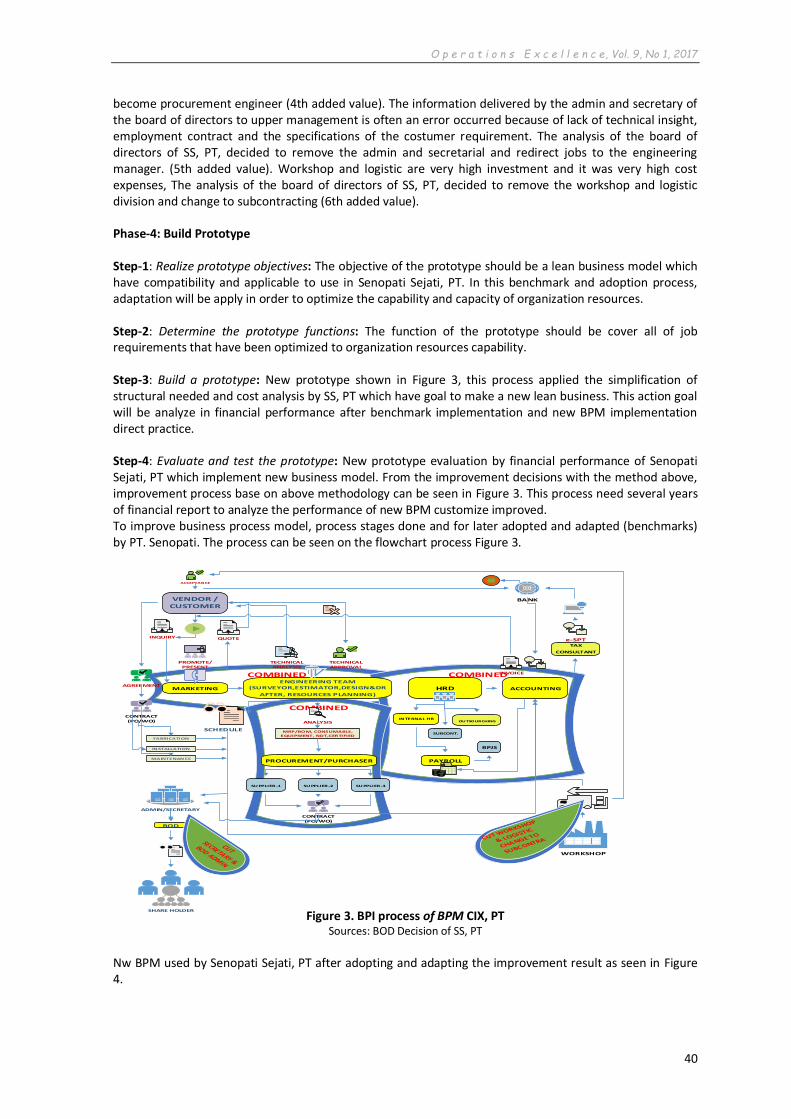
become procurement engineer (4th added value). The information delivered by the admin and secretary of the board of directors to upper management is often an error occurred because of lack of technical insight, employment contract and the specifications of the costumer requirement. The analysis of the board of directors of SS, PT, decided to remove the admin and secretarial and redirect jobs to the engineering manager. (5th added value). Workshop and logistic are very high investment and it was very high cost expenses, The analysis of the board of directors of SS, PT, decided to remove the workshop and logistic division and change to subcontracting (6th added value). Phase-4: Build Prototype Step-1: Realize prototype objectives: The objective of the prototype should be a lean business model which have compatibility and applicable to use in Senopati Sejati, PT. In this benchmark and adoption process, adaptation will be apply in order to optimize the capability and capacity of organization resources. Step-2: Determine the prototype functions: The function of the prototype should be cover all of job requirements that have been optimized to organization resources capability. Step-3: Build a prototype: New prototype shown in Figure 3, this process applied the simplification of structural needed and cost analysis by SS, PT which have goal to make a new lean business. This action goal will be analyze in financial performance after benchmark implementation and new BPM implementation direct practice. Step-4: Evaluate and test the prototype: New prototype evaluation by financial performance of Senopati Sejati, PT which implement new business model. From the improvement decisions with the method above, improvement process base on above methodology can be seen in Figure 3. This process need several years of financial report to analyze the performance of new BPM customize improved. To improve business process model, process stages done and for later adopted and adapted (benchmarks) by PT. Senopati. The process can be seen on the flowchart process Figure 3.
Figure 3. BPI process of BPM CIX, PT Sources: BOD Decision of SS, PT
Nw BPM used by Senopati Sejati, PT after adopting and adapting the improvement result as seen in Figure 4.
COMBINED COMBINED
COMBINED
VENDOR / CUSTOMER
MARKETING
ENGINEERING TEAM (SURVEYOR,ESTIMATOR,DESIGN&DR
AFTER, RESOURCES PLANNING)
BOD
ACCOUNTING
TAX
CONSULTANT
HRD
PROCUREMENT/PURCHASER
IN TERNAL HRANALYSIS
TECHNICAL APPROVAL
AGREEMENT
INVOICE
PROMOTE/PRESENT
TECHNICAL ANALYSIS
SU PPLIER-1
MRP/BOM, CONSUMABLE, EQUIPMENT, NDT,CERTIFIED
SU PPLIER-2 SU PPLIER-3
SUBCONT.
OUTSOURCHING
PAYROLL
BPJS
e-SPTINQUIRY QUOTE
FABRICATION
IN STALLATION
MAINTENAN CE
SCHEDULE
CONTRACT (PO/WO)
BANK
SHARE HOLDER
ADMIN/SECRETARY
WORKSHOP
CONTRACT (PO/WO)
ACCEPTANCE

O p e r a t i o n s E x c e l l e n c e, Vol. 9, No 1, 2017
41
Figure 4. Final result BPM SS, PT benchmark from CIX, PT Sources: BOD Decision SS, PT
Financial performance results that Senopati Sejati, PT, used new BPM implementation in period year of 2014 to 2016 resume in Table.1, and financial performance of CIX in Table.2.
Table 1. Income Statement Resume SS, PT Year 2014-2015 (new BPM)
Table 2. Income Statement Resume CIX, PT Year 2013-2014 (Old BPM)
Year Order Gross Profit % Net Profit %
2014 IDR 1,366,108,222 IDR 566,573,975 41.47 IDR 311,690,797 22.82
2015 IDR 1,894,866,035 IDR 680,500,600 35.91 IDR 480,700,800 25.37
2016 Not yet closed
Year Order Gross Profit % Net Profit %
2013 IDR 4.391.452.142 IDR 1.163.385.740 26,5 IDR 204.548.680 4.66 2014 IDR 5.439.355.706 IDR 1.213.074.802 22,3 IDR 157.306.240 2,89
VENDOR / CUSTOMER
ENGINEERING TEAM (SURVEYOR,ESTIMATOR,DESIGN&DR
AFTER, RESOURCES PLANNING)
TAX
CONSULTANT
TECHNICAL APPROVAL
AGREEMENTINVOICE
PROMOTE/PRESENT
TECHNICAL ANALYSIS
SU PPLIER-1
SU PPLIER-2
SU PPLIER-3
SUBCONT.
BPJS
e-SPTINQUIRY QUOTE
FABRICATION
IN STALLATION
MAINTENAN CE
SCHEDULE
CONTRACT (PO/WO)
BANK
CONTRACT (PO/WO)
ACCEPTANCE
BOD
Procurement
Engineer
Marketing EngineerHuman Resources
EngineerADMIN
O p e r a t i o n s E x c e l l e n c e, Vol. 9, No 1, 2017
42
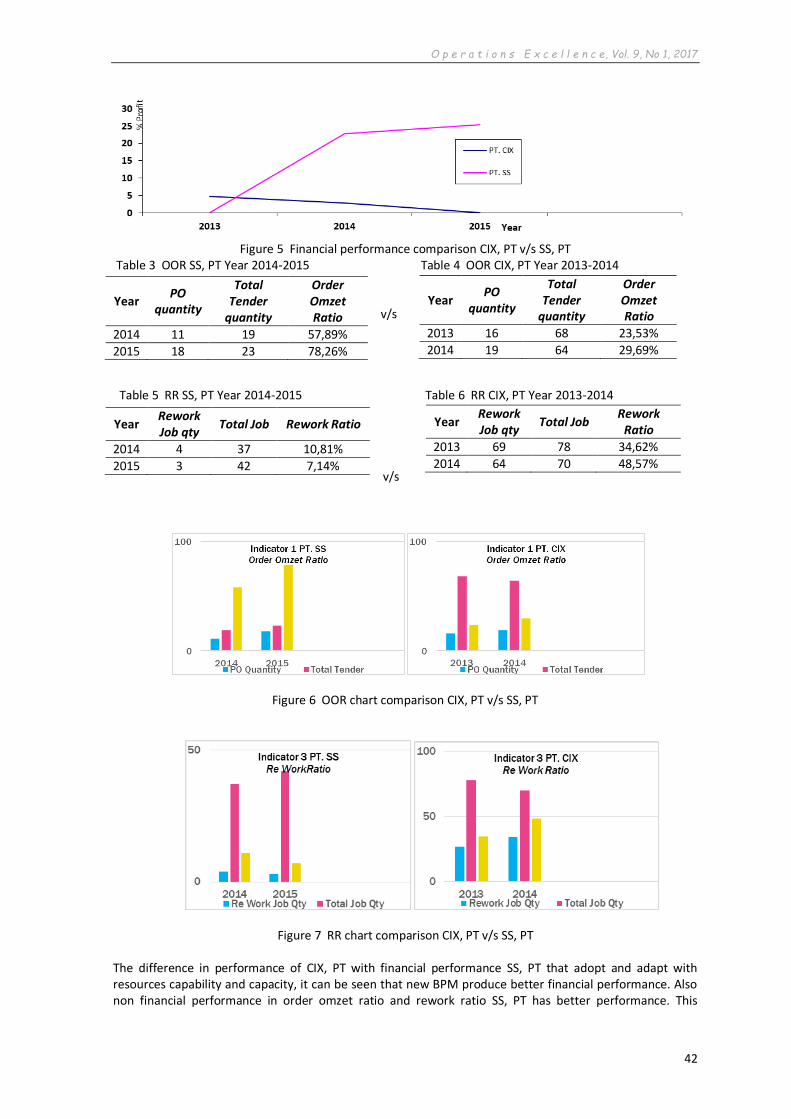
Figure 5 Financial performance comparison CIX, PT v/s SS, PT
Table 3 OOR SS, PT Year 2014-2015 Table 4 OOR CIX, PT Year 2013-2014 v/s
Table 5 RR SS, PT Year 2014-2015 Table 6 RR CIX, PT Year 2013-2014
v/s
Figure 6 OOR chart comparison CIX, PT v/s SS, PT
Figure 7 RR chart comparison CIX, PT v/s SS, PT The difference in performance of CIX, PT with financial performance SS, PT that adopt and adapt with resources capability and capacity, it can be seen that new BPM produce better financial performance. Also non financial performance in order omzet ratio and rework ratio SS, PT has better performance. This
Year PO
quantity
Total Tender
quantity
Order Omzet Ratio
2014 11 19 57,89%
2015 18 23 78,26%
Year PO
quantity
Total Tender
quantity
Order Omzet Ratio
2013 16 68 23,53%
2014 19 64 29,69%
Year Rework Job qty
Total Job Rework Ratio
2014 4 37 10,81%
2015 3 42 7,14%
Year Rework Job qty
Total Job Rework
Ratio
2013 69 78 34,62%
2014 64 70 48,57%

O p e r a t i o n s E x c e l l e n c e, Vol. 9, No 1, 2017
43
indicates that the benchmark results from BPM CIX, PT which implemented by SS, PT succeeded in creating a new business model that has a better added value. From the above comparison shown that percent of net profit SS, PT, higher than CIX, PT, it indicates that new BPM used was create very high value added and decrease high cost. It was exclude the workshop value that not calculate in this research, the assumption it will get more value from workshop investment that not build by SS, PT. The result of the business process improvement and benchmark BPM adapted on structural organization resources, can be used as initial parameters in the preparation of the concept of custom ERP (Enterprises Resources Planning) in the future development of the organization.
5 Conclusion
BPM can help in doing the structural efficiency of Small and Medium Industry (SMI) organization and process flow based on added value. With BPM and BPI which adapted to the capability and capacity of resources each of the SMI, then a business flow can be improved in order to provide added value, reduce costs and remove waste and create more added value to increase SMI profit. In the SMI scale developing endurance and competitiveness does not mean developing the structure of the Organization, but the efficiency of the organizational structure with streamlined process that does not lean towards value-added business strategy is one of the effective strategies and proven to be helpful in reducing the operational costs of SMI and increase profits. In this research it can be concluded that the durability and the existence of an SMI is not only determined by the magnitude of the turnover and the magnitude of the organizational structure, but the end result of the process of its business and how much weight advantage against turnover. Higher turnover without the cost efficiency and organizational structure improvement will produce lower advantage, but on the contrary if SMI can perform organizational structure efficiency based on added value even though the turnover have lower quantities can generate larger profits seen from the advantages presentations towards turnover. Researchers advice message and in this paper, may this paper can be beneficial especially for the Small and Medium Industries (SMIs) who are struggling and survive in global competition today in 2016 and next 2017-2018, compete and take advantage of opportunities that there has always been and remains a share in building the economy of Indonesia and Asian.
Aknowledgements The authors acknowledge the support and are most grateful of Universitas Mercu Buana, Jakarta, Indonesia, for their efforts and commitments in building and motivating. This research did not receive any spesific grant from funding agencies in the public, commercial, or not-for-profit sectors.
References
Hammer, M., & Champy, J. (2009). Reengineering the Corporation: Manifesto for Business Revolution, A. Zondervan.NY: Harper Collins Publisher
Harrington, H. J. (1995). Continuous versus breakthrough improvement: Finding the right answer. Business Process Re-engineering & Management Journal, 1(3), 31-49
Monk, E., & Wagner, B. (2012). Concepts in enterprise resource planning. Cengage Learning. Sousa-Poza, A., Altinkilinc, M., & Searcy, C. (2009). Implementing a functional ISO 9001 quality management
system in small and medium-sized enterprises. International Journal of Engineering, 3(3), 220-228.). Sumanth David, J. (1990). Productivity Engineering and Management. Delhi India: Tata McGraw-Hill Edition. Van de Vrande, V., De Jong, J. P., Vanhaverbeke, W., & De Rochemont, M. (2009). Open innovation in SMEs:
Trends, motives and management challenges. Technovation, 29(6-7), 423-437. Widiarto, B. (2015). Do the Best and keep on Fighting for the Better Indonesia SME. Forum Senator untuk
Rakyat. RMOL. Co. Yahaya, J. H., Fithri, S., & Deraman, A. (2012). An enhanced workflow reengineering methodology for
SMEs.International Journal of Digital Information and Wireless Communications (IJDIWC), 2(1), 51-65.

O p e r a t i o n s E x c e l l e n c e, Vol. 9, No 1, 2017
44
Yun, J. H. J., & Mohan, A. V. (2012). Exploring open innovation approaches adopted by small and medium firms in emerging/growth industries: case studies from Daegu–Gyeongbuk region of South Korea. International Journal of Technology, Policy and Management, 12(1), 1-19.