Embed Size (px)
Citation preview

4RCR(3)
12 - 033
OC
TOB
ER
2012T
HE
PRE
PAR
ATOR
Y SU
RV
EY
ON
TH
E PR
OJE
CT FO
RIM
PRO
VE
ME
NT O
F AG
RIC
ULT
UR
AL PR
OD
UC
TIO
N A
ND
PRO
DU
CT
IVIT
YIN
DR
Y Z
ON
E A
RE
AS IN
DE
MO
CR
ATIC
SOC
IAL
IST RE
PUB
LIC
OF SR
I LA
NK
AFIN
AL R
EPO
RT
VO
LU
ME
-II ATTA
CH
ME
NT
DEMOCRATIC SOCIALIST REPUBLIC OF SRI LANKA
OCTOBER 2012
JAPAN INTERNATIONAL COOPERATION AGENCY (JICA)
NIPPON KOEI CO., LTD. KRI INTERNATIONAL CORP.
THE PREPARATORY SURVEY ON
THE PROJECT FOR
IMPROVEMENT OF AGRICULTURAL PRODUCTION AND PRODUCTIVITY IN DRY ZONE AREAS
INDEMOCRATIC SOCIALIST REPUBLIC OF SRI LANKA
FINAL REPORT
VOLUME-IIATTACHMENT

The Preparatory Survey on the Project for Improvement of Agricultural Production and Productivity in Dry Zone Areas in Democratic Socialist Republic of Sri Lanka
Final Report
THE PREPARATORY SURVEY ON THE PROJECT FOR IMPROVEMENT OF AGRICULTURAL PRODUCTION AND PRODUCTIVITY IN DRY
ZONE AREAS IN DEMOCRATIC SOCIALIST REPUBLIC OF SRI LANKA
TABLE OF CONTENTS FINAL REPORT
VOLUME II
ATTACHMENTS
(1) ANNEXED FIGURES AND TABLES
(2) COST ESTIMATE
(3) MEETING RECORD

The Preparatory Survey on the Project for Improvement of Agricultural Production and Productivity in Dry Zone Areas in Democratic Socialist Republic of Sri Lanka
Final Report
ANNEXED FIGURES

The Preparatory Survey on the Project for Improvement of Agricultural Production and Productivity in Dry Zone Areas in Democratic Socialist Republic of Sri Lanka
Final Report
List of Figures Figure A 3.1 Administration Boundary ................................................................................... F 3-1 Figure A 3.2 Administrative Structure of Provincial Council ................................................. F 3-2 Figure A 3.3 Overall Management Organization Chart, Northern Provincial Council ( in
the absence of council- an elected body) ........................................................... F 3-3 Figure A 3.4 Organization Structure of Central Department of Agriculture ........................... F 3-4 Figure A 3.5 Organization Structure of Ministry of Agriculture ............................................. F 3-5 Figure A 3.6 Organization Structure of Provincial Department of Agriculture and Animal
Production & Health .......................................................................................... F 3-6 Figure A 3.7 Organization Structure of Ministry of Livestock and Rural Community
Development ...................................................................................................... F 3-7 Figure A 3.8 Agro Ecological Zone ........................................................................................ F 3-8 Figure A 3.9 Soil Map ............................................................................................................. F 3-9 Figure A 3.10 Soil Suitability for OFC and Vegetable Cultivation (DS-wise) ....................... F 3-10 Figure A 3.11 River Basin ...................................................................................................... F 3-11 Figure A 3.12 Distribution of major OFC production in survey area ..................................... F 3-12 Figure A 3.13 Distribution of major vegetable production in survey area. ............................. F 3-13 Figure A 3.14 Distribution of major fruit production in survey area. ..................................... F 3-14 Figure A 3.15 Traditional Vegetable Supply Chains in Sri Lanka .......................................... F 3-15 Figure A 3.16 Procurement and Distribution of Vegetable by Leading Supermarkets in Sri
Lanka ............................................................................................................... F 3-16 Figure A 3.17 Procurement and Distribution of Vegetable by Leading Supermarkets in Sri
Lanka ............................................................................................................... F 3-17 Figure A 3.18 Wholesale Price of OFC at Major Market ....................................................... F 3-18 Figure A 3.19 Organization Structure of Irrigation Department ............................................. F 3-19 Figure A 3.20 Organization of Irrigation Management Division ............................................ F 3-20 Figure A 3.21 Organization Structure of Mahaweli Authority of Sri Lanka ........................... F 3-21 Figure A 3.22 Organization Structure of Provincial Irrigation Department ........................... F 3-22 Figure A 3.23 Organization Structure of Road Development Authority ................................. F 3-23 Figure A 3.24 Organization Structure of Provincial Road Development Department ............ F 3-24 Figure A 3.25 Organization Structure of Ministry of Economic Development ........................ F 3-25 Figure A 3.26 Organization Structure of Ministry of Local Government & Provincial
Council ........................................................................................................... F 3-26 Figure A 3.27 Structure of Government Agencies and Officials related to FOs and CBO ..... F 3-27 Figure A 4.1 Location Map of Cultivation Zone in Potential Area ......................................... F 4-1 Figure A 4.2 Problem Tree Malwanegama (North-Central) ................................................... F 4-2 Figure A 4.3 Objective Tree Malwanegama (North-Central) ................................................. F 4-3 Figure A 4.4 Problem Tree Thiriyay (Eastern) ........................................................................ F 4-4 Figure A 4.5 Objective Tree Thiriyay (Eastern) ...................................................................... F 4-5 Figure A 4.6 Problem Tree Saliyawewa (North-Western) ...................................................... F 4-6 Figure A 4.7 Objective Tree Saliyawewa (North-Western) .................................................... F 4-7 Figure A 4.8 Problem Tree Thenagallanda (Uva) ................................................................... F 4-8 Figure A 4.9 Objective Tree Thenagallanda (Uva) ................................................................. F 4-9 Figure A 4.10 Problem Tree Periyapandivirichchan (Northern) ............................................. F 4-10 Figure A 4.11 Objective Tree Periyapandivirichchan (Northern) ........................................... F 4-11 Figure A 4.12 Project Concept Summary ............................................................................... F 4-12 Figure A 5.1 Implementing organization ................................................................................ F 5-1 Figure A 5.2 Assignment Schedule of Consultants ................................................................. F 5-2

The Preparatory Survey on the Project for Improvement of Agricultural Production and Productivity in Dry Zone Areas in Democratic Socialist Republic of Sri Lanka
Final Report
F 3-1
Figure A 3.1 Administration Boundary

The Preparatory Survey on the Project for Improvement of Agricultural Production and Productivity in Dry Zone Areas in Democratic Socialist Republic of Sri Lanka
Final Report
F 3-2
Figure A 3.2 Administrative Structure of Provincial Council
GOVERNOR
CHIEF SECRETARY
CHIEF MINISTER
PROVINCIAL COUNCIL
PPSC
BOARD OF MINISTERS
GOVT. AGENTS/ DISTRICT COMMISSIONERS
DISTRICT SECRETARIES
SECTOR SECRETARIES
GRAMA NILADHARIES
A.G.AA / DIVISIONAL COMMISSIONERS
DIVISIONAL SECRETARIES
CO-OP EMP COM
PROVINCIAL HEADS OF DEPARTMENTS
DISTRICT HEADS OF DEPARTMENTS
LOCAL AUTHORITIES (U.C/M.C
/PRADESHIYA SABHA)
GRAMODAYA MANDALAYA
VILLAGE LEVEL ORGANIZATION

The Preparatory Survey on the P
roject for Improvem
ent of Agricultural P
roduction and Productivity
in Dry Zone A
reas in Dem
ocratic Socialist Republic of Sri Lanka
Final R
eport
F 3-3
Figure A
3.3 O
verall Managem
ent Organization C
hart, Northern Provincial C
ouncil ( in the absence of council- an elected body)

The Preparatory Survey on the P
roject for Improvem
ent of Agricultural P
roduction and Productivity
in Dry Zone A
reas in Dem
ocratic Socialist Republic of Sri Lanka
Final R
eport
F 3-4
Source: Central D
epartment of A
griculture
Figure A 3.4
Organization Structure of C
entral Departm
ent of Agriculture
HORDI : Horticultural Research and Development InstituteRRDI : Rice Research and Development InstituteFCRDI : Field Crops Research and Development InstituteE & T : Extension and Training DivisionSPSPP : Seed Certification and Plant ProtectionSEPC : Socio-Economic Planning CenterSPM : Seed and Planting Material Division
DirectorE & T
DirectorSPM
DirectorSCSPP
DirectorSEPC
DirectorAdmin. & Fin.
Deputy Directors
Inservice Training Ins.Farm Mechanization Training Ins.District Training CentersAg.Enterprice Dev.CenterBee Keeping Dev. CenterExhibition UnitHead Quarter
Deputy Directors Interprovincial
AmparaAnuradhapuraPolonnaruw aHambantotaMoneragalaKandy
Deputy Directors Exams
SchoolsKundasalePalw eharaAngunukolaAnuradhapuraLabuduw aKarapinchaVavuniyaWariyapolaBibile
Deputy Directors
Broadcasting, TVAudio Visual CenterInformation Center
Press
SMOs
DIRECTOR GENERAL
Director HORDI
DirectorRRDI
DirectorFCRDI
Segment Agri.Off icers Lecturers
AI
Se. Deputy DirectorExtension
Se. Deputy DirectorEducation
Se. Deputy Director
Communication

The Preparatory Survey on the P
roject for Improvem
ent of Agricultural P
roduction and Productivity
in Dry Zone A
reas in Dem
ocratic Socialist Republic of Sri Lanka
Final R
eport
F 3-5
Figure A 3.5
Organization Structure of M
inistry of Agriculture
Secretary
Ministry of Agriculture
Additional Secretary Administration
Additional Secretary Agri. Development
Additional Secretary
Agri. Technology
Internal
Auditor
Director
Agri. Technology
Project
Director
Ad /
DD
Ad /
DD
Executive
Coordinator Statistic
SO SO
Ad /
DD
Ad /
DD
Director Organic Fertilizer
Ad /
DD
Ad /
DD
Accountant
(Payment)
S.A.S
Admin.
S.A.S.
Establishment
AS AS AS AS
Accountant
(Procurement)
Chief
Accountant
Executive Coordinator
NRM
Director
Northern Development
Director
Planning
Director Development
Ad /
DD
Ad /
DD
Ad /
DD
Ad /
DD
Ad /
DD
Ad /
DD
S.A.S – Senior Assistant Secretary
SO ‐ Statistical Off icer
AD ‐ Assistant Director
DD ‐ Deputy Director
AS ‐ Assistant Secretary
NRM – Natural Resource Management

The Preparatory Survey on the P
roject for Improvem
ent of Agricultural P
roduction and Productivity
in Dry Zone A
reas in Dem
ocratic Socialist Republic of Sri Lanka
Final R
eport
F 3-6
Source: Provincial D
epartment of A
griculture, Anim
al Production and H
ealth, North C
entral Province
Figure A 3.6
Organization Structure of Provincial D
epartment of A
griculture and Anim
al Production &
Health
Livestock OfficerTraining & Extension
Provincial Ministry ofAgriculture and Animal Production
Provincial Director ofAgriculture
Provincial Director ofAnimal Production &
Health
Deputy ProvincialDirector
Deputy ProvincialDirector
Assistant Director of Agriculture
Deputy/AssistantDirector : District
District VetSurgeon
Subject Matter Officers
Divisional Vet Surgeon
Subject MatterSpecialists VS
Dairy Development GoatDevelopment Poultry / Pig
Development Artificial
Assistant Director of Segment
Head Office LDI
SubjectMatter Officers
AI LDI

The Preparatory Survey on the P
roject for Improvem
ent of Agricultural P
roduction and Productivity
in Dry Zone A
reas in Dem
ocratic Socialist Republic of Sri Lanka
Final R
eport
F 3-7
Figure A
3.7 O
rganization Structure
of M
inistry of
Livestock
and R
ural C
omm
unity D
evelopment
Secretary
Additional Secretary
(Development) (SLAS)
Senior Assistant
Secretary -02
(SLAS)
Chief Accountant
(SLAccS)
Assistant
Secretary -02
(SLAS)
Accountants 02
(SLAccS)
Director
(Development)
(SLAS)
Director
(Development)
(SLPS)
Engineer
(SLES)
Deputy Director/
Assistant Director 02
(SLAS)
Additional Secretary
(Admin & Finance) (SLAS)
Additional Secretary
(Livestock) (SLAPHS)
Administrative Officer
Subordinate Staff Subordinate Staff
Director (Livestock) - 03
(SLAPHS)
Deputy Director/
Assistant Director - 04
(SLAPHS)
Subordinate StaffSubordinate
Staff
Subordinate
Staff
Deputy Director/
Assistant Director 02
(SLPS)
Subordinate
Staff
Internal Audit
II - II/II - I
(SLAccS)
Subordinate
Staff

The Preparatory Survey on the Project for Improvement of Agricultural Production and Productivity in Dry Zone Areas in Democratic Socialist Republic of Sri Lanka
Final Report
F 3-8
Figure A 3.8 Agro Ecological Zone

The Preparatory Survey on the Project for Improvement of Agricultural Production and Productivity in Dry Zone Areas in Democratic Socialist Republic of Sri Lanka
Final Report
F 3-9
Figure A 3.9 Soil Map

The Preparatory Survey on the Project for Improvement of Agricultural Production and Productivity in Dry Zone Areas in Democratic Socialist Republic of Sri Lanka
Final Report
F 3-10
Figure A 3.10 Soil Suitability for OFC and Vegetable Cultivation (DS-wise)
Suitable Area Ratio
More than 80% 80% - 60%
60% - 40%
40% - 20%
Less than 20%

The Preparatory Survey on the Project for Improvement of Agricultural Production and Productivity in Dry Zone Areas in Democratic Socialist Republic of Sri Lanka
Final Report
F 3-11
Figure A 3.11 River Basin
18 Walawe Ganga 37 Karanda Oya 52 Mundeni Aru 67 Yan Oya 82 Kalwalappu Aru 97 Kalagamuna Oya20 Malala Oya 38 Semana Aru 53 Miyangolla Ela 68 Mee Oya 83 Akkarayan Aru 98 Rathambala Oya22 Kirindi Oya 39 Tandiadi Aru 54 Maduru Oya 69 Ma Oya 84 Mandakal Aru 99 Deduru Oya23 Bambawe Ara 40 Kangikadichi Aru 55 Puliyanpota Aru 70 Churiyan Aru 85 Pallavarayan Kaddu 100 Karambalan Oya24 Mahasilawa Oya 41 Rufus Kulam Aru 56 Kirimechchi Odai 71 Chavar Aru 86 Pali Aru 101 Ratmal Oya26 Menik Ganga 42 Pannel Oya 57 Bodigolla Aru 72 Palladi Aru 87 Chappi Aru 102 Maha Oya27 Katupila Ara 43 Ambalam Oya 58 Mandan Aru 73 Manal Aru 88 Parangi Aru28 Kurundu Ara 44 Gal Oya 59 Makarachchi Aru 74 Kodalikallu Aru 89 Nay Aru29 Nabadagas Ara 45 Andella Oya 60 Mahaweli Ganga 75 Per Aru 90 Aruvi Aru31 Kumbukkan Oya 46 Tumpan Keni 61 Kantale basin 76 Pali Aru 91 Kal Aru32 Bagura Oya 47 Namakada Aru 62 Palampotta Ara 77 Maruthapillay Aru 92 Moderagam Aru33 Girikula Ara 48 Mandipattu Aru 63 Panna Oya 78 Theravil Aru 93 Kala Oya34 Helawe Ara 49 Pathantoppu Aru 64 Pankulam Aru 79 Piramenthal Aru 94 Moongil Ara35 Wila Oya 50 Vett Aru 65 Kunchikumban Aru 80 Metheli Aru 95 Mi Oya36 Heda Oya 51 Unnichchai 66 Palakutta Aru 81 Kanakarayan Aru 96 Madurankuli Aru

The Preparatory Survey on the Project for Improvement of Agricultural Production and Productivity in Dry Zone Areas in Democratic Socialist Republic of Sri Lanka
Final Report
F 3-12
Chillies (green) Red onion
Maize Green gram Source: Agricultural Profile 2006 HARTI
Figure A 3.12 Distribution of major OFC production in survey area

The Preparatory Survey on the Project for Improvement of Agricultural Production and Productivity in Dry Zone Areas in Democratic Socialist Republic of Sri Lanka
Final Report
F 3-13
(Source: Agricultural Profile 2006 HARTI
Figure A 3.13 Distribution of major vegetable production in survey area.
Bitter gourd Capsicum
Tomato Brinjal

The Preparatory Survey on the Project for Improvement of Agricultural Production and Productivity in Dry Zone Areas in Democratic Socialist Republic of Sri Lanka
Final Report
F 3-14
Mango Pineapple
Banana Papaw Source: Agricultural Profile 2006 HARTI
Figure A 3.14 Distribution of major fruit production in survey area.

The Preparatory Survey on the Project for Improvement of Agricultural Production and Productivity in Dry Zone Areas in Democratic Socialist Republic of Sri Lanka
Final Report
F 3-15
Source: “Marketing of Vegetables through Supermarkets: Implication of Procurement Practices for Farmers” Ruvini Vidanapathirana et al,
HARTI, 2011
Figure A 3.15 Traditional Vegetable Supply Chains in Sri Lanka

The Preparatory Survey on the Project for Improvement of Agricultural Production and Productivity in Dry Zone Areas in Democratic Socialist Republic of Sri Lanka
Final Report
F 3-16
Source: “Marketing of Vegetables through Supermarkets: Implication of Procurement Practices for Farmers” Ruvini Vidanapathirana et al,
HARTI, 2011
Figure A 3.16 Procurement and Distribution of Vegetable by Leading Supermarkets in Sri Lanka

The Preparatory Survey on the Project for Improvement of Agricultural Production and Productivity in Dry Zone Areas in Democratic Socialist Republic of Sri Lanka
Final Report
F 3-17
Source: “Marketing of Vegetables through Supermarkets: Implication of Procurement Practices for Farmers” Ruvini Vidanapathirana et al,
HARTI, 2011 Figure A 3.17 Procurement and Distribution of Vegetable by Leading Supermarkets in Sri
Lanka

The Preparatory Survey on the Project for Improvement of Agricultural Production and Productivity in Dry Zone Areas in Democratic Socialist Republic of Sri Lanka
Final Report
F 3-18
Figure A 3.18 Wholesale Price of OFC at Major Market
0
50
100
150
200
250
JAN. FEB. MAR. APR. MAY JUNE JULY AUG. SEP. OCT. NOV. DEC.
Price (Rs./kg)
0
50
100
150
200
250
JAN. FEB. MAR. APR. MAY JUNE JULY AUG. SEP. OCT. NOV. DEC.
Price (Rs./kg)
Month2009 SRI LANKA 2009 COLOMBO 2009 DAMBULLA 2009 Avg Target District
2010 SRI LANKA 2010 COLOMBO 2010 DAMBULLA 2010 Avg Target District
Green Gram
Green Bean

The Preparatory Survey on the P
roject for Improvem
ent of Agricultural P
roduction and Productivity
in Dry Zone A
reas in Dem
ocratic Socialist Republic of Sri Lanka
Final R
eport
F 3-19
Figure A 3.19
Organization Structure of Irrigation D
epartment
National Level Regional LevelSS & T - Special Service & Training AM - Assets Management I & WM - Irrigation & Water Management HR - Human Resources P & D - Planning & Design M & W - Machinery & Workshop RD & C - Regional Development & Construction C & P - Contracts & ProcurementP & I - Planning & Implementation ITI - Irrigation Training InstituteF - Finance IMAC - Irrigation Management Cell
Ministry of I rrigation and Water Resources Management
Irrigation Department
Director General of I rrigation
Director(SS & T)
Director(I & WM)
Director (P & D)
Director(RD & C)
Director(P & I)
Director(F)
Divisional IrrigationEngineers
Director(AM)
Director(HR)
Snr. Dep.Director(SS & T)
Snr. Dep.Director
(AM)
Snr. Dep.Director(M & W)
Director ITI Functional Deputy Director in Head Quarter - Branches
IMAC
Technical Staff Technical Staff TechnicalStaff
Dep. Director(C&P)
Chief InternalAuditor
Regional Director
Chief Irrigation Engineers Chief IrrigationEngineer
Irrigation Engineers

The Preparatory Survey on the P
roject for Improvem
ent of Agricultural P
roduction and Productivity
in Dry Zone A
reas in Dem
ocratic Socialist Republic of Sri Lanka
Final R
eport
F 3-20
Figure A 3.20
Organization of Irrigation M
anagement D
ivision
National Level
Field Level
Additional Director(Agronomy)
Monitoring OfficersDy. Director (Planning &Progress Control)
Director, IMD
Chief ManagementAssistant
Institutional DevelopmentManagement AssistantsManagement Assistants
Development Assistants
Ministry of I rrigation and Water Resources Management
Irrigation Management Division
Resident ProjectManagers
Institutional DevelopmentOfficers
Development Assistants
The Preparatory Survey on the P
roject for Improvem
ent of Agricultural P
roduction and Productivity
in Dry Zone A
reas in Dem
ocratic Socialist Republic of Sri Lanka
Final R
eport
F 3-21
Figure A
3.21 O
rganization Structure of Mahaw
eli Authority of Sri L
anka
National Level
Project Level
HAO&M - Head Works Administration, Operation & Maintenance MUP - Mahaweli Upgrading Project EAA - Engineering AssistantsHRID - Human Resources & Institutional Development SFD - Saudi Fund TOO - Technical Officers
Ministry of I rrigation and Water Resources Management
Mahaweli Authority of Sri LankaBoard of Directors
Director General
Executive Director(Engineering & Technical Services)
Executive Director(Development)
Executive Director (Admin & Finance)
DirectorsProject Planning & DesignProject ImplementationHAO&M & Dam SafetyRiver Basin Planning & ManagementEnvironmentLand Use PlanningProject Directors (MUP/M h k d /SFD)
DirectorsAgricultureLivestockLandsEnterprise DevelopmentHR & IDMahaweli Centre
DirectorsPersonnel & AdministrationFinance
DirectorsPlanning &MonitoringWater Management SecretariatSecretariat/Board Secretary
Chief Internal Auditor
Resident Project Manager
DRPM(Land)
DRPM(Agriculture)
DRPM(Development)
DRPM(Technical Services)
Accountant,Administrative Officer
Land Officers Agriculture Officers HR & ID Officer , SportsOfficer, Enterprise Dev. Officer
Engineers, EAA, TOO
Admin Assist.
Field Assistant Supporting Staff
Block Manager
Land Officer Agriculture Officer HR & ID Officer Irrigation Engineer
Unit Manager
The Preparatory Survey on the P
roject for Improvem
ent of Agricultural P
roduction and Productivity
in Dry Zone A
reas in Dem
ocratic Socialist Republic of Sri Lanka
Final R
eport
F 3-22
Figure A 3.22
Organization Structure of Provincial Irrigation D
epartment
Provincial Level Range Level
Admin. Officer
Accountant Admin. Officer
Provincial Director of I rrigation
Snr. Dy. Director(Technical)
Snr. Dy. Director(Design)
Dy. Director (Range Office)
Chief Engineer Chief Engineer Chief Engineer
Supporting Staff Supporting Staff Supporting Staff
Div. IrrigationEngineers
Irrigation Engineer Accountant
Supporting Staff Supporting Staff Supporting Staff
Div. Assistants
Technical & Admin. Staff Technical & Admin.Staff
Technical & Admin.Staff
Technical & Admin.Staff
Supporting Staff Supporting Staff

The Preparatory Survey on the P
roject for Improvem
ent of Agricultural P
roduction and Productivity
in Dry Zone A
reas in Dem
ocratic Socialist Republic of Sri Lanka
Final R
eport
F 3-23
National Level Provincial Level
Ministry of Highways
Road Development Authority
Chairman & Board of Directors
Director General
Additional DirectorGeneral (Finance &
Additional Director General(Assets Operation & Maintenance)
Additional Director General(Assets Development)
Additional DirectorGeneral (Network
Additional DirectorGeneral (Projects)
Directors Administration Finance
DirectorsEngineering ServicesMaintenance Mgt & Construction Works
DirectorsLand Acquisition &ResettlementMechanicalProcurement
DirectorsPlanningHighway DesignResearch & DevelopmentTraining
DirectorForeign FundedProjects
DirectorInternal Audit
DirectorLegal
Deputy DirectorsAdministration - 02 Nos.Finance- 02 Nos.
Deputy DirectorsEngineering ServicesMaintenance Mgt & ConstructionWorks - 02 Nos.
Deputy DirectorsLand Acquisition &Resettlement - 02 Nos.MechanicalProperty Mgt & Revenue
Deputy DirectorsPlanning - 04 Nos.Highway DesignResearch & Development
DeputyDirector
Provincial Director
ChiefEngineers
Engineer Executive Engineer(Districts)
Engineer
Admin.Officer Accountant
Mgt. Staff Tech. Staff Tech. & Mgt Staff Tech. Staff Admin. Staff Accounts Staff
Supporting Staff Supporting Supporting Staff Supporting Staff Supporting Staff Supporting Staff
Figure A 3.23
Organization Structure of R
oad Developm
ent Authority

The Preparatory Survey on the P
roject for Improvem
ent of Agricultural P
roduction and Productivity
in Dry Zone A
reas in Dem
ocratic Socialist Republic of Sri Lanka
Final R
eport
F 3-24
Figure A 3.24
Organization Structure of Provincial R
oad Developm
ent Departm
ent
Provincial Level District Level
Provincial Director
Chief Engineer Accountant Admin. Officer Chief Engineers (District Offices)
Divisional Engineers
Technical Staff Admin. Staff Technical Staff Admin. & Planning Staff
Supporting Staff Supporting Staff Supporting Staff Supporting Staff Supporting Staff

The Preparatory Survey on the P
roject for Improvem
ent of Agricultural P
roduction and Productivity
in Dry Zone A
reas in Dem
ocratic Socialist Republic of Sri Lanka
Final R
eport
F 3-25
Figure A
3.25 Organization Structure of M
inistry of Econom
ic Developm
ent
Regional Deve lopment Rural Deve lopment
Director Genaral( World Food)
Director Genaral Director Genaral
Secretary Ministry of Economic Development
Add. Secretary( Administration )
Add. Secretary( Rural Economy)
Janasaba
Inst i tu t ion Under the Min istry
Director Genaral ( Comunication &
Development)
Director Genaral( Janasaba)
Director Genaral( Invesment &
Turisum )
Invest in Sr i Lanka
Board of Invesment of SriLanka
Surthern Development Authority
Director Genaral(Doner Coordination )
Director Genaral(Chief Accoountant )
Udarata Development Authority
Department of upcuntry PeasantryRehabilitation
Sri Lanak Institute of Tourism & Hotel Management
Gamanaguma
Department of Commissioner General ofSmurdi
Tour ism
Sri Lanka Convention Bureau
Sri Lanka Tourism Development Authority
Sri Lanka tuarisum Promotion Bureau
Empower ing People

The Preparatory Survey on the P
roject for Improvem
ent of Agricultural P
roduction and Productivity
in Dry Zone A
reas in Dem
ocratic Socialist Republic of Sri Lanka
Final R
eport
F 3-26
Figure A
3.26 Organization Structure of M
inistry of Local G
overnment &
Provincial Council
LG - Local GovernmentPC - Provincial CouncilICT - Information & Communication Technology NSWMSC - National Solid Waste Management Support Center
NSWMSC
Director( NSWMSC)
Asst. Director( NSWMSC)
SecretaryMinistry of Local Government &
Provincial Council
Legal Division
Legal Officer
ICT Division
ICT Officer
ICT Assistant
InternalAudit
Division
Internal Auditor
Monitoring Division
ChiefAccountant - 2
Accountant
Development & PlanningDivision
Finance Division
Chief Accountant - 1
Accountant( Accounts &
Payment)
Accountant ( Supplies &
AdvanceAccounts)
AdministrativeOfficer
Asst. DirectorPlanning
DirectorEngineering
Add. Secretary - Development
Administration Division
Add. Secretary -Admin. &Finance
Senior Asst.Secretary -
Admin.
DirectorPlanning
Provincial CouncilTraining Division
Local GovernmentDivision
Add. Secretary –LG & PC
Senior Asst.Secretary - PC
& Training
Asst. Secretary- PC & Training
Add. Secretary –LG & PC
Senior Asst.Secretary - LG
Asst. Secretary- LG

The Preparatory Survey on the P
roject for Improvem
ent of Agricultural P
roduction and Productivity
in Dry Zone A
reas in Dem
ocratic Socialist Republic of Sri Lanka
Final R
eport
F 3-27
Figure A 3.27
Structure of Governm
ent Agencies and O
fficials related to FOs and C
BO
Province
Central Ministry of Agrarian Services and Wildlife
Ministry of Irrigation and Water
Management
Irrigation Department (ID)
Irrigation Management Division (IMD)
DistrictGovernment Agent (GA)/District Secretary
Division
Assistant Commissioner
Agrarian Development (ACAD)
Agrarian Service Center (ASC)
Agrarian Development Officer (ADO)
Agriculture Research and Productivity Assistant(ARPA)
Irrigation Engineer (IE)
Regional Director of
Irrigation (RDI)
Chief Irrigation Engineer (CIE)
Provincial Ministry of Agriculture
Provincial Director of Agriculture
Deputy Director of Agriculture
(DDA)
Agriculture Instructor(AI)
Resident Project Manager (RPM)
Institutional Development Officer (IDO)
Grama Niladhari (GN)
Divisional Secretary (DS)
Land Officer (LO)
ColonizationOfficer (CO)
Village
Farmers Producers Society (FPS)
Young Farmers Club(YFC)
Women Farmers Society(WFS)
Rural Development Society( RDS)
Women Rural Development Society( WRDS)
Provincial Director of Rural Development
Rural Development Officer (RDO)
Provincial Council
Chief Minister's Secretariat
Samurdhi task force
Death Donation Society
Sports Clubs
Rural Cooperative society
Provincial Commissioner of Cooperative Development
Ministry of Health
Cooperative Development Officer (CDO)
Farmers Organization (FO)
CBOs
Other CBOs
Assistant Commissioner of Cooperative Development
(ACCD)
Provincial Council*
Central Government
*Case of Eastern Province
SamurthiDevelopment Officer (SDO)
EngineerAssistant (EA)
Development Assistant (DA)
SamurthiManager

The Preparatory Survey on the P
roject for Improvem
ent of Agricultural P
roduction and Productivity
in Dry Zone A
reas in Dem
ocratic Socialist Republic of Sri Lanka
Final R
eport
F 4-1
Figure A 4.1
Location M
ap of Cultivation Zone in Potential A
rea
opriate
Cultivation Zone 1Covering Mullativu, Mannar, Vauniya and
Trincomalee
Chilli & Red OnionPromotion Zone
PulsesPromotion Zone
Milk Promotion
Cultivation Zone 2Covering Anuradhapura, Batticaloa and
Western Part of Ampara
Papaya & MangoPromotion Zone (Export-oriented)
Orange & Passion FruitsPromotion Zone
Cultivation Zone 4Covering Surrounding area of
Baddula area and dry and intermediate zone of Moneragala
Cultivation Zone 3Covering Northern part of Kurunegala and
Puttalam

The Preparatory Survey on the P
roject for Improvem
ent of Agricultural P
roduction and Productivity
in Dry Zone A
reas in Dem
ocratic Socialist Republic of Sri Lanka
Final R
eport
F 4-2
Figure A 4.2
Problem T
ree Malw
anegama (N
orth-Central)
Negative attitudes of
farmers
Lack of knowledge on crops
Lack of new
knowledge and skills on farming
Lack of knowledge to select
most suitable
variety to match with
the soil condition
Lack of Extension
services
Inadequate government training
and extension services
Low profit due to high
cost of agro
chemicals
Lack of (advice)
extension services on
decease control
High cost of seeds
and breeding materials
Lack of locally
produced highbred
seeds
High cost of labour
Lack of appropriate
farm mechanizat
ion
Lack of holistic
production plan
Absence of proper
organizations and plans
Lack of appropriate ‘buyback system’ for all OFCs
Lack of coordination between policymakers and the
Farmer Organizati
ons
Lack of adequate
milk collecting
centers
Lack of milk
production
Absence of guaranteed minimum
price
Inadequate techniques on efficient and low water use
Lack of water at the
needy times
Lack of savings (to invest) due
to low profit
Credit facilities are not
available for some
OFCs
Lack of proper
ways of cash
handling (family
budgeting)
Lack of breeding
facilities to upgrade the local animals
High cost of
production
Lack of marketing facilities
Problems in proper water in
irrigation management system
Lack of capital
High cost of drip
irrigation systems
Lack of credit
facilities (from
Banks) as there is no guaranteed price for
OFCs
High cost of quality breeding
stocks
Lack of quality cattle
breeding stock
Lack of pasture lands
Production and Productivity of Other Field Crops (OFCs), Vegetable, Fruit and Dairy is low
Country compelled to import OFC from foreign
countries
The wealth of the
country drained
Country lose native food
The prices become very high as there is shortage of OFCs
Increase of unemployme
nt
People are sick due to
lack of healthy food
Access to quality food
decreases
The economic
problems are aggravated
due to decrease of
extra income
People become
malnourish
The economy of the country
weaken
Core Problem
Effects
CausesLack of
productive animals
Problem Analysis Tree‐Malwanegama (North‐Central)

The Preparatory Survey on the P
roject for Improvem
ent of Agricultural P
roduction and Productivity
in Dry Zone A
reas in Dem
ocratic Socialist Republic of Sri Lanka
Final R
eport
F 4-3
Figure A 4.3
Objective T
ree Malw
anegama (N
orth-Central)
Attitude of farmers is
turned into positive
Knowledge and skills on OFC is improved
Skills on farming are Improved
Farmers are able to select the
most suitable
varieties to match with
the soil condition
Frequent extension services is provided
Proper training
and extension services is provided
by the GoSL
Prices of agrochemic
als are reduced
Proper extension services is provided
on disease control
Cost of seeds and planting materials
are reduced
Highbred seeds is
produced locally
Labour is used
efficiently
Farm mechanizat
ion is improved
Holistic production
plan is prepared
Proper organizatio
ns and plans are prepared
Appropriate ‘buyback system’ for all OFCs is established
Proper coordination between policymakers and the
FO is established
Adequate milk
collecting centers are established
Milk production
is increased
Minimum price is
guaranteed for all OFC
Farmers has
efficient water use
techniques
Water is provided
when needed
Savings are increased
due to high profits
margins
Credit scheme is available
for all OFCs
Proper ways of
cash handling (family
budgeting) are set up
Breeding facilities to upgrade the local animals
available
Pasture lands are
developed
Costs of production are reduced.
Proper marketing system is organized
Efficient and
effective water
irrigation management system is set up
Capital for the
investments is assured
Subsidized drip
irrigation systems is established
Guaranteed prices are ensured
Productive animals is available
Quality breeding stocks are available
Pasture lands are available
Production and Productivity of Other Field Crops (OFCs), Vegetable, Fruit and Dairy is High
Volume of imported
food decreases
Volume of wealth
drain to the other
countries decreases
Native food are plentiful
Prices become low as
OFCs are plentiful
Employment
opportunities is
increased
People are healthy as fresh food
are available
Access to quality food is
increased
Economic situation increased to some extent
The nutrition
level of the people increase
The economy
of the country is strengthen
Core Objective
Ends
Means
Objective Analysis Tree‐Malwanegama (North‐Central)

The Preparatory Survey on the P
roject for Improvem
ent of Agricultural P
roduction and Productivity
in Dry Zone A
reas in Dem
ocratic Socialist Republic of Sri Lanka
Final R
eport
F 4-4
Figure A 4.4
Problem T
ree Thiriyay (E
astern)
Insufficient Agro wells
Lack of (irrigation)
water
Poor quality of
water (salinity)
Lack of systems
/knowledge to deal
with poor quality water
Water quality affected
after tsunami
Unavailability of irrigation
systems (dam or reservoir)/
Proper maintains of
irrigation systems
Cultivations are
affected due to floods
Cultivations are
affected due to
draught
Lack of institutions to provide training on
crop, livestock
management
Lack of institutions to provide livestock and grass
lands
Less contacts
with outside traders
Insufficient market
buildings/ places
The lands are not
maintaining due to
displacement of the people
Not maintainin
g the existing
lands
Inadequate Income
Lack of quality
livestock and pasture
lands
Production and Productivity of Other Field Crops (OFCs), Vegetable, Fruit and Dairy is low
Core Problem
Effects
Causes
Problems from wild elephants
Absence of an electric
fence
Lack of marketing opportuniti
es
Insufficient lands
Lack of new
technologies
Outside traders do not about
the products of
the villagers
Lack of income/ losses
Low income
Grassroots people are
affected and cannot be developed
Unemployment
Less nutritious
food
Children are weak
Increasing poverty
Psychological
Problems
Lack of financial support
Inferior complex
Making Wrong
decisions
Increase of DebtsSuicidesDiseases
(sickness)
Engage in illegal
activities
Problem Analysis Tree‐ Thiriyay (Eastern)

The Preparatory Survey on the P
roject for Improvem
ent of Agricultural P
roduction and Productivity
in Dry Zone A
reas in Dem
ocratic Socialist Republic of Sri Lanka
Final R
eport
F 4-5
Figure A 4.5
Objective T
ree Thiriyay (E
astern)
Sufficient agro wells
are established
Sufficient irrigation water is
provided
Good quality of water (no
salinity) is provided
Knowledge to deal
with poor quality water is
available
Affected water
quality after
tsunami is recovered
Irrigation systems (dam or reservoir)/
and its proper maintains systems is available
Cultivations are not affected due to floods
Cultivations are not affected due to
draught
Linkage with
institutions which
provides training on
crop, livestock
management is
established
Good institutions supports
for livestock and grass lands is
provided
More linkage
with outside
traders is established
Sufficient market
buildings/ places is
established
The lands are well
maintained by the
resettled people
Existing lands is properly
maintained
Adequate income is assured
Quality livestock
and pasture lands is
available
Production and Productivity of Other Field Crops (OFCs), Vegetable, Fruit and Dairy is High
Core Objective
Ends
Means
Problems from
elephants are solved
Electric fence is set
up
Market opportunities assured
Land is sufficient
Access to new
technologies is assured
Outside traders do
know about the products of
the villagers
More income is available
High income can be earned
Grassroots people are
not affected and can be developed
Employment
opportunities increase
More nutritious
food is available
Children are strong
Poverty is decreased
Less psychologi
cal problems happen
More financial
support is provided
People feel no inferior complex
Correct decisions
can be made
Decrease of debts
No suicides
Diseases is lessen
No engagement in illegal activities
Objective Analysis Tree‐ Thiriyay (Eastern)

The Preparatory Survey on the P
roject for Improvem
ent of Agricultural P
roduction and Productivity
in Dry Zone A
reas in Dem
ocratic Socialist Republic of Sri Lanka
Final R
eport
F 4-6
Figure A 4.6
Problem T
ree Saliyawew
a (North-W
estern)
Lack of irrigation facilities
Lack of water and water
management systems for crop and livestock
husbandry
Lack of knowledge and
skills in effective and
efficient water management
(FO & Farmers)
Absence of permanent
water source (to feed
irrigation system)
lack of commitments to upgrade and maintain the
existing irrigation
systems by the duty bearers.
Lack of participation of
farmers and farmers'
organizations in water
management
Weak collective bargaining
power as there is no
community effect and
organizations
Lack of initiatives and
facilities to add value
(storage, by-products, transport,
preservation etc)
Absence of guaranteed
minimum price.
Lack of influence on policymakers to stop imports and promote
local production
Inadequate state policies to promote local seeds
Lack of production of quality seeds
locally
Lack of quality seeds
Lack of quality dairy cattle
High expenses on imported
(external) inputs (seeds
& agrochemicals)
Lack of technical
knowledge on low input
(sustainable) agriculture
Lack of appropriate measures to
deal with climatic
conditions.
Lack of pasture for dairy cattle
Lack of lands for Chena cultivation
Increase wild elephant attack
to the cultivations and villages
Low price and lack of market
facilities
Lack of quality inputs
High cost of production
Deviation from traditional
(sustainable) Chena farming
system
Susceptibility of to pest and
diseases is high
Increase of stray cattle
attack to the OFC
cultivations.
Lack of feed for the wild
elephants (as there are no
left overs from Chena
cultivation )
Production and Productivity of Other Field Crops (OFCs), Vegetable, Fruit and Dairy is low
Abounded (OFC)
cultivable lands
Lack of quality food High poverty
High importation of OFC and
milk products
Core Problem
Effects
Causes
Acquisition of traditional
Chena lands by the State
(for the forest and wildlife departments
Economic crisis
Barren lands Malnutrition More family disputes
Drain off foreign
currency
Inflation occurs
More diseases
High dependence on foreign
food
Addiction to imported seeds
Problem Analysis Tree‐ Saliyawewa(North‐Western)

The Preparatory Survey on the P
roject for Improvem
ent of Agricultural P
roduction and Productivity
in Dry Zone A
reas in Dem
ocratic Socialist Republic of Sri Lanka
Final R
eport
F 4-7
Figure A 4.7
Objective T
ree Saliyawew
a (North-W
estern)
Efficient and effective irrigation
facilities are established
Adequate water and
proper water management systems are available
Effective and efficient water management
by the FO and farmers as
knowledge and skills are improved
Access to permanent
water source (to feed
irrigation system) is ensured
Duty bearers commit to
upgrade and maintain the
irrigation systems
More FO and farmer
participate in water
management
Collective bargaining power is
strengthen through the community
organization
Strong initiatives and
facilities to add value is
available(storage, by-
products, transport,
preservation etc)
Minimum price is
guaranteed
Policymakers stop
importation and promote
local production
There is adequate / appropriate
state policies to promote local seeds
More quality seeds are produced
locally
Quality local seeds is
available
Quality dairy cattle is
available
Local inputs (seeds &
agrochemicals) are used more
with low expenses
Proper technical
knowledge on low input
(sustainable) agriculture is
gained
Appropriate measures to
deal with climatic
conditions is available
More fodder/ pasture for
dairy cattle is available
More lands for Chena
cultivation is available
Wild elephant attack to the cultivations
and villages is decreased
High prices of product is assured, market is organized
Quality inputs are available
Production cost is low
Traditional (sustainable)
Chena farming system is adapted
Susceptibility of to pest and diseases is low
Stray cattle attack to the
cultivations is decreased
More feeds is available for
the wild elephants (as
there crop residuals of
Chena cultivations)
Production and Productivity of Other Field Crops (OFCs), Vegetable, Fruit and Dairy is High
More (OFC) cultivable lands is available
More quality food is available
Poverty is lessen
Importation of OFC and
milk products is decreased
Core Objective
Ends
Means
Rights to access the traditional
Chena lands is assured by the
state
Economic becomes
stable
Barren land is lessen
Malnutrition is lessen
Family disputes is
lessen
Foreign currency is
saved
Inflation is reduced
Diseases is lessen
Dependence on foreign
food is lessen
Farmers use of locally
produced high quality seeds
Objective Analysis Tree‐ Saliyawewa(North‐Western)

The Preparatory Survey on the P
roject for Improvem
ent of Agricultural P
roduction and Productivity
in Dry Zone A
reas in Dem
ocratic Socialist Republic of Sri Lanka
Final R
eport
F 4-8
Figure A 4.8
Problem T
ree Thenagallanda (U
va)
Insufficient agro wells
Lack of (irrigation)
water
Lack of maintenance of existing irrigation
systems (by the duty bearers)
Lack of attention from the relevant duty bearers.
Lack of strong influence by the Farmer
Organizations.
Lack of a proper
cultivation plan to
diversify crops
Lack of inputs for the
cultivation (fertilizer and
other)
Lack of pasture land for the cattle
Establishing human
settlements without a
proper plan
Lack of quality seeds
Lack of quality dairy cattle
Financial problems
Lack of institutions-
resource persons to get training locally
Lack of pressure from
the farmer-farmers
organizations to influence
the state
Absence of a proper market
with fair (good) price
Lack of resources
Lack of knowledge, skills and
attitudes in technical and
managerial aspects
High cost of Agricultural equipments/
seeds/ fertilizer/
Production and Productivity of Other Field Crops (OFCs), Vegetable, Fruit and Dairy is low
Subjected to foreign
influences (e.g. high prices of
milk food)
Lack of balanced -
nutritious food
Drain out the national wealth to the foreign
countries
Farmers are poor
Core Problem
Effects
Causes
Increasing the malnutrition level
of the people
Decreasing the Economic situation
Decreasing the standards of living of the
farmers
Increase of the diseases
Decreasing the per capita income of
farmer households
Decrease of prices during the harvesting
period
Lack of quality products
Insufficient volume
(quantity) of production to attract traders
Lack of Agricultural equipment/ machinery
Lack of production of cattle which suit to the
local conditions
Lack of organizational effect to get
the equipment/ machinery
Get used to foreign seeds
Lack of commitments and improper plans of the duty bearers
High cost of production
Increasing povertyProblem Analysis Tree
‐ Thenagallanda (Uva)

The Preparatory Survey on the P
roject for Improvem
ent of Agricultural P
roduction and Productivity
in Dry Zone A
reas in Dem
ocratic Socialist Republic of Sri Lanka
Final R
eport
F 4-9
Figure A 4.9
Objective T
ree Thenagallanda (U
va)
Sufficient agro wells are
established
Irrigation water is
available
Maintenance of irrigation systems is properly
conducted by the duty
bearers and FO
Proper attention is paid by the
duty bearers
Establishment of stronger
Farmers Organizations to have strong
influence
Proper diversified cultivation
plans is available
Proper application of
inputs is available
Pasture land for cattle is available
Human settlements is established with proper
plans
More quality seeds are available
Quality dairy cattle are available
Financial problems are
decreased
Local institutions
and resource are available
More pressure is given to the duty bearers from farmers and Farmer
Organizations
Proper market is available, good price is
ensured
Sufficient resources inputs is available
Knowledge, skills and
attitudes in technical and
managerial aspects are available
Fair cost of inputs,
equipments, seeds,
fertilizer are ensured
Production and Productivity of Other Field Crops (OFCs), Vegetable, Fruit and Dairy is High
Influences from foreign countries
is lessen
Balanced -nutritious food
is available
National wealth in the country is
retained
Famers produce local
productions
Core Objective
Ends
Means
People in malnutrition
level is decreased
Economic situation is
uplifted
Farmers living standards is improved
Diseases is decreased
Per capita income of
farmer households is
increased
Good price is maintained by
more diversification
of crops
Availability of quality
products
Sufficient volume of
production to attract traders
(scale of production) is
produced
Agricultural equipment/
machinery are available
Cattle which suit to the
local conditions is
available
Organizational effect is
strengthen to get the
equipment/ machinery
Get used to quality local
seeds
More commitments
and proper plans is
provided by duty bearers
and state
Production cost is low
Poverty is decreasedObjective Analysis Tree
‐ Thenagallanda (Uva)

The Preparatory Survey on the P
roject for Improvem
ent of Agricultural P
roduction and Productivity
in Dry Zone A
reas in Dem
ocratic Socialist Republic of Sri Lanka
Final R
eport
F 4-10
Figure A 4.10
Problem T
ree Periyapandivirichchan (Northern)
Lack of investmen
ts
Lack of wealth due to displacement
s (war)
Poor economic
returns
Low profits
High cost of fuel and inputs etc
Shallow wells
Lack of modern
techniques and
machinery
Lack of high
productive cows
Lack of high
quality seeds
Lack of water
Lack of quality input
supply
Production and Productivity of Other Field Crops (OFCs), Vegetable, Fruit and Dairy is low
Low quality of life Malnutrition
Low returns from local
market
More imports/ fewer exports
Core Problem
Effects
Causes
More diseases Unemployment Low foreign exchange
Low water
availability in the
agro wells
No links with
perennial water
sources
Climate change/ drought
Lack of agrochem
icals, fertilizer
and animal
feeds etc.
Problem Analysis Tree‐ Periyapandivirichchan (Norhtern)
lack of modern
technical knowhow on crop
and animal
husbandry,
alternative options and value addition
Lack of motivatio
n and entrepreneurship
Lack of knowledge, skills and
motivation
Lack of marketabl
e productio
n
Lack of diversity
as the same crop produced
at the same time
by all
Lack of markets and marketing facilities
Lack of connection with the outside traders
Lack of advices on crop
and animal
husbandry
Lack of veterinary
service
Lack of technical support
(extension, training and treatments)
Lack of cultivable lands for OFC and pastures
Lack of lands for farmers
Economic down grading
Lack of government officers

The Preparatory Survey on the P
roject for Improvem
ent of Agricultural P
roduction and Productivity
in Dry Zone A
reas in Dem
ocratic Socialist Republic of Sri Lanka
Final R
eport
F 4-11
Figure A 4.11
Objective T
ree Periyapandivirichchan (Northern)
More investments come
Wealth is recovered
after resettlement
Farmers can
receive good
economic returns
Farmers can
receive higher profits
Cost of fuel and
inputs etc. is
reasonable
Agro wells are establishe
d
Modern technique
s and machinery are used
High productive cows is available
High quality
seeds are available
Water supply is adequate
Proper quality input is supplied
Production and Productivity of Other Field Crops (OFCs), Vegetable, Fruit and Dairy is High
High quality of life is ensured
Nutritious condition is
good
Farmers can receive higher returns from local market
Imports decreases, exports
increased
Core Objective
Ends
Means
Diseases is lessen
There is more employment opportunity
Proper foreign exchange is
ensured
Sufficient water is
availability from agro wells
Links with
perennial water
sources is set up
Proper irrigation
to overcome the adverse effects of Climate change/
drought is developed
Agrochemicals,
fertilizer and
animal feeds etc.
are properly
used
Objective Analysis Tree‐ Periyapandivirichchan (Norhtern)
Modern technical knowhow
on crop and animal
husbandry, alternative options and
value addition are available
Farmers are
motivated with
entrepreneur skills
Knowledge, skills and
motivation is improved
Marketable
products are
produced
Crop productio
n is diversifie
d
Marketing facilities are
prepared, market is organized
Connection with the outside
traders is improved
Proper advices is given on crop & animal
husbandry
Good veterinary service is provided
Technical support
(extension, training and treatments) is assured
Lands for OFC and pastures
are available
Land is provided to
farmers
Economic grows
More commitm
ent is government officers

The Preparatory Survey on the Project for Improvement of Agricultural Production and Productivity in Dry Zone Areas in Democratic Socialist Republic of Sri Lanka
Final Report
F 4-12
Figure A 4.12 Project Concept Summary
Overall Target
Project Objective
(1) Decrease in foreign currency outflow through improvement of self sufficient ratio(2) Increase in income of small holding sector
(1) Red and Big Onion (2) Chili(3) Legumes (4) Fruit
(Papaya, Mango, Orange, Passion Fruits etc.)
Feature of Strategic Agriculture and Livestock Product
(1) High production for effective import substution(2) Conform to the development plan (Mahinda Chintana /
Agriculture Cooperative Plan / Livestock Master Plan)(3) Technically feasible to produce(4) Meet ground level needs (farmer and frontline officer’s needs)
for production(5) Expect high net return
CZ-03 : Papaya & Mango etc.Promotion Zone (Export-oriented)
CZ 01~04 Milk Promotion
CZ-04 : Orange & Passion Fruits etc. Promotion Zone
CZ-02 : Legumes & B-onion etc.Promotion Zone
CZ-01: Chili & Red Onion etc.Promotion Zone
Potential areas in dry zone
(1) Soil suitability(2) Appropriateness of water resources(3) Farmer’s needs and experience(4) Marketability(5) Adequacy of extension services
Selected 54 DS divisions as high potential area with some criterias
Commercially viable strategic agriculture products
Milk &OFC productionIntegrated approach
1. Rehabilitation and/or construction of irrigation and drainage facilities;2. Establishment of supply chains of quality seeds and planting materials;3. Farmer training on improvement of farm management and production
technologies;4. Provision of the machineries to promote quality products with low
production cost and fences to protect farm products from domestic and wild animals;
5. Provision of credit to producers to support the above activities.
Major ActivitiesChili, Onion, Legume and Fruits
1. Establishment of proper interface and incubation of business minded leader for effective trading between producer and trader;
2. Rehabilitation or/and upgrading of rural road and farm access road;3. Conducting study tours for exporters/processors and government
official to major export countries and potential import countries of agricultural products from Sri Lanka.
❶Productivity Improvement Program
❷Logistic System Improvement and Entrepreneurship Development Program
1. Provision of training to extension officers for promotion of commercialized farming;
2. Enhancement of DATC/ISTC facilities to carry out the ground level on-farm trials and provision of mobility for field extension officers and other equipment to improve the extension services;
3. Overseas training for advanced commercial farming and extension method.
1. Establishment of supply chain of feed; 2. Breeding improvement through rapid increase in Artificial
Insemination (AI);3. Introduction of feed efficient livestock such as milking goat.
1. Provision of necessary equipments and training on clean milk production;
2. Establishment of effective milk collecting network and promotion of mobile sale.
Milk
❶Productivity Improvement Program of Semi-intensive and Intensive Farmer
1. Construction of livestock service center to be a focal point for livestock extension services and milk collection;
2. Training of VS and LDI on AI and synchronization; and3. Provision of the mobility to LDI and VS.
❸Livestock Service Quality and Accessibility Improvement Program
❷Program on Clean Milk Production and Market Network Development of Fresh Milk
❸Program on Enhancement of Extension Services and Ground Adaptive Trials
Increase in production & productivity of commercially viable strategic agriculture products in potential areas in dry zone through the promotion of integrated farming to small holding sector

The Preparatory Survey on the Project for Improvement of Agricultural Production and Productivity in Dry Zone Areas in Democratic Socialist Republic of Sri Lanka
Final Report
F 5-1
Figure A 5.1 Implementing organization
Project Steering Committee(PSC)
Service Providing Agency(SPA)
Executing Agency(EA)
Project Management Unit(PMU)
Project Director
Management ConsultantTeam Leader
Project Implementing Unit (PIU)
Deputy Project Director
Project Consultant
Project Coordinating Committee (PCC)
Implementing Agency (IA)
(1) Departments under Provincial Council(2) Department of Agrarian Development(3) Regional Director of Irrigation(4) Inter provincial extension unit of Department of Agriculture(5) Development Bank(6) Management Trust in DEC(7) Regional Project Manager's Office in System H
Provincial Coordination Committee (PCC)
District Coordination Committee (DCC)District Agriculture Committee
Divisional Agriculture Committee
BeneficialiesCBO / Indivisual Farmer / Private Sector
ReportApproval
CoordinationAdvise
ReportApproval
CoordinationAdvise
Report
Approval Coordination
Advise
AdviseServices
Service
Service
Fund Flow
Fund Flow
CentralLevel
ProvinceDistrictDivision
Level

The Preparatory Survey on the P
roject for Improvem
ent of Agricultural P
roduction and Productivity
in Dry Zone A
reas in Dem
ocratic Socialist Republic of Sri Lanka
Final R
eport
F 5-2
Figure A
5.2 Assignm
ent Schedule of Consultants (1/4)
1 2 3 4 5 6 7 8 9 10 11 12 13 14 15 16 17 18 19 20 21 22 23 24 25 26 27 28 29 30 31 32 33 34 35 36 37 38 39 40 41 42 43 44 45 46 47 48 49 50 51 52 53 54 55 56 57 58 59 60 61 62 63 64 65 66 67 68 69 70 71 72 73 74 75 76 77 78 79 80 81 82 83 84 Sub-Pro SupStaff
A M J J A S O N D J F M A M J J A S O N D J F M A M J J A S O N D J F M A M J J A S O N D J F M A M J J A S O N D J F M A M J J A S O N D J F M A M J J A S O N D J F M M/M M/M M/M M/M1. PMU Central
Professional ATeam Director
Team Leader / Project Management 1 1 1 1 1 1 1 1 1 1 1 1 1 1 1 1 1 1 1 1 1 1 1 1 1 1 1 1 1 1 1 1 1 1 1 1 1 1 1 1 1 1 1 1 1 1 1 1 1 1 1 1 1 1 1 1 1 1 58.0
Agriculture Expert (Marketing) 1 1 1 1 1 1 1 1 1 1 1 1 1 1 1 1 1 1 1 1 1 1 1 1 1 1 1 1 1 1 1 1 1 1 1 1 1 1 1 1 1 1 1 1 44.0
Agriculture Expert (Fruits Crop Management) 1 1 1 1 1 1 1 1 8.0
1 1 1 1 1 1 1 1 1 1 1 1 12.0
Professional BCo-Team Leader / Sr.Monitoring Engineer 1 1 1 1 1 1 1 1 1 1 1 1 1 1 1 1 1 1 1 1 1 1 1 1 1 1 1 1 1 1 1 1 1 1 1 1 1 1 1 1 1 1 1 1 1 1 1 1 1 1 1 1 1 1 1 1 1 1 1 1 1 1 1 63
Architect 1 1 1 1 1 1 1 1 1 1 1 1 12
Sr.Livestock Expert 1 1 1 1 1 1 1 1 1 1 1 1 1 1 1 1 1 1 1 1 1 1 1 1 1 1 1 1 1 1 1 1 1 1 1 1 1 1 1 1 1 1 1 1 1 1 1 1 1 1 1 1 1 1 1 1 1 1 1 1 1 1 1 1 1 1 1 1 1 1 1 1 1 1 1 75
Sr.Agronomist 1 1 1 1 1 1 1 1 1 1 1 1 1 1 1 1 1 1 1 1 1 1 1 1 1 1 1 1 1 1 1 1 1 1 1 1 1 1 1 1 1 1 1 1 1 1 1 1 1 1 1 1 1 1 1 1 1 1 1 1 1 1 1 1 1 1 1 1 1 1 1 1 1 1 1 75
Project monitoring and evaluation 1 1 1 1 1 1 1 1 1 1 1 1 1 1 14
Hydrogeologist 1 1 1 1 1 1 6
Procurement Specialist 1 1 1 1 1 1 1 1 1 1 1 1 12
Specialist as required 1 1 1 1 1 1 1 1 1 1 10
Supporting StaffAccounting / Office Manager / Procurement 1 1 1 1 1 1 1 1 1 1 1 1 1 1 1 1 1 1 1 1 1 1 1 1 1 1 1 1 1 1 1 1 1 1 1 1 1 1 1 1 1 1 1 1 1 1 1 1 1 1 1 1 1 1 1 1 1 1 1 1 1 1 1 1 1 1 1 1 1 1 1 1 1 1 74
Clerk 1 1 1 1 1 1 1 1 1 1 1 1 1 1 1 1 1 1 1 1 1 1 1 1 1 1 1 1 1 1 1 1 1 1 1 1 1 1 1 1 1 1 1 1 1 1 1 1 1 1 1 1 1 1 1 1 1 1 1 1 1 1 1 1 1 1 1 1 1 1 1 1 1 1 74
Secretary 1 1 1 1 1 1 1 1 1 1 1 1 1 1 1 1 1 1 1 1 1 1 1 1 1 1 1 1 1 1 1 1 1 1 1 1 1 1 1 1 1 1 1 1 1 1 1 1 1 1 1 1 1 1 1 1 1 1 1 1 1 1 1 1 1 1 1 1 1 1 1 1 1 1 74
Computer Operator 1 1 1 1 1 1 1 1 1 1 1 1 1 1 1 1 1 1 1 1 1 1 1 1 1 1 1 1 1 1 1 1 1 1 1 1 1 1 1 1 1 1 1 1 1 1 1 1 1 1 1 1 1 1 1 1 1 1 1 1 1 1 1 1 1 1 1 1 1 1 1 1 1 1 74
Office Aid 1 1 1 1 1 1 1 1 1 1 1 1 1 1 1 1 1 1 1 1 1 1 1 1 1 1 1 1 1 1 1 1 1 1 1 1 1 1 1 1 1 1 1 1 1 1 1 1 1 1 1 1 1 1 1 1 1 1 1 1 1 1 1 1 1 1 1 1 1 1 1 1 1 1 74
Driver 1 1 1 1 1 1 1 1 1 1 1 1 1 1 1 1 1 1 1 1 1 1 1 1 1 1 1 1 1 1 1 1 1 1 1 1 1 1 1 1 1 1 1 1 1 1 1 1 1 1 1 1 1 1 1 1 1 1 1 1 1 1 1 1 1 1 1 1 1 1 1 1 1 1 1 74
Driver 2 1 1 1 1 1 1 1 1 1 1 1 1 1 1 1 1 1 1 1 1 1 1 1 1 1 1 1 1 1 1 1 1 1 1 1 1 1 1 1 1 1 1 1 1 1 1 1 1 1 1 1 1 1 1 1 1 1 1 1 1 1 1 1 1 1 1 1 1 1 1 1 1 1 1 74
Driver 3 1 1 1 1 1 1 1 1 1 1 1 1 1 1 1 1 1 1 1 1 1 1 1 1 1 1 1 1 1 1 1 1 1 1 1 1 1 1 1 1 1 1 1 1 1 1 1 1 1 1 1 1 1 1 1 1 1 1 1 1 1 1 1 1 1 1 1 1 1 1 1 1 1 1 74
122 267 0 592
2.PIU NORTHProfessional B
Sr. Design/Construction Engineer (North) 1 1 1 1 1 1 1 1 1 1 1 1 1 1 1 1 1 1 1 1 1 1 1 1 1 1 1 1 1 1 1 1 1 1 1 1 1 1 1 1 1 1 1 1 1 1 1 1 1 1 1 1 1 1 1 1 1 1 58
Design/Construction Engineer (Mullaitive) 1 1 1 1 1 1 1 1 1 1 1 1 1 1 1 1 1 1 1 1 1 1 1 1 1 1 1 1 1 1 1 1 1 1 1 1 1 1 1 1 1 1 1 1 1 1 1 1 1 1 1 1 1 1 1 1 1 1 58
Design/Construction Engineer (Mannar) 1 1 1 1 1 1 1 1 1 1 1 1 1 1 1 1 1 1 1 1 1 1 1 1 1 1 1 1 1 1 1 1 1 1 1 1 1 1 1 1 1 1 1 1 1 1 1 1 1 1 50
Mechanical Engineer 1 1 1 1 1 1 1 1 1 1 1 1 1 1 1 1 1 1 1 1 1 21
Surveyor 1 1 1 1 1 1 1 1 1 1 1 1 1 1 1 15
Agriculture Marketing 1 1 1 1 1 1 1 1 1 1 1 1 1 1 1 1 1 1 1 1 1 1 1 1 1 1 1 1 1 1 1 1 1 1 1 1 1 1 1 1 1 1 1 1 1 1 1 1 1 1 1 1 1 1 1 1 1 1 1 1 1 1 1 1 1 1 1 1 1 1 1 1 72
Agriculture Extension (OFC & Vegetable) 1 1 1 1 1 1 1 1 1 1 1 1 1 1 1 1 1 1 1 1 1 1 1 1 1 1 1 1 1 1 1 1 1 1 1 1 1 1 1 1 1 1 1 1 1 1 1 1 1 1 1 1 1 1 1 1 1 1 1 1 1 1 1 1 1 1 1 1 1 1 1 1 72
Agriculture Extension (Fruits) 1 1 1 1 1 1 1 1 1 1 1 1 1 1 1 1 1 1 1 1 1 1 1 1 1 1 1 1 1 1 1 1 1 1 1 1 1 1 1 1 1 1 1 1 1 1 1 1 1 1 1 1 1 1 1 1 1 1 1 1 1 1 1 1 1 1 1 1 1 1 1 1 72
Livestock Expert 1 1 1 1 1 1 1 1 1 1 1 1 1 1 1 1 1 1 1 1 1 1 1 1 24
Sub ProfessionalEngineer Assistant (Kurai 1) 1 1 1 1 1 1 1 1 1 1 1 1 1 1 1 1 1 1 1 1 1 1 1 1 1 1 1 1 1 1 1 1 1 1 1 1 1 1 1 1 1 1 1 1 1 1 1 1 1 1 1 1 1 1 1 1 1 1 1 1 1 1 1 1 1 65
Engineer Assistant (Kurai 2) 1 1 1 1 1 1 1 1 1 1 1 1 1 1 1 1 1 1 1 1 1 1 1 1 1 1 26
Engineer Assistant (Welimaruthamadu 1) 1 1 1 1 1 1 1 1 1 1 1 1 1 1 1 1 1 1 1 1 1 1 1 1 1 1 1 1 1 1 1 1 1 1 1 1 1 1 1 1 1 1 1 1 1 1 1 1 1 1 50
Engineer Assistant (Welimaruthamadu 2) 1 1 1 1 1 1 1 1 1 1 1 1 1 1 1 1 1 1 1 1 1 1 1 1 1 1 26
Engineer Assistant (Muthayankaddu 1) 1 1 1 1 1 1 1 1 1 1 1 1 1 1 1 1 1 1 1 1 1 1 1 1 1 1 1 1 1 1 1 1 1 1 1 1 1 1 1 1 1 1 1 1 1 1 1 1 1 1 1 1 1 1 1 1 1 1 1 1 1 1 1 1 1 65
Engineer Assistant (Muthayankaddu 2) 1 1 1 1 1 1 1 1 1 1 1 1 1 1 1 1 1 1 1 1 1 1 1 1 1 1 26
Engineer Assistant (Vavunikulam 1) 1 1 1 1 1 1 1 1 1 1 1 1 1 1 1 1 1 1 1 1 1 1 1 1 1 1 1 1 1 1 1 1 1 1 1 1 1 1 1 1 1 1 1 1 1 1 1 1 1 1 50
Engineer Assistant (Vavunikulam 2) 1 1 1 1 1 1 1 1 1 1 1 1 1 1 1 1 1 1 1 1 1 1 1 1 1 1 26
Field Supervisor 1 1 1 1 1 1 1 1 1 1 1 1 1 1 1 1 1 1 1 1 1 1 1 1 1 1 1 1 1 1 1 1 1 1 1 34
Field Supervisor 2 1 1 1 1 1 1 1 1 1 1 1 1 1 1 1 1 1 1 1 1 1 1 1 1 1 1 1 1 1 1 1 1 1 1 34
Field Supervisor 3 1 1 1 1 1 1 1 1 1 1 1 1 1 1 1 1 1 1 1 1 1 1 1 1 1 1 1 1 1 1 1 1 1 1 34
Field Supervisor 4 1 1 1 1 1 1 1 1 1 1 1 1 1 1 1 1 1 1 1 1 1 1 1 1 1 1 1 1 1 1 1 1 1 1 34
Field Supervisor 5 1 1 1 1 1 1 1 1 1 1 1 1 1 1 1 1 1 1 1 1 1 1 1 1 1 1 1 1 1 1 1 1 1 1 34
Field Supervisor 6 1 1 1 1 1 1 1 1 1 1 1 1 1 1 1 1 1 1 1 1 1 1 1 1 1 1 1 1 1 1 1 1 1 1 34
Field Supervisor 7 1 1 1 1 1 1 1 1 1 1 1 1 1 1 1 1 1 1 1 1 1 1 1 1 1 1 1 1 1 1 1 1 1 1 34
Specialist as required
Total
M/M
ProfessionalProfessional / Sub-professional /
Supporting Staff
1st Year 2nd Year 3rd Year 4th Year 5th Year 6th Year 7th Year 8th Year

The Preparatory Survey on the P
roject for Improvem
ent of Agricultural P
roduction and Productivity
in Dry Zone A
reas in Dem
ocratic Socialist Republic of Sri Lanka
Final R
eport
F 5-3
Figure A 5.2 A
ssignment Schedule of C
onsultants (2/4)
1 2 3 4 5 6 7 8 9 10 11 12 13 14 15 16 17 18 19 20 21 22 23 24 25 26 27 28 29 30 31 32 33 34 35 36 37 38 39 40 41 42 43 44 45 46 47 48 49 50 51 52 53 54 55 56 57 58 59 60 61 62 63 64 65 66 67 68 69 70 71 72 73 74 75 76 77 78 79 80 81 82 83 84 Sub-Pro SupStaff
A M J J A S O N D J F M A M J J A S O N D J F M A M J J A S O N D J F M A M J J A S O N D J F M A M J J A S O N D J F M A M J J A S O N D J F M A M J J A S O N D J F M M/M M/M M/M M/M
Field Supervisor 8 1 1 1 1 1 1 1 1 1 1 1 1 1 1 1 1 1 1 1 1 1 1 1 1 1 1 1 1 1 1 1 1 1 1 34
Field Supervisor 9 1 1 1 1 1 1 1 1 1 1 1 1 1 1 1 1 1 1 1 1 1 1 1 1 1 1 1 1 1 1 1 1 1 1 34
Field Supervisor 10 1 1 1 1 1 1 1 1 1 1 1 1 1 1 1 1 1 1 1 1 1 1 1 1 1 1 1 1 1 1 1 1 1 1 34
Field Supervisor 11 1 1 1 1 1 1 1 1 1 1 1 1 1 1 1 1 1 1 1 1 1 1 1 1 1 1 1 1 1 1 1 1 1 1 34
Field Supervisor 12 1 1 1 1 1 1 1 1 1 1 1 1 1 1 1 1 1 1 1 1 1 1 1 1 1 1 1 1 1 1 1 1 1 1 34
Field Supervisor 13 1 1 1 1 1 1 1 1 1 1 1 1 1 1 1 1 1 1 1 1 1 1 1 1 1 1 1 1 1 1 1 1 1 1 34
Field Supervisor 14 1 1 1 1 1 1 1 1 1 1 1 1 1 1 1 1 1 1 1 1 1 1 1 1 1 1 1 1 1 1 1 1 1 1 34
Field Supervisor 15 1 1 1 1 1 1 1 1 1 1 1 1 1 1 1 1 1 1 1 1 1 1 1 1 1 1 1 1 1 1 1 1 1 1 34
Field Supervisor 16 1 1 1 1 1 1 1 1 1 1 1 1 1 1 1 1 1 1 1 1 1 1 1 1 1 1 1 1 1 1 1 1 1 1 34
CAD Operator 1 1 1 1 1 1 1 1 1 1 1 1 1 1 1 1 1 1 1 1 1 1 1 1 1 1 1 1 1 1 1 1 1 1 1 1 1 1 1 1 1 1 1 1 1 1 1 1 1 1 1 1 1 1 1 1 1 1 1 1 1 1 1 1 63
CAD Operator 2 1 1 1 1 1 1 1 1 1 1 1 1 1 1 1 1 1 1 1 1 1 1 1 1 1 1 1 1 1 1 1 1 1 1 1 1 1 1 1 1 1 1 1 1 1 1 1 1 48
CAD Operator 3 1 1 1 1 1 1 1 1 1 1 1 1 1 1 1 1 1 1 1 1 1 1 1 1 1 1 1 1 1 1 1 1 1 1 1 1 36
CAD Operator 4 1 1 1 1 1 1 1 1 1 1 1 1 1 1 1 1 1 1 1 1 1 1 1 1 1 1 1 1 1 1 1 1 1 1 1 1 36
CAD Operator 5 1 1 1 1 1 1 1 1 1 1 1 1 1 1 1 1 1 1 1 1 1 1 1 1 1 1 1 1 1 1 1 1 1 1 1 1 36
Agriculture Assistant 1 (OFC) 1 1 1 1 1 1 1 1 1 1 1 1 1 1 1 1 1 1 1 1 1 1 1 1 1 1 1 1 1 1 1 1 1 1 1 1 1 1 1 1 1 1 1 1 1 1 1 1 1 1 1 1 1 1 1 1 1 1 1 1 1 1 1 1 1 1 66
Agriculture Assistant 2 (Fruits) 1 1 1 1 1 1 1 1 1 1 1 1 1 1 1 1 1 1 1 1 1 1 1 1 1 1 1 1 1 1 1 1 1 1 1 1 1 1 1 1 1 1 1 1 1 1 1 1 1 1 1 1 1 1 1 1 1 1 1 1 1 1 1 1 1 1 66
Livestock Assistant 1 1 1 1 1 1 1 1 1 1 1 1 1 1 1 1 1 1 1 1 1 1 1 1 1 1 1 1 1 1 1 1 1 1 1 1 1 1 1 1 1 1 1 1 1 1 1 1 1 1 1 1 1 1 1 1 1 1 1 1 1 1 1 1 1 1 66
Supporting StaffAccounting / Office Manager / Procurement 1 1 1 1 1 1 1 1 1 1 1 1 1 1 1 1 1 1 1 1 1 1 1 1 1 1 1 1 1 1 1 1 1 1 1 1 1 1 1 1 1 1 1 1 1 1 1 1 1 1 1 1 1 1 1 1 1 1 1 1 1 1 1 1 1 1 1 1 1 1 1 1 1 1 74
Clerk 1 1 1 1 1 1 1 1 1 1 1 1 1 1 1 1 1 1 1 1 1 1 1 1 1 1 1 1 1 1 1 1 1 1 1 1 1 1 1 1 1 1 1 1 1 1 1 1 1 1 1 1 1 1 1 1 1 1 1 1 1 1 1 1 1 1 1 1 1 1 1 1 1 1 74
Secretary 1 1 1 1 1 1 1 1 1 1 1 1 1 1 1 1 1 1 1 1 1 1 1 1 1 1 1 1 1 1 1 1 1 1 1 1 1 1 1 1 1 1 1 1 1 1 1 1 1 1 1 1 1 1 1 1 1 1 1 1 1 1 1 1 1 1 1 1 1 1 1 1 1 1 74
Computer Operator A 1 1 1 1 1 1 1 1 1 1 1 1 1 1 1 1 1 1 1 1 1 1 1 1 1 1 1 1 1 1 1 1 1 1 1 1 1 1 1 1 1 1 1 1 1 1 1 1 1 1 1 1 1 1 1 1 1 1 1 1 1 1 1 1 1 1 1 1 1 1 1 1 1 1 74
Office Aid 1 1 1 1 1 1 1 1 1 1 1 1 1 1 1 1 1 1 1 1 1 1 1 1 1 1 1 1 1 1 1 1 1 1 1 1 1 1 1 1 1 1 1 1 1 1 1 1 1 1 1 1 1 1 1 1 1 1 1 1 1 1 1 1 1 1 1 1 1 1 1 1 1 1 74
Driver 1 1 1 1 1 1 1 1 1 1 1 1 1 1 1 1 1 1 1 1 1 1 1 1 1 1 1 1 1 1 1 1 1 1 1 1 1 1 1 1 1 1 1 1 1 1 1 1 1 1 1 1 1 1 1 1 1 1 1 1 1 1 1 1 1 1 1 1 1 1 1 1 1 1 1 74
Driver 2 1 1 1 1 1 1 1 1 1 1 1 1 1 1 1 1 1 1 1 1 1 1 1 1 1 1 1 1 1 1 1 1 1 1 1 1 1 1 1 1 1 1 1 1 1 1 1 1 1 1 1 1 1 1 1 1 1 1 1 1 1 1 1 1 1 1 1 1 1 1 1 1 1 1 74
Driver 3 1 1 1 1 1 1 1 1 1 1 1 1 1 1 1 1 1 1 1 1 1 1 1 1 1 1 1 1 1 1 1 1 1 1 1 1 1 1 1 1 1 1 1 1 1 1 1 1 1 1 1 1 1 1 1 1 1 1 1 1 1 1 62
Driver 4 1 1 1 1 1 1 1 1 1 1 1 1 1 1 1 1 1 1 1 1 1 1 1 1 1 1 1 1 1 1 1 1 1 1 1 1 1 1 1 1 1 1 1 1 1 1 1 1 1 1 50
Driver 5 1 1 1 1 1 1 1 1 1 1 1 1 1 1 1 1 1 1 1 1 1 1 1 1 1 1 1 1 1 1 1 1 1 1 1 1 1 1 1 1 1 1 1 1 1 1 1 1 1 1 50
0 442 1295 630
2.PIU EASTProfessional B
Design/Construction Engineer (East) 1 1 1 1 1 1 1 1 1 1 1 1 1 1 1 1 1 1 1 1 1 1 1 1 1 1 1 1 1 1 1 1 1 1 1 1 1 1 1 1 1 1 1 1 1 1 1 1 1 1 1 51
Agriculture Marketing 1 1 1 1 1 1 1 1 1 1 1 1 1 1 1 1 1 1 1 1 1 1 1 1 1 1 1 1 1 1 1 1 1 1 1 1 1 1 1 1 1 1 1 1 1 1 1 1 1 1 1 1 1 1 1 1 1 1 1 1 1 1 1 1 1 1 1 1 1 1 1 1 72
Agriculture Extension (OFC & Vegetable) 1 1 1 1 1 1 1 1 1 1 1 1 1 1 1 1 1 1 1 1 1 1 1 1 1 1 1 1 1 1 1 1 1 1 1 1 1 1 1 1 1 1 1 1 1 1 1 1 1 1 1 1 1 1 1 1 1 1 1 1 1 1 1 1 1 1 1 1 1 1 1 1 72
Agriculture Extension (Fruits) 1 1 1 1 1 1 1 1 1 1 1 1 1 1 1 1 1 1 1 1 1 1 1 1 1 1 1 1 1 1 1 1 1 1 1 1 1 1 1 1 1 1 1 1 1 1 1 1 1 1 1 1 1 1 1 1 1 1 1 1 1 1 1 1 1 1 1 1 1 1 1 1 72
Livestock Expert 1 1 1 1 1 1 1 1 1 1 1 1 1 1 1 1 1 1 1 1 1 1 1 1 24
Sub ProfessionalEngineering Assistant (East 1) 1 1 1 1 1 1 1 1 1 1 1 1 1 1 1 1 1 1 1 1 1 1 1 1 1 1 1 1 1 1 1 1 1 1 1 1 1 1 1 1 1 1 1 1 1 1 1 1 1 1 1 1 1 1 1 1 1 1 1 1 1 1 1 1 1 65
Engineering Assistant (East 2) 1 1 1 1 1 1 1 1 1 1 1 1 1 1 1 1 1 1 1 1 1 1 1 1 1 1 1 1 1 1 1 1 1 1 1 1 1 1 1 1 1 1 1 1 1 1 1 1 1 1 50
Field Supervisor 1 1 1 1 1 1 1 1 1 1 1 1 1 1 1 1 1 1 1 1 1 1 1 1 1 1 1 1 1 1 1 1 1 1 1 1 1 36
Field Supervisor 2 1 1 1 1 1 1 1 1 1 1 1 1 1 1 1 1 1 1 1 1 1 1 1 1 1 1 1 1 1 1 1 1 1 1 1 1 36
Field Supervisor 3 1 1 1 1 1 1 1 1 1 1 1 1 1 1 1 1 1 1 1 1 1 1 1 1 1 1 1 1 1 1 1 1 1 1 1 1 36
CAD Operator 1 1 1 1 1 1 1 1 1 1 1 1 1 1 1 1 1 1 1 1 1 1 1 1 1 1 1 1 1 1 1 1 1 1 1 1 1 1 1 1 1 1 1 1 1 1 1 1 1 1 1 1 1 1 1 1 1 1 1 1 1 1 1 1 63
CAD Operator 2 1 1 1 1 1 1 1 1 1 1 1 1 1 1 1 1 1 1 1 1 1 1 1 1 1 1 1 1 1 1 1 1 1 1 1 1 36
CAD Operator 3 1 1 1 1 1 1 1 1 1 1 1 1 1 1 1 1 1 1 1 1 1 1 1 1 1 1 1 1 1 1 1 1 1 1 1 1 36
Agriculture Assistant 1 (OFC) 1 1 1 1 1 1 1 1 1 1 1 1 1 1 1 1 1 1 1 1 1 1 1 1 1 1 1 1 1 1 1 1 1 1 1 1 1 1 1 1 1 1 1 1 1 1 1 1 1 1 1 1 1 1 1 1 1 1 1 1 1 1 1 1 1 1 66
Agriculture Assistant 2 (Fruits) 1 1 1 1 1 1 1 1 1 1 1 1 1 1 1 1 1 1 1 1 1 1 1 1 1 1 1 1 1 1 1 1 1 1 1 1 1 1 1 1 1 1 1 1 1 1 1 1 1 1 1 1 1 1 1 1 1 1 1 1 1 1 1 1 1 1 66
Livestock Assistant 1 1 1 1 1 1 1 1 1 1 1 1 1 1 1 1 1 1 1 1 1 1 1 1 1 1 1 1 1 1 1 1 1 1 1 1 1 1 1 1 1 1 1 1 1 1 1 1 1 1 1 1 1 1 1 1 1 1 1 1 1 1 1 1 1 1 66
Supporting StaffAccounting / Office Manager / Procurement 1 1 1 1 1 1 1 1 1 1 1 1 1 1 1 1 1 1 1 1 1 1 1 1 1 1 1 1 1 1 1 1 1 1 1 1 1 1 1 1 1 1 1 1 1 1 1 1 1 1 1 1 1 1 1 1 1 1 1 1 1 1 1 1 1 1 1 1 1 1 1 1 1 1 74
Clerk 1 1 1 1 1 1 1 1 1 1 1 1 1 1 1 1 1 1 1 1 1 1 1 1 1 1 1 1 1 1 1 1 1 1 1 1 1 1 1 1 1 1 1 1 1 1 1 1 1 1 1 1 1 1 1 1 1 1 1 1 1 1 1 1 1 1 1 1 1 1 1 1 1 1 74
Secretary 1 1 1 1 1 1 1 1 1 1 1 1 1 1 1 1 1 1 1 1 1 1 1 1 1 1 1 1 1 1 1 1 1 1 1 1 1 1 1 1 1 1 1 1 1 1 1 1 1 1 1 1 1 1 1 1 1 1 1 1 1 1 1 1 1 1 1 1 1 1 1 1 1 1 74
7th Year 8th Year M/M
ProfessionalProfessional / Sub-professional /
Supporting Staff
1st Year 2nd Year
Total
3rd Year 4th Year 5th Year 6th Year

The Preparatory Survey on the P
roject for Improvem
ent of Agricultural P
roduction and Productivity
in Dry Zone A
reas in Dem
ocratic Socialist Republic of Sri Lanka
Final R
eport
F 5-4
1 2 3 4 5 6 7 8 9 10 11 12 13 14 15 16 17 18 19 20 21 22 23 24 25 26 27 28 29 30 31 32 33 34 35 36 37 38 39 40 41 42 43 44 45 46 47 48 49 50 51 52 53 54 55 56 57 58 59 60 61 62 63 64 65 66 67 68 69 70 71 72 73 74 75 76 77 78 79 80 81 82 83 84 Sub-Pro SupStaff
A M J J A S O N D J F M A M J J A S O N D J F M A M J J A S O N D J F M A M J J A S O N D J F M A M J J A S O N D J F M A M J J A S O N D J F M A M J J A S O N D J F M M/M M/M M/M M/M
Computer Operator A 1 1 1 1 1 1 1 1 1 1 1 1 1 1 1 1 1 1 1 1 1 1 1 1 1 1 1 1 1 1 1 1 1 1 1 1 1 1 1 1 1 1 1 1 1 1 1 1 1 1 1 1 1 1 1 1 1 1 1 1 1 1 1 1 1 1 1 1 1 1 1 1 1 1 74
Office Aid 1 1 1 1 1 1 1 1 1 1 1 1 1 1 1 1 1 1 1 1 1 1 1 1 1 1 1 1 1 1 1 1 1 1 1 1 1 1 1 1 1 1 1 1 1 1 1 1 1 1 1 1 1 1 1 1 1 1 1 1 1 1 1 1 1 1 1 1 1 1 1 1 1 1 74
Driver 1 1 1 1 1 1 1 1 1 1 1 1 1 1 1 1 1 1 1 1 1 1 1 1 1 1 1 1 1 1 1 1 1 1 1 1 1 1 1 1 1 1 1 1 1 1 1 1 1 1 1 1 1 1 1 1 1 1 1 1 1 1 1 1 1 1 1 1 1 1 1 1 1 1 1 74
Driver 2 1 1 1 1 1 1 1 1 1 1 1 1 1 1 1 1 1 1 1 1 1 1 1 1 1 1 1 1 1 1 1 1 1 1 1 1 1 1 1 1 1 1 1 1 1 1 1 1 1 1 1 1 1 1 1 1 1 1 1 1 1 1 1 1 1 1 1 1 1 1 1 1 1 1 74
Driver 3 1 1 1 1 1 1 1 1 1 1 1 1 1 1 1 1 1 1 1 1 1 1 1 1 1 1 1 1 1 1 1 1 1 1 1 1 1 1 1 1 1 1 1 1 1 1 1 1 1 1 50
Driver 4 1 1 1 1 1 1 1 1 1 1 1 1 1 1 1 1 1 1 1 1 1 1 1 1 1 1 1 1 1 1 1 1 1 1 1 1 1 1 1 1 1 1 1 1 1 1 1 1 1 1 50
0 291 556 618
4.PIU NORTH CENTRALProfessional B
Sr. Design/Construction Engineer 1 1 1 1 1 1 1 1 1 1 1 1 1 1 1 1 1 1 1 1 1 1 1 1 1 1 1 1 1 1 1 1 1 1 1 1 1 1 1 1 1 1 1 1 1 1 1 1 1 1 1 1 51
Design/Construction Engineer 2 1 1 1 1 1 1 1 1 1 1 1 1 1 1 1 1 1 1 1 1 1 1 1 1 1 1 1 1 1 1 1 1 1 1 1 1 1 1 1 1 1 1 1 1 1 1 1 1 1 1 1 51
Agriculture Marketing 1 1 1 1 1 1 1 1 1 1 1 1 1 1 1 1 1 1 1 1 1 1 1 1 1 1 1 1 1 1 1 1 1 1 1 1 1 1 1 1 1 1 1 1 1 1 1 1 1 1 1 1 1 1 1 1 1 1 1 1 1 1 1 1 1 1 1 1 1 1 1 1 72
Agriculture Extension (OFC & Vegetable) 1 1 1 1 1 1 1 1 1 1 1 1 1 1 1 1 1 1 1 1 1 1 1 1 1 1 1 1 1 1 1 1 1 1 1 1 1 1 1 1 1 1 1 1 1 1 1 1 1 1 1 1 1 1 1 1 1 1 1 1 1 1 1 1 1 1 1 1 1 1 1 1 72
Agriculture Extension (Fruits) 1 1 1 1 1 1 1 1 1 1 1 1 1 1 1 1 1 1 1 1 1 1 1 1 1 1 1 1 1 1 1 1 1 1 1 1 1 1 1 1 1 1 1 1 1 1 1 1 1 1 1 1 1 1 1 1 1 1 1 1 1 1 1 1 1 1 1 1 1 1 1 1 72
Livestock Expert 1 1 1 1 1 1 1 1 1 1 1 1 1 1 1 1 1 1 1 1 1 1 1 1 24
Sub ProfessionalEngineering Assistant 1 1 1 1 1 1 1 1 1 1 1 1 1 1 1 1 1 1 1 1 1 1 1 1 1 1 1 1 1 1 1 1 1 1 1 1 1 1 1 1 1 1 1 1 1 1 1 1 1 1 1 1 1 1 1 1 1 1 1 1 1 1 1 1 1 65
Engineering Assistant 1 1 1 1 1 1 1 1 1 1 1 1 1 1 1 1 1 1 1 1 1 1 1 1 1 1 1 1 1 1 1 1 1 1 1 1 1 1 1 1 1 1 1 1 1 1 1 1 1 1 50
Field Supervisor 1 1 1 1 1 1 1 1 1 1 1 1 1 1 1 1 1 1 1 1 1 1 1 1 1 1 1 1 1 1 1 1 1 1 1 1 1 36
Field Supervisor 2 1 1 1 1 1 1 1 1 1 1 1 1 1 1 1 1 1 1 1 1 1 1 1 1 1 1 1 1 1 1 1 1 1 1 1 1 36
Field Supervisor 3 1 1 1 1 1 1 1 1 1 1 1 1 1 1 1 1 1 1 1 1 1 1 1 1 1 1 1 1 1 1 1 1 1 1 1 1 36
Field Supervisor 4 1 1 1 1 1 1 1 1 1 1 1 1 1 1 1 1 1 1 1 1 1 1 1 1 1 1 1 1 1 1 1 1 1 1 1 1 36
CAD Operator 1 1 1 1 1 1 1 1 1 1 1 1 1 1 1 1 1 1 1 1 1 1 1 1 1 1 1 1 1 1 1 1 1 1 1 1 1 1 1 1 1 1 1 1 1 1 1 1 1 1 1 1 1 1 1 1 1 1 1 1 1 1 1 1 63
CAD Operator 2 1 1 1 1 1 1 1 1 1 1 1 1 1 1 1 1 1 1 1 1 1 1 1 1 1 1 1 1 1 1 1 1 1 1 1 1 36
CAD Operator 3 1 1 1 1 1 1 1 1 1 1 1 1 1 1 1 1 1 1 1 1 1 1 1 1 1 1 1 1 1 1 1 1 1 1 1 1 36
Agriculture Assistant 1 (OFC) 1 1 1 1 1 1 1 1 1 1 1 1 1 1 1 1 1 1 1 1 1 1 1 1 1 1 1 1 1 1 1 1 1 1 1 1 1 1 1 1 1 1 1 1 1 1 1 1 1 1 1 1 1 1 1 1 1 1 1 1 1 1 1 1 1 1 66
Agriculture Assistant 2 (Fruits) 1 1 1 1 1 1 1 1 1 1 1 1 1 1 1 1 1 1 1 1 1 1 1 1 1 1 1 1 1 1 1 1 1 1 1 1 1 1 1 1 1 1 1 1 1 1 1 1 1 1 1 1 1 1 1 1 1 1 1 1 1 1 1 1 1 1 66
Livestock Assistant 1 1 1 1 1 1 1 1 1 1 1 1 1 1 1 1 1 1 1 1 1 1 1 1 1 1 1 1 1 1 1 1 1 1 1 1 1 1 1 1 1 1 1 1 1 1 1 1 1 1 1 1 1 1 1 1 1 1 1 1 1 1 1 1 1 1 66
Supporting StaffAccounting / Office Manager / Procurement 1 1 1 1 1 1 1 1 1 1 1 1 1 1 1 1 1 1 1 1 1 1 1 1 1 1 1 1 1 1 1 1 1 1 1 1 1 1 1 1 1 1 1 1 1 1 1 1 1 1 1 1 1 1 1 1 1 1 1 1 1 1 1 1 1 1 1 1 1 1 1 1 1 1 74
Clerk 1 1 1 1 1 1 1 1 1 1 1 1 1 1 1 1 1 1 1 1 1 1 1 1 1 1 1 1 1 1 1 1 1 1 1 1 1 1 1 1 1 1 1 1 1 1 1 1 1 1 1 1 1 1 1 1 1 1 1 1 1 1 1 1 1 1 1 1 1 1 1 1 1 1 74
Secretary 1 1 1 1 1 1 1 1 1 1 1 1 1 1 1 1 1 1 1 1 1 1 1 1 1 1 1 1 1 1 1 1 1 1 1 1 1 1 1 1 1 1 1 1 1 1 1 1 1 1 1 1 1 1 1 1 1 1 1 1 1 1 1 1 1 1 1 1 1 1 1 1 1 1 74
Computer Operator A 1 1 1 1 1 1 1 1 1 1 1 1 1 1 1 1 1 1 1 1 1 1 1 1 1 1 1 1 1 1 1 1 1 1 1 1 1 1 1 1 1 1 1 1 1 1 1 1 1 1 1 1 1 1 1 1 1 1 1 1 1 1 1 1 1 1 1 1 1 1 1 1 1 1 74
Office Aid 1 1 1 1 1 1 1 1 1 1 1 1 1 1 1 1 1 1 1 1 1 1 1 1 1 1 1 1 1 1 1 1 1 1 1 1 1 1 1 1 1 1 1 1 1 1 1 1 1 1 1 1 1 1 1 1 1 1 1 1 1 1 1 1 1 1 1 1 1 1 1 1 1 1 74
Driver 1 1 1 1 1 1 1 1 1 1 1 1 1 1 1 1 1 1 1 1 1 1 1 1 1 1 1 1 1 1 1 1 1 1 1 1 1 1 1 1 1 1 1 1 1 1 1 1 1 1 1 1 1 1 1 1 1 1 1 1 1 1 1 1 1 1 1 1 1 1 1 1 1 1 1 74
Driver 2 1 1 1 1 1 1 1 1 1 1 1 1 1 1 1 1 1 1 1 1 1 1 1 1 1 1 1 1 1 1 1 1 1 1 1 1 1 1 1 1 1 1 1 1 1 1 1 1 1 1 1 1 1 1 1 1 1 1 1 1 1 1 1 1 1 1 1 1 1 1 1 1 1 1 74
Driver 3 1 1 1 1 1 1 1 1 1 1 1 1 1 1 1 1 1 1 1 1 1 1 1 1 1 1 1 1 1 1 1 1 1 1 1 1 1 1 1 1 1 1 1 1 1 1 1 1 1 1 50
0 342 592 568
5.PIU NORTH WESTProfessional B
Sr. Design/Construction Engineer (NWP 1) 1 1 1 1 1 1 1 1 1 1 1 1 1 1 1 1 1 1 1 1 1 1 1 1 1 1 1 1 1 1 1 1 1 1 1 1 1 1 1 1 1 1 1 1 1 1 1 1 1 1 1 51
Design/Construction Engineer (NWP 2) 1 1 1 1 1 1 1 1 1 1 1 1 1 1 1 1 1 1 1 1 1 1 1 1 1 1 1 1 1 1 1 1 1 1 1 1 1 1 1 1 1 1 1 1 1 1 1 1 1 1 1 51
Surveyor 1 1 1 1 1 1 1 1 1 1 1 1 1 1 1 1 1 17
Agriculture Marketing 1 1 1 1 1 1 1 1 1 1 1 1 1 1 1 1 1 1 1 1 1 1 1 1 1 1 1 1 1 1 1 1 1 1 1 1 1 1 1 1 1 1 1 1 1 1 1 1 1 1 1 1 1 1 1 1 1 1 1 1 1 1 1 1 1 1 1 1 1 1 1 1 72
Agriculture Extension (OFC & Vegetable) 1 1 1 1 1 1 1 1 1 1 1 1 1 1 1 1 1 1 1 1 1 1 1 1 1 1 1 1 1 1 1 1 1 1 1 1 1 1 1 1 1 1 1 1 1 1 1 1 1 1 1 1 1 1 1 1 1 1 1 1 1 1 1 1 1 1 1 1 1 1 1 1 72
Agriculture Extension (Fruits) 1 1 1 1 1 1 1 1 1 1 1 1 1 1 1 1 1 1 1 1 1 1 1 1 1 1 1 1 1 1 1 1 1 1 1 1 1 1 1 1 1 1 1 1 1 1 1 1 1 1 1 1 1 1 1 1 1 1 1 1 1 1 1 1 1 1 1 1 1 1 1 1 72
Livestock Expert 1 1 1 1 1 1 1 1 1 1 1 1 1 1 1 1 1 1 1 1 1 1 1 1 24
Sub ProfessionalEngineering Assistant (Ingnimitiya) 1 1 1 1 1 1 1 1 1 1 1 1 1 1 1 1 1 1 1 1 1 1 1 1 1 1 1 1 1 1 1 1 1 1 1 1 1 1 1 1 1 1 1 1 1 1 1 1 1 1 1 1 1 1 1 1 1 1 1 1 1 1 1 1 1 65
Engineering Assistant (Neelabemma) 1 1 1 1 1 1 1 1 1 1 1 1 1 1 1 1 1 1 1 1 1 1 1 1 1 1 1 1 1 1 1 1 1 1 1 1 1 1 1 1 1 1 1 1 1 1 1 1 1 1 50
Engineering Assistant (NWP) 1 1 1 1 1 1 1 1 1 1 1 1 1 1 1 1 1 1 1 1 1 1 1 1 1 1 1 1 1 1 1 1 1 1 1 1 1 1 1 1 1 1 1 1 1 1 1 1 1 1 50
Field Supervisor 1 1 1 1 1 1 1 1 1 1 1 1 1 1 1 1 1 1 1 1 1 1 1 1 1 1 1 1 1 1 1 1 1 1 1 1 1 36
6th Year 7th Year 8th Year M/M
ProfessionalProfessional / Sub-professional /
Supporting Staff
1st Year 2nd Year 3rd Year 4th Year 5th Year
Total
Total
Figure A
5.2 Assignm
ent Schedule of Consultants (3/4)

The Preparatory Survey on the P
roject for Improvem
ent of Agricultural P
roduction and Productivity
in Dry Zone A
reas in Dem
ocratic Socialist Republic of Sri Lanka
Final R
eport
F 5-5
1 2 3 4 5 6 7 8 9 10 11 12 13 14 15 16 17 18 19 20 21 22 23 24 25 26 27 28 29 30 31 32 33 34 35 36 37 38 39 40 41 42 43 44 45 46 47 48 49 50 51 52 53 54 55 56 57 58 59 60 61 62 63 64 65 66 67 68 69 70 71 72 73 74 75 76 77 78 79 80 81 82 83 84 Sub-Pro SupStaff
A M J J A S O N D J F M A M J J A S O N D J F M A M J J A S O N D J F M A M J J A S O N D J F M A M J J A S O N D J F M A M J J A S O N D J F M A M J J A S O N D J F M M/M M/M M/M M/MField Supervisor 2 1 1 1 1 1 1 1 1 1 1 1 1 1 1 1 1 1 1 1 1 1 1 1 1 1 1 1 1 1 1 1 1 1 1 1 1 36
Field Supervisor 3 1 1 1 1 1 1 1 1 1 1 1 1 1 1 1 1 1 1 1 1 1 1 1 1 1 1 1 1 1 1 1 1 1 1 1 1 36
Field Supervisor 4 1 1 1 1 1 1 1 1 1 1 1 1 1 1 1 1 1 1 1 1 1 1 1 1 1 1 1 1 1 1 1 1 1 1 1 1 36
Field Supervisor 5 1 1 1 1 1 1 1 1 1 1 1 1 1 1 1 1 1 1 1 1 1 1 1 1 1 1 1 1 1 1 1 1 1 1 1 1 36
Field Supervisor 6 1 1 1 1 1 1 1 1 1 1 1 1 1 1 1 1 1 1 1 1 1 1 1 1 1 1 1 1 1 1 1 1 1 1 1 1 36
Field Supervisor 7 1 1 1 1 1 1 1 1 1 1 1 1 1 1 1 1 1 1 1 1 1 1 1 1 1 1 1 1 1 1 1 1 1 1 1 1 36
Field Supervisor 8 1 1 1 1 1 1 1 1 1 1 1 1 1 1 1 1 1 1 1 1 1 1 1 1 1 1 1 1 1 1 1 1 1 1 1 1 36
Field Supervisor 9 1 1 1 1 1 1 1 1 1 1 1 1 1 1 1 1 1 1 1 1 1 1 1 1 1 1 1 1 1 1 1 1 1 1 1 1 36
CAD Operator 1 1 1 1 1 1 1 1 1 1 1 1 1 1 1 1 1 1 1 1 1 1 1 1 1 1 1 1 1 1 1 1 1 1 1 1 1 1 1 1 1 1 1 1 1 1 1 1 1 1 1 1 1 1 1 1 1 1 1 1 1 1 1 1 63
CAD Operator 2 1 1 1 1 1 1 1 1 1 1 1 1 1 1 1 1 1 1 1 1 1 1 1 1 1 1 1 1 1 1 1 1 1 1 1 1 36
CAD Operator 3 1 1 1 1 1 1 1 1 1 1 1 1 1 1 1 1 1 1 1 1 1 1 1 1 1 1 1 1 1 1 1 1 1 1 1 1 36
Agriculture Assistant 1 (OFC) 1 1 1 1 1 1 1 1 1 1 1 1 1 1 1 1 1 1 1 1 1 1 1 1 1 1 1 1 1 1 1 1 1 1 1 1 1 1 1 1 1 1 1 1 1 1 1 1 1 1 1 1 1 1 1 1 1 1 1 1 1 1 1 1 1 1 66
Agriculture Assistant 2 (Fruits) 1 1 1 1 1 1 1 1 1 1 1 1 1 1 1 1 1 1 1 1 1 1 1 1 1 1 1 1 1 1 1 1 1 1 1 1 1 1 1 1 1 1 1 1 1 1 1 1 1 1 1 1 1 1 1 1 1 1 1 1 1 1 1 1 1 1 66
Livestock Assistant 1 1 1 1 1 1 1 1 1 1 1 1 1 1 1 1 1 1 1 1 1 1 1 1 1 1 1 1 1 1 1 1 1 1 1 1 1 1 1 1 1 1 1 1 1 1 1 1 1 1 1 1 1 1 1 1 1 1 1 1 1 1 1 1 1 1 66
Supporting StaffAccounting / Office Manager / Procurement 1 1 1 1 1 1 1 1 1 1 1 1 1 1 1 1 1 1 1 1 1 1 1 1 1 1 1 1 1 1 1 1 1 1 1 1 1 1 1 1 1 1 1 1 1 1 1 1 1 1 1 1 1 1 1 1 1 1 1 1 1 1 1 1 1 1 1 1 1 1 1 1 1 1 74
Clerk 1 1 1 1 1 1 1 1 1 1 1 1 1 1 1 1 1 1 1 1 1 1 1 1 1 1 1 1 1 1 1 1 1 1 1 1 1 1 1 1 1 1 1 1 1 1 1 1 1 1 1 1 1 1 1 1 1 1 1 1 1 1 1 1 1 1 1 1 1 1 1 1 1 1 74
Secretary 1 1 1 1 1 1 1 1 1 1 1 1 1 1 1 1 1 1 1 1 1 1 1 1 1 1 1 1 1 1 1 1 1 1 1 1 1 1 1 1 1 1 1 1 1 1 1 1 1 1 1 1 1 1 1 1 1 1 1 1 1 1 1 1 1 1 1 1 1 1 1 1 1 1 74
Computer Operator A 1 1 1 1 1 1 1 1 1 1 1 1 1 1 1 1 1 1 1 1 1 1 1 1 1 1 1 1 1 1 1 1 1 1 1 1 1 1 1 1 1 1 1 1 1 1 1 1 1 1 1 1 1 1 1 1 1 1 1 1 1 1 1 1 1 1 1 1 1 1 1 1 1 1 74
Office Aid 1 1 1 1 1 1 1 1 1 1 1 1 1 1 1 1 1 1 1 1 1 1 1 1 1 1 1 1 1 1 1 1 1 1 1 1 1 1 1 1 1 1 1 1 1 1 1 1 1 1 1 1 1 1 1 1 1 1 1 1 1 1 1 1 1 1 1 1 1 1 1 1 1 1 74
Driver 1 1 1 1 1 1 1 1 1 1 1 1 1 1 1 1 1 1 1 1 1 1 1 1 1 1 1 1 1 1 1 1 1 1 1 1 1 1 1 1 1 1 1 1 1 1 1 1 1 1 1 1 1 1 1 1 1 1 1 1 1 1 1 1 1 1 1 1 1 1 1 1 1 1 1 74
Driver 2 1 1 1 1 1 1 1 1 1 1 1 1 1 1 1 1 1 1 1 1 1 1 1 1 1 1 1 1 1 1 1 1 1 1 1 1 1 1 1 1 1 1 1 1 1 1 1 1 1 1 1 1 1 1 1 1 1 1 1 1 1 1 1 1 1 1 1 1 1 1 1 1 1 1 74
Driver 3 1 1 1 1 1 1 1 1 1 1 1 1 1 1 1 1 1 1 1 1 1 1 1 1 1 1 1 1 1 1 1 1 1 1 1 1 1 1 1 1 1 1 1 1 1 1 1 1 1 1 50
Driver 4 1 1 1 1 1 1 1 1 1 1 1 1 1 1 1 1 1 1 1 1 1 1 1 1 1 1 1 1 1 1 1 1 1 1 1 1 1 1 38
0 359 822 606
6.PIU UVAProfessional B
Agriculture Marketing 1 1 1 1 1 1 1 1 1 1 1 1 1 1 1 1 1 1 1 1 1 1 1 1 1 1 1 1 1 1 1 1 1 1 1 1 1 1 1 1 1 1 1 1 1 1 1 1 1 1 1 1 1 1 1 1 1 1 1 1 1 1 1 1 1 1 1 1 1 1 1 1 1 1 74
Agriculture Extension (OFC & Vegetable) 1 1 1 1 1 1 1 1 1 1 1 1 1 1 1 1 1 1 1 1 1 1 1 1 1 1 1 1 1 1 1 1 1 1 1 1 1 1 1 1 1 1 1 1 1 1 1 1 1 1 1 1 1 1 1 1 1 1 1 1 1 1 1 1 1 1 1 1 1 1 1 1 1 1 74
Agriculture Extension (Fruits) 1 1 1 1 1 1 1 1 1 1 1 1 1 1 1 1 1 1 1 1 1 1 1 1 1 1 1 1 1 1 1 1 1 1 1 1 1 1 1 1 1 1 1 1 1 1 1 1 1 1 1 1 1 1 1 1 1 1 1 1 1 1 1 1 1 1 1 1 1 1 1 1 1 1 74
Livestock Expert 1 1 1 1 1 1 1 1 1 1 1 1 1 1 1 1 1 1 18
Sub ProfessionalAgriculture Assistant 1 (OFC) 1 1 1 1 1 1 1 1 1 1 1 1 1 1 1 1 1 1 1 1 1 1 1 1 1 1 1 1 1 1 1 1 1 1 1 1 1 1 1 1 1 1 1 1 1 1 1 1 1 1 1 1 1 1 1 1 1 1 1 1 1 1 1 1 1 1 66
Agriculture Assistant 2 (Fruits) 1 1 1 1 1 1 1 1 1 1 1 1 1 1 1 1 1 1 1 1 1 1 1 1 1 1 1 1 1 1 1 1 1 1 1 1 1 1 1 1 1 1 1 1 1 1 1 1 1 1 1 1 1 1 1 1 1 1 1 1 1 1 1 1 1 1 66
Livestock Assistant 1 1 1 1 1 1 1 1 1 1 1 1 1 1 1 1 1 1 1 1 1 1 1 1 1 1 1 1 1 1 1 1 1 1 1 1 1 1 1 1 1 1 1 1 1 1 1 1 1 1 1 1 1 1 1 1 1 1 1 1 1 1 1 1 1 1 66
Supporting StaffAccounting / Office Manager / Procurement 1 1 1 1 1 1 1 1 1 1 1 1 1 1 1 1 1 1 1 1 1 1 1 1 1 1 1 1 1 1 1 1 1 1 1 1 1 1 1 1 1 1 1 1 1 1 1 1 1 1 1 1 1 1 1 1 1 1 1 1 1 1 1 1 1 1 1 1 1 1 1 1 1 1 74
Clerk 1 1 1 1 1 1 1 1 1 1 1 1 1 1 1 1 1 1 1 1 1 1 1 1 1 1 1 1 1 1 1 1 1 1 1 1 1 1 1 1 1 1 1 1 1 1 1 1 1 1 1 1 1 1 1 1 1 1 1 1 1 1 1 1 1 1 1 1 1 1 1 1 1 1 74
Secretary 1 1 1 1 1 1 1 1 1 1 1 1 1 1 1 1 1 1 1 1 1 1 1 1 1 1 1 1 1 1 1 1 1 1 1 1 1 1 1 1 1 1 1 1 1 1 1 1 1 1 1 1 1 1 1 1 1 1 1 1 1 1 1 1 1 1 1 1 1 1 1 1 1 1 74
Office Aid 1 1 1 1 1 1 1 1 1 1 1 1 1 1 1 1 1 1 1 1 1 1 1 1 1 1 1 1 1 1 1 1 1 1 1 1 1 1 1 1 1 1 1 1 1 1 1 1 1 1 1 1 1 1 1 1 1 1 1 1 1 1 1 1 1 1 1 1 1 1 1 1 1 1 74
Driver 1 1 1 1 1 1 1 1 1 1 1 1 1 1 1 1 1 1 1 1 1 1 1 1 1 1 1 1 1 1 1 1 1 1 1 1 1 1 1 1 1 1 1 1 1 1 1 1 1 1 1 1 1 1 1 1 1 1 1 1 1 1 1 1 1 1 1 1 1 1 1 1 1 1 1 74
Driver 2 1 1 1 1 1 1 1 1 1 1 1 1 1 1 1 1 1 1 1 1 1 1 1 1 1 1 1 1 1 1 1 1 1 1 1 1 1 1 1 1 1 1 1 1 1 1 1 1 1 1 1 1 1 1 1 1 1 1 1 1 1 1 1 1 1 1 1 1 1 1 1 1 1 1 74
0 240 198 444
Grand Total 122 1941 3463 3458
5th Year 6th Year 7th Year 8th Year M/M
ProfessionalProfessional / Sub-professional /
Supporting Staff
1st Year 2nd Year 3rd Year 4th Year
Total
Total
Figure A
5.2 Assignm
ent Schedule of Consultants (4/4)

The Preparatory Survey on the Project for Improvement of Agricultural Production and Productivity in Dry Zone Areas in Democratic Socialist Republic of Sri Lanka
Final Report
ANNEXED TABLES

The Preparatory Survey on the Project for Improvement of Agricultural Production and Productivity in Dry Zone Areas in Democratic Socialist Republic of Sri Lanka
Final Report
List of Tables Table A 2.1 Sri Lanka's Socio-economic Indices .................................................................. T 2-1 Table A 2.2 Production, Import & Export and Domestic Supply Quantities of
Agriculture Products, and Food Supply Quantities in 2002 and 2007 ............... T 2-2 Table A 2.3 Activity Output Matrix: Development of the Agriculture Sector ...................... T 2-3 Table A 2.4 Investment Programme for Agriculture Sector (Corporate Plan of the
Ministry of Agriculture) ..................................................................................... T 2-4 Table A 2.5 National Livestock Development Plan .............................................................. T 2-5 Table A 2.6 Investment Program in Dairy Sector ................................................................ T 2-11 Table A 2.7 Expected Annual Milestones in Dairy Sector .................................................. T 2-11 Table A 2.8 On-going Irrigation Project .............................................................................. T 2-12 Table A 2.9 New Irrigation Project...................................................................................... T 2-13 Table A 2.10 Provincial Development Policy and Programs ................................................ T 2-14
Table A 3.1 Province Specific Development Grant (PSDG) - 2005 to 2010 ........................ T 3-1 Table A 3.2 Employment Status by District based on Results of Sri Lanka Labor Force
Survey 2004 ....................................................................................................... T 3-6 Table A 3.3 Description of Agro-Ecological Region ............................................................. T 3-7 Table A 3.4 Summary of Climate Zone and Agro-Eco Zone ................................................ T 3-9 Table A 3.5 District-wise Surface Water Discharge Volume to Sea .................................... T 3-10 Table A 3.6 Present Land Use in the Survey Area .............................................................. T 3-11 Table A 3.7 Agricultural Holdings and their Land Extent by District in 2002 .................... T 3-12 Table A 3.8 Land Holding and Ownership of Small Holdings in the Survey Area (2002) . T 3-13 Table A 3.9 Production of Paddy and OFCs in the Survey Area in Maha 2008/09 and
Yala 2009 ......................................................................................................... T 3-14 Table A 3.10 Vegetable Production in the Survey Area in 2006 ........................................... T 3-20 Table A 3.11 Fruits Production in the Survey Area in 2006 .................................................. T 3-22 Table A 3.12 OFC Cultivation and Production in Target Districts (Maha Cultivation) ........ T 3-23 Table A 3.13 OFC Cultivation and Production in Target Districts (Yala Cultivation) .......... T 3-24 Table A 3.14 Vegetable Cultivation and Production in Target Districts (Maha Cultivation) T 3-26 Table A 3.15 Vegetable Cultivation and Production in Target Districts (Yala Cultivation) .. T 3-27 Table A 3.16 Fruits Cultivation and Production in Target Districts (Annual Production) .... T 3-28 Table A 3.17 Duty Changes of Other Field Crops 2000 – 2009 ............................................ T 3-29 Table A 3.18 Dedicated Economic Centres ........................................................................... T 3-31 Table A 3.19 Import and Export Information of Selected Commodity : Average of 2000 -
2009 (except 2006 & 2007) ............................................................................. T 3-32 Table A 3.20 Crop Budget per Hectare for OFC, Paddy and Vegetables under Present
Conditions ........................................................................................................ T 3-33 Table A 3.21 Crop Budget per Hectare for Fruits under Present Condition .......................... T 3-36 Table A 3.22 2012 Farmgate Prices of Farm Products and Inputs ........................................ T 3-45 Table A 3.23 Number of Vaccination .................................................................................... T 3-46 Table A 3.24 Summary of CBOs in Rural Communities ...................................................... T 3-47 Table A 3.25 Northern Province Forest Conservation Areas within Project Areas ............... T 3-51
Table A 4.1 Result of Selection of Priority Site for Project Implementation ........................ T 4-1 Table A 4.2 Candidate DS Division for Project Implementation .......................................... T 4-4 Table A 4.3 Target Development Areas by Strategic Crop and DS Division in Each
Province ............................................................................................................. T 4-5 Table A 4.4 Crop Budget per Hectare for OFC under With-project Conditions in
Financial Prices .................................................................................................. T 4-6 Table A 4.5 Crop Budget per Hectare for Fruits under With-project Condition in
Financial Prices .................................................................................................. T 4-8 Table A 4.6 Target Development Areas by Strategic Crop and DS Division in Each
Zone ................................................................................................................. T 4-14 Table A 4.7 Overall Problem Analysis ................................................................................ T 4-16

The Preparatory Survey on the Project for Improvement of Agricultural Production and Productivity in Dry Zone Areas in Democratic Socialist Republic of Sri Lanka
Final Report
Table A 4.8 Prioritized Approaches and Activities - Malwanegama (North-Central) ...... T 4-19 Table A 4.9 Prioritized Approaches and Activities Thiriyay (Eastern) .......................... T 4-21 Table A 4.10 Prioritized Approaches and Activities - Saliyawewa (North-Western) ......... T 4-22 Table A 4.11 Prioritized Approaches and Activities - Thenagallanda (Uva) ......................... T 4-23 Table A 4.12 Prioritized Approaches and Activities - Periyapandivirichchan (Northern)..... T 4-24
Table A 5.1 Screening of the Irrigation Schemes .................................................................. T 5-1 Table A 5.2 Farmer Training Program on Production of Self-seed and Cetified Seed for
OFCs and Planting Material for Fruits ............................................................. T 5-12 Table A 5.3 Farmer Training Program on Farm Management Technology ......................... T 5-13 Table A 5.4 Farmer Training Program on Crop Production Technology ............................. T 5-16 Table A 5.5 Number of farm machineries Required for OFCs
Production and Processing ............................................................................... T 5-17 Table A 5.6 Estimate of Barbed Wire Fence Requirement by Districts and Zones ............. T 5-18 Table A 5.7 Estimate of Electric Fence (EF) Requirement by Districts and Zones ............ T 5-19 Table A 5.8 Number of Farmers Whose Storage Facilities are Needed to be Improved ..... T 5-20 Table A 5.9 Training of Trainers Program on Farm Management Improvement ................ T 5-21 Table A 5.10 Training of Trainers Program on Crop Production Improvement .................... T 5-22 Table A 5.11 Outline of Training on Feeding Improvement. ................................................ T 5-24 Table A 5.12 Outline of Training on Clean Milk Production and Market Network
Development .................................................................................................... T 5-25 Table A 5.13 List of Prescribed Projects to be required to carry out IEE/EIA ...................... T 5-26 Table A 5.14 List of Sensitive Sectors, Characteristics, and Areas ....................................... T 5-29 Table A 5.15 Check list of Environmental and Social Management System ........................ T 5-30 Table A 5.16 Format for Environmental and Social Screening ............................................. T 5-33 Table A 5.17 Environmental and Social Categorization: Definition of Categorization ..... T 5-35 Table A 5.18 Criteria for Project Components Selection ...................................................... T 5-36 Table A 5.19 Indigenous People Planning Framework ......................................................... T 5-37 Table A 5.20 Outline of an Abbreviated Resettlement Action Plan for Project Component . T 5-44 Table A 5.21 Outline of an Annual Environmental and Social Performance Report to
JICA ................................................................................................................. T 5-45 Table A 5.22 Qualification and Job Description of Experts. ................................................. T 5-46 Table A 5.23 Breakdown of Total Project Cost ..................................................................... T 5-48 Table A 5.24 Cost Breakdown for Program Cost by Zone .................................................... T 5-49 Table A 5.25 Breakdown of Consulting Service Cost ........................................................... T 5-52 Table A 5.26 Detailed Annual Disbursement Schedule ......................................................... T 5-53
Table A 6.1 Economic Prices of Crops and Fertilizers .......................................................... T 6-1 Table A 6.2 Economic Price of Paddy ................................................................................... T 6-2 Table A 6.3 Economic Price of Maize ................................................................................... T 6-2 Table A 6.4 Economic Price of Soybeans ............................................................................. T 6-3 Table A 6.5 Economic Farmgate Prices of Fertilizers ........................................................... T 6-3 Table A 6.6 Economic Crop Budget of OFC, Paddy and Vegetables per Hectare under
With-project Conditions ..................................................................................... T 6-4 Table A 6.7 Economic Crop Budget of OFC, Paddy and Vegetables per Hectare under
Without-project Conditions .............................................................................. T 6-13 Table A 6.8 Basic Production Data of Livestock Sector ..................................................... T 6-22 Table A 6.9 Farm Budget of Livestock Sector by each Production Style ........................... T 6-22 Table A 6.10 Calculation of EIRR and B/C .......................................................................... T 6-23

The Preparatory Survey on the Project for Improvement of Agricultural Production and Productivity in Dry Zone Areas in Democratic Socialist Republic of Sri Lanka
Final Report
T2-1
Table A 2.1 Sri Lanka's Socio-economic Indices
Item Unit 2004 2005 2006 2007 2008 2009 2010
1. Demography and Labour Force1) Estimated mid. Year population (1,000 prns) 19,462 19,668 19,886 20,010 20,217 20,450 20,6532) Population growth rate (%) 1.2 1.0 1.1 1.1 1.0 1.1 1.03) Population density (prns/km2) 310 314 317 319 322 326 329
- Land area (km2) 62,705 62,705 62,705 62,705 62,705 62,705 62,705 (excluding large inland waters)
4) Labour force a/- Household population (10 years & over) (1,000 prns) 16,593 16,871 14,834 15,048 16,320 16,578 16,862- Total labour force (1,000 prns) 8,061 8,141 7,599 7,489 8,082 8,074 8,108- Labour force participation rate (%) 48.6 48.3 51.2 49.8 49.5 48.7 48.1- Labour force employed (1,000 prns) 7,394 7,518 7,105 7,042 7,648 7,602 7,707
of which Agriculture, forestry and fishery (1,000 prns) 2,477 2,278 2,288 2,204 2,501 2,478 2,520(Percentage in labour force employed) (%) 33.5 30.3 32.2 31.3 32.7 32.6 32.7
- Labour force unemployed (1,000 prns) 667 623 493 447 434 471 401Unemployment rate (%) 8.3 7.7 6.5 6.0 5.4 5.8 4.9
2. National Output1) GDP at current market prices (Rs.billion) 2,091 2,453 2,939 3,579 4,411 4,825 5,602
(US$ billion) 20.7 24.4 28.3 32.7 40.7 42.1 49.52) GNP at current market prices (Rs.billion) 2,070 2,423 2,898 3,540 4,306 4,779 5,530
(US$ billion) 20.5 24.1 27.9 32.0 39.7 41.6 48.93) GDP at constant (2002) market prices (Rs.billion) 1,828 1,942 2,091 2,233 2,366 2,449 2,6454) GNP at constant (2002) market prices (Rs.billion) 1,809 1,918 2,062 2,208 2,309 2,421 2,6125) GDP Growth Rate (at constant prices) (%) 5.4 6.2 7.7 6.8 6.0 3.5 8.06) Per capita GDP at current market prices (Rs.) 107,432 124,709 147,776 178,845 218,167 236,445 271,259
Per capita GDP at current market prices (US$) 1,062 1,241 1,421 1,617 2,014 2,057 2,3997) Per capita GNP at current market prices (Rs.) 106,367 123,181 145,744 176,893 212,972 233,716 267,780
Per capita GNP at current market prices (US$) 1,051 1,226 1,402 1,599 1,966 2,033 2,3688) GDP by industry at current factor cost price
- Agriculture, forestry and fishing (%) 12.5 11.8 11.3 11.7 13.4 12.7 12.8- Mining and quarrying (%) 1.4 1.5 1.6 1.6 1.6 1.6 1.6- Manufactureing (%) 18.7 19.5 19.2 18.5 18.0 18.1 18.0- Electricity, gas, and water (%) 2.3 2.4 2.5 2.5 2.4 2.4 2.3- Construction (%) 6.1 6.8 7.4 7.4 7.4 7.6 7.6- Wholesale and retail trade (%) 24.6 23.2 22.4 22.1 21.5 19.6 19.6- Restaurants and Hotels (%) 0.6 0.6 0.6 0.5 0.5 0.5 0.6- Transport and communication (%) 11.5 11.7 11.7 11.8 12.0 12.4 12.7- Banking, insurance and real estate, etc. (%) 8.5 8.4 9.1 9.2 9.4 10.3 10.7- Ownership of dwellings (%) 3.7 3.6 3.5 3.5 3.2 3.3 3.1- Government services (%) 7.8 8.4 8.8 9.3 8.6 9.2 8.9- Private services (%) 2.2 2.1 1.9 1.9 2.0 2.2 2.3
Total (%) 100.0 100.0 100.0 100.0 100.0 100.0 100.03. Balance of Payments
1) Merchandise trade (US$ million) -2,243 -2,516 -3,370 -3,656 -5,981 -3,122 -5,205Exports (f.o.b.) (US$ million) 5,757 6,347 6,883 7,640 8,111 7,085 8,307Imports (c.i.f.) (US$ million) 8,000 8,863 10,253 11,296 14,091 10,207 13,512
2) Services (net) (US$ million) 419 338 257 302 401 391 6983) Income (net) (US$ million) -204 -299 -389 -358 -972 -488 -5724) Goods, Services and Income (1+2+3) (US$ million) -2,028 -2,477 -3,502 -3,712 -6,552 -3,219 -5,0795) Current Transfers (net) (US$ million) 1,380 1,828 2,004 2,311 2,666 3,005 3,6606) Current Account Balance (4+5) (US$ million) -648 -650 -1,499 -1,402 -3,886 -214 -1,4187) Capital and Financial Account (US$ million) 631 1,224 1,808 2,097 1,773 2,594 2,8768) Errors and omissions (US$ million) -189 -72 -105 -165 728 346 -5379) Overall Balance (6+7+8) (US$ million) -205 501 204 531 -1,385 2,725 921
Exchange Rate (Rs./US$) 101 101 104 111 108 115 113Ratio to GDP in percentage
Trade account (%) -10.9 -10.3 -11.9 -11.3 -14.7 -7.4 -10.5Current account (%) -3.1 -2.7 -5.3 -4.3 -9.5 -0.5 -2.9Current account without Grants (%) -3.3 -3.0 -5.7 -4.6 -9.8 -0.7 -3.0
Note: a/; Mullaitive and Kilinochchi districts are excluded in 2004, all the districts are included in 2005, Northern and Eastern provinces are excluded in 2007, and Eastern province is included but Northern province is excluded in 2008, 2009 and 2010.
Source: Economic and Social Statistics of Sri Lanka 2011, Central Bank of Sri Lanka

The Preparatory Survey on the Project for Improvement of Agricultural Production and Productivity in Dry Zone Areas in Democratic Socialist Republic of Sri Lanka
Final Report
T2-2
Table A 2.2 Production, Import & Export and Domestic Supply Quantities of Agriculture Products, and Food Supply Quantities in 2002 and 2007
Production Import Quantity Export Quantity Domestic supply quantity Food supply quantity
item 2002 2007 Ave.Growth
2002 2007 Ave.Growth
2002 2007 Ave.Growth
2002 2007 Ave.Growth
2002 2007 Ave.Growth
(1000 tons) (1000 tons) (% p.a.) (1000 tons) (1000 tons) (% p.a.) (1000 tons) (1000 tons) (% p.a.) (1000 tons) (1000 tons) (% p.a.) (kg/capita/yr)
(kg/capita/yr)
(% p.a.)
Cereals - Excluding Beer + (Total) 1,938 2,150 2.10 1,307 1,199 -1.71 10 191 80.39 3,012 3,190 1.15 145.6 143.5 -0.29Wheat - 1,103 986 -2.22 7 185 92.49 926 901 -0.55 47.4 44.1 -1.43Rice (Milled Equivalent) 1,907 2,088 1.83 93 109 3.23 3 6 14.87 1,945 2,123 1.77 92.7 97.3 0.97Barley - 8 12 8.45 0 0 - 9 11 4.10 0.1 0.0 -100.00Maize 26 56 16.59 99 88 -2.33 0 0 - 125 145 3.01 5.0 1.6 -20.38Millet 4 6 8.45 3 4 5.92 0 0 - 7 9 5.15 0.3 0.5 10.76Cereals, Other - 0 1 - 0 0 - 0 1 - 0.0 0.0 - Starchy Roots + (Total) 361 346 -0.85 69 90 5.46 5 1 -27.52 425 436 0.51 15.9 15.6 -0.38Cassava 225 220 -0.45 21 22 0.93 5 0 -100.00 241 242 0.08 8.3 7.7 -1.49Potatoes 89 77 -2.86 47 68 7.67 0 0 - 136 145 1.29 5.8 6.1 1.01Sweet Potatoes 47 49 0.84 0 0 - 0 0 - 47 49 0.84 1.7 1.7 0.00Roots, Other - 1 0 -100.00 1 0 -100.00 0 0 - 0.0 0.0 - Sugarcrops + (Total) 963 783 -4.05 0 0 - - 963 783 -4.05 32.3 24.1 -5.69Sugar Cane 963 783 -4.05 0 0 - - 963 783 -4.05 32.3 24.1 -5.69Sugar & Sweeteners + (Total) 39 33 -3.29 619 577 -1.40 1 2 14.87 622 519 -3.56 31.7 25.0 -4.64Sugar, Non-Centrifugal 1 2 14.87 - - 1 2 14.87 0.1 0.1 0.00Sugar (Raw Equivalent) 38 32 -3.38 612 570 -1.41 0 1 - 615 511 -3.64 31.3 24.6 -4.70Sweeteners, Other - 7 7 0.00 0 1 - 6 6 0.00 0.3 0.3 0.00Pulses + (Total) 21 20 -0.97 157 155 -0.26 0 0 - 178 174 -0.45 8.0 8.0 0.00Beans 10 9 -2.09 14 8 -10.59 0 0 - 25 17 -7.42 1.2 0.8 -7.79Peas - 18 25 6.79 0 0 - 18 25 6.79 0.9 1.2 5.92Pulses, Other 10 11 1.92 124 122 -0.32 0 0 - 135 132 -0.45 5.8 5.9 0.34Treenuts + (Total) 17 33 14.19 1 0 -100.00 1 2 14.87 17 31 12.77 0.6 1.1 12.89Oilcrops + (Total) 1,827 2,199 3.78 17 12 -6.73 245 261 1.27 1,604 1,898 3.42 60.3 63.9 1.17Soyabeans 1 5 37.97 4 1 -24.21 0 0 - 5 5 0.00 0.0 0.0 - Groundnuts (Shelled Eq) 4 7 11.84 5 3 -9.71 4 2 -12.94 6 8 5.92 0.2 0.3 8.45Rape and Mustardseed 0 0 - 1 1 0.00 0 0 - 2 1 -12.94 0.1 0.1 0.00Coconuts - Incl Copra 1,818 2,181 3.71 6 1 -30.12 242 259 1.37 1,588 1,871 3.33 59.9 63.0 1.01Sesameseed 4 6 8.45 0 1 - 0 0 - 4 7 11.84 0.2 0.3 8.45Oilcrops, Other - 0 5 - 0 0 - 0 5 - 0.0 0.2 - Vegetable Oils + (Total) 38 76 14.87 168 367 16.92 3 106 104.00 177 356 15.00 2.5 4.1 10.40Soyabean Oil 1 1 0.00 0 2 - 0 0 - 1 2 14.87 0.1 0.1 0.00Groundnut Oil 1 1 0.00 0 0 - 0 0 - 1 1 0.00 0.0 0.0 - Palmkernel Oil - 37 8 -26.38 0 0 - 22 17 -5.03 0.1 0.2 14.87Palm Oil - 96 341 28.85 1 14 69.52 95 327 28.05 - Coconut Oil 30 67 17.43 34 5 -31.84 3 91 97.87 50 -100.00 2.0 3.4 11.20Sesameseed Oil 0 0 - 0 1 - 0 0 - 0 1 - 0.0 0.1 - Ricebran Oil 6 6 0.00 - - 6 6 0.00 0.3 0.3 0.00Oilcrops Oil, Other 1 1 0.00 0 9 - 0 0 - 2 9 35.10 - Vegetables + (Total) 531 734 6.69 157 191 4.00 12 18 8.45 676 906 6.03 30.9 40.1 5.35Tomatoes 41 65 9.65 3 4 5.92 0 1 - 44 68 9.10 2.0 2.9 7.71Onions 67 149 17.33 134 143 1.31 0 0 - 201 292 7.75 9.0 12.7 7.13Vegetables, Other 423 519 4.18 21 44 15.94 12 17 7.21 431 547 4.88 19.9 24.5 4.25Fruits - Excluding Wine + (Total) 830 728 -2.59 62 35 -10.81 25 27 1.55 867 736 -3.22 35.5 27.2 -5.19Oranges, Mandarines 6 6 0.00 13 7 -11.65 0 0 - 18 13 -6.30 0.9 0.6 -7.79Lemons, Limes 21 5 -24.95 0 0 - 0 1 - 21 4 -28.23 1.1 0.2 -28.89Plantains 590 519 -2.53 - 0 0 - 590 519 -2.53 22.6 17.4 -5.10Apples - 20 19 -1.02 0 0 - 20 19 -1.02 1.1 0.9 -3.93Pineapples 51 53 0.77 0 0 - 3 3 0.00 48 51 1.22 2.1 2.1 0.00Dates - 12 0 -100.00 0 0 - 12 0 -100.00 0.6 0.0 -100.00Grapes - 12 4 -19.73 0 0 - 12 4 -19.73 0.6 0.2 -19.73Fruits, Other 162 145 -2.19 4 4 0.00 22 23 0.89 145 126 -2.77 6.4 5.6 -2.64Stimulants + (Total) 323 313 -0.63 6 19 25.93 292 194 -7.85 29 137 36.42 1.6 7.0 34.34Coffee 10 6 -9.71 0 1 - 0 0 - 10 6 -9.71 0.5 0.3 -9.71Cocoa Beans 3 1 -19.73 2 5 20.11 0 1 - 5 5 0.00 0.3 0.3 0.00Tea 310 305 -0.32 4 14 28.47 292 193 -7.95 14 126 55.18 0.8 6.5 52.04Spices + (Total) 46 48 0.85 48 54 2.38 25 26 0.79 69 76 1.95 3.6 3.9 1.61Pepper 18 19 1.09 0 0 - 8 7 -2.64 10 12 3.71 0.5 0.6 3.71Pimento - 25 33 5.71 0 0 - 25 33 5.71 1.3 1.6 4.24Cloves 4 3 -5.59 0 0 - 4 5 4.56 0 - 0.0 0.0 - Spices, Other 24 26 1.61 23 21 -1.80 13 15 2.90 34 33 -0.60 1.8 1.7 -1.14Alcoholic Beverages + (Total) 47 54 2.82 14 17 3.96 0 1 - 60 70 3.13 2.6 2.8 1.49Wine - 1 1 0.00 0 0 - 1 1 0.00 0.0 0.0 - Beer 43 50 3.06 1 1 0.00 0 1 - 43 50 3.06 2.3 2.5 1.68Beverages, Alcoholic 4 4 0.00 1 2 14.87 0 0 - 5 6 3.71 0.3 0.3 0.00Alcohol, Non-Food - 11 13 3.40 0 0 - 11 13 3.40 - Meat + (Total) 121 131 1.60 2 5 20.11 1 1 0.00 122 135 2.05 6.4 6.8 1.22Bovine Meat 31 27 -2.73 0 0 - 0 0 - 31 28 -2.02 1.6 1.4 -2.64Mutton & Goat Meat 2 1 -12.94 1 0 -100.00 0 0 - 2 2 0.00 0.1 0.1 0.00Pigmeat 2 2 0.00 0 1 - 0 1 - 2 2 0.00 0.1 0.1 0.00Poultry Meat 86 100 3.06 2 4 14.87 0 0 - 87 104 3.63 4.6 5.2 2.48Offals + (Total) 13 14 1.49 0 0 - 0 0 - 13 14 1.49 0.7 0.7 0.00Animal Fats + (Total) 2 2 0.00 16 28 11.84 0 1 - 18 29 10.01 0.8 1.4 11.84Butter, Ghee 1 1 0.00 1 1 0.00 0 0 - 1 2 14.87 0.1 0.1 0.00Fats, Animals, Raw 1 1 0.00 15 27 12.47 0 1 - 16 27 11.03 0.7 1.4 14.87Eggs + (Total) 51 52 0.39 0 1 - 0 0 - 50 52 0.79 2.2 2.2 0.00Milk - Excluding Butter + (Total) 160 176 1.92 519 563 1.64 1 11 61.54 677 727 1.44 34.9 36.1 0.68Fish, Seafood + (Total) 300 318 1.17 172 174 0.23 14 26 13.18 458 465 0.30 21.8 21.7 -0.09Freshwater Fish 26 43 10.59 0 1 - 1 0 -100.00 25 43 11.46 1.3 2.2 11.10Demersal Fish 49 18 -18.15 0 10 - 5 7 6.96 44 22 -12.94 2.3 1.1 -13.72Pelagic Fish 206 227 1.96 171 161 -1.20 3 11 29.67 374 377 0.16 17.4 17.3 -0.12Marine Fish, Other 8 15 13.40 0 0 - 0 3 - 8 13 10.20 0.4 0.6 8.45Crustaceans 10 13 5.39 0 1 - 5 5 0.00 6 9 8.45 0.3 0.5 10.76Memo itemPopulation x1000 persons 19,040 19,882 0.87 19,040 19,882 0.87 19,040 19,882 0.87 19,040 19,882 0.87 19,040 19,882 0.87
Note: Product/food item with matrix performed higher increase in per capita consumption than the Sri Lanka's population increase rate of 0.87% p.a. during 2002-2007 period.Source: FAOSTAT

The Preparatory Survey on the Project for Improvement of Agricultural Production and Productivity in Dry Zone Areas in Democratic Socialist Republic of Sri Lanka
Final Report
T2-3
Table A 2.3 Activity Output Matrix: Development of the Agriculture Sector Policy Thrust Intervention Key Indicator Present Status Anticipated Targets
2015 2020 Production and productivity increase of agriculture products to ensure the food security of people and to export the surplus
Paddy Provision of improved seeds, planting materials and other inputs with modern technology Expansion of the extent of the cultivable Land Provision of water supply through the 10,000 tank programme and the mega irrigation projects
Productivity of paddy lands Annual production of paddy Provision of quality seed paddy Import of wheat flour (tons) Extent of abandoned paddy lands (ha) Cropping intensity
4.3 tons/ha 3.64 million tons 35% 662,000 100,000 120%
5.5 tons/ha 6.5 million tons 60% 350,000 30,000 140%
6.5 tons/ha 8.2 million tons 100% 130,000 0 160%.
Other Field Crops (OFC) Modernization of research institutes and seed farms to cater to the demand for seed and the requirements of planting material Land will be provided to private parties to augment the cultivation of cereals, tubers and pulses
No of seed farms modernized Additional amount of lands provided for cultivation
Farms are under utilized (19) OFC - 10,000 ha.
50% of the farms (10) 0.1 million ha
All seed farms (19) 0.1 million ha of lands will be cultivated
Horticulture Crops Increase of vegetable production by reducing post harvest losses and ensuring the price stability by making a direct connection between producer and consumer.
Vegetable production
0.58 million tons
1.2 million tons
1.5 million tons
Establishment of new floriculture villages for increase in export revenue Establishment of orchards based on Joint collaboration between farmers and private entrepreneurs
No of floriculture villages established No of orchards established
Only a few farms are operational at present. At present the concept of fruit zoning is limited to a few locations
600 floriculture villages 5 orchards of 200 ha each will be established
1500 floriculture villages 10 orchards
Creation of a knowledge based farming society
Enhancement of institutional capacity Development of the agricultural information system through Agrarian Service Centres (ASC)
No of ASCs modernized and developed.
80 ASCs have already been covered
Cover 350 ASCs
Cover all ASCs (552)
Research and development will be oriented towards the demand driven approaches which arise due to actual needs of the people and the sector
Promotion of traditional rice varieties among farmers Development of research institutes and regional research centres Improvement of agricultural biodiversityAcceleration of breeding programmes among traditional varieties Strengthen extension activities and close the research gap
Extent of cultivation No of institutes
24,000 ha To be improved
35,000 ha All institutes (13) will be developed
50,000 ha
Processing and value addition
Export of value added agricultural products and establishment of new fruit and vegetable processing factories Post harvest losses are minimized with the introduction of crates and modern technology
No of factories established Percent of post harvest loss
- 30-35%
5 5%
16 2%
Integration of marketing channel
Maintain a buffer stock of paddy and strengthen storage capacity
Stock to be stored 250,000 tons 750,000 tons 1.3 million tons
Promotion of commercial agriculture Development of contracts and cooperative farming
Introduction of bar code system No of commercial farms
Only a few farms are operational at present 500
20% 1500
50% 3000
Source: Mahinda Chintana, 2010

The Preparatory Survey on the P
roject for Improvem
ent of Agricultural P
roduction and Productivity
in Dry Zone A
reas in Dem
ocratic Socialist Republic of Sri Lanka
Final R
eport
T2-4
Table A
2.4 Investm
ent Programm
e for Agriculture Sector
(Corporate Plan of the M
inistry of Agriculture)
Budget (Rs. Million)2011 2012 2013 2014 2015 Total
1. 1.1 To review and update the National Agriculture Policy (NAP) and National Agriculture Research Policy (NARPol) 0.3 1.5 1.0 1.0 1.1 4.81.2 To review and update the regulatory enactments pertaining to agriculture sector 0.0 0.4 0.4 0.0 0.0 0.9
2.2.1 To develop National Research Priorities and National Agriculture Research Plan 15.3 26.8 27.7 33.3 46.0 149.12.2 To increase production and productivity of rice under changing and variable climate 472.0 361.5 384.5 288.9 417.5 1,924.42.3 To increase production and productivity of OFCs, vegetables and fruits under changing and variable climate 694.6 744.8 770.9 811.9 835.6 3,857.82.4 To make officers and farmers aware on novel technologies for improved production and productivity of agricultural crops (see 2.2 and 2.3) 90.0 1,111.0 1,175.0 340.0 351.0 3,067.0
3. 3.1 To implement programs to increase value-added product development to provide uninterrupted supply of commodities to domestic and international market 44.0 289.0 311.0 274.0 282.0 1,200.0
4.4.1 To reduce post harvest losses of agricultural commodities 46.0 30.0 21.2 22.2 23.2 142.6
5.5.1 To build resilience to climate change impacts 235.0 279.0 293.0 300.3 306.0 1,413.35.2 To establish agro-industries among farming communities 316.3 338.5 355.5 369.0 383.0 1,762.3
6.6.1 To institute environment sensitive farming communities 59.0 60.5 67.0 69.5 72.5 328.56.2 To conserve soil and environment on adverse impacts of agricultural practices 403.1 446.1 457.0 470.0 485.0 2,261.2
7. 7.1 To provide financial incentive to farming communities to improve productivity as a disaster risk reduction measure - - - - -7.2 To provide quality agricultural inputs to the farming communities at affordable prices ( See 2.1 and 2.2 ) 20.0 10.0 10.0 10.0 10.0 60.07.3 To increase the machinery in use of agricultural farming practices to increase labour productivity (2.1, 2.2, 2.3, 7.1) 130.0 110.0 117.0 113.0 113.5 583.5
8. 8.1 To establish partnerships with other state and private sector organizations in Sri Lanka to conduct research on agricultural commodities 20.0 45.0 97.0 113.0 130.0 405.08.2 To establish linkages with recognized regional and global institutions for research and development, capacity building, and technology transfer 5.3 116.7 136.8 144.2 146.8 549.8
9. 9.1 To establish good governance in implementing activities of the Ministry 9.7 20.2 20.5 25.7 26.0 102.19.2 To establish a performance-based work culture 13.5 93.0 97.5 102.0 103.0 409.09.3 To improve work performance through implementation of periodic review and management information system 2.4 5.1 8.9 10.7 11.1 38.29.4 To upgrade the welfare facilities for the work force 0.8 5.1 5.4 5.7 6.0 23.0
Total 2,577.3 4,094.1 4,357.3 3,504.4 3,749.3 18,282.5Source: Corporate Plan 2011-2015, Ministry of Agriculture
Facilitate accessibility of affordable credit and quality inputs including seeds and planting materials and agricultural machinery to farmers
Promote national, Regional and global partnerships for agriculture development
Strengthen capacity building and monitoring and evaluation to achieve high standards of delivery
Facilitate the empowerment of farming communities to transform subsistence agriculture to commercial agriculture
Ensure food security under changing and variable climate through improved and novel research, extension, advisory
Create a conducive environment for agricultural development through review and revision of the current policy and legal framework
Expand and promote domestic value-added agricultural products and agriculture exports
Promote waste reduction in agricultural commodities at farm-gate and at transit
Promote conservation of the environment and natural resources through sustainable land use practices

The Preparatory Survey on the P
roject for Improvem
ent of Agricultural P
roduction and Productivity
in Dry Zone A
reas in Dem
ocratic Socialist Republic of Sri Lanka
Final R
eport
T2-5
Table A
2.5 N
ational Livestock D
evelopment Plan (1/6)

The Preparatory Survey on the P
roject for Improvem
ent of Agricultural P
roduction and Productivity
in Dry Zone A
reas in Dem
ocratic Socialist Republic of Sri Lanka
Final R
eport
T2-6
Table A
2.5 N
ational Livestock D
evelopment Plan (2/6)

The Preparatory Survey on the P
roject for Improvem
ent of Agricultural P
roduction and Productivity
in Dry Zone A
reas in Dem
ocratic Socialist Republic of Sri Lanka
Final R
eport
T2-7
Table A
2.5 N
ational Livestock D
evelopment Plan (3/6)
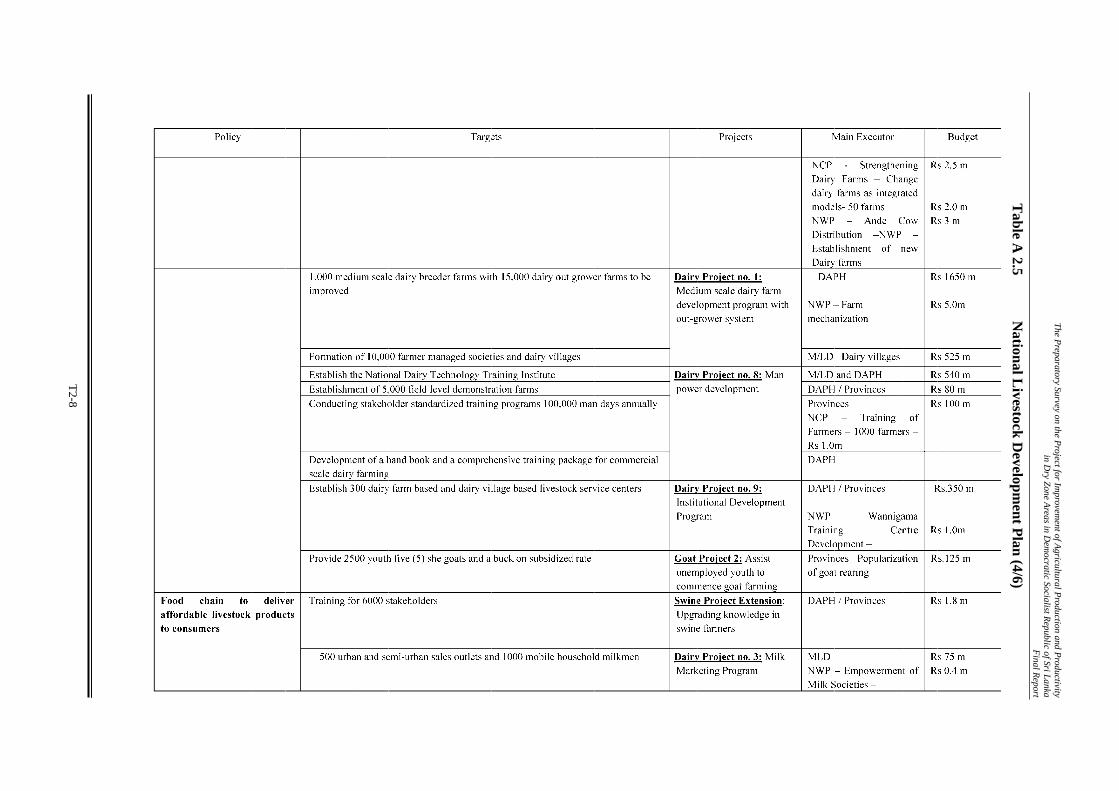
The Preparatory Survey on the P
roject for Improvem
ent of Agricultural P
roduction and Productivity
in Dry Zone A
reas in Dem
ocratic Socialist Republic of Sri Lanka
Final R
eport
T2-8
Table A
2.5 N
ational Livestock D
evelopment Plan (4/6)
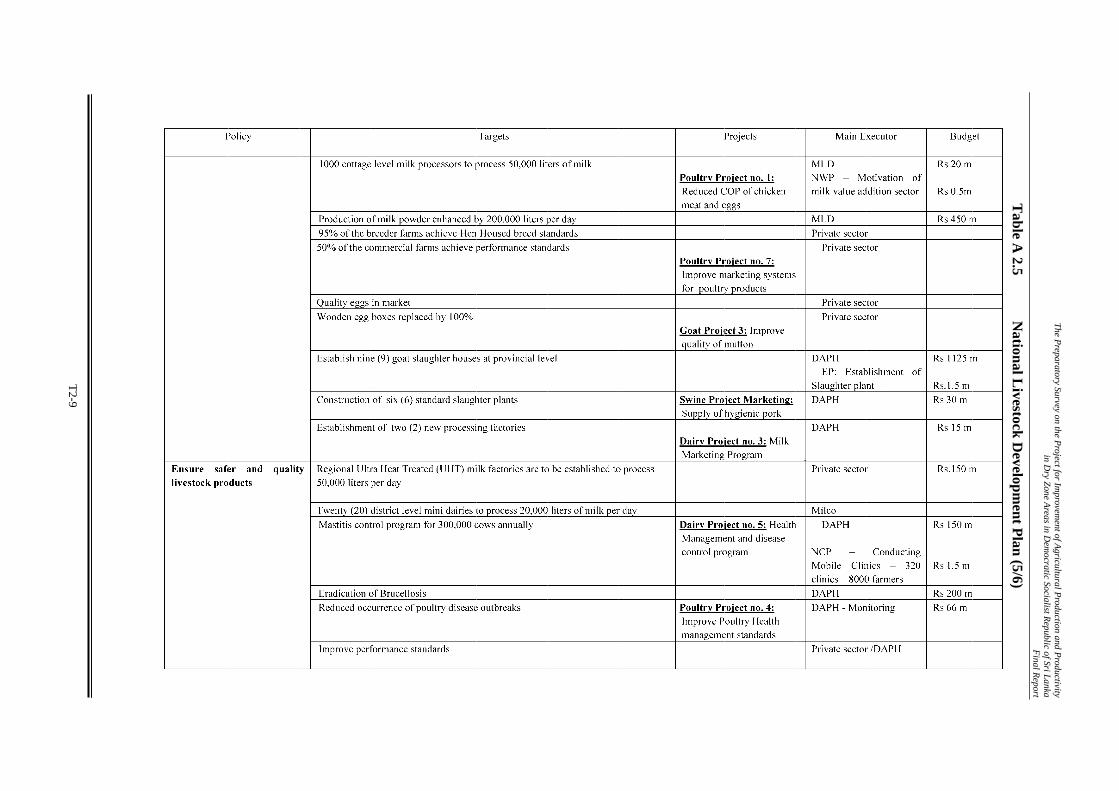
The Preparatory Survey on the P
roject for Improvem
ent of Agricultural P
roduction and Productivity
in Dry Zone A
reas in Dem
ocratic Socialist Republic of Sri Lanka
Final R
eport
T2-9
Table A
2.5 N
ational Livestock D
evelopment Plan (5/6)

The Preparatory Survey on the P
roject for Improvem
ent of Agricultural P
roduction and Productivity
in Dry Zone A
reas in Dem
ocratic Socialist Republic of Sri Lanka
Final R
eport
T2-10
Table A
2.5 N
ational Livestock D
evelopment Plan (6/6)

The Preparatory Survey on the Project for Improvement of Agricultural Production and Productivity in Dry Zone Areas in Democratic Socialist Republic of Sri Lanka
Final Report
T2-11
Table A 2.6 Investment Program in Dairy Sector Program (Rs Million) 2011 2012 2013 2014 2015 Total
1.Production System Based Dairy Farms Development
1.1.Small scale dairy farm development 462 616 770 1,232 770 3,850 1.2. Medium scale dairy farm development without grower system 216 381 673 573 332 2,175 2.Animal feed resources development and nutritional promotion 18 33 37 37 25 150 3.Milk Marketing 50 466 528 372 253 1,669 4. Breeding (upgrading & genetic improvement) 200 305 600 505 390 2,000 5.Health management and disease control 305 405 365 395 430 1,900 6. Veterinary Services Improvement 644 1,094 1,294 1,294 894 5,220 7. Research 20 27 33 40 20 140 8. Man Power Development 40 155 290 205 30 720 9. Institutional Development 4 8 110 212 56 390 Grand Total 1,959 3,490 4,700 4,865 3,200 18,214 Source: Ministry of Livestock and Rural Community Development
Table A 2.7 Expected Annual Milestones in Dairy Sector Item Present 1st Year 2nd Year 3rd Year 4th Year 5th Year
Dairy Farmer Families 262,000 263,560 266,160 269,410 272,660 275,000Total neat cattle and buffaloes( Million) 1.49 1.464 1.404 1.329 1.254 1.2Milking animals 240,000 262,000 282,000 307,000 332,000 350,000Fresh milk collecting points 2,895 3,000 3,500 4,125 4,750 5,200Milk cooling stations 232 243 260 280 293 300Average milk yield / cow (L) 2.83 3.10 3.70 4.60 5.50 6.00 Large scale processing facilities 13 13 14 14 14 15Small scale processing facilities 2,295 2,315 2,335 2,360 2,435 2,500Support service units Dept of AP & H 293 355 425 510 595 660
Source: Ministry of Livestock and Rural Community Development

The Preparatory Survey on the Project for Improvement of Agricultural Production and Productivity in Dry Zone Areas in Democratic Socialist Republic of Sri Lanka
Final Report
T2-12
Table A 2.8 On-going Irrigation Project S.No. The Project TEC
(Rs.m.) Location Completed by
Financial Support by
1 Daduru-Oya Reservoir Project 6,200 Puttalam, Kurunagala
2014 GOSL
2 Moragahakanda and Kaluganga Reservoirs Development Project
62,000 Matale 2015 SFD, FAED, OPEC
3 Rambukkan Oya Project 2,500 Ampara 2013 GOSL 4 Mahaweli System B (LB) Development Project 16,000 Batticaloa,
Trincomalee2013 GOSL
5 Dam Safety & Water Resources Planing Project (DSWRPP)
7,749 Whole Island 2015 World Bank
6 Gurugal Oya Project 400 Kandy 2014 GOSL 7 Lower Malwathu Oya Reservoir Project 10,000 Mannar 2016 GOSL 8 Restoration of Wilakandiya 81 Badulla 2014 GOSL 9 Kaluganga Reservoir Project 10,000 Ratnapura 2017 Israil
10 Rehabilitation of Theniyankulam Tank 100 Mullaitivu 2012 JICA 11 Rehabilitation of Akkarayan Kulam Tank 300 Kilinochchi 201 JICA 12 Rehabilitation of Kanagarayankulam Tank,
Eropothana Tank, Mahakachchikodiya Tank & Kalmadu Tank
154 Vavuniya 2012 World Bank
13 Rehabilitation of Periyamadu Tank, Periyapandiviichchan Tank, Adampankulam Tank & Mullikulam Tank
312 Mannar 2012 World Bank
14 Rehabilitation of Kariyalai Nagapaduwan Tank & Kanagambigai Kulam Tank
77 Kilinochchi 2012 World Bank
15 Rehabilitation of Iyankulam Tank, Palayamururukandy Tank, Mallavi Tank, Therankandal Tank, Koddaikaddiya Kulam Tank & Aampalapperumal Kulam Tank
280 Mullaitivu 2012 World Bank
16 Rehabilitation of Piramanthal Aru Tank & Vanneri Kulam Tank
80 Kilinochchi 2012 World Bank
17 Rehabilitation of Muthuiyankaddu, Vavunikulam & Visvamadu Lift Irrigation Schemes
71 Mullaitivu 2012 ADB
18 Rehabilitation of Mallikai Kulam Tank, Chemamadu Tank, Kombuvaithakulam Tank, Velankulam Tank, Aliyamuaruthamadu Tank & Periyathampanai Tank
253 Vavuniya 2012 ADB
19 Rehabilitation of Puthumurippu Kulam Tank 118 Kilinochchi 2012 ADB 20 Rehabilitation of Vavunikulam Tank, Maruthan
Kulam Tank, Kalvilan Kulam Tank, Panankamam Kulam Tank, Kollavilan Kulam Tank, Viswamadu Kulam Tank, Muruthamadu Tank, Udayarkaddu Tank, Madawalasinggam Kulam Tank & Thannimurippu Kulam Tank
1,613 Mullaitivu 2013 ADB

The Preparatory Survey on the Project for Improvement of Agricultural Production and Productivity in Dry Zone Areas in Democratic Socialist Republic of Sri Lanka
Final Report
T2-13
Table A 2.9 New Irrigation Project S.No. The Project TEC (Rs.m.) Location Completed by
1 Gin/Nilwala Diversion Project 55,125 Galle, Matara 20172 Ma Oya Diversion 18,000 Puttalam 20173 System B (Maduru Oya) 22,500 Baticaloa 2018
4 System L (Weli Oya) 6,750 Anuradhapura, Vavniya, Mulativu 2018
5 Uma Oya Multipurpose Development Project 62,626 Moneragala 20156 Yan Oya Reservoir Project 9,152 Trincomalee 20157 Thalpitigala Reservoir Project 5,500 Badulla 20158 Kivul Oya Reservoir Project 6,000 Vavuniya/Mullaitivu 20179 Nakkala Reservoir Project 10,500 Moneragala 2017
10 Kaudulla Extension Project 370 Polollaruwa 201411 Digili Oya Reservoir Project 3,000 Matara 201712 Morana Reservoir Project 1,700 Badulla 201613 Kalugal Oya Reservoir Project 1,517 Ampara 201514 Wandurapeenu Ela Reservoir Project 1,500 Kurunegala 201615 Basnagoda Reservoir Project 2,500 Gampaha 201616 Ellawewa Reservoir Project 470 Rathnapura 201517 Udawathura Reservoir Project 40 Matara 201418 Gonagalatenna Tank 55 Kandy 201419 Gin Nilwala Diversion Project 55,125 Galle/Matara 201720 Heda Oya Development Project 4,200 Monaragala/Ampara 201721 Urawa Diversion 2,200 Matara 2017

The Preparatory Survey on the P
roject for Improvem
ent of Agricultural P
roduction and Productivity
in Dry Zone A
reas in Dem
ocratic Socialist Republic of Sri Lanka
Final R
eport
T2-14
Table A
2.10 Provincial D
evelopment Policy and Program
s (1/15)

The Preparatory Survey on the P
roject for Improvem
ent of Agricultural P
roduction and Productivity
in Dry Zone A
reas in Dem
ocratic Socialist Republic of Sri Lanka
Final R
eport
T2-15
Table A 2.10
Provincial Developm
ent Policy and Programs (2/15)

The Preparatory Survey on the P
roject for Improvem
ent of Agricultural P
roduction and Productivity
in Dry Zone A
reas in Dem
ocratic Socialist Republic of Sri Lanka
Final R
eport
T2-16
Table A
2.10 Provincial D
evelopment Policy and Program
s (3/15)

The Preparatory Survey on the P
roject for Improvem
ent of Agricultural P
roduction and Productivity
in Dry Zone A
reas in Dem
ocratic Socialist Republic of Sri Lanka
Final R
eport
T2-17
Table A
2.10 Provincial D
evelopment Policy and Program
s(4/15)

The Preparatory Survey on the P
roject for Improvem
ent of Agricultural P
roduction and Productivity
in Dry Zone A
reas in Dem
ocratic Socialist Republic of Sri Lanka
Final R
eport
T2-18
Table A
2.10 Provincial D
evelopment Policy and Program
s(5/15)

The Preparatory Survey on the P
roject for Improvem
ent of Agricultural P
roduction and Productivity
in Dry Zone A
reas in Dem
ocratic Socialist Republic of Sri Lanka
Final R
eport
T2-19
Table A
2.10 Provincial D
evelopment Policy and Program
s (6/15)

The Preparatory Survey on the P
roject for Improvem
ent of Agricultural P
roduction and Productivity
in Dry Zone A
reas in Dem
ocratic Socialist Republic of Sri Lanka
Final R
eport
T2-20
Table A
2.10 Provincial D
evelopment Policy and Program
s (7/15)

The Preparatory Survey on the P
roject for Improvem
ent of Agricultural P
roduction and Productivity
in Dry Zone A
reas in Dem
ocratic Socialist Republic of Sri Lanka
Final R
eport
T2-21
Table A
2.10 Provincial D
evelopment Policy and Program
s(8/15)
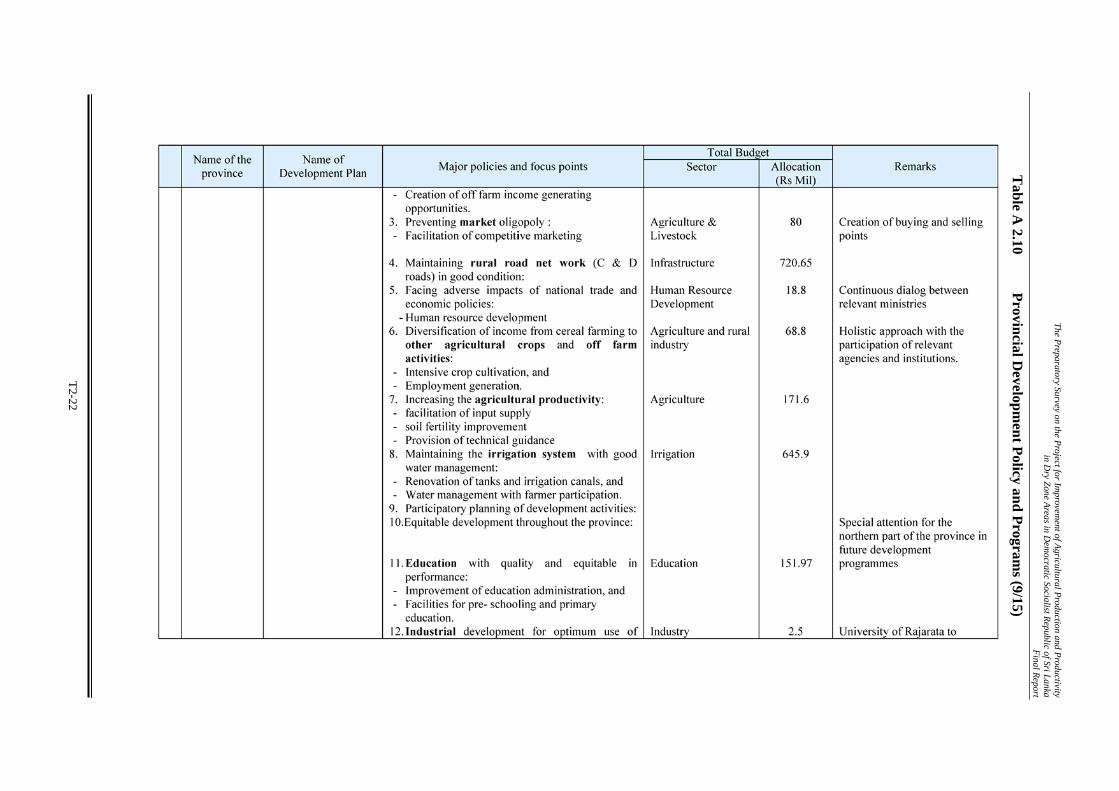
The Preparatory Survey on the P
roject for Improvem
ent of Agricultural P
roduction and Productivity
in Dry Zone A
reas in Dem
ocratic Socialist Republic of Sri Lanka
Final R
eport
T2-22
Table A
2.10 Provincial D
evelopment Policy and Program
s (9/15)
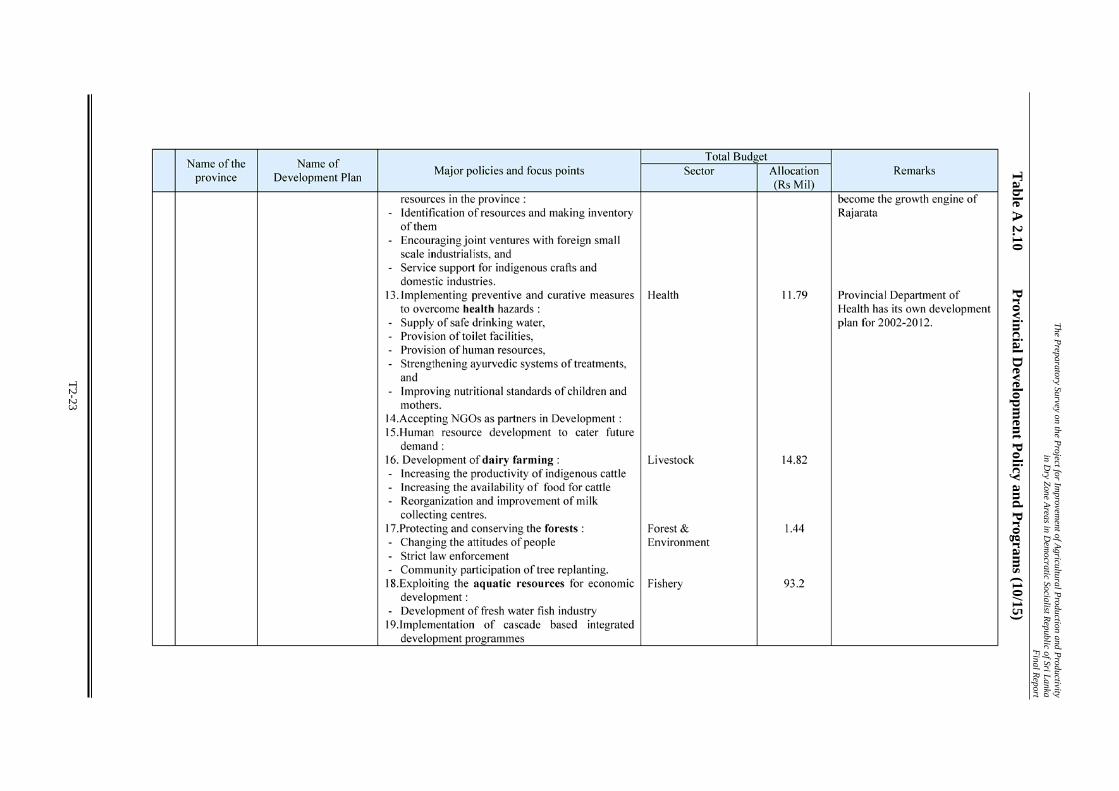
The Preparatory Survey on the P
roject for Improvem
ent of Agricultural P
roduction and Productivity
in Dry Zone A
reas in Dem
ocratic Socialist Republic of Sri Lanka
Final R
eport
T2-23
Table A
2.10 Provincial D
evelopment Policy and Program
s (10/15)

The Preparatory Survey on the P
roject for Improvem
ent of Agricultural P
roduction and Productivity
in Dry Zone A
reas in Dem
ocratic Socialist Republic of Sri Lanka
Final R
eport
T2-24
Table A
2.10 Provincial D
evelopment Policy and Program
s (11/15)

The Preparatory Survey on the P
roject for Improvem
ent of Agricultural P
roduction and Productivity
in Dry Zone A
reas in Dem
ocratic Socialist Republic of Sri Lanka
Final R
eport
T2-25
Table A
2.10 Provincial D
evelopment Policy and Program
s (12/15)

The Preparatory Survey on the P
roject for Improvem
ent of Agricultural P
roduction and Productivity
in Dry Zone A
reas in Dem
ocratic Socialist Republic of Sri Lanka
Final R
eport
T2-26
Table A
2.10 Provincial D
evelopment Policy and Program
s (13/15)
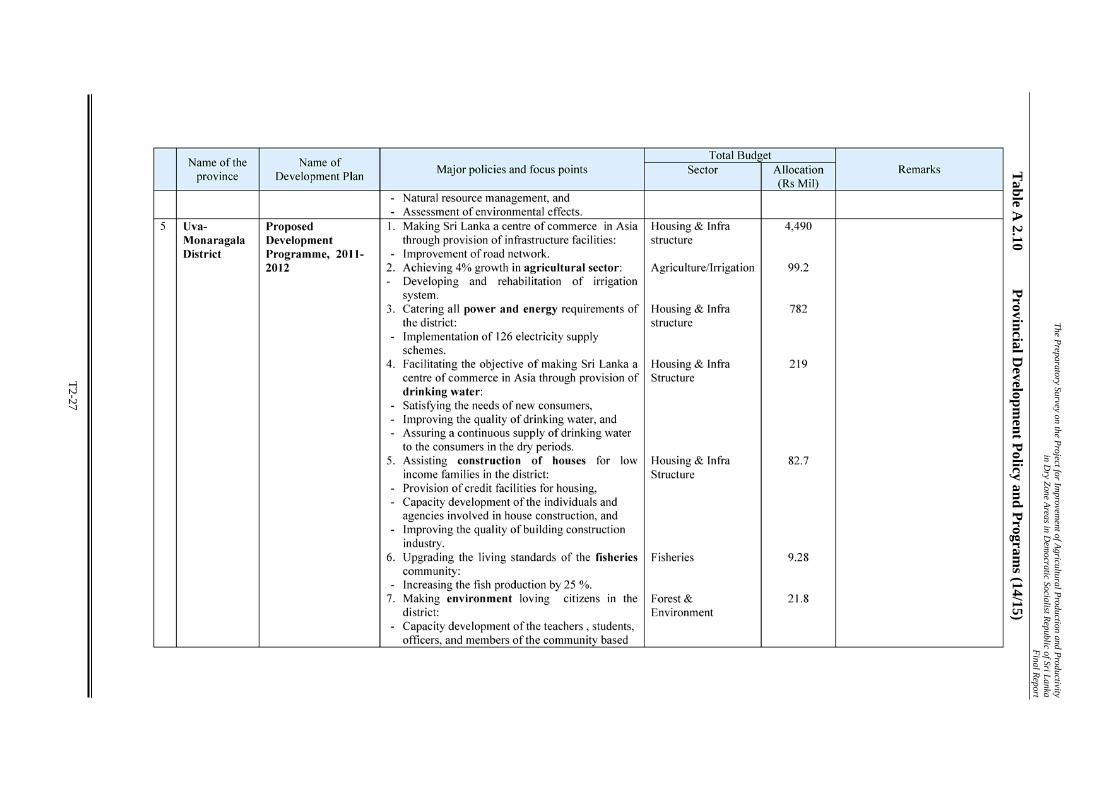
The Preparatory Survey on the P
roject for Improvem
ent of Agricultural P
roduction and Productivity
in Dry Zone A
reas in Dem
ocratic Socialist Republic of Sri Lanka
Final R
eport
T2-27
Table A
2.10 Provincial D
evelopment Policy and Program
s (14/15)

The Preparatory Survey on the P
roject for Improvem
ent of Agricultural P
roduction and Productivity
in Dry Zone A
reas in Dem
ocratic Socialist Republic of Sri Lanka
Final R
eport
T2-28
Table A
2.10 Provincial D
evelopment Policy and Program
s (15/15)

The Preparatory Survey on the P
roject for Improvem
ent of Agricultural P
roduction and Productivity
in Dry Zone A
reas in Dem
ocratic Socialist Republic of Sri Lanka
Final R
eport
T 3-1
Table A
3.1 Province Specific D
evelopment G
rant (PSDG
) - 2005 to 2010(1/5) N
orthern Province
Rs.Million
Allocation Expenditure Allocation Expenditure Allocation Expenditure Allocation Expenditure Allocation Expenditure Allocation Expenditure
1 Economic Infrastructure Dev. 240.00 208.27 437.00 177.00 170.00 83.00 224.60 124.52 243.00 323.70 395.00 287.09 1.1 Transport - - - - - - 6.40 - 2.00 - 4.00 - 1.2 Land Development - - - - - - 6.40 2.97 6.00 9.99 6.00 7.00 1.3 Roads 240.00 208.27 417.00 177.00 155.00 83.00 192.50 121.55 200.00 313.71 350.00 280.09 1.4 Rural Electrification - - 20.00 - 15.00 - 19.30 - 35.00 - 35.00 - 2 Social Infrastructure Dev. 440.00 400.72 928.00 724.30 520.50 126.10 309.30 386.02 821.00 1,048.24 1,931.40 1,550.81
2.1 Education - WB (ESDP) - - 110.00 94.20 55.00 50.00 110.00 121.05 208.00 185.75 300.00 299.99 - SIRUP 200.00 162.64 210.00 194.60 - - - - - - - - - CF - - 40.00 - 150.00 11.80 18.10 25.29 100.00 126.99 125.00 147.21
2.2 Health - WB (HSDP) - - 201.00 206.00 100.50 30.40 100.50 166.56 127.00 355.50 1,081.40 773.34 - SIRUP 200.00 219.51 260.00 200.00 - - - - - - - - - CF - - 52.00 - 175.00 17.90 35.80 47.82 176.00 197.17 175.00 153.50
2.3 Indigenous Medicine 15.00 8.20 20.00 12.60 12.50 8.00 19.30 9.07 15.00 24.34 30.00 27.24 2.4 Social Services 15.00 6.38 20.00 7.90 12.50 3.80 12.80 11.09 100.00 85.13 100.00 69.84 2.5 Probation and Childcare 10.00 3.99 15.00 9.00 15.00 4.20 12.80 5.14 75.00 73.36 100.00 79.69 2.6 Housing - - - - - - - - 20.00 - 20.00 - 3 Industries Dev. - - 65.00 22.10 25.00 5.00 15.00 5.09 40.00 6.12 30.00 9.30
3.1 Tourism - - - - - - - - 20.00 - 10.00 - 3.2 Fisheries - - - - 10.00 - 6.00 - 8.00 - 8.00 - 3.3 Industries - - 65.00 22.10 15.00 5.00 9.00 5.09 12.00 6.12 12.00 9.30 4 Agriculture Dev. 45.00 29.72 55.00 43.30 30.00 41.30 43.80 75.97 178.00 219.09 185.00 226.71
4.1 Agriculture - - - - - 25.20 14.90 35.41 20.00 92.35 25.00 89.13 4.2 Irrigation 30.00 26.74 40.00 31.40 20.00 7.60 19.30 6.86 128.00 107.07 125.00 108.69 4.3 Livestock Development 15.00 2.98 15.00 11.90 10.00 8.50 9.60 33.70 30.00 19.67 35.00 28.89 5 Community Dev. 25.00 - 32.00 6.80 81.00 24.60 28.40 9.00 108.00 75.85 124.00 165.83
5.1 Community Development 25.00 - 25.00 - 12.50 - 6.00 - 10.00 - 7.00 - 5.2 Rural Development - - - - 10.00 - 12.80 - 20.00 31.76 30.00 28.46 5.3 Sports - - 7.00 6.80 7.50 5.00 9.60 9.00 5.00 7.49 10.00 7.27 5.4 Cultural Affairs - - - - - - - - 8.00 - 10.00 - 5.5 Estate Infrastructure Development - - - - - - - - - - - - 5.6 Coperatives - - - - - - - - 5.00 36.60 7.00 22.74
5.7 Local Government including Solid wasteMgt. - - - - 51.00 19.60 - - 60.00 - 60.00 107.36
6 Other - - 220.00 44.20 120.00 87.40 - - - - - - 7 Regional Development Initiatives - - - - - - 150.00 - 100.00 - 75.00 - 8 Flexible Amount - - - - - - 64.20 6.62 100.00 69.07 82.30 34.94
Sub Total 750.00 638.71 1,737.00 1,017.70 946.50 367.40 835.30 607.22 1,590.00 1,742.06 2,822.70 2,274.68 9 Special Projects - - - - - - 634.00 134.84 287.40 147.35 272.10 272.09
9.1 UNICEF - - - - - - 324.00 125.84 95.40 135.91 201.10 238.30 9.2 Pro Poor Rural Development (JBIC) - - - - - - - - - - - - 9.3 Navodya - - - - - - 10.00 9.00 12.00 11.45 25.00 25.47 9.4 NECORD - - - - - - 300.00 - 180.00 - - - 9.5 ESSDP - - - - - - - - - - 9.6 ADB - - - - - - - - - - - - 9.7 Provincial Road Project - - - - - - - - - - - - 9.8 UNFPA Programme 46.00 8.32 9.9 NNIP - - - - - - - - - - - -
Total 750.00 638.71 1,737.00 1,017.70 946.50 367.40 1,469.30 742.06 1,877.40 1,889.41 3,094.80 2,546.77
2010No. Description
2005 (NEP) 2006 (NEP) 2007 2008 2009

The Preparatory Survey on the P
roject for Improvem
ent of Agricultural P
roduction and Productivity
in Dry Zone A
reas in Dem
ocratic Socialist Republic of Sri Lanka
Final R
eport
T 3-2
Table A
3.1 Province Specific D
evelopment G
rant (PSDG
) - 2005 to 2010 (2/5) E
astern Province
Rs.Million
Allocation Expenditure Allocation Expenditure Allocation Expenditure Allocation Expenditure Allocation Expenditure Allocation Expenditure
1 Economic Infrastructure Dev. 240.00 208.27 437.00 177.00 170.00 85.50 313.70 146.36 170.00 119.53 215.00 109.22 1.1 Transport - - - - - - 8.50 - 20.00 - 15.00 - 1.2 Land Development - - - - - - 8.50 2.36 10.00 4.98 5.00 3.32 1.3 Roads 240.00 208.27 417.00 177.00 155.00 85.50 271.30 144.00 100.00 114.55 150.00 105.90 1.4 Rural Electrification - - 20.00 - 15.00 - 25.40 - 40.00 - 45.00 - 2 Social Infrastructure Dev. 440.00 400.72 928.00 724.30 520.50 184.60 368.40 330.18 764.00 546.39 1,198.60 1,102.73
2.1 Education - WB (ESDP) - - 110.00 94.20 55.00 69.00 110.00 123.22 208.00 125.98 285.00 244.99 - SIRUP 200.00 162.64 210.00 194.60 - - - - - - - - - CF - - 40.00 - 150.00 31.40 41.50 65.20 125.00 101.49 150.00 132.93
2.2 Health - WB (HSDP) - - 201.00 206.00 100.50 40.40 100.50 81.76 138.00 103.80 380.60 499.18 - SIRUP 200.00 219.51 260.00 200.00 - - - - - - - - - CF - - 52.00 - 175.00 26.50 57.20 34.50 175.00 128.69 250.00 150.64
2.3 Indigenous Medicine 15.00 8.20 20.00 12.60 12.50 5.50 25.40 11.50 40.00 56.00 40.00 25.55 2.4 Social Services 15.00 6.38 20.00 7.90 12.50 7.00 16.90 6.00 23.00 15.30 37.00 27.17 2.5 Probation and Childcare 10.00 3.99 15.00 9.00 15.00 4.80 16.90 8.00 35.00 15.13 41.00 22.27 2.6 Housing - - - - - - - - 20.00 - 15.00 - 3 Industries Dev. - - 65.00 22.10 25.00 4.70 25.50 9.45 45.00 10.70 42.00 11.00
3.1 Tourism - - - - - - 6.40 - 20.00 - 20.00 - 3.2 Fisheries - - - - 10.00 - 6.40 - 10.00 - 10.00 - 3.3 Industries - - 65.00 22.10 15.00 4.70 12.70 9.45 15.00 10.70 12.00 11.00 4 Agriculture Dev. 45.00 29.72 55.00 43.30 30.00 10.50 57.10 77.51 157.00 124.78 160.00 146.40
4.1 Agriculture - - - - - 3.50 19.00 25.75 40.00 44.25 45.00 45.16 4.2 Irrigation 30.00 26.74 40.00 31.40 20.00 4.50 25.40 34.18 82.00 51.01 75.00 70.94 4.3 Livestock Development 15.00 2.98 15.00 11.90 10.00 2.50 12.70 17.58 35.00 29.52 40.00 30.30 5 Community Dev. 25.00 - 32.00 6.80 81.00 67.50 36.00 8.00 121.00 145.57 130.00 190.17
5.1 Community Development 25.00 - 25.00 - 12.50 - 6.40 - 21.00 - 20.00 - 5.2 Rural Development - - - - 10.00 - 16.90 - 15.00 7.56 25.00 51.91 5.3 Sports - - 7.00 6.80 7.50 2.50 12.70 8.00 20.00 22.70 25.00 27.17 5.4 Cultural Affairs - - - - - - - - 5.00 - 8.00 - 5.5 Estate Infrastructure Development - - - - - - - - - - - - 5.6 Coperatives - - - - - - - - - 3.21 2.00 3.59
5.7 Local Government including Solid wasteMgt. - - - - 51.00 65.00 - - 60.00 112.10 50.00 107.50
6 Other - - 220.00 44.20 120.00 19.60 - - - - - - 7 Regional Development Initiatives - - - - - - 150.00 - 100.00 - 75.00 8 Flexible Amount - - - - - - 85.80 0.10 90.00 50.53 94.10
Sub Total 750.00 638.71 1,737.00 1,017.70 946.50 372.40 1,036.50 571.60 1,447.00 997.49 1,914.70 1,673.12 9 Special Projects - - - - - - 605.00 80.08 3,254.90 67.97 2,576.00 198.91
9.1 UNICEF - - - - - - 222.00 80.08 76.40 67.97 152.60 153.64 9.2 Pro Poor Rural Development (JBIC) - - - - - - 153.00 - 165.00 - - - 9.3 Navodya - - - - - - 15.00 - 22.50 - 22.50 - 9.4 NECORD - - - - - - 215.00 - 216.00 - - - 9.5 ESSDP - - - - - - - - - - 9.6 ADB - - - - - - - - 275.00 - 1,706.00 - 9.7 Provincial Road Project - - - - - - - - 700.00 - 603.00 - 9.8 UNFPA Programme - - - - - - - - - - 91.90 45.27 9.9 NNIP - - - - - - - - 1,800.00 - - -
Total 750.00 638.71 1,737.00 1,017.70 946.50 372.40 1,641.50 651.68 4,701.90 1,065.46 4,490.70 1,872.03
113.60
2010No. Description
2005 (NEP) 2006 (NEP) 2007 2008 2009
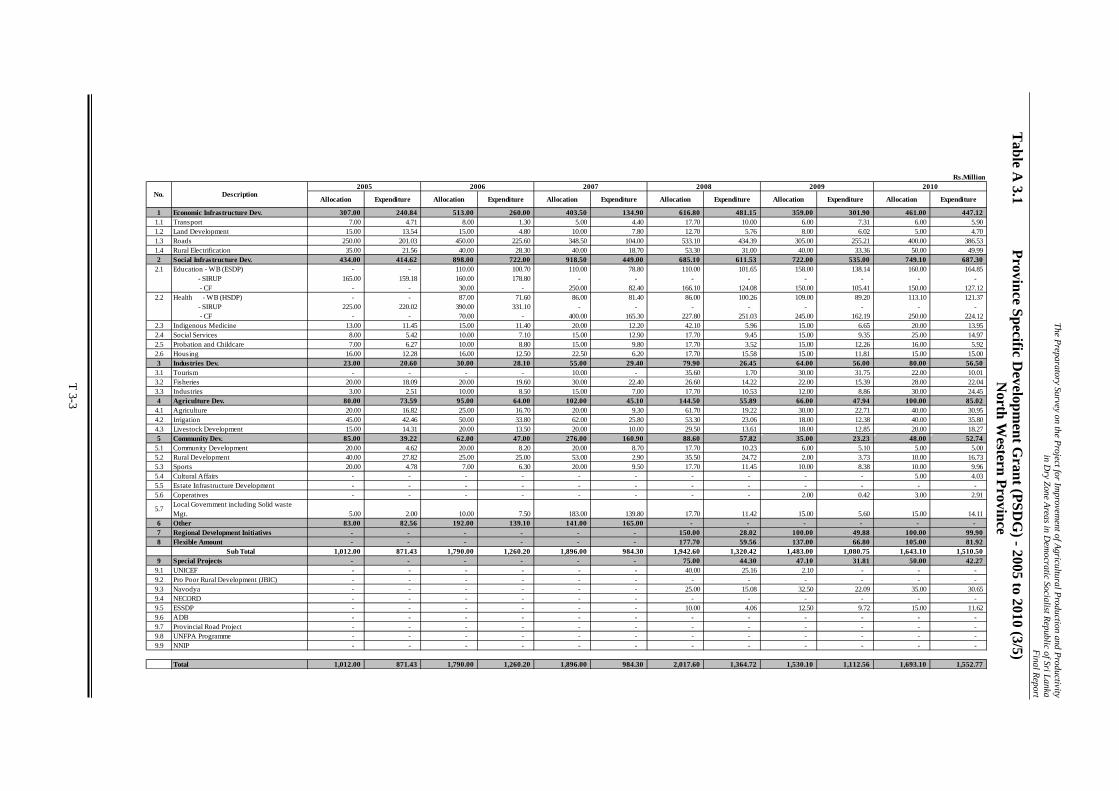
The Preparatory Survey on the P
roject for Improvem
ent of Agricultural P
roduction and Productivity
in Dry Zone A
reas in Dem
ocratic Socialist Republic of Sri Lanka
Final R
eport
T 3-3
Table A
3.1 Province Specific D
evelopment G
rant (PSDG
) - 2005 to 2010 (3/5) N
orth Western Province
Rs.Million
Allocation Expenditure Allocation Expenditure Allocation Expenditure Allocation Expenditure Allocation Expenditure Allocation Expenditure
1 Economic Infrastructure Dev. 307.00 240.84 513.00 260.00 403.50 134.90 616.80 481.15 359.00 301.90 461.00 447.12 1.1 Transport 7.00 4.71 8.00 1.30 5.00 4.40 17.70 10.00 6.00 7.31 6.00 5.90 1.2 Land Development 15.00 13.54 15.00 4.80 10.00 7.80 12.70 5.76 8.00 6.02 5.00 4.70 1.3 Roads 250.00 201.03 450.00 225.60 348.50 104.00 533.10 434.39 305.00 255.21 400.00 386.53 1.4 Rural Electrification 35.00 21.56 40.00 28.30 40.00 18.70 53.30 31.00 40.00 33.36 50.00 49.99 2 Social Infrastructure Dev. 434.00 414.62 898.00 722.00 918.50 449.00 685.10 611.53 722.00 535.00 749.10 687.30
2.1 Education - WB (ESDP) - - 110.00 100.70 110.00 78.80 110.00 101.65 158.00 138.14 160.00 164.85 - SIRUP 165.00 159.18 160.00 178.80 - - - - - - - - - CF - - 30.00 - 250.00 82.40 166.10 124.08 150.00 105.41 150.00 127.12
2.2 Health - WB (HSDP) - - 87.00 71.60 86.00 81.40 86.00 100.26 109.00 89.20 113.10 121.37 - SIRUP 225.00 220.02 390.00 331.10 - - - - - - - - - CF - - 70.00 - 400.00 165.30 227.80 251.03 245.00 162.19 250.00 224.12
2.3 Indigenous Medicine 13.00 11.45 15.00 11.40 20.00 12.20 42.10 5.96 15.00 6.65 20.00 13.95 2.4 Social Services 8.00 5.42 10.00 7.10 15.00 12.90 17.70 9.45 15.00 9.35 25.00 14.97 2.5 Probation and Childcare 7.00 6.27 10.00 8.80 15.00 9.80 17.70 3.52 15.00 12.26 16.00 5.92 2.6 Housing 16.00 12.28 16.00 12.50 22.50 6.20 17.70 15.58 15.00 11.81 15.00 15.00 3 Industries Dev. 23.00 20.60 30.00 28.10 55.00 29.40 79.90 26.45 64.00 56.00 80.00 56.50
3.1 Tourism - - - - 10.00 - 35.60 1.70 30.00 31.75 22.00 10.01 3.2 Fisheries 20.00 18.09 20.00 19.60 30.00 22.40 26.60 14.22 22.00 15.39 28.00 22.04 3.3 Industries 3.00 2.51 10.00 8.50 15.00 7.00 17.70 10.53 12.00 8.86 30.00 24.45 4 Agriculture Dev. 80.00 73.59 95.00 64.00 102.00 45.10 144.50 55.89 66.00 47.94 100.00 85.02
4.1 Agriculture 20.00 16.82 25.00 16.70 20.00 9.30 61.70 19.22 30.00 22.71 40.00 30.95 4.2 Irrigation 45.00 42.46 50.00 33.80 62.00 25.80 53.30 23.06 18.00 12.38 40.00 35.80 4.3 Livestock Development 15.00 14.31 20.00 13.50 20.00 10.00 29.50 13.61 18.00 12.85 20.00 18.27 5 Community Dev. 85.00 39.22 62.00 47.00 276.00 160.90 88.60 57.82 35.00 23.23 48.00 52.74
5.1 Community Development 20.00 4.62 20.00 8.20 20.00 8.70 17.70 10.23 6.00 5.10 5.00 5.00 5.2 Rural Development 40.00 27.82 25.00 25.00 53.00 2.90 35.50 24.72 2.00 3.73 10.00 16.73 5.3 Sports 20.00 4.78 7.00 6.30 20.00 9.50 17.70 11.45 10.00 8.38 10.00 9.96 5.4 Cultural Affairs - - - - - - - - - - 5.00 4.03 5.5 Estate Infrastructure Development - - - - - - - - - - - - 5.6 Coperatives - - - - - - - - 2.00 0.42 3.00 2.91
5.7 Local Government including Solid wasteMgt. 5.00 2.00 10.00 7.50 183.00 139.80 17.70 11.42 15.00 5.60 15.00 14.11
6 Other 83.00 82.56 192.00 139.10 141.00 165.00 - - - - - - 7 Regional Development Initiatives - - - - - - 150.00 28.02 100.00 49.88 100.00 99.90 8 Flexible Amount - - - - - - 177.70 59.56 137.00 66.80 105.00 81.92
Sub Total 1,012.00 871.43 1,790.00 1,260.20 1,896.00 984.30 1,942.60 1,320.42 1,483.00 1,080.75 1,643.10 1,510.50 9 Special Projects - - - - - - 75.00 44.30 47.10 31.81 50.00 42.27
9.1 UNICEF - - - - - - 40.00 25.16 2.10 - - - 9.2 Pro Poor Rural Development (JBIC) - - - - - - - - - - - - 9.3 Navodya - - - - - - 25.00 15.08 32.50 22.09 35.00 30.65 9.4 NECORD - - - - - - - - - - - - 9.5 ESSDP - - - - - - 10.00 4.06 12.50 9.72 15.00 11.62 9.6 ADB - - - - - - - - - - - - 9.7 Provincial Road Project - - - - - - - - - - - - 9.8 UNFPA Programme - - - - - - - - - - - - 9.9 NNIP - - - - - - - - - - - -
Total 1,012.00 871.43 1,790.00 1,260.20 1,896.00 984.30 2,017.60 1,364.72 1,530.10 1,112.56 1,693.10 1,552.77
No. Description2005 2006 2007 2008 2009 2010

The Preparatory Survey on the P
roject for Improvem
ent of Agricultural P
roduction and Productivity
in Dry Zone A
reas in Dem
ocratic Socialist Republic of Sri Lanka
Final R
eport
T 3-4
Table A
3.1 Province Specific D
evelopment G
rant (PSDG
) - 2005 to 2010 (4/5) N
orth Central Province
Rs.Million
Allocation Expenditure Allocation Expenditure Allocation Expenditure Allocation Expenditure Allocation Expenditure Allocation Expenditure
1 Economic Infrastructure Dev. 333.00 214.41 447.50 287.50 438.00 199.30 599.20 379.72 368.00 243.88 280.00 614.51 1.1 Transport 10.00 - 15.00 15.00 23.00 6.10 17.10 - 30.00 16.14 35.00 23.84 1.2 Land Development 3.00 - 5.00 0.10 5.00 2.70 17.10 5.88 8.00 7.57 10.00 9.12 1.3 Roads 290.00 188.33 387.50 226.80 370.00 175.50 530.80 324.61 300.00 168.02 200.00 549.48 1.4 Rural Electrification 30.00 26.08 40.00 45.60 40.00 15.00 34.20 49.23 30.00 52.15 35.00 32.07 2 Social Infrastructure Dev. 493.00 409.24 953.00 651.30 817.50 422.80 659.50 574.07 684.00 588.80 712.60 642.85
2.1 Education - WB (ESDP) - - 110.00 110.00 110.00 62.70 110.00 105.20 158.00 162.12 150.00 154.92 - SIRUP 175.00 117.02 170.00 190.40 - - - - - - - - CF - - 30.00 - 250.00 106.30 173.60 170.19 150.00 105.96 175.00 159.02
2.2 Health - WB (HSDP) - - 90.00 64.70 90.00 57.60 90.00 137.34 121.00 121.17 116.60 119.67 - SIRUP 280.00 270.66 418.00 252.00 - - - - - - - - CF - - 85.00 - 300.00 159.00 183.20 105.30 160.00 126.09 165.00 127.25
2.3 Indigenous Medicine 12.00 3.90 20.00 11.60 20.00 9.10 42.80 26.11 55.00 46.75 65.00 45.69 2.4 Social Services 5.00 3.55 7.00 5.30 15.00 7.40 17.10 8.77 10.00 6.97 15.00 12.52 2.5 Probation and Childcare 5.00 2.67 7.00 1.70 10.00 5.00 17.10 8.61 15.00 7.05 15.00 13.72 2.6 Housing 16.00 11.44 16.00 15.60 22.50 15.70 25.70 12.55 15.00 12.70 11.00 10.06 3 Industries Dev. 9.00 2.31 12.00 12.00 42.00 8.90 85.60 22.30 57.00 23.81 65.00 43.16
3.1 Tourism - - - - - - 34.20 0.23 25.00 3.29 30.00 15.42 3.2 Fisheries 9.00 2.31 12.00 12.00 12.00 8.40 17.10 10.39 12.00 10.10 15.00 13.49 3.3 Industries - - - - 30.00 0.50 34.30 11.68 20.00 10.42 20.00 14.25 4 Agriculture Dev. 61.00 14.50 100.00 30.70 120.00 40.70 119.90 42.16 100.00 108.53 240.00 150.16
4.1 Agriculture 10.00 5.66 40.00 8.90 40.00 11.60 51.40 13.16 35.00 26.61 45.00 38.31 4.2 Irrigation 42.00 8.42 45.00 18.30 60.00 22.70 51.40 20.47 40.00 74.65 160.00 95.95 4.3 Livestock Development 9.00 0.42 15.00 3.50 20.00 6.40 17.10 8.53 25.00 7.27 35.00 15.90 5 Community Dev. 37.00 8.40 37.00 29.80 250.50 96.90 94.10 53.52 117.00 41.33 136.00 113.02
5.1 Community Development 10.00 1.90 20.00 5.60 25.50 5.10 17.10 11.76 7.00 5.23 10.00 7.14 5.2 Rural Development 15.00 - - 15.00 30.00 5.10 34.20 10.38 20.00 15.11 20.00 22.43 5.3 Sports 7.00 5.00 7.00 6.70 20.00 6.80 17.10 14.92 10.00 9.40 15.00 13.56 5.4 Cultural Affairs - - - - 10.00 6.90 17.10 11.86 15.00 7.20 16.00 11.17 5.5 Estate Infrastructure Development - - - - - - - - - - - - 5.6 Coperatives - - - - - - - - 5.00 4.11 5.00 4.80
5.7 Local Government including Solid wasteMgt. 5.00 1.50 10.00 2.50 165.00 73.00 8.60 4.60 60.00 0.28 70.00 53.92
6 Other 72.00 52.62 230.00 95.40 190.00 133.70 - - - - - - 7 Regional Development Initiatives - - - - - - 150.00 49.84 100.00 100.00 91.64 8 Flexible Amount - - - - - - 170.20 176.94 100.00 151.60 125.17
Sub Total 1,005.00 701.48 1,779.50 1,106.70 1,858.00 902.30 1,878.50 1,298.55 1,526.00 1,219.27 1,685.20 1,780.51 9 Special Projects - - - - - - 51.00 12.81 174.60 2.94 1,460.50 1,300.45
9.1 UNICEF - - - - - - 36.00 2.90 2.10 2.10 3.50 1.02 9.2 Pro Poor Rural Development (JBIC) - - - - - - - - - - - - 9.3 Navodya - - - - - - 15.00 9.91 22.50 0.84 25.00 20.33 9.4 NECORD - - - - - - - - - - - - 9.5 ESSDP - - - - - - - - - - 9.6 ADB - - - - - - - - 150.00 - 1,386.00 1,255.46 9.7 Provincial Road Project - - - - - - - - - - - - 9.8 UNFPA Programme - - - - - - - - - - 46.00 23.64 9.9 NNIP - - - - - - - - - - - -
Total 1,005.00 701.48 1,779.50 1,106.70 1,858.00 902.30 1,929.50 1,311.36 1,700.60 1,222.21 3,145.70 3,080.96
No.
212.92
Description2005 2006 2007 2008 2009 2010

The Preparatory Survey on the P
roject for Improvem
ent of Agricultural P
roduction and Productivity
in Dry Zone A
reas in Dem
ocratic Socialist Republic of Sri Lanka
Final R
eport
T 3-5
Table A
3.1 Province Specific D
evelopment G
rant (PSDG
) - 2005 to 2010 (5/5) U
va Province
Rs.Million
Allocation Expenditure Allocation Expenditure Allocation Expenditure Allocation Expenditure Allocation Expenditure Allocation Expenditure
1 Economic Infrastructure Dev. 340.00 242.37 365.00 221.40 245.00 127.90 344.30 214.13 427.00 511.41 368.00 350.40 1.1 Transport 10.00 0.08 10.00 - 15.00 - 9.80 3.35 10.00 4.46 10.00 8.09 1.2 Land Development - - - - 5.00 3.10 9.80 3.71 7.00 6.32 8.00 3.56 1.3 Roads 290.00 212.98 315.00 195.90 185.00 106.40 305.00 207.07 360.00 463.79 300.00 297.14 1.4 Rural Electrification 40.00 29.31 40.00 25.50 40.00 18.40 19.70 - 50.00 36.84 50.00 41.61 2 Social Infrastructure Dev. 485.00 342.10 729.00 426.00 882.50 444.30 369.50 423.36 642.00 610.29 695.70 732.17
2.1 Education - WB (ESDP) - - 110.00 46.90 110.00 65.40 110.00 127.16 158.00 193.51 160.00 145.05 - SIRUP 183.00 141.08 190.00 132.00 - - - - - - - - CF - - 35.00 - 270.00 160.10 58.20 112.46 175.00 137.72 200.00 224.98
2.2 Health - WB (HSDP) - - 85.00 39.60 85.00 50.80 85.00 89.17 109.00 112.55 110.70 153.00 - SIRUP 237.00 166.95 190.00 180.60 - - - - - - - - CF - - 70.00 - 350.00 152.50 67.20 70.19 135.00 132.62 150.00 148.40
2.3 Indigenous Medicine 20.00 9.97 15.00 9.00 25.00 7.50 19.70 10.18 30.00 16.27 35.00 28.24 2.4 Social Services 15.00 7.05 10.00 10.00 15.00 3.10 9.80 9.11 10.00 7.16 15.00 11.48 2.5 Probation and Childcare 14.00 9.05 8.00 7.90 10.00 0.90 9.80 5.09 15.00 8.96 15.00 11.62 2.6 Housing 16.00 8.00 16.00 - 17.50 4.00 9.80 - 10.00 1.50 10.00 9.40 3 Industries Dev. 5.00 - 10.00 - 20.00 1.10 49.50 10.28 64.00 25.06 65.00 90.06
3.1 Tourism 5.00 - 10.00 - 10.00 - 24.60 1.19 30.00 9.65 35.00 26.30 3.2 Fisheries - - - - - - 5.20 4.23 20.00 11.38 20.00 14.27 3.3 Industries - - - - 10.00 1.10 19.70 4.86 14.00 4.02 10.00 49.49 4 Agriculture Dev. 85.00 53.32 85.00 60.40 95.00 45.30 68.80 40.60 170.00 93.29 170.00 189.31
4.1 Agriculture 15.00 9.00 20.00 12.90 30.00 9.60 34.40 14.64 45.00 20.87 60.00 66.57 4.2 Irrigation 50.00 28.17 45.00 32.20 40.00 22.00 19.70 15.57 75.00 40.43 60.00 82.24 4.3 Livestock Development 20.00 16.15 20.00 15.30 25.00 13.70 14.70 10.39 50.00 31.99 50.00 40.50 5 Community Dev. 86.00 41.71 69.00 26.40 274.00 59.70 63.80 75.90 110.00 55.00 173.00 162.42
5.1 Community Development 15.00 8.64 15.00 9.30 22.00 10.50 9.80 8.24 28.00 24.58 30.00 58.44 5.2 Rural Development 50.00 20.75 30.00 11.30 60.00 5.00 24.60 2.35 30.00 5.89 40.00 34.52 5.3 Sports 6.00 5.90 7.00 4.90 12.00 5.10 9.80 8.39 12.00 4.41 20.00 18.24 5.4 Cultural Affairs - - - - - - - - - 8.00 4.51 5.5 Estate Infrastructure Development 10.00 4.78 10.00 - 15.00 - 9.80 4.49 5.00 1.57 25.00 - 5.6 Coperatives - - - - - - - - 5.00 1.15 10.00 14.88
5.7 Local Government including Solid wasteMgt. 5.00 1.64 7.00 0.90 165.00 39.10 9.80 52.43 30.00 17.39 40.00 31.83
6 Other - - 232.00 18.80 177.50 93.00 - - - - - - 7 Regional Development Initiatives - - - - - - 150.00 24.64 100.00 39.30 100.00 99.00 8 Flexible Amount - - - - - - 98.40 55.46 100.00 18.31 240.00 15.58
Sub Total 1,001.00 679.50 1,490.00 753.00 1,694.00 771.30 1,144.30 844.37 1,613.00 1,352.65 1,811.70 1,638.94 9 Special Projects - - - - - - 772.00 374.17 724.70 459.08 2,546.50 126.95
9.1 UNICEF - - - - - - 71.00 8.37 14.70 14.38 46.50 13.15 9.2 Pro Poor Rural Development (JBIC) - - - - - - 596.00 350.55 390.00 377.46 - - 9.3 Navodya - - - - - - 15.00 3.06 20.00 12.37 25.00 23.75 9.4 NECORD - - - - - - - - - - - 9.5 ESSDP - - - - - - 90.00 12.19 125.00 54.87 125.00 90.05 9.6 ADB - - - - - - - - 175.00 - 2,350.00 - 9.7 Provincial Road Project - - - - - - - - - - - - 9.8 UNFPA Programme - - - - - - - - - - - - 9.8 NNIP - - - - - - - - - - - -
Total 1,001.00 679.50 1,490.00 753.00 1,694.00 771.30 1,916.30 1,218.54 2,337.70 1,811.73 4,358.20 1,765.89
No. Description2005 2006 2007 2008 2009 2010

The Preparatory Survey on the P
roject for Improvem
ent of Agricultural P
roduction and Productivity
in Dry Zone A
reas in Dem
ocratic Socialist Republic of Sri Lanka
Final R
eport
T 3-6
Table A
3.2 E
mploym
ent Status by District based on R
esults of Sri Lanka L
abor Force Survey 2004
(1) Employed and Unemployed Population, and Employed Population by Major Industry GroupEmployed and Unemployment Population Emplyed Population by Major Industry Group
District EmployedUn-
employedTotal Employed
Un-employed
Total Agriculture Industry Services Total Agriculture Industry Services Total
(person) (person) (person) (%) (%) (%) (person) (person) (person) (person) (%) (%) (%) (%)Jaffna 165,371 17,780 183,151 90.3 9.7 100.0 63,572 32,824 68,975 165,371 38.4 19.8 41.7 100.0Kilinochchi n.a. n.a. - 91.5 8.5 100.0 n.a. n.a. n.a. n.a. 42.1 9.5 48.4 100.0Manner 28,522 * 29,450 96.8 * 100.0 14,014 3,454 11,054 28,522 49.1 12.1 38.8 100.0Vauniya 41,404 5,155 46,559 88.9 11.1 100.0 11,137 5,613 24,654 41,404 26.9 13.6 59.5 100.0Mullaitive n.a. n.a. - 88.7 11.3 100.0 n.a. n.a. n.a. n.a. 55.6 9.9 34.5 100.0Battikaloa 142,790 16,879 159,669 89.4 10.6 100.0 46,525 33,286 62,979 142,790 32.6 23.3 44.1 100.0Ampara 196,754 25,657 222,411 88.5 11.5 100.0 89,382 28,179 79,193 196,754 45.4 14.3 40.2 100.0Trincomalee 115,182 10,623 125,805 91.6 8.4 100.0 34,813 14,709 65,660 115,182 30.2 12.8 57.0 100.0Kurunegala 673,450 57,254 730,704 92.2 7.8 100.0 194,304 198,527 280,619 673,450 28.9 29.5 41.7 100.0Puttalam 278,294 20,952 299,246 93.0 7.0 100.0 88,257 75,964 114,073 278,294 31.7 27.3 41.0 100.0Anuradhapura 330,526 32,242 362,768 91.1 8.9 100.0 191,172 39,305 100,049 330,526 57.8 11.9 30.3 100.0Polonnarwa 140,215 9,127 149,342 93.9 6.1 100.0 67,145 26,916 46,154 140,215 47.9 19.2 32.9 100.0Badulla 415,215 26,019 441,234 94.1 5.9 100.0 282,325 43,189 89,701 415,215 68.0 10.4 21.6 100.0Moneragala 182,122 19,589 201,711 90.3 9.7 100.0 122,632 24,111 35,379 182,122 67.3 13.2 19.4 100.0Survey Area Total 2,709,845 241,277 2,952,050 91.8 8.2 100.0 1,205,278 522,623 978,490 2,709,845 44.5 19.3 36.1 100.0Other provinces 4,684,184 426,047 5,109,303 91.7 8.3 100.0 1,269,771 1,259,061 2,158,807 4,684,184 27.1 26.9 46.1 100.0Sri Lanka Total 7,394,029 667,324 8,061,353 91.7 8.3 100.0 2,475,049 1,781,684 3,137,297 7,394,029 33.5 24.1 42.4 100.0
(2) Employed Population by Major Industry Group and by SexEmployed Population by Major Industry Group - Male Employed Population by Major Industry Group - Female
District Agriculture Industry Services Total Agriculture Industry Services Total Agriculture Industry Services Total Agriculture Industry Services Total(person) (person) (person) (person) (%) (%) (%) (%) (person) (person) (person) (person) (%) (%) (%) (%)
Jaffna 46,812 27,797 53,524 128,133 36.5 21.7 41.8 100.0 16,760 5,027 15,451 37,238 45.0 13.5 41.5 100.0Kilinochchi n.a. n.a. n.a. n.a. 19.9 * 60.0 100.0 * * * * * * * *Manner 12,696 3,002 7,690 23,388 54.3 12.8 32.9 100.0 * * 3,365 5,135 * * 65.5 100.0Vauniya 10,162 4,792 20,253 35,207 28.9 13.6 57.5 100.0 * * 4,401 6,196 * * 71.0 100.0Mullaitive n.a. n.a. n.a. n.a. 35.1 12.0 52.9 100.0 * * * * * * * *Battikaloa 40,011 20,434 48,514 108,959 36.7 18.8 44.5 100.0 6,514 12,852 14,465 33,832 19.3 38.0 42.8 100.0Ampara 63,101 19,372 60,597 143,070 44.1 13.5 42.4 100.0 26,281 8,807 18,596 53,685 49.0 16.4 34.6 100.0Trincomalee 32,677 10,716 55,194 98,587 33.1 10.9 56.0 100.0 * * 10,467 16,594 * * 63.1 100.0Kurunegala 127,921 117,415 202,287 447,623 28.6 26.2 45.2 100.0 66,383 81,112 78,331 225,827 29.4 35.9 34.7 100.0Puttalam 69,395 52,041 90,296 211,732 32.8 24.6 42.6 100.0 18,862 23,923 23,777 66,562 28.3 35.9 35.7 100.0Anuradhapura 114,383 25,340 72,356 212,079 53.9 11.9 34.1 100.0 76,789 13,965 27,693 118,447 64.8 11.8 23.4 100.0Polonnarwa 53,722 15,300 35,941 104,963 51.2 14.6 34.2 100.0 13,424 11,615 10,213 35,252 38.1 32.9 29.0 100.0Badulla 141,394 29,059 67,280 237,733 59.5 12.2 28.3 100.0 140,932 14,130 22,420 177,482 79.4 8.0 12.6 100.0Moneragala 83,425 17,341 25,877 126,643 65.9 13.7 20.4 100.0 39,206 6,770 9,501 55,478 70.7 12.2 17.1 100.0Survey Area Total 795,699 342,609 739,809 1,878,117 42.4 18.2 39.4 100.0 405,151 178,201 238,680 831,728 48.7 21.4 28.7 100.0Other provinces 763,926 824,587 1,582,796 3,171,309 24.1 26.0 49.9 100.0 510,273 436,287 576,011 1,512,875 33.7 28.8 38.1 100.0Sri Lanka Total 1,559,625 1,167,196 2,322,605 5,049,426 30.9 23.1 46.0 100.0 915,424 614,488 814,691 2,344,603 39.0 26.2 34.7 100.0Note: *; Reliable estimates cannot be provided due to the small cell size.
; Due to some defects observed in the sampling frame, absolute estimates for Mullativu and Kilinochchi districts are not published in this report.Total estimate also excludes these two districts. However, some rates and percentages pertaining to these districts are published separately.
Source: District and Provincial Level Tables of the Sri Lanka Labour Force Survey 2004, Department of Census and Statistics

The Preparatory Survey on the Project for Improvement of Agricultural Production and Productivity in Dry Zone Areas in Democratic Socialist Republic of Sri Lanka
Final Report
T 3-7
Table A 3.3 Description of Agro-Ecological Region (1/2)
Zone Agro -Ecological
Region and Symbol
75% Expectancy Value of Annual Rainfall (MM)
Terrain & Dominant Soils
WET
ZO
NE
Up
Cou
ntry
WU1 >3,100 Tea, Forest Plantations, Natural Forest, Mountainous, steeply dissected, hilly& rolling RYP, Mountain Regosols & Lithosol soils.
WU2a >2,400 Tea, Forest Plantations, Steeply dissected, hilly& rolling RYP soils
WU2b >2,200 Tea, Forest Plantations, Vegetables, Mountainous ,Steeply dissected, hilly& rolling RYP, Mountain Regosol & Lithosol soils
WU3 >1,800 Tea, Vegetables ,Pasture, Home gardens, Forest plantations, Hilly & rolling RYP soils with prominent A1 horizon & RYP soils with dark B horizon.
Mid
C
ount
ry
WM1a >3,300 Tea, Natural forest, Mountainous, steeply dissected, hilly & rolling RYP soils with semi prominent A1 horizon & Lithosol soils
WM1b >2,900 Tea, Natural forest , Mixed home gardens, steeply dissected, hilly & rolling RYP soils with semi prominent A1 horizon & Lithosol soils
WM2a >2,200 Tea, Mixed Home gardens, Export Agricultural Crops, Natural Forest, Paddy, Steeply dissected , Hilly & rolling RYP , RBL & LHG Soils
WM2b >1,800 Mixed home gardens, Paddy, Export Agricultural Crops, Tea, Steep, hilly & rolling RBL, IBL, LHG & RYP soils.
WM3a >1,600 Mixed home gardens, Export Agricultural Crops, Tea, Paddy, Rubber, Steep, hilly & rolling RBL, IBL, LHG, Lithosol soils.
WM3b >1,400 Mixed home gardens, Export Agricultural Crops, Tea, Vegetables, hilly, rolling undulating & steep RBL, IBL &, LHG soils.
Low
Cou
ntry
WL1a >3,200 Tea, Rubber, Mixed home gardens, Paddy, Export Agricultural Crops (Cinnamon), Rolling, undulating & hilly RYP, RYP soils with prominent A1 horizon & LHG soils.
WL1b >2,800 Rubber Mixed home gardens, Paddy, Undulating & rolling RYP & LHG soils.
WL2a >2,400 Rubber Tea, Coconut, Mixed home gardens, Paddy, Export Agricultural Crop( Cinnamon) ,Rolling , undulating and flat RYP , LHG & Bog and Half -Bog soils..
WL2b >2,200 Rubber, Coconut, Mixed home gardens, Paddy, Steeply dissected, rolling & undulating RYP, RYP soils with strongly motted sub- soil, RBL & LHG soils.
WL3 >1,700 Coconut, Fruit Crops, Mixed home gardens, Paddy, Rolling & undulating RYP soils with soft and hard laterite, LHG & Regosol soils.
INTE
RM
EDIA
TE Z
ON
E
Up
Cou
ntry
IU1 >2,400 Tea, Export Crops (Cardamom), Natural forest, Forest plantation, Mountainous, steeply dissected, hilly & rolling RYP, Mountain Regosol & Lithosol soils.
IU2 >2,100 Tea, Vegetables, Mixed home gardens, Natural forest, Forest plantation, Mountainous, steeply dissected, hilly & rolling RYP, Mountain Regosol & Lithosol soils.
IU3a >1,900 Tea, Forest plantation, steeply dissected, hilly & rolling RYP, Mountain Regosol soils.
IU3b > 1,700 Tea, Natural Forest, Forest plantation, Mountainous, steeply dissected, hilly RYP, Mountain Regosol & Lithosol soils.
IU3c > 1,600 Tea, Vegetables, Paddy, Steeply dissected hilly & rolling RYP & LHG soils
IU3d >1,300 Tea, Vegetables, Forest Plantations, Natural forest, Steep, hilly & rolling RYP & Mountain Regosol soils
IU3e >1400 Tea, Vegetables, Paddy, Mixed home gardens, Steeply dissected hilly & rolling RYP & LHG soils

The Preparatory Survey on the Project for Improvement of Agricultural Production and Productivity in Dry Zone Areas in Democratic Socialist Republic of Sri Lanka
Final Report
T 3-8
Table A 3.3 Description of Agro-Ecological Region (2/2)
Zone Agro -Ecological
Region and Symbol
75% Expectancy Value of Annual Rainfall (MM)
Terrain & Dominant Soils
INTE
RM
EDIA
TE Z
ON
E Mid
Cou
ntry
IM1a >2,000 Tea, Vegetables, Paddy, Mixed home gardens, paddy, Forest Plantations, Very Steep & hilly RBL RYP , IBL , LHG & Lithosol soils
IM1b >2,000 Natural forest, Mixed home garden, Paddy, Grass lands, Hilly, rolling & undulating RBE,RBL,LHG, Mountain Regosol & Lithosol soils
IM1c >1,300 Natural forest, Vegetables, Very steep, Hilly & rolling RBL,IBL , Mountain Regosol & Lithosol soils
IM2a >1,800 Export Agricultural Crops, Mixed home gardens, Tea, Vegetables, Steep, hilly & rolling RBL & RYP soils.
IM2b >1,600 Natural forest Mixed home gardens, Paddy, Tea, Vegetables, Very Steep, hilly & rolling RBL, IBL, RYP, LHG & Lithosol soils.
IM3a >1,400 Mixed home gardens, Export Agricultural Crops, Paddy, and hilly, rolling & steep IBL, RBL & LHG soils.
IM3b >1,200 Mixed home gardens, Export Agricultural Crops, Rubber, Vegetables, Paddy, rolling & undulating, RBL, RBE & LHG soils.
IM3c >1,100 Vegetables, Tea , Mixed home gardens, Export Agricultural Crops, Steeply dissected , hilly & rolling RBL & IBL soils
Low
Cou
ntry
IL1a >1,400 Coconut, Mixed home gardens, Export Agricultural Crops, Paddy, Rubber, Rolling , Undulating & Flat RYP soils with strongly motted sub- soil, RYP, LHG , RBL, & Regosol soils
IL1b >1,100 Coconut, Paddy ,Mixed home gardens, Export Agricultural Crops, Rolling , Undulating & Flat , RYP, RBL, RBE,, LHG , & Regosol soils
IL1c >1,300 Mixed home gardens, Rubber, Paddy, Sugar cane , Rolling , undulating & flat RBL, RBE, LHG & IBL soils
IL2 >1,600 Mixed home gardens, Paddy, Rain fed Upland Crops, Scrub, Sugar cane , Rolling , hilly & undulating RBE, LHG & RBL soils
IL3 >1,100 Coconut, Paddy. Mixed home gardens, Undulating NCB, RBE & LHG soils
DR
Y Z
ON
E
Low
Cou
ntry
DL1a >1,100 Mixed home gardens, Paddy, Forest Plantations , Scrub, Sugar cane ,Natural forest, Rolling & undulating RBE & LHG soils
DL1b > 900 Rained Upland Crops , Paddy, Scrub, Mixed home gardens, Forest plantations, Undulating RBE & LHG soils
DL1c > 900 Rained Upland Crops , Paddy, Scrub, Natural forest, Forest plantations, Undulating RBE & LHG soils
DL1d >900 Rained Upland Crops , Paddy, Scrub, Undulating & flat RBE, Regosol & LHG soils
DL1e > 900 Rained Upland Crops , Paddy, Scrub, Undulating RBE & LHG soils
DL1f > 800 Rained Upland Crops , Paddy, Scrub, Natural forest ,Undulating RBE , LHG Grumusol soils
DL2a >1,300 Rained Upland Crops , Paddy, Natural forest, Sugar Cane , Scrub, Undulating NCB, RBE , LHG & Old Alluvial soils
DL2b >1,100 Paddy, Rained Upland Crops, Undulating & flat NCB, RBE, Old alluvial, LHG, Regosol& Solodized - Solonetz soils.
DL3 >800 Cashew, Coconut, Condiments, Scrub, Natural forest, Flat & slightly undulating RYL & Regosol soils
DL4 >750 Scrub, Paddy, Rained Upland Crops, Flat Solodized- Solonetz, Solonchaks & Grumusol soils
DL5 >650 Scrub, Natural forest, Rained Upland Crops, Paddy, Undulating & flat RBE soils with high amount of gravel in sub soil , LHG & Solodized - Solonetz soils.

The Preparatory Survey on the P
roject for Improvem
ent of Agricultural P
roduction and Productivity
in Dry Zone A
reas in Dem
ocratic Socialist Republic of Sri Lanka
Final R
eport
T 3-9
Table A
3.4 Sum
mary of C
limate Z
one and Agro-E
co Zone

The Preparatory Survey on the Project for Improvement of Agricultural Production and Productivity in Dry Zone Areas in Democratic Socialist Republic of Sri Lanka
Final Report
T 3-10
Table A 3.5 District-wise Surface Water Discharge Volume to Sea Province
Names of River Basins Estimated Annual Discharge Volume
to Sea (MCM)District North 2,602 Jaffna 0
Kilinochchi Torvil Aru, Piramenthal Aru, Methalli Aru, Kanakarayan Aru, Kalvalappu Aru, Akkarayan Aru, Madekal Aru, Pallavarayayankaddu Aru, & Pali Aru 408
Mannar Chippi Aru, Parangi Aru, Nay Aru, Malwatu Oya, Kal Aru & Kala Oya 580
Vavuniya Ma Oya, Chriya Aru, Palladi aru, Manal Aru, Per Aru, Kanakarayan Aru, Pali Aru, Parangi Aru, Nay Aru , Malwatu Oya & Kal Aru 590
Mullaitivu
Ma Oya, Chriya Aru, Chavar Aru, Palladi Aru, Manal Aru, Kodalikallu Aru, Per Aru, Pali Aru, Maruthapilly aruTorvil Aru,Piramenthal Aru, Methalli Aru, Kanakarayan Aru, Kalvalappu Aru, Akkarayan Aru, Madekal Aru, Pallavarayayankaddu Aru, Pali Aru, Chippi Aru, Parangi Aru & Nay Aru
1,024
East 3,380
Batticaloa
Gal Oya, Andella Oya, Thumpankeni Tank, Namakada Aru, Mandipattu Aru, Pathanthe Aru, Vett Aru, Unnichchai Aru, Mundeni Aru, Miyangilla Ela, Maduru Oya, Pulliyanpota Aru, Kirimechchi Odai, Bodigoda Aru, Mandan Aru & Makarachchi Aru
994
Ampara
Kumbukkan Oya, Bagura Oya, Girikula Oya, Helawa Oya, Wila Oya, Heda Oya, Karanda Oya, Saymena Aru, Tandiadi Aru, Kangikadichi Aru, Rufus Aru, Pannala Oya, Ambalam Oya, Gal Oya, Andella Oya, Mandipattu Aru, Unnichchai Aru, Mundeni Aru, Miyangolla Ela, Maduru Oya & Kantale Aru
1,921
Trincomalee Makarachchi Aru, Mahaweli Ganga, Kantale Aru, Panna Oya, Palampotha Aru, Pankulama Aru, Kunchikumban Aru, Palkutti Aru, Yan Oya, Mee Oya & Ma Oya 465
North-West 3,155
Kurunegala Kala Oya, Mi Oya, Kolamune Oya, Rathambala Oya, Daduru Oya, Karambalan Oya, Ratmal Oya & Maha Oya 2,471
Puttalam Moderagam Aru, Kala Oya, Moongili Aru, Mi Oya, Maurankuli Aru, Kolamune Oya, Rathambala Oya, Daduru Oya, Karambalan Oya, Ratmal Oya, Maha Oya & Attanagalu Oya
684
North Central 2,437
Anuradhapura Mahaweli Ganga, Pankulama Aru, Yan Oya, Mee Oya, Ma Oya, Knakarayan Aru, Parangi Aru, Malwatu Oya, Kal Aru, Moderagam Aru, Kala Oya, Mi Oya, Daduru Oya
1,209
Polonnaruwa Maduru Oya, Bodigoda Aru, Mandan Aru, Makarachchi Aru, Mahaweli Ganaga, Kantale Aru & Yan Oya, 1,228
Uva 2,050
Badulla Walawe Ganga, Kirindi Oya, Manik Ganga, Kumbukkan Oya, Gal oya & Maduru Oya 878
Monaragala Walawe Ganga, Malala Oya, Kirindi Oya, Bambawa Ara, Manik Ganga, Katupila Ara, Kurundu Ara, Nambadagas Ara, Kumbukkan Oya, Wila Oya, Heda Oya, Karanda Oya & Gal oya
1,172
5 Provinces Total 13,624
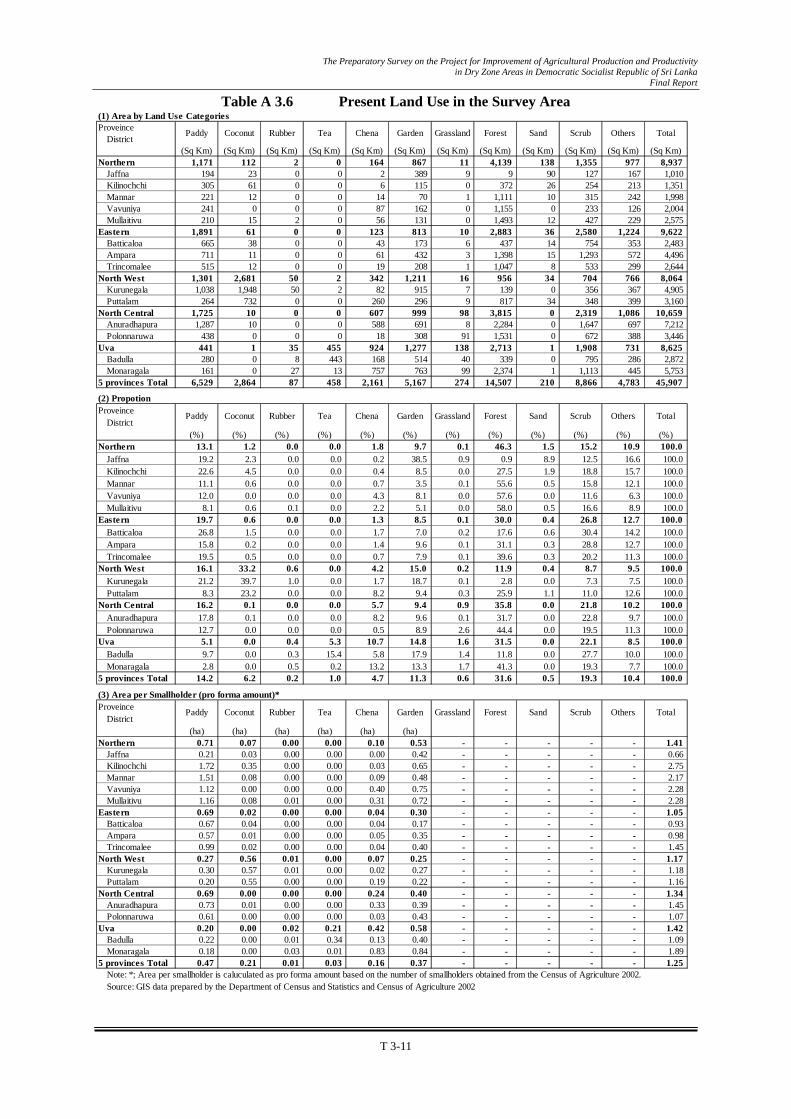
The Preparatory Survey on the Project for Improvement of Agricultural Production and Productivity in Dry Zone Areas in Democratic Socialist Republic of Sri Lanka
Final Report
T 3-11
Table A 3.6 Present Land Use in the Survey Area (1) Area by Land Use CategoriesProveince
District(Sq Km) (Sq Km) (Sq Km) (Sq Km) (Sq Km) (Sq Km) (Sq Km) (Sq Km) (Sq Km) (Sq Km) (Sq Km) (Sq Km)
Northern 1,171 112 2 0 164 867 11 4,139 138 1,355 977 8,937Jaffna 194 23 0 0 2 389 9 9 90 127 167 1,010Kilinochchi 305 61 0 0 6 115 0 372 26 254 213 1,351Mannar 221 12 0 0 14 70 1 1,111 10 315 242 1,998Vavuniya 241 0 0 0 87 162 0 1,155 0 233 126 2,004Mullaitivu 210 15 2 0 56 131 0 1,493 12 427 229 2,575
Eastern 1,891 61 0 0 123 813 10 2,883 36 2,580 1,224 9,622Batticaloa 665 38 0 0 43 173 6 437 14 754 353 2,483Ampara 711 11 0 0 61 432 3 1,398 15 1,293 572 4,496Trincomalee 515 12 0 0 19 208 1 1,047 8 533 299 2,644
North West 1,301 2,681 50 2 342 1,211 16 956 34 704 766 8,064Kurunegala 1,038 1,948 50 2 82 915 7 139 0 356 367 4,905Puttalam 264 732 0 0 260 296 9 817 34 348 399 3,160
North Central 1,725 10 0 0 607 999 98 3,815 0 2,319 1,086 10,659Anuradhapura 1,287 10 0 0 588 691 8 2,284 0 1,647 697 7,212Polonnaruwa 438 0 0 0 18 308 91 1,531 0 672 388 3,446
Uva 441 1 35 455 924 1,277 138 2,713 1 1,908 731 8,625Badulla 280 0 8 443 168 514 40 339 0 795 286 2,872Monaragala 161 0 27 13 757 763 99 2,374 1 1,113 445 5,753
5 provinces Total 6,529 2,864 87 458 2,161 5,167 274 14,507 210 8,866 4,783 45,907
(2) PropotionProveince
District(%) (%) (%) (%) (%) (%) (%) (%) (%) (%) (%) (%)
Northern 13.1 1.2 0.0 0.0 1.8 9.7 0.1 46.3 1.5 15.2 10.9 100.0Jaffna 19.2 2.3 0.0 0.0 0.2 38.5 0.9 0.9 8.9 12.5 16.6 100.0Kilinochchi 22.6 4.5 0.0 0.0 0.4 8.5 0.0 27.5 1.9 18.8 15.7 100.0Mannar 11.1 0.6 0.0 0.0 0.7 3.5 0.1 55.6 0.5 15.8 12.1 100.0Vavuniya 12.0 0.0 0.0 0.0 4.3 8.1 0.0 57.6 0.0 11.6 6.3 100.0Mullaitivu 8.1 0.6 0.1 0.0 2.2 5.1 0.0 58.0 0.5 16.6 8.9 100.0
Eastern 19.7 0.6 0.0 0.0 1.3 8.5 0.1 30.0 0.4 26.8 12.7 100.0Batticaloa 26.8 1.5 0.0 0.0 1.7 7.0 0.2 17.6 0.6 30.4 14.2 100.0Ampara 15.8 0.2 0.0 0.0 1.4 9.6 0.1 31.1 0.3 28.8 12.7 100.0Trincomalee 19.5 0.5 0.0 0.0 0.7 7.9 0.1 39.6 0.3 20.2 11.3 100.0
North West 16.1 33.2 0.6 0.0 4.2 15.0 0.2 11.9 0.4 8.7 9.5 100.0Kurunegala 21.2 39.7 1.0 0.0 1.7 18.7 0.1 2.8 0.0 7.3 7.5 100.0Puttalam 8.3 23.2 0.0 0.0 8.2 9.4 0.3 25.9 1.1 11.0 12.6 100.0
North Central 16.2 0.1 0.0 0.0 5.7 9.4 0.9 35.8 0.0 21.8 10.2 100.0Anuradhapura 17.8 0.1 0.0 0.0 8.2 9.6 0.1 31.7 0.0 22.8 9.7 100.0Polonnaruwa 12.7 0.0 0.0 0.0 0.5 8.9 2.6 44.4 0.0 19.5 11.3 100.0
Uva 5.1 0.0 0.4 5.3 10.7 14.8 1.6 31.5 0.0 22.1 8.5 100.0Badulla 9.7 0.0 0.3 15.4 5.8 17.9 1.4 11.8 0.0 27.7 10.0 100.0Monaragala 2.8 0.0 0.5 0.2 13.2 13.3 1.7 41.3 0.0 19.3 7.7 100.0
5 provinces Total 14.2 6.2 0.2 1.0 4.7 11.3 0.6 31.6 0.5 19.3 10.4 100.0
(3) Area per Smallholder (pro forma amount)*Proveince
District(ha) (ha) (ha) (ha) (ha) (ha)
Northern 0.71 0.07 0.00 0.00 0.10 0.53 - - - - - 1.41Jaffna 0.21 0.03 0.00 0.00 0.00 0.42 - - - - - 0.66Kilinochchi 1.72 0.35 0.00 0.00 0.03 0.65 - - - - - 2.75Mannar 1.51 0.08 0.00 0.00 0.09 0.48 - - - - - 2.17Vavuniya 1.12 0.00 0.00 0.00 0.40 0.75 - - - - - 2.28Mullaitivu 1.16 0.08 0.01 0.00 0.31 0.72 - - - - - 2.28
Eastern 0.69 0.02 0.00 0.00 0.04 0.30 - - - - - 1.05Batticaloa 0.67 0.04 0.00 0.00 0.04 0.17 - - - - - 0.93Ampara 0.57 0.01 0.00 0.00 0.05 0.35 - - - - - 0.98Trincomalee 0.99 0.02 0.00 0.00 0.04 0.40 - - - - - 1.45
North West 0.27 0.56 0.01 0.00 0.07 0.25 - - - - - 1.17Kurunegala 0.30 0.57 0.01 0.00 0.02 0.27 - - - - - 1.18Puttalam 0.20 0.55 0.00 0.00 0.19 0.22 - - - - - 1.16
North Central 0.69 0.00 0.00 0.00 0.24 0.40 - - - - - 1.34Anuradhapura 0.73 0.01 0.00 0.00 0.33 0.39 - - - - - 1.45Polonnaruwa 0.61 0.00 0.00 0.00 0.03 0.43 - - - - - 1.07
Uva 0.20 0.00 0.02 0.21 0.42 0.58 - - - - - 1.42Badulla 0.22 0.00 0.01 0.34 0.13 0.40 - - - - - 1.09Monaragala 0.18 0.00 0.03 0.01 0.83 0.84 - - - - - 1.89
5 provinces Total 0.47 0.21 0.01 0.03 0.16 0.37 - - - - - 1.25Note: *; Area per smallholder is caluculated as pro forma amount based on the number of smallholders obtained from the Census of Agriculture 2002. Source: GIS data prepared by the Department of Census and Statistics and Census of Agriculture 2002
Paddy Coconut Rubber Tea Chena Garden Grassland Forest Sand Scrub Others Total
Paddy Coconut Rubber Tea Chena Garden Grassland Forest Sand Scrub Others Total
Paddy Coconut Rubber Tea Chena Garden Grassland Forest Sand Scrub Others Total

The Preparatory Survey on the Project for Improvement of Agricultural Production and Productivity in Dry Zone Areas in Democratic Socialist Republic of Sri Lanka
Final Report
T 3-12
Table A 3.7 Agricultural Holdings and their Land Extent by District in 2002 (1) Number of Agricultural Holdings (No.)
Province/District Less than or Equal to
0.11 ha More than 0.11 ha Estate Sector above 8.0 ha Total Total excluding
Estate Sector Share in 5 Provinces Share in Sri Lanka
(No.) (No.) (No.) (No.) (No.) (%) (%) North 95,176 68,686 1 163,863 163,862 11.8 5.0
Jaffna 66,526 25,329 0 91,855 91,855 6.6 2.8 Kilinochchi 4,174 13,491 1 17,666 17,665 1.3 0.5 Manner 9,478 5,188 0 14,666 14,666 1.1 0.5 Vauniya 8,649 12,873 0 21,522 21,522 1.6 0.7 Mullaitive 6,349 11,805 0 18,154 18,154 1.3 0.6
East 180,008 95,155 13 275,176 275,163 19.9 8.5 Battikaloa 78,897 20,476 12 99,385 99,373 7.2 3.1 Ampara 67,778 55,822 1 123,601 123,600 8.9 3.8 Trincomalee 33,333 18,857 0 52,190 52,190 3.8 1.6
North-Western 155,619 320,382 2,960 478,961 476,001 34.4 14.6 Kurunegala 90,104 252,111 2,017 344,232 342,215 24.7 10.5 Puttalam 65,515 68,271 943 134,729 133,786 9.7 4.1
North Central 38,670 210,300 45 249,015 248,970 18.0 7.7 Anuradhapura 26,351 150,971 23 177,345 177,322 12.8 5.5 Polonnarwa 12,319 59,329 22 71,670 71,648 5.2 2.2
Uva 47,336 173,883 209 221,428 221,219 16.0 6.8 Badulla 38,733 91,169 186 130,088 129,902 9.4 4.0 Moneragala 8,603 82,714 23 91,340 91,317 6.6 2.8
5 provinces Total 516,809 868,406 3,228 1,388,443 1,385,215 100.0 42.6 Other provinces 946,095 918,209 3,349 1,867,653 1,864,304 57.4 Sri Lanka Total 1,462,904 1,786,615 6,577 3,256,096 3,249,519 100.0
(2) Land Area (ha) Province/District
Less than or Equal to 0.11 ha More than 0.11 ha Estate Sector
above8.0 ha Total Total excluding Estate Sector Share in 5 Provinces Share in
Sri Lanka (ha) (ha) (ha) (ha) (ha) (%) (%)
North 5,736 64,701 16 70,453 70,437 8.3 4.6 Jaffna 4,023 12,853 0 16,876 16,876 2.0 1.1 Kilinochchi 340 14,773 16 15,129 15,113 1.8 1.0 Manner 427 8,365 0 8,792 8,792 1.0 0.6 Vauniya 544 13,023 0 13,567 13,567 1.6 0.9 Mullaitive 402 15,687 0 16,089 16,089 1.9 1.1
East 9,096 117,620 691 127,407 126,716 14.9 8.3 Battikaloa 3,879 28,784 501 33,164 32,663 3.9 2.1 Ampara 3,319 68,514 190 72,023 71,833 8.5 4.7 Trincomalee 1,898 20,322 0 22,220 22,220 2.6 1.5
North-Western 9,962 277,127 71,858 358,947 287,089 33.8 18.7 Kurunegala 6,126 212,941 49,293 268,360 219,067 25.8 14.3 Puttalam 3,836 64,186 22,565 90,587 68,022 8.0 4.4
North Central 2,723 208,236 6,301 217,260 210,959 24.9 13.8 Anuradhapura 1,817 143,726 2,350 147,893 145,543 17.2 9.5 Polonnarwa 906 64,510 3,951 69,367 65,416 7.7 4.3
Uva 2,984 150,158 45,449 198,591 153,142 18.1 10.0 Badulla 2,343 61,809 40,881 105,033 64,152 7.6 4.2 Moneragala 641 88,349 4,568 93,558 88,990 10.5 5.8
5 provinces Total 30,501 817,842 124,315 972,658 848,343 100.0 55.4 Other provinces 51,321 631,703 260,528 943,552 683,024 44.6 Sri Lanka Total 81,822 1,449,545 384,843 1,916,210 1,531,367 100.0
(3) Average Holding Size (ha/holding) Province/District Less than or Equal
to 0.11 ha (ha) More than 0.11 ha
(ha) Estate Sector
above 8.0 ha (ha) Total (ha) Total excluding Estate Sector (ha)
North 0.06 0.94 16.00 0.43 0.43 Jaffna 0.06 0.51 - 0.18 0.18 Kilinochchi 0.08 1.10 16.00 0.86 0.86 Manner 0.05 1.61 - 0.60 0.60 Vauniya 0.06 1.01 - 0.63 0.63 Mullaitive 0.06 1.33 - 0.89 0.89
East 0.05 1.24 53.15 0.46 0.46 Battikaloa 0.05 1.41 41.75 0.33 0.33 Ampara 0.05 1.23 190.00 0.58 0.58 Trincomalee 0.06 1.08 - 0.43 0.43
North-Western 0.06 0.86 24.28 0.75 0.60 Kurunegala 0.07 0.84 24.44 0.78 0.64 Puttalam 0.06 0.94 23.93 0.67 0.51
North Central 0.07 0.99 140.02 0.87 0.85 Anuradhapura 0.07 0.95 102.17 0.83 0.82 Polonnarwa 0.07 1.09 179.59 0.97 0.91
Uva 0.06 0.86 217.46 0.90 0.69 Badulla 0.06 0.68 219.79 0.81 0.49 Moneragala 0.07 1.07 198.61 1.02 0.97
5 provinces Total 0.06 0.94 38.51 0.70 0.61 Other provinces 0.05 0.69 77.79 0.51 0.37 Sri Lanka Total 0.06 0.81 58.51 0.59 0.47 Source: Census of Agriculture 2002, Department of Census and Statistics

The Preparatory Survey on the Project for Improvement of Agricultural Production and Productivity in Dry Zone Areas in Democratic Socialist Republic of Sri Lanka
Final Report
T 3-13
Table A 3.8 Land Holding and Ownership of Small Holdings in the Survey Area (2002)
Small holdings more than 0.1 ha
Owning onlyHomegarden
OwningHomegarden
and Other Land
Owning OtherLand Only
Sub-total
(1) Number of Operators (No.)North 8,823 95,176 15,821 34,686 9,075 59,582 163,581
Jaffna 2,015 66,526 5,848 14,892 2,409 23,149 91,690Kilinochchi 1,677 4,174 3,888 5,693 2,233 11,814 17,665Manner 1,159 9,478 564 2,963 500 4,027 14,664Vauniya 946 8,649 3,519 5,997 2,297 11,813 21,408Mullaitive 3,026 6,349 2,002 5,141 1,636 8,779 18,154
East 9,961 180,008 15,967 55,217 11,815 82,999 272,968Battikaloa 997 78,897 2,502 12,713 4,124 19,339 99,233Ampara 6,698 67,778 8,432 33,209 5,443 47,084 121,560Trincomalee 2,266 33,333 5,033 9,295 2,248 16,576 52,175
North-Western 21,769 155,619 77,420 104,548 111,050 293,018 470,406Kurunegala 14,267 90,104 59,922 87,382 86,430 233,734 338,105Puttalam 7,502 65,515 17,498 17,166 24,620 59,284 132,301
North Central 23,843 38,670 57,370 109,785 14,294 181,449 243,962Anuradhapura 18,223 26,351 43,501 73,980 11,513 128,994 173,568Polonnarwa 5,620 12,319 13,869 35,805 2,781 52,455 70,394
Uva 16,112 47,336 46,396 64,024 43,853 154,273 217,721Badulla 7,119 38,733 15,586 29,205 37,487 82,278 128,130Moneragala 8,993 8,603 30,810 34,819 6,366 71,995 89,591
5 provinces Total 80,508 516,809 212,974 368,260 190,087 771,321 1,368,638Other provinces/districts 58,957 946,095 194,437 279,492 369,634 843,563 1,848,615Sri Lanka Total 139,465 1,462,904 407,411 647,752 559,721 1,614,884 3,217,253(2) Percentage distribution (%)North 5.4 58.2 9.7 21.2 5.5 36.4 100.0
Jaffna 2.2 72.6 6.4 16.2 2.6 25.2 100.0Kilinochchi 9.5 23.6 22.0 32.2 12.6 66.9 100.0Manner 7.9 64.6 3.8 20.2 3.4 27.5 100.0Vauniya 4.4 40.4 16.4 28.0 10.7 55.2 100.0Mullaitive 16.7 35.0 11.0 28.3 9.0 48.4 100.0
East 3.6 65.9 5.8 20.2 4.3 30.4 100.0Battikaloa 1.0 79.5 2.5 12.8 4.2 19.5 100.0Ampara 5.5 55.8 6.9 27.3 4.5 38.7 100.0Trincomalee 4.3 63.9 9.6 17.8 4.3 31.8 100.0
North-Western 4.6 33.1 16.5 22.2 23.6 62.3 100.0Kurunegala 4.2 26.6 17.7 25.8 25.6 69.1 100.0Puttalam 5.7 49.5 13.2 13.0 18.6 44.8 100.0
North Central 9.8 15.9 23.5 45.0 5.9 74.4 100.0Anuradhapura 10.5 15.2 25.1 42.6 6.6 74.3 100.0Polonnarwa 8.0 17.5 19.7 50.9 4.0 74.5 100.0
Uva 7.4 21.7 21.3 29.4 20.1 70.9 100.0Badulla 5.6 30.2 12.2 22.8 29.3 64.2 100.0Moneragala 10.0 9.6 34.4 38.9 7.1 80.4 100.0
5 provinces Total 5.9 37.8 15.6 26.9 13.9 56.4 100.0Other provinces/districts 3.2 51.2 10.5 15.1 20.0 45.6 100.0Sri Lanka Total 4.3 45.5 12.7 20.1 17.4 50.2 100.0
Note: *; This is categorized as "holdings reporting extent less than or equal to 40 perches (1/4 acre) of land with agricultural output mainlyfor home consumption".
Source: Census of Agriculture 2002, Department of Census and Statistics
Small holdingsless than orequal to 0.1
ha*
Total Not OwningAny Land

The Preparatory Survey on the Project for Improvement of Agricultural Production and Productivity in Dry Zone Areas in Democratic Socialist Republic of Sri Lanka
Final Report
T 3-14
Table A 3.9 Production of Paddy and OFCs in the Survey Area in Maha 2008/09 and Yala 2009 (1/6)

The Preparatory Survey on the Project for Improvement of Agricultural Production and Productivity in Dry Zone Areas in Democratic Socialist Republic of Sri Lanka
Final Report
T 3-15
Table A 3.9 Production of Paddy and OFCs in the Survey Area in Maha 2008/09 and Yala 2009 (2/6)

The Preparatory Survey on the Project for Improvement of Agricultural Production and Productivity in Dry Zone Areas in Democratic Socialist Republic of Sri Lanka
Final Report
T 3-16
Table A 3.9 Production of Paddy and OFCs in the Survey Area in Maha 2008/09 and Yala 2009 (3/6)

The Preparatory Survey on the Project for Improvement of Agricultural Production and Productivity in Dry Zone Areas in Democratic Socialist Republic of Sri Lanka
Final Report
T 3-17
Table A 3.9 Production of Paddy and OFCs in the Survey Area in Maha 2008/09 and Yala 2009 (4/6)

The Preparatory Survey on the Project for Improvement of Agricultural Production and Productivity in Dry Zone Areas in Democratic Socialist Republic of Sri Lanka
Final Report
T 3-18
Table A 3.9 Production of Paddy and OFCs in the Survey Area in Maha 2008/09 and Yala 2009 (5/6)

The Preparatory Survey on the Project for Improvement of Agricultural Production and Productivity in Dry Zone Areas in Democratic Socialist Republic of Sri Lanka
Final Report
T 3-19
Table A 3.9 Production of Paddy and OFCs in the Survey Area in Maha 2008/09 and Yala 2009 (6/6)

The Preparatory Survey on the Project for Improvement of Agricultural Production and Productivity in Dry Zone Areas in Democratic Socialist Republic of Sri Lanka
Final Report
T 3-20
Table A 3.10 Vegetable Production in the Survey Area in 2006 (1/2)
Production Production ProductionProvince Produc- Share in Share in Produc- Share in Share in Produc- Share in Share in
District tion S. Area Sri Lanka tion S. Area Sri Lanka tion S. Area Sri Lanka(ha) (kg/ha) (ton) (%) (%) (ha) (kg/ha) (ton) (%) (%) (ha) (kg/ha) (ton) (%) (%)
Ash pumpkin Ash Plantain CucumberNorth 101 7,238 731 (10.5) (8.8) 605 5,916 3,579 (8.9) (5.5) 18 6,889 124 (0.8) (0.5)
Jaffna 45 5,022 226 (3.3) (2.7) 229 7,083 1,622 (4.0) (2.5) 7 6,286 44 (0.3) (0.2)Kilinochchi 9 2,444 22 (0.3) (0.3) 154 3,649 562 (1.4) (0.9) 8 5,875 47 (0.3) (0.2)Mannar 8 7,125 57 (0.8) (0.7) 48 9,146 439 (1.1) (0.7) 3 11,000 33 (0.2) (0.1)Vauniya 39 10,923 426 (6.1) (5.1) 120 5,808 697 (1.7) (1.1) 0 - 0 (0.0) (0.0) Mulaitive 45 5,022 226 (3.3) (2.7) 54 4,796 259 (0.6) (0.4) 0 - 0 (0.0) (0.0)
East 113 5,133 580 (8.4) (7.0) 964 6,330 6,102 (15.2) (9.4) 278 7,511 2,088 (13.4) (8.5)Baticaloa 7 4,571 32 (0.5) (0.4) 199 4,995 994 (2.5) (1.5) 29 3,862 112 (0.7) (0.5)Ampara 98 5,173 507 (7.3) (6.1) 615 7,037 4,328 (10.8) (6.7) 235 7,919 1,861 (11.9) (7.5)Trincomalee 8 5,125 41 (0.6) (0.5) 150 5,200 780 (1.9) (1.2) 14 8,214 115 (0.7) (0.5)
North-Western 196 7,495 1,469 (21.2) (17.7) 1,116 6,898 7,698 (19.2) (11.8) 467 8,084 3,775 (24.2) (15.3)Kurunegala 168 7,387 1,241 (17.9) (15.0) 804 6,500 5,226 (13.0) (8.0) 409 8,281 3,387 (21.7) (13.7)Puttalam 28 8,143 228 (3.3) (2.8) 312 7,923 2,472 (6.2) (3.8) 58 6,690 388 (2.5) (1.6)
North Central 139 12,719 1,768 (25.5) (21.3) 971 5,491 5,332 (13.3) (8.2) 343 9,184 3,150 (20.2) (12.8)Anuradapura 132 13,008 1,717 (24.7) (20.7) 584 4,945 2,888 (7.2) (4.4) 293 9,686 2,838 (18.2) (11.5)Polonnaruwa 7 7,286 51 (0.7) (0.6) 387 6,315 2,444 (6.1) (3.8) 50 6,240 312 (2.0) (1.3)
Uva 194 8,675 1,683 (24.2) (20.3) 2,152 7,666 16,497 (41.0) (25.4) 510 9,625 4,909 (31.5) (19.9)Badulla 20 8,450 169 (0.4) (2.0) 706 7,028 4,962 (12.3) (7.6) 199 11,085 2,206 (5.5) (8.9)Monaragala 174 8,701 1,514 (21.8) (18.3) 1,446 7,977 11,535 (28.7) (17.7) 311 8,691 2,703 (17.3) (11.0)
Mahaweli-H 66 10,788 712 (10.3) (8.6) 88 11,216 987 (2.5) (1.5) 207 7,469 1,546 (9.9) (6.3)5 Provinces Total 809 8,582 6,943 (100.0) (83.8) 5,896 6,817 40,195 (100.0) (61.8) 1,823 8,553 15,592 (100.0) (63.2)Other provinces 160 8,400 1,344 (16.2) 3,308 7,497 24,801 (38.2) 1,024 8,867 9,080 (36.8)SRI LANKA Total 969 8,552 8,287 (100.0) 9,204 7,062 64,996 (100.0) 2,847 8,666 24,672 (100.0)
Ladies finger Bitter gourd Red PumpkinNorth 411 6,321 2,598 (10.9) (6.4) 273 6,883 1,879 (13.9) (6.9) 267 6,318 1,687 (3.1) (2.3)
Jaffna 159 7,623 1,212 (5.1) (3.0) 97 6,598 640 (4.7) (2.4) 111 7,036 781 (1.4) (1.1)Kilinochchi 138 6,638 916 (3.8) (2.3) 75 5,960 447 (3.3) (1.6) 91 3,703 337 (0.6) (0.5)Mannar 27 8,444 228 (1.0) (0.6) 19 6,684 127 (0.9) (0.5) 8 13,250 106 (0.2) (0.1)Vauniya 87 2,782 242 (1.0) (0.6) 82 8,110 665 (4.9) (2.5) 57 8,123 463 (0.8) (0.6) Mulaitive 93 2,989 278 (1.2) (0.7) 83 3,530 293 (2.2) (1.1) 67 7,149 479 (0.9) (0.7)
East 689 7,077 4,876 (20.5) (12.0) 299 6,712 2,007 (14.8) (7.4) 633 8,577 5,429 (10.0) (7.4)Baticaloa 229 7,052 1,615 (6.8) (4.0) 90 5,333 480 (3.5) (1.8) 28 6,000 168 (0.3) (0.2)Ampara 335 6,499 2,177 (9.1) (5.4) 151 6,424 970 (7.2) (3.6) 519 9,071 4,708 (8.6) (6.4)Trincomalee 125 8,672 1,084 (4.6) (2.7) 58 9,603 557 (4.1) (2.1) 86 6,430 553 (1.0) (0.8)
North-Western 813 5,309 4,316 (18.1) (10.6) 507 5,604 2,841 (21.0) (10.5) 901 8,527 7,683 (14.1) (10.5)Kurunegala 582 4,500 2,619 (11.0) (6.4) 331 4,677 1,548 (11.4) (5.7) 725 8,286 6,007 (11.0) (8.2)Puttalam 231 7,346 1,697 (7.1) (4.2) 176 7,347 1,293 (9.5) (4.8) 176 9,523 1,676 (3.1) (2.3)
North Central 857 7,106 6,090 (25.6) (15.0) 494 6,559 3,240 (23.9) (12.0) 1,946 9,462 18,414 (33.8) (25.1)Anuradapura 705 7,387 5,208 (21.9) (12.8) 405 6,753 2,735 (20.2) (10.1) 1,796 9,574 17,195 (31.5) (23.5)Polonnaruwa 152 5,803 882 (3.7) (2.2) 89 5,674 505 (3.7) (1.9) 150 8,127 1,219 (2.2) (1.7)
Uva 744 5,759 4,285 (18.0) (10.5) 434 6,924 3,005 (22.2) (11.1) 1,291 9,500 12,265 (22.5) (16.7)Badulla 266 4,955 1,318 (3.3) (3.2) 154 6,721 1,035 (2.6) (3.8) 450 7,660 3,447 (8.6) (4.7)Monaragala 478 6,207 2,967 (12.5) (7.3) 280 7,036 1,970 (14.5) (7.3) 841 10,485 8,818 (16.2) (12.0)
Mahaweli-H 274 6,004 1,645 (6.9) (4.0) 101 5,733 579 (4.3) (2.1) 748 12,115 9,062 (16.6) (12.4)5 Provinces Total 3,788 6,286 23,810 (100.0) (58.6) 2,108 6,428 13,551 (100.0) (50.0) 5,786 9,426 54,540 (100.0) (74.4)Other provinces 2,858 5,887 16,824 (41.4) 1,835 7,384 13,550 (50.0) 1,399 13,391 18,734 (25.6)SRI LANKA Total 6,646 6,114 40,634 (100.0) 3,943 6,873 27,101 (100.0) 7,185 10,198 73,274 (100.0)
Brinjal Snake gourd CapsicumNorth 815 9,620 7,840 (13.3) (8.9) 194 6,577 1,276 (12.6) (6.0) 142 3,923 557 (7.2) (4.1)
Jaffna 210 8,233 1,729 (2.9) (2.0) 75 7,827 587 (5.8) (2.7) 17 4,706 80 (1.0) (0.6)Kilinochchi 290 7,859 2,279 (3.9) (2.6) 63 5,000 315 (3.1) (1.5) 45 2,756 124 (1.6) (0.9)Mannar 43 13,302 572 (1.0) (0.6) 16 9,000 144 (1.4) (0.7) 19 3,842 73 (0.9) (0.5)Vauniya 272 11,985 3,260 (5.5) (3.7) 40 5,750 230 (2.3) (1.1) 61 4,590 280 (3.6) (2.1) Mulaitive 229 4,629 1,060 (1.8) (1.2) 69 4,174 288 (2.8) (1.3) 57 3,965 226 (2.9) (1.7)
East 807 8,457 6,825 (11.6) (7.7) 268 7,321 1,962 (19.3) (9.2) 26 5,115 133 (1.7) (1.0)Baticaloa 254 9,693 2,462 (4.2) (2.8) 107 5,579 597 (5.9) (2.8) 10 3,200 32 (0.4) (0.2)Ampara 398 7,241 2,882 (4.9) (3.3) 111 7,829 869 (8.6) (4.1) 12 6,833 82 (1.1) (0.6)Trincomalee 155 9,555 1,481 (2.5) (1.7) 50 9,920 496 (4.9) (2.3) 4 4,750 19 (0.2) (0.1)
North-Western 794 6,256 4,967 (8.4) (5.6) 401 7,322 2,936 (28.9) (13.7) 493 3,868 1,907 (24.6) (14.0)Kurunegala 591 5,575 3,295 (5.6) (3.7) 324 6,583 2,133 (21.0) (10.0) 330 3,455 1,140 (14.7) (8.4)Puttalam 203 8,236 1,672 (2.8) (1.9) 77 10,429 803 (7.9) (3.8) 163 4,706 767 (9.9) (5.6)
North Central 1,708 8,515 14,543 (24.7) (16.5) 209 6,067 1,268 (12.5) (5.9) 112 5,357 600 (7.8) (4.4)Anuradapura 1,478 8,874 13,116 (22.3) (14.8) 152 6,263 952 (9.4) (4.5) 93 5,796 539 (7.0) (3.9)Polonnaruwa 230 6,204 1,427 (2.4) (1.6) 57 5,544 316 (3.1) (1.5) 19 3,211 61 (0.8) (0.4)
Uva 1,888 11,684 22,059 (37.5) (25.0) 170 10,782 1,833 (18.0) (8.6) 676 6,139 4,150 (53.6) (30.4)Badulla 1,089 12,621 13,744 (34.2) (15.6) 31 8,613 267 (1.7) (1.2) 557 6,422 3,577 #REF! (26.2)Monaragala 799 10,407 8,315 (14.1) (9.4) 139 11,266 1,566 (15.4) (7.3) 119 4,815 573 (7.4) (4.2)
Mahaweli-H 290 9,107 2,641 (4.5) (3.0) 118 7,475 882 (8.7) (4.1) 116 3,362 390 (5.0) (2.9)5 Provinces Total 6,302 9,342 58,875 (100.0) (66.6) 1,360 7,468 10,157 (100.0) (47.5) 1,565 4,944 7,737 (100.0) (56.7)Other provinces 3,867 7,629 29,500 (33.4) 1,288 8,718 11,229 (52.5) 1,438 4,112 5,913 (43.3)SRI LANKA Total 10,169 8,691 88,375 (100.0) 2,648 8,076 21,386 (100.0) 3,003 4,545 13,650 (100.0)
Area Yield Area YieldArea Yield

The Preparatory Survey on the Project for Improvement of Agricultural Production and Productivity in Dry Zone Areas in Democratic Socialist Republic of Sri Lanka
Final Report
T 3-21
Table A 3.10 Vegetable Production in the Survey Area in 2006 (2/2)
Production Production ProductionProvince Produc- Share in Share in Produc- Share in Share in Produc- Share in Share in
District tion S. Area Sri Lanka tion S. Area Sri Lanka tion S. Area Sri Lanka(ha) (kg/ha) (ton) (%) (%) (ha) (kg/ha) (ton) (%) (%) (ha) (kg/ha) (ton) (%) (%)
Beans Cabbage CarrotNorth 105 4,971 522 (2.1) (1.3) 179 7,983 1,429 (5.9) (2.4) 116 7,526 873 (9.8) (2.4)
Jaffna 92 5,109 470 (1.9) (1.2) 72 7,833 564 (2.3) (0.9) 97 7,825 759 (8.5) (2.1)Kilinochchi 0 - 0 (0.0) (0.0) 44 5,386 237 (1.0) (0.4) 15 6,333 95 (1.1) (0.3)Mannar 3 3,333 10 (0.0) (0.0) 6 14,333 86 (0.4) (0.1) 1 11,000 11 (0.1) (0.0)Vauniya 10 4,200 42 (0.2) (0.1) 57 9,509 542 (2.3) (0.9) 3 2,667 8 (0.1) (0.0) Mulaitive 6 3,500 21 (0.1) (0.1) 41 8,268 339 (1.4) (0.6) 22 4,727 104 (1.2) (0.3)
East 6 3,333 20 (0.1) (0.0) 13 11,462 149 (0.6) (0.3) 0 - 0 (0.0) (0.0)Baticaloa 0 - 0 (0.0) (0.0) 0 - 0 (0.0) (0.0) 0 - 0 (0.0) (0.0)Ampara 5 3,600 18 (0.1) (0.0) 13 11,462 149 (0.6) (0.3) 0 - 0 (0.0) (0.0)Trincomalee 1 2,000 2 (0.0) (0.0) 0 - 0 (0.0) (0.0) 0 - 0 (0.0) (0.0)
North-Western 34 3,206 109 (0.4) (0.3) 117 9,427 1,103 (4.6) (1.9) 0 - 0 (0.0) (0.0)Kurunegala 34 3,206 109 (0.4) (0.3) 6 3,333 20 (0.1) (0.0) 0 - 0 (0.0) (0.0)Puttalam 0 - 0 (0.0) (0.0) 111 9,757 1,083 (4.5) (1.8) 0 - 0 (0.0) (0.0)
North Central 23 3,217 74 (0.3) (0.2) 38 6,974 265 (1.1) (0.4) 0 - 0 (0.0) (0.0)Anuradapura 23 3,217 74 (0.3) (0.2) 38 6,974 265 (1.1) (0.4) 0 - 0 (0.0) (0.0)Polonnaruwa 0 - 0 (0.0) (0.0) 0 - 0 (0.0) (0.0) 0 - 0 (0.0) (0.0)
Uva 3,675 6,669 24,510 (96.6) (60.4) 1,197 17,395 20,822 (86.5) (35.1) 650 12,417 8,071 (90.2) (22.3)Badulla 3,608 6,737 24,307 (60.5) (59.9) 1,196 17,405 20,816 (133.5) (35.1) 650 12,417 8,071 (20.1) (22.3)Monaragala 67 3,030 203 (0.8) (0.5) 1 6,000 6 (0.0) (0.0) 0 - 0 (0.0) (0.0)
Mahaweli-H 41 3,439 141 (0.6) (0.3) 57 5,193 296 (1.2) (0.5) 0 - 0 (0.0) (0.0)5 Provinces Total 3,884 6,533 25,376 (100.0) (62.6) 1,601 15,031 24,064 (100.0) (40.5) 766 11,676 8,944 (100.0) (24.7)Other provinces 3,925 3,867 15,177 (37.4) 2,473 14,281 35,317 (59.5) 2,199 12,417 27,306 (75.3)SRI LANKA Total 7,809 5,193 40,553 (100.0) 4,074 14,576 59,381 (100.0) 2,965 12,226 36,250 (100.0)
Leeks Knoh-Khol RaddishNorth 31 6,484 201 (8.1) (0.8) 1 4,000 4 (0.1) (0.0) 2 4,500 9 (0.1) (0.0)
Jaffna 30 6,533 196 (7.9) (0.8) 0 - 0 (0.0) (0.0) 0 - 0 (0.0) (0.0)Kilinochchi 1 5,000 5 (0.2) (0.0) 1 4,000 4 (0.1) (0.0) 2 4,500 9 (0.1) (0.0)Mannar 0 - 0 (0.0) (0.0) 0 - 0 (0.0) (0.0) 0 - 0 (0.0) (0.0)Vauniya 0 - 0 (0.0) (0.0) 0 - 0 (0.0) (0.0) 0 - 0 (0.0) (0.0) Mulaitive 0 - 0 (0.0) (0.0) 0 - 0 (0.0) (0.0) 0 - 0 (0.0) (0.0)
East 0 - 0 (0.0) (0.0) 1 4,000 4 (0.1) (0.0) 9 8,556 77 (0.7) (0.3)Baticaloa 0 - 0 (0.0) (0.0) 0 - 0 (0.0) (0.0) 0 - 0 (0.0) (0.0)Ampara 0 - 0 (0.0) (0.0) 0 - 0 (0.0) (0.0) 5 13,000 65 (0.6) (0.2)Trincomalee 0 - 0 (0.0) (0.0) 1 4,000 4 (0.1) (0.0) 4 3,000 12 (0.1) (0.0)
North-Western 0 - 0 (0.0) (0.0) 127 9,386 1,192 (16.8) (7.9) 384 9,870 3,790 (32.4) (13.6)Kurunegala 0 - 0 (0.0) (0.0) 127 9,386 1,192 (16.8) (7.9) 218 8,050 1,755 (15.0) (6.3)Puttalam 0 - 0 (0.0) (0.0) 0 - 0 (0.0) (0.0) 166 12,259 2,035 (17.4) (7.3)
North Central 0 - 0 (0.0) (0.0) 11 8,455 93 (1.3) (0.6) 35 7,571 265 (2.3) (0.9)Anuradapura 0 - 0 (0.0) (0.0) 11 8,455 93 (1.3) (0.6) 21 9,000 189 (1.6) (0.7)Polonnaruwa 0 - 0 (0.0) (0.0) 0 - 0 (0.0) (0.0) 14 5,429 76 (0.6) (0.3)
Uva 181 12,646 2,289 (91.9) (9.2) 449 12,430 5,581 (78.8) (36.8) 610 11,997 7,318 (62.6) (26.2)Badulla 181 12,646 2,289 (5.7) (9.2) 449 12,430 5,581 (35.8) (36.8) 586 12,090 7,085 (17.6) (25.4)Monaragala 0 - 0 (0.0) (0.0) 0 - 0 (0.0) (0.0) 24 9,708 233 (2.0) (0.8)
Mahaweli-H 0 - 0 (0.0) (0.0) 28 7,500 210 (3.0) (1.4) 22 10,864 239 (2.0) (0.9)5 Provinces Total 212 11,745 2,490 (100.0) (10.0) 617 11,481 7,084 (100.0) (46.7) 1,062 11,015 11,698 (100.0) (41.9)Other provinces 1,497 14,908 22,317 (90.0) 827 9,791 8,097 (53.3) 1,448 11,187 16,199 (58.1)SRI LANKA Total 1,709 14,516 24,807 (100.0) 1,444 10,513 15,181 (100.0) 2,510 11,114 27,897 (100.0)
Tomato Beet rootNorth 309 6,958 2,150 (7.9) (3.5) 130 7,215 938 (9.4) (3.9)
Jaffna 105 8,448 887 (3.2) (1.5) 78 8,013 625 (6.3) (2.6)Kilinochchi 77 6,091 469 (1.7) (0.8) 22 5,864 129 (1.3) (0.5)Mannar 28 8,250 231 (0.8) (0.4) 3 8,000 24 (0.2) (0.1)Vauniya 99 5,687 563 (2.1) (0.9) 27 5,926 160 (1.6) (0.7) Mulaitive 88 6,307 555 (2.0) (0.9) 22 2,955 65 (0.7) (0.3)
East 163 8,160 1,330 (4.9) (2.2) 0 - 0 (0.0) (0.0)Baticaloa 58 6,121 355 (1.3) (0.6) 0 - 0 (0.0) (0.0)Ampara 72 9,500 684 (2.5) (1.1) 0 - 0 (0.0) (0.0)Trincomalee 33 8,818 291 (1.1) (0.5) 0 - 0 (0.0) (0.0)
North-Western 232 5,987 1,389 (5.1) (2.3) 594 8,237 4,893 (49.0) (20.6)Kurunegala 177 5,712 1,011 (3.7) (1.7) 519 7,969 4,136 (41.5) (17.4)Puttalam 55 6,873 378 (1.4) (0.6) 75 10,093 757 (7.6) (3.2)
North Central 281 8,021 2,254 (8.3) (3.7) 69 10,493 724 (7.3) (3.0)Anuradapura 225 8,902 2,003 (7.3) (3.3) 69 10,493 724 (7.3) (3.0)Polonnaruwa 56 4,482 251 (0.9) (0.4) 0 - 0 (0.0) (0.0)
Uva 1,854 10,539 19,540 (71.6) (32.0) 254 12,071 3,066 (30.7) (12.9)Badulla 1,702 10,804 18,388 (45.7) (30.1) 254 12,071 3,066 (7.6) (12.9)Monaragala 152 7,579 1,152 (4.2) (1.9) 0 - 0 (0.0) (0.0)
Mahaweli-H 95 6,789 645 (2.4) (1.1) 56 6,339 355 (3.6) (1.5)5 Provinces Total 2,934 9,307 27,308 (100.0) (44.7) 1,103 9,044 9,976 (100.0) (42.0)Other provinces 3,699 9,120 33,735 (55.3) 1,210 11,385 13,776 (58.0)SRI LANKA Total 6,633 9,203 61,043 (100.0) 2,313 10,269 23,752 (100.0)
YieldArea Yield Area Yield Area

The Preparatory Survey on the Project for Improvement of Agricultural Production and Productivity in Dry Zone Areas in Democratic Socialist Republic of Sri Lanka
Final Report
T 3-22
Table A 3.11 Fruits Production in the Survey Area in 2006
Production Production ProductionProvince Produc- Share in Share in Produc- Share in Share in Produc- Share in Share in
District tion S. Area Sri Lanka tion S. Area Sri Lanka tion S. Area Sri Lanka(ha) (kg/ha) (ton) (%) (%) (ha) (kg/ha) (ton) (%) (%) (ha) (kg/ha) (ton) (%) (%)
Banana Papaw PineappleNorth 1,327 11,132 14,772 (8.8) (3.9) 165 3,798 627 (6.3) (3.0) 3 2,083 6 (0.0) (0.0)
Jaffna 565 12,871 7,272 (4.3) (1.9) 46 3,759 173 (1.7) (0.8) 0 - 0 (0.0) (0.0)Kilinochchi 366 12,885 4,716 (2.8) (1.2) 43 6,122 263 (2.7) (1.2) 0 - 0 (0.0) (0.0)Mannar 104 6,808 708 (0.4) (0.2) 17 4,626 79 (0.8) (0.4) 0 - 0 (0.0) (0.0)Vaunia 263 6,844 1,800 (1.1) (0.5) 24 758 18 (0.2) (0.1) 0 - 0 (0.0) (0.0) Mulaitive 29 9,517 276 (0.2) (0.1) 35 2,674 94 (0.9) (0.4) 3 2,083 6 (0.0) (0.0)
East 1,445 5,199 7,512 (4.5) (2.0) 126 3,219 406 (4.1) (1.9) 16 391 6 (0.0) (0.0)Baticaloe 372 10,871 4,044 (2.4) (1.1) 46 3,900 179 (1.8) (0.8) 0 - 0 (0.0) (0.0)Ampara 818 2,641 2,160 (1.3) (0.6) 56 2,565 144 (1.4) (0.7) 16 391 6 (0.0) (0.0)Trincomalee 255 5,129 1,308 (0.8) (0.3) 24 3,440 83 (0.8) (0.4) 0 - 0 (0.0) (0.0)
North-Western 10,121 8,176 82,752 (49.3) (21.9) 567 5,426 3,076 (31.0) (14.6) 1,940 14,030 27,218 (80.9) (45.7)Kurunegala 8,311 8,965 74,508 (44.4) (19.7) 263 5,867 1,543 (15.6) (7.3) 1,730 14,566 25,200 (74.9) (42.3)Puttalam 1,810 4,555 8,244 (4.9) (2.2) 304 5,044 1,533 (15.5) (7.3) 210 9,607 2,018 (6.0) (3.4)
North Central 3,213 6,338 20,364 (12.1) (5.4) 702 4,133 2,902 (29.3) (13.7) 7 10,000 70 (0.2) (0.1)Anuradapura 2,208 6,283 13,872 (8.3) (3.7) 405 4,446 1,801 (18.2) (8.5) 7 10,000 70 (0.2) (0.1)Polonnaruwa 1,005 6,460 6,492 (3.9) (1.7) 297 3,707 1,101 (11.1) (5.2) 0 - 0 (0.0) (0.0)
Uva 6,297 6,355 40,020 (23.9) (10.6) 429 5,005 2,147 (21.7) (10.2) 372 10,615 3,949 (11.7) (6.6)Badulla 1,815 7,101 12,888 (7.7) (3.4) 221 5,097 1,126 (11.4) (5.3) 121 13,884 1,680 (5.0) (2.8)Monaragala 4,482 6,054 27,132 (16.2) (7.2) 208 4,906 1,021 (10.3) (4.8) 251 9,039 2,269 (6.7) (3.8)
Mahaweli H 634 3,748 2,376 (1.4) (0.6) 153 4,924 753 (7.6) (3.6) 634 3,748 2,376 (7.1) (4.0)5 povinces Total 23,037 7,284 167,796 (100.0) (44.4) 2,142 4,627 9,911 (100.0) (46.9) 2,972 11,314 33,625 (100.0) (56.5)Other provinces 25,819 8,154 210,540 (55.6) 2,937 3,823 11,227 (53.1) 1,991 13,021 25,925 (43.5)Sri Lanka Total 48,856 7,744 378,336 (100.0) 5,079 4,162 21,138 (100.0) 4,963 11,999 59,550 (100.0)
Mango Orange LimeNorth 918 2,737 2,513 (6.9) (3.6) 155 1,263 196 (6.4) (5.2) 267 290 77 (1.9) (1.6)
Jaffna 465 1,866 868 (2.4) (1.2) 38 987 38 (1.2) (1.0) 85 256 22 (0.5) (0.4)Kilinochchi 115 2,901 334 (0.9) (0.5) 10 1,063 11 (0.3) (0.3) 14 358 5 (0.1) (0.1)Mannar 77 2,781 214 (0.6) (0.3) 14 473 7 (0.2) (0.2) 23 200 5 (0.1) (0.1)Vaunia 121 2,817 341 (0.9) (0.5) 45 936 42 (1.4) (1.1) 73 322 24 (0.6) (0.5) Mulaitive 140 5,401 756 (2.1) (1.1) 48 2,060 99 (3.2) (2.6) 72 314 23 (0.6) (0.5)
East 1,433 1,461 2,094 (5.8) (3.0) 296 384 114 (3.7) (3.0) 1,005 446 448 (11.2) (9.0)Baticaloe 441 1,966 867 (2.4) (1.2) 73 481 35 (1.1) (0.9) 56 384 21 (0.5) (0.4)Ampara 631 878 554 (1.5) (0.8) 160 326 52 (1.7) (1.4) 875 466 408 (10.2) (8.2)Trincomalee 361 1,863 673 (1.9) (1.0) 63 421 27 (0.9) (0.7) 74 247 18 (0.5) (0.4)
North-Western 5,725 2,963 16,965 (46.8) (24.1) 887 930 825 (26.9) (21.9) 1,155 679 784 (19.7) (15.8)Kurunegala 4,768 3,087 14,719 (40.6) (20.9) 543 1,041 566 (18.4) (15.0) 814 782 637 (16.0) (12.8)Puttalam 957 2,347 2,246 (6.2) (3.2) 344 754 259 (8.5) (6.9) 341 432 147 (3.7) (3.0)
North Central 2,452 2,725 6,681 (18.4) (9.5) 795 671 533 (17.4) (14.1) 1,199 364 437 (11.0) (8.8)Anuradapura 1,565 3,086 4,829 (13.3) (6.9) 547 702 384 (12.5) (10.2) 831 388 322 (8.1) (6.5)Polonnaruwa 887 2,088 1,852 (5.1) (2.6) 248 602 149 (4.9) (4.0) 368 312 115 (2.9) (2.3)
Uva 1,984 3,674 7,290 (20.1) (10.4) 848 1,606 1,362 (44.4) (36.1) 2,920 754 2,203 (55.2) (44.4)Badulla 691 5,086 3,515 (9.7) (5.0) 473 1,581 748 (24.4) (19.8) 639 756 483 (12.1) (9.7)Monaragala 1,293 2,920 3,776 (10.4) (5.4) 375 1,638 614 (20.0) (16.3) 2,281 754 1,720 (43.1) (34.6)
Mahaweli H 163 4,312 703 (1.9) (1.0) 48 773 37 (1.2) (1.0) 43 929 40 (1.0) (0.8)5 povinces Total 12,675 2,860 36,245 (100.0) (51.5) 3,029 1,012 3,067 (100.0) (81.3) 6,589 605 3,989 (100.0) (80.3)Other provinces 12,640 2,704 34,173 (48.5) 1,263 559 706 (18.7) 2,384 409 976 (19.7)Sri Lanka Total 25,315 2,782 70,418 (100.0) 4,292 879 3,772 (100.0) 8,973 553 4,965 (100.0)
Passion Fruit CashewNorth 0 - 0 (0.0) (0.0) 206 126 26 (0.5) (0.4)
Jaffna 0 - 0 (0.0) (0.0) 0 - 0 (0.0) (0.0)Kilinochchi 0 - 0 (0.0) (0.0) 2 0 0 (0.0) (0.0)Mannar 0 - 0 (0.0) (0.0) 204 127 26 (0.5) (0.4)Vaunia 0 - 0 (0.0) (0.0) 0 - 0 (0.0) (0.0) Mulaitive 0 - 0 (0.0) (0.0) 0 - 0 (0.0) (0.0)
East 0 - 0 (0.0) (0.0) 1,427 676 965 (20.1) (15.2)Baticaloe 0 - 0 (0.0) (0.0) 754 439 331 (6.9) (5.2)Ampara 0 - 0 (0.0) (0.0) 610 1,025 625 (13.0) (9.9)Trincomalee 0 - 0 (0.0) (0.0) 63 143 9 (0.2) (0.1)
North-Western 31 850 26 (48.8) (4.7) 10,458 283 2,956 (61.6) (46.7)Kurunegala 14 1,135 16 (29.4) (2.8) 5,941 274 1,629 (33.9) (25.7)Puttalam 17 615 10 (19.4) (1.9) 4,517 294 1,327 (27.6) (21.0)
North Central 0 - 0 (0.0) (0.0) 2,251 239 537 (11.2) (8.5)Anuradapura 0 - 0 (0.0) (0.0) 1,791 251 450 (9.4) (7.1)Polonnaruwa 0 - 0 (0.0) (0.0) 460 189 87 (1.8) (1.4)
Uva 30 921 28 (51.2) (4.9) 1,459 206 301 (6.3) (4.8)Badulla 23 1,090 25 (46.5) (4.4) 696 228 159 (3.3) (2.5)Monaragala 7 364 3 (4.7) (0.5) 763 186 142 (3.0) (2.2)
Mahaweli H 0 - 0 (0.0) (0.0) 58 293 17 (0.4) (0.3)5 povinces Total 61 885 54 (100.0) (9.6) 15,859 303 4,802 (100.0) (75.9)Other provinces 288 1,773 511 (90.4) 4,087 373 1,526 (24.1)Sri Lanka Total 349 1,617 564 (100.0) 19,946 317 6,328 (100.0)Note: Cashew is categorized as industrial crop according to HARTI. Source: Agricultural Profile 2006, HARTI
Area Yield Area YieldArea Yield

The Preparatory Survey on the P
roject for Improvem
ent of Agricultural P
roduction and Productivity
in Dry Zone A
reas in Dem
ocratic Socialist Republic of Sri Lanka
Final R
eport
T 3-23
Table A
3.12 O
FC C
ultivation and Production in Target D
istricts (Maha C
ultivation)
Ext. (ha) Prod. (mt) Ext. (ha) Prod. (mt) Ext. (ha) Prod. (mt) Ext. (ha) Prod. (mt) Ext. (ha) Prod. (mt) Ext. (ha) Prod. (mt) Ext. (ha) Prod. (mt) Ext. (ha) Prod. (mt) Ext. (ha) Prod. (mt) Ext. (ha) Prod. (mt) Ext. (ha) Prod. (mt) Ext. (ha) Prod. (mt)
2008 97 78 45 18 87 43 37 18 54 37 693 224 13 4 19 143 550 5,315 81 638 340 5892009 134 97 32 36 74 53 54 45 65 46 283 190 13 4 28 216 603 6,151 52 350 227 5542010 132 101 37 34 118 68 66 33 78 38 417 234 13 11 33 272 679 9,063 74 548 341 6352008 19 11 85 45 175 120 147 98 192 131 32 16 239 173 2 8 63 566 354 8842009
2010
2008 2 1 4 5 16 16 17 21 1 1 25 27 3 1 8 9 11 44 27 632009 2 1 5 6 13 14 20 25 1 1 17 19 1 1 35 38 4 23 1 5 34 792010 1 1 7 8 22 22 25 31 1 1 13 14 3 2 63 68 5 34 12 54 1 7 54 1242008 127 75 101 231 207 183 372 292 1,188 762 94 56 204 219 90 810 11 117 149 8792009 18 11 220 871 278 247 278 219 2,404 1,545 366 217 423 459 44 670 9 72 322 1,9092010 75 45 155 611 199 145 264 201 2,305 2,834 250 148 306 332 27 365 263 1,4802008 7 4 69 52 139 125 134 120 811 694 40 20 714 493 46 436 111 3152009
2010
2008 28 10 285 444 34 17 29 16 35 18 17 6 124 71 34 239 113 1612009 33 11 505 488 30 14 38 17 1 1 43 14 13 4 157 87 34 239 115 1542010 35 12 574 561 188 410 38 19 1 32 15 11 5 318 187 32 231 120 1662008 242 273 6,485 13,655 472 470 1,770 1,822 9 18 19 30 44 27 671 644 17 148 2 24 349 1,0592009 297 207 4,693 16,603 406 432 2,918 4,296 5 8 21 34 69 40 607 1,322 27 133 2 20 314 1,0062010 217 183 4,114 17,073 527 420 1,964 1,760 27 21 20 16 852 1,438 9 73 367 8042008 22 21 850 815 59 47 48 44 3 2 19 15 12 10 171 173 111 1,048 6 60 98 1742009 29 23 496 791 66 65 84 87 28 23 10 10 249 280 150 1,565 119 1382010 18 12 595 1,059 75 73 75 74 16 13 13 9 227 292 226 2,460 135 1582008 353 300 940 797 1,249 666 885 398 38 18 78 55 202 89 841 353 80 257 47 181 737 6142009 367 311 931 792 1,297 715 892 430 32 15 70 67 249 99 911 383 69 195 40 172 761 6092010 470 397 1,243 1,057 1,204 896 995 448 2 1 66 62 201 80 881 361 72 216 29 13 724 5792008 103 102 799 1,752 343 500 306 412 46 56 240 141 541 585 1,097 12,018 1 1 974 3,3282009 92 103 643 1,277 353 471 249 298 43 56 212 181 454 600 830 8,727 829 2,6352010 106 160 466 970 301 405 324 433 51 82 231 233 466 789 1,064 15,741 790 3,5312008 1,552 1,338 16,212 41,786 610 537 935 979 68 79 4,446 5,606 199 158 536 554 25 177 17 133 2,844 13,0582009 1,540 1,640 20,170 54,972 638 780 1,089 1,315 155 245 4,665 4,617 167 151 475 706 23 200 18 235 3,183 13,9432010 1,663 1,674 20,753 54,893 724 884 1,196 1,442 88 145 6,090 5,724 209 195 506 717 20 179 122 1,243 2,394 12,2342008 63 100 516 1,206 154 196 147 204 3 6 8 13 34 20 344 407 20 149 16 129 176 6932009 70 96 744 2,041 172 256 224 303 3 4 29 48 22 14 361 739 33 330 14 177 219 1,0712010 83 97 643 1,777 145 225 174 242 4 5 23 39 37 22 265 643 32 351 10 97 156 6812008 207 289 5,131 7,570 137 152 227 236 3 6 9 8 118 65 55 107 1,014 14,011 68 654 413 8812009 209 308 4,120 8,065 101 113 224 246 4 6 22 24 1 1 67 123 1,518 21,480 78 669 1 6 417 1,0022010 230 428 4,508 9,255 109 108 218 238 4 7 8 13 59 106 1,499 19,898 79 790 432 9032008 873 1,053 8,704 17,999 1,705 1,353 1,582 1,726 57 57 317 195 2,403 2,908 60 543 847 2,9072009 874 961 9,888 24,452 1,643 2,317 1,528 1,648 73 73 280 174 2,330 4,349 72 730 833 3,3982010 944 1,026 13,477 35,898 1,801 1,984 1,699 2,192 348 344 326 193 2,648 5,411 71 715 875 3,4242008 5,023 5,418 42,864 91,046 7,123 6,543 7,665 7,598 219 314 7,025 7,577 2,871 1,469 7,723 7,753 1,618 23,425 2,487 24,532 219 1,874 9,883 33,4052009 5,024 5,571 44,786 114,855 6,674 7,515 8,488 10,062 425 796 7,496 6,595 2,412 1,477 6,877 10,203 1,886 27,452 2,175 21,041 182 1,347 9,479 33,2462010 5,540 6,209 48,887 127,761 6,888 7,594 7,856 8,143 709 1,353 9,081 9,241 2,603 1,701 7,331 11,262 1,893 26,114 2,523 31,734 243 1,074 8,863 31,842
Chillies (Green)Potato
Sri Lanka
Uva
Badulla
Monaragala
NorthWestern
Kurunegala
Puttalama
Black gram Gingely
NorthCentral
Anuradhapura
Pollonnaruwa
Eastern
Baticaloa
Ampara
Trincomalee
Northern
Jaffna
Kilinochchi
Mannar
Vavniya
Mullativu
Green gram Cowpea Ground nut Big onionMaizeProvince District Year
Kurakkan Red onionSoya bean

The Preparatory Survey on the P
roject for Improvem
ent of Agricultural P
roduction and Productivity
in Dry Zone A
reas in Dem
ocratic Socialist Republic of Sri Lanka
Final R
eport
T 3-24
Table A
3.13 O
FC C
ultivation and Production in Target D
istricts (Yala C
ultivation) (1/2)
Ext. (ha) Prod. (mt) Ext. (ha) Prod. (mt) Ext. (ha) Prod. (mt) Ext. (ha) Prod. (mt) Ext. (ha) Prod. (mt) Ext. (ha) Prod. (mt) Ext. (ha) Prod. (mt) Ext. (ha) Prod. (mt) Ext. (ha) Prod. (mt) Ext. (ha) Prod. (mt) Ext. (ha) Prod. (mt) Ext. (ha) Prod. (mt)
2008 122 101 67 58 1 1 5 3 32 21 10 2 609 6,516 218 8492009 138 125 7 13 72 58 9 12 12 8 111 79 20 9 446 3,925 28 316 177 2972010 131 114 5 7 67 58 9 6 5 4 312 149 26 31 533 4,837 19 166 142 2262008 4 2 1 1 27 10 19 7 4 2 27 6 71 284 8 15 15 442009
2010 200 198 16 12 1 1 15 30 98 1,210 6 112008 3 3 2 2 3 2 11 12 4 18 16 362009 1 2 6 6 3 4 1 1 5 2 18 20 8 35 16 852010 1 1 1 24 25 8 10 1 1 5 5 1 20 22 24 103 3 23 23 522008 2 1 19 76 47 42 52 41 117 75 142 84 93 101 158 2,418 86 899 84 4962009 28 112 19 17 38 30 8 5 52 31 170 185 351 5,321 25 250 52 3092010 15 39 15 13 11 9 9 6 160 95 76 82 353 5,358 12 127 55 3272008 3 1 9 7 55 37 45 26 6 4 4 1 157 33 116 1,030 10 64 41 1592009
2010 1 2 93 92 56 42 5 5 111 220 104 1,290 2 36 21 352008 12 3 65 52 12 6 7 3 12 6 12 4 28 20 74 637 84 1722009 10 3 166 201 7 3 2 1 8 4 5 2 16 14 58 468 70 1502010 13 4 188 222 14 7 2 1 2 1 11 5 9 3 52 54 59 476 77 1612008 38 34 372 538 134 123 2,627 2,240 2 4 35 35 1 1 56 53 8 29 6 21 108 2082009 12 7 74 98 135 140 1,074 1,317 10 4 3 2 1 20 22 5 24 1 11 60 1522010 22 28 244 755 109 126 1,017 1,388 1 1 5 4 22 44 4 29 85 2232008 110 119 15 12 7 6 29 29 82 607 47 932009 108 125 13 13 15 15 2 1 2 2 29 31 86 746 4 49 49 752010 110 159 14 13 12 12 36 43 78 767 57 742008 91 56 410 395 581 249 427 299 4 4 107 36 203 53 855 964 79 261 187 1,122 543 8662009 92 55 448 430 627 263 460 322 11 23 85 64 217 56 879 1,318 65 218 175 1,049 607 9722010 143 86 392 376 556 234 459 321 13 24 82 46 265 69 623 872 66 305 148 888 481 7692008 33 58 171 483 114 185 127 177 16 31 135 104 234 219 783 9,479 14 67 666 3,8192009 14 18 65 184 154 148 107 114 16 15 118 78 184 207 939 11,250 569 3,3362010 51 89 39 113 141 169 127 145 7 8 202 150 236 322 1,037 12,425 7 108 613 3,5022008 53 44 589 1,035 67 69 88 102 27 24 107 124 4,058 3,045 47 46 30 251 1,101 13,539 342 1,8192009 11 22 395 888 74 69 86 112 213 516 98 125 6,379 5,518 23 34 32 300 1,284 18,404 284 1,2482010 40 37 502 1,544 63 57 106 120 484 878 240 308 13,888 13,664 34 46 20 181 1,197 19,151 441 2,0842008 15 15 550 1,761 66 90 63 85 6 12 1 2 8 6 114 108 17 174 49 600 80 4512009 16 18 366 1,029 58 85 52 72 2 5 18 12 67 102 12 120 48 466 76 5112010 11 12 418 1,341 54 75 54 73 1 2 14 11 106 189 15 183 48 577 78 4312008 116 135 3,682 10,429 108 101 99 88 10 7 951 699 62 67 2,481 38,689 94 566 2 17 307 7532009 88 116 2,305 7,751 82 79 92 90 21 35 1 1 627 585 43 103 1,827 27,502 68 486 2 13 223 5002010 111 152 4,283 23,203 105 95 121 114 6 10 1 2 603 454 37 60 1,634 20,459 73 676 1 4 250 6132008 94 137 578 1,573 175 262 384 523 2 3 687 592 375 343 66 675 236 1,1882009 31 44 204 448 81 111 299 301 569 442 238 256 51 504 137 3912010 54 78 445 1,233 137 163 493 541 4 4 388 308 300 480 87 861 178 1,7242008 1,056 1,093 8,744 21,241 2,233 2,335 4,496 4,354 1,007 2,718 1,293 1,900 6,641 4,868 2,549 2,498 3,251 51,389 2,391 24,758 3,871 55,497 4,920 17,5982009 878 862 6,071 15,114 1,895 1,742 2,951 3,423 1,229 2,992 372 476 8,469 7,048 2,125 2,874 2,253 34,253 2,323 25,193 4,899 80,380 4,075 13,1682010 1,025 1,098 8,731 33,933 3,395 4,109 3,014 3,466 3,791 6,168 727 750 15,794 15,246 2,150 3,092 1,951 25,819 2,705 30,077 3,915 56,958 4,399 17,161
Sri Lanka
CowpeaProvince District Year
Kurakkan Maize Green gram Soya bean Black gram Sesame Ground nut Chillies (Green)Potato Red onion Big onion
Northern
Jaffna
Kilinochchi
Mannar
Vavniya
Mullativu
Eastern
Baticaloa
Ampara
Trincomalee
NorthWestern
Kurunegara
Puttalama
NorthCentral
Anuradhapura
Pollonnaruwa
Uva
Badulla
Monaragala

The Preparatory Survey on the P
roject for Improvem
ent of Agricultural P
roduction and Productivity
in Dry Zone A
reas in Dem
ocratic Socialist Republic of Sri Lanka
Final R
eport
T 3-25
Table A
3.13 O
FC C
ultivation and Production in Target D
istricts (Yala C
ultivation) (2/2)
Ext. (ha) Prod. (mt) Ext. (ha) Prod. (mt) Ext. (ha) Prod. (mt) Ext. (ha) Prod. (mt) Ext. (ha) Prod. (mt) Ext. (ha) Prod. (mt) Ext. (ha) Prod. (mt) Ext. (ha) Prod. (mt) Ext. (ha) Prod. (mt)
2008 7 12 248 2,4722009 33 58 4 3 230 2,644 1 72010 13 92 189 2,0542008 62 372 4 52009
2010 25 2472008 10 106 2 182009 10 242 1 112010 10 250 1 112008 33 60 92 945 4 452009 65 1,343 2 242010 11 15 57 5842008 42 236 5 192009
2010 16 1602008 3 2 240 2,766 34 1462009 3 2 223 2,805 36 1332010 4 2 270 3,172 31 1092008 14 11 369 3,279 120 8932009 8 10 207 1,447 30 2892010 21 46 1 265 2,459 36 3882008 8 12 126 1,100 11 652009 160 1,559 17 1222010 137 1,541 11 1042008 1 0 8 10 5 2 1,427 9,108 478 2,7352009 3 1 16 22 2 1 1,362 8,647 489 2,7872010 18 24 5 5 2 1 1,321 8,388 367 2,0922008 6 8 200 333 1 1 426 5,080 64 5632009 7 9 72 170 422 4,417 55 4582010 248 407 406 5,842 62 5672008 5 2 13 13 440 4,077 68 3712009 8 6 62 111 13 11 4 5 351 3,982 57 4602010 8 4 22 41 7 14 276 5,014 30 2582008 20 31 5 ??? 6 9 288 2,465 168 2,5232009 34 59 1 2 2 3 237 3,156 116 1,7632010 1 2 118 178 2 1 216 3,103 153 2,4132008 5 5 17 13 18 27 699 9,312 270 1,9122009 12 3 23 18 1 2 2 1 559 7,926 189 1,4952010 5 3 8 6 1 2 1 1 669 9,895 221 1,7342008 14 13 643 8,929 115 9742009 10 8 461 6,360 54 7772010 3 3 504 7832 70 7442008 25 17 - - - - 329 538 257 433 47 61 23 19 9,948 100,138 2,964 23,5822009 41 22 - - - - 789 1,380 136 269 31 38 18 14 9,158 99,140 2,492 20,2782010 25 15 - - - - 850 1,396 301 554 21 23 7 7 9,394 104,126 2,605 20,680
Sri Lanka
NorthCentral
Anuradhapura
Pollonnaruwa
Uva
Badulla
Monaragala
Eastern
Baticaloa
Ampara
Trincomalee
NorthWestern
Kurunegara
Puttalama
Year
Northern
Jaffna
Kilinochchi
Mannar
Vavniya
Mullativu
Mustard Ginger (raw)Province District
Manioc Sweet PotatoTumeric (raw) Tobacco(Cigar) Tobacco(Beedi) Sorgham Meneri

The Preparatory Survey on the P
roject for Improvem
ent of Agricultural P
roduction and Productivity
in Dry Zone A
reas in Dem
ocratic Socialist Republic of Sri Lanka
Final R
eport
T 3-26
Table A
3.14 V
egetable Cultivation and Production in T
arget Districts (M
aha Cultivation)
Ext. (ha) Prod. (mt) Ext. (ha) Prod. (mt) Ext. (ha) Prod. (mt) Ext. (ha) Prod. (mt) Ext. (ha) Prod. (mt) Ext. (ha) Prod. (mt) Ext. (ha) Prod. (mt) Ext. (ha) Prod. (mt) Ext. (ha) Prod. (mt) Ext. (ha) Prod. (mt) Ext. (ha) Prod. (mt) Ext. (ha) Prod. (mt)
2008 9 26 109 692 154 1,217 56 327 76 640 7 25 45 219 51 357 20 100 101 844 146 900 25 1052009 1 4 100 921 161 1,441 103 1,304 85 721 1 8 82 782 60 683 21 143 828 5,852 129 835 25 1182010 4 15 132 948 222 1,684 73 551 117 836 10 38 61 875 62 672 37 244 126 1,024 166 1,328 31 1022008 5 38 87 574 161 1,447 43 215 59 355 8 47 25 137 9 51 47 141 89 354 33 992009
2010
2008 14 84 16 167 9 85 11 72 1 7 1 6 2 12 3 28 18 122 6 262009 14 216 16 243 9 93 8 108 1 13 1 4 4 62 18 366 6 502010 18 274 25 630 11 109 15 246 2 17 4 100 1 7 6 89 27 538 12 922008 3 18 82 762 144 2,674 30 327 72 678 10 85 48 278 35 318 53 264 41 119 77 730 50 2252009 4 40 68 977 152 2,850 36 787 57 1,294 4 53 69 791 26 301 25 127 66 669 83 900 55 4922010 39 561 104 1,910 23 449 46 755 15 175 27 546 12 176 15 71 26 263 10 108 14 832008 32 62 67 192 20 43 24 123 11 79 6 9 1 2 11 13 21 93 16 702009
2010
2008 31 252 109 794 159 1,633 57 307 44 262 25 81 20 123 113 466 3 82009 38 299 138 908 182 1,608 73 374 42 228 18 47 29 135 142 639 4 92010 31 256 132 946 168 1,608 62 357 38 221 9 28 27 156 107 498 3 82008 105 455 259 2,089 250 2,980 84 849 68 594 155 1,311 3 17 1 6 22 65 359 3,374 390 3,413 24 952009 134 799 320 2,650 328 3,788 122 1,834 110 1,834 196 3,089 3 26 1 7 32 94 446 6,568 381 3,628 30 662010 181 2,891 219 2,271 229 3,268 87 1,552 89 1,563 57 1,021 1 11 16 81 444 10,531 206 3,722 12 812008 22 182 76 667 101 1,037 39 371 39 319 14 118 2 8 62 456 89 614 6 252009 74 671 99 1,118 43 519 39 345 19 174 2 10 66 623 87 829 11 632010 38 673 93 908 98 1,162 39 480 44 460 19 190 1 14 5 24 56 590 94 1,024 16 1142008 176 1,189 394 1,617 419 1,886 229 749 178 887 219 1,679 10 19 223 1,658 22 40 334 2,497 455 1,570 214 6322009 263 1,711 397 1,587 481 2,166 183 549 174 824 237 1,836 9 15 222 554 23 44 369 3,227 491 1,695 223 6682010 292 1,856 343 1,322 512 2,303 147 441 175 824 235 1,878 9 13 211 532 18 34 324 2,757 504 1,715 229 6882008 105 635 142 1,186 163 1,496 64 784 61 486 46 405 360 3,554 119 1,087 1 2 96 1,100 132 1,361 178 9102009 120 692 177 1,297 186 1,966 73 825 56 412 37 289 324 2,985 290 2,377 125 1,448 156 1,553 188 1,2772010 94 819 171 1276 153 1,163 60 682 44 395 39 365 200 3386 153 1,528 100 1505 139 1,195 187 8392008 365 1,538 611 3,137 1,225 7,833 108 749 307 1,859 272 2,098 41 288 14 99 83 248 1,729 17,143 470 202 85 2972009 321 2,443 582 3,938 1,147 9,942 141 1,210 274 2,160 220 2,470 27 232 20 123 92 322 1,497 17,395 523 3,892 88 4662010 396 3,298 688 4,082 1,171 8,775 118 725 287 2,074 304 3,076 24 176 14 95 78 382 1,707 20,342 504 2,498 94 3862008 106 761 145 1,306 168 1,680 72 769 68 549 60 577 2 14 4 19 37 125 141 1,437 247 1,822 61 1792009 180 2,136 178 2,746 241 3,530 112 1,114 142 1,567 55 731 1 7 3 33 56 239 156 2,052 213 1,947 57 1622010 161 1,623 165 1,870 222 2,388 78 783 100 1,192 51 576 4 19 2 10 35 177 142 2,096 268 3,397 44 1882008 81 711 179 847 566 6,481 47 416 947 10,368 148 1,544 844 14,895 132 1,382 2,045 11,903 295 1,804 438 2,672 329 1,9992009 79 701 168 1,062 539 6,974 45 394 955 10,015 137 1,441 665 11,782 114 1,412 1,867 11,032 266 2,615 460 3,770 277 1,4712010 96 805 158 827 648 7,826 52 428 1,001 10,948 152 1,583 638 12,649 179 2,077 1,726 12,804 294 3,627 493 4,302 301 1,5552008 168 1,339 256 2,377 508 6,192 90 1,156 192 1,876 191 2,031 1 10 2 19 39 183 800 10,182 746 7,913 48 2192009 195 2,006 266 2,913 512 6,555 81 1,157 154 1,518 194 1,945 1 15 2 19 31 379 714 9,571 721 8,869 42 1932010 167 1,546 276 2,585 527 6,144 85 971 221 2,190 221 2,416 1 10 1 14 25 60 959 12,342 755 9,307 31 1362008 2,562 17,824 4,364 28,053 6,781 60,690 1,956 16,756 4,185 48,496 1,891 17,553 2,643 49,638 1,152 13,621 4,685 25,662 5,147 54,003 5,343 39,311 2,016 9,0622009 2,638 23,444 4,192 33,928 6,535 67,374 1,921 20,339 4,020 41,930 1,774 18,540 2,316 35,682 1,336 12,732 4,615 24,009 5,661 65,028 5,121 44,981 1,818 8,3242010 2,854 27,601 4,185 32,486 6,431 62,048 1,725 18,138 4,139 43,791 1,967 20,322 1,948 34,697 1,370 14,066 4,413 25,623 5,373 69,158 5,099 47,988 1,695 7,252
Ash plantainRed pumpkinBeansBeetrootCucumber Cabbage CapsicumLuffa TomatoBandakka Brinjal
Mannar
Vavniya
Mullativu
Baticaloa
Ampara
Trincomalee
Puttalama
Sri Lanka
Uva
Badulla
Monaragala
NorthCentral
Anuradhapura
Pollonnaruwa
NorthWestern
Kilinochchi
Snake gourdProvince District
Jaffna
Northern
Kurunegara
Eastern
Year

The Preparatory Survey on the P
roject for Improvem
ent of Agricultural P
roduction and Productivity
in Dry Zone A
reas in Dem
ocratic Socialist Republic of Sri Lanka
Final R
eport
T 3-27
Table A
3.15 V
egetable Cultivation and Production in T
arget Districts (Y
ala Cultivation)
Ext. (ha) Prod. (mt) Ext. (ha) Prod. (mt) Ext. (ha) Prod. (mt) Ext. (ha) Prod. (mt) Ext. (ha) Prod. (mt) Ext. (ha) Prod. (mt) Ext. (ha) Prod. (mt) Ext. (ha) Prod. (mt) Ext. (ha) Prod. (mt) Ext. (ha) Prod. (mt) Ext. (ha) Prod. (mt) Ext. (ha) Prod. (mt)
2008 76 589 89 764 35 294 45 408 2 9 25 142 37 324 47 156 57 361 119 985 5 272009 2 10 85 753 134 1,241 43 364 56 539 3 14 40 346 46 480 74 817 102 926 16 822010 88 752 118 1,172 40 389 51 499 3 8 36 351 35 515 1 7 56 762 89 841 9 552008 20 137 52 333 8 40 7 46 8 40 5 31 18 78 26 83 5 102009
2010 22 530 10 288 6 70 15 380 10 382008 7 108 9 220 5 46 5 59 1 13 3 38 11 224 5 382009 8 118 9 228 3 34 5 58 2 19 4 49 11 222 4 282010 16 246 17 429 7 60 10 132 4 40 1 8 4 56 14 272 6 342008 1 10 39 566 80 1,505 22 475 31 591 2 28 23 506 12 252 15 78 37 110 46 502 39 3512009 2 20 28 396 66 1,242 20 429 30 557 3 36 6 141 16 333 2 11 24 242 10 103 21 1842010 3 28 23 329 88 1,652 29 628 44 829 4 50 20 418 2 13 15 46 34 369 13 802008 12 62 38 257 12 81 16 124 8 56 4 18 2 7 18 91 5 30 10 342009
2010 39 950 8 252 11 144 2 51 10 14 3502008 14 118 97 718 105 980 38 203 26 144 14 68 10 64 91 495 10 492009 34 189 84 628 91 838 23 132 14 93 12 60 2 16 22 152 78 408 2 62010 28 171 98 706 106 954 32 150 21 120 12 57 25 180 73 377 5 252008 26 191 151 1,387 190 2,054 74 651 29 275 61 500 2 7 101 1,377 168 1,522 7 302009 18 149 71 599 75 843 32 538 19 212 16 249 102 1,975 117 1,253 3 92010 42 574 88 1,186 109 1,314 40 563 17 202 35 665 185 4,006 573 5,078 4 92008 2 12 43 320 48 370 12 100 9 77 2 14 14 79 50 325 2 112009 11 103 48 397 61 589 16 159 15 132 6 49 1 6 22 174 55 448 4 212010 8 126 43 386 66 686 15 171 14 137 4 42 24 214 61 565 3 182008 228 1,572 346 1,628 413 1,926 151 1,086 133 618 254 2,080 4 5 232 1,044 27 94 377 2,843 378 3,654 176 5312009 272 1,834 388 1,824 398 1,830 184 1,286 122 563 306 2,296 7 9 233 1,049 28 90 369 2,766 384 3,648 194 5812010 236 1,593 309 1,452 345 1,589 141 977 119 548 227 2,271 9 9 254 1,343 19 61 299 2,241 414 3929 203 6092008 81 776 136 826 142 1,713 46 530 29 165 41 434 65 1,121 119 1,326 55 690 115 1,235 145 5092009 77 581 135 770 125 1,266 33 309 20 87 27 232 10 167 111 1,234 82 925 90 575 124 4322010 62 596 139 847 127 1,656 45 574 21 132 29 313 39 680 90 996 82 1,097 128 901 143 6792008 122 511 270 1,372 453 2,458 80 414 79 466 103 834 17 82 55 272 9 43 504 5,282 379 1,907 43 1342009 126 708 276 1,678 468 2,676 72 441 209 516 99 788 12 76 9 61 1 3 705 7,137 263 1,307 54 2302010 129 758 341 2,289 503 3,499 73 408 67 620 83 626 6 63 44 333 2 5 507 5,857 248 1,211 47 2282008 67 659 64 1,105 102 1,469 50 602 30 367 29 268 3 22 6 36 75 1,168 175 2,254 13 62009 55 510 69 1,000 87 1,542 37 379 23 312 19 254 3 5 67 1,280 152 2,025 10 542010 47 444 93 1,418 112 1,725 40 433 21 314 36 490 5 10 87 1,357 160 2,149 15 712008 43 361 126 610 614 7,955 23 231 667 7,848 101 1,028 528 11,802 128 1,790 1,456 8,492 206 5,078 296 2,906 276 1,3592009 56 451 105 576 486 6,811 30 322 610 7,902 87 912 428 11,127 115 1,348 1,443 8,390 178 1,907 266 2,939 238 1,5942010 59 459 118 684 514 7,386 36 282 647 8,133 102 1,098 444 11,294 105 1,138 1,406 8,905 176 2,063 282 2,845 217 1,2562008 104 1,153 188 2,098 222 2,917 66 810 59 679 117 1,266 1 10 1 10 14 35 260 4,448 526 7,006 62 3392009 48 371 113 994 173 2,023 37 441 34 366 61 572 1 10 1 10 6 14 172 2,040 411 5,178 37 1812010 69 645 151 1,471 218 2,702 37 458 35 400 97 888 1 20 7 15 410 4,917 427 4,959 63 3252008 1,765 16,011 3,237 24,075 4,661 43,474 1,449 15,516 3,549 36,202 1,362 13,508 1,825 27,290 1,218 12,257 3,378 16,900 402 3,503 2,590 33,219 4,060 39,0882009 1,790 16,133 3,038 22,621 4,226 39,007 1,247 13,082 3,117 31,987 1,318 13,217 1,699 27,092 1,356 13,932 3,295 16,504 309 3,166 3,536 42,291 3,328 32,6522010 1,854 17,524 3,219 25,302 4,580 45,248 1,420 14,688 3,122 31,544 1,336 13,303 1,729 28,135 1,354 13,889 3,302 17,068 393 4,242 3,315 39,738 4,164 39,330
Sri Lanka
Northern
Jaffna
Kilinochchi
Mannar
Vavniya
Mullativu
NorthWestern
Kurunegara
Puttalama
Eastern
Baticaloa
Anmpara
Trincomalee
Uva
Badulla
Monaragala
NorthCentral
Anuradhapura
Pollonnaruwa
Cabbage Ash plantainRed PumpkinCucumber CapsicumBeansYear Luffa Bandakka Brinjal TomatoProvince District BeetrootSnake gourd
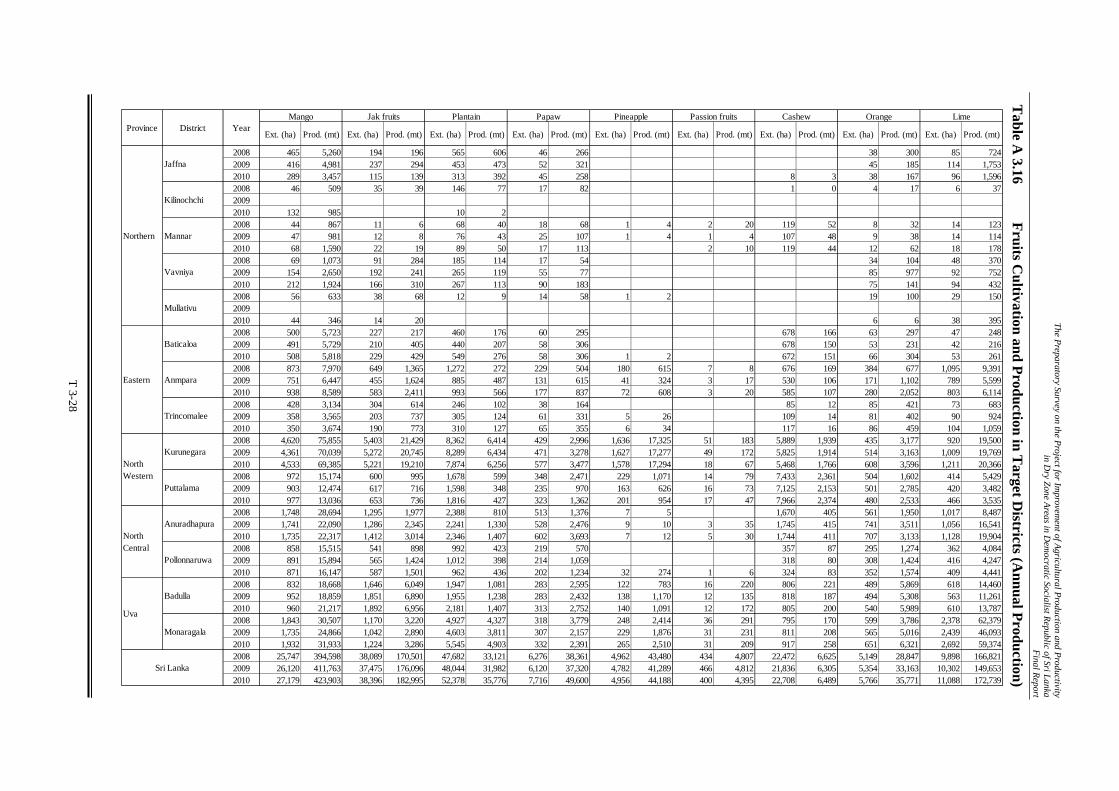
The Preparatory Survey on the P
roject for Improvem
ent of Agricultural P
roduction and Productivity
in Dry Zone A
reas in Dem
ocratic Socialist Republic of Sri Lanka
Final R
eport
T 3-28
Table A
3.16 Fruits C
ultivation and Production in Target D
istricts (Annual Production)
Ext. (ha) Prod. (mt) Ext. (ha) Prod. (mt) Ext. (ha) Prod. (mt) Ext. (ha) Prod. (mt) Ext. (ha) Prod. (mt) Ext. (ha) Prod. (mt) Ext. (ha) Prod. (mt) Ext. (ha) Prod. (mt) Ext. (ha) Prod. (mt)
2008 465 5,260 194 196 565 606 46 266 38 300 85 7242009 416 4,981 237 294 453 473 52 321 45 185 114 1,7532010 289 3,457 115 139 313 392 45 258 8 3 38 167 96 1,5962008 46 509 35 39 146 77 17 82 1 0 4 17 6 3720092010 132 985 10 22008 44 867 11 6 68 40 18 68 1 4 2 20 119 52 8 32 14 1232009 47 981 12 8 76 43 25 107 1 4 1 4 107 48 9 38 14 1142010 68 1,590 22 19 89 50 17 113 2 10 119 44 12 62 18 1782008 69 1,073 91 284 185 114 17 54 34 104 48 3702009 154 2,650 192 241 265 119 55 77 85 977 92 7522010 212 1,924 166 310 267 113 90 183 75 141 94 4322008 56 633 38 68 12 9 14 58 1 2 19 100 29 15020092010 44 346 14 20 6 6 38 3952008 500 5,723 227 217 460 176 60 295 678 166 63 297 47 2482009 491 5,729 210 405 440 207 58 306 678 150 53 231 42 2162010 508 5,818 229 429 549 276 58 306 1 2 672 151 66 304 53 2612008 873 7,970 649 1,365 1,272 272 229 504 180 615 7 8 676 169 384 677 1,095 9,3912009 751 6,447 455 1,624 885 487 131 615 41 324 3 17 530 106 171 1,102 789 5,5992010 938 8,589 583 2,411 993 566 177 837 72 608 3 20 585 107 280 2,052 803 6,1142008 428 3,134 304 614 246 102 38 164 85 12 85 421 73 6832009 358 3,565 203 737 305 124 61 331 5 26 109 14 81 402 90 9242010 350 3,674 190 773 310 127 65 355 6 34 117 16 86 459 104 1,0592008 4,620 75,855 5,403 21,429 8,362 6,414 429 2,996 1,636 17,325 51 183 5,889 1,939 435 3,177 920 19,5002009 4,361 70,039 5,272 20,745 8,289 6,434 471 3,278 1,627 17,277 49 172 5,825 1,914 514 3,163 1,009 19,7692010 4,533 69,385 5,221 19,210 7,874 6,256 577 3,477 1,578 17,294 18 67 5,468 1,766 608 3,596 1,211 20,3662008 972 15,174 600 995 1,678 599 348 2,471 229 1,071 14 79 7,433 2,361 504 1,602 414 5,4292009 903 12,474 617 716 1,598 348 235 970 163 626 16 73 7,125 2,153 501 2,785 420 3,4822010 977 13,036 653 736 1,816 427 323 1,362 201 954 17 47 7,966 2,374 480 2,533 466 3,5352008 1,748 28,694 1,295 1,977 2,388 810 513 1,376 7 5 1,670 405 561 1,950 1,017 8,4872009 1,741 22,090 1,286 2,345 2,241 1,330 528 2,476 9 10 3 35 1,745 415 741 3,511 1,056 16,5412010 1,735 22,317 1,412 3,014 2,346 1,407 602 3,693 7 12 5 30 1,744 411 707 3,133 1,128 19,9042008 858 15,515 541 898 992 423 219 570 357 87 295 1,274 362 4,0842009 891 15,894 565 1,424 1,012 398 214 1,059 318 80 308 1,424 416 4,2472010 871 16,147 587 1,501 962 436 202 1,234 32 274 1 6 324 83 352 1,574 409 4,4412008 832 18,668 1,646 6,049 1,947 1,081 283 2,595 122 783 16 220 806 221 489 5,869 618 14,4602009 952 18,859 1,851 6,890 1,955 1,238 283 2,432 138 1,170 12 135 818 187 494 5,308 563 11,2612010 960 21,217 1,892 6,956 2,181 1,407 313 2,752 140 1,091 12 172 805 200 540 5,989 610 13,7872008 1,843 30,507 1,170 3,220 4,927 4,327 318 3,779 248 2,414 36 291 795 170 599 3,786 2,378 62,3792009 1,735 24,866 1,042 2,890 4,603 3,811 307 2,157 229 1,876 31 231 811 208 565 5,016 2,439 46,0932010 1,932 31,933 1,224 3,286 5,545 4,903 332 2,391 265 2,510 31 209 917 258 651 6,321 2,692 59,3742008 25,747 394,598 38,089 170,501 47,682 33,121 6,276 38,361 4,962 43,480 434 4,807 22,472 6,625 5,149 28,847 9,898 166,8212009 26,120 411,763 37,475 176,096 48,044 31,982 6,120 37,320 4,782 41,289 466 4,812 21,836 6,305 5,354 33,163 10,302 149,6532010 27,179 423,903 38,396 182,995 52,378 35,776 7,716 49,600 4,956 44,188 400 4,395 22,708 6,489 5,766 35,771 11,088 172,739
NorthWestern
Kurunegara
Puttalama
NorthCentral
Anuradhapura
Pollonnaruwa
Sri Lanka
Mannar
Vavniya
Mullativu
Uva
Badulla
Monaragala
Eastern
Baticaloa
Anmpara
Trincomalee
Northern
Jaffna
Kilinochchi
LimePineapple Passion fruits Cashew OrangePlantain PapawProvince District Year
Mango Jak fruits

The Preparatory Survey on the Project for Improvement of Agricultural Production and Productivity in Dry Zone Areas in Democratic Socialist Republic of Sri Lanka
Final Report
T 3-29
Table A 3.17 Duty Changes of Other Field Crops 2000 – 2009 (1/2) 1. Red Onion (%)
Year/Period Cus. Duty VAT NSL PAL SRL SUR NBT Waiver SCL
2000 35.0 12.0 5.5 2001 35.0 12.0 5.5 2002 35.0 Ex 6.5 2003 Rs.5/kg 10.0 2004 Rs.5/kg 15.0 2005 Rs.5/kg 5.0 2006 Rs.5/kg 12.0 5.0 1.5 2007 Rs.5/kg 5.0 3.0 1.0 Rs.5/kg 09.01.’08-26.08.’08 Rs.5/kg 12.0 5.0 1.5 3.0 26.08.’08-07.11.’08 Rs.5/kg 12.0 5.0 1.5 3.0 07.11.’08-04.02.’09 Rs.5/kg 12.0 5.0 1.5 3.0 04.02.’09-09.11.’09 Rs.5/kg 12.0 5.0 1.5 3.0 10.11.’09- Rs.10/kg 2. Big Onion (%)
Year/Period Cus. Duty
VAT NSL PAL SRL SUR NBT Waiver SCL
2000 35.0 12.0 5.5 2001 35.0 12.0 5.5 2002 35.0 6.5 2003 Rs.6/kg 10.0 2004 Rs.10/kg 15.0 2005 Rs.8/kg 5.0 2006 Rs.20/kg 12.0 5.0 1.5 2007 Rs.20/kg 5.0 3.0 09.01.’08-26.08.’08 Rs.20/kg 26.08.’08-07.11.’08 Rs.20/kg 07.11.’08-04.02.’09 Rs.20/kg 04.02.’09-09.11.’09 Rs.25/kg 10.11.’09- Rs.10/kg Abreviations Cus Duty Custom Duty SUR Surcharge VAT Value Added Tax NBT National Building Tax NSL National Security Levy Waiver Duty Waiver PAL Port & Airport Development Levy SCL Special Commodity Levy SRL Social Responsibility Levy Source: Sri Lanka Customs from C.P. Hathurusinghe et al, Production and Marketing of Other Field Crops: A Review, 2012 HARTI

The Preparatory Survey on the Project for Improvement of Agricultural Production and Productivity in Dry Zone Areas in Democratic Socialist Republic of Sri Lanka
Final Report
T 3-30
Table A 3.17 Duty Changes of Other Field Crops 2000 – 2009 (2/2) 3. Dried Chillies (%)
Year/Period Cus. Duty
VAT NSL PAL SRL SUR NBT Waiver SCL
2000 35.0 12.0 5.5 2001 35.0 12.0 5.5 2002 35.0 6.5 2003 Rs.30/kg 10.0 2004 Rs.30/kg 15.0 2005 Rs.30/kg 5.0 2006 Rs.30/kg 12.0 5.0 1.5 2007 Rs.30/kg 5.0 3.0 Rs.12/kg 09.01.’08-26.08.’08 Rs.30/kg 26.08.’08-07.11.’08 Rs.30/kg 07.11.’08-04.02.’09 Rs.30/kg 04.02.’09-09.11.’09 Rs.40/kg 10.11.’09- Rs.20/kg 4. Green Gram (%)
Year/Period Cus. Duty
VAT NSL PAL SRL SUR NBT Waiver SCL
2000 35.0 12.0 5.5 2001 35.0 12.0 5.5 2002 35.0 6.5 2003 Rs.30/kg 10.0 2004 Rs.30/kg 15.0 2005 Rs.30/kg 5.0 2006 Rs.30/kg 12.0 5.0 1.5 15.0 2007 Rs.30/kg 5.0 3.0 1.0 10.0 Rs.5/kg 09.01.’08-26.08.’08 Rs.13/kg 26.08.’08-07.11.’08 Rs.13/kg 07.11.’08-04.02.’09 Rs.13/kg 04.02.’09-09.11.’09 Rs.15/kg 10.11.’09- Rs.15/kg Abreviations Cus Duty Custom Duty SUR Surcharge VAT Value Added Tax NBT National Building Tax NSL National Security Levy Waiver Duty Waiver PAL Port & Airport Development Levy SCL Special Commodity Levy SRL Social Responsibility Levy Source: Sri Lanka Customs from C.P. Hathurusinghe et al, Production and Marketing of Other Field Crops: A Review, 2012 HARTI

The Preparatory Survey on the P
roject for Improvem
ent of Agricultural P
roduction and Productivity
in Dry Zone A
reas in Dem
ocratic Socialist Republic of Sri Lanka
Final R
eport
T 3-31
Table A
3.18 D
edicated Econom
ic Centres
Economic Centre Established
Located District No. ofStall
No. ofTrader
Trade Capacity(Mt/week)
Major Commodity Type of Function Facility
1. Dambulla 1999 Matale 146 145 26,500 vegetable & fruits Wholesale Park, Bank, Police
2. Keppetipola 2001 Badulla 56 56 Upcountryvegetable
Exchange Park, Storage, Canteen
3. Meegoda 2003 Colombo 104 75 Vegetable & fruits Wholesale,Collecting
Generator, Park, Bank,Polica
4. Welisara 2003 Gampaha 122 105 Vegetable & fruits Wholesale
5. Thambuththegama 2005 Anuradhapura 56 50 2,800 Low countryvegetable
Collecting Park, Bank, Police
6. Nuwara-Eliya 2006 Nuwara Eliya 136 129 992.5 Upcountryvegetable
Wholesale &Collecting
Park, Bank, Police,Storage
7. Veyangoda 2007 Gampaha 64 52 Vegetable & fruitsPola vendor-50%,Retail Boutique-25%,Cosumer-25%
Generator, Parki, Polica.Restaurant
8. Kurunduwatta 2008 Kandy 15 15 Spices Collecting Park, Meeting, Bank9. Narahenpita 2008 Colombo 208 143 26,500 Comsumer Items Consumer Park, Bank, Police10. Rathmalana 2009 Colombo 128 110 Comsumer Items Consumer Park, Bank11. Piliyandala 2010 Colombo 56 46 Comsumer Items Consumer Park12. Embilipitiya Rathnapura 45 42 Banana Distribution Open hall,
Source: Website of Ministry of Cooperatives and Internal Trade

The Preparatory Survey on the Project for Improvement of Agricultural Production and Productivity in Dry Zone Areas in Democratic Socialist Republic of Sri Lanka
Final Report
T 3-32
Table A 3.19 Import and Export Information of Selected Commodity : Average of 2000 - 2009 (except 2006 & 2007)
/ItemTradedCountry
DataAvailable
Years
Avg AnnalQuantity
(mt)
Avg AnnalExpenditure
('000$)
Avg Price($/Mt)
TradedCountry
DataAvailable
Years
Avg AnnalQuantity
(mt)
Avg AnnalExpenditure
('000$)
Avg Price($/Mt)
1. OFCChillies and peppers, dry 20 8 28,140 23,956 851 37 5 249 605 2,432Chillies and peppers, green 3 8 22 94 4,196 12 8 26 17 652Onions, dry 21 8 135,536 28,354 209 13 8 40 20 492Beans, dry 25 8 17,803 7,321 411 11 8 34 55 1,611Lentils 33 8 94,397 52,598 557 34 8 3,000 3,175 1,058Peas, dry 20 8 21,934 7,907 360 20 3 54 26 472Maize 17 8 99,466 18,839 189 1 1 0 0Flour of Maize 14 8 325 101 311 6 8 1.875 2.875 1,533Prepared Groundnuts 6 8 277 314 1,133 7 8 6 13 2,191Groundnuts, with shell 1 4 885 438 495 0 0Cassava Dried 2 2 5 1 222 19 8 1,733 903 5212. VegetableVegetables fresh nes 7 8 14 9 688 67 8 6,066 5,334 879Veg.Prod.Fresh Or Dried 3 4 2 7 2,889 1 1 1 2 2,000Vegetables in Vinegar 11 8 37 47 1,260 40 8 3,666 3,771 1,029Vegetables Preserved Nes 0 8 319 425 1,333 15 8 12 33 2,839Cabbages and other brassicas 5 8 9 14 1,554 9 7 9 7 7463. Temperate Zone FruitsApples 23 8 17,575 6,670 379 2 5 11 7 636Grapes 20 8 3,258 3,009 924 3 5 4 7 1,682Oranges 20 8 7,692 2,210 287 7 6 13 17 1,275Citrus fruit, nes 5 8 53 31 579 30 8 999 976 976Tangerines, mandarins, clem. 11 8 2,488 591 238 7 7 9 19 2,129Apricots 2 3 11 4 353 0 1 0 1Pears 10 8 805 240 298 1 3 1 2 1,5004. Fruits Of Sri LankaPineapples 6 5 8 24 3,025 44 8 2,406 2,106 876Pineapples Cand 6 8 10 12 1,175 17 8 209 416 1,991Plantains 2 3 23 20 882 21 5 899 423 471Mangoes, mangosteens, 2 4 2 17 8,625 20 8 48 126 2,644Bananas 0 1 0 0 #DIV/0! 5 3 5 14 2,688Papayas 2 5 16 20 1,250 21 6 228 269 1,182Fruit Juice Nes 25 8 599 474 791 48 8 1,348 2,075 1,539Fruit Dried Nes 16 8 415 228 549 31 8 2,476 1,643 664Cashew Nuts Shelled 7 7 91 291 3,186 30 8 145 922 6,343Cashew nuts, with shell 6 4 310 284 916 0 3 0 45. Oil CommodityCoconuts 5 5 14 7 521 72 8 36,855 9,011 245Coconut (copra) oil 6 7 13,797 3,052 221 29 8 12,073 2,670 221Coconuts Desiccated 12 7 87 79 1,097 111 8 46,217 44,248 957Copra 4 6 384 12,961 736 20 8 288 93 736Coir 5 6 28 13 461 105 6 150,935 34,169 226Palm kernel oil 5 8 15,426 7,106 461 2 5 95 62 649Palm oil 8 8 112,733 56,311 0 8 8 3,915 697 178Rapeseed oil 4 8 41 18 433 0 1 0 2Sesame seed 5 8 305 117 384 14 8 756 602 796Sesame oil 6 8 506 601 1,189 14 8 41 131 3,176Source: FAOSTAT
Import Export

The Preparatory Survey on the P
roject for Improvem
ent of Agricultural P
roduction and Productivity
in Dry Zone A
reas in Dem
ocratic Socialist Republic of Sri Lanka
Final R
eport
T 3-33
Table A
3.20 C
rop Budget per H
ectare for OFC
, Paddy and Vegetables under Present
Conditions (1/3)
Maize Kurakkan Black gram Cowpea Green gram GingellyUnit Unit Value Unit Value Unit Unit Unit Unit
Price Amount Price Amount Price Amount Value Price Amount Value Price Amount Value Price Amount Value(Rs) (Rs) (Rs) (Rs) (Rs) (Rs) (Rs) (Rs) (Rs) (Rs) (Rs) (Rs)
A. Gross IncomeYield (kg) 29.0 2,880.0 83,520.0 60.0 1,020.0 61,200.0 160.0 960.0 153,600.0 135.0 1,030.0 139,050.0 170.0 951.0 161,670.0 120.0 730.0 87,600.0
B. Production Cost1) Seeds (kg) 661.0 11.9 7,865.9 66.0 12.1 798.6 178.0 24.7 4,396.6 154.0 25.2 3,880.8 263.0 24.0 6,312.0 183.0 10.9 1,994.72) Fertilizers
-Urea (kg) 26.0 101.0 2,626.0 26.0 0.0 0.0 26.0 0.0 0.0 26.0 0.0 0.0 26.0 0.0 0.0 26.0 0.0 0.0- TSP (kg) 26.0 73.0 1,898.0 26.0 0.0 0.0 26.0 0.0 0.0 26.0 0.0 0.0 26.0 0.0 0.0 26.0 0.0 0.0- MOP (kg) 26.0 55.0 1,430.0 26.0 0.0 0.0 26.0 0.0 0.0 26.0 0.0 0.0 26.0 0.0 0.0 26.0 0.0 0.0- TDM (kg) 0.0 0.0 0.0 0.0 0.0 0.0 0.0 0.0 0.0 0.0 0.0 0.0 0.0 0.0 0.0 0.0 0.0 0.0- Mixture (kg) 0.0 0.0 0.0 0.0 0.0 0.0 0.0 0.0 0.0 0.0 0.0 0.0 0.0 0.0 0.0 0.0 0.0 0.0- Poultry manure (ton) 0.0 0.0 0.0 0.0 0.0 0.0 0.0 0.0 0.0 0.0 0.0 0.0 0.0 0.0 0.0 0.0 0.0 0.0- Others (LS) 0.0 0.0 0.0 0.0 0.0 0.0 0.0 0.0 0.0 0.0 0.0 0.0 0.0 0.0 0.0 0.0 0.0 0.0 Sub-total 5,954.0 0.0 0.0 0.0 0.0 0.0
3) Agro-chemicals- Herbicide (Rs) 4,600.0 1.0 4,600.0 4,600.0 0.0 0.0 4,600.0 1.0 4,600.0 4,600.0 0.0 0.0 4,600.0 1.0 4,600.0 4,600.0 0.0 0.0- Pesticide (Rs) 4,190.0 1.0 4,190.0 4,190.0 1.0 4,190.0 4,190.0 1.0 4,190.0 4,190.0 1.0 4,190.0 4,190.0 1.0 4,190.0 4,190.0 1.0 4,190.0 Sub-total 8,790.0 4,190.0 8,790.0 4,190.0 8,790.0 4,190.0
4) MachineryLand preparation (Rs) 13,400.0 1.0 13,400.0 13,400.0 1.0 13,400.0 13,400.0 1.0 13,400.0 13,400.0 1.0 13,400.0 13,400.0 1.0 13,400.0 13,400.0 1.0 13,400.0Irrigation by pump (Rs) 23,600.0 0.0 0.0 23,600.0 0.0 0.0 23,600.0 0.0 0.0 23,600.0 0.0 0.0 23,600.0 0.0 0.0 23,600.0 0.0 0.0Thresing and winnowing per ton (ton) 2,450.0 2.9 7,056.0 2,450.0 1.0 2,499.0 2,450.0 1.0 2,352.0 2,450.0 1.0 2,523.5 2,450.0 1.0 2,330.0 2,450.0 0.7 1,788.5Transport produce per ton (ton) 380.0 2.9 1,094.4 380.0 1.0 387.6 380.0 1.0 364.8 380.0 1.0 391.4 380.0 1.0 361.4 380.0 0.7 277.4 Sub-total 21,550.4 16,286.6 16,116.8 16,314.9 16,091.3 15,465.9
5) Human labor- Hired (prn/day) 740.0 30.0 22,200.0 740.0 10.0 7,400.0 740.0 27.0 19,980.0 740.0 12.0 8,880.0 740.0 40.0 29,600.0 740.0 25.0 18,500.0- Family (prn/day) 0.0 54.0 0.0 0.0 89.0 0.0 0.0 25.0 0.0 0.0 84.0 0.0 0.0 32.0 0.0 0.0 35.0 0.0 Sub-total 84.0 22,200.0 99.0 7,400.0 52.0 19,980.0 96.0 8,880.0 72.0 29,600.0 60.0 18,500.0
6) Support (Rs) 0.0 0.0 0.0 0.0 0.0 0.07) Miscellaneous (5%) 3,318.0 1,433.8 2,464.2 1,663.3 3,039.7 2,007.5
Total Cost- Including famliy labour (Rs) 109,638.3 95,969.0 70,247.6 97,089.0 87,513.0 68,058.1- Excluding family labour (Rs) 69,678.3 30,109.0 51,747.6 34,929.0 63,833.0 42,158.1
C. Net Returen- Including famliy labour (Rs) -26,118.3 -34,769.0 83,352.4 41,961.0 74,157.0 19,541.9- Excluding family labour (Rs) 13,841.7 31,091.0 101,852.4 104,121.0 97,837.0 45,441.9
Source (1): For farm inputs, figures available in Cost of Cultivation of Agricultural Crops, 2009/10 Maha and 2010 Yala (DOA) are referred.(2): For prices, those presented in attached Table 3.46C were referred.

The Preparatory Survey on the P
roject for Improvem
ent of Agricultural P
roduction and Productivity
in Dry Zone A
reas in Dem
ocratic Socialist Republic of Sri Lanka
Final R
eport
T 3-34
Table A
3.20 C
rop Budget per H
ectare for OFC
, Paddy and Vegetables under Present
Conditions (2/3)
Soybean Groundnut Chilli (Green) Red onion Big onion Paddy IrrigatedUnit Unit Unit Unit Unit Unit Unit
Price Amount Value Price Amount Value Price Amount Value Price Amount Value Price Amount Value Price Amount Value(Rs) (Rs) (Rs) (Rs) (Rs) (Rs) (Rs) (Rs) (Rs) (Rs) (Rs) (Rs)
A. Gross IncomeYield (kg) 45.0 1,630.0 73,350.0 99.0 1,290.0 127,710.0 100.0 3,700.0 370,000.0 87.0 10,970.0 954,390.0 67.0 10,300.0 690,100.0 28.0 5,500.0 154,000.0
B. Production Cost1) Seeds (kg) 135.0 54.4 7,344.0 111.0 154.0 17,094.0 1,976.0 1.8 3,458.0 112.0 1,406.2 157,494.4 4,201.0 7.7 32,347.7 64.0 139.3 8,915.22) Fertilizers
-Urea (kg) 26.0 0.0 0.0 26.0 0.0 0.0 26.0 197.5 5,135.8 26.0 98.8 2,568.0 26.0 143.0 3,718.0 7.0 369.0 2,583.0- TSP (kg) 26.0 0.0 0.0 26.0 0.0 0.0 26.0 96.3 2,503.8 26.0 207.4 5,392.4 26.0 133.0 3,458.0 7.0 172.0 1,204.0- MOP (kg) 26.0 0.0 0.0 26.0 0.0 0.0 26.0 197.5 5,135.8 26.0 0.0 0.0 26.0 0.0 0.0 7.0 275.0 1,925.0- TDM (kg) 0.0 0.0 0.0 0.0 0.0 0.0 26.0 0.0 0.0 26.0 0.0 0.0 26.0 0.0 0.0 0.0 0.0 0.0- Mixture (kg) 0.0 0.0 0.0 0.0 0.0 0.0 26.0 239.5 6,227.0 26.0 229.6 5,969.6 26.0 377.0 9,802.0 0.0 0.0 0.0- Poultry manure (ton) 0.0 0.0 0.0 0.0 0.0 0.0 2,000.0 0.0 0.0 2,000.0 0.0 0.0 2,000.0 0.0 0.0 0.0 0.0 0.0- Others (LS) 0.0 0.0 0.0 0.0 0.0 0.0 0.0 0.0 0.0 22,000.0 0.0 0.0 22,000.0 0.0 0.0 0.0 0.0 0.0 Sub-total 0.0 0.0 19,002.4 13,930.0 16,978.0 5,712.0
3) Agro-chemicals- Herbicide (Rs) 4,600.0 0.0 0.0 4,600.0 0.0 0.0 5,910.0 0.0 0.0 5,910.0 0.0 0.0 5,910.0 0.0 0.0 8,150.0 1.0 8,150.0- Pesticide (Rs) 4,190.0 1.0 4,190.0 4,190.0 1.0 4,190.0 34,550.0 1.0 34,550.0 34,550.0 1.0 34,550.0 34,550.0 1.0 34,550.0 4,210.0 1.0 4,210.0 Sub-total 4,190.0 4,190.0 34,550.0 34,550.0 34,550.0 12,360.0
4) MachineryLand preparation (Rs) 13,400.0 1.0 13,400.0 13,400.0 1.0 13,400.0 13,400.0 1.0 13,400.0 13,400.0 1.0 13,400.0 13,400.0 1.0 13,400.0 13,400.0 1.0 13,400.0Irrigation by pump (Rs) 23,600.0 0.0 0.0 23,600.0 0.0 0.0 23,600.0 0.5 11,800.0 23,600.0 1.0 23,600.0 23,600.0 1.0 23,600.0 23,600.0 0.0 0.0Thresing and winnowing per ton (ton) 2,450.0 1.6 3,993.5 2,450.0 1.3 3,160.5 2,450.0 0.0 0.0 2,450.0 0.0 0.0 2,450.0 0.0 0.0 2,450.0 5.5 13,475.0Transport produce per ton (ton) 380.0 1.6 619.4 380.0 1.3 490.2 380.0 3.7 1,406.0 380.0 11.0 4,168.6 380.0 10.3 3,914.0 380.0 5.5 2,090.0 Sub-total 18,012.9 17,050.7 26,606.0 41,168.6 40,914.0 28,965.0
5) Human labor- Hired (prn/day) 740.0 32.0 23,680.0 740.0 32.0 23,680.0 740.0 35.0 25,900.0 740.0 166.0 122,840.0 740.0 151.0 111,740.0 740.0 32.0 23,680.0- Family (prn/day) 0.0 56.0 0.0 0.0 94.0 0.0 0.0 245.0 0.0 0.0 54.0 0.0 0.0 64.0 0.0 0.0 35.0 0.0 Sub-total 88.0 23,680.0 126.0 23,680.0 280.0 25,900.0 220.0 122,840.0 215.0 111,740.0 67.0 23,680.0
6) Support (Rs) 0.0 0.0 0.0 0.0 0.0 0.07) Miscellaneous (5%) 2,661.3 3,100.7 5,475.8 18,499.2 11,826.5 3,981.6
Total Cost- Including famliy labour (Rs) 97,328.2 134,675.4 296,292.2 428,442.2 295,716.2 109,513.8- Excluding family labour (Rs) 55,888.2 65,115.4 114,992.2 388,482.2 248,356.2 83,613.8
C. Net Returen- Including famliy labour (Rs) -23,978.2 -6,965.4 73,707.8 525,947.8 394,383.8 44,486.2- Excluding family labour (Rs) 17,461.8 62,594.6 255,007.8 565,907.8 441,743.8 70,386.2
Source (1): For farm inputs, figures available in Cost of Cultivation of Agricultural Crops, 2009/10 Maha and 2010 Yala (DOA) are referred.(2): For prices, those presented in attached Table 3.46C were referred.

The Preparatory Survey on the P
roject for Improvem
ent of Agricultural P
roduction and Productivity
in Dry Zone A
reas in Dem
ocratic Socialist Republic of Sri Lanka
Final R
eport
T 3-35
Table A
3.20 C
rop Budget per H
ectare for OFC
, Paddy and Vegetables under Present
Conditions (3/3)
Paddy Rainfed Brinjal Pumpkin Capsicum Tomato Vegetable's AverageUnit Unit Value Unit Unit Unit Unit
Price Amount Price Amount Value Price Amount Value Price Amount Value Price Amount Value Value(Rs) (Rs) (Rs) (Rs) (Rs) (Rs) (Rs) (Rs) (Rs) (Rs) (Rs)
A. Gross IncomeYield (kg) 28.0 3,500.0 98,000.0 38.5 9,900.0 381,150.0 20.0 11,580.0 231,600.0 90.5 4,600.0 416,070.0 48.5 10,030.0 486,455.0 378,818.8
B. Production Cost1) Seeds (kg) 64.0 102.2 6,540.8 10,092.0 0.6 5,954.3 19,090.0 0.5 9,354.1 11,109.0 1.6 17,307.8 29,568.0 0.4 10,940.22) Fertilizers
-Urea (kg) 7.0 402.0 2,814.0 26.0 325.9 8,474.2 26.0 165.4 4,301.2 26.0 102.0 2,652.0 26.0 61.7 1,605.0- TSP (kg) 7.0 203.0 1,421.0 26.0 135.8 3,530.8 26.0 138.3 3,595.0 26.0 0.0 0.0 26.0 0.0 0.0- MOP (kg) 7.0 388.0 2,716.0 26.0 261.7 6,805.0 26.0 84.0 2,182.7 26.0 0.0 0.0 26.0 0.0 0.0- TDM (kg) 0.0 0.0 0.0 26.0 0.0 0.0 26.0 0.0 0.0 26.0 339.0 8,814.0 26.0 195.1 5,071.6- Mixture (kg) 0.0 0.0 0.0 26.0 0.0 0.0 26.0 0.0 0.0 26.0 473.0 12,298.0 26.0 414.8 10,785.1- Poultry manure (ton) 0.0 0.0 0.0 2,000.0 0.0 0.0 2,000.0 0.0 0.0 2,000.0 8.0 16,000.0 2,000.0 11.0 22,000.0- Others (LS) 0.0 0.0 0.0 0.0 0.0 0.0 0.0 0.0 0.0 0.0 0.0 0.0 0.0 0.0 0.0 Sub-total 6,951.0 18,810.0 10,078.9 39,764.0 39,461.6
3) Agro-chemicals- Herbicide (Rs) 8,150.0 1.0 8,150.0 5,910.0 0.0 0.0 5,910.0 1.0 5,910.0 5,910.0 0.0 0.0 5,910.0 0.0 0.0- Pesticide (Rs) 4,210.0 1.0 4,210.0 34,550.0 1.0 34,550.0 34,550.0 1.0 34,550.0 34,550.0 1.0 37,284.0 34,550.0 1.0 42,232.1 Sub-total 12,360.0 34,550.0 40,460.0 37,284.0 42,232.1
4) MachineryLand preparation (Rs) 13,400.0 1.0 13,400.0 13,400.0 1.0 13,400.0 13,400.0 1.0 13,400.0 13,400.0 1.0 13,400.0 13,400.0 1.0 13,400.0Irrigation by pump (Rs) 23,600.0 0.0 0.0 23,600.0 0.5 11,800.0 23,600.0 0.5 11,800.0 23,600.0 0.5 11,800.0 23,600.0 0.5 11,800.0Thresing and winnowing per ton (ton) 2,450.0 3.5 8,575.0 2,450.0 0.0 0.0 2,450.0 0.0 0.0 2,450.0 0.0 0.0 2,450.0 0.0 0.0Transport produce per ton (ton) 380.0 3.5 1,330.0 380.0 9.9 3,762.0 380.0 11.6 4,400.4 380.0 4.6 1,748.0 380.0 10.0 3,811.4 Sub-total 23,305.0 28,962.0 29,600.4 26,948.0 29,011.4
5) Human labor- Hired (prn/day) 740.0 27.0 19,980.0 740.0 136.0 100,640.0 740.0 15.0 11,100.0 740.0 89.0 65,860.0 740.0 89.0 65,860.0- Family (prn/day) 0.0 49.0 0.0 0.0 180.0 0.0 0.0 79.0 0.0 0.0 171.0 0.0 0.0 194.0 0.0 Sub-total 76.0 19,980.0 316.0 100,640.0 94.0 11,100.0 260.0 65,860.0 283.0 65,860.0
6) Support (Rs) 0.0 0.0 0.0 0.0 44,900.07) Miscellaneous (5%) 3,456.8 9,445.8 5,029.7 9,358.2 11,620.3
Total Cost- Including famliy labour 108,853.6 331,562.1 164,083.1 323,062.0 387,585.5 301,573.2- Excluding family labour 72,593.6 198,362.1 105,623.1 196,522.0 244,025.5 186,133.2
Net Returen- Including famliy labour -10,853.6 49,587.9 67,516.9 93,008.0 98,869.5 77,245.6- Excluding family labour 25,406.4 182,787.9 125,976.9 219,548.0 242,429.5 192,685.6
Source (1): For farm inputs, figures available in Cost of Cultivation of Agricultural Crops, 2009/10 Maha and 2010 Yala (DOA) are referred.(2): For prices, those presented in attached Table 3.46C were referred.

The Preparatory Survey on the P
roject for Improvem
ent of Agricultural P
roduction and Productivity
in Dry Zone A
reas in Dem
ocratic Socialist Republic of Sri Lanka
Final R
eport
T 3-36
Table A
3.21 C
rop Budget per H
ectare for Fruits under Present Condition (1/9)
(1) BananaBanana: 1st Year Banana: 2nd Year Banana: 3rd-7th Year Ave. Banana: 8-12th Yr Ave. Banana: 13-15th Yr Ave. Banana: 15-Year Ave.
Unit Unit Value Value Value Value Value ValuePrice Amount Amount Amount Amount Amount Amount(Rs) (Rs) (Rs) (Rs) (Rs) (Rs) (Rs)
A. Gross IncomeYield (kg) 20.0 0.0 0.0 14,300.0 286,000.0 10,000.0 200,000.0 6,700.0 134,000.0 3,800.0 76,000.0 7,280.0 145,600.0
B. Production Cost1) Suckers (kg) 24.3 1,100.0 26,730.0 0.0 0.0 0.0 0.0 0.0 0.0 0.0 0.0 73.3 1,782.02) Fertilizers
-Urea (kg) 26.0 263.5 6,852.1 0.0 0.0 0.0 0.0 0.0 0.0 0.0 0.0 17.6 456.8- TSP (kg) 26.0 175.7 4,568.1 0.0 0.0 0.0 0.0 0.0 0.0 0.0 0.0 11.7 304.5- MOP (kg) 26.0 548.8 14,267.8 0.0 0.0 0.0 0.0 0.0 0.0 0.0 0.0 36.6 951.2- Compost (ton) 2,000.0 10.0 20,000.0 0.0 0.0 0.0 0.0 0.0 0.0 0.0 0.0 0.7 1,333.3- Others (LS) 0.0 0.0 0.0 0.0 0.0 0.0 0.0 0.0 0.0 0.0 0.0 0.0 0.0 Sub-total 45,688.0 0.0 0.0 0.0 0.0 3,045.9
3) Agro-chemicals- Herbicide (Rs) 12,150.0 0.0 0.0 0.0 0.0 0.0 0.0 0.0 0.0 0.0 0.0 0.0 0.0- Pesticide (Rs) 10,640.0 0.0 0.0 1.0 10,640.0 0.0 0.0 0.0 0.0 0.0 0.0 0.1 709.3- Hormone (Rs) 3,800.0 0.0 0.0 0.0 0.0 0.0 0.0 0.0 0.0 0.0 0.0 0.0 0.0 Sub-total 0.0 10,640.0 0.0 0.0 0.0 709.3
4) MachineryLand preparation (Rs) 13,400.0 1.0 13,400.0 0.0 0.0 0.0 0.0 0.0 0.0 0.0 0.0 0.1 893.3Irrigation by pump (Rs) 23,600.0 0.5 11,800.0 0.5 11,800.0 0.5 11,800.0 0.5 11,800.0 0.5 11,800.0 0.5 11,800.0Transport produce per ton (Rs) 380.0 0.0 0.0 14.3 5,434.0 10.0 3,800.0 6.7 2,546.0 3.8 1,444.0 7.3 2,766.4 Sub-total 25,200.0 17,234.0 15,600.0 14,346.0 13,244.0 15,459.7
5) Human labor- Hired (prn/day) 740.0 94.0 69,560.0 34.8 25,752.0 34.8 25,752.0 34.8 25,752.0 34.8 25,752.0 38.7 28,672.5- Family (prn/day) 0.0 141.0 0.0 52.2 0.0 52.2 0.0 52.2 0.0 52.2 0.0 58.1 0.0 Sub-total 235.0 69,560.0 87.0 25,752.0 87.0 25,752.0 87.0 25,752.0 87.0 25,752.0 96.9 28,672.5
6) Support- Poles and wires (Rs) 70,200.0 0.0 0.0 0.0 0.0 0.0 0.0 0.0 0.0 0.0 0.0 0.0 0.0
7) Miscellaneous (5%) 8,358.9 2,681.3 2,067.6 2,004.9 1,949.8 2,483.5
Total Cost- Including famliy labour 279,876.9 94,935.3 82,047.6 80,730.9 79,573.8 95,161.7- Excluding family labour 175,536.9 56,307.3 43,419.6 42,102.9 40,945.8 52,152.9
C. Net Returen- Including famliy labour -279,876.9 191,064.7 117,952.4 53,269.1 -3,573.8 50,438.3- Excluding family labour -175,536.9 229,692.7 156,580.4 91,897.1 35,054.2 93,447.1
Source: Socio-economic and Planning Centre, DOAFor prices, those presented in attached Table 3.46C were referred.

The Preparatory Survey on the P
roject for Improvem
ent of Agricultural P
roduction and Productivity
in Dry Zone A
reas in Dem
ocratic Socialist Republic of Sri Lanka
Final R
eport
T 3-37
Table A
3.21 C
rop Budget per H
ectare for Fruits under Present Condition (2/9)
(2) PineapplePineapple: 1st Year Pineapple: 2nd Year Pineapple: 3rd Year Pineapple: 4th Year Pineapple: 4-Yr Ave.
Unit Unit Value Value Value Value ValuePrice Amount Amount Amount Amount Amount(Rs) (Rs) (Rs) (Rs) (Rs) (Rs)
A. Gross IncomeYield (fruit) 34.0 0.0 0.0 13,900.0 472,600.0 17,450.0 593,300.0 6,900.0 234,600.0 9,562.5 325,125.0
B. Production Cost1) Suckers (kg) 24.3 12,500.0 303,750.0 0.0 0.0 0.0 0.0 0.0 0.0 3,125.0 75,937.52) Fertilizers
-Urea (kg) 26.0 325.0 8,450.0 292.5 7,605.0 292.5 7,605.0 292.5 7,605.0 300.6 7,816.3- TSP (kg) 26.0 162.5 4,225.0 146.3 3,802.5 146.3 3,802.5 146.3 3,802.5 150.3 3,908.1- MOP (kg) 26.0 487.5 12,675.0 438.8 11,407.5 438.8 11,407.5 438.8 11,407.5 450.9 11,724.4- Compost (ton) 2,000.0 10.0 20,000.0 0.0 0.0 0.0 0.0 0.0 0.0 2.5 5,000.0- Others (LS) 0.0 0.0 0.0 0.0 0.0 0.0 0.0 0.0 0.0 0.0 0.0 Sub-total 20,000.0 0.0 0.0 0.0 5,000.0
3) Agro-chemicals- Herbicide (Rs) 12,150.0 0.0 0.0 0.0 0.0 0.0 0.0 0.0 0.0 0.0 0.0- Pesticide (Rs) 10,640.0 1.0 10,640.0 1.0 10,640.0 1.0 10,640.0 1.0 10,640.0 1.0 10,640.0- Hormone (Rs) 3,800.0 1.0 3,800.0 1.0 3,800.0 1.0 3,800.0 1.0 3,800.0 1.0 3,800.0 Sub-total 14,440.0 14,440.0 14,440.0 14,440.0 14,440.0
4) Machinery- Land preparation (Rs) 13,400.0 1.0 13,400.0 0.0 0.0 0.0 0.0 0.0 0.0 0.3 3,350.0- Irrigation by pump (Rs) 23,600.0 0.5 11,800.0 0.5 11,800.0 0.5 11,800.0 0.5 11,800.0 0.5 11,800.0- Transport produce per ton (Rs) 380.0 0.0 0.0 13.9 5,282.0 17.5 6,631.0 6.9 2,622.0 9.6 3,633.8 Sub-total 25,200.0 17,082.0 18,431.0 14,422.0 18,783.8
5) Human labor- Hired (prn/day) 740.0 59.5 44,030.0 21.7 16,058.0 21.7 16,058.0 21.7 16,058.0 31.2 23,051.0- Family (prn/day) 0.0 90.3 0.0 33.6 0.0 33.6 0.0 33.6 0.0 47.8 0.0 Sub-total 149.8 44,030.0 55.3 16,058.0 55.3 16,058.0 55.3 16,058.0 78.9 23,051.0
6) Support- Poles and wires (Rs) 70,200.0 0.0 0.0 0.0 0.0 0.0 0.0 0.0 0.0 0.0 0.0
7) Miscellaneous (5%) 20,371.0 2,379.0 2,446.5 2,246.0 6,860.6
Total Cost- Including famliy labour 494,613.0 74,823.0 76,239.5 72,030.0 179,426.4- Excluding family labour 427,791.0 49,959.0 51,375.5 47,166.0 144,072.9
C. Net Returen- Including famliy labour -494,613.0 397,777.0 517,060.6 162,570.0 145,698.6- Excluding family labour -427,791.0 422,641.0 541,924.6 187,434.0 181,052.1
Source: Socio-economic and Planning Centre, DOAFor prices, those presented in attached Table 3.46C were referred.

The Preparatory Survey on the P
roject for Improvem
ent of Agricultural P
roduction and Productivity
in Dry Zone A
reas in Dem
ocratic Socialist Republic of Sri Lanka
Final R
eport
T 3-38
Table A
3.21 C
rop Budget per H
ectare for Fruits under Present Condition (3/9)
(3) PapawPapaw: 1st Year Papaw: 2nd Year Papaw: 3rd Year Papaw: 4th Year Papaw: 4-Yr Ave.
Unit Unit Value Value Value Value ValuePrice Amount Amount Amount Amount Amount(Rs) (Rs) (Rs) (Rs) (Rs) (Rs)
A. Gross IncomeYield (fruit) 33.2 0.0 0.0 7,700.0 255,640.0 8,600.0 285,520.0 7,600.0 252,320.0 5,975.0 198,370.0
B. Production Cost1) Seedlings (kg) 36.5 1,125.0 41,062.5 0.0 0.0 0.0 0.0 0.0 0.0 281.3 10,265.62) Fertilizers
-Urea (kg) 26.0 427.0 11,102.0 0.0 0.0 0.0 0.0 0.0 0.0 106.8 2,775.5- TSP (kg) 26.0 247.0 6,422.0 0.0 0.0 0.0 0.0 0.0 0.0 61.8 1,605.5- MOP (kg) 26.0 900.0 23,400.0 0.0 0.0 0.0 0.0 0.0 0.0 225.0 5,850.0- Compost (ton) 2,000.0 10.0 20,000.0 0.0 0.0 0.0 0.0 0.0 0.0 2.5 5,000.0- Others (LS) 0.0 0.0 0.0 0.0 0.0 0.0 0.0 0.0 0.0 0.0 Sub-total 60,924.0 0.0 0.0 0.0 15,231.0
3) Agro-chemicals- Herbicide (Rs) 12,150.0 0.0 0.0 0.0 0.0 0.0 0.0 0.0 0.0 0.0 0.0- Pesticide (Rs) 10,640.0 1.0 10,640.0 0.0 0.0 0.0 0.0 0.0 0.0 0.3 2,660.0- Hormone (Rs) 3,800.0 0.0 0.0 0.0 0.0 0.0 0.0 0.0 0.0 0.0 0.0 Sub-total 10,640.0 0.0 0.0 0.0 2,660.0
4) Machinery- Land preparation (Rs) 13,400.0 1.0 13,400.0 0.0 0.0 0.0 0.0 0.0 0.0 0.3 3,350.0- Irrigation by pump (Rs) 23,600.0 0.5 11,800.0 0.5 11,800.0 0.5 11,800.0 0.5 11,800.0 0.5 11,800.0- Transport produce per ton (Rs) 380.0 0.0 0.0 7.7 2,926.0 8.6 3,268.0 7.6 2,888.0 6.0 2,270.5 Sub-total 25,200.0 14,726.0 15,068.0 14,688.0 17,420.5
5) Human labor- Hired (prn/day) 740.0 85.0 62,900.0 31.0 22,940.0 31.0 22,940.0 31.0 22,940.0 44.5 32,930.0- Family (prn/day) 0.0 129.0 0.0 48.0 0.0 48.0 0.0 48.0 0.0 68.3 0.0 Sub-total 214.0 62,900.0 79.0 22,940.0 79.0 22,940.0 79.0 22,940.0 112.8 32,930.0
6) Support- Poles and wires (Rs) 70,200.0 0.0 0.0 0.0 0.0 0.0 0.0 0.0 0.0 0.0 0.0
7) Miscellaneous (5%) 10,036.3 1,883.3 1,900.4 1,881.4 3,925.4
Total Cost- Including famliy labour 306,222.8 75,069.3 75,428.4 75,029.4 132,937.5- Excluding family labour 210,762.8 39,549.3 39,908.4 39,509.4 82,432.5
C. Net Returen- Including famliy labour -306,222.8 180,570.7 210,091.6 177,290.6 65,432.5- Excluding family labour -210,762.8 216,090.7 245,611.6 212,810.6 115,937.5
Source: Socio-economic and Planning Centre, DOAFor prices, those presented in attached Table 3.46C were referred.

The Preparatory Survey on the P
roject for Improvem
ent of Agricultural P
roduction and Productivity
in Dry Zone A
reas in Dem
ocratic Socialist Republic of Sri Lanka
Final R
eport
T 3-39
Table A
3.21 C
rop Budget per H
ectare for Fruits under Present Condition (4/9)
(4) Passion fruitPassion fruit: 1st Year Passion fruit: 2nd Year Passion fruit: 3rd Year Passion fruit: 4th Year Passion fruit: 5th Year Passion fruit: 5-Yr Ave.
Unit Unit Value Value Value Value Value ValuePrice Amount Amount Amount Amount Amount Amount(Rs) (Rs) (Rs) (Rs) (Rs) (Rs) (Rs)
A. Gross IncomeYield (kg) 51.3 0.0 0.0 9,050.0 464,265.0 9,650.0 495,045.0 7,240.0 371,412.0 4,820.0 247,266.0 6,152.0 315,597.6
B. Production Cost1) Seedling (kg) 15.0 1,125.0 16,875.0 0.0 0.0 0.0 0.0 0.0 0.0 0.0 0.0 225.0 3,375.02) Fertilizers
-Urea (kg) 26.0 133.0 3,458.0 133.0 3,458.0 201.0 5,226.0 271.0 7,046.0 204.0 5,304.0 188.4 4,898.4- TSP (kg) 26.0 238.0 6,188.0 238.0 6,188.0 358.0 9,308.0 483.0 12,558.0 364.0 9,464.0 336.2 8,741.2- MOP (kg) 26.0 119.0 3,094.0 119.0 3,094.0 179.0 4,654.0 242.0 6,292.0 182.0 4,732.0 168.2 4,373.2- Compost (ton) 2,000.0 10.0 20,000.0 0.0 0.0 0.0 0.0 0.0 0.0 0.0 0.0 2.0 4,000.0- Others (LS) 0.0 1.0 0.0 1.0 0.0 1.0 0.0 1.0 0.0 1.0 0.0 1.0 0.0 Sub-total 32,740.0 12,740.0 19,188.0 25,896.0 19,500.0 22,012.8
3) Agro-chemicals- Herbicide (Rs) 12,150.0 0.0 0.0 0.0 0.0 0.0 0.0 0.0 0.0 0.0 0.0 0.0 0.0- Pesticide (Rs) 10,640.0 1.0 10,640.0 1.0 10,640.0 1.0 10,640.0 1.0 10,640.0 1.0 10,640.0 1.0 10,640.0- Hormone (Rs) 3,800.0 0.0 0.0 0.0 0.0 0.0 0.0 0.0 0.0 0.0 0.0 0.0 0.0 Sub-total 10,640.0 10,640.0 10,640.0 10,640.0 10,640.0 10,640.0
4) Machinery- Land preparation (Rs) 13,400.0 1.0 13,400.0 0.0 0.0 0.0 0.0 0.0 0.0 0.0 0.0 0.2 2,680.0- Irrigation by pump (Rs) 23,600.0 0.5 11,800.0 0.5 11,800.0 0.5 11,800.0 0.5 11,800.0 0.5 11,800.0 0.5 11,800.0- Transport produce per ton (Rs) 380.0 0.0 0.0 9.1 3,439.0 9.7 3,667.0 7.2 2,751.2 4.8 1,831.6 6.2 2,337.8 Sub-total 25,200.0 15,239.0 15,467.0 14,551.2 13,631.6 16,817.8
5) Human labor- Hired (prn/day) 740.0 118.0 87,320.0 80.0 59,200.0 87.0 64,380.0 80.0 59,200.0 67.0 49,580.0 86.4 63,936.0- Family (prn/day) 0.0 185.0 0.0 125.0 0.0 136.0 0.0 125.0 0.0 105.0 0.0 135.2 0.0 Sub-total 303.0 87,320.0 205.0 59,200.0 223.0 64,380.0 205.0 59,200.0 172.0 49,580.0 221.6 63,936.0
6) Support- Poles and wires (Rs) 70,200.0 1.0 70,200.0 0.0 0.0 0.0 0.0 0.0 0.0 0.0 0.0 0.2 14,040.0
7) Miscellaneous (5%) 12,148.8 4,891.0 5,483.8 5,514.4 4,667.6 6,541.1
Total Cost- Including famliy labour 392,023.8 195,210.0 215,798.8 208,301.6 175,719.2 237,410.6- Excluding family labour 255,123.8 102,710.0 115,158.8 115,801.6 98,019.2 137,362.6
C. Net Returen- Including famliy labour -392,023.8 269,055.1 279,246.3 163,110.4 71,546.8 78,187.0- Excluding family labour -255,123.8 361,555.1 379,886.3 255,610.4 149,246.8 178,235.0
Source: Socio-economic and Planning Centre, DOAFor prices, those presented in attached Table 3.46C were referred.

The Preparatory Survey on the P
roject for Improvem
ent of Agricultural P
roduction and Productivity
in Dry Zone A
reas in Dem
ocratic Socialist Republic of Sri Lanka
Final R
eport
T 3-40
Table A
3.21 C
rop Budget per H
ectare for Fruits under Present Condition (5/9)
(5) MangoMango: 1st Year Mango: 2nd Year Mango: 3rd Year Mango: 4th Year Mango: 5th Year Mango: 6th Year Mango: 7-20th Yr Ave. Mango: 20-Yr Ave.
Unit Unit Value Value Value Value Value Value Value ValuePrice Amount Amount Amount Amount Amount Amount Amount Amount(Rs) (Rs) (Rs) (Rs) (Rs) (Rs) (Rs) (Rs) (Rs)
A. Gross IncomeYield (kg) 58.2 0.0 0.0 0.0 0.0 0.0 0.0 0.0 0.0 1,400.0 81,480.0 4,000.0 232,800.0 9,800.0 570,360.0 7,130.0 414,966.0
B. Production Cost1) Seedling (kg) 121.6 105.0 12,768.0 0.0 0.0 0.0 0.0 0.0 0.0 0.0 0.0 0.0 0.0 0.0 0.0 5.3 638.42) Fertilizers
-Urea (kg) 26.0 18.0 468.0 27.0 702.0 36.0 936.0 36.0 936.0 45.0 1,170.0 58.0 1,508.0 89.0 2,314.0 73.3 1,905.8- TSP (kg) 26.0 22.0 572.0 33.0 858.0 44.0 1,144.0 44.0 1,144.0 55.0 1,430.0 70.0 1,820.0 108.0 2,808.0 89.0 2,314.0- MOP (kg) 26.0 10.0 260.0 15.0 390.0 20.0 520.0 20.0 520.0 25.0 650.0 32.0 832.0 49.0 1,274.0 40.4 1,050.4- Compost (ton) 2,000.0 10.0 20,000.0 10.0 20,000.0 10.0 20,000.0 10.0 20,000.0 10.0 20,000.0 10.0 20,000.0 10.0 20,000.0 10.0 20,000.0- Others (LS) 0.0 0.0 0.0 0.0 0.0 0.0 0.0 0.0 0.0 0.0 0.0 0.0 0.0 0.0 0.0 0.0 0.0 Sub-total 21,300.0 21,950.0 22,600.0 22,600.0 23,250.0 24,160.0 26,396.0 25,270.2
3) Agro-chemicals- Herbicide (Rs) 12,150.0 1.0 12,150.0 0.0 0.0 0.0 0.0 0.0 0.0 0.0 0.0 0.0 0.0 0.0 0.0 0.1 607.5- Pesticide (Rs) 10,640.0 0.0 0.0 1.0 10,640.0 1.0 10,640.0 1.0 10,640.0 1.0 10,640.0 1.0 10,640.0 1.0 10,640.0 1.0 10,108.0- Hormone (Rs) 3,800.0 0.0 0.0 0.0 0.0 0.0 0.0 0.0 0.0 0.0 0.0 0.0 0.0 0.0 0.0 0.0 0.0 Sub-total 12,150.0 10,640.0 10,640.0 10,640.0 10,640.0 10,640.0 10,640.0 10,715.5
4) MachineryLand preparation (Rs) 13,400.0 1.0 13,400.0 0.0 0.0 0.0 0.0 0.0 0.0 0.0 0.0 0.0 0.0 0.0 0.0 0.1 670.0Irrigation by pump (Rs) 23,600.0 0.5 11,800.0 0.5 11,800.0 0.5 11,800.0 0.5 11,800.0 0.5 11,800.0 0.5 11,800.0 0.5 11,800.0 0.5 11,800.0Transport produce per ton (Rs) 380.0 0.0 0.0 0.0 0.0 0.0 0.0 0.0 0.0 1.4 532.0 4.0 1,520.0 9.8 3,724.0 7.1 2,709.4 Sub-total 25,200.0 11,800.0 11,800.0 11,800.0 12,332.0 13,320.0 15,524.0 15,179.4
5) Human labor- Hired (prn/day) 740.0 47.0 34,780.0 37.0 27,380.0 38.0 28,120.0 46.0 34,040.0 51.0 37,740.0 43.0 31,820.0 44.0 32,560.0 43.9 32,486.0- Family (prn/day) 0.0 73.0 0.0 57.0 0.0 59.0 0.0 73.0 0.0 80.0 0.0 68.0 0.0 69.0 0.0 68.8 0.0 Sub-total 120.0 34,780.0 94.0 27,380.0 97.0 28,120.0 119.0 34,040.0 131.0 37,740.0 111.0 31,820.0 113.0 32,560.0 112.7 32,486.0
6) Support- Poles and wires (Rs) 70,200.0 0.0 0.0 0.0 0.0 0.0 0.0 0.0 0.0 0.0 0.0 0.0 0.0 0.0 0.0 0.0 0.0
7) Miscellaneous (5%) 5,309.9 3,588.5 3,658.0 3,954.0 4,198.1 3,997.0 4,256.0 4,214.5
Total Cost- Including famliy labour 165,527.9 117,538.5 120,478.0 137,054.0 147,360.1 134,257.0 140,436.0 139,416.0- Excluding family labour 111,507.9 75,358.5 76,818.0 83,034.0 88,160.1 83,937.0 89,376.0 88,504.0
C. Net Returen- Including famliy labour -165,527.9 -117,538.5 -120,478.0 -137,054.0 -65,880.1 98,543.0 429,924.0 275,550.0- Excluding family labour -111,507.9 -75,358.5 -76,818.0 -83,034.0 -6,680.1 148,863.0 480,984.0 326,462.0
Source: Socio-economic and Planning Centre, DOAFor prices, those presented in attached Table 3.46C were referred.

The Preparatory Survey on the P
roject for Improvem
ent of Agricultural P
roduction and Productivity
in Dry Zone A
reas in Dem
ocratic Socialist Republic of Sri Lanka
Final R
eport
T 3-41
Table A
3.21 C
rop Budget per H
ectare for Fruits under Present Condition (6/9)
(6) OrangeOrange: 1st Year Orange: 2nd Year Orange: 3rd Year Orange: 4th Year Orange: 5th Year Orange: 6-8th Yr Ave. Orange: 9-15th Yr Ave. Orange: 15-Yr Ave.
Unit Unit Value Value Value Value Value Value Value ValuePrice Amount Amount Amount Amount Amount Amount Amount Amount(Rs) (Rs) (Rs) (Rs) (Rs) (Rs) (Rs) (Rs) (Rs)
A. Gross IncomeYield (fruit) 76.8 0.0 0.0 0.0 0.0 0.0 0.0 1,300.0 99,840.0 3,070.0 235,776.0 10,150.0 779,520.0 10,150.0 779,520.0 6,381.3 490,086.4
B. Production Cost1) Seedlings (kg) 121.6 562.0 68,339.2 0.0 0.0 0.0 0.0 0.0 0.0 0.0 0.0 0.0 0.0 0.0 0.0 37.5 4,555.92) Fertilizers
-Urea (kg) 26.0 48.0 1,248.0 66.0 1,716.0 59.0 1,534.0 96.0 2,496.0 128.0 3,328.0 137.0 3,562.0 137.0 3,562.0 108.7 2,825.3- TSP (kg) 26.0 75.0 1,950.0 82.0 2,132.0 73.0 1,898.0 120.0 3,120.0 159.0 4,134.0 170.0 4,420.0 170.0 4,420.0 135.9 3,534.3- MOP (kg) 26.0 51.0 1,326.0 37.0 962.0 33.0 858.0 55.0 1,430.0 72.0 1,872.0 78.0 2,028.0 78.0 2,028.0 63.3 1,646.7- Compost (ton) 2,000.0 5.6 11,240.0 6.0 12,000.0 6.0 12,000.0 6.0 12,000.0 6.0 12,000.0 6.0 12,000.0 6.0 12,000.0 5.6 11,149.3- Others (LS) 0.0 0.0 0.0 0.0 0.0 0.0 0.0 0.0 0.0 0.0 0.0 0.0 0.0 0.0 0.0 0.0 0.0 Sub-total 15,764.0 16,810.0 16,290.0 19,046.0 21,334.0 22,010.0 22,010.0 19,155.6
3) Agro-chemicals- Herbicide (Rs) 12,150.0 0.0 0.0 0.0 0.0 0.0 0.0 0.0 0.0 0.0 0.0 0.0 0.0 0.0 0.0 0.0 0.0- Pesticide (Rs) 10,640.0 1.0 10,640.0 1.0 10,640.0 1.0 10,640.0 1.0 10,640.0 1.0 10,640.0 1.0 10,640.0 1.0 10,640.0 0.9 9,930.7- Hormone (Rs) 3,800.0 0.0 0.0 0.0 0.0 0.0 0.0 0.0 0.0 0.0 0.0 0.0 0.0 0.0 0.0 0.0 0.0 Sub-total 10,640.0 10,640.0 10,640.0 10,640.0 10,640.0 10,640.0 10,640.0 9,930.7
4) MachineryLand preparation (Rs) 13,400.0 1.0 13,400.0 0.0 0.0 0.0 0.0 0.0 0.0 0.0 0.0 0.0 0.0 0.0 0.0 0.1 893.3Irrigation by pump (Rs) 23,600.0 0.5 11,800.0 0.5 11,800.0 0.5 11,800.0 0.5 11,800.0 0.5 11,800.0 0.5 11,800.0 0.5 11,800.0 0.5 11,013.3Transport produce per ton (Rs) 380.0 0.0 0.0 0.0 0.0 0.0 0.0 1.3 494.0 3.1 1,166.6 10.2 3,857.0 10.2 3,857.0 6.4 2,424.9 Sub-total 25,200.0 11,800.0 11,800.0 12,294.0 12,966.6 15,657.0 15,657.0 14,331.6
5) Human labor- Hired (prn/day) 740.0 59.0 43,660.0 34.0 25,160.0 34.0 25,160.0 38.0 28,120.0 38.0 28,120.0 39.0 28,860.0 44.0 32,560.0 38.9 28,810.7- Family (prn/day) 0.0 91.0 0.0 52.0 0.0 52.0 0.0 58.0 0.0 58.0 0.0 60.0 0.0 67.0 0.0 59.5 0.0 Sub-total 150.0 43,660.0 86.0 25,160.0 86.0 25,160.0 96.0 28,120.0 96.0 28,120.0 99.0 28,860.0 111.0 32,560.0 98.5 28,810.7
6) Support- Poles and wires (Rs) 70,200.0 0.0 0.0 0.0 0.0 0.0 0.0 0.0 0.0 0.0 0.0 0.0 0.0 0.0 0.0 0.0 0.0
7) Miscellaneous (5%) 8,180.2 3,220.5 3,194.5 3,505.0 3,653.0 3,858.4 4,043.4 3,839.2
Total Cost- Including famliy labour 239,123.4 106,110.5 105,564.5 116,525.0 119,633.6 125,425.4 134,490.4 124,678.3- Excluding family labour 171,783.4 67,630.5 67,084.5 73,605.0 76,713.6 81,025.4 84,910.4 80,623.7
C. Net Returen- Including famliy labour -239,123.4 -106,110.5 -105,564.5 -16,685.0 116,142.4 654,094.7 645,029.7 365,408.1- Excluding family labour -171,783.4 -67,630.5 -67,084.5 26,235.0 159,062.4 698,494.7 694,609.7 409,462.7
Source: Socio-economic and Planning Centre, DOAFor prices, those presented in attached Table 3.46C were referred.

The Preparatory Survey on the P
roject for Improvem
ent of Agricultural P
roduction and Productivity
in Dry Zone A
reas in Dem
ocratic Socialist Republic of Sri Lanka
Final R
eport
T 3-42
Table A
3.21 C
rop Budget per H
ectare for Fruits under Present Condition (7/9)
(7) LimeLime: 1st Year Lime: 2nd Year Lime: 3rd Year Lime: 4th Year Lime: 5th Year Lime: 6th Year Lime: 7-15th Year Average Lime: 15-year Average
Unit Unit Value Value Value Value Value Value Value ValuePrice Amount Amount Amount Amount Amount Amount Amount Amount(Rs) (Rs) (Rs) (Rs) (Rs) (Rs) (Rs) (Rs) (Rs)
A. Gross IncomeYield (kg) 60.0 0.0 0.0 0.0 0.0 3,400.0 204,000.0 5,100.0 306,000.0 7,800.0 468,000.0 12,500.0 750,000.0 21,800.0 1,308,000.0 15,000.0 900,000.0
B. Production Cost1) Seedling (kg) 182.3 700.0 127,610.0 0.0 0.0 0.0 0.0 0.0 0.0 0.0 0.0 0.0 0.0 0.0 0.0 46.7 8,507.32) Fertilizers
-Urea (kg) 26.0 52.0 1,352.0 103.0 2,678.0 156.0 4,056.0 230.0 5,980.0 309.0 8,034.0 182.0 4,732.0 254.0 6,604.0 221.2 5,751.2- TSP (kg) 26.0 57.0 1,482.0 114.0 2,964.0 170.0 4,420.0 208.0 5,408.0 243.0 6,318.0 200.0 5,200.0 240.0 6,240.0 210.1 5,463.5- MOP (kg) 26.0 15.0 390.0 30.0 780.0 46.0 1,196.0 54.0 1,404.0 65.0 1,690.0 53.0 1,378.0 64.0 1,664.0 55.9 1,454.3- Compost (ton) 2,000.0 11.0 22,000.0 11.0 22,000.0 11.0 22,000.0 11.0 22,000.0 11.0 22,000.0 11.0 22,000.0 11.0 22,000.0 11.0 22,000.0- Others (LS) 0.0 0.0 0.0 0.0 0.0 0.0 0.0 0.0 0.0 0.0 0.0 0.0 0.0 0.0 0.0 0.0 Sub-total 25,224.0 28,422.0 31,672.0 34,792.0 38,042.0 33,310.0 36,508.0 34,668.9
3) Agro-chemicals- Herbicide (Rs) 12,150.0 1.0 12,150.0 1.0 12,150.0 1.0 12,150.0 1.0 12,150.0 1.0 12,150.0 1.0 12,150.0 1.0 12,150.0 1.0 12,150.0- Pesticide (Rs) 10,640.0 1.0 10,640.0 1.0 10,640.0 1.0 10,640.0 1.0 10,640.0 1.0 10,640.0 1.0 10,640.0 1.0 10,640.0 1.0 10,640.0- Hormone (Rs) 3,800.0 0.0 0.0 0.0 0.0 0.0 0.0 0.0 0.0 0.0 0.0 0.0 0.0 0.0 0.0 0.0 0.0 Sub-total 22,790.0 22,790.0 22,790.0 22,790.0 22,790.0 22,790.0 22,790.0 22,790.0
4) Machinery- Land preparation (Rs) 13,400.0 1.0 13,400.0 0.0 0.0 0.0 0.0 0.0 0.0 0.0 0.0 0.0 0.0 0.0 0.0 0.1 893.3- Irrigation by pump (Rs) 23,600.0 0.5 11,800.0 0.5 11,800.0 0.5 11,800.0 0.5 11,800.0 0.5 11,800.0 0.5 11,800.0 0.5 11,800.0 0.5 11,800.0- Transport produce per ton (Rs) 380.0 0.0 0.0 0.0 0.0 3.4 1,292.0 5.1 1,938.0 7.8 2,964.0 12.5 4,750.0 21.8 8,284.0 15.0 5,700.0 Sub-total 25,200.0 11,800.0 13,092.0 13,738.0 14,764.0 16,550.0 20,084.0 18,393.3
5) Human labor- Hired (prn/day) 740.0 60.0 44,400.0 39.0 28,860.0 48.0 35,520.0 43.0 31,820.0 39.0 28,860.0 43.0 31,820.0 43.0 31,820.0 43.9 32,510.7- Family (prn/day) 0.0 94.0 0.0 60.0 0.0 76.0 0.0 68.0 0.0 60.0 0.0 68.0 0.0 68.0 0.0 69.2 0.0 Sub-total 154.0 44,400.0 99.0 28,860.0 124.0 35,520.0 111.0 31,820.0 99.0 28,860.0 111.0 31,820.0 111.0 31,820.0 113.1 32,510.7
6) Support- Poles and wires (Rs) 70,200.0 0.0 0.0 0.0 0.0 0.0 0.0 0.0 0.0 0.0 0.0 0.0 0.0
6) Miscellaneous (5%) 12,261.2 4,593.6 5,153.7 5,157.0 5,222.8 5,223.5 5,560.1 5,843.5
Total Cost- Including famliy labour 327,045.2 140,865.6 164,467.7 158,617.0 154,078.8 160,013.5 167,082.1 173,921.8- Excluding family labour 257,485.2 96,465.6 108,227.7 108,297.0 109,678.8 109,693.5 116,762.1 122,713.8
C. Net Returen- Including famliy labour -327,045.2 -140,865.6 39,532.3 147,383.0 313,921.2 589,986.5 1,140,917.9 726,078.2- Excluding family labour -257,485.2 -96,465.6 95,772.3 197,703.0 358,321.2 640,306.5 1,191,237.9 777,286.2
Source: Socio-economic and Planning Centre, DOAFor prices, those presented in attached Table 3.46C were referred.

The Preparatory Survey on the P
roject for Improvem
ent of Agricultural P
roduction and Productivity
in Dry Zone A
reas in Dem
ocratic Socialist Republic of Sri Lanka
Final R
eport
T 3-43
Table A
3.21 C
rop Budget per H
ectare for Fruits under Present Condition (8/9)
(8) PonegranatePonegranate: 1st Year Ponegranate: 2nd Year Ponegranate: 3rd Year Ponegranate: 4th Year Ponegranate: 5th Year Ponegranate: 6th Year Ponegranate: 7-20th Yr Ave. Ponegranate: 20-Yr Ave.
Unit Unit Value Value Value Value Value Value Value ValuePrice Amount Amount Amount Amount Amount Amount Amount Amount(Rs) (Rs) (Rs) (Rs) (Rs) (Rs) (Rs) (Rs) (Rs)
A. Gross IncomeYield (fruit) 48.6 0.0 0.0 0.0 0.0 0.0 0.0 2,000.0 97,200.0 4,200.0 204,120.0 6,000.0 291,600.0 7,700.0 374,220.0 6,000.0 291,600.0
B. Production Cost1) Seedlings (kg) 30.4 1,100.0 33,440.0 0.0 0.0 0.0 0.0 0.0 0.0 0.0 0.0 0.0 0.0 0.0 0.0 55.0 1,672.02) Fertilizers
-Urea (kg) 26.0 52.0 1,352.0 52.0 1,352.0 0.0 0.0 52.0 1,352.0 78.0 2,028.0 78.0 2,028.0 78.0 2,028.0 70.2 1,825.2- TSP (kg) 26.0 57.0 1,482.0 57.0 1,482.0 0.0 0.0 57.0 1,482.0 85.5 2,223.0 85.5 2,223.0 85.5 2,223.0 77.0 2,000.7- MOP (kg) 26.0 15.0 390.0 15.0 390.0 0.0 0.0 15.0 390.0 22.5 585.0 22.5 585.0 22.5 585.0 20.3 526.5- Compost (ton) 2,000.0 10.0 20,000.0 0.0 0.0 0.0 0.0 0.0 0.0 0.0 0.0 0.0 0.0 0.0 0.0 0.5 1,000.0- Others (LS) 0.0 0.0 0.0 0.0 0.0 0.0 0.0 0.0 0.0 0.0 0.0 0.0 0.0 0.0 0.0 0.0 0.0 Sub-total 23,224.0 3,224.0 0.0 3,224.0 4,836.0 4,836.0 4,836.0 5,352.4
3) Agro-chemicals- Herbicide (Rs) 12,150.0 0.0 0.0 0.0 0.0 0.0 0.0 0.0 0.0 0.0 0.0 0.0 0.0 0.0 0.0 0.0 0.0- Pesticide (Rs) 10,640.0 1.0 10,640.0 0.0 0.0 0.0 0.0 0.0 0.0 0.0 0.0 0.0 0.0 0.0 0.0 0.1 532.0- Hormone (Rs) 3,800.0 0.0 0.0 0.0 0.0 0.0 0.0 0.0 0.0 0.0 0.0 0.0 0.0 0.0 0.0 0.0 0.0 Sub-total 10,640.0 0.0 0.0 0.0 0.0 0.0 0.0 532.0
4) MachineryLand preparation (Rs) 13,400.0 1.0 13,400.0 0.0 0.0 0.0 0.0 0.0 0.0 0.0 0.0 0.0 0.0 0.0 0.0 0.1 670.0Irrigation by pump (Rs) 23,600.0 0.0 0.0 0.0 0.0 0.0 0.0 0.0 0.0 0.0 0.0 0.0 0.0 0.0 0.0 0.0 0.0Transport produce per ton (Rs) 380.0 0.0 0.0 0.0 0.0 0.0 0.0 2.0 760.0 4.2 1,596.0 6.0 2,280.0 7.7 2,926.0 6.0 2,280.0 Sub-total 13,400.0 0.0 0.0 760.0 1,596.0 2,280.0 2,926.0 2,950.0
5) Human labor- Hired (prn/day) 740.0 89.6 66,304.0 41.4 30,636.0 39.6 29,304.0 40.8 30,192.0 51.0 37,740.0 57.0 42,180.0 60.6 44,844.0 58.4 43,208.6- Family (prn/day) 0.0 139.2 0.0 48.6 0.0 61.8 0.0 63.6 0.0 80.4 0.0 89.4 0.0 95.4 0.0 90.9 0.0 Sub-total 228.8 66,304.0 90.0 30,636.0 101.4 29,304.0 104.4 30,192.0 131.4 37,740.0 146.4 42,180.0 156.0 44,844.0 149.3 43,208.6
6) Support- Poles and wires (Rs) 70,200.0 0.0 0.0 0.0 0.0 0.0 0.0 0.0 0.0 0.0 0.0 0.0 0.0 0.0 0.0 0.0 0.0
6) Miscellaneous (5%) 7,350.4 1,693.0 1,465.2 1,708.8 2,208.6 2,464.8 2,630.3 2,685.8
Total Cost- Including famliy labour 257,366.4 71,517.0 76,501.2 82,948.8 105,876.6 117,916.8 125,832.3 123,689.0- Excluding family labour 154,358.4 35,553.0 30,769.2 35,884.8 46,380.6 51,760.8 55,236.3 56,400.8
C. Net Returen- Including famliy labour -257,366.4 -71,517.0 -76,501.2 14,251.2 98,243.4 173,683.2 248,387.7 167,911.1- Excluding family labour -154,358.4 -35,553.0 -30,769.2 61,315.2 157,739.4 239,839.2 318,983.7 235,199.3
Source: Socio-economic and Planning Centre, DOAFor prices, those presented in attached Table 3.46C were referred.
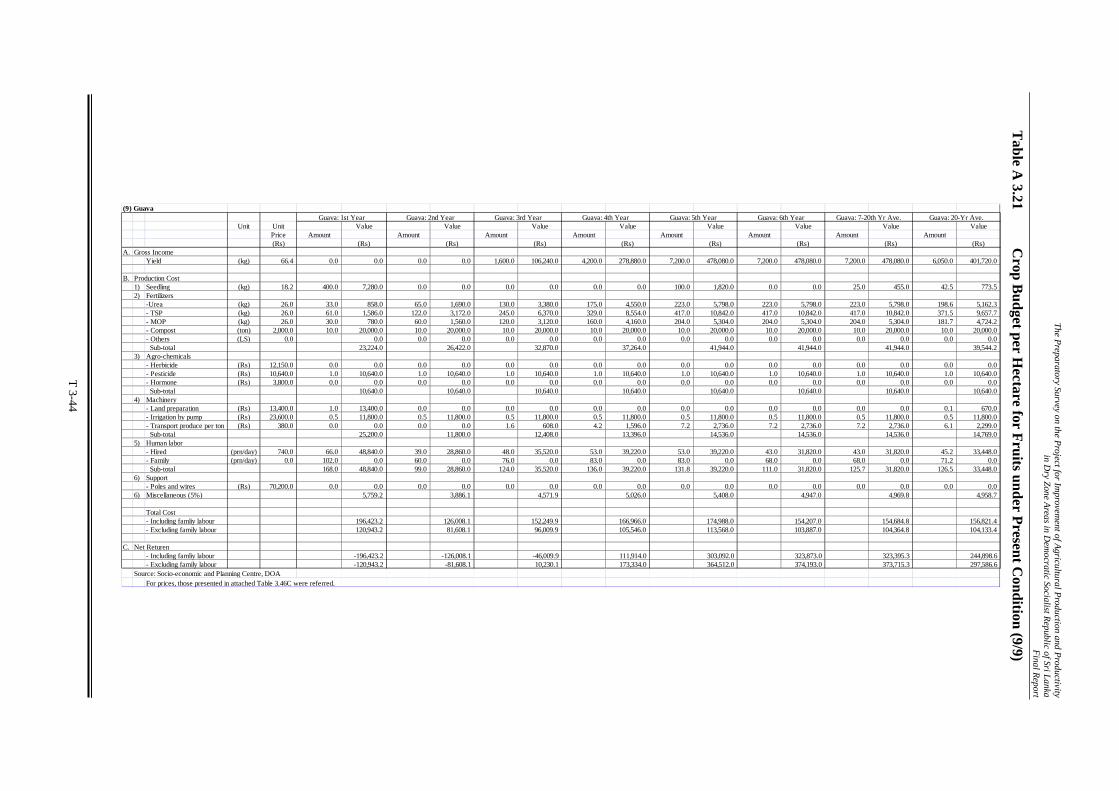
The Preparatory Survey on the P
roject for Improvem
ent of Agricultural P
roduction and Productivity
in Dry Zone A
reas in Dem
ocratic Socialist Republic of Sri Lanka
Final R
eport
T 3-44
Table A
3.21 C
rop Budget per H
ectare for Fruits under Present Condition (9/9)
(9) GuavaGuava: 1st Year Guava: 2nd Year Guava: 3rd Year Guava: 4th Year Guava: 5th Year Guava: 6th Year Guava: 7-20th Yr Ave. Guava: 20-Yr Ave.
Unit Unit Value Value Value Value Value Value Value ValuePrice Amount Amount Amount Amount Amount Amount Amount Amount(Rs) (Rs) (Rs) (Rs) (Rs) (Rs) (Rs) (Rs) (Rs)
A. Gross IncomeYield (kg) 66.4 0.0 0.0 0.0 0.0 1,600.0 106,240.0 4,200.0 278,880.0 7,200.0 478,080.0 7,200.0 478,080.0 7,200.0 478,080.0 6,050.0 401,720.0
B. Production Cost1) Seedling (kg) 18.2 400.0 7,280.0 0.0 0.0 0.0 0.0 0.0 0.0 100.0 1,820.0 0.0 0.0 25.0 455.0 42.5 773.52) Fertilizers
-Urea (kg) 26.0 33.0 858.0 65.0 1,690.0 130.0 3,380.0 175.0 4,550.0 223.0 5,798.0 223.0 5,798.0 223.0 5,798.0 198.6 5,162.3- TSP (kg) 26.0 61.0 1,586.0 122.0 3,172.0 245.0 6,370.0 329.0 8,554.0 417.0 10,842.0 417.0 10,842.0 417.0 10,842.0 371.5 9,657.7- MOP (kg) 26.0 30.0 780.0 60.0 1,560.0 120.0 3,120.0 160.0 4,160.0 204.0 5,304.0 204.0 5,304.0 204.0 5,304.0 181.7 4,724.2- Compost (ton) 2,000.0 10.0 20,000.0 10.0 20,000.0 10.0 20,000.0 10.0 20,000.0 10.0 20,000.0 10.0 20,000.0 10.0 20,000.0 10.0 20,000.0- Others (LS) 0.0 0.0 0.0 0.0 0.0 0.0 0.0 0.0 0.0 0.0 0.0 0.0 0.0 0.0 0.0 0.0 Sub-total 23,224.0 26,422.0 32,870.0 37,264.0 41,944.0 41,944.0 41,944.0 39,544.2
3) Agro-chemicals- Herbicide (Rs) 12,150.0 0.0 0.0 0.0 0.0 0.0 0.0 0.0 0.0 0.0 0.0 0.0 0.0 0.0 0.0 0.0 0.0- Pesticide (Rs) 10,640.0 1.0 10,640.0 1.0 10,640.0 1.0 10,640.0 1.0 10,640.0 1.0 10,640.0 1.0 10,640.0 1.0 10,640.0 1.0 10,640.0- Hormone (Rs) 3,800.0 0.0 0.0 0.0 0.0 0.0 0.0 0.0 0.0 0.0 0.0 0.0 0.0 0.0 0.0 0.0 0.0 Sub-total 10,640.0 10,640.0 10,640.0 10,640.0 10,640.0 10,640.0 10,640.0 10,640.0
4) Machinery- Land preparation (Rs) 13,400.0 1.0 13,400.0 0.0 0.0 0.0 0.0 0.0 0.0 0.0 0.0 0.0 0.0 0.0 0.0 0.1 670.0- Irrigation by pump (Rs) 23,600.0 0.5 11,800.0 0.5 11,800.0 0.5 11,800.0 0.5 11,800.0 0.5 11,800.0 0.5 11,800.0 0.5 11,800.0 0.5 11,800.0- Transport produce per ton (Rs) 380.0 0.0 0.0 0.0 0.0 1.6 608.0 4.2 1,596.0 7.2 2,736.0 7.2 2,736.0 7.2 2,736.0 6.1 2,299.0 Sub-total 25,200.0 11,800.0 12,408.0 13,396.0 14,536.0 14,536.0 14,536.0 14,769.0
5) Human labor- Hired (prn/day) 740.0 66.0 48,840.0 39.0 28,860.0 48.0 35,520.0 53.0 39,220.0 53.0 39,220.0 43.0 31,820.0 43.0 31,820.0 45.2 33,448.0- Family (prn/day) 0.0 102.0 0.0 60.0 0.0 76.0 0.0 83.0 0.0 83.0 0.0 68.0 0.0 68.0 0.0 71.2 0.0 Sub-total 168.0 48,840.0 99.0 28,860.0 124.0 35,520.0 136.0 39,220.0 131.8 39,220.0 111.0 31,820.0 125.7 31,820.0 126.5 33,448.0
6) Support- Poles and wires (Rs) 70,200.0 0.0 0.0 0.0 0.0 0.0 0.0 0.0 0.0 0.0 0.0 0.0 0.0 0.0 0.0 0.0 0.0
6) Miscellaneous (5%) 5,759.2 3,886.1 4,571.9 5,026.0 5,408.0 4,947.0 4,969.8 4,958.7
Total Cost- Including famliy labour 196,423.2 126,008.1 152,249.9 166,966.0 174,988.0 154,207.0 154,684.8 156,821.4- Excluding family labour 120,943.2 81,608.1 96,009.9 105,546.0 113,568.0 103,887.0 104,364.8 104,133.4
C. Net Returen- Including famliy labour -196,423.2 -126,008.1 -46,009.9 111,914.0 303,092.0 323,873.0 323,395.3 244,898.6- Excluding family labour -120,943.2 -81,608.1 10,230.1 173,334.0 364,512.0 374,193.0 373,715.3 297,586.6
Source: Socio-economic and Planning Centre, DOAFor prices, those presented in attached Table 3.46C were referred.

The Preparatory Survey on the Project for Improvement of Agricultural Production and Productivity in Dry Zone Areas in Democratic Socialist Republic of Sri Lanka
Final Report
T 3-45
Table A 3.22 2012 Farmgate Prices of Farm Products and Inputs
Item Unit Financial Item Unit Financial(Rs.) (Rs.)
Products Fertilizers- Paddy kg 28.0 Fertilizer for paddy- Maize kg 29.0 - Urea kg 7.0- Krakkan kg 60.0 - TSP kg 7.0- Green gram kg 170.0 - MOP kg 7.0- Black gram kg 160.0 - TDM kg 26.0- Cowpea kg 135.0 - Mixture kg - - Gingelly kg 120.0 - Poultry manure kg - - Soybean kg 45.0 - Others kg - - Groundnut kg 99.0 Fertilizer for other crops- Red onion kg 87.0 - Urea kg 26.0- Big onion kg 67.0 - TSP kg 26.0- Chillies kg 100.0 - MOP kg 26.0- Pumpkin kg 20.0 - TDM kg 26.0- Brinjal kg 38.5 - Mixture kg 26.0- Bitter gourd kg 51.0 - Poultry manure ton 20,000.0- Capsicum kg 90.5 - Compost fertilizer ton 20,000.0- Tomato kg 48.5 - Others* ha 22,000.0
Banana kg 20.0Pineapple fruit 42.5 Agro-chemicalsPineapple kg 34.0 HerbicidePapaw fruit 21.6 - Paddy ha 8,150.0Papaw kg 33.2 - OFC (excluding onions and chillies) ha 4,600.0Passion fruit kg 51.3 - Vegetables (including onions and chillies) ha 5,910.0Mango kg 58.2 - Fruits ha 12,150.0Orange fruit 9.6 PesticideOrange kg 76.8 - Paddy ha 4,210.0Lime kg 60.0 - OFC (excluding onions and chillies) ha 4,190.0Pomegranate kg 48.6 - Vegetables (including onions and chillies) ha 34,550.0Guava kg 66.4 - Fruits ha 10,640.0
Hormone for pineapple ha 3,800.0Seeds, suckers and seedlings
- Paddy kg 64.0 Farm Machinery- Maize kg 661.0 - Land preparation ha 13,400.0- Krakkan kg 66.0 - Irrigation by pump ha 23,600.0- Green gram kg 263.0 - Thresing and winnoring ton 2,450.0- Black gram kg 178.0 - Transport of produce ton 380.0- Cowpea kg 154.0- Gingelly kg 183.0 Labour- Soybean kg 135.0 - Hired labour prn-day 740.0- Groundnut kg 111.0 - Family labour prn-day 0.0- Red onion kg 112.0- Big onion kg 4,201.0 Others- Chillies kg 1,976.0 - Support for tomato ha 44,900.0- Pumpkin kg 19,090.0 - Support for passion fruit ha 70,200.0- Brinjal kg 10,092.0- Bitter gourd kg 5,750.0- Capsicum kg 11,109.0- Tomato kg 29,568.0- Banana No. 24.3- Pineapple No. 6.0- Papaw No. 36.5- Passion fruit No. 18.2- Mango No. 121.6- Orange No. 121.6- Lime No. 182.3- Pomegranate No. 30.4- Guava No. 18.2
Note:*: Amonia, CU3 and Hydro are applied to some vegetables.
Source: - Cost of Cultivation of Agricultural Crops, 2009/10 Maha, Socio-economic and Planning Centre, DOA- Cost of Cultivation of Agricultural Crops, 2010 Yala, Socio-economic and Planning Centre, DOA- Cost and benefit analysis tables for fruits prepared by DOA- The unit prices available in the above data sources were converted into 2012 prices by applying increase rate of 5% p.a. which was
estimated based on CCPI and information obtained through field survey in the present Survey.

The Preparatory Survey on the Project for Improvement of Agricultural Production and Productivity in Dry Zone Areas in Democratic Socialist Republic of Sri Lanka
Final Report
T 3-46
Table A 3.23 Number of Vaccination
Vaccination 2008-2011
HS 2008 2009 2010 2011 FMD 2008 2009 2010 2011
NWP 244270 93990 0 209280 NWP 123350 98250 146700 150050
EP 266160 150230 13090 110 EP 42000 120300 65000 134350
NCP 129450 1020 171570 NCP 101200 38000 85000 120000
NP 139790 89890 24750 213110 NP 65000 49850 41000 141450
SP 83330 70560 46750 SP 24850 32850 17600 71000
UP 72240 40080 62170 UP 69500 40000 62000 61800
WP 45040 44280 68600 WP 54250 68400 46350 18650
CP 22570 15760 17600 CP 1550 0 29350 25100
Sab.P 15840 14120 10080 Sab.P 16400 13100 13550 13350
Others 4330 Others 4800
Total 1018690 524260 37840 799270 Total 498100 455550 506550 735750
Vac. 834864 408473 37500 558319 Vac. 523733 342474 453305 529080
Local 82% 78% 99% 70% Local 105% 75% 89% 72%
BQ 2008 2009 2010 2011 HS: Haemorhhagic Septiacemia
NWP 83523 75273 78210 78441 FMD: Foot and Mouth Disease
EP 23232 24189 15312 43527 BQ: Black Quarter
NCP 34848 30723 30591 31053
NP 19074 8448 20592 33101 1.Privince decides the number
SP 0 0 0 0 2.Privince asks vaccine production
UP 35112 6534 13662 5016 3.The vaccine production center
WP 0 0 0 12012 accumulates total demands
CP 33 o 0 528 4. The center distributes vaccine
Sab.P 0 0 1023 to each provinces
Others 0 5.Each province executes vaccination
Total 195822 145167 159390 203678 according to availabilities
Vac. 147396 114526 119005 156265 6. Provinces inform the number
Local 75% 79% 75% 77%

The Preparatory Survey on the P
roject for Improvem
ent of Agricultural P
roduction and Productivity
in Dry Zone A
reas in Dem
ocratic Socialist Republic of Sri Lanka
Final R
eport
T 3-47
Table A
3.24 Sum
mary of C
BO
s in Rural C
omm
unities (1/4)
CBO Legal Basis(Act /Circulars)
Member Size In-ChargeDepartment
Monitoring(who / how)
Major Functions Remarks
FarmersOrganization(FO)
AgrarianDevelopment Act,No. 46 of 2000
minimum - 25,maximum - nolimit
Department ofAgrarianDevelopment
Agriculture Instructor(AI) under DuputyDirector of Agriculture(DDA)Agrarian DevelopmentOfficer (ADO) underAgrarian Servie Center(ASC)
- Formulate annual programe for cultivating paddy lands and high lands- Collecting information and making reports regarding agricultural lands within itsarea authority- Collect data regarding agricultural lands, agricultural machinery and agriculturalanimals and inland fish in its area authority- Recommend the cultivation of agricultural crops which are recommended for thatarea, and the breeding of such breeds of livestock and inland fish as are best suitedfor that area- Take measures to ensure that such crops and animals are free from diseases andpests- Implement programmes to educate owner cultivators, occupies and encouragingthem to adopt methods which are environmentally friendly- Engage in the supply of goods and services relating to agriculture- It can sign an agreement and implement small scale irrigation and otherconstruction works- Improve coordination among members and support to Improve their livingstandard
FOs rules and regulations andactivities are mostly commonfor all the districts in thecountry.
FarmersProducersSociety (FPS)
Circular issued bythe Department ofAgriculturePeradeniya.
minimum - 10maximum - 20
Department ofAgriculture(provincial)
Agriculture Instructor(AI) under DuputyDirector of Agriculture(DDA)
- Improve agricultural production through joint venture and make demonstration toincrease output-Motivate members to follow the recommended methods in the agricultural activities- Guide the members to reduce the production cost and increase profit- Provide facilities to the members to get agricultural inputs easily and support themto increase products- Motivate members to improve own investment and make them free from credits andadvice them for without dependency- Educate the members to the important of the saving and motivate them- Assist the members to get benefits from donors who are supporting to theagricultural activities- Guide the members to earn additional income from other sources also
FPSs are not common for allprovinces mostly these arefunctioning in EasternProvince and a part ofNorthern Province.

The Preparatory Survey on the P
roject for Improvem
ent of Agricultural P
roduction and Productivity
in Dry Zone A
reas in Dem
ocratic Socialist Republic of Sri Lanka
Final R
eport
T 3-48
Table A
3.24 Sum
mary of C
BO
s in Rural C
omm
unities (2/4)
CBO Legal Basis(Act /Circulars)
Member Size In-ChargeDepartment
Monitoring(who / how)
Major Functions Remarks
Young FarmersSociety (YFS)
Circular issued bythe Department ofAgriculturePeradeniya.
minimum - 10maximum- 30
Department ofAgriculture(provincial)
Agriculture Instructor(AI) under DuputyDirector of Agriculture(DDA)
- Encourage youths to engage in agricultural activities with new technologiesthrough that reduce unemployment in the country- Introduce new agricultural technologies among youth farmers who are alreadyEngage with the agricultural activities- Make arrangements to get agricultural tools and equipments and make marketingopportunities through the societies- Build unity, coordination, cooperation, leadership and characteristic of humanityamong youths
YFSs are not common for allprovinces mostly these arefunctioning in the EasternProvince.
Women FarmersSociety (WFS)
Circular issued bythe Department ofAgriculturePeradeniya.
minimum - 10maximum - nomention
Department ofAgriculture(provincial)
Agriculture Instructor(AI) under DuputyDirector of Agriculture(DDA)
- Educate the members regarding agricultural activities and Encourage earningsthrough it. and develop the practical knowledge to all members- Attention to the members to make interest of agriculture and agricultural relatedproduction and make arrangement to Improve the economical status of the members.- Give the basic knowledge for the new agricultural technologies, knowledge ofnutritional foods, customer rights and food processing- Guide the members regarding agriculture based friendly environment, protection ofenvironment and get nutritional foods through home gardening- Encourage women participation in the development process, Improve leadershipamong women and motivate them for social service activities- Change the attitudes, Improve relationship, coordination and unity amongmembers- Improve saving habits and prepare them for agricultural investments
WFSs are not common for allprovinces mostly these arefunctioning in EasternProvince. In the NorthernProvince only 27 WFSs arefunctioning in VavuniyaDistrict.

The Preparatory Survey on the P
roject for Improvem
ent of Agricultural P
roduction and Productivity
in Dry Zone A
reas in Dem
ocratic Socialist Republic of Sri Lanka
Final R
eport
T 3-49
Table A
3.24 Sum
mary of C
BO
s in Rural C
omm
unities (3/4)
CBO Legal Basis(Act /Circulars)
Member Size In-ChargeDepartment
Monitoring(who / how)
Major Functions Remarks
RuralDevelopmentSociety
Circular No.A/C/3/1/118.09.1978Amended on31.10.1978
Not mentionedin the circular
RuralDevelopmentDepartment(provincial)
Rural DevelopmentOfficer (RDO) underProvisional Director ofRural Developemnt
- Plan its work activities to create self employment opportunities from availableresources in its locality- Maintain good health conditions and habits of the people and to take preventivemeasures against the spread of any infectious disease- Work for improving the pre -school education of the children in the village- Take steps to protect and improve the environmental condition of the area- Take action to develop their village in all aspects
This is common for all districtsin the country.
Women RuralDevelopmentSociety
Circular No.A/C/3/1/118.09.1978Amended on31.10.1978
Not mentionedin the circular
RuralDevelopmentDepartment(provincial)
Rural DevelopmentOfficer (RDO) underProvisional Director ofRural Developemnt
- Plan its work activities to create self employment opportunities from availableresources in its locality- Maintain good health conditions and habits of the people and to take preventivemeasures against the spread of any infectious disease- Work for improving the pre -school education of the children in the village- Take steps to protect and Improve the environment of the area.- Help women in acquiring knowledge of vocational training, marketing and alliedwomen development activities
This is common for all districtsin the country.
Samurthi taskforce
Circular producedby the Sri LankaSamurthi Authority
All the Samurthibeneficiaries inthe village arethe members ofthe society.
Sri LankaSamurthiAuthority
Samurthi DevelopmentOfficer (SDO) underSamurthi Managerattached to DivisionalSecretary (DS)
- Implement all development activities requested by Samurthi Authority throughDivisional Secretary office in the village Level- Celebrate national and cultural events
Samurthi task forces are in allsamurthi beneficiary villagesin the country, and all therules and regulations andactivities are common for all.

The Preparatory Survey on the P
roject for Improvem
ent of Agricultural P
roduction and Productivity
in Dry Zone A
reas in Dem
ocratic Socialist Republic of Sri Lanka
Final R
eport
T 3-50
Table A
3.24 Sum
mary of C
BO
s in Rural C
omm
unities (4/4)
CBO Legal Basis(Act /Circulars)
Member Size In-ChargeDepartment
Monitoring(who / how)
Major Functions Remarks
Death donationsociety
Villagers form thissocietiesthemselves as awelfare society
No restrictions N/A N/A - Collect membership money- Serve as a welfare society- Provide money to the funeral expenses to the members
This society is not commonfor all areas. Normally it is inpractice in village areas in thecountry.
RuralCooperativesociety
Co-operativeSocieties Act No. 5of 1972Amended Act No.32 of 1983Amended Act no.11 of 1992
minimum - 10maximum - nolimit
Co-operativeDepartment(provincial)
Co-operativeDevelopment Officer(CDO) under AssistantCo-operativeDevelopment Officer
- Serve the common needs of the people in the village- Provide services to the people who need the services of the co-operativemovement- Play a significant role in development process
Co-operative societiesare formed according to theco-operative act thereforebasic rules and regulations aresame in inland wide butobjectives of the societiesvaries one from another.Ex: Fishermen co-operativesocietyAgriculture producers co-operative societyCarpenters co-operativesocietyDairy farmers co-operativesocietyConsumer co-operativesociety
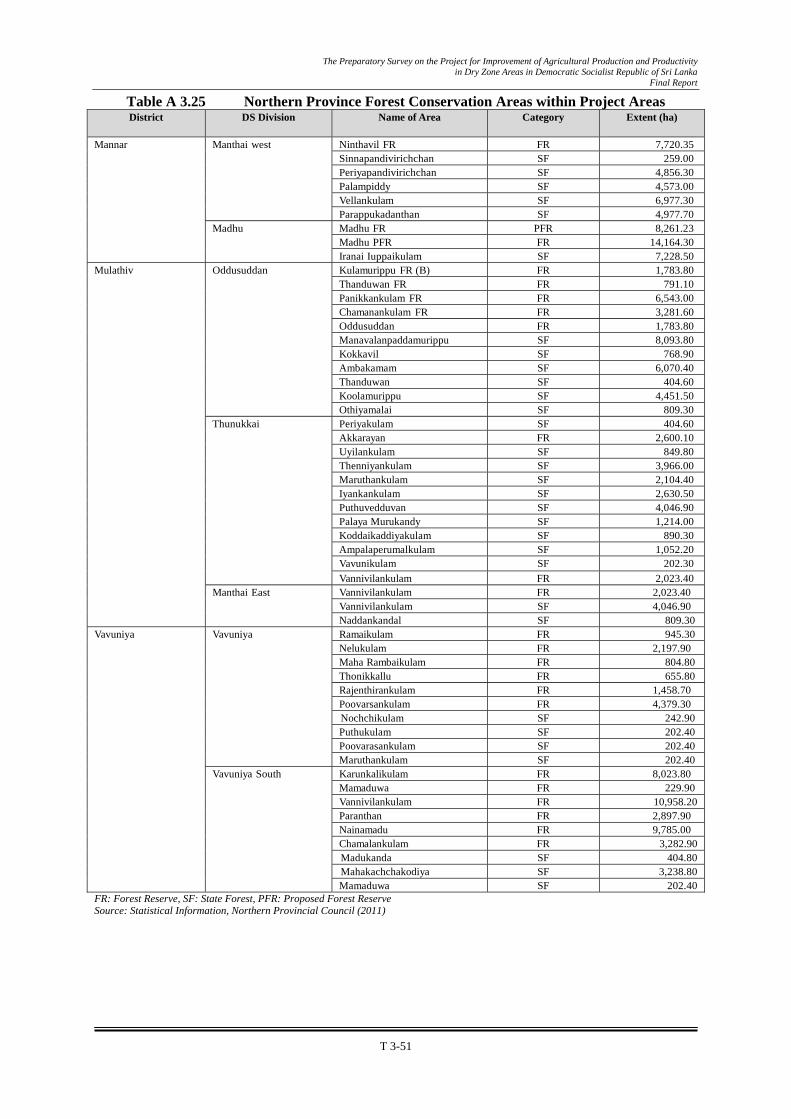
The Preparatory Survey on the Project for Improvement of Agricultural Production and Productivity in Dry Zone Areas in Democratic Socialist Republic of Sri Lanka
Final Report
T 3-51
Table A 3.25 Northern Province Forest Conservation Areas within Project Areas District DS Division Name of Area Category Extent (ha)
Mannar Manthai west Ninthavil FR FR 7,720.35
Sinnapandivirichchan SF 259.00Periyapandivirichchan SF 4,856.30Palampiddy SF 4,573.00Vellankulam SF 6,977.30Parappukadanthan SF 4,977.70
Madhu Madhu FR PFR 8,261.23Madhu PFR FR 14,164.30Iranai Iuppaikulam SF 7,228.50
Mulathiv Oddusuddan Kulamurippu FR (B) FR 1,783.80Thanduwan FR FR 791.10Panikkankulam FR FR 6,543.00Chamanankulam FR FR 3,281.60Oddusuddan FR 1,783.80Manavalanpaddamurippu SF 8,093.80Kokkavil SF 768.90Ambakamam SF 6,070.40Thanduwan SF 404.60Koolamurippu SF 4,451.50Othiyamalai SF 809.30
Thunukkai
Periyakulam SF 404.60Akkarayan FR 2,600.10Uyilankulam SF 849.80Thenniyankulam SF 3,966.00Maruthankulam SF 2,104.40Iyankankulam SF 2,630.50Puthuvedduvan SF 4,046.90Palaya Murukandy SF 1,214.00Koddaikaddiyakulam SF 890.30Ampalaperumalkulam SF 1,052.20Vavunikulam SF 202.30Vannivilankulam FR 2,023.40
Manthai East
Vannivilankulam FR 2,023.40 Vannivilankulam SF 4,046.90 Naddankandal SF 809.30
Vavuniya Vavuniya
Ramaikulam FR 945.30Nelukulam FR 2,197.90 Maha Rambaikulam FR 804.80Thonikkallu FR 655.80Rajenthirankulam FR 1,458.70 Poovarsankulam FR 4,379.30 Nochchikulam SF 242.90Puthukulam SF 202.40Poovarasankulam SF 202.40Maruthankulam SF 202.40
Vavuniya South Karunkalikulam FR 8,023.80 Mamaduwa FR 229.90Vannivilankulam FR 10,958.20Paranthan FR 2,897.90 Nainamadu FR 9,785.00 Chamalankulam FR 3,282.90Madukanda SF 404.80Mahakachchakodiya SF 3,238.80Mamaduwa SF 202.40
FR: Forest Reserve, SF: State Forest, PFR: Proposed Forest Reserve Source: Statistical Information, Northern Provincial Council (2011)

The Preparatory Survey on the Project for Improvement of Agricultural Production and Productivity in Dry Zone Areas in Democratic Socialist Republic of Sri Lanka
Final Report
T 4-1
Table A 4.1 Result of Selection of Priority Site for Project Implementation (1/3)
No. Province District DS Division
Result of Scoring
Suitability of soil
Water Resources Farmer's
needs and ability
Market Advantage Adequateness of
Government Extension Services
Total ScoreAccessibility to
ground waterAppropriateness of surface water
Accessibility to main
road
Distance to Major Market
maximum point
allocated
maximum point
allocated
maximum point
allocated
maximum point
allocated
maximum point
allocated
maximum point
allocated
maximum point
allocated
( 15 ) ( 10 ) ( 10 ) ( 30 ) ( 10 ) ( 10 ) ( 15 ) ( 100 )
1 Eastern Ampara Addalaichchenai 12 8 0 0 2 2 6 30 2 Eastern Ampara Akkaraipattu 15 9 0 0 2 2 0 28 3 Eastern Ampara Alayadivembu 8 9 0 0 0 4 9 30 4 Eastern Ampara Ampara 12 10 2 0 2 2 0 28 5 Eastern Ampara Damana 13 10 2 0 4 4 0 33 6 Eastern Ampara Dehiyatakandiya 15 10 0 6 2 2 0 35 7 Eastern Ampara Irrakamam 11 10 2 0 2 2 15 42 8 Eastern Ampara Kalmunai (Muslim Div.) 15 0 0 0 4 2 15 36 9 Eastern Ampara Kalmunai (Tamil Div.) 15 0 0 0 8 2 15 40
10 Eastern Ampara Karaitivu 11 1 0 0 2 2 15 31 11 Eastern Ampara Lahugala 11 10 10 0 8 4 9 52 12 Eastern Ampara Mahaoya 13 10 0 30 4 4 0 61 13 Eastern Ampara Navethanveli 13 9 2 0 2 2 6 34 14 Eastern Ampara Nintavurpattu 5 5 0 0 0 2 9 21 15 Eastern Ampara Padiyatalawa 14 10 10 24 4 4 0 66 16 Eastern Ampara Pottuvil 11 10 6 0 2 4 15 48 17 Eastern Ampara Sainthamaruthu 14 1 0 0 2 2 15 34 18 Eastern Ampara Sammanthurai 5 10 0 0 0 2 0 17 19 Eastern Ampara Thirukovil 10 7 10 0 2 4 15 48 20 Eastern Ampara Uhana 14 10 0 6 2 2 0 34 21 Eastern Batticaloa Eravur Pattu (Chenkalady) 11 9 2 18 2 4 12 58 22 Eastern Batticaloa Eravur Town 14 4 0 0 6 4 15 43 23 Eastern Batticaloa Kattankudy 15 0 0 0 4 2 15 36
24 Eastern Batticaloa Koralaipattu (Valaichechenai) 11 0 0 0 2 4 12 29
25 Eastern Batticaloa Koralaipattu Central 11 0 2 0 6 4 15 38 26 Eastern Batticaloa Koralaipattu North (Vaharai) 14 9 10 12 8 4 15 72 27 Eastern Batticaloa Koralaipattu South (Kiran) 12 10 10 0 4 4 15 55 28 Eastern Batticaloa Koralaipattu West 14 8 0 0 2 4 15 43
29 Eastern Batticaloa Manmunai North (Batticaloa Town) 12 0 10 0 4 2 15 43
30 Eastern Batticaloa Manmunai South & Eruvil pattu (Kaluwanchikudy) 13 0 10 12 4 2 12 53
31 Eastern Batticaloa Manmunai South West (Paddippalai) 10 10 10 0 2 2 9 43
32 Eastern Batticaloa Manmunai West 11 10 10 6 2 2 3 44
33 Eastern Batticaloa Manmunaipattu (Arayampathi) 14 0 0 0 4 2 15 35
34 Eastern Batticaloa Porathivupattu (Vellavely) 9 10 6 0 2 0 12 39 35 Eastern Trincomalee Eachchilampattu 11 9 6 6 6 4 12 54 36 Eastern Trincomalee Gomarankadawela 15 9 10 6 2 6 6 54 37 Eastern Trincomalee Kantalai 12 10 0 12 4 8 3 49 38 Eastern Trincomalee Kinniya 10 10 2 12 4 6 15 59 39 Eastern Trincomalee Kuchchaveli 11 8 10 12 4 4 12 61 40 Eastern Trincomalee Morawewa 15 9 10 0 6 6 15 61 41 Eastern Trincomalee Muthur 10 10 10 18 4 4 15 71 42 Eastern Trincomalee Padavi Sripura 12 10 2 0 2 2 0 28 43 Eastern Trincomalee Seruvila 6 10 2 0 4 4 3 29 44 Eastern Trincomalee Thampalakamam 13 9 10 0 2 8 12 54 45 Eastern Trincomalee Town & Gravets 13 8 6 0 8 6 15 56 46 North Central Anuradhapura Galenbindunuwewa 15 9 10 12 2 10 0 58 47 North Central Anuradhapura Galnewa 15 10 2 24 2 8 0 61 48 North Central Anuradhapura Horowapotana 14 9 2 30 4 6 0 65 49 North Central Anuradhapura Ipalogama 15 10 0 0 2 10 0 37 50 North Central Anuradhapura kahatagasdigiliya 15 9 2 30 2 8 0 66 51 North Central Anuradhapura Kebithigollewa 15 10 10 0 6 6 0 47 52 North Central Anuradhapura Kekirawa 15 10 10 30 2 10 0 77 53 North Central Anuradhapura Mahawilachchiya 12 10 10 30 8 8 9 87 54 North Central Anuradhapura Medawachchiya 14 10 0 18 4 8 0 54 55 North Central Anuradhapura Mihintale 14 10 2 6 4 10 0 46 56 North Central Anuradhapura Nachchaduwa 15 9 0 18 2 8 12 64 57 North Central Anuradhapura Nochchiyagama 13 10 6 30 4 10 6 79 58 North Central Anuradhapura Nuwaragam Palatha Central 14 10 2 30 6 10 0 72 59 North Central Anuradhapura Nuwaragam Palatha East 15 10 2 6 4 10 6 53 60 North Central Anuradhapura Padawiya 15 10 10 0 2 4 6 47 61 North Central Anuradhapura Palagala 14 7 0 0 2 8 0 31 62 North Central Anuradhapura Palugaswewa 15 9 10 30 2 10 0 76 63 North Central Anuradhapura Rajanganaya 12 10 0 24 2 10 0 58 64 North Central Anuradhapura Rambewa 14 10 10 6 4 10 0 54 65 North Central Anuradhapura Talawa 14 10 6 18 2 10 0 60 66 North Central Anuradhapura Tambuttegama 13 10 2 30 2 10 0 67 67 North Central Anuradhapura Tirappane 14 10 0 30 4 10 0 68

The Preparatory Survey on the Project for Improvement of Agricultural Production and Productivity in Dry Zone Areas in Democratic Socialist Republic of Sri Lanka
Final Report
T 4-2
Table A 4.1 Result of Selection of Priority Site for Project Implementation (2/3)
No. Province District DS Division
Result of Scoring
Suitability of soil
Water Resources Farmer's
needs and ability
Market Advantage Adequateness of
Government Extension Services
Total ScoreAccessibility to
ground waterAppropriateness of surface water
Accessibility to main
road
Distance to Major Market
maximum point
allocated
maximum point
allocated
maximum point
allocated
maximum point
allocated
maximum point
allocated
maximum point
allocated
maximum point
allocated
( 15 ) ( 10 ) ( 10 ) ( 30 ) ( 10 ) ( 10 ) ( 15 ) ( 100 )68 North Central Polonnaruwa Dimbulagala 12 10 0 0 4 8 0 34 69 North Central Polonnaruwa Elahera 15 10 6 0 2 10 0 43 70 North Central Polonnaruwa Hingurakgoda 15 9 2 6 2 10 3 47
71 North Central Polonnaruwa Lankapura 6 10 0 0 2 8 0 26 72 North Central Polonnaruwa Medirigiriya 13 9 6 0 4 8 0 40 73 North Central Polonnaruwa Thamankaduwa 12 9 0 0 2 8 3 34 74 North Central Polonnaruwa Welikanda 12 10 0 0 10 6 9 47 75 North West Kurunegala Alawwa 7 9 0 0 0 8 0 24 76 North West Kurunegala Ambanpola 13 10 10 6 2 10 0 51 77 North West Kurunegala Bamunakotuwa 1 10 2 0 0 8 0 21 78 North West Kurunegala Bingiriya 8 10 0 0 2 6 0 26 79 North West Kurunegala Ehetuwewa 14 10 0 6 2 10 0 42 80 North West Kurunegala Galgamuwa 14 10 10 18 2 10 0 64 81 North West Kurunegala Ganewatta 10 10 2 0 0 8 0 30 82 North West Kurunegala Giribawa 14 10 10 6 2 10 3 55 83 North West Kurunegala Ibbagamuwa 3 9 2 6 0 10 0 30 84 North West Kurunegala Katupotha (Bamunakotuwa) 6 10 2 0 2 8 0 28 85 North West Kurunegala Kobeigane 13 10 6 0 2 8 0 39 86 North West Kurunegala kotavehera 14 10 10 18 0 8 3 63 87 North West Kurunegala Kuliyapitiya East 2 10 10 0 2 8 0 32 88 North West Kurunegala Kuliyapitiya West 5 10 6 0 2 8 3 34 89 North West Kurunegala Kurunegala 1 10 0 0 2 8 6 27 90 North West Kurunegala Mahawa 15 10 10 30 0 10 0 75 91 North West Kurunegala Mallawapitiya 4 9 0 0 0 8 0 21 92 North West Kurunegala Maspotha 6 10 2 0 2 8 6 34 93 North West Kurunegala Mawathagama 6 8 2 0 0 8 0 24 94 North West Kurunegala Narammala 4 9 0 0 0 8 0 21 95 North West Kurunegala Nikaweratiya 13 10 2 18 2 10 0 55 96 North West Kurunegala Panduwasnuwara 13 10 2 0 2 8 0 35 97 North West Kurunegala Panduwasnuwara East 8 10 2 0 2 10 0 32 98 North West Kurunegala Pannala 5 6 2 0 2 8 0 23 99 North West Kurunegala Polghawela 3 10 0 6 0 8 3 30
100 North West Kurunegala Polpithigama 14 9 10 24 2 10 0 69 101 North West Kurunegala Rasnayakapura 12 10 2 6 2 8 0 40 102 North West Kurunegala Ridigama 8 9 6 6 2 8 0 39 103 North West Kurunegala Udubaddawa 4 10 0 0 0 8 0 22 104 North West Kurunegala Wariyapola 14 10 2 0 2 8 0 36 105 North West Kurunegala Weerambugedara 3 10 6 0 0 8 0 27 106 North West Puttalam Anamaduwa 13 10 0 12 2 8 0 45 107 North West Puttalam Arachchikattuwa 6 10 2 0 2 6 0 26 108 North West Puttalam Chilaw 5 10 0 0 2 8 3 28 109 North West Puttalam Dankotuwa 7 10 0 0 2 10 0 29 110 North West Puttalam Kalpitiya 11 0 5 30 2 6 9 63 111 North West Puttalam Karuwalagaswewa 12 10 10 6 4 8 6 56 112 North West Puttalam Madampe 9 10 6 0 2 8 0 35 113 North West Puttalam Mahakumbukkadawala 15 10 2 18 4 6 0 55 114 North West Puttalam Mahawewa 10 10 0 0 2 8 9 39 115 North West Puttalam Mundel 12 3 2 6 2 6 0 31 116 North West Puttalam Nattandiya 9 10 10 0 2 8 0 39 117 North West Puttalam Nawagattegama 13 10 10 0 2 8 12 55 118 North West Puttalam Pallama 11 10 10 0 2 8 0 41 119 North West Puttalam Puttalam 11 8 10 6 2 8 15 60 120 North West Puttalam Vanathavillu 10 5 10 0 6 6 15 52 121 North West Puttalam Wennappuwa 9 7 5 0 4 8 6 39 122 Northern Jaffna Delft 14 0 5 0 10 0 15 44 123 Northern Jaffna Island North 13 0 5 0 8 0 15 41 124 Northern Jaffna Island South 12 0 5 0 6 0 15 38 125 Northern Jaffna Jaffna 14 10 5 0 6 2 15 52 126 Northern Jaffna Karainagar 13 0 5 0 2 0 9 29 127 Northern Jaffna Nallur 14 7 5 0 4 2 15 47 128 Northern Jaffna Thenmarachchy 14 5 5 6 4 2 0 36 129 Northern Jaffna Vadamarachchy East 14 0 5 0 6 2 15 42 130 Northern Jaffna Vadamarachchy North 14 0 5 6 4 2 9 40 131 Northern Jaffna Vadamarachchy South West 15 3 5 0 2 2 0 27 132 Northern Jaffna Valikamam East 15 4 5 18 4 2 0 48 133 Northern Jaffna Valikamam North 15 0 5 0 4 2 12 38 134 Northern Jaffna Valikamam South 15 0 5 6 4 2 3 35

The Preparatory Survey on the Project for Improvement of Agricultural Production and Productivity in Dry Zone Areas in Democratic Socialist Republic of Sri Lanka
Final Report
T 4-3
Table A 4.1 Result of Selection of Priority Site for Project Implementation (3/3)
No. Province District DS Division
Result of Scoring
Suitability of soil
Water Resources Farmer's
needs and ability
Market Advantage Adequateness of
Government Extension Services
Total ScoreAccessibility to
ground waterAppropriateness of surface water
Accessibility to main
road
Distance to Major Market
maximum point
allocated
maximum point
allocated
maximum point
allocated
maximum point
allocated
maximum point
allocated
maximum point
allocated
maximum point
allocated
( 15 ) ( 10 ) ( 10 ) ( 30 ) ( 10 ) ( 10 ) ( 15 ) ( 100 )135 Northern Jaffna Valikamam South West 15 0 5 12 4 2 0 38 136 Northern Jaffna Valikamam West 15 0 5 12 2 2 3 39 137 Northern Kilinochchi Kandawalai 7 8 2 0 2 2 0 21 138 Northern Kilinochchi Karachchi 9 6 10 0 4 2 0 31 139 Northern Kilinochchi Pachchilaipalli 1 0 0 0 4 2 15 22 140 Northern Kilinochchi Poonakari 13 1 0 0 6 2 9 31
141 Northern Mannar Madu 14 10 10 0 10 6 15 65 142 Northern Mannar Mannar 15 0 10 0 2 4 15 46 143 Northern Mannar Manthai West 13 3 10 6 4 4 15 55 144 Northern Mannar Musali 11 6 0 0 8 4 15 44 145 Northern Mannar Nanaddan 14 2 0 0 2 4 9 31 146 Northern Mullaitivu Manthai East 12 10 10 12 8 4 12 68 147 Northern Mullaitivu Maritimepattu 11 8 10 0 6 4 12 51 148 Northern Mullaitivu Oddusuddan 13 10 6 30 8 4 12 83 149 Northern Mullaitivu Puthukudiyiruppu 11 9 10 12 4 2 3 51 150 Northern Mullaitivu Thunukkai 13 10 6 12 6 4 12 63 151 Northern Mullaitivu Welioya N.A N.A N.A N.A N.A N.A N.A N.A152 Northern Vavuniya Cheddikulam 0 10 0 6 4 6 0 26 153 Northern Vavuniya Vavuniya 14 10 10 24 4 6 0 68 154 Northern Vavuniya Vavuniya - North 15 10 2 6 6 4 12 55 155 Northern Vavuniya Vavuniya-South 15 10 10 0 4 8 12 59 156 Uva Badulla Badulla 14 9 0 0 4 10 9 46 157 Uva Badulla Bandarawela 8 9 0 0 2 10 0 29 158 Uva Badulla Ella 8 10 0 12 2 10 12 54 159 Uva Badulla Haldummulla 8 9 0 6 4 10 12 49 160 Uva Badulla Hali Ela 12 9 0 30 2 10 3 66 161 Uva Badulla Haputale 13 8 0 0 2 10 9 42 162 Uva Badulla Kandaketiya 5 9 2 0 4 8 6 34 163 Uva Badulla Lunugala 13 10 0 0 2 8 0 33 164 Uva Badulla Mahiyangana 2 10 2 18 2 6 0 40 165 Uva Badulla Migahakivula 14 8 0 30 6 10 0 68 166 Uva Badulla Passara 9 9 0 0 2 8 0 28 167 Uva Badulla Ridimaliyadda 0 9 2 18 2 6 0 37 168 Uva Badulla Soranatota 14 8 0 0 2 8 0 32 169 Uva Badulla Uva paranagama 3 9 0 30 2 10 0 54 170 Uva Badulla Welimada 12 9 0 30 2 10 0 63 171 Uva Monaragala Badalkumpura 11 10 2 18 2 8 0 51 172 Uva Monaragala Bibile 12 10 6 18 2 8 0 56 173 Uva Monaragala Buttala 14 10 6 18 2 6 0 56 174 Uva Monaragala Kataragama 13 10 10 0 10 10 9 62 175 Uva Monaragala Madulla 14 10 6 30 2 6 0 68 176 Uva Monaragala Medagama 13 10 2 18 2 6 0 51 177 Uva Monaragala Monaragala 15 10 10 18 0 6 0 59 178 Uva Monaragala Sewanagala 12 10 0 6 4 2 0 34 179 Uva Monaragala Siyambalanduwa 13 10 2 24 10 6 0 65 180 Uva Monaragala Tanamalwila 14 10 0 0 6 6 0 36 181 Uva Monaragala Wellawaya 14 10 6 18 2 8 0 58

The Preparatory Survey on the Project for Improvement of Agricultural Production and Productivity in Dry Zone Areas in Democratic Socialist Republic of Sri Lanka
Final Report
T 4-4
Table A 4.2 Candidate DS Division for Project Implementation Province District Candidate DS Division Remarks Northern Mannar Madu
Manthai West Mullaitivu Manthai East
Oddusuddan Thunukkai
Vavuniya Vavuniya Vavuniya - North Vavuniya-South
Eastern Ampara Mahaoya Padiyatalawa
Batticaloa Eravur Pattu (Chenkalady) Koralaipattu North (Vaharai) Koralaipattu South (Kiran)
Trincomalee Kinniya Kuchchaveli Morawewa Muthur Town & Gravets
North Central Anuradhapura Galenbindunuwewa Galnewa Horowapotana kahatagasdigiliya Kekirawa Mahawilachchiya Nachchaduwa Nochchiyagama Nuwaragam Palatha Central Palugaswewa Rajanganaya Talawa Tambuttegama Tirappane
North West Kurunegala Ambanpola Low score but selected based on zonal development plan of NWPEhetuwewa Low score but selected based on zonal development plan of NWPGalgamuwa Giribawa kotavehera Mahawa Nikaweratiya Polpithigama
Puttalam Anamaduwa Low score but selected based on zonal development plan of NWPKaruwalagaswewa Mahakumbukkadawala Nawagattegama
Uva Badulla Hali Ela Migahakivula Welimada
Monaragala Badalkumpura Low score but selected based on the development plan of UP Bibile Buttala Madulla Monaragala Siyambalanduwa Wellawaya
Note: Although scores of Kalpitiya, Puttalam in Puttalam District and Kataragama in Moneragara District are high, these DS divisions were not selected due to provincial level adjustment based on the development plan

The Preparatory Survey on the Project for Improvement of Agricultural Production and Productivity in Dry Zone Areas in Democratic Socialist Republic of Sri Lanka
Final Report
T 4-5
Table A 4.3 Target Development Areas by Strategic Crop and DS Division in Each Province (1/2)
Province DS Division
Fruit OFC TOTAL Increment through Project
Ban
ana
Lim
e
Man
go
Pap
aw
Pas
sion
Fr
uits
Sw
eet
Ora
nge
Chi
li
Red
Oni
on
Big
Oni
on
Leg
umes
OFC (ha) Fruit (ha)
TOTAL (ha)
Under Irrigation Scheme
Under Agro well
Under Irrigation Scheme
Under Agro well
District North Mannar Manthai West 0 10 50 0 0 0 150 40 20 0 170 40 60 270 Madu 20 0 10 0 0 0 50 30 50 0 50 80 30 160 Mullative Thunukkai 0 0 0 0 0 0 180 10 20 280 480 10 0 490 Manthai East 0 0 0 0 0 10 450 10 60 130 620 30 10 660 Oddusuddan 0 0 0 0 0 10 540 20 30 230 800 20 10 830
Vauniya Vavuniya town 0 0 20 0 0 0 130 50 30 0 160 50 20 230 Vavuniya North 0 0 0 0 0 0 10 140 20 0 20 150 0 170 Vavuniya South 0 0 0 0 0 0 40 0 60 0 60 40 0 100
SUB TOTAL 20 10 80 0 0 20 1,550 300 290 640 2,360 420 20 110 2,910
East Trincomalee Kuchchiweli 0 0 0 20 0 0 10 400 40 60 110 400 20 530 Morawewa 0 0 0 0 0 0 0 0 0 160 160 0 0 160 Town & Gravets 0 0 20 0 0 10 40 10 20 70 130 10 30 170 Kinniya 20 0 30 0 0 20 0 20 0 10 10 20 70 100 Muthur 0 0 0 0 0 0 10 110 10 0 20 110 0 130
Ampara Padiyathalawa 30 20 10 0 0 20 0 0 0 20 20 0 80 100 Mahaoya 70 0 0 0 0 0 0 0 0 100 100 0 70 170
Batticaloa Koralaipattu South 0 0 0 0 0 0 0 0 0 330 330 0 0 330 Koralaipattu North 10 0 0 0 0 0 90 0 0 0 10 80 10 100 Chenkalady 20 0 70 0 0 0 10 0 0 0 0 10 90 100
SUB TOTAL 150 20 130 20 0 50 160 540 70 750 890 630 0 370 1,890
North Central Anuradapura Horowpothana 0 0 140 0 0 0 0 0 0 20 20 0 140 160 Kahatagasdigiliya 0 0 0 0 0 0 120 0 60 0 180 0 0 180 Galenbindunuwewa 0 0 40 0 0 0 190 0 20 0 210 0 40 250 Mahawilachchiya 40 0 40 0 0 0 20 0 0 0 0 20 80 100
Nuwaragampalatha (Central) 0 0 60 0 0 0 40 0 0 0 0 40 60 100
Nachchaduwa 0 0 10 0 0 0 30 0 60 0 0 90 10 100 Rajangana 0 0 0 0 0 0 0 0 0 0 0 0 0 0 Galnewa 20 0 0 0 0 0 80 0 0 0 0 80 20 100 Thambuttegama 0 0 0 0 0 0 0 0 0 0 0 0 0 0 Talawa 0 0 0 0 0 30 0 0 70 0 0 70 30 100 Nochchiyagama 0 0 30 0 0 0 70 0 0 0 0 70 30 100 Tirappane 10 0 20 0 0 10 60 0 0 0 0 60 40 100 Palugaswewa 0 0 0 0 0 0 100 0 0 0 30 70 0 100 Kakirawa 20 10 0 0 0 0 70 0 0 0 0 70 30 100 System H Mahaveli System H 0 0 60 30 0 10 1,650 20 1,210 5,270 8,150 0 100 8,250
SUB TOTAL 90 10 400 30 0 50 2,430 20 1,420 5,290 8,590 570 0 580 9,740 North West Kurunegala Galgamuwa 10 30 50 0 0 10 0 0 0 0 0 0 100 100 Giribawa 0 0 30 10 0 10 10 0 0 40 50 0 50 100 Ehatuwewa 0 0 0 0 0 0 0 0 0 0 0 0 0 0 Ambanpola 0 40 50 40 0 10 0 0 0 0 0 0 140 140 Nikaweratiya 10 0 0 40 0 30 20 0 0 0 0 20 80 100 Maho 10 0 50 50 0 10 0 0 30 0 0 30 120 150 Kotawehera 10 0 40 20 0 30 40 0 0 0 40 0 100 140 Polpithigama 10 0 90 150 0 20 0 10 50 0 0 60 270 330
Puttalam Karuwalagaswewa 0 50 130 50 0 50 40 10 0 330 380 0 280 660 Nawagattegama 0 0 60 0 0 20 10 0 10 0 10 10 80 100 Anamaduwa 0 30 40 20 0 10 290 0 50 180 520 0 100 620 Mahakumbukkadawala 0 0 0 0 0 0 100 0 0 0 0 100 0 100
SUB TOTAL 50 150 540 380 0 200 510 20 140 550 1,000 220 280 1,040 2,540
Uva Badulla Haliela 30 0 10 0 0 40 0 0 80 0 0 80 80 160 Welimada 0 0 0 0 20 20 120 10 200 0 90 240 40 370 Meegahakiwla 0 0 20 0 0 0 0 0 80 0 0 80 20 100
Maneragala Badalkumbura 30 10 0 0 0 30 40 0 0 90 130 0 70 200 Madulla 0 0 10 20 10 50 70 0 0 0 0 70 90 160 Bibila 0 0 0 0 0 110 30 0 0 0 0 30 110 140 Buttala 30 0 0 0 10 20 310 0 0 0 10 300 60 370 Wellawaya 0 0 40 0 0 30 30 0 0 0 30 0 70 100 Monaragala 0 0 100 0 0 0 0 0 0 0 0 0 100 100 Siyambalanduwa 0 0 70 0 0 0 30 0 0 0 10 20 70 100
SUB TOTAL 90 10 250 20 40 300 630 10 360 90 270 820 0 710 1,800
TOTAL 400 200 1,400 450 40 620 5,280 890 2,280 7,320 13,110 2,660 300 2,810 18,880
Source: JICA Survey Team
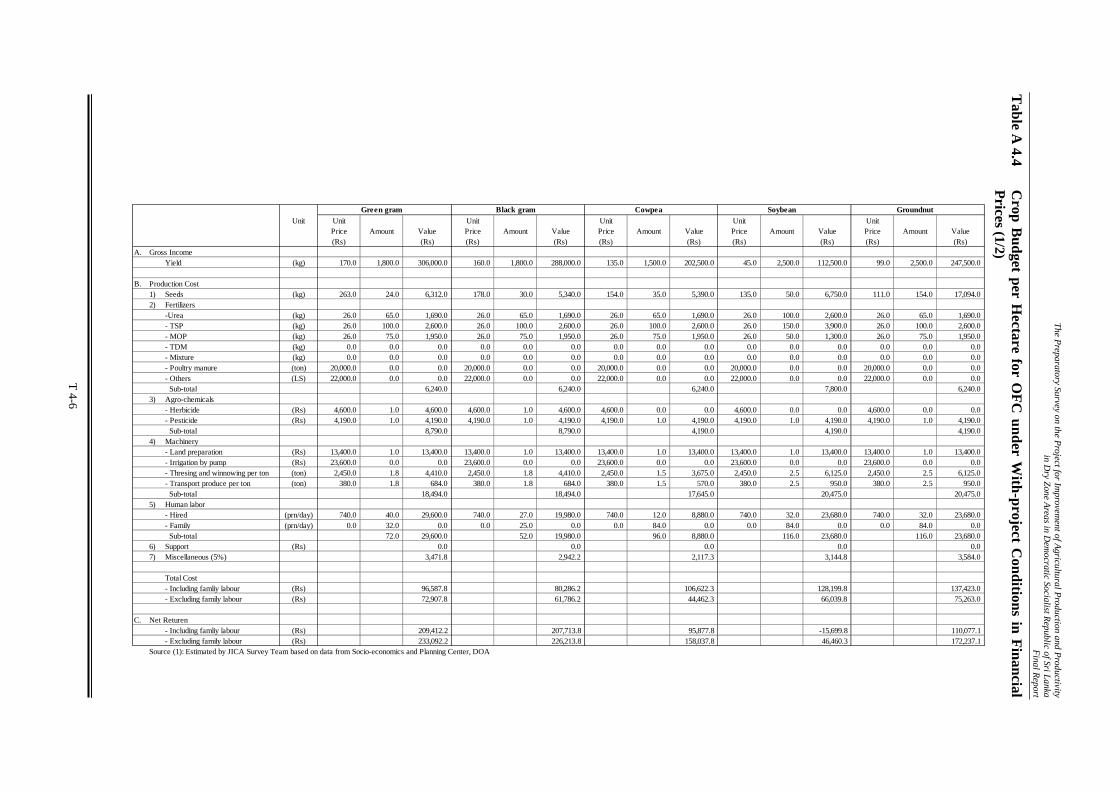
The Preparatory Survey on the P
roject for Improvem
ent of Agricultural P
roduction and Productivity
in Dry Zone A
reas in Dem
ocratic Socialist Republic of Sri Lanka
Final R
eport
T 4-6
Table A
4.4 C
rop Budget per H
ectare for OFC
under With-project C
onditions in Financial Prices (1/2)
Green gram Black gram Cowpea Soybean GroundnutUnit Unit Unit Unit Unit Unit
Price Amount Value Price Amount Value Price Amount Value Price Amount Value Price Amount Value(Rs) (Rs) (Rs) (Rs) (Rs) (Rs) (Rs) (Rs) (Rs) (Rs)
A. Gross IncomeYield (kg) 170.0 1,800.0 306,000.0 160.0 1,800.0 288,000.0 135.0 1,500.0 202,500.0 45.0 2,500.0 112,500.0 99.0 2,500.0 247,500.0
B. Production Cost1) Seeds (kg) 263.0 24.0 6,312.0 178.0 30.0 5,340.0 154.0 35.0 5,390.0 135.0 50.0 6,750.0 111.0 154.0 17,094.02) Fertilizers
-Urea (kg) 26.0 65.0 1,690.0 26.0 65.0 1,690.0 26.0 65.0 1,690.0 26.0 100.0 2,600.0 26.0 65.0 1,690.0- TSP (kg) 26.0 100.0 2,600.0 26.0 100.0 2,600.0 26.0 100.0 2,600.0 26.0 150.0 3,900.0 26.0 100.0 2,600.0- MOP (kg) 26.0 75.0 1,950.0 26.0 75.0 1,950.0 26.0 75.0 1,950.0 26.0 50.0 1,300.0 26.0 75.0 1,950.0- TDM (kg) 0.0 0.0 0.0 0.0 0.0 0.0 0.0 0.0 0.0 0.0 0.0 0.0 0.0 0.0 0.0- Mixture (kg) 0.0 0.0 0.0 0.0 0.0 0.0 0.0 0.0 0.0 0.0 0.0 0.0 0.0 0.0 0.0- Poultry manure (ton) 20,000.0 0.0 0.0 20,000.0 0.0 0.0 20,000.0 0.0 0.0 20,000.0 0.0 0.0 20,000.0 0.0 0.0- Others (LS) 22,000.0 0.0 0.0 22,000.0 0.0 0.0 22,000.0 0.0 0.0 22,000.0 0.0 0.0 22,000.0 0.0 0.0 Sub-total 6,240.0 6,240.0 6,240.0 7,800.0 6,240.0
3) Agro-chemicals- Herbicide (Rs) 4,600.0 1.0 4,600.0 4,600.0 1.0 4,600.0 4,600.0 0.0 0.0 4,600.0 0.0 0.0 4,600.0 0.0 0.0- Pesticide (Rs) 4,190.0 1.0 4,190.0 4,190.0 1.0 4,190.0 4,190.0 1.0 4,190.0 4,190.0 1.0 4,190.0 4,190.0 1.0 4,190.0 Sub-total 8,790.0 8,790.0 4,190.0 4,190.0 4,190.0
4) Machinery- Land preparation (Rs) 13,400.0 1.0 13,400.0 13,400.0 1.0 13,400.0 13,400.0 1.0 13,400.0 13,400.0 1.0 13,400.0 13,400.0 1.0 13,400.0- Irrigation by pump (Rs) 23,600.0 0.0 0.0 23,600.0 0.0 0.0 23,600.0 0.0 0.0 23,600.0 0.0 0.0 23,600.0 0.0 0.0- Thresing and winnowing per ton (ton) 2,450.0 1.8 4,410.0 2,450.0 1.8 4,410.0 2,450.0 1.5 3,675.0 2,450.0 2.5 6,125.0 2,450.0 2.5 6,125.0- Transport produce per ton (ton) 380.0 1.8 684.0 380.0 1.8 684.0 380.0 1.5 570.0 380.0 2.5 950.0 380.0 2.5 950.0 Sub-total 18,494.0 18,494.0 17,645.0 20,475.0 20,475.0
5) Human labor- Hired (prn/day) 740.0 40.0 29,600.0 740.0 27.0 19,980.0 740.0 12.0 8,880.0 740.0 32.0 23,680.0 740.0 32.0 23,680.0- Family (prn/day) 0.0 32.0 0.0 0.0 25.0 0.0 0.0 84.0 0.0 0.0 84.0 0.0 0.0 84.0 0.0 Sub-total 72.0 29,600.0 52.0 19,980.0 96.0 8,880.0 116.0 23,680.0 116.0 23,680.0
6) Support (Rs) 0.0 0.0 0.0 0.0 0.07) Miscellaneous (5%) 3,471.8 2,942.2 2,117.3 3,144.8 3,584.0
Total Cost- Including famliy labour (Rs) 96,587.8 80,286.2 106,622.3 128,199.8 137,423.0- Excluding family labour (Rs) 72,907.8 61,786.2 44,462.3 66,039.8 75,263.0
C. Net Returen- Including famliy labour (Rs) 209,412.2 207,713.8 95,877.8 -15,699.8 110,077.1- Excluding family labour (Rs) 233,092.2 226,213.8 158,037.8 46,460.3 172,237.1
Source (1): Estimated by JICA Survey Team based on data from Socio-economics and Planning Center, DOA

The Preparatory Survey on the P
roject for Improvem
ent of Agricultural P
roduction and Productivity
in Dry Zone A
reas in Dem
ocratic Socialist Republic of Sri Lanka
Final R
eport
T 4-7
Table A
4.4 C
rop Budget per H
ectare for OFC
under With-project C
onditions in Financial Prices (2/2)
Legumes Average Chilli (Green) Red onion Big onion Paddy IrrigatedUnit Unit Unit Unit Unit Unit Value
Price Amount Value Price Amount Value Price Amount Value Price Amount Value Price Amount(Rs) (Rs) (Rs) (Rs) (Rs) (Rs) (Rs) (Rs) (Rs) (Rs)
A. Gross IncomeYield (kg) 231,300.0 100.0 11,000.0 1,100,000.0 87.0 15,500.0 1,348,500.0 67.0 18,000.0 1,206,000.0 28.0 5,500.0 154,000.0
B. Production Cost1) Seeds (kg) 1,976.0 1.8 3,458.0 112.0 1,406.2 157,494.4 4,201.0 7.7 32,347.7 64.0 139.3 8,915.22) Fertilizers
-Urea (kg) 26.0 255.0 6,630.0 26.0 139.0 3,614.0 26.0 200.0 5,200.0 7.0 274.0 1,918.0- TSP (kg) 26.0 145.0 3,770.0 26.0 290.0 7,540.0 26.0 185.0 4,810.0 7.0 101.0 707.0- MOP (kg) 26.0 130.0 3,380.0 26.0 0.0 0.0 26.0 0.0 0.0 7.0 89.0 623.0- TDM (kg) 26.0 0.0 0.0 26.0 0.0 0.0 26.0 0.0 0.0 0.0 0.0 0.0- Mixture (kg) 26.0 150.0 3,900.0 26.0 321.0 8,346.0 26.0 520.0 13,520.0 0.0 0.0 0.0- Poultry manure (ton) 20,000.0 0.0 0.0 20,000.0 0.0 0.0 20,000.0 0.0 0.0 20,000.0 0.0 0.0- Others (LS) 22,000.0 1.0 22,000.0 22,000.0 1.0 22,000.0 22,000.0 1.0 22,000.0 22,000.0 0.0 0.0 Sub-total 39,680.0 41,500.0 45,530.0 3,248.0
3) Agro-chemicals- Herbicide (Rs) 5,910.0 0.0 0.0 5,910.0 1.0 5,910.0 5,910.0 1.0 5,910.0 8,150.0 1.0 8,150.0- Pesticide (Rs) 34,550.0 1.0 34,550.0 34,550.0 1.0 34,550.0 34,550.0 1.0 34,550.0 4,210.0 1.0 4,210.0 Sub-total 34,550.0 40,460.0 40,460.0 12,360.0
4) Machinery- Land preparation (Rs) 13,400.0 1.0 13,400.0 13,400.0 1.0 13,400.0 13,400.0 1.0 13,400.0 13,400.0 1.0 13,400.0- Irrigation by pump (Rs) 23,600.0 0.0 0.0 23,600.0 0.0 0.0 23,600.0 0.0 0.0 23,600.0 0.0 0.0- Thresing and winnowing per ton (ton) 2,450.0 0.0 0.0 2,450.0 0.0 0.0 2,450.0 0.0 0.0 2,450.0 5.5 13,475.0- Transport produce per ton (ton) 380.0 11.0 4,180.0 380.0 15.5 5,890.0 380.0 18.0 6,840.0 380.0 5.5 2,090.0 Sub-total 17,580.0 19,290.0 20,240.0 28,965.0
5) Human labor- Hired (prn/day) 740.0 146.0 108,040.0 740.0 175.0 129,500.0 740.0 210.0 155,400.0 740.0 32.0 23,680.0- Family (prn/day) 0.0 228.0 0.0 0.0 62.0 0.0 0.0 89.0 0.0 0.0 35.0 0.0 Sub-total 374.0 108,040.0 237.0 129,500.0 299.0 155,400.0 67.0 23,680.0
6) Support (Rs) 0.0 0.0 0.0 0.07) Miscellaneous (5%) 10,165.4 19,412.2 14,698.9 3,858.4
Total Cost- Including famliy labour (Rs) 109,823.8 382,193.4 453,536.6 374,536.6 106,926.6- Excluding family labour (Rs) 64,091.8 213,473.4 407,656.6 308,676.6 81,026.6
C. Net Returen- Including famliy labour (Rs) 121,476.2 717,806.6 894,963.4 831,463.4 47,073.4- Excluding family labour (Rs) 167,208.2 886,526.6 940,843.4 897,323.4 72,973.4
Source (1): Estimated by JICA Survey Team based on data from Socio-economics and Planning Center, DOA

The Preparatory Survey on the P
roject for Improvem
ent of Agricultural P
roduction and Productivity
in Dry Zone A
reas in Dem
ocratic Socialist Republic of Sri Lanka
Final R
eport
T 4-8
Table A
4.5 C
rop Budget per H
ectare for Fruits under With-project C
ondition in Financial Prices(1/6)
(1) BananaBanana: 1st Year Banana: 2nd Year Banana: 3rd Year Banana: 4th Year Banana: 5th Year Banana: 5-year Ave.
Unit UnitPrice Amount Value Amount Value Amount Value Amount Value Amount Value Amount Value(Rs) (Rs) (Rs) (Rs) (Rs) (Rs) (Rs)
A. Gross IncomeYield (kg) 20.0 0.0 0.0 23,000.0 460,000.0 35,000.0 700,000.0 26,000.0 520,000.0 16,000.0 320,000.0 20,000.0 400,000.0
B. Production Cost1) Suckers (kg) 24.3 1,100.0 26,730.0 0.0 0.0 0.0 0.0 0.0 0.0 0.0 0.0 220.0 5,346.02) Fertilizers
-Urea (kg) 26.0 462.0 12,012.0 415.8 10,810.8 415.8 10,810.8 415.8 10,810.8 415.8 10,810.8 425.0 11,051.0- TSP (kg) 26.0 308.0 8,008.0 277.2 7,207.2 277.2 7,207.2 277.2 7,207.2 277.2 7,207.2 283.4 7,367.4- MOP (kg) 26.0 962.0 25,012.0 865.8 22,510.8 865.8 22,510.8 865.8 22,510.8 865.8 22,510.8 885.0 23,011.0- Compost (ton) 20,000.0 10.0 200,000.0 0.0 0.0 10.0 200,000.0 10.0 200,000.0 0.0 0.0 6.0 120,000.0- Others (ha) 0.0 0.0 0.0 0.0 0.0 0.0 0.0 0.0 0.0 0.0 0.0 0.0 0.0 Sub-total 245,032.0 40,528.8 240,528.8 240,528.8 40,528.8 161,429.4
3) Agro-chemicals- Herbicide (ha) 12,150.0 1.0 12,150.0 1.0 12,150.0 1.0 12,150.0 1.0 12,150.0 1.0 12,150.0 1.0 12,150.0- Pesticide (ha) 10,640.0 0.0 0.0 1.0 10,640.0 1.0 10,640.0 1.0 10,640.0 1.0 10,640.0 0.8 8,512.0- Hormone (ha) 3,800.0 0.0 0.0 0.0 0.0 0.0 0.0 0.0 0.0 0.0 0.0 0.0 0.0 Sub-total 12,150.0 22,790.0 22,790.0 22,790.0 22,790.0 20,662.0
4) Machinery- Land preparation (ha) 13,400.0 1.0 13,400.0 0.0 0.0 0.0 0.0 0.0 0.0 0.0 0.0 0.2 2,680.0- Irrigation by pump (ha) 23,600.0 1.0 23,600.0 1.0 23,600.0 1.0 23,600.0 1.0 23,600.0 1.0 23,600.0 1.0 23,600.0- Transport produce per ton (ton) 380.0 0.0 0.0 23.0 8,740.0 35.0 13,300.0 26.0 9,880.0 16.0 6,080.0 20.0 7,600.0 Sub-total 37,000.0 32,340.0 36,900.0 33,480.0 29,680.0 33,880.0
5) Human labor- Hired (prn/day) 740.0 110.0 81,400.0 44.0 32,560.0 44.0 32,560.0 44.0 32,560.0 44.0 32,560.0 57.2 42,328.0- Family (prn/day) 0.0 171.0 0.0 67.0 0.0 67.0 0.0 67.0 0.0 67.0 0.0 87.8 0.0 Sub-total 281.0 81,400.0 111.0 32,560.0 111.0 32,560.0 111.0 32,560.0 111.0 32,560.0 145.0 42,328.0
6) Support- Poles and wires (ha) 70,200.0 0.0 0.0 0.0 0.0 0.0 0.0 0.0 0.0 0.0 0.0 0.0 0.0
7) Miscellaneous (5%) 20,115.6 6,410.9 16,638.9 16,467.9 6,277.9 13,182.3
Total Cost- Including famliy labour 548,967.6 184,209.7 398,997.7 395,406.7 181,416.7 341,799.7- Excluding family labour 422,427.6 134,629.7 349,417.7 345,826.7 131,836.7 276,827.7
C. Net Returen- Including famliy labour -548,967.6 275,790.3 301,002.3 124,593.3 138,583.3 58,200.3- Excluding family labour -422,427.6 325,370.3 350,582.3 174,173.3 188,163.3 123,172.3
Source: Estimated by JICA Survey Team based on data from DOA

The Preparatory Survey on the P
roject for Improvem
ent of Agricultural P
roduction and Productivity
in Dry Zone A
reas in Dem
ocratic Socialist Republic of Sri Lanka
Final R
eport
T 4-9
Table A
4.5 C
rop Budget per H
ectare for Fruits under With-project C
ondition in Financial Prices (2/6)
(2) PapawPapaw: 1st Year Papaw: 2nd Year Papaw: 3rd Year Papaw: 4th Year Papaw: 4-year Average
Unit UnitPrice Amount Value Amount Value Amount Value Amount Value Amount Value Amount Value(Rs) (Rs) (Rs) (Rs) (Rs) (Rs) (Rs)
A. Gross IncomeYield (kg) 33.2 0.0 0.0 32,500.0 1,079,000.0 36,000.0 1,195,200.0 31,500.0 1,045,800.0 25,000.0 830,000.0
B. Production Cost1) Seedlings (kg) 36.5 1,125.0 41,062.5 0.0 0.0 0.0 0.0 0.0 0.0 281.3 10,265.62) Fertilizers
-Urea (kg) 26.0 603.3 15,686.7 537.1 13,965.7 537.1 13,965.7 537.1 13,965.7 553.7 14,395.9- TSP (kg) 26.0 349.0 9,074.0 310.7 8,078.5 310.7 8,078.5 310.7 8,078.5 320.3 8,327.4- MOP (kg) 26.0 1,271.7 33,063.3 1,132.1 29,435.8 1,132.1 29,435.8 1,132.1 29,435.8 1,167.0 30,342.7- Compost (ton) 20,000.0 11.0 220,000.0 11.0 220,000.0 11.0 220,000.0 11.0 220,000.0 11.0 220,000.0- Others (ha) 0.0 0.0 0.0 0.0 0.0 0.0 0.0 0.0 0.0 0.0 Sub-total 277,824.0 271,480.0 271,480.0 271,480.0 273,066.0
3) Agro-chemicals- Herbicide (ha) 12,150.0 0.0 0.0 0.0 0.0 0.0 0.0 0.0 0.0 0.0 0.0- Pesticide (ha) 10,640.0 1.0 10,640.0 1.0 10,640.0 1.0 10,640.0 1.0 10,640.0 1.0 10,640.0- Hormone (ha) 3,800.0 0.0 0.0 0.0 0.0 0.0 0.0 0.0 0.0 0.0 0.0 Sub-total 10,640.0 10,640.0 10,640.0 10,640.0 10,640.0
4) Machinery- Land preparation (ha) 13,400.0 1.0 13,400.0 0.0 0.0 0.0 0.0 0.0 0.0 0.3 3,350.0- Irrigation by pump (ha) 23,600.0 1.0 23,600.0 1.0 23,600.0 1.0 23,600.0 1.0 23,600.0 1.0 23,600.0- Transport produce per ton (ton) 380.0 0.0 0.0 32.5 12,350.0 36.0 13,680.0 31.5 11,970.0 25.0 9,500.0 Sub-total 37,000.0 35,950.0 37,280.0 35,570.0 36,450.0
5) Human labor- Hired (prn/day) 740.0 112.8 83,474.8 102.0 75,498.7 118.5 87,694.7 102.0 75,498.7 108.8 80,541.7- Family (prn/day) 0.0 171.2 0.0 158.0 0.0 183.5 0.0 158.0 0.0 167.7 0.0 Sub-total 284.0 83,474.8 260.0 75,498.7 302.0 87,694.7 260.0 75,498.7 276.5 80,541.7
6) Support- Poles and wires (ha) 70,200.0 0.0 0.0 0.0 0.0 0.0 0.0 0.0 0.0 0.0 0.0
7) Miscellaneous (5%) 22,500.1 19,678.4 20,354.7 19,659.4 20,548.2
Total Cost- Including famliy labour 599,186.6 530,148.4 563,234.7 529,749.4 555,579.8- Excluding family labour 472,501.3 413,247.2 427,449.4 412,848.2 431,511.5
C. Net Returen- Including famliy labour -599,186.6 548,851.6 631,965.3 516,050.6 274,420.2- Excluding family labour -472,501.3 665,752.8 767,750.6 632,951.8 398,488.5
Source: Estimated by JICA Survey Team based on data from DOA

The Preparatory Survey on the P
roject for Improvem
ent of Agricultural P
roduction and Productivity
in Dry Zone A
reas in Dem
ocratic Socialist Republic of Sri Lanka
Final R
eport
T 4-10
Table A
4.5 C
rop Budget per H
ectare for Fruits under With-project C
ondition in Financial Prices (3/6)
(3) Passion fruitPassion fruit: 1st Year Passion fruit: 2nd Year Passion fruit: 3rd Year Passion fruit: 4th Year Passion fruit: 5th Year Passion fruit: 5-Yr Ave.
Unit UnitPrice Amount Value Amount Value Amount Value Amount Value Amount Value Amount Value(Rs) (Rs) (Rs) (Rs) (Rs) (Rs) (Rs)
A. Gross IncomeYield (kg) 51.3 0.0 0.0 20,000.0 1,026,000.0 22,000.0 1,128,600.0 17,500.0 897,750.0 10,500.0 538,650.0 14,000.0 718,200.0
B. Production Cost1) Seedling (kg) 15.0 1,125.0 16,875.0 0.0 0.0 0.0 0.0 0.0 0.0 0.0 0.0 225.0 3,375.02) Fertilizers
-Urea (kg) 26.0 202.0 5,252.0 282.8 7,352.8 282.8 7,352.8 343.4 8,928.4 551.5 14,338.0 332.5 8,644.8- TSP (kg) 26.0 360.0 9,360.0 504.0 13,104.0 504.0 13,104.0 612.0 15,912.0 982.8 25,552.8 592.6 15,406.6- MOP (kg) 26.0 180.0 4,680.0 252.0 6,552.0 252.0 6,552.0 306.0 7,956.0 491.4 12,776.4 296.3 7,703.3- Compost (ton) 20,000.0 10.0 200,000.0 10.0 200,000.0 10.0 200,000.0 10.0 200,000.0 10.0 200,000.0 10.0 200,000.0- Others (ha) 0.0 1.0 0.0 1.0 0.0 1.0 0.0 1.0 0.0 1.0 0.0 1.0 0.0 Sub-total 219,292.0 227,008.8 227,008.8 232,796.4 252,667.2 231,754.6
3) Agro-chemicals- Herbicide (ha) 12,150.0 0.0 0.0 0.0 0.0 0.0 0.0 0.0 0.0 0.0 0.0 0.0 0.0- Pesticide (ha) 10,640.0 1.0 10,640.0 1.0 10,640.0 1.0 10,640.0 1.0 10,640.0 1.0 10,640.0 1.0 10,640.0- Hormone (ha) 3,800.0 0.0 0.0 0.0 0.0 0.0 0.0 0.0 0.0 0.0 0.0 0.0 0.0 Sub-total 10,640.0 10,640.0 10,640.0 10,640.0 10,640.0 10,640.0
4) Machinery- Land preparation (ha) 13,400.0 1.0 13,400.0 0.0 0.0 0.0 0.0 0.0 0.0 0.0 0.0 0.2 2,680.0- Irrigation by pump (ha) 23,600.0 1.0 23,600.0 1.0 23,600.0 1.0 23,600.0 1.0 23,600.0 1.0 23,600.0 1.0 23,600.0- Transport produce per ton (ton) 380.0 0.0 0.0 20.0 7,600.0 22.0 8,360.0 17.5 6,650.0 10.5 3,990.0 14.0 5,320.0 Sub-total 37,000.0 31,200.0 31,960.0 30,250.0 27,590.0 31,600.0
5) Human labor- Hired (prn/day) 740.0 139.0 102,860.0 94.0 69,560.0 98.0 72,520.0 98.0 72,520.0 98.0 72,520.0 105.4 77,996.0- Family (prn/day) 0.0 217.0 0.0 146.0 0.0 152.0 0.0 152.0 0.0 152.0 0.0 163.8 0.0 Sub-total 356.0 102,860.0 240.0 69,560.0 250.0 72,520.0 250.0 72,520.0 250.0 72,520.0 269.2 77,996.0
6) Support- Poles and wires (ha) 70,200.0 0.0 0.0 0.0 0.0 0.0 0.0 0.0 0.0 0.0 0.0 0.0 0.0
7) Miscellaneous (5%) 19,333.4 16,920.4 17,106.4 17,310.3 18,170.9 17,768.3
Total Cost- Including famliy labour 566,580.4 463,369.2 471,715.2 475,996.7 494,068.0 494,345.9- Excluding family labour 406,000.4 355,329.2 359,235.2 363,516.7 381,588.0 373,133.9
C. Net Returen- Including famliy labour -566,580.4 562,630.8 656,884.8 421,753.3 44,582.0 223,854.1- Excluding family labour -406,000.4 670,670.8 769,364.8 534,233.3 157,062.0 345,066.1
Source: Estimated by JICA Survey Team based on data from DOA

The Preparatory Survey on the P
roject for Improvem
ent of Agricultural P
roduction and Productivity
in Dry Zone A
reas in Dem
ocratic Socialist Republic of Sri Lanka
Final R
eport
T 4-11
Table A
4.5 C
rop Budget per H
ectare for Fruits under With-project C
ondition in Financial Prices (4/6)
(4) MangoMango: 1st Year Mango: 2nd Year Mango: 3rd Year Mango: 4th Year Mango: 5th Year Mango: 6th Year Mango: 7-20th Yr Ave. Mango: 20-Yr Ave.
Unit UnitPrice Amount Value Amount Value Amount Value Amount Value Amount Value Amount Value Amount Value Amount Value(Rs) (Rs) (Rs) (Rs) (Rs) (Rs) (Rs) (Rs) (Rs)
A. Gross IncomeYield (kg) 58.2 0.0 0.0 0.0 0.0 0.0 0.0 0.0 0.0 6,800.0 395,760.0 6,800.0 395,760.0 27,600.0 1,606,320.0 20,000.0 1,164,000.0
B. Production Cost1) Seedling (kg) 121.6 105.0 12,768.0 0.0 0.0 0.0 0.0 0.0 0.0 0.0 0.0 0.0 0.0 0.0 0.0 5.3 638.42) Fertilizers
-Urea (kg) 26.0 42.0 1,092.0 42.0 1,092.0 42.0 1,092.0 42.0 1,092.0 69.0 1,794.0 87.0 2,262.0 177.0 4,602.0 140.1 3,642.6- TSP (kg) 26.0 51.0 1,326.0 51.0 1,326.0 51.0 1,326.0 51.0 1,326.0 84.0 2,184.0 106.0 2,756.0 215.0 5,590.0 170.2 4,425.2- MOP (kg) 26.0 23.0 598.0 23.0 598.0 23.0 598.0 23.0 598.0 38.0 988.0 48.0 1,248.0 97.0 2,522.0 76.8 1,996.8- Compost (ton) 20,000.0 10.0 200,000.0 10.0 200,000.0 10.0 200,000.0 10.0 200,000.0 10.0 200,000.0 10.0 200,000.0 10.0 200,000.0 10.0 200,000.0- Others (LS) 0.0 0.0 0.0 0.0 0.0 0.0 0.0 0.0 0.0 0.0 0.0 0.0 0.0 0.0 0.0 0.0 0.0 Sub-total 203,016.0 203,016.0 203,016.0 203,016.0 204,966.0 206,266.0 212,714.0 210,064.6
3) Agro-chemicals- Herbicide (ha) 12,150.0 1.0 12,150.0 1.0 12,150.0 1.0 12,150.0 1.0 12,150.0 1.0 12,150.0 1.0 12,150.0 1.0 12,150.0 1.0 12,150.0- Pesticide (ha) 10,640.0 0.0 0.0 1.0 10,640.0 1.0 10,640.0 1.0 10,640.0 1.0 10,640.0 1.0 10,640.0 1.0 10,640.0 1.0 10,108.0- Hormone (ha) 3,800.0 0.0 0.0 0.0 0.0 0.0 0.0 0.0 0.0 0.0 0.0 0.0 0.0 0.0 0.0 0.0 0.0 Sub-total 12,150.0 22,790.0 22,790.0 22,790.0 22,790.0 22,790.0 22,790.0 22,258.0
4) Machinery- Land preparation (ha) 13,400.0 1.0 13,400.0 0.0 0.0 0.0 0.0 0.0 0.0 0.0 0.0 0.0 0.0 0.0 0.0 0.1 670.0- Irrigation by pump (ha) 23,600.0 1.0 23,600.0 1.0 23,600.0 1.0 23,600.0 1.0 23,600.0 1.0 23,600.0 1.0 23,600.0 1.0 23,600.0 1.0 23,600.0- Transport produce per ton (ton) 380.0 0.0 0.0 0.0 0.0 0.0 0.0 0.0 0.0 6.8 2,584.0 6.8 2,584.0 27.6 10,488.0 20.0 7,600.0 Sub-total 37,000.0 23,600.0 23,600.0 23,600.0 26,184.0 26,184.0 34,088.0 31,870.0
5) Human labor- Hired (prn/day) 740.0 47.0 34,780.0 37.0 27,380.0 38.0 28,120.0 71.0 52,540.0 82.0 60,680.0 83.0 61,420.0 83.0 61,420.0 76.0 56,240.0- Family (prn/day) 0.0 73.0 0.0 57.0 0.0 59.0 0.0 111.0 0.0 127.0 0.0 131.0 0.0 131.0 0.0 119.6 0.0 Sub-total 120.0 34,780.0 94.0 27,380.0 97.0 28,120.0 182.0 52,540.0 209.0 60,680.0 214.0 61,420.0 214.0 61,420.0 195.6 56,240.0
6) Support- Poles and wires (ha) 70,200.0 1.0 70,200.0 0.0 0.0 0.0 0.0 0.0 0.0 0.0 0.0 0.2 14,040.0 0.0 2,808.0 0.1 6,177.6
7) Miscellaneous (5%) 18,495.7 13,839.3 13,876.3 15,097.3 15,731.0 16,535.0 16,691.0 16,362.4
Total Cost- Including famliy labour 442,429.7 332,805.3 335,062.3 399,183.3 424,331.0 444,175.0 447,451.0 432,115.0- Excluding family labour 388,409.7 290,625.3 291,402.3 317,043.3 330,351.0 347,235.0 350,511.0 343,611.0
C. Net Returen- Including famliy labour -442,429.7 -332,805.3 -335,062.3 -399,183.3 -28,571.0 -48,415.0 1,158,869.0 731,885.0- Excluding family labour -388,409.7 -290,625.3 -291,402.3 -317,043.3 65,409.0 48,525.0 1,255,809.0 820,389.0
Source: Estimated by JICA Survey Team based on data from DOA

The Preparatory Survey on the P
roject for Improvem
ent of Agricultural P
roduction and Productivity
in Dry Zone A
reas in Dem
ocratic Socialist Republic of Sri Lanka
Final R
eport
T 4-12
Table A
4.5 C
rop Budget per H
ectare for Fruits under With-project C
ondition in Financial Prices (5/6)
(5) Sweet OrangeOrange: 1st Year Orange: 2nd Year Orange: 3rd Year Orange: 4th Year Orange: 5th Year Orange: 6-8th Yr Ave. Orange: 9-15th Yr Ave. Orange: 15-Yr Ave.
Unit UnitPrice Amount Value Amount Value Amount Value Amount Value Amount Value Amount Value Amount Value Amount Value(Rs) (Rs) (Rs) (Rs) (Rs) (Rs) (Rs) (Rs) (Rs)
A. Gross IncomeYield (fruit) 76.8 0.0 0.0 0.0 0.0 0.0 0.0 4,000.0 307,200.0 8,000.0 614,400.0 16,800.0 1,290,240.0 16,800.0 1,290,240.0 12,000.0 921,600.0
B. Production Cost1) Seedlings (kg) 121.6 562.0 68,339.2 0.0 0.0 0.0 0.0 0.0 0.0 0.0 0.0 0.0 0.0 0.0 0.0 37.5 4,555.92) Fertilizers
-Urea (kg) 26.0 90.0 2,340.0 88.0 2,288.0 133.0 3,458.0 175.0 4,550.0 220.0 5,720.0 264.0 6,864.0 264.0 6,864.0 223.1 5,799.7- TSP (kg) 26.0 112.0 2,912.0 110.0 2,860.0 164.0 4,264.0 218.0 5,668.0 274.0 7,124.0 327.0 8,502.0 327.0 8,502.0 276.5 7,189.9- MOP (kg) 26.0 51.0 1,326.0 50.0 1,300.0 74.0 1,924.0 100.0 2,600.0 124.0 3,224.0 149.0 3,874.0 149.0 3,874.0 125.9 3,274.3- Compost (ton) 20,000.0 5.6 112,400.0 6.0 120,000.0 6.0 120,000.0 6.0 120,000.0 6.0 120,000.0 6.0 120,000.0 6.0 120,000.0 6.0 119,493.3- Others (LS) 0.0 0.0 0.0 0.0 0.0 0.0 0.0 0.0 0.0 0.0 0.0 0.0 0.0 0.0 0.0 0.0 0.0 Sub-total 118,978.0 126,448.0 129,646.0 132,818.0 136,068.0 139,240.0 139,240.0 135,757.2
3) Agro-chemicals- Herbicide (ha) 12,150.0 1.0 12,150.0 1.0 12,150.0 1.0 12,150.0 1.0 12,150.0 1.0 12,150.0 1.0 12,150.0 1.0 12,150.0 1.0 12,150.0- Pesticide (ha) 10,640.0 1.0 10,640.0 1.0 10,640.0 1.0 10,640.0 1.0 10,640.0 1.0 10,640.0 1.0 10,640.0 1.0 10,640.0 1.0 10,640.0- Hormone (ha) 3,800.0 0.0 0.0 0.0 0.0 0.0 0.0 0.0 0.0 0.0 0.0 0.0 0.0 0.0 0.0 0.0 0.0 Sub-total 22,790.0 22,790.0 22,790.0 22,790.0 22,790.0 22,790.0 22,790.0 22,790.0
4) Machinery- Land preparation (ha) 13,400.0 1.0 13,400.0 0.0 0.0 0.0 0.0 0.0 0.0 0.0 0.0 0.0 0.0 0.0 0.0 0.1 893.3- Irrigation by pump (ha) 23,600.0 1.0 23,600.0 1.0 23,600.0 1.0 23,600.0 1.0 23,600.0 1.0 23,600.0 1.0 23,600.0 1.0 23,600.0 1.0 23,600.0- Transport produce per ton (ton) 380.0 0.0 0.0 0.0 0.0 0.0 0.0 4.0 1,520.0 8.0 3,040.0 16.8 6,384.0 16.8 6,384.0 12.0 4,560.0 Sub-total 37,000.0 23,600.0 23,600.0 25,120.0 26,640.0 29,984.0 29,984.0 29,053.3
5) Human labor- Hired (prn/day) 740.0 88.0 65,120.0 39.0 28,860.0 39.0 28,860.0 39.0 28,860.0 43.0 31,820.0 43.0 31,820.0 43.0 31,820.0 45.2 33,448.0- Family (prn/day) 0.0 139.0 0.0 60.0 0.0 60.0 0.0 60.0 0.0 68.0 0.0 68.0 0.0 68.0 0.0 71.1 0.0 Sub-total 227.0 65,120.0 99.0 28,860.0 99.0 28,860.0 99.0 28,860.0 111.0 31,820.0 111.0 31,820.0 111.0 31,820.0 116.3 33,448.0
6) Support- Poles and wires (ha) 70,200.0 0.0 0.0 0.0 0.0 0.0 0.0 0.0 0.0 0.0 0.0 0.0 0.0 0.0 0.0 0.0 0.0
7) Miscellaneous (5%) 15,611.4 10,084.9 10,244.8 10,479.4 10,865.9 11,191.7 11,191.7 11,280.2
Total Cost- Including famliy labour 430,698.6 256,182.9 259,540.8 264,467.4 278,503.9 285,345.7 285,345.7 289,523.4- Excluding family labour 327,838.6 211,782.9 215,140.8 220,067.4 228,183.9 235,025.7 235,025.7 236,884.7
C. Net Returen- Including famliy labour -430,698.6 -256,182.9 -259,540.8 42,732.6 335,896.1 1,004,894.3 1,004,894.3 632,076.6- Excluding family labour -327,838.6 -211,782.9 -215,140.8 87,132.6 386,216.1 1,055,214.3 1,055,214.3 684,715.3
Source: Estimated by JICA Survey Team based on data from DOA

The Preparatory Survey on the P
roject for Improvem
ent of Agricultural P
roduction and Productivity
in Dry Zone A
reas in Dem
ocratic Socialist Republic of Sri Lanka
Final R
eport
T 4-13
Table A
4.5 C
rop Budget per H
ectare for Fruits under With-project C
ondition in Financial Prices (6/6)
(6) LimeLime: 1st Year Lime: 2nd Year Lime: 3rd Year Lime: 4th Year Lime: 5th Year Lime: 6th Year Lime: 7-15th Yr Ave. Lime: 15-Yr Ave.
Unit UnitPrice Amount Value Amount Value Amount Value Amount Value Amount Value Amount Value Amount Value Amount Value(Rs) (Rs) (Rs) (Rs) (Rs) (Rs) (Rs) (Rs) (Rs)
A. Gross IncomeYield (kg) 60.0 0.0 0.0 0.0 0.0 5,000.0 300,000.0 8,000.0 480,000.0 12,000.0 720,000.0 18,500.0 1,110,000.0 33,500.0 2,010,000.0 23,000.0 1,380,000.0
B. Production Cost1) Seedling (kg) 182.3 700.0 127,610.0 0.0 0.0 0.0 0.0 0.0 0.0 0.0 0.0 0.0 0.0 0.0 0.0 46.7 8,507.32) Fertilizers
-Urea (kg) 26.0 147.0 3,822.0 182.3 4,739.3 230.8 6,000.5 279.3 7,261.8 321.9 8,370.2 310.0 8,060.0 310.0 8,060.0 284.1 7,386.3- TSP (kg) 26.0 161.0 4,186.0 199.6 5,190.6 252.8 6,572.0 252.8 6,572.0 252.8 6,572.0 340.0 8,840.0 340.0 8,840.0 301.3 7,832.8- MOP (kg) 26.0 43.0 1,118.0 53.3 1,386.3 67.5 1,755.3 67.5 1,755.3 67.5 1,755.3 90.0 2,340.0 90.0 2,340.0 79.9 2,078.0- Compost (ton) 20,000.0 11.0 220,000.0 11.0 220,000.0 11.0 220,000.0 11.0 220,000.0 11.0 220,000.0 11.0 220,000.0 11.0 220,000.0 11.0 220,000.0- Others (LS) 0.0 0.0 0.0 0.0 0.0 0.0 0.0 0.0 0.0 0.0 0.0 0.0 0.0 0.0 0.0 0.0 Sub-total 229,126.0 231,316.2 234,327.8 235,589.1 236,697.5 239,240.0 239,240.0 237,297.1
3) Agro-chemicals- Herbicide (ha) 12,150.0 1.0 12,150.0 1.0 12,150.0 1.0 12,150.0 1.0 12,150.0 1.0 12,150.0 1.0 12,150.0 1.0 12,150.0 1.0 12,150.0- Pesticide (ha) 10,640.0 1.0 10,640.0 1.0 10,640.0 1.0 10,640.0 1.0 10,640.0 1.0 10,640.0 1.0 10,640.0 1.0 10,640.0 1.0 10,640.0- Hormone (ha) 3,800.0 0.0 0.0 0.0 0.0 0.0 0.0 0.0 0.0 0.0 0.0 0.0 0.0 0.0 0.0 0.0 0.0 Sub-total 22,790.0 22,790.0 22,790.0 22,790.0 22,790.0 22,790.0 22,790.0 22,790.0
4) Machinery- Land preparation (ha) 13,400.0 1.0 13,400.0 0.0 0.0 0.0 0.0 0.0 0.0 0.0 0.0 0.0 0.0 0.0 0.0 0.1 893.3- Irrigation by pump (ha) 23,600.0 1.0 23,600.0 1.0 23,600.0 1.0 23,600.0 1.0 23,600.0 1.0 23,600.0 1.0 23,600.0 1.0 23,600.0 1.0 23,600.0- Transport produce per ton (ton) 380.0 0.0 0.0 0.0 0.0 5.0 1,900.0 8.0 3,040.0 12.0 4,560.0 18.5 7,030.0 33.5 12,730.0 23.0 8,740.0 Sub-total 37,000.0 23,600.0 25,500.0 26,640.0 28,160.0 30,630.0 36,330.0 33,233.3
5) Human labor- Hired (prn/day) 740.0 90.0 66,600.0 34.0 25,160.0 46.0 34,040.0 54.0 39,960.0 62.0 45,880.0 70.0 51,800.0 70.0 51,800.0 65.7 48,642.7- Family (prn/day) 0.0 142.0 0.0 53.0 0.0 73.0 0.0 85.0 0.0 97.0 0.0 109.0 0.0 109.0 0.0 102.7 0.0 Sub-total 232.0 66,600.0 87.0 25,160.0 119.0 34,040.0 139.0 39,960.0 159.0 45,880.0 179.0 51,800.0 179.0 51,800.0 168.4 48,642.7
6) Support- Poles and wires (ha) 70,200.0 0.0 0.0 0.0 0.0 0.0 0.0 0.0 0.0 0.0 0.0 0.0 0.0 0.0 0.0 0.0 0.0
7) Miscellaneous (5%) 24,156.3 15,143.3 15,832.9 16,249.0 16,676.4 17,223.0 17,508.0 17,523.5
Total Cost- Including famliy labour 612,362.3 357,229.6 386,510.7 404,128.0 421,983.8 442,343.0 448,328.0 443,967.3- Excluding family labour 507,282.3 318,009.6 332,490.7 341,228.0 350,203.8 361,683.0 367,668.0 367,994.0
C. Net Returen- Including famliy labour -612,362.3 -357,229.6 -86,510.7 75,872.0 298,016.2 667,657.0 1,561,672.0 936,032.7- Excluding family labour -507,282.3 -318,009.6 -32,490.7 138,772.0 369,796.2 748,317.0 1,642,332.0 1,012,006.0
Source: Estimated by JICA Survey Team based on data from DOA
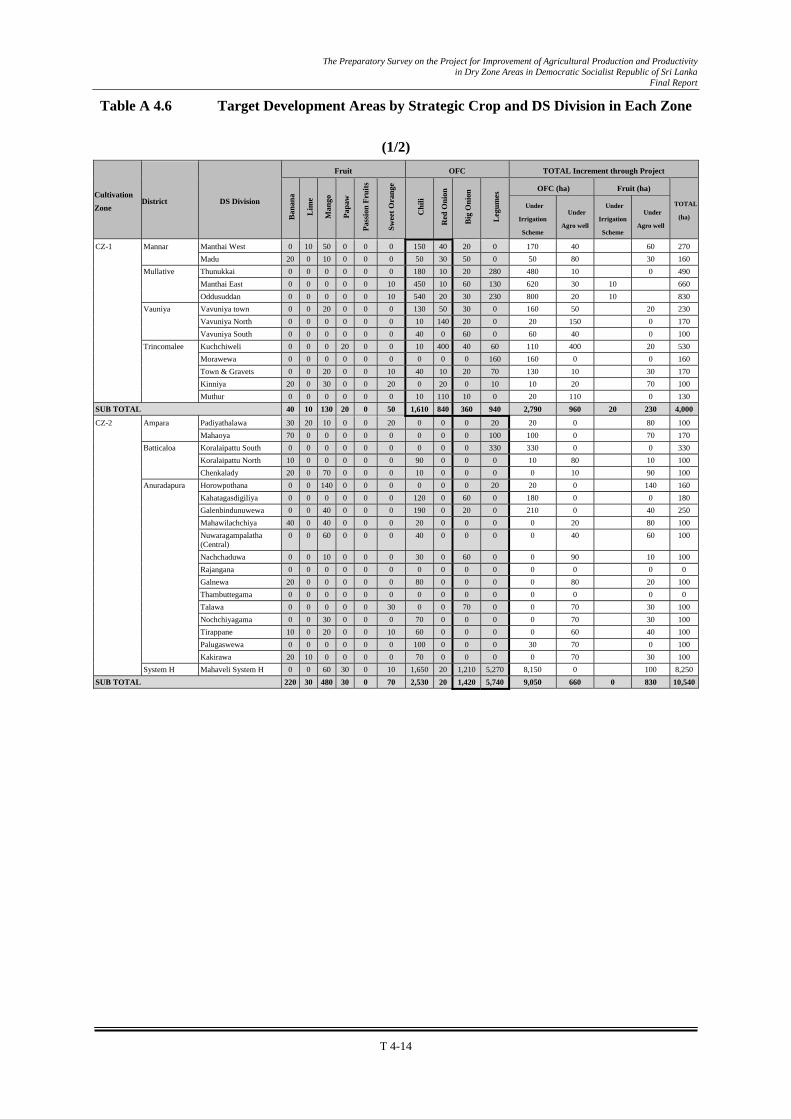
The Preparatory Survey on the Project for Improvement of Agricultural Production and Productivity in Dry Zone Areas in Democratic Socialist Republic of Sri Lanka
Final Report
T 4-14
Table A 4.6 Target Development Areas by Strategic Crop and DS Division in Each Zone
(1/2)
Cultivation
Zone District DS Division
Fruit OFC TOTAL Increment through Project
Ban
ana
Lim
e
Man
go
Pap
aw
Pas
sion
Fru
its
Sw
eet O
rang
e
Chi
li
Red
Oni
on
Big
Oni
on
Leg
umes
OFC (ha) Fruit (ha)
TOTAL
(ha)
Under
Irrigation
Scheme
Under
Agro well
Under
Irrigation
Scheme
Under
Agro well
CZ-1 Mannar Manthai West 0 10 50 0 0 0 150 40 20 0 170 40 60 270 Madu 20 0 10 0 0 0 50 30 50 0 50 80 30 160 Mullative Thunukkai 0 0 0 0 0 0 180 10 20 280 480 10 0 490 Manthai East 0 0 0 0 0 10 450 10 60 130 620 30 10 660 Oddusuddan 0 0 0 0 0 10 540 20 30 230 800 20 10 830 Vauniya Vavuniya town 0 0 20 0 0 0 130 50 30 0 160 50 20 230 Vavuniya North 0 0 0 0 0 0 10 140 20 0 20 150 0 170 Vavuniya South 0 0 0 0 0 0 40 0 60 0 60 40 0 100 Trincomalee Kuchchiweli 0 0 0 20 0 0 10 400 40 60 110 400 20 530 Morawewa 0 0 0 0 0 0 0 0 0 160 160 0 0 160 Town & Gravets 0 0 20 0 0 10 40 10 20 70 130 10 30 170 Kinniya 20 0 30 0 0 20 0 20 0 10 10 20 70 100 Muthur 0 0 0 0 0 0 10 110 10 0 20 110 0 130 SUB TOTAL 40 10 130 20 0 50 1,610 840 360 940 2,790 960 20 230 4,000
CZ-2 Ampara Padiyathalawa 30 20 10 0 0 20 0 0 0 20 20 0 80 100 Mahaoya 70 0 0 0 0 0 0 0 0 100 100 0 70 170 Batticaloa Koralaipattu South 0 0 0 0 0 0 0 0 0 330 330 0 0 330 Koralaipattu North 10 0 0 0 0 0 90 0 0 0 10 80 10 100 Chenkalady 20 0 70 0 0 0 10 0 0 0 0 10 90 100 Anuradapura Horowpothana 0 0 140 0 0 0 0 0 0 20 20 0 140 160 Kahatagasdigiliya 0 0 0 0 0 0 120 0 60 0 180 0 0 180 Galenbindunuwewa 0 0 40 0 0 0 190 0 20 0 210 0 40 250 Mahawilachchiya 40 0 40 0 0 0 20 0 0 0 0 20 80 100 Nuwaragampalatha
(Central) 0 0 60 0 0 0 40 0 0 0 0 40 60 100
Nachchaduwa 0 0 10 0 0 0 30 0 60 0 0 90 10 100 Rajangana 0 0 0 0 0 0 0 0 0 0 0 0 0 0 Galnewa 20 0 0 0 0 0 80 0 0 0 0 80 20 100 Thambuttegama 0 0 0 0 0 0 0 0 0 0 0 0 0 0 Talawa 0 0 0 0 0 30 0 0 70 0 0 70 30 100 Nochchiyagama 0 0 30 0 0 0 70 0 0 0 0 70 30 100 Tirappane 10 0 20 0 0 10 60 0 0 0 0 60 40 100 Palugaswewa 0 0 0 0 0 0 100 0 0 0 30 70 0 100 Kakirawa 20 10 0 0 0 0 70 0 0 0 0 70 30 100 System H Mahaveli System H 0 0 60 30 0 10 1,650 20 1,210 5,270 8,150 0 100 8,250 SUB TOTAL 220 30 480 30 0 70 2,530 20 1,420 5,740 9,050 660 0 830 10,540

The Preparatory Survey on the Project for Improvement of Agricultural Production and Productivity in Dry Zone Areas in Democratic Socialist Republic of Sri Lanka
Final Report
T 4-15
Table A 4.6 Target Development Areas by Strategic Crop and DS Division in Each Zone ( 2/ 2 )
Cultivation
Zone District DS Division
Fruit OFC TOTAL Increment through Project
Ban
ana
Lim
e
Man
go
Pap
aw
Pas
sion
Fru
its
Sw
eet O
rang
e
Chi
li
Red
Oni
on
Big
Oni
on
Leg
umes
OFC (ha) Fruit (ha)
TOTAL
(ha)
Under
Irrigation
Scheme
Under
Agro well
Under
Irrigation
Scheme
Under
Agro well
CZ-3 Kurunegala Galgamuwa 10 30 50 0 0 10 0 0 0 0 0 0 100 100 Giribawa 0 0 30 10 0 10 10 0 0 40 50 0 50 100 Ehatuwewa 0 0 0 0 0 0 0 0 0 0 0 0 0 0 Ambanpola 0 40 50 40 0 10 0 0 0 0 0 0 140 140 Nikaweratiya 10 0 0 40 0 30 20 0 0 0 0 20 80 100 Maho 10 0 50 50 0 10 0 0 30 0 0 30 120 150 Kotawehera 10 0 40 20 0 30 40 0 0 0 40 0 100 140 Polpithigama 10 0 90 150 0 20 0 10 50 0 0 60 270 330 Puttalam Karuwalagaswewa 0 50 130 50 0 50 40 10 0 330 380 0 280 660 Nawagattegama 0 0 60 0 0 20 10 0 10 0 10 10 80 100 Anamaduwa 0 30 40 20 0 10 290 0 50 180 520 0 100 620 Mahakumbukkadawala 0 0 0 0 0 0 100 0 0 0 0 100 0 100 SUB TOTAL 50 150 540 380 0 200 510 20 140 550 1,000 220 280 1,040 2,540
CZ-4 Badulla Haliela 30 0 10 0 0 40 0 0 80 0 0 80 80 160 Welimada 0 0 0 0 20 20 120 10 200 0 90 240 40 370 Meegahakiwla 0 0 20 0 0 0 0 0 80 0 0 80 20 100 Maneragala Badalkumbura 30 10 0 0 0 30 40 0 0 90 130 0 70 200 Madulla 0 0 10 20 10 50 70 0 0 0 0 70 90 160 Bibila 0 0 0 0 0 110 30 0 0 0 0 30 110 140 Buttala 30 0 0 0 10 20 310 0 0 0 10 300 60 370 Wellawaya 0 0 40 0 0 30 30 0 0 0 30 0 70 100 Monaragala 0 0 100 0 0 0 0 0 0 0 0 0 100 100 Siyambalanduwa 0 0 70 0 0 0 30 0 0 0 10 20 70 100 SUB TOTAL 90 10 250 20 40 300 630 10 360 90 270 820 0 710 1,800
TOTAL 400 200 1,400 450 40 620 5,280 890 2,280 7,320 13,110 2,660 300 2,810 18,880

The Preparatory Survey on the P
roject for Improvem
ent of Agricultural P
roduction and Productivity
in Dry Zone A
reas in Dem
ocratic Socialist Republic of Sri Lanka
Final R
eport
T 4-16
Table A
4.7 O
verall Problem A
nalysis (1/3)

The Preparatory Survey on the P
roject for Improvem
ent of Agricultural P
roduction and Productivity
in Dry Zone A
reas in Dem
ocratic Socialist Republic of Sri Lanka
Final R
eport
T 4-17
Table A
4.7 O
verall Problem A
nalysis (2/3)

The Preparatory Survey on the P
roject for Improvem
ent of Agricultural P
roduction and Productivity
in Dry Zone A
reas in Dem
ocratic Socialist Republic of Sri Lanka
Final R
eport
T 4-18
Table A
4.7 O
verall Problem A
nalysis (3/3)

The Preparatory Survey on the Project for Improvement of Agricultural Production and Productivity in Dry Zone Areas in Democratic Socialist Republic of Sri Lanka
Final Report
T 4-19
Table A 4.8 Prioritized Approaches and Activities - Malwanegama (North-Central)
Priority / Approach Activities
1. Marketing Approach
Make products attractive with cleanliness and presentation Ensure the quality standards of the products Produce appropriate products to meet with the requirements of the relevant markets Usage of attractive and safer packing Protect and maintain the natural and authentic standards of the products Increase the purchasing and marketing centers Introduce a clear and fair price tags to the products Supply products according to the needs of the respective areas Come up with preservation systems to protect the freshness of the products Establish an efficient transportation system Obtain consultation servicers on competing in the market mechanism Adopt value added process Engage Farmers Organizations in marketing
2. Water and Irrigation Management Approach
Program to identify the water requirement for different/each crops Program to obtain water in the needy time Minimize the wastages of water Maximize the usage of water Usage of drip irrigation systems Usage of solar power for drip irrigation Maximize the usage of agro wells Maximize the usage of rain water Maintain/repair the irrigation canals with concrete in time to minimize the wastages Train and make the farmers aware of the proper and efficient usage of water
3. Financial and Credit Approach
Establish credit scheme through Farmers Organizations Program for supplying quality seeds and fertilizer at low prices Program to provide credit at low interest rates Establish a methodology to obtain credit facilities from financial institutions Organize small groups to obtain contributions through free labour
4. Training Approach
Obtain advice on the diseases of the crops from the extension officers Obtain information on the markets and make farmers/ Farmers Organizations aware of them Finding proper trainers to conduct training programs Organization training programs on;
- Land preparations - Selecting seeds according to the respective soil conditions - Selection and usage of chemicals according to the respective seeds - Identification of the quality and standards seeds - Watering needs and methods according to the needs of the various crops - Modern technology and their appropriate usages - Attitude changes of the farmers in favor of involvement in OFCs
5. Organization and Planning Approach
Establish an apex organization of the OFCs farmers Identification of the needs / quantities/ Facilities such as finance and knowledge and skills with
regard to the OFC cultivation Coordination with other institutions Enter in to MOUs with relevant government/ private institutions Preparation of cultivation plans Adopt proper resources management Usage of modern and appropriate technology Improve post harvest methods Planning marketing programs
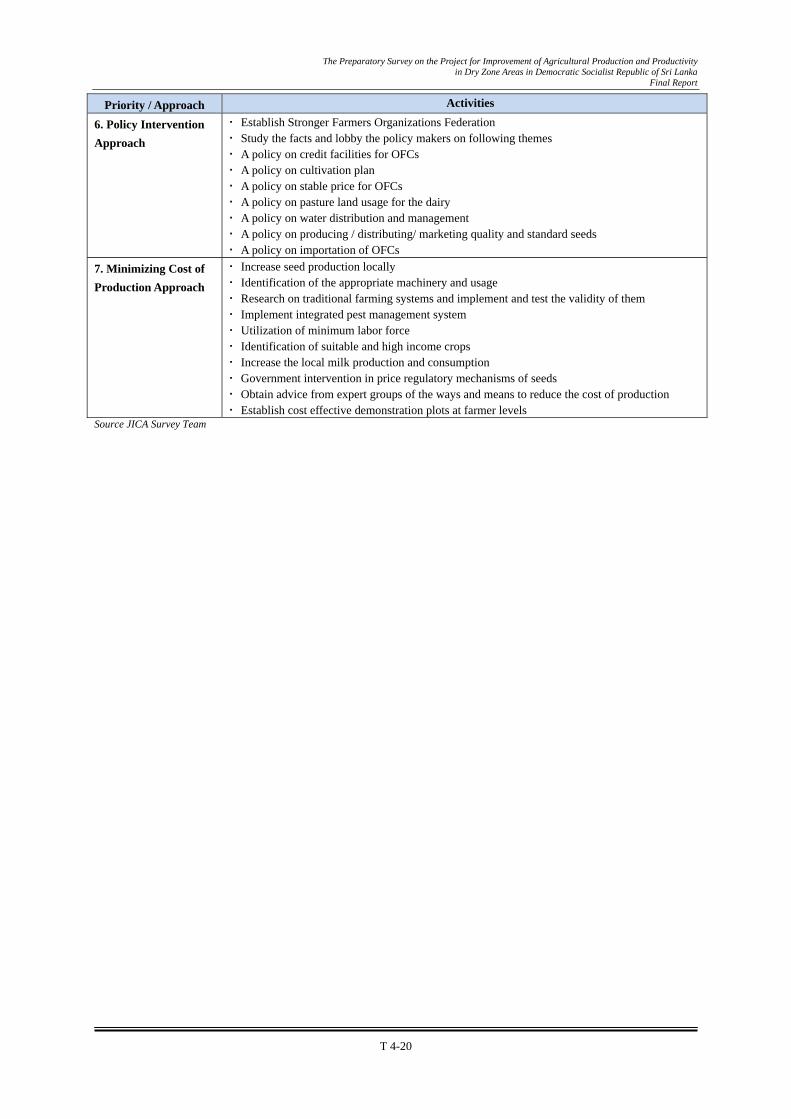
The Preparatory Survey on the Project for Improvement of Agricultural Production and Productivity in Dry Zone Areas in Democratic Socialist Republic of Sri Lanka
Final Report
T 4-20
Priority / Approach Activities
6. Policy Intervention Approach
Establish Stronger Farmers Organizations Federation Study the facts and lobby the policy makers on following themes A policy on credit facilities for OFCs A policy on cultivation plan A policy on stable price for OFCs A policy on pasture land usage for the dairy A policy on water distribution and management A policy on producing / distributing/ marketing quality and standard seeds A policy on importation of OFCs
7. Minimizing Cost of Production Approach
Increase seed production locally Identification of the appropriate machinery and usage Research on traditional farming systems and implement and test the validity of them Implement integrated pest management system Utilization of minimum labor force Identification of suitable and high income crops Increase the local milk production and consumption Government intervention in price regulatory mechanisms of seeds Obtain advice from expert groups of the ways and means to reduce the cost of production Establish cost effective demonstration plots at farmer levels
Source JICA Survey Team

The Preparatory Survey on the Project for Improvement of Agricultural Production and Productivity in Dry Zone Areas in Democratic Socialist Republic of Sri Lanka
Final Report
T 4-21
Table A 4.9 Prioritized Approaches and Activities Thiriyay (Eastern)
Priority / Approach Activities
1. Water Management Approach
Rehabilitation of dams Increasing capacity of the tanks (wewa) Stopping salty water coming to fresh water sources Constructing wells in the villages to supply water for OFC cultivations Introduce modern irrigation systems (drip irrigation) to the farmers.
2. Natural Resource Management Approach
Obtaining the services of the forest gourds continually. Get the displaced people to clear their lands and make the cultivable Obtain government support to establish electric fence to minimize the wild elephant
attacks. Obtain land and the deeds for the farmers engage in OFC cultivation Establish separate area for the wild animals (sanctuary)
3. Marketing Approach Increase the volume of the production of OFCs to attract traders. Establish a guaranteed minimum price for the OFCs Establish market places convenient for the farmers and for the traders. Obtain the support from the NGOs to construct market places Obtaining the inputs and Training from the experts to increase the quality of the products,
technical knowhow for preservative methods and packing. Workout methods to prevent the farmers from the excessive exploitation by the traders.
4. Extension Services/ Expert Inputs Approach
Identify the problems and the needs of the OFC farmers with the assistance of the Agriculture department and finding the solutions for them
Obtain the support from the NGOs to solve the identified problems and needs of the OFC farmers.
Obtain the continuers support from the Veterinary Department for the dairy farmers Obtain the continuers support from the Forest Department to minimize the damages from
the wild animals. Obtain the support from the Education Department to motivate children of the OFC
farmers. 5. Financial and Credit Approach
Make programs to obtain credit facilities for the OFC farmers from the State Banks. Obtain the support of the NGOs to get financial/credit facilities for OFCs Obtain the support of the village level CBOs to get credit facilities for the OFC farmers. Program to increase income and savings of the OFC farmers through improving the
quality of their products. Purchasing modern equipments from the government institutions to improve the products
of the OFCs 6. Training and Awareness Building Approach
Arranging exposure programs for the OFC farmers to share their experiences and to obtain the experiences and knowledge
Obtain support from the NGOs for the training and awareness programs for the OFC farmers on the relevant themes.
Develop village level OFC farmers as trainers on relevant subjects Make an action plan to determine as how to use these trained farmers services to train
other OFC farmers. Source JICA Survey Team
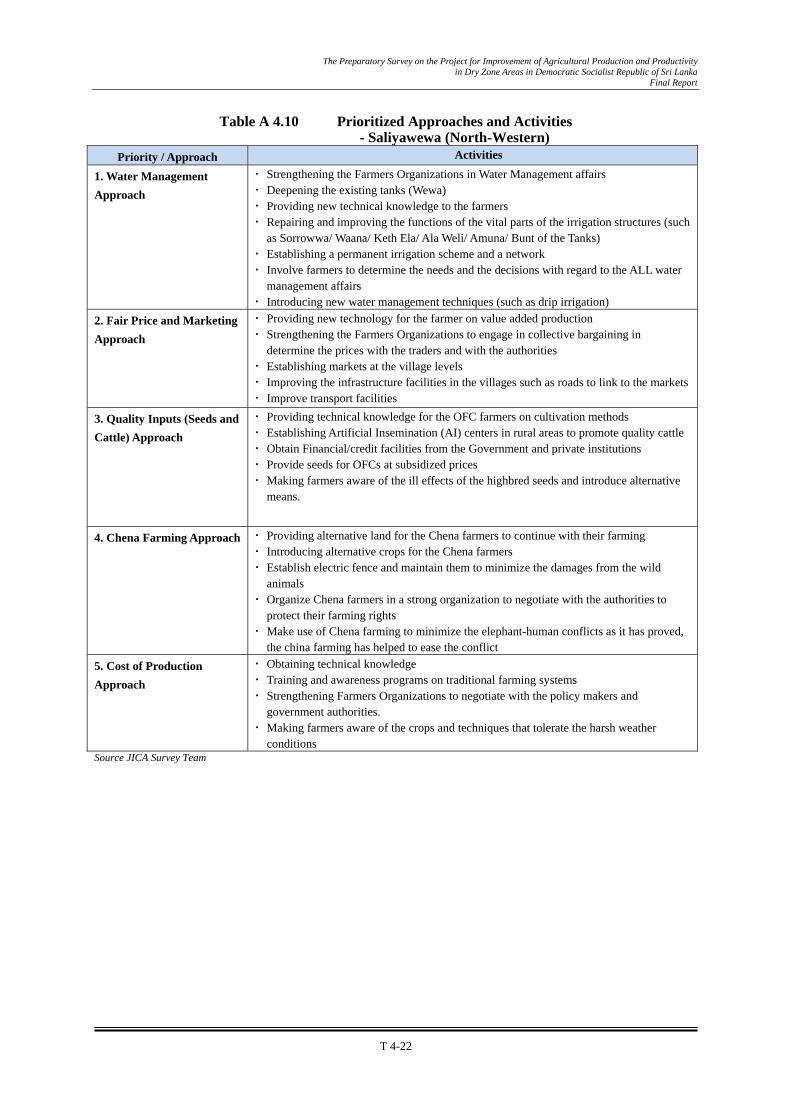
The Preparatory Survey on the Project for Improvement of Agricultural Production and Productivity in Dry Zone Areas in Democratic Socialist Republic of Sri Lanka
Final Report
T 4-22
Table A 4.10 Prioritized Approaches and Activities - Saliyawewa (North-Western)
Priority / Approach Activities
1. Water Management Approach
Strengthening the Farmers Organizations in Water Management affairs Deepening the existing tanks (Wewa) Providing new technical knowledge to the farmers Repairing and improving the functions of the vital parts of the irrigation structures (such
as Sorrowwa/ Waana/ Keth Ela/ Ala Weli/ Amuna/ Bunt of the Tanks) Establishing a permanent irrigation scheme and a network Involve farmers to determine the needs and the decisions with regard to the ALL water
management affairs Introducing new water management techniques (such as drip irrigation)
2. Fair Price and Marketing Approach
Providing new technology for the farmer on value added production Strengthening the Farmers Organizations to engage in collective bargaining in
determine the prices with the traders and with the authorities Establishing markets at the village levels Improving the infrastructure facilities in the villages such as roads to link to the markets Improve transport facilities
3. Quality Inputs (Seeds and Cattle) Approach
Providing technical knowledge for the OFC farmers on cultivation methods Establishing Artificial Insemination (AI) centers in rural areas to promote quality cattle Obtain Financial/credit facilities from the Government and private institutions Provide seeds for OFCs at subsidized prices Making farmers aware of the ill effects of the highbred seeds and introduce alternative
means.
4. Chena Farming Approach
Providing alternative land for the Chena farmers to continue with their farming Introducing alternative crops for the Chena farmers Establish electric fence and maintain them to minimize the damages from the wild
animals Organize Chena farmers in a strong organization to negotiate with the authorities to
protect their farming rights Make use of Chena farming to minimize the elephant-human conflicts as it has proved,
the china farming has helped to ease the conflict 5. Cost of Production Approach
Obtaining technical knowledge Training and awareness programs on traditional farming systems Strengthening Farmers Organizations to negotiate with the policy makers and
government authorities. Making farmers aware of the crops and techniques that tolerate the harsh weather
conditions Source JICA Survey Team

The Preparatory Survey on the Project for Improvement of Agricultural Production and Productivity in Dry Zone Areas in Democratic Socialist Republic of Sri Lanka
Final Report
T 4-23
Table A 4.11 Prioritized Approaches and Activities - Thenagallanda (Uva)
Priority / Approach Activities 1. Water Management Approach
1. Identifying water catchment areas and protect them - Make the Irrigation Department aware of these areas through Farmers Organizations
2. Establishment of agro wells - Identify the target population of these wells and inform relevant authorities through Farmers Organizations - Obtain government, NGO and the farmer contributions
3. Draw the attention of the authorities - Discuss the issues at the Farmers Organization - Inform the authorities about the problems/issues through the village level Agriculture Officers - Discuss with the authorities about the problems/issues collectively as a group
4. Organize the farmers - Make farmers aware of the issues/ problems through Farmers Organizations - Get the consent of the farmers for the opinion of the Farmers Organization - Pressurize the relevant authorities to obtain the rights of the farmers
2. Marketing and Fair Price Approach
Make farmers aware of the crops suitable for the different weather and geographical conditions through learned agricultural organizations
Organizing the Farmers Organizations, formulate a program and stand against the massive importation of the OFCs Establishing storage facilities for the farmers to store their products through the help of government and other
NGOs Prepare a cultivation plan, analyzing the needs and disseminate these information among farmers Obtain expert advice and information and make farmers aware on proper cultivation methods, marketing techniques
and how to increase the quality of the products 3. Intervention of the State and Farmers Organization Approach
Strengthening the Farmers Organizations Making the farmers aware of the issues Identify the problems and channel them to the relevant government and other organizations Obtain all the services and needs (seeds, pesticides ,fertilizer) from the Agrarian Services Department and
distribute among farmers Unite all the Farmers Organizations and pressurize the government to limit the importation of OFCs Pressurize the government to minimize the ill effects of the middle men in trading
4. Resource Management Approach
Establishing local seeds farms Preparing program by the government to supply cattle suitable for the respective weather and geographical
conditions Conducting training programs on proper dairy farming Program for supplying agricultural equipments to the farmers at subsidized price or without charge Preparing a plan by the government in consultation with the farmers Organization in proper utilization of the land
and reservation pasture land 5. Training, Awareness Building and Knowledge Approach
Organize training Programs utilizing the knowledge and experiences of the Agricultural Officers and experienced farmers on
Water management Animal husbandry Crop New techniques Training of Trainers at the village levels
6. Cost of Production Approach Making farmers aware giving training on of the low cost Proper utilization of labor Minimization of machineries on traditional farming methods Utilization of cattle Increase the production of local seeds Utilization of compost fertilizer Utilization of locally made pesticides Traditional ‘kem’ systems Reduce the usage of foreign seeds and fertilizer
Source JICA Survey Team

The Preparatory Survey on the Project for Improvement of Agricultural Production and Productivity in Dry Zone Areas in Democratic Socialist Republic of Sri Lanka
Final Report
T 4-24
Table A 4.12 Prioritized Approaches and Activities - Periyapandivirichchan (Northern)
Priority / Approach Activities
1. Water Management Approach
Deepen the existing wells Construct new wells Repair/rehabilitate abandoned tanks Link mother tank to the sub tanks
2. Market and Marketing Approach
Coordinate with farmers and collect their products Identify main market for the producers to sell their products at high prices Construct collecting centers for milk and OFCs Linkage these centers with markets Introduce crops that suit to the respective climatic conditions to ensure continuous supply Bring marketing/ purchasing companies from outside
3. Training, Knowledge, Motivation Approach
Start seminars/ discussions among village people on the subject matters Train youth at village levels in agriculture and dairy Make youth aware of new crops and provide inputs such as travel costs to attain training Organize exposure visits for farmers to get new knowledge/ experience in OFC
cultivation and dairy 4. Economic Development of Re-settlers Approach
Get support from Government and NGOs Introduce self employment and home gardening Provide loans through banks and CBOs Introduce crops with low investments and high returns Provide distress loans through government and NGOs
5. Land Approach
Identify available and underutilized land with the RDS and Farmers Organizations and inform the authorities
Inform the government offices of the needs of the land for the farmers Organize tests through the government institutions to verify the suitability of the soil for
cultivation Provide subsidies to develop the land to a cultivable status Identify grass land and reserve them for cattle rearing
6. Service Provision Approach
Identify and appeal to the Agriculture Officers Organize Training of Trainers (TOT) programs for the leaders of the Farmers
Organizations Organize Training programs for the other farmers and obtain the service from TOT
participants Prepare a monitoring plan to see whether the training is take place Organize exposure tour for the farmers to see new techniques on farming Introduce value added production techniques for the farmers
7. Inputs Approach Identify profitable crops and introduce to the farmers Establish nurseries to produce quality plants Provide training in cultivation for the farmers
Source JICA Survey Team
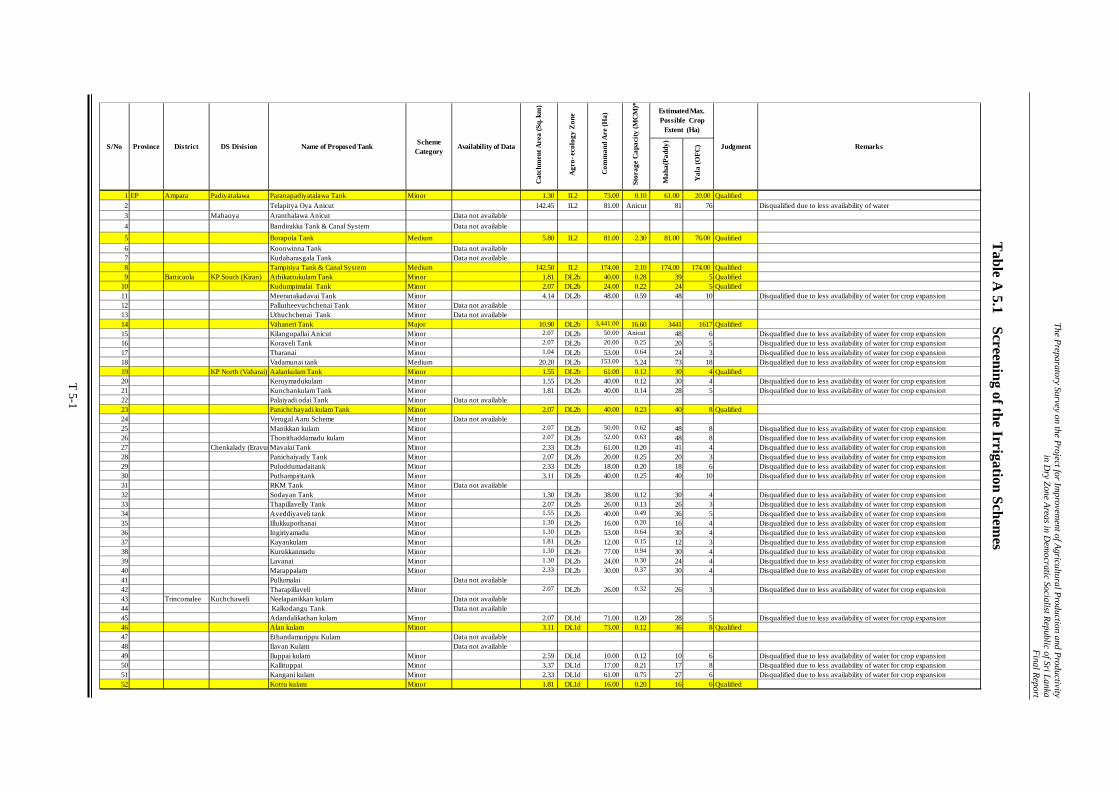
The Preparatory Survey on the P
roject for Improvem
ent of Agricultural P
roduction and Productivity
in Dry Zone A
reas in Dem
ocratic Socialist Republic of Sri Lanka
Final R
eport
T 5-1
Table A
5.1 Screening of the Irrigation Schem
es
Mah
a(Pa
ddy)
Yal
a (O
FC)
1 EP Ampara Padiyatalawa Paranapadiyatalawa Tank Minor 1.30 IL2 73.00 0.10 61.00 20.00 Qualified2 Telapitya Oya Anicut 142.45 IL2 81.00 Anicut 81 76 Disqualified due to less availability of water3 Mahaoya Aranthalawa Anicut Data not available4 Bandirakka Tank & Canal System Data not available5 Borapola Tank Medium 5.80 IL2 81.00 2.30 81.00 76.00 Qualified6 Koonwinna Tank Data not available7 Kudaharasgala Tank Data not available8 Tampitiya Tank & Canal System Medium 142.50 IL2 174.00 2.10 174.00 174.00 Qualified9 Batticaola KP South (Kiran) Athikattukulam Tank Minor 1.81 DL2b 40.00 0.28 39 5 Qualified
10 Kudumpimalai Tank Minor 2.07 DL2b 24.00 0.22 24 5 Qualified11 Meeranakadavai Tank Minor 4.14 DL2b 48.00 0.59 48 10 Disqualified due to less availability of water for crop expansion12 Pallutheevuchchenai Tank Minor Data not available13 Uthuchchenai Tank Minor Data not available14 Vahaneri Tank Major 10.90 DL2b 3,441.00 16.60 3441 1617 Qualified15 Kilangupallai Anicut Minor 2.07 DL2b 50.00 Anicut 48 6 Disqualified due to less availability of water for crop expansion16 Koraveli Tank Minor 2.07 DL2b 20.00 0.25 20 5 Disqualified due to less availability of water for crop expansion17 Tharanai Minor 1.04 DL2b 53.00 0.64 24 3 Disqualified due to less availability of water for crop expansion18 Vadamunai tank Medium 20.20 DL2b 153.00 5.24 73 18 Disqualified due to less availability of water for crop expansion19 KP North (Vaharai) Aalankulam Tank Minor 1.55 DL2b 61.00 0.12 30 4 Qualified20 Keruymadukulam Minor 1.55 DL2b 40.00 0.12 30 4 Disqualified due to less availability of water for crop expansion21 Kunchankulam Tank Minor 1.81 DL2b 40.00 0.14 28 5 Disqualified due to less availability of water for crop expansion22 Palaiyadi odai Tank Minor Data not available23 Panichchayadi kulam Tank Minor 2.07 DL2b 40.00 0.23 40 8 Qualified24 Verugal Aaru Scheme Minor Data not available25 Manikkan kulam Minor 2.07 DL2b 50.00 0.62 48 8 Disqualified due to less availability of water for crop expansion26 Thonithaddamadu kulam Minor 2.07 DL2b 52.00 0.63 48 8 Disqualified due to less availability of water for crop expansion27 Chenkalady (EravurMavalai Tank Minor 2.33 DL2b 61.00 0.20 41 4 Disqualified due to less availability of water for crop expansion28 Panichaiyady Tank Minor 2.07 DL2b 20.00 0.25 20 3 Disqualified due to less availability of water for crop expansion29 Puluddumadaitank Minor 2.33 DL2b 18.00 0.20 18 6 Disqualified due to less availability of water for crop expansion30 Puthampiritank Minor 3.11 DL2b 40.00 0.25 40 10 Disqualified due to less availability of water for crop expansion31 RKM Tank Minor Data not available32 Sodayan Tank Minor 1.30 DL2b 38.00 0.12 30 4 Disqualified due to less availability of water for crop expansion33 Thapillavelly Tank Minor 2.07 DL2b 26.00 0.13 26 3 Disqualified due to less availability of water for crop expansion34 Aveddiyaveli tank Minor 1.55 DL2b 40.00 0.49 36 5 Disqualified due to less availability of water for crop expansion35 Illukkupothanai Minor 1.30 DL2b 16.00 0.20 16 4 Disqualified due to less availability of water for crop expansion36 Ingiriyamadu Minor 1.30 DL2b 53.00 0.64 30 4 Disqualified due to less availability of water for crop expansion37 Kayankulam Minor 1.81 DL2b 12.00 0.15 12 3 Disqualified due to less availability of water for crop expansion38 Kurukkanmadu Minor 1.30 DL2b 77.00 0.94 30 4 Disqualified due to less availability of water for crop expansion39 Lavanai Minor 1.30 DL2b 24.00 0.30 24 4 Disqualified due to less availability of water for crop expansion40 Marappalam Minor 2.33 DL2b 30.00 0.37 30 4 Disqualified due to less availability of water for crop expansion41 Pullumalai Data not available42 Tharapillaveli Minor 2.07 DL2b 26.00 0.32 26 3 Disqualified due to less availability of water for crop expansion43 Trincomalee Kuchchaweli Neelapanikkan kulam Data not available44 Kalkodangu Tank Data not available45 Adandalikathan kulam Minor 2.07 DL1d 71.00 0.20 28 5 Disqualified due to less availability of water for crop expansion46 Alan kulam Minor 3.11 DL1d 73.00 0.12 36 8 Qualified47 Ethandamurippu Kulam Data not available48 Ilavan Kulam Data not available49 Iluppai kulam Minor 2.59 DL1d 10.00 0.12 10 6 Disqualified due to less availability of water for crop expansion50 Kallituppai Minor 3.37 DL1d 17.00 0.21 17 8 Disqualified due to less availability of water for crop expansion51 Kangani kulam Minor 2.33 DL1d 61.00 0.75 27 6 Disqualified due to less availability of water for crop expansion52 Kottu kulam Minor 1.81 DL1d 16.00 0.20 16 6 Qualified
Judgment Remarks
Com
man
d A
re (H
a)
Sto
rage
Cap
acity
(MC
M) *
Estimated Max.Possible Crop
Extent (Ha)
Availability of Data
Cat
chm
ent A
rea
(Sq.
km
)
Agr
o- e
colo
gy Z
one
S/No Province District DS Division Name of Proposed Tank SchemeCategory

The Preparatory Survey on the P
roject for Improvem
ent of Agricultural P
roduction and Productivity
in Dry Zone A
reas in Dem
ocratic Socialist Republic of Sri Lanka
Final R
eport
T 5-2
Table A
5.1 Screening of the Irrigation Schem
es
Mah
a(Pa
ddy)
Yal
a (O
FC)
53 Maduwa Kulam Data not available54 Myilan kulam & Channel system Minor 2.33 DL1d 32.00 0.39 27 6 Disqualified due to less availability of water for crop expansion55 Nayadicha Murippu Tank Minor 3.11 DL1d 44.00 0.54 24 5 Disqualified due to less availability of water for crop expansion56 Pallechchenai Minor 2.85 DL1d 55.00 0.67 33 7 Disqualified due to less availability of water for crop expansion57 Parisanoddai kulam Minor 2.07 DL1d 24.00 0.30 24 5 Disqualified due to less availability of water for crop expansion58 Periya Elumpurukki Kulam Data not available59 Periya Kulam Data not available60 Periyamathuran kulam Minor 2.59 DL1d 61.00 0.74 30 6 Qualified61 Pokkan kulam Data not available62 Salanamadu Tank Data not available63 Samalan kulam Minor 2.85 DL1d 44.00 0.53 39 9 Disqualified due to less availability of water for crop expansion64 Samara kulam Minor 1.55 DL1d 14.00 0.17 14 4 Disqualified due to less availability of water for crop expansion65 Saththannadu kulam Minor 4.66 DL1d 50.00 0.62 50 12 Disqualified due to less availability of water for crop expansion66 Savi Aru Anicut -01 Data not available67 Savi Aru Anicut -02 Data not available68 Sinna Elumpurukki Tank Minor 2.07 DL1d 32.00 0.39 24 5 Disqualified due to less availability of water for crop expansion69 Sinnadan kulam Minor 1.04 DL1d 26.00 0.32 14 3 Disqualified due to less availability of water for crop expansion70 Sinnamathuran kulam Minor 2.07 DL1d 14.00 0.17 14 5 Disqualified due to less availability of water for crop expansion71 Vadali kulam Minor 1.04 DL1d 15.00 0.18 14 3 Disqualified due to less availability of water for crop expansion72 Vannathi kulam & Channel system Minor 2.33 DL1d 44.00 0.54 27 6 Disqualified due to less availability of water for crop expansion73 Velang kulam Minor 0.78 DL1d 15.00 0.19 11 2 Disqualified due to less availability of water for crop expansion74 Vilan Kulam Minor 1.04 DL1d 14.00 0.17 14 3 Disqualified due to less availability of water for crop expansion75 Yan oya scheme - Anicut Major 1,497.00 DL1d 689.00 Anicut 375 94 Qualified76 Morawewa Anicut in Kambakuttawewa Data not available77 Ethabendiwewa Medium 15.54 DL1d 86.00 1.20 96 73 Qualified78 Ilanthai kulam Data not available79 Kakkamodai Tank Minor Data not available80 Kithul uthuwa irrigation Scheme Minor 2.59 DL1d 61.00 0.75 40 12 Qualified81 Kutkut Kulam Data not available82 Paliyabandi wewa Minor 3.11 DL1d 40.00 0.49 40 19 Qualified83 Pan madawachiya Tank & Spill Minor 7.00 DL1d 65.00 0.79 65 33 Qualified84 Parayan kulam Data not available85 Rotawewa Minor 4.92 DL1d 79.00 0.97 79 23 Qualified86 Veppan kulam Minor 3.37 DL1d 44.00 0.53 44 16 Qualified87 Mahadivulwewa Major 1,398.60 563.00 20.20 563 484 Qualified88 Navatkulam Minor 7.00 DL1d 19.00 0.23 19 22 Disqualified due to less availability of water for crop expansion89 Nochchi kulam Minor 2.85 DL1d 30.00 0.37 30 13 Disqualified due to less availability of water for crop expansion90 Pankulam Minor 4.14 DL1d 80.00 0.98 65 19 Disqualified due to less availability of water for crop expansion91 Ralapanawewa Minor 2.85 DL1d 57.00 0.69 44 13 Disqualified due to less availability of water for crop expansion92 Thimbiriwewa Minor 2.59 DL1d 19.00 0.23 19 12 Disqualified due to less availability of water for crop expansion93 Namalwatha Tank Minor Data not available Disqualified due to less availability of water for crop expansion94 Town & Gravets Andankulam Medium 12.30 DL2b 183.00 2.00 183 92 Qualified95 Iluppai Kulam Minor 1.30 DL2b 6.00 0.07 6 3 Disqualified due to less availability of water for crop expansion96 Katkat Kulam Minor 2.85 DL2b 68.00 0.83 33 7 Qualified97 Manganai Kulam Minor 20.72 DL2b 53.00 0.64 53 52 Qualified98 Maraierichan Kulam Minor 1.30 DL2b 27.00 0.33 15 3 Disqualified due to less availability of water for crop expansion99 Periya muthaliyar Kulam Minor Data not available
100 Sinna Andankulam Minor 1.04 DL2b 3.00 0.04 3 3 Disqualified due to less availability of water for crop expansion101 Sinna Muthaliyar kulam Minor 2.33 DL2b 29.00 0.36 27 6 Disqualified due to less availability of water for crop expansion102 Siruppitty Minor 2.59 DL2b 42.00 0.52 30 6 Disqualified due to less availability of water for crop expansion103 Velveri kulam Minor 2.07 DL2b 35.00 0.43 24 5 Qualified104 Vilan Kulam Minor 2.85 DL2b 40.00 0.49 33 7 Disqualified due to less availability of water for crop expansion
Judgment RemarksAvailability of Data
Cat
chm
ent A
rea
(Sq.
km
)
Agr
o- e
colo
gy Z
one
Com
man
d A
re (H
a)
Sto
rage
Cap
acity
(MC
M)*
Estimated Max.Possible Crop
Extent (Ha)
S/No Province District DS Division Name of Proposed Tank SchemeCategory
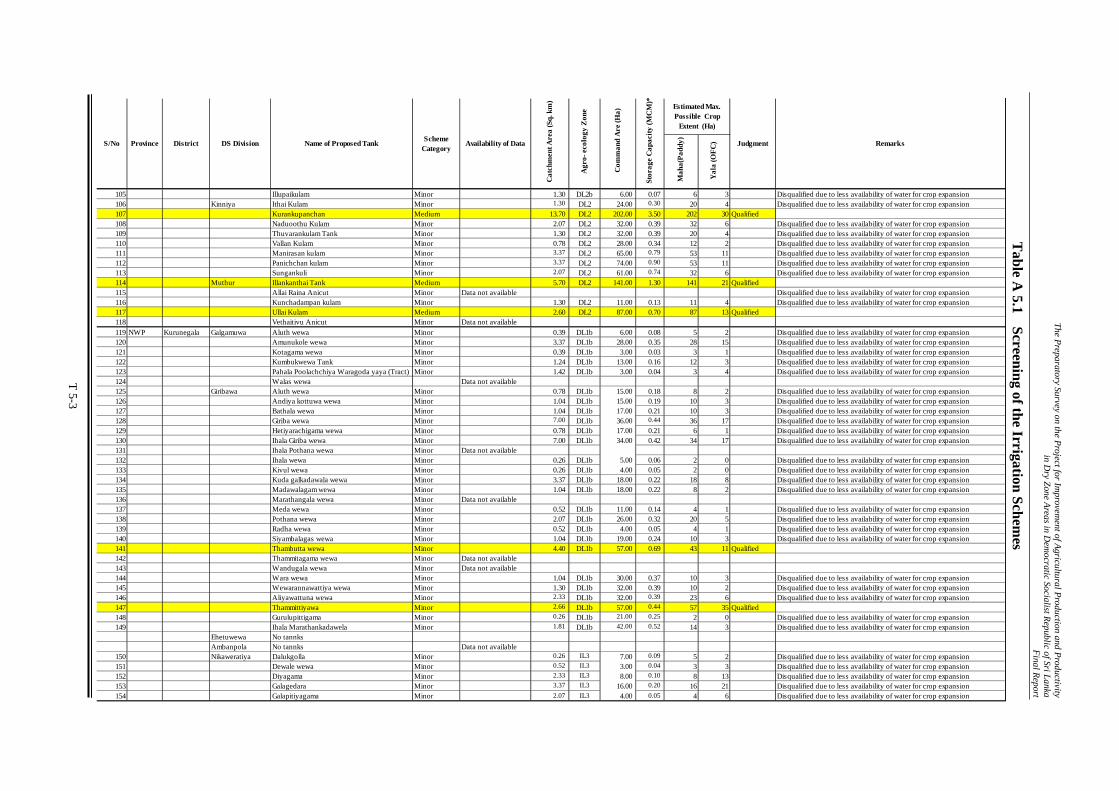
The Preparatory Survey on the P
roject for Improvem
ent of Agricultural P
roduction and Productivity
in Dry Zone A
reas in Dem
ocratic Socialist Republic of Sri Lanka
Final R
eport
T 5-3
Table A
5.1 Screening of the Irrigation Schem
es
Mah
a(Pa
ddy)
Yal
a (O
FC)
105 Illupaikulam Minor 1.30 DL2b 6.00 0.07 6 3 Disqualified due to less availability of water for crop expansion106 Kinniya Ithai Kulam Minor 1.30 DL2 24.00 0.30 20 4 Disqualified due to less availability of water for crop expansion107 Kurankupanchan Medium 13.70 DL2 202.00 3.50 202 30 Qualified108 Naduoothu Kulam Minor 2.07 DL2 32.00 0.39 32 6 Disqualified due to less availability of water for crop expansion109 Thuvarankulam Tank Minor 1.30 DL2 32.00 0.39 20 4 Disqualified due to less availability of water for crop expansion110 Vallan Kulam Minor 0.78 DL2 28.00 0.34 12 2 Disqualified due to less availability of water for crop expansion111 Manirasan kulam Minor 3.37 DL2 65.00 0.79 53 11 Disqualified due to less availability of water for crop expansion112 Panichchan kulam Minor 3.37 DL2 74.00 0.90 53 11 Disqualified due to less availability of water for crop expansion113 Sungankuli Minor 2.07 DL2 61.00 0.74 32 6 Disqualified due to less availability of water for crop expansion114 Muthur Illankanthai Tank Medium 5.70 DL2 141.00 1.30 141 21 Qualified115 Allai Raina Anicut Minor Data not available Disqualified due to less availability of water for crop expansion116 Kunchadampan kulam Minor 1.30 DL2 11.00 0.13 11 4 Disqualified due to less availability of water for crop expansion117 Ullai Kulam Medium 2.60 DL2 87.00 0.70 87 13 Qualified118 Vethaitivu Anicut Minor Data not available119 NWP Kurunegala Galgamuwa Aluth wewa Minor 0.39 DL1b 6.00 0.08 5 2 Disqualified due to less availability of water for crop expansion120 Amunukole wewa Minor 3.37 DL1b 28.00 0.35 28 15 Disqualified due to less availability of water for crop expansion121 Kotagama wewa Minor 0.39 DL1b 3.00 0.03 3 1 Disqualified due to less availability of water for crop expansion122 Kumbukwewa Tank Minor 1.24 DL1b 13.00 0.16 12 3 Disqualified due to less availability of water for crop expansion123 Pahala Poolachchiya Waragoda yaya (Tract) Minor 1.42 DL1b 3.00 0.04 3 4 Disqualified due to less availability of water for crop expansion124 Walas wewa Data not available125 Giribawa Aluth wewa Minor 0.78 DL1b 15.00 0.18 8 2 Disqualified due to less availability of water for crop expansion126 Andiya kottuwa wewa Minor 1.04 DL1b 15.00 0.19 10 3 Disqualified due to less availability of water for crop expansion127 Bathala wewa Minor 1.04 DL1b 17.00 0.21 10 3 Disqualified due to less availability of water for crop expansion128 Giriba wewa Minor 7.00 DL1b 36.00 0.44 36 17 Disqualified due to less availability of water for crop expansion129 Hetiyarachigama wewa Minor 0.78 DL1b 17.00 0.21 6 1 Disqualified due to less availability of water for crop expansion130 Ihala Giriba wewa Minor 7.00 DL1b 34.00 0.42 34 17 Disqualified due to less availability of water for crop expansion131 Ihala Pothana wewa Minor Data not available132 Ihala wewa Minor 0.26 DL1b 5.00 0.06 2 0 Disqualified due to less availability of water for crop expansion133 Kivul wewa Minor 0.26 DL1b 4.00 0.05 2 0 Disqualified due to less availability of water for crop expansion134 Kuda galkadawala wewa Minor 3.37 DL1b 18.00 0.22 18 8 Disqualified due to less availability of water for crop expansion135 Madawalagam wewa Minor 1.04 DL1b 18.00 0.22 8 2 Disqualified due to less availability of water for crop expansion136 Marathangala wewa Minor Data not available137 Meda wewa Minor 0.52 DL1b 11.00 0.14 4 1 Disqualified due to less availability of water for crop expansion138 Pothana wewa Minor 2.07 DL1b 26.00 0.32 20 5 Disqualified due to less availability of water for crop expansion139 Radha wewa Minor 0.52 DL1b 4.00 0.05 4 1 Disqualified due to less availability of water for crop expansion140 Siyambalagas wewa Minor 1.04 DL1b 19.00 0.24 10 3 Disqualified due to less availability of water for crop expansion141 Thambutta wewa Minor 4.40 DL1b 57.00 0.69 43 11 Qualified142 Thammitagama wewa Minor Data not available143 Wandugala wewa Minor Data not available144 Wara wewa Minor 1.04 DL1b 30.00 0.37 10 3 Disqualified due to less availability of water for crop expansion145 Wewarannawattiya wewa Minor 1.30 DL1b 32.00 0.39 10 2 Disqualified due to less availability of water for crop expansion146 Aliyawattuna wewa Minor 2.33 DL1b 32.00 0.39 23 6 Disqualified due to less availability of water for crop expansion147 Thammittiyawa Minor 2.66 DL1b 57.00 0.44 57 35 Qualified148 Gurulupittigama Minor 0.26 DL1b 21.00 0.25 2 0 Disqualified due to less availability of water for crop expansion149 Ihala Marathankadawela Minor 1.81 DL1b 42.00 0.52 14 3 Disqualified due to less availability of water for crop expansion
Ehetuwewa No tannksAmbanpola No tannks Data not available
150 Nikaweratiya Dalukgolla Minor 0.26 IL3 7.00 0.09 5 2 Disqualified due to less availability of water for crop expansion151 Dewale wewa Minor 0.52 IL3 3.00 0.04 3 3 Disqualified due to less availability of water for crop expansion152 Diyagama Minor 2.33 IL3 8.00 0.10 8 13 Disqualified due to less availability of water for crop expansion153 Galagedara Minor 3.37 IL3 16.00 0.20 16 21 Disqualified due to less availability of water for crop expansion154 Galapitiyagama Minor 2.07 IL3 4.00 0.05 4 6 Disqualified due to less availability of water for crop expansion
Agr
o- e
colo
gy Z
one
Com
man
d A
re (H
a)
Sto
rage
Cap
acity
(MC
M)*
Estimated Max.Possible Crop
Extent (Ha)
Judgment RemarksS/No Province District DS Division Name of Proposed Tank SchemeCategory
Availability of Data
Cat
chm
ent A
rea
(Sq.
km
)

The Preparatory Survey on the P
roject for Improvem
ent of Agricultural P
roduction and Productivity
in Dry Zone A
reas in Dem
ocratic Socialist Republic of Sri Lanka
Final R
eport
T 5-4
Table A
5.1 Screening of the Irrigation Schem
es
Mah
a(Pa
ddy)
Yal
a (O
FC)
155 Hulugalla Minor 1.55 IL3 6.00 0.07 6 10 Disqualified due to less availability of water for crop expansion156 Kaluwennawa Minor 0.52 IL3 10.00 0.12 9 3 Disqualified due to less availability of water for crop expansion157 Kiridigalla Minor 9.58 IL3 5.00 0.06 5 8 Disqualified due to less availability of water for crop expansion158 Kumbukwewa Minor 1.30 IL3 6.00 0.07 6 8 Disqualified due to less availability of water for crop expansion159 Mawathagama Minor 2.07 IL3 18.00 0.22 18 13 Disqualified due to less availability of water for crop expansion160 Nabadawa Minor 0.78 IL3 8.00 0.10 8 5 Disqualified due to less availability of water for crop expansion161 Olupaliyawa Minor 7.00 IL3 10.00 0.12 10 16 Disqualified due to less availability of water for crop expansion162 Pahalagalapittiyagama Minor 1.30 IL3 11.00 0.14 11 8 Disqualified due to less availability of water for crop expansion163 Thanagolla Minor 1.04 IL3 6.00 0.07 6 6 Disqualified due to less availability of water for crop expansion164 Wasiwewa Minor 3.11 IL3 12.00 0.15 12 19 Disqualified due to less availability of water for crop expansion
Mahawa No tannks Disqualified due to less availability of water for crop expansion165 Kotawehera Ahubadagama wewa Minor 0.26 IL3 12.00 0.15 4 1 Disqualified due to less availability of water for crop expansion166 Aluthgama Maha wewa Minor 3.37 IL3 24.00 0.30 24 11 Disqualified due to less availability of water for crop expansion167 Aluthgame Rathmale wewa Minor 2.33 IL3 2.00 0.02 3 5 Disqualified due to less availability of water for crop expansion168 Awulegama wewa Minor Data not available169 Berawa wewa Minor 0.26 IL3 6.00 0.07 4 1 Disqualified due to less availability of water for crop expansion170 Divulawa wewa Minor Data not available171 Gatila wewa Minor 0.26 IL3 5.00 0.06 4 1 Disqualified due to less availability of water for crop expansion172 Hudaliyawa Maha wewa Minor 7.77 IL3 36.00 0.44 36 24 Qualified173 Ihal Bedura wewa Minor Data not available Disqualified due to less availability of water for crop expansion174 Kaluwage wewa Minor 1.04 IL3 8.00 0.10 8 6 Disqualified due to less availability of water for crop expansion175 Karawadeniya kuda wewa Minor 1.55 IL3 13.00 0.16 13 10 Disqualified due to less availability of water for crop expansion176 Karuwalagaha watta wewa Minor 0.26 IL3 3.00 0.04 3 2 Disqualified due to less availability of water for crop expansion177 Karuwalagaha wewa Minor 0.26 IL3 3.00 0.03 3 2 Disqualified due to less availability of water for crop expansion178 Kondiyawa wewa Minor Data not available179 Kudarawaliya Maha wewa Minor 0.78 IL3 18.00 0.22 9 2 Disqualified due to less availability of water for crop expansion180 Millagolla wewa Minor 0.52 IL3 1.00 0.01 2 2 Disqualified due to less availability of water for crop expansion181 Moragolla Aluth wewa Minor 2.59 IL3 16.00 0.19 16 16 Qualified182 Nabadeyaya wewa Minor 0.26 IL3 2.00 0.03 2 1 Disqualified due to less availability of water for crop expansion183 Palugaha wewa Minor 0.52 IL3 4.00 0.04 4 3 Disqualified due to less availability of water for crop expansion184 Pathkalawettiya-Patapiliyadoda Minor 0.26 IL3 3.00 0.04 3 2 Disqualified due to less availability of water for crop expansion185 Ugurassawa wewa Minor 3.11 Il3 17.00 0.20 17 10 Disqualified due to less availability of water for crop expansion186 Weerapuliyawa wewa Minor Data not available187 Polpitigama Palugaswewa Minor 0.78 DL1b 12.00 0.15 12 2 Disqualified due to less availability of water for crop expansion188 Palugolla-A Minor 0.78 DL1b 12.00 0.15 12 2 Disqualified due to less availability of water for crop expansion189 Palugolla-B Minor 0.26 DL1b 8.00 0.09 5 1 Disqualified due to less availability of water for crop expansion190 Puttalam Karuwalagaswewa Neelabemma Scheme Major 1,830.00 DL1b 746.00 14.80 746 388 Qualified191 Aluthgama Minor 0.26 DL1b 2.00 0.01 1 0 Disqualified due to less availability of water for crop expansion192 Dangaswewa Minor 0.54 DL1b 26.00 0.06 5 1 Disqualified due to less availability of water for crop expansion193 Ihalapuliyankulama Minor 4.61 DL1b 50.00 0.76 45 9 Disqualified due to less availability of water for crop expansion194 Ipologama Minor 0.73 DL1b 12.00 0.10 7 1 Disqualified due to less availability of water for crop expansion195 Kudamadawachchiya Minor 0.75 DL1b 7.00 0.06 5 2 Disqualified due to less availability of water for crop expansion196 Kumbukwewa Minor 2.02 DL1b 14.00 0.14 11 4 Disqualified due to less availability of water for crop expansion197 Munamalgaswewa Medium 3.37 DL1b 85.00 0.04 3 5 Disqualified due to less availability of water for crop expansion198 Murukwattawewa Minor 7.25 DL11 18.00 0.32 26 18 Disqualified due to less availability of water for crop expansion199 Pahalapuliyankulama Minor 6.73 DL1b 71.00 0.66 54 13 Disqualified due to less availability of water for crop expansion200 Paligama Minor 6.01 DL3 33.00 0.43 35 15 Disqualified due to less availability of water for crop expansion201 Rabawewa Minor 0.98 DL1b 16.00 0.12 10 2 Disqualified due to less availability of water for crop expansion202 Ranawarapitiya Minor 2.10 DL1b 16.00 0.21 17 4 Disqualified due to less availability of water for crop expansion203 Devanuwara Minor 14.50 DL1b 77.00 0.31 25 36 Qualified204 Egodapitiya Minor 11.14 DL1b 61.00 1.01 82 28 Qualified205 Karuwalagaswewa Minor 10.36 DL1b 48.00 0.31 25 26 Qualified
Judgment RemarksAvailability of Data
Cat
chm
ent A
rea
(Sq.
km
)
Agr
o- e
colo
gy Z
one
Com
man
d A
re (H
a)
Sto
rage
Cap
acity
(MC
M)*
Estimated Max.Possible Crop
Extent (Ha)
S/No Province District DS Division Name of Proposed Tank SchemeCategory

The Preparatory Survey on the P
roject for Improvem
ent of Agricultural P
roduction and Productivity
in Dry Zone A
reas in Dem
ocratic Socialist Republic of Sri Lanka
Final R
eport
T 5-5
Table A
5.1 Screening of the Irrigation Schem
es
Mah
a(Pa
ddy)
Yal
a (O
FC)
206 Madogama Minor 11.45 DL1b 40.00 0.43 36 29 Qualified207 Pahariya Minor 14.50 DL1b 71.00 0.66 54 36 Qualified208 Palugasgame Minor 8.86 DL3 33.00 0.43 35 22 Qualified209 Pavaddamaduwa Minor 14.25 DL11 38.00 0.62 51 36 Qualified210 Saliya-A Minor 2.54 DL1b 16.00 0.21 17 6 Qualified211 Saliya-B Minor 2.33 DL1b 18.00 0.11 9 6 Qualified212 Saliya-C Minor 6.35 DL1b 26.00 0.46 37 16 Qualified213 Tabbowa Major 388.50 DL11 847.00 18.50 847 525 Qualified214 Thambapanniya Minor 24.09 DL1b 73.00 0.53 44 60 Qualified215 Virapura Minor 5.18 DL1b 32.00 0.18 15 13 Qualified216 Nawagattegama Aluthwewa Minor Data not available217 Maha Andarawewa Tank Medium 33.70 DL1b 151.00 2.10 102 25 Qualified218 Gallawa wewa Minor Data not available219 Konkadawela Tank Minor Data not available220 Mahadombakaththawawewa Minor Data not available221 Sarasgediya wewa Minor Data not available222 Anamaduwa Ingirimettiya Tank Individual 388.00 DL1b 2,643.00 66.50 2643 1269 Qualified223 MahakumbukkadawAndigamawalpanawa Minor 1.84 DL1b 15.00 0.18 15 9 Disqualified due to less availability of water for crop expansion224 Dangaswewa Minor 0.44 DL1b 3.00 0.03 3 1 Disqualified due to less availability of water for crop expansion225 Galkuliya Minor 0.80 DL1b 12.00 0.15 12 3 Disqualified due to less availability of water for crop expansion226 Jeyarajapura Minor 0.75 DL1b 10.00 0.12 10 2 Disqualified due to less availability of water for crop expansion227 Kivla Minor 0.54 DL1b 1.00 0.07 6 2 Disqualified due to less availability of water for crop expansion228 Ratmalgaswewa Minor 0.80 DL1b 40.00 0.49 11 3 Disqualified due to less availability of water for crop expansion229 NCP Anuradhapura Horowpothana Kakulbendadigiliya wewa Minor 1.30 DL1e 67.00 0.81 0 0 Disqualified due to less availability of water for crop expansion230 Lewapathiththa Wewa Minor 2.33 DL1e 38.00 0.47 38 15 Qualified231 Mora wewa Minor 0.52 DL1e 34.00 0.42 12 3 Disqualified due to less availability of water for crop expansion232 Rasnaka wewa Minor Data not available233 Walahawidda wewa Minor Data not available234 Welmuwa Pothana wewa Minor 1.04 DL1e 12.00 0.71 24 6 Qualified235 Wahalkada Major 81.60 DL1e 810.00 53.00 810 308 Disqualified due to less availability of water for crop expansion236 Kahatagasdigiliya Diganhalmillawa Pahala olugolawa Minor 3.89 DL1b 63.00 0.76 61 12 Qualified237 Divul wewa - Divul wewa Minor 2.59 DL1b 57.00 0.69 61 16 Qualified238 Ellawewa - Kuda wewa Minor Data not available 4.00 239 Kanadara Rathmale - Rathmale wewa Minor 3.63 DL1b 41.00 0.50 41 11 Qualified240 Kelani wewa - Dahanakwewa Minor Data not available241 Kirigollewa - Kirigollawa wewa Minor Data not available242 Kokebe wewa Medium 2.33 DL1b 92.00 1.18 55 15 Qualified243 Konmaduwa - Divulwewa - Kuda wewa Minor 2.59 DL1b 57.00 0.75 61 16 Qualified244 Konmaduwa - Kuda wewa Minor 0.78 DL1b 4.00 0.04 0 0 Disqualified due to less availability of water for crop expansion245 Koon wewa Minor 4.40 DL1b 69.00 0.84 69 27 Qualified246 Kudapattiyawa - Mahadivul wewa Minor Data not available247 Makichchawa - Kukulewa wewa Minor Data not available248 Meekumbuk wewa meeminnawala wewa Minor 1.81 DL1b 35.00 0.43 35 8 Disqualified due to less availability of water for crop expansion249 Nekutunuwewa - Ganguru wewa Minor 1.86 DL1b 36.00 0.94 29 6 Disqualified due to less availability of water for crop expansion250 Nilugollakada - Nelugollakada wewa Minor 4.79 DL1b 40.00 0.63 52 15 Qualified251 Palipothana - Palipothana wewa Data not available252 Panwella - Parandarellawa wewa Minor 4.66 DL1b 33.00 0.78 64 29 Qualified253 Parandarellawa Ihalakumbukgollewa wewa Minor Data not available254 Rampathgama -Agaraya wewa Minor Data not available255 Rampathvila - Kuda wewa Minor 1.17 DL1b 10.00 0.12 10 4 Disqualified due to less availability of water for crop expansion256 Ranpathwila - Ranpathwila wewa Medium 3.11 DL1b 107.00 2.49 48 10 Disqualified due to less availability of water for crop expansion257 Sampathgama - Ethawatuna wewa Data not available
Agr
o- e
colo
gy Z
one
Com
man
d A
re (H
a)
Sto
rage
Cap
acity
(MC
M)*
Estimated Max.Possible Crop
Extent (Ha)
Judgment RemarksS/No Province District DS Division Name of Proposed Tank SchemeCategory
Availability of Data
Cat
chm
ent A
rea
(Sq.
km
)

The Preparatory Survey on the P
roject for Improvem
ent of Agricultural P
roduction and Productivity
in Dry Zone A
reas in Dem
ocratic Socialist Republic of Sri Lanka
Final R
eport
T 5-6
Table A
5.1 Screening of the Irrigation Schem
es
Mah
a(Pa
ddy)
Yal
a (O
FC)
258 Thalaththewa - Pattilapu wewa Minor 3.24 DL1b 38.00 0.47 38 20 Qualified259 Thalaththewa - Thalaththewa wewa Minor Data not available260 Thuruturagama Mahakulumeemakada wewa Minor 3.89 DL1b 67.00 0.82 61 12 Qualified261 Tikanpothana Heen ela anicut Minor Data not available262 Weeththawa - Alpath wewa Minor 2.85 DL1b 14.00 0.17 14 9 Qualified263 GalenbindunuwewaAluthdivul Wewa Medium 16.20 DL1b 115.00 1.73 115 48 Disqualified due to less availability of water for crop expansion264 Manankatiya Tank Major 61.60 DL1b 427.00 5.94 427 260 Qualified265 Mahawilachchiya Andaradigiliya wewa Minor Data not available266 Godarathmalgaha wewa Minor Data not available267 Kadurupittiya Wewa Minor 1.97 DL1b 3.00 0.15 12 3 Disqualified due to less availability of water for crop expansion268 Kivulekade wewa Minor 1.17 DL1b 73.00 0.89 14 2 Disqualified due to less availability of water for crop expansion269 Kudakimbulewa wewa Minor 2.59 DL1b 43.00 0.52 20 4 Disqualified due to less availability of water for crop expansion270 Katupuliyankulama wewa Minor 1.68 DL1b 16.00 0.20 13 3 Disqualified due to less availability of water for crop expansion271 Malhamige wewa Minor Data not available272 Meegasdigiliya wewa Minor Data not available273 Millagollawa wewa Minor 1.55 DL1b 11.00 0.13 11 2 Disqualified due to less availability of water for crop expansion274 Nabadagasdigiliya wewa Minor 2.07 DL1b 22.00 0.27 16 3 Disqualified due to less availability of water for crop expansion275 Nawodagama wewa Minor 2.33 DL1b 17.00 0.21 17 4 Disqualified due to less availability of water for crop expansion276 Puravarasan kulam Minor Data not available277 Randoowa wewa Minor 1.55 DL1b 11.00 0.13 11 2 Disqualified due to less availability of water for crop expansion278 Dunumadlawa Minor 1.19 DL1b 12.00 0.15 9 2 Disqualified due to less availability of water for crop expansion279 Helabagaswewa Minor 3.11 DL1b 19.00 0.24 19 5 Disqualified due to less availability of water for crop expansion280 Palugaswewa Minor 1.04 DL1b 13.00 0.16 8 2 Disqualified due to less availability of water for crop expansion281 Kiralpatiyawa Minor 1.04 DL1b 30.00 0.37 8 2 Disqualified due to less availability of water for crop expansion282 Nuwaragampalatha Ambagaha wewa Minor Data not available283 Gambirigas Wewa Minor 1.42 DL1b 46.00 0.57 17 2 Disqualified due to less availability of water for crop expansion284 Halambagas wewa Minor 0.65 DL1b 24.00 0.30 8 1 Disqualified due to less availability of water for crop expansion285 Kudahalmillawa wewa Minor Data not available286 Lift irrigation system at Asokapura Minor Data not available287 Paniyankadawela wewa Minor 3.24 DL1b 18.00 0.72 38 5 Disqualified due to less availability of water for crop expansion288 Perimiyankulama tnk Minor 1.30 DL1b 24.00 0.28 10 2 Disqualified due to less availability of water for crop expansion289 Siyambalagas wewa Minor 0.26 DL1b 6.00 0.07 3 0 Disqualified due to less availability of water for crop expansion290 Nachchaduwa Ahangama wewa Minor 2.33 DL1b 20.00 0.25 20 4 Disqualified due to less availability of water for crop expansion291 Ambagas wewa Minor 1.04 DL1b 9.00 0.11 9 2 Disqualified due to less availability of water for crop expansion292 Demata wewa Minor 0.52 DL1b 2.00 0.02 2 1 Disqualified due to less availability of water for crop expansion
293 Feeder channel to Palisge wewa fromNachchaduwa feeder channel
Minor Data not available
294 Henapolayagama wewa Minor 0.52 DL1b 18.00 0.22 6 1 Disqualified due to less availability of water for crop expansion295 Kaluarachchigama wewa Minor Data not available296 Katugampola wewa Minor 2.59 DL1b 32.00 0.39 30 4 Disqualified due to less availability of water for crop expansion297 Kudanelumbewa wewa Minor Data not available298 Mahanelumbewa wewa Minor Data not available299 Pahala wewa Minor Data not available300 Palisge Wewa Minor Data not available301 Siyambalagas wewa Minor 1.48 DL1b 10.00 0.12 10 2 Disqualified due to less availability of water for crop expansion302 Rajangana Thamannawa wewa Minor 1.97 DL1b 4.00 0.15 12 3 Disqualified due to less availability of water for crop expansion303 Galnewa Ihala Palugallagama wewa Minor 0.39 DL1b 4.00 0.05 4 1 Disqualified due to less availability of water for crop expansion304 Ihala Walas wewa Minor 0.78 DL1b 4.00 0.06 5 2 Disqualified due to less availability of water for crop expansion305 Ihalagama Haliyagama Wewa Minor 1.04 DL1b 4.00 0.05 4 3 Disqualified due to less availability of water for crop expansion306 Kallanchiya wewa Minor 2.33 DL1b 28.00 0.35 27 6 Disqualified due to less availability of water for crop expansion307 Nelumpathgama wewa Minor 0.91 DL1b 8.00 0.10 8 2 Disqualified due to less availability of water for crop expansion308 Pahala Seerambewa Minor 1.94 DL1b 8.00 0.13 11 5 Disqualified due to less availability of water for crop expansion
Judgment RemarksAvailability of Data
Cat
chm
ent A
rea
(Sq.
km
)
Agr
o- e
colo
gy Z
one
Com
man
d A
re (H
a)
Sto
rage
Cap
acity
(MC
M)*
Estimated Max.Possible Crop
Extent (Ha)
S/No Province District DS Division Name of Proposed Tank SchemeCategory

The Preparatory Survey on the P
roject for Improvem
ent of Agricultural P
roduction and Productivity
in Dry Zone A
reas in Dem
ocratic Socialist Republic of Sri Lanka
Final R
eport
T 5-7
Table A
5.1 Screening of the Irrigation Schem
es
Mah
a(Pa
ddy)
Yal
a (O
FC)
309 Udanagama wewa Minor 1.04 DL1b 26.00 0.32 12 3 Disqualified due to less availability of water for crop expansionTambuttegama No tannks -
310 Talawa Dik wewa Minor 1.94 DL1b 40.00 0.49 23 5 Disqualified due to less availability of water for crop expansion311 Eppawela Tank Minor Data not available312 Kadurugas wewa Minor Data not available313 Karagaha wewa Minor Data not available314 Kelediul wewa Minor Data not available315 Kiri Amunugollewa wewa Minor 0.93 DL1b 16.00 0.20 11 2 Disqualified due to less availability of water for crop expansion316 Nambada Wewa Medium 2.46 DL1b 101.00 1.23 29 4 Disqualified due to less availability of water for crop expansion317 Rathmelwatiya wewa Minor 1.24 DL1b 34.00 0.42 15 3 Disqualified due to less availability of water for crop expansion318 Siyambalagas wewa Minor 0.91 DL1b 24.00 0.30 11 2 Disqualified due to less availability of water for crop expansion319 Nochchiyagama Galkadawela wewa Minor 1.55 DL1b 18.00 0.38 12 2 Disqualified due to less availability of water for crop expansion320 Kongasdigiliya wewa Minor 1.11 DL1b 18.00 0.27 9 2 Disqualified due to less availability of water for crop expansion321 Kuda wewa Minor Data not available322 Kusumpura wewa Minor 1.30 DL1b 52.00 0.63 10 2 Disqualified due to less availability of water for crop expansion323 Mahadivul Wewa Minor 2.38 DL1b 18.00 0.32 19 4 Disqualified due to less availability of water for crop expansion324 Nekaththegama wewa Minor 1.30 DL1b 8.00 0.20 10 2 Disqualified due to less availability of water for crop expansion325 Nivandama wewa Minor 1.09 DL1b 6.00 0.20 8 2 Disqualified due to less availability of water for crop expansion326 Paluhiriyalegama wewa Minor 0.93 DL1b 10.00 0.16 7 1 Disqualified due to less availability of water for crop expansion327 Wahabedu wewa Minor 0.83 DL1b 4.00 0.12 6 1 Disqualified due to less availability of water for crop expansion328 Thirappane Dik wewa Minor 0.39 DL1b 14.00 0.17 6 1 Disqualified due to less availability of water for crop expansion329 Kumbuk wewa Minor Data not available330 Mahakanumulla wewa Minor 0.78 DL1b 79.00 0.13 9 2 Disqualified due to less availability of water for crop expansion331 Thodamaduwa Wewa Minor 4.79 DL1b 24.00 0.21 24 15 Disqualified due to less availability of water for crop expansion332 Palugaswewa Asirigama wewa Minor 1.30 DL1b 13.00 0.25 21 4 Disqualified due to less availability of water for crop expansion333 Debunnawa wewa Minor 3.37 DL1b 46.00 0.53 46 8 Qualified334 Horuwila Nikathugama wewa Minor 1.17 DL1b 24.00 0.18 18 3 Disqualified due to less availability of water for crop expansion335 Kalawagama Wewa Minor 2.46 DL1b 40.00 0.16 38 6 Qualified336 Maithirigama wewa Minor Data not available337 Puwakpitiya wewa Minor 0.65 DL1b 22.00 0.27 15 4 Qualified338 Senadirayagama wewa Minor 3.63 DL1b 44.00 0.55 45 11 Qualified339 Siyambalagas wewa Minor 1.55 DL1b 14.00 0.19 15 4 Qualified340 Thimbala wewa Minor Data not available341 Thumbikkulama wewa Minor Data not available342 Wayana ulpotha wewa Minor 1.17 DL1b 22.00 0.22 18 3 Disqualified due to less availability of water for crop expansion343 Kakirawa Kadiyawa wewa Minor Data not available344 Keeriyagas wewa Minor Data not available345 Kowakkulama wewa Minor 1.94 DL1b 30.00 0.19 30 5 Disqualified due to less availability of water for crop expansion346 Maminiyawa wewa Minor 1.30 DL1b 24.00 0.10 4 1 Disqualified due to less availability of water for crop expansion347 Medagama Ihala wewa Minor 1.55 DL1b 4.00 0.05 4 4 Disqualified due to less availability of water for crop expansion348 Neekiniyawa Wewa Minor 0.78 DL1b 34.00 0.08 12 2 Disqualified due to less availability of water for crop expansion349 Nelliyagama wewa Minor 0.78 DL1b 22.00 0.11 12 2 Disqualified due to less availability of water for crop expansion350 Olukarandagama Palugas wewa Minor 0.52 DL1b 28.00 0.08 8 1 Disqualified due to less availability of water for crop expansion351 Ramba wewa Minor Data not available - Disqualified due to less availability of water for crop expansion352 Sasthraweliyaya wewa Minor 0.52 DL1b 57.00 0.09 8 1 Disqualified due to less availability of water for crop expansion353 Thoru wewa Minor 2.85 DL1b 81.00 0.66 44 7 Disqualified due to less availability of water for crop expansion
354 Mahaweli - Sy HKalawewa, Kandalama Tanks with MahaweliDiversion 841.00 DL1b 28,000.00 154.00 28,000 21,560 Qualified
355 NP Mannar Manthai West Adampankulam Medium 11.70 DL4 162.00 0.72 59 11 Qualified356 Karayankannadi tank Data not available357 Kurai tank & Parangi Aru Anicut Individual 24.60 DL4 700.00 2.54 208 42 Qualified358 Maruthamadu Anicut Scheme Medium 6.90 DL4 227.00 0.51 41 8 Qualified
Agr
o- e
colo
gy Z
one
Com
man
d A
re (H
a)
Sto
rage
Cap
acity
(MC
M)*
Estimated Max.Possible Crop
Extent (Ha)
Judgment RemarksS/No Province District DS Division Name of Proposed Tank SchemeCategory
Availability of Data
Cat
chm
ent A
rea
(Sq.
km
)

The Preparatory Survey on the P
roject for Improvem
ent of Agricultural P
roduction and Productivity
in Dry Zone A
reas in Dem
ocratic Socialist Republic of Sri Lanka
Final R
eport
T 5-8
Table A
5.1 Screening of the Irrigation Schem
es
Mah
a(Pa
ddy)
Yal
a (O
FC)
359 Periyamadu Tank & Lift Irrigation Medium 367.80 DL4 304.00 7.13 584 117 Qualified360 Welimaruthamadu Scheme Individual 400.00 DL4 307.00 3.41 279 56 Qualified361 Madu Thatchchanamaruthamadu Medium 111.40 DL11 214.00 1.41 115 25 Qualified362 Periya Pandivirichchan Scheme Medium 83.90 DL11 245.00 3.47 284 57 Qualified363 Mullikulam Irrigation Scheme Medium 32.80 DL11 152.00 1.85 151 30 Qualified364 Mulattivu Thurkkai Ambalaperumalkulam Tank Medium 61.10 DL1e 252.00 3.78 309 151 Qualified365 Iyankulam Tank Medium 35.00 DL1e 384.00 4.87 399 196 Qualified366 Koddaikuddinakulam Tank Medium 24.60 DL1e 164.00 1.28 105 51 Qualified367 Kollvilankulam Tank Medium 14.90 DL1e 162.00 1.87 153 75 Qualified368 Mallavi Tank Medium 4.80 DL1e 131.00 0.91 75 37 Qualified369 Muruthankulam Tank Medium 26.70 DL1e 182.00 2.1 172 84 Qualified370 Palayamurukandykulam Tank Medium 19.60 DL1e 144.00 2.2 180 88 Qualified371 Tenniyankulam Tank Medium 45.30 DL1e 344.00 5.4 442 217 Qualified372 Therankandal Tank Medium 12.30 DL1e 121.00 0.9 74 36 Qualified373 Manthai East Eppadiyakulam Tank Data not available374 Moopankulam Tank Data not available375 Sinnaiyamperumalkulam Tank Minor 1.04 DL1e 8.00 0.10 8 3 Disqualified due to less availability of water for crop expansion376 Vaunikulam Tank - LB & RB LIS Individual 228.00 DL1e 2,790.00 43.54 2790 1746 Qualified377 Moonru murippu Minor 1.55 DL1e 23.00 0.29 23 5 Disqualified due to less availability of water for crop expansion378 Naddankandal kulam Minor 1.30 DL1e 21.00 0.25 21 4 Disqualified due to less availability of water for crop expansion379 Odarunthakulam Minor 1.81 DL1e 32.00 0.39 32 6 Disqualified due to less availability of water for crop expansion380 Kalvilankulam Data not available381 Karumpuliyankulam Data not available382 Pandiyankulam Data not available383 Poovarasankulam Data not available384 Siraddy kulam Data not available385 Ambal puram Data not available386 Ponnagar Data not available387 Selvapuram Data not available388 Sivapuram Data not available389 Vinayagapuram Data not available390 Oddusuddan Muthu lyan kaddu Tank & LIS Individual 171.00 DL1e 2,468.00 50.57 4140 3188 Qualified391 Othiyamalai Minor 2.59 DL1e 27.00 0.34 27 8 Disqualified due to less availability of water for crop expansion392 Palampasi Minor 2.59 DL1e 21.00 0.26 21 8 Disqualified due to less availability of water for crop expansion393 Thaddayamalai Minor 2.59 DL1e 16.00 0.20 16 8 Disqualified due to less availability of water for crop expansion394 Thadduvan Minor 2.59 DL1e 38.00 0.46 38 8 Disqualified due to less availability of water for crop expansion395 17th mile post Data not available396 Ganeshapuram Data not available397 Kanagarathinapuram Data not available398 Katchilamadu Data not available399 Muthuvinayagapuram Data not available400 Pandarawanni Data not available401 Per aru Data not available402 Puliyankulam Data not available403 Samanan kulam Data not available404 Vithiyapuram Data not available405 Vavuniya Vavuniya Town Alankulam Minor 4.14 DL1b 9.00 0.11 10 16 Disqualified due to less availability of water for crop expansion406 Alayamaruthamadu Tank Medium 8.30 DL1b 92.00 0.60 92 43 Disqualified due to less availability of water for crop expansion407 Arasankulam Minor 4.14 DL1b 11.00 0.14 11 10 Disqualified due to less availability of water for crop expansion408 Chemamadu Tank Medium 37.60 DL1b 243.00 3.20 243 114 Disqualified due to less availability of water for crop expansion409 Elamaruthankulam Minor 5.96 DL1b 16.00 0.20 40 15 Disqualified due to less availability of water for crop expansion410 Illuppaikulam Minor 3.89 DL1b 32.00 0.39 32 10 Disqualified due to less availability of water for crop expansion
Judgment RemarksAvailability of Data
Cat
chm
ent A
rea
(Sq.
km
)
Agr
o- e
colo
gy Z
one
Com
man
d A
re (H
a)
Sto
rage
Cap
acity
(MC
M)*
Estimated Max.Possible Crop
Extent (Ha)
S/No Province District DS Division Name of Proposed Tank SchemeCategory

The Preparatory Survey on the P
roject for Improvem
ent of Agricultural P
roduction and Productivity
in Dry Zone A
reas in Dem
ocratic Socialist Republic of Sri Lanka
Final R
eport
T 5-9
Table A
5.1 Screening of the Irrigation Schem
es
Mah
a(Pa
ddy)
Yal
a (O
FC)
411 Kaliya Kulam Minor 1.55 DL1b 18.00 0.22 18 4 Disqualified due to less availability of water for crop expansion412 Kalmadu Tank Medium 52.30 DL1b 162.00 1.30 162 76 Disqualified due to less availability of water for crop expansion413 Kathiran Kulam Minor Data not available414 Kathirvelan Poovarasan Kulam Minor 2.33 DL1b 67.00 0.81 27 6 Disqualified due to less availability of water for crop expansion415 Kollamaruthamadu Kulam Minor 1.55 DL1b 18.00 0.22 18 4 Disqualified due to less availability of water for crop expansion416 Kombuvitha Kulam Medium 6.20 DL1b 85.00 1.04 85 40 Disqualified due to less availability of water for crop expansion417 Maharambai Kulam Medium 15.80 DL1b 87.00 1.06 87 41 Qualified418 Mallikai Tank Medium 6.30 DL1b 122.00 1.48 122 57 Disqualified due to less availability of water for crop expansion419 Moonayamadu Tank Medium 56.20 DL1b 87.00 1.06 87 41 Qualified420 Maraiyadiththa Kulam Minor 4.40 DL1b 45.00 0.55 45 21 Qualified421 Nainarmadu Kulam Minor Data not available422 Nampan Kulam Medium 6.10 DL1b 104.00 1.27 104 49 Disqualified due to less availability of water for crop expansion423 Naruvil kulam Minor 0.78 DL1b 8.00 0.10 8 4 Disqualified due to less availability of water for crop expansion424 Nedunkulam Minor 1.30 DL1b 32.00 0.39 20 3 Qualified425 Palavar Kulam Minor Data not available426 Pampaimadu Tankm Medium 18.10 DL1b 105.00 1.29 105 49 Qualified427 Panikkaneeravi Kulam Minor 1.81 DL1b 15.00 0.48 39 8 Qualified428 Peechchaththipodda kulam Minor Data not available429 Pirappan Kulam Minor Data not available430 Puthuk Kulam Minor 2.59 DL1b 26.00 0.32 26 6 Disqualified due to less availability of water for crop expansion431 Rambaikulam Minor 1.81 DL1b 16.00 0.24 19 5 Disqualified due to less availability of water for crop expansion432 Samalan kulam Minor 0.78 DL1b 8.00 0.10 8 2 Disqualified due to less availability of water for crop expansion433 Sengalpaddu - 2nd Minor Data not available434 Sundarathayar Puliyankulam Minor 2.59 DL1b 18.00 0.22 18 6 Qualified435 Thampanai Kulam Minor 2.59 DL1b 14.00 0.17 14 6 Qualified436 Tharani Kulam Minor 1.55 DL1b 16.00 0.20 16 4 Qualified437 Thirumeiyathu Kulam Minor Data not available438 Vadakoddu Puliyankulam Tank Minor Data not available439 Vaikooli Koodan Kulam Minor 1.81 DL1b 27.00 0.33 21 5 Qualified440 Vavuniya Tank Medium Data not available 27.20 DL1b 173.00 2.11 173 81 Qualified441 Vedan Kulam Minor 1.30 DL1b 32.00 0.39 20 3 Qualified442 Velankulam Medium 4.90 DL1b 90.00 1.11 90 42 Disqualified due to less availability of water for crop expansion443 Veppan Kulam Minor 1.30 DL1b 12.00 0.15 12 3 Qualified444 Vavuniya North Kachchakodi Kulam Minor Data not available445 Kanagarayankulam Medium 9.10 DL1b 127.00 1.55 127 37 Disqualified due to less availability of water for crop expansion446 Kantharodai Kulam Minor 1.30 DL1b 10.00 0.12 10 6 Qualified447 Kodaliparichan Kulam Minor 3.63 DL1b 12.00 0.14 12 16 Qualified448 Kovilpuliyankulam Minor 1.81 DL1b 9.00 0.41 34 8 Disqualified due to less availability of water for crop expansion449 Kunchukulam Minor 3.63 DL1b 51.00 0.62 51 16 Disqualified due to less availability of water for crop expansion450 Nagar Kulam Minor Data not available451 Paddadai Pirintha Kulam Minor 4.14 DL1b 12.00 0.38 32 18 Disqualified due to less availability of water for crop expansion452 Padukatukulam Minor 0.78 DL1b 8.00 0.14 11 3 Disqualified due to less availability of water for crop expansion453 Parasankulam Minor 0.78 DL1b 15.00 0.24 12 2 Disqualified due to less availability of water for crop expansion454 Samalan Kulam Minor 1.55 DL1b 25.00 0.31 24 4 Disqualified due to less availability of water for crop expansion455 Senappan kulam Minor Data not available456 Thirkkkaddu kulam Minor 3.37 DL1b 8.00 0.32 23 15 Qualified457 Thuvaraneri Kulam Minor 1.81 DL1b 34.00 0.42 34 7 Disqualified due to less availability of water for crop expansion458 Udayaraipandiard Minor 0.78 DL1b 13.00 0.24 14 2 Qualified459 Vavuniya South Anapulunthawewa Irrigation Scheme Minor 0.81 DL1b 14.00 0.17 14 3 Disqualified due to less availability of water for crop expansion460 Eropothan Irrigation Scheme Medium 3.89 DL1b 88.00 1.08 83 18 Qualified461 Galsiyampalawewa Irrigation Scheme Minor 1.20 DL1b 34.00 0.41 34 7 Disqualified due to less availability of water for crop expansion462 Madukanda Irrigation Scheme Medium 11.10 DL1b 162.00 1.98 162 34 Qualified
Agr
o- e
colo
gy Z
one
Com
man
d A
re (H
a)
Sto
rage
Cap
acity
(MC
M)*
Estimated Max.Possible Crop
Extent (Ha)
Judgment RemarksS/No Province District DS Division Name of Proposed Tank SchemeCategory
Availability of Data
Cat
chm
ent A
rea
(Sq.
km
)

The Preparatory Survey on the P
roject for Improvem
ent of Agricultural P
roduction and Productivity
in Dry Zone A
reas in Dem
ocratic Socialist Republic of Sri Lanka
Final R
eport
T 5-10
Table A
5.1 Screening of the Irrigation Schem
es
Mah
a(Pa
ddy)
Yal
a (O
FC)
463 Mahakachchakodiya Irrigation Scheme Medium 18.60 DL1b 104.00 1.27 104 22 Disqualified due to less availability of water for crop expansion464 Mamaduwa Irrigation Scheme Medium 67.30 DL1b 267.00 3.26 267 56 Disqualified due to less availability of water for crop expansion465 Navatkulam Irrigation Scheme Minor 4.66 DL1b 17.00 0.21 17 12 Disqualified due to less availability of water for crop expansion466 Poomaduwa Irrigation Scheme Minor 4.66 DL1b 37.00 0.45 37 12 Qualified
467 UP Badulla Haliela Irrigation channels -Wathuelpothapallearawa
Minor Data not available
468 Irrigation channels -hethakma suwandalwatta Mahawela Ela
Minor Data not available
469 Irrigation channels -Yahalekembura Ela Minor 1.94 IU3c 5.00 Anicut 5 4 Disqualified due to less availability of water for crop expansion470 Welimada Ahaswewa in Gavarammana Minor Data not available
471 Lift irrigation system to Madorawitagamenwela Tract
Minor Data not available
472 Nedungamuwakiri Uthurana wewa Minor 3.37 IU3d 70.00 0.86 70 112 Qualified473 New tank near Wakadaginna Anicut Minor Data not available474 Thummane Canal Minor Data not available475 Welikandagama to Navaranwatta ella Canal Minor Data not available476 Wewa goda tank (Malpotha) Minor 0.78 IU3d 20.00 0.25 20 32 Qualified477 Meegahakiwla Ambagahawela Canal Data not available478 Balagolla Yapamma Ela Data not available479 Ellanda yatillaara Ela Data not available480 Monaragala Badalkumbura Athala ela Canal system Minor 7.77 IM2b 46.00 Anicut 46 35 Disqualified due to less availability of water for crop expansion481 Ankada Maha Canal (Anicut) Minor 7.77 IM2b 52.00 Anicut 52 39 Qualified482 Hirimale Anicut & Channel system Minor 1.55 IM2b 13.00 Anicut 13 21483 Lunugala yoda Tank Medium 9.07 IM2b 135.00 1.65 135 101 Qualified484 Ulwitta Canal (Hingurukandura) - Anicut Minor 11.66 IM2b 27.00 Anicut 27 20 Qualified485 Madulla Wiharakandiya Tank Minor 0.52 IL1c 14.00 0.17 14 11 Disqualified due to less availability of water for crop expansion486 Dummulagasara Anicut Minor 0.26 IL1c 8.00 Anicut 8 6 Disqualified due to less availability of water for crop expansion487 Ethgalekandura Anicut Minor 0.52 IL1c 16.00 Anicut 16 12 Disqualified due to less availability of water for crop expansion488 Madahelagama anicut Minor 1.04 IL1c 8.00 Anicut 8 6 Disqualified due to less availability of water for crop expansion489 Moragahakumbura Tank Minor 0.78 IL1c 20.00 0.25 20 15 Disqualified due to less availability of water for crop expansion490 Nagahamada Tank Minor 0.52 IL1c 28.00 0.34 28 21 Disqualified due to less availability of water for crop expansion491 Bibile Gurulagolla Canal Minor 1.20 IL1c 14.00 Anicut 14 11 Disqualified due to less availability of water for crop expansion492 Hadduramba Tank Minor 2.07 IL1c 16.00 0.20 16 12 Disqualified due to less availability of water for crop expansion493 Meegaha arawa Tank Medium Data not available494 Paragahalanda Tank Minor 2.07 IL1c 24.00 0.01 1 2 Disqualified due to less availability of water for crop expansion495 Buttala Aragala Tank & Canal System Minor 0.52 IL1c 21.00 0.26 15 8 Disqualified due to less availability of water for crop expansion496 Boileruwa Tank Data not available497 Dambewewa Canal System Minor 1.30 DL1a 20.00 Anicut 20 14 Qualified498 Doowa Anicut & Canal System Minor 0.47 DL1a 11.00 Anicut 11 7 Disqualified due to less availability of water for crop expansion499 Edarugala oya Tank & Canal System Minor 1.30 DL1a 28.00 0.35 28 20 Disqualified due to less availability of water for crop expansion500 Ilupittiya Tank & Canal System Minor 1.04 DL1a 20.00 0.01 1 1 Disqualified due to less availability of water for crop expansion501 Kudagal Amuna Project Medium Data not available502 Mahanaga Project Anicut & Canal Major Data not available503 Milaththagala Tank & Canal Minor Data not available504 Niyadella Anicut & Canal system Minor 0.26 DL1a 51.00 0.62 11 2 Disqualified due to less availability of water for crop expansion505 Paraluwelyaya anicut & canal system Data not available506 Pathigilanda Canal Data not available507 Weerakettiya wewa feeder canal 1.04 DL1a 101.00 1.23 30 16 Disqualified due to less availability of water for crop expansion508 Wellawaya Anicut in Sudupanawela canal to feed Minor Data not available509 Anjaligama Tank Minor Data not available510 Buduruwagala wewa Minor 4.66 DL1a 32.00 0.39 32 32 Qualified511 Naigal Ara Tank Minor 0.52 DL1a 5.00 0.13 9 6 Disqualified due to less availability of water for crop expansion
Judgment RemarksAvailability of Data
Cat
chm
ent A
rea
(Sq.
km
)
Agr
o- e
colo
gy Z
one
Com
man
d A
re (H
a)
Sto
rage
Cap
acity
(MC
M)*
Estimated Max.Possible Crop
Extent (Ha)
S/No Province District DS Division Name of Proposed Tank SchemeCategory

The Preparatory Survey on the P
roject for Improvem
ent of Agricultural P
roduction and Productivity
in Dry Zone A
reas in Dem
ocratic Socialist Republic of Sri Lanka
Final R
eport
T 5-11
Table A
5.1 Screening of the Irrigation Schem
es
Mah
a(Pa
ddy)
Yal
a (O
FC)
512 Pideni Ara Tank Data not available513 Ranawaranawa Tank Data not available514 Manaelgal Tank Data not available515 Pehilla Pottavitta Tank Data not available
516 Feeder canal from Divulgaha kanatha tank toVarunagama senasuma tank (5km)
Data not available
517 Kawantissa Tank Minor Data not available518 Linda ara Tank Minor Data not available519 Randeniya Anicut Minor 1.30 DL1a 25.00 Anicut 25 20 Disqualified due to less availability of water for crop expansion520 Watagala ara - 1 Tank Minor 1.55 DL1a 30.00 0.37 30 23 Disqualified due to less availability of water for crop expansion521 Watagala ara - 2 Minor 0.78 DL1a 2.00 Anicut 2 1 Disqualified due to less availability of water for crop expansion
Moneragala No tannks522 Siyambalanduwa Ambilinna Tank Data not available523 Bamparagale Tank Data not available524 Galbidupitiya Tank Data not available525 Gamagala Tank Data not available526 Karadadara tank Medium 0.52 DL1b 91.00 1.11 21 5 Qualified527 Kiulearawewa & canal system Minor 0.52 DL1b 40.00 Anicut 40 30 Disqualified due to less availability of water for crop expansion528 Una Ena Canal & anicut Data not available529 Warapittiya Tank Minor 1.30 DL1b 32.00 0.39 23 2 Qualified530 Waththedoruwa Anicut Minor 1.55 DL1b 32.00 Anicut 27 3 Qualified
Note:* Storage Capacities of minor tanks are estimated capacities
Agr
o- e
colo
gy Z
one
Com
man
d A
re (H
a)
Sto
rage
Cap
acity
(MC
M)*
Estimated Max.Possible Crop
Extent (Ha)
Judgment RemarksS/No Province District DS Division Name of Proposed Tank SchemeCategory
Availability of Data
Cat
chm
ent A
rea
(Sq.
km
)

The Preparatory Survey on the Project for Improvement of Agricultural Production and Productivity in Dry Zone Areas in Democratic Socialist Republic of Sri Lanka
Final Report
T 5-12
Table A 5.2 Farmer Training Program on Production of Self-seed and Cetified Seed for OFCs and Planting Material for Fruits
Name of Session Objectives Participants Contents
No. of Participants
Executor Time Frame
(1) Quality self -seed production for OFC
At the end of the training program participants will be able to acquire knowledge to produce quality seeds in their farms
Farmers producing seeds for own use and commercial scale producers
1. What is self-seed production
2. Seed production process
3. Factors affecting quality of seeds
4. Important agronomic and post -harvest practices in self seed production.
5. Storage of seeds.
About 30 farmers in each session depending on number of potential farmers in the respective districts
SMOs of the Provincial DOA at district training centers or SMOs of the Central DOA
1day
(2)Certified seed production for OFCs
At the end of the training program the participants will acquire knowledge to produce seeds according to the quality standards for seed certification.
Farmers producing seeds in commercial scale
1. Seed production act
2. Quality standards of seeds.
3. Maintaining quality standards
About 30 farmers in each session depending on number of potential farmers in the respective districts
SMOs of the Provincial DOA at district training centers and/or SMOs of the Seed Certification units in the respective areas.
1day
(3)Quality planting material production for fruits
At the end training program the participants will acquire knowledge and skill on planting material production
Farmers producing planting material in commercial scale
1. Seed and planting material act.
2. Plant propagation systems
3. Budding and grafting (Practical)
4. Plant net houses 5. Plant nursery field
visit
About 28 farmers in each session held at In-service training centers. A total of 9 sessions will be held for 255 potential farmers.
the experts (including SMOs) of fruit tree plant material production
3 days

The Preparatory Survey on the Project for Improvement of Agricultural Production and Productivity in Dry Zone Areas in Democratic Socialist Republic of Sri Lanka
Final Report
T 5-13
Table A 5.3 Farmer Training Program on Farm Management Technology Name of Session Objective Participant Contents No. of
Participants Executer Time Frame
(1)Characters of entrepreneur and successful entrepreneur
At the end of the day participants will be aware of the skills most needed for successful enterprise and be able to make a self -assessment on those skills
Selected farmers in the target development area
1. Sharing knowledge of participants on the entrepreneurial skills needed for successful business.
2. Self assessment on entrepreneurial skills possessed by each participant
3. Importance of acquiring such skills individually to run the farm as a business venture.
Thirty (30) participants in each program
Business persons from private sector and SMOs of Provincial DOA
Half day
At the end of the day participants will be able to describe who is an entrepreneur? And be able to identify the characters of an entrepreneur.
Selected farmers in the target development area
1. Discussion with a successful entrepreneur on the following subjects.
-Why did they start a business?
-How long their business is being carried out?
-How long did they take to get a profit?
-What was the most important thing they did as an entrepreneur?
-What is the most important thing you should be careful as an entrepreneur.
-What are the most important characteristics of an entrepreneur?
-Does risk influence them? Do they take risks?
2. Self-identification of strengths and weaknesses of participants as an entrepreneur.
Thirty (30) participants in each program
Business persons from private sector and SMOs of Provincial DOA
Half day
(2) Analysis of market information and market survey
At the end of the day participants will demonstrate their knowledge on acquiring information from various types of individuals involved in marketing.
Selected farmers in the target development area
Preparation for conducting a simple market survey Conducting a simple market survey
Thirty (30) participants in each program
Business persons from private sector and SMOs of Provincial DOA
Half day
At the end of day the participants will be able to learn the methods to summarize the survey information and present
Selected farmers in the target development area
1. Processing the information
2. Developing Market linkages.
3. Importance of market survey data in planning
Thirty (30) participants in each program
Business persons from private sector and SMOs of Provincial DOA
Half day

The Preparatory Survey on the Project for Improvement of Agricultural Production and Productivity in Dry Zone Areas in Democratic Socialist Republic of Sri Lanka
Final Report
T 5-14
Name of Session Objective Participant Contents No. of
Participants Executer Time Frame
(3) Farm Record keeping
At the end of the day the participants will be able to understand the importance of keeping farm record and will be aware of that there are many types of records.
Selected farmers in the target development area
1. Importance of record keeping.
Thirty (30) participants in each program
Business persons from private sector and SMOs of Provincial DOA
Half day
-Exercise 01
At the end of the day the participants will be able to identify the type of records they should keep and the methodology for continuous record keeping.
Selected farmers in the target development area
1. Production records. 2. Labor reports
Thirty (30) participants in each program
Business persons from private sector and SMOs of Provincial DOA
Half day
-Exercise 02
At the end of the day the participants will have the skill on keeping records regularly.
Selected farmers in the target development area
Income records Financial expenditure records
Thirty (30) participants in each program
Business persons from private sector and SMOs of Provincial DOA
Half day
- Exercise 03
At the end of the day the participants will have the skill on keeping records regularly
Selected farmers in the target development area
1. Domestic consumption records
2. Fixed assets records 3. Upgrading of records
Thirty (30) participants in each program
Business persons from private sector and SMOs of Provincial DOA
Half day
(4) Preparation of farm business plan
At the end of day the participants will be able to prepare a business plan for their respective farms.
Selected farmers in the target development area
Components of farm business plan(Production plan, Marketing plan, Profitability, cash flow, risks)
Thirty (30) participants in each program
Business persons from private sector and SMOs of Provincial DOA
Half day
Participants will be able to identify the main activities and resources needed to implement the business plan.
Selected farmers in the target development area
Requirements to implement a business plan – Physical resources, inputs, labor, market, resource management and risk management.
Thirty (30) participants in each program
Business persons from private sector and SMOs of Provincial DOA
Half day
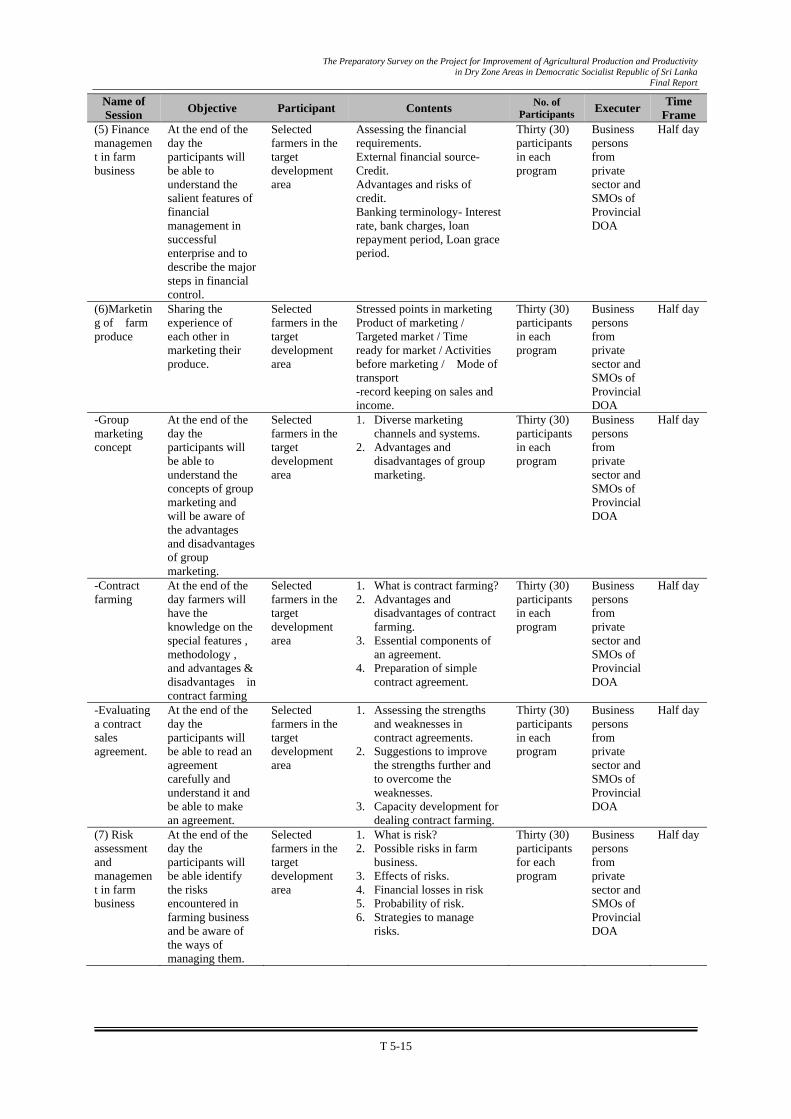
The Preparatory Survey on the Project for Improvement of Agricultural Production and Productivity in Dry Zone Areas in Democratic Socialist Republic of Sri Lanka
Final Report
T 5-15
Name of Session Objective Participant Contents No. of
Participants Executer Time Frame
(5) Finance management in farm business
At the end of the day the participants will be able to understand the salient features of financial management in successful enterprise and to describe the major steps in financial control.
Selected farmers in the target development area
Assessing the financial requirements. External financial source- Credit. Advantages and risks of credit. Banking terminology- Interest rate, bank charges, loan repayment period, Loan grace period.
Thirty (30) participants in each program
Business persons from private sector and SMOs of Provincial DOA
Half day
(6)Marketing of farm produce
Sharing the experience of each other in marketing their produce.
Selected farmers in the target development area
Stressed points in marketing Product of marketing / Targeted market / Time ready for market / Activities before marketing / Mode of transport -record keeping on sales and income.
Thirty (30) participants in each program
Business persons from private sector and SMOs of Provincial DOA
Half day
-Group marketing concept
At the end of the day the participants will be able to understand the concepts of group marketing and will be aware of the advantages and disadvantages of group marketing.
Selected farmers in the target development area
1. Diverse marketing channels and systems.
2. Advantages and disadvantages of group marketing.
Thirty (30) participants in each program
Business persons from private sector and SMOs of Provincial DOA
Half day
-Contract farming
At the end of the day farmers will have the knowledge on the special features , methodology , and advantages & disadvantages in contract farming
Selected farmers in the target development area
1. What is contract farming?2. Advantages and
disadvantages of contract farming.
3. Essential components of an agreement.
4. Preparation of simple contract agreement.
Thirty (30) participants in each program
Business persons from private sector and SMOs of Provincial DOA
Half day
-Evaluating a contract sales agreement.
At the end of the day the participants will be able to read an agreement carefully and understand it and be able to make an agreement.
Selected farmers in the target development area
1. Assessing the strengths and weaknesses in contract agreements.
2. Suggestions to improve the strengths further and to overcome the weaknesses.
3. Capacity development for dealing contract farming.
Thirty (30) participants in each program
Business persons from private sector and SMOs of Provincial DOA
Half day
(7) Risk assessment and management in farm business
At the end of the day the participants will be able identify the risks encountered in farming business and be aware of the ways of managing them.
Selected farmers in the target development area
1. What is risk? 2. Possible risks in farm
business. 3. Effects of risks. 4. Financial losses in risk 5. Probability of risk. 6. Strategies to manage
risks.
Thirty (30) participants for each program
Business persons from private sector and SMOs of Provincial DOA
Half day

The Preparatory Survey on the Project for Improvement of Agricultural Production and Productivity in Dry Zone Areas in Democratic Socialist Republic of Sri Lanka
Final Report
T 5-16
Table A 5.4 Farmer Training Program on Crop Production Technology
Participant Objectives Contents No. Of
Participants Executor Time Frame
OFCs Production Target farmers of strategic OFC crops in DS division
- To increase productivity and production
- To Efficient water use of available sources on crop cultivation
- To improve productivity with appropriate irrigation methods
- To add value of the products for increase income of farming
In and Around Demonstration Farm to be Established 1. Basic cultivation technologies
on chili and red onion 2. Basic cultivation technologies
on big onion and legumes 3. Farm mechanization program 4. Productivity improvement of
available water resource for OFC cultivation
5. Introduction of basic irrigation methods and operation
6. Installation and O&M of micro irrigation
7. Post-harvest handling of OFC crops (legumes/ chili/ onion)
8. Processing black gram flour/ chili powder
Study Tour to Advanced OFC Cultivation Farm(s)
Thirty participants for each program
Subject Matter Officer (SMO) and/or Agriculture Instructor (AI) (External resource trainers would be arranged if necessary)
The program is planned for 7 courses (half-day each) of “OFC cultivation technology”, “Micro Irrigation” and “Value Addition” following to “Farm Management Improvement Program” in the period of 1 crop season (180 days). Program is to be conducted at; 1) Pre-cultivation, 2) Land preparation stage, 3) Planting stage, 4) Flowering stage, 5) Harvesting stage 6) Post-harvest stage 7) Marketing stage In addition, the study tour is conducted in an appropriate timing spending two days.
Fruits Production Target farmers of strategic fruits crops in DS division
- To increase productivity and production
- To Efficient water use of available sources on crop cultivation
- To improve productivity with appropriate irrigation methods
- To add value of the products for increase income of farming
In and Around Demonstration Farm to be Established 1. Basic cultivation technologies
on mango and papaw 2. Basic cultivation technologies
on sweet orange and passion fruits
3. Technical training on pruning for plant establishing and proper fruits setting
4. Productivity improvement of available water resources for fruits cultivation
5. Introduction of basic irrigation methods and operation
6. Installation and O&M of micro irrigation
7. Post-harvest handling of fruits crops
8. Value addition of fruits products
Study Tour to Advanced OFC Cultivation Farm(s)
Thirty participants for each program
Subject Matter Officer (SMO) and/or Agriculture Instructor (AI) (External resource trainers would be arranged if necessary)
The program is planned for 14 courses of “ Fruits cultivation technology”, “Micro Irrigation” and “ Value Addition” following to “Farm Management Improvement Program” Program is to be conducted for about one year at; 1) Planning for cultivation 2) Pre-land preparation 3) Planting stage 4) 3-month after planting 5) 6-month after planting 6) 12-month after planting 7) 18-month after planting 8) 24-month after planting 9) 30-month after planting 10) 36-month after planting 11) 42-month after planting 12) 48-month after planting 13) Harvesting stage 14) Marketing stage In addition, the study tour is conducted in an appropriate timing spending two days.

The Preparatory Survey on the P
roject for Improvem
ent of Agricultural P
roduction and Productivity
in Dry Zone A
reas in Dem
ocratic Socialist Republic of Sri Lanka
Final R
eport
T 5-17
Table A
5.5 N
umber of farm
machineries R
equired for OFC
s Production and Processing
For Legume Cultivation For Pulse Splitting and Cleaning Machines For Pulses and Chili Grinding
Total LegumesExtent
ManualHighlandSeeder
Highlandweeder
RidgerGroundnut
ExtentGroundnut
DecorticatingTotal Pulse
ExtentPulse Splitting
MachinePulse Cleaning
MachineTotal Pulses
and Chili ExtentGrindingMachine
(ha) (No.) a/ (No.) a/ (No.) a/ (ha) (No.) a/ (ha) (No.) a/ (No.) a/ (ha) b/ (No.) a/CZ-1 Mannar 0 0 0 0 0 0 0 0 0 200 10
Mulathiv 640 32 32 16 90 5 230 12 12 1,400 70Vavnia 0 0 0 0 0 0 0 0 0 180 9Trincomalee 300 15 15 8 40 2 110 6 6 170 9Sub total 940 47 47 24 130 7 340 18 18 1,950 98
CZ-2 Ampara 120 6 6 3 15 1 40 2 2 40 2Batcaloa 330 17 17 8 45 2 120 6 6 220 11Anuradapura 20 1 1 1 0 0 10 1 1 790 40Mahaweli H 5,270 264 264 132 730 37 1,900 95 95 3,550 178Sub total 5,740 288 288 144 790 40 2,070 104 104 4,600 231
CZ-3 Kurunegala 40 2 2 1 5 0 15 1 1 80 4Puttalam 510 26 26 13 70 4 185 9 9 620 31Sub total 550 28 28 14 75 4 200 10 10 700 35
CZ-4 Badulla 0 0 0 0 0 0 0 0 0 120 6Monaragala 90 5 5 2 10 1 30 2 2 540 27Sub total 90 5 5 2 10 1 30 2 2 660 33
Total 7,320 368 368 184 1,005 52 2,640 134 134 7,910 397Note a/: Number of machineries required is estimated based on the following assumptions:
- Manual highland seeder; about 5% of total legumes extent- Highland weeder; about 5% of total legumes extent- Ridger; about 2.5% of total legumes extent- Groundnut decorticating machine; about 5.0% of groundnut extent- Pulse splitting machine; about 5.0% of total pulse extent- Pulse cleaning machine; about 5.0% of total pulse extent- Grinding machine; about 5.0% of total pulse and chili extent
b/: Pulses consist of cowpea, blackgram and greengram (groundnut and soybean are excluded.).Source: JICA Survey Team
Zone District
For Groundnut DecorticatingMachine

The Preparatory Survey on the P
roject for Improvem
ent of Agricultural P
roduction and Productivity
in Dry Zone A
reas in Dem
ocratic Socialist Republic of Sri Lanka
Final R
eport
T 5-18
Table A
5.6 E
stimate of B
arbed Wire Fence R
equirement by D
istricts and Zones
Fence for Agro Well Area Fence for Surface Irrigation Area
Zone District Develop-ment Area
RequiredLength per
Ha a/Sub-total Develop
-ment Area
No. ofTracks
(Tertiaries)b/
RequiredLength per
10 HaSub-total
CalculatedTotal
Amount
AssumedTotal
Requirement c/
(ha) (km/ha) (km) (ha) (No.) (km/10 ha) (km) (km) (km)CZ-1 Mannar 210 0.40 84 220 22.0 1.265 28 112 56
Mualthive 60 0.40 24 1,920 192.0 1.265 243 267 133Vavnia 260 0.40 104 240 24.0 1.265 30 134 67Trincomalee 660 0.40 264 430 43.0 1.265 54 318 159Sub-total 1,190 0.40 476 2,810 281.0 1.265 355 831 416
CZ-2 Ampara 150 0.40 60 120 12.0 1.265 15 75 38Batticaloa 190 0.40 76 340 34.0 1.265 43 119 60Anuradapura 1,050 0.40 420 440 44.0 1.265 56 476 238System H 100 0.40 40 8,150 815.0 1.265 1,031 1,071 535Sub-total 1,490 0.40 596 9,050 905.0 1.265 1,145 1,741 870
CZ-3 Kurunegala 970 0.40 388 90 9.0 1.265 11 399 200Puttalam 290 0.40 116 1,190 119.0 1.265 151 267 133Sub-total 1,260 0.40 504 1,280 128.0 1.265 162 666 333
CZ-4 Badulla 540 0.40 216 90 9.0 1.265 11 227 114Monaragala 990 0.40 396 180 18.0 1.265 23 419 209Sub-total 1,530 0.40 612 270 27.0 1.265 34 646 323
5,470 0.40 2,188 13,410 1,341.0 1.265 1,696 3,884 1,942Note a/: Assumed that each unit area of 1.0 ha (400m) is fenced with barbed wire
b/: Assumed that each track area (tertiary block) of 10 ha (1,265 m) is fenced with barbed wirec/: Assumed that actual total requirement is to be 50% of the calculated amount.
Source: JICA Survey Team
Total

The Preparatory Survey on the Project for Improvement of Agricultural Production and Productivity in Dry Zone Areas in Democratic Socialist Republic of Sri Lanka
Final Report
T 5-19
Table A 5.7 Estimate of Electric Fence (EF) Requirement by Districts and Zones
Zone District DS Division Which Requires EF a/ Total Length of Electric Fence
(Km) CZ-1 Mannar - 0
Mualthive - 0 Vavnia - 0 Trincomalee Kuchchaweli 30 Trincomalee Morawewa 30 Sub-total 60
CZ-2 Ampara Padiyathalawa 30 Mahaoya 30
Batticaloa - 0 Anuradapura Horowpathana 30 Kahatagasdigiliya 30 Mahawilachchiya 30 Thirappane 30 System H - 0
Sub-total 180 CZ-3 Kurunegala Galgamuwa 30
Giribawa 30 Ambanpola 30 Kotawehera 30 Polpithigama 30 Nikaweratiya 30
Puttalam Karuwalagaswewa 30 Nawagattegama 30 Anamaduwa 30 Mahakumbukkadawala 30
Sub-total 300 CZ-4 Badulla - 0
Monaragala Siyabalanduwa 30 Sub-total 30 Total 570 Note a/:30 km of electric fence will be provided to DS division where elephant damage frequently occurs.Source: JICA Survey Team

The Preparatory Survey on the Project for Improvement of Agricultural Production and Productivity in Dry Zone Areas in Democratic Socialist Republic of Sri Lanka
Final Report
T 5-20
Table A 5.8 Number of Farmers Whose Storage Facilities are Needed to be Improved
Zone District
No. of Red & Big Onion Farmers for Storage Improvement
No. of Chili & Legume Farmers for Storage Improvement
Target Development
Area
Estimated No. of
Farmers a/
Farmers for Improvement
of Storage Facilities b/
Target Development
Area
Estimated No. of
Farmers c/
Farmers for Improvement
of Storage Facilities d/
(ha) (No.) (No.) (ha) (No.) (No.)
CZ-1 Mannar 140 230 115 200 328 66 Mulathiv 150 246 123 1,810 2,967 593 Vavnia 300 492 246 180 295 59 Trincomalee 610 1,000 500 360 590 118 Sub total 1,200 1,967 984 2,550 4,180 836
CZ-2 Ampara 0 0 0 120 197 39 Batcaloa 0 0 0 430 705 141 Anuradapura 210 344 172 800 1,311 262 Mahaweli H 1,230 2,016 1,008 6,920 11,344 2,269 Sub total 1,440 2,361 1,180 8,270 13,557 2,711
CZ-3 Kurunegala 90 148 74 110 180 36 Puttalam 70 115 57 950 1,557 311 Sub total 160 262 131 1,060 1,738 348
CZ-4 Badulla 370 607 303 120 197 39 Monaragala 0 0 0 600 984 197 Sub total 370 607 303 720 1,180 236
Total 3,170 5,197 2,598 12,600 20,656 4,131 Note a/: Average farm size of 0.61 ha per farm household is applied in the estimate.
b/: Assumed that 50% of farmers will need to improve the storage facilities. c/: Average farm size of 0.61 ha per farm household is applied in the estimate. d/: Assumed that 20% of farmers will need to improve the storage facilities.
Source: JICA Survey Team

The Preparatory Survey on the Project for Improvement of Agricultural Production and Productivity in Dry Zone Areas in Democratic Socialist Republic of Sri Lanka
Final Report
T 5-21
Table A 5.9 Training of Trainers Program on Farm Management Improvement
Program Participant Objectives Contents No. of Participants Executor Time
FrameTOT on farm management improvement
SMO, AI, FA of MASL who will take charge of farmer training at DS level
- Fostering trainers for conducting training program of “Farm Management Improvement”
- Trained field extension staffs are to conduct field training of “Farm Management Improvement” training program and “Improvement of Crop Productivity, Production”, “ Micro Irrigation and “Value Addition” in the field
- Characters entrepreneur and successful entrepreneur
- Analysis of market information and market survey
- Farm Record keeping - Preparation of farm
business plan - Finance management in
farm business - Marketing of farm
produce (group marketing/contract farming/evaluation)
- Risk assessment and management in farm business
Thirty (30) participants for each session of program Total number will be 180, 3 extension officers from 54 DS divisions and 6 areas of Mahaweli System “H”
DOA (central) with private sector assistance at ISTCs
14 days

The Preparatory Survey on the Project for Improvement of Agricultural Production and Productivity in Dry Zone Areas in Democratic Socialist Republic of Sri Lanka
Final Report
T 5-22
Table A 5.10 Training of Trainers Program on Crop Production Improvement Program Participant Objectives Contents No. of
Participants Executor Time Frame
Enhancement of crop (OFC) production through advanced agricultural practices
SMO, AI, FA of MASL who will take charge of farmer training at DS level
Capacity development of front line extension staff (Agricultural instructors/Field Assistants) on advance agricultural technology to disseminate among OFC growing farmers.
- Potential and actual yield gap
- New OFC crop varieties and their special characters.
- Good agronomic practices in OFC cultivation
- Integrated Plant Nutrient Management (IPNS) in OFC cultivation.
- Integrated Pest Management (IPM) in OFC cultivation.
- Organic farming of OFC for Nish markets.
- Pre harvest practices and quality of produce.
- Sandwich crop cultivation
Thirty (30) participants for each session of program Total number will be 180, 3 extension officers from 54 DS divisions and 6 areas of Mahaweli System “H”
DOA (central) with private sector assistance at ISTCs
3 days
Promotion of Fruit production for export market.
SMO, AI, FA of MASL who will take charge of farmer training at DS level
Capacity development of front line extension staff (Agricultural instructors/Field Assistants) on advance agricultural technology (with special emphasis on export) to disseminate among fruit growing farmers.
- Export demand for fruits - Production factors for
export market - Orchard type fruit
cultivation (establishment and management)
- Pruning, training and other essentials in fruit crop cultivation.
- Induced blooming and fruiting in fruit crop cultivation.
- Pre and post- harvest practices for production of quality fruits.
- Organic farming of fruits for Nish markets.
- Inter cropping in fruit cultivation.
Thirty (30) participants for each session of program Total number will be 180, 3 extension officers from 54 DS divisions and 6 areas of Mahaweli System “H”
DOA (central) with private sector assistance at ISTCs
3 days
Productivity Improvement of available water resources for cultivation
SMO, AI, FA of MASL who will take charge of farmer training at DS level
Agriculture Instructors will gather necessary knowledge and skills to assist farmers to manage available water resources to maximize crop yield.
- Global scarcity of water and its value.
- Soil/plant water relationship
- Crop water requirement - On farm water
management - Micro irrigation - Soil moisture conservation- Use of Agro Wells for
cultivation - Agricultural drainage for
soil conservation and enhanced production.
Thirty (30) participants for each session of program Total number will be 180, 3 extension officers from 54 DS divisions and 6 areas of Mahaweli System “H”
DOA (central) with private sector assistance at ISTCs
3 days

The Preparatory Survey on the Project for Improvement of Agricultural Production and Productivity in Dry Zone Areas in Democratic Socialist Republic of Sri Lanka
Final Report
T 5-23
Program Participant Objectives Contents No. of Participants Executor Time
Frame Training as a function of management and process of technology transfer
SMO, AI, FA of MASL who will take charge of farmer training at DS level
The participants will enhance and refresh their knowledge and skill on planning, implementation, monitoring and evaluation of training and thus carry out the training function to the set standard.
- Introduction to Training (history of training and definitions, use of training, advantageous etc)
- Training Need Assessment (problem identification, identification of target group, gap between existing level and expected level of Knowledge, Attitude and Skill
- Setting training objectives (program objective, course objective, lesson objective, etc.)
- Subject Analysis - Training methods and
materials. - Preparation of lesson plans
and manuals - Room arrangement for
different training programs- Conduct training - Monitoring and evaluation of
training - Use of training equipment
(OHP, Multimedia, Flipcharts, etc.
- Factors to be considered in conducting training
- Role of a trainer and a training manager
Thirty (30) participants for each session of program Total number will be 180, 3 extension officers from 54 DS divisions and 6 areas of Mahaweli System “H”
DOA (central) with private sector assistance at ISTCs
5 days
Exposure visits for sharing experience of best agricultural practices
SMO, AI, FA of MASL who will take charge of farmer training at DS level
The main objective of the visits is to make the relevant officers exposed in the area of advanced agriculture to facilitate the dissemination of technology among farmers.
- Agricultural production process from planning to marketing
- Observation of best agricultural practices adopted by farmers
- Comparison of traditional practices and best practices
- Economical advantageous of the best practices adopted
- Management of problems and risks
- Record keeping - Means of acquisition of
technology
Thirty (30) participants for each session of program Total number will be 180, 3 extension officers from 54 DS divisions and 6 areas of Mahaweli System “H”
DOA (central) with private sector assistance at ISTCs
3 days

The Preparatory Survey on the Project for Improvement of Agricultural Production and Productivity in Dry Zone Areas in Democratic Socialist Republic of Sri Lanka
Final Report
T 5-24
Table A 5.11 Outline of Training on Feeding Improvement. Name of Program Objective Participant Contents No. of
Participants Executor Time frame
Production of micro silage
To acquire knowledge to improve the keeping quality and maintain nutritive value of grass and fodder
Dairy farmers
1. Basics on ruminant nutrition
2. Feeds and feeding3. Principles of
silage making 4. Practical silage
making
Twenty (20) participants of each program
Subject matter specialists of the provincial DAPH
1 day
Production planning, financial and operational management of crop residue usage
To acquire knowledge to utilize crop residue as a feed
Dairy and crop farmers
1. Basics on ruminant nutrition
2. Feeds and feeding3. Economic value
of crop residue 4. Basic processing
of crop residue
Twenty (20) participants of each program
Subject matter specialists of the provincial DAPH
1 day
Awareness and utilization of crop residue
To acquire knowledge to utilize crop residue as an enterprise
Dairy and crop farmers and investors
1. Equipment and machinery used in processing
2. Basic knowledge on processing machinery
3. Collection of crop residue
4. Storage and packaging
5. Economics of processing
Twenty (20) participants of each program
Subject matter specialists of the provincial DAPH
1 day
Technical training on products from crop residue
To acquire knowledge to improve the nutritive quality of crop residues for ruminant feeding
Dairy and crop farmers and investors
1. Equipment and machinery used in processing
2. Ration formulation
3. Processing of crop residue to feed ruminants
4. Labeling and basic advertising
5. Packaging and marketing
6. Operational and financial planning
7. Project planning
Twenty (20) participants of each program
Subject matter specialists of the provincial DAPH
1 day
Processing and marketing crop residue as an enterprise
To acquire knowledge to utilize crop residue as an enterprise
Dairy and crop farmers and investors
1. equipment and machinery used in processing
2. Basic knowledge on processing machinery
3. Collection of crop residue
4. Storage and packaging
5. Economics of processing
Twenty participants of each program
Subject matter specialists of the provincial DAPH
1 day

The Preparatory Survey on the Project for Improvement of Agricultural Production and Productivity in Dry Zone Areas in Democratic Socialist Republic of Sri Lanka
Final Report
T 5-25
Table A 5.12 Outline of Training on Clean Milk Production and Market Network Development Name of Program
Objective Participant Contents No. of Participants
Executor Time frame
Clean Milk Production
At the end of the training program participants will be able to acquire knowledge to reduce economic losses due to the spoilage of milk on the farm
Farmers producing milk to supply milk collecting network
1. Characteristics of clean milk.
2. Sources of milk contamination
3. Conditions for clean milk production
4. Milk preservation on farm
5. Good milking procedure
6. Use of appropriate equipment
7. Practical exercise on hand milking and mastitis control
8. Personal hygiene
20 Subject matter specialists of the provincial DAPH
1 day
Operation and maintenance of UHT processing plant
At the end of the training program participants will be able to acquire knowledge to operate and maintain a UHT processing plant
Semi-skilled operators in milk processing units
1. Familiarization of the UHT plant
2. Basic requirements to operate the plant.
3. Hygienic standards of operation
4. Trouble shooting 5. Basic maintenance
of plant 6. Personal hygiene
5 Training should be provided by the supplier of the UHT plant
3 days
Establishment of effective milk collection network
At the end of the training program participants will be able to acquire knowledge to maintain the quality of milk throughout the collection and disposal process
Milk collectors from farmers
1. Factors affecting the quality of milk before and after transportation
2. Hygienic cleaning and sanitation procedure
3. Personal hygiene 4. Basic quality
control techniques5. Guidelines to
maintain quality of milk
20 Subject matter specialists of the provincial DAPH or Health depatment
1 day
Market Planning and entrepreneurship development
At the end of the training program participants will be able to acquire knowledge to run a successful milk vending trade
Milk vendors 1. Maintaining quality of milk
2. Personal hygiene 3. Good hygienic
practices 4. Record keeping 5. Establishing key
market information
6. Development of a market plan
7. Organizational and financial plan
8. Regulations and standards.
20 Subject matter specialists of the provincial DAPH or Health department
1 day
Source: JICA Survey Team

The Preparatory Survey on the Project for Improvement of Agricultural Production and Productivity in Dry Zone Areas in Democratic Socialist Republic of Sri Lanka
Final Report
T 5-26
Table A 5.13 List of Prescribed Projects to be required to carry out IEE/EIA No. Type of project Detailed criteria
Part I Projects and undertaking if located wholly or partly outside the coastal zone as defined by Coast conservation Act No.57 of 1981 1 All river basin development and irrigation projects excluding minor irrigation works
If command area is more than 1,000 acre (404.6 ha) Major irrigation scheme If command area is more than 200 acre (80.9 ha) and less than 1,000 acre (404.6 ha) Medium irrigation scheme If command are is less than 200 acre (80.9 ha) Minor irrigation scheme
2 Reclamation of land, wetland area exceeding 4 hectares 3 Extraction of timber covering land area exceeding 5 hectares 4 Conversion of forest covering an area exceeding 1 hectare into non-forest uses 5 Clearing of land areas exceeding 50 hectares 6 Mining and Mineral Extraction Inland deep mining and mineral extraction involving a depth exceeding 25 meters
Inland surface mining of cumulative areas exceeding 10 hectares All off shore mining and mineral extractions Mechanized mining and quarrying operations of aggregate, marble, limestone,
silica, quarts and decorative stone within 1 kilometer of any residential or commercial areas
7 Transportation systems Construction of national and provincial highway involving a length exceeding 10 kilometers
Construction of railway lines Construction of airports Construction of airstrips Expansion of airports or airstrips that increase capacity by 50 percent or more
8 Port and harbour development Construction of ports Construction of harbours Port expansion involving an annual increase of 50% or more in handling capacity
per annum
9 Power generation and transmission
Construction of hydroelectric power stations exceeding 50 Megawatts Construction of thermal power plants having generation capacity exceeding 25
Megawatts at a single location or capacity addition exceeding 25 Megawatts to existing plants
Construction of nuclear power plants All renewable energy based electricity generating stations exceeding 50
Megawatts
10 Transmission lines Installation of overhead transmission lines of length exceeding 10 kilometers and voltage above 50 kilovolts
11 Housing and building Integrated multi-development activities consisting of housing, industry, commercial infrastructure covering a land area exceeding 10 hectares
12 Resettlement Involuntary resettlement exceeding 100 families other than resettlement effected under emergency situations
13 Water supply All ground water extraction projects of capacity exceeding ½ million cubic meters per day
Construction of water treatment plants of capacity exceeding ½ million cubic meters
14 Pipelines Laying of gas and liquid (excluding water) transfer pipelines of length exceeding 1 kilometer
15 Hotels Construction of hotels or holiday resorts or projects which provide recreational facilities exceeding 99 rooms or 40 hectares, as the case may be
16 Fisheries Aquaculture development projects of extent exceeding 4 hectares Construction of fisheries harbours Fisheries harbour expansion projects involving an increase of 50% or more in fish
handling capacity per annum
17 All tunneling projects 18 Disposal of waste Construction of any solid waste disposal facility having a capacity exceeding 100
tons per day Construction of waste treatment plants treating toxic or hazardous waste

The Preparatory Survey on the Project for Improvement of Agricultural Production and Productivity in Dry Zone Areas in Democratic Socialist Republic of Sri Lanka
Final Report
T 5-27
No. Type of project Detailed criteria 19 Development of all Industrial Estates and Parks exceeding an area of 10 hectares 20 Iron and Steel Industries Manufacture of iron and steel products of production capacity exceeding 100 tons
per day using iron are as raw material Manufacture of iron and steel products of production capacity exceeding 100 tons
per day using scrap iron ore as raw material 21 Non-Ferrous Basic Metal
Industries Smelting of aluminum or copper or lead of production capacity exceeding 25 tons
per day 22 Basic Industrial Chemicals Formulation of toxic chemicals of production capacity exceeding 50 tons per day
Manufacture of toxic chemicals of production capacity exceeding 25 tons per day
23 Pesticides and Fertilizers Formulation of pesticides of combined production capacity exceeding 50 tons per day
Manufacture of pesticides of combined production capacity exceeding 25 tons per day
24 Petroleum and Petrochemical Petroleum refineries producing gasoline, fuel oils, illuminating oils, lubricating oils and grease, aviation and marine fuel and liquefied petroleum gas from crude petroleum
Manufacture of petro-chemicals of combined production capacity exceeding 100 tons per day from production processes of oil refinery or natural gas separation
25 Tyre and Tube Industries Manufacture of tyre and tubes of combined production capacity exceeding 100 tons per day form natural or synthetic rubber
26 Sugar factories Manufacture of refined sugar of combined production capacity exceeding 50 tons per day
27 Cement and Lime Manufacture of Cement through production of clinker Manufacture of lime employing kiln capacity exceeding 50 tons per day
28 Paper and Pulp Manufacture of paper or pulp of combined production capacity exceeding 50 tons per day
29 Spinning, Weaving and Finishing of Textiles
Integrated cotton or synthetic textile mills employing spinning, weaving, dyeing and printing operations together of combined production capacity exceeding 50 tons per day
30 Tanneries and Leather Finishing
Chrome tanneries of combined production capacity exceeding 25 tons per day Vegetable (bark) of combined production capacity exceeding 50 tons per day
31 Industries which involved the manufacture, storage or use of Radio Active Materials as defined in the Atomic Energy Authority Act No. 19 of 1969 or Explosives as defined in the Explosives Act No. 21 of 1956, excluding for national security reasons
Part II 32 All projects and undertaking listed in Part I irrespective of their magnitudes and irrespective of whether they are
located in the coastal zone or not, if located wholly or partly within the areas specified in Part III of the Schedule. 32 (a)
Constructions of all commercial buildings as defined by the Urban Development Authority Law, No.41 of 1978 and the construction of dwelling housing units, irrespectively of heir magnitudes and irrespective of whether they are located in the coastal zone or not, if located wholly or partially within the areas specified in Part III of this schedule.
33 Iron and Steel 34 Non-Ferrous Basic Metal 35 Basic Industrial Chemicals 36 Pesticides and Fertilizers 37 Synthetic Resins, Plastic materials and Man-made fibers 38 Other Chemical Products 39 Petroleum and Petro-chemical Products 40 Tyres and Tubes 41 Manufacturing and Refining of Sugar 42 Alcoholic Spirits 43 Malt Liquors and Malt 44 Cement, clinker and Lime 45 Non-metallic Mineral Products 46 Papers, Pulp and Paperboard 47 Spinning, Weaving and Finishing of Textile 48 Tanneries and Leather finishing

The Preparatory Survey on the Project for Improvement of Agricultural Production and Productivity in Dry Zone Areas in Democratic Socialist Republic of Sri Lanka
Final Report
T 5-28
No. Type of project Detailed criteria 49 Shipbuilding and Repairs 50 Railroad Equipment 51 Motor Vehicles 52 Air Craft Part III 1 Within 100m from the boundaries of or within any area declared under the National Heritage Wilderness Act No.3 of
1988, the Forest Ordinance (Chapter 451); whether or not such area are wholly or partly within the Coastal Zone: 2 Within the following area whether or not the areas are wholly or partly within the Coastal Zone:
Any erodible are declared under the Soil Conservation Act (Chapter 540) Any Flood Area declared under the Flood Protection Ordinance (Chapter 449) and any flood protection area declared
under the Sri Lanka Land Reclamation and Development Corporation Act No.15 of 1968 as amended by Act No.52 of 1982.
60 meters from the bank of a public stream as defined in the Crown Lands Ordinance (Chapter 454) and having a width of more than 25 meters at any point if it course.
Any reservation beyond the full supply level of a reservoir Any archaeological reserve, ancient or protected monument as defined or declared under the Antiquities Ordinance
(Chapter 188) Any area declared under the Botanic Gardens Ordinance (Chapter 446) Within 100 meters from the high flood level contour of within a public lake as defined in the Crown Lands Ordinance
(Chapter 454) including those declared under section 71 of the said Ordinance Source: http://www.cea.lk/Prescribed_Projects.php (Sited 2012/08/15)
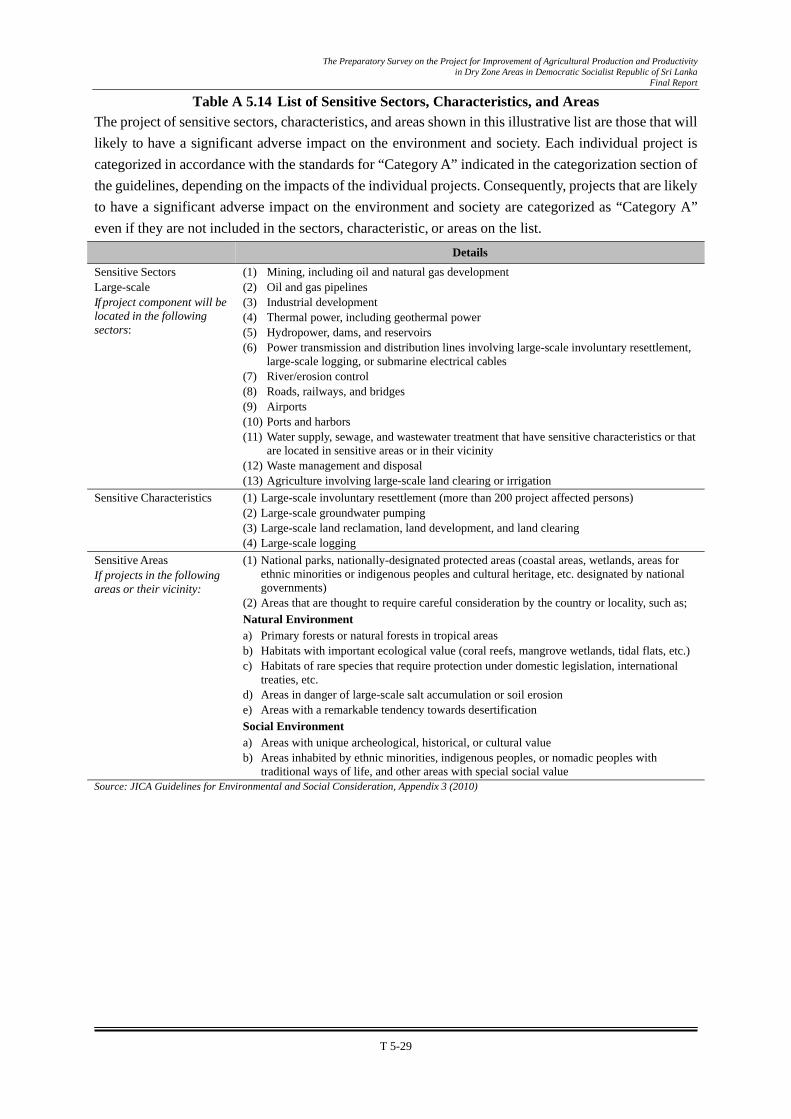
The Preparatory Survey on the Project for Improvement of Agricultural Production and Productivity in Dry Zone Areas in Democratic Socialist Republic of Sri Lanka
Final Report
T 5-29
Table A 5.14 List of Sensitive Sectors, Characteristics, and Areas The project of sensitive sectors, characteristics, and areas shown in this illustrative list are those that will likely to have a significant adverse impact on the environment and society. Each individual project is categorized in accordance with the standards for “Category A” indicated in the categorization section of the guidelines, depending on the impacts of the individual projects. Consequently, projects that are likely to have a significant adverse impact on the environment and society are categorized as “Category A” even if they are not included in the sectors, characteristic, or areas on the list.
Details Sensitive Sectors Large-scale If project component will be located in the following sectors:
(1) Mining, including oil and natural gas development (2) Oil and gas pipelines (3) Industrial development (4) Thermal power, including geothermal power (5) Hydropower, dams, and reservoirs (6) Power transmission and distribution lines involving large-scale involuntary resettlement,
large-scale logging, or submarine electrical cables (7) River/erosion control (8) Roads, railways, and bridges (9) Airports (10) Ports and harbors (11) Water supply, sewage, and wastewater treatment that have sensitive characteristics or that
are located in sensitive areas or in their vicinity (12) Waste management and disposal (13) Agriculture involving large-scale land clearing or irrigation
Sensitive Characteristics (1) Large-scale involuntary resettlement (more than 200 project affected persons) (2) Large-scale groundwater pumping (3) Large-scale land reclamation, land development, and land clearing (4) Large-scale logging
Sensitive Areas If projects in the following areas or their vicinity:
(1) National parks, nationally-designated protected areas (coastal areas, wetlands, areas for ethnic minorities or indigenous peoples and cultural heritage, etc. designated by national governments)
(2) Areas that are thought to require careful consideration by the country or locality, such as; Natural Environment a) Primary forests or natural forests in tropical areas b) Habitats with important ecological value (coral reefs, mangrove wetlands, tidal flats, etc.) c) Habitats of rare species that require protection under domestic legislation, international
treaties, etc. d) Areas in danger of large-scale salt accumulation or soil erosion e) Areas with a remarkable tendency towards desertification Social Environment a) Areas with unique archeological, historical, or cultural value b) Areas inhabited by ethnic minorities, indigenous peoples, or nomadic peoples with
traditional ways of life, and other areas with special social value Source: JICA Guidelines for Environmental and Social Consideration, Appendix 3 (2010)

The Preparatory Survey on the Project for Improvement of Agricultural Production and Productivity in Dry Zone Areas in Democratic Socialist Republic of Sri Lanka
Final Report
T 5-30
Table A 5.15 Check list of Environmental and Social Management System No. Questions Answer Improvement Plan
1. Policy (1) Does the executing agency have any
formal environmental policy or procedures? If yes, please describe them and provide appropriate documentation. If no, does the executing agency have any plan to set such policy or procedures?
Ministry of Economic Development as executing agency of this project does not have formal environmental policy or procedures. There is no plan to set such policy or procedures.
Improvement Plan is not required. National Environment Act (NEA) and its related regulations define the procedures for environment and social considerations in Sri Lanka. Existing CEA procedure is the regulatory framework to ensure the environment and social safeguard of Sri Lanka
(2) Are there any types of projects in which the executing agency will not take part due to the environmental risks? (e.g., projects involving handling of hazardous wastes or endangered plants or animals).
The Ministry of Economic Development does not reject project due to the environmental risk. Under the CEA procedure, projects with high environment and social risk will be rejected or will propose alternatives or mitigation measures in the Environmental Management Plan prepared for each project/activity.
Improvement plan is not required. Under the CEA procedures, specific and careful attention will be paid for project within sensitive area with respective ministries and departments. Project with high risk for environment is screened through CEA procedures.
2. Procedures (3) Does the executing agency have any
environmental procedures such as screening, categorization and environmental review? If yes, please describe.
Ministry of Economic Development does not have environmental procedures. However, the Central Environmental Authority (CEA) acts as the main regulatory body for environment and social management in Sri Lanka. All project proponents (executing agency or implementing agency) must carry out the procedures established by the National Environment Act. In the procedure, there is screening, categorization and environmental review.
JICA Survey Team proposed a procedure for screening, categorization and environmental review to ensure that selected project component will not be categorized as Category A according to the JICA Guidelines. JICA Survey Team prepared a format of environmental and social screening to be filled out during preparation of project initial concept report by project implementing agency, and to be submitted to the PMU.
(4) Please describe how the executive agency ensures that your subproject companies and their subprojects are operated in compliance with the national laws and regulations and applicable JICA’s requirements.
In the foreign funded projects, the Ministry of Economic Development appoints local environmental consultants for each project (designing/ planning and implementation phases). Project implementing unit (PIU) submits environmental status and monitoring reports to the Ministry upon implementing EMP on identified projects for environmental risks/impacts.
JICA Survey Team proposed to establish an ESMS under the Ministry of Economic Development for this project.
3. Organization and Staff (5) Please provide us with the
organization chart of the executing agency’s Environmental and Social Management System (ESMS).
There is not existing ESMS in the Ministry of Economic Development.
JICA Survey Team proposed a provisional ESMS for this project based on the Sri Lanka experience and practice.
(6) Who is responsible for environmental and social management within the executing agency? (name/role and title)
At the moment, there is no such position or person on environmental and social management in the projects which they have undertaken. Their regular practice is to appoint a local environmental consultant under the Ministry of Economic Development in short term basis and he/she will report the Ministry about the status and issues with respect to environmental and social considerations.
JICA Survey Team proposes a position of environmental and social management staff in the ESMS Coordination Committee under the Ministry of Economic Development during this project period.

The Preparatory Survey on the Project for Improvement of Agricultural Production and Productivity in Dry Zone Areas in Democratic Socialist Republic of Sri Lanka
Final Report
T 5-31
No. Questions Answer Improvement Plan(7) Are there any staff with training for
environmental and social considerations in the executing agency? If so, describe.
There is not staff with training for environmental and social considerations in the Ministry of Economic Development. The Ministry appoints for short term local environmental consultant if necessary. There is an Environment System Monitoring (ESM) officer within the MED to supervise the local environmental consultants in each project team.
JICA Survey Team proposes a position of environmental and social management staff under the MED during for this project period. The staff should be experienced and qualified.
(8) Are there any technical staff with an engineering/industry background responsible for technical analysis of credit proposals?
MED does not have technical expertise in each sector. The analysis of proposals is done through a steering committee. A steering committee will be formed with relevant ministry and agencies included Ministry of Finance and National Planning.
JICA Survey Team proposed to establish Project Management Unit under the MED. Technical staff for analysis of credit proposals will be in the PMU.
(9) What experience, if any, does the executing agency have of hiring or dealing with environmental consultants?
MED hires environmental consultant when their project required to carry out IEE/EIA and monitoring of EMP.
Improvement plan is not required.
(10) What was the budget allocated to the ESMS and its implementation during a year? Please provide budget details including staff costs and training as well as any actual costs.
There is not ESMS in the Ministry of Economic Development.
JICA will confirm that the MED allocates budget for newly established ESMS for this project.
4. Monitoring and Reporting (11) Does the executing agency receive
environmental and social monitoring reports from subproject companies that the executing agency finances?
The common practice of the MED is to appoint environmental specialists (local consultant) under respective implementing agency. According to the EMP and its monitoring plan defined in the IEE/EIA report, an Environmental Monitoring Committee (EMC) will be set up for each project. The appointed environmental specialist is responsible on monitoring the activities as stated in EMP through an EMC. EMC produce timely progress reports on their monitoring out comes and report to the respective environmental specialist their observation in relation to the duly activation of EMP by the appointed contractor/agency. The ESM officer at MED will be aware about the environmental status through the appointed environmental consultant through timely progress reports. ESM officer at MED discusses the issues identified from progress reports if any at their steering committee and find solutions. In addition, EMD has experiences of preparing an EMP monitoring manual by an expert appointed through the EMD, in the case of the World Bank funded project.
Improvement plan is not required.
(12)
Please describe how the executing agency monitors the subproject implementing agency and their subprojects social and environmental performance.
(13) Is there an internal process to report on social and environmental issues to senior management?
No. Improvement plan is not required.

The Preparatory Survey on the Project for Improvement of Agricultural Production and Productivity in Dry Zone Areas in Democratic Socialist Republic of Sri Lanka
Final Report
T 5-32
No. Questions Answer Improvement Plan(14) Do you prepare any social and
environmental reports: - For other multilateral agencies or other stake holders - E&S reporting in the Annual Report
No. According to the Ministry’s experience, the implementing agency is responsible for preparing and submitting progress report of environmental and social monitoring and the report is checked by ESM officer of EMD. If there are any important environmental and social issues identified in the report, those will be discussed at the steering committee meeting.
JICA Survey Team prepared a format of Annual Environmental and Social Performance Report to JICA to be filled out by the ESMS specialist of ESMS Coordination Committee under the MED.
5. Experience (15) Has the executing agency signed any
national or international agreements or declarations concerning environmental issues?
No. No improvement plan is required since the CEA is the main regulatory body for environmental issues in Sri Lanka.
(16) Has the executing agency ever received any criticism of its environmental record? If so, what was the criticism?
Ministry of Economic Development has been acted as executing agency of sector loan projects funded by World Bank and ADB, and the MED had been managed to safeguard environmental and social considerations with no any criticism through a ESMS established in the regional level as explained above through an appointed consultant environmentalist on project basis with close coordination and communication with CEA as required.
No improvement plan is required.
(17) Does the executing agency carry out environmental audits of its properties to analyze health and safety issues, waste disposal, etc.?
No. Under CEA procedures, the mentioned issues are always taken in consideration as a part of environmental management plan and the contractor should follow those conditions.
No improvement plan is required.
(18) Please state any difficulties and/or constrains related to the implementation of the ESMS.
There is no difficulty. No improvement plan is required.

The Preparatory Survey on the Project for Improvement of Agricultural Production and Productivity in Dry Zone Areas in Democratic Socialist Republic of Sri Lanka
Final Report
T 5-33
Table A 5.16 Format for Environmental and Social Screening Implementing Agency should conduct environmental and social screening to fill out this format, and then submit to Project Management Unit of executing agency (Ministry of Agriculture), with an initial concept report (ICR) of each proposed project.
JICA Survey Team prepared this format referring to the format of “Basic Information Questionnaire” of CEA and JICA Guidelines for Environmental and Social Considerations (2010), Appendix 4 Screening Format. Name of Proposed Project Project Implementing Agency’s Contact Data Name Address
Tel Fax e-mail address Environmental and Social Management Experts’ Data Name Tel e-mail address
1 Brief description of proposed
project
2 Scale and magnitude of the project
3 Main objectives of the project
4 Location of the project Pradeshiya Sabha Divisional Secretariat District Provincial Council
5 Extent of the project area
6 Present land use
7. Does the proposed project wholly or partly fall within any of the following areas? Item Yes No Unaware
100m from the boundaries of or within any area declared under the National Heritage Wilderness Act No.4 of 1988
100m from the boundaries of or within any area declared under the Forest Ordinance (Chapter 451)
Any Flood Area declared under the Flood Protection Ordinance (Chapter 449)
Any flood protection area declared under the Sri Lanka Land Reclamation and Development Corporation Act 15 0f 1968 as amended by Act No.52 of 1982
60 meters from the bank of a public stream as defined in the Crown Lands Ordinance (Chapter 454) and having width of more than 25 meters at any point of its course
Any reservation beyond the full supply level of a reservoir
Any archaeological reserve, ancient or protected monument as defined or declared under the Antiquities Ordinance (Chapter 188)
Any area declared under the Botanic Gardens Ordinance (Chapter 446)
Within 100 meters from the boundaries of, or within any area declared as a Sanctuary under the Fauna and Flora Protection Ordinance (Chapter 469)

The Preparatory Survey on the Project for Improvement of Agricultural Production and Productivity in Dry Zone Areas in Democratic Socialist Republic of Sri Lanka
Final Report
T 5-34
100 meters from the high flood level contour of or within, a public lake as defined in the Crown Lands Ordinance (Chapter 454) including those declared under section 71 of the said Ordinance
Within a distance of one mile (1.6km) of the boundary of a National Reserve declared under the Fauna and Flora Protection Ordinance
Areas that run the risk of a large scale increase in soil salinity or soil erosion
Areas where is settlement of indigenous people
8. Does the project require any Item Yes No If Yes, give the scale
Reclamation of land, wetlands ha Clearing of forest ha Felling of trees trees Groundwater pumping m3/year Land acquisition ha
buildings Resettlement households
persons
9. Does the project will generate negative impacts as followings:
Environmental and social impact check list Yes No If Yes, give description of possible impacts
Environmental components Topography and Geography Ground subsidence Underground water Soil Erosion Hydrology Fauna, Flora and Biodiversity Protected area Air pollution Global warming Water pollution Bottom sediment Soil pollution Noise and vibrations Offensive odors Waste Social components Water usage Local economies, such as employment, livelihood, etc. Land use and utilization of local resources Social institutions such as social infrastructure and local decision-making institutions
Existing social infrastructures and services Misdistribution of benefits and damages Local conflicts of interest Limitation of accessibility to information, meetings, etc. on a specific person or group
Gender Children’s rights Infectious diseases such as HIV/AIDS Accidents Other possible impact ( )

The Preparatory Survey on the Project for Improvement of Agricultural Production and Productivity in Dry Zone Areas in Democratic Socialist Republic of Sri Lanka
Final Report
T 5-35
Table A 5.17 Environmental and Social Categorization: Definition of Categorization1
1 Excerpt from JICA Guidelines for Environmental and Social Considerations (April 2010)
5.4.3 (2) (a) Screening and Categorization Based on the results of environmental and social screening, environmental expert and social expert in of the PMU will categorize each project components, according the JICA Guidelines (Use Annexed Table 5.3.5 and Annexed Table 5.3.6).
JICA classifies projects into four categories according to the extent of environmental and social impacts, taking into account an outline of project, scale, site condition, etc.
Category A:
Proposed projects are classified as Category A if they are likely to have significant adverse impacts on the environment and society. Projects with complicated or unprecedented impacts that are difficult to assess, or projects with a wide range of impacts or irreversible impacts, are also classified as Category A. These impacts may affect an area broader than the sites or facilities subject to physical construction. Category A, in principle, includes projects in sensitive sectors, projects that have characteristics that are liable to cause adverse environmental impacts, and projects located in or near sensitive areas. An illustrative list of sensitive sectors, characteristics, and areas is provided in Appendix 3 of the JICA Guidelines (2010).
Category B:
Proposed projects are classified as Category B if their potential adverse impacts on the environment and society are less adverse than those of Category A projects. Generally, they are site specific; few if any are irreversible; and in most cases, normal mitigation measures can be designed more readily.
Category C:
Proposed projects are categorized as Category C if they are likely to have minimal or little adverse impact on the environment and society and also if they satisfy all of the following criteria:
1) Not to be applied to the sensitive sectors, characteristics, and areas shown in Appendix 3 of the JICA Guidelines (2010).
2) No land acquisition or resettlement 3) Little environmental and social influence during civil works even in restoration of existing
buildings (e.g. restoration of schools, public health care centre, vocational training centre; rehabilitation of existing distribution network and substations, procurement of well digging equipment for water supply etc)

The Preparatory Survey on the Project for Improvement of Agricultural Production and Productivity in Dry Zone Areas in Democratic Socialist Republic of Sri Lanka
Final Report
T 5-36
Table A 5.18 Criteria for Project Components Selection This table will be used for rapid environmental assessment conducted by the environmental and social management staff of each implementing agency. If project component is categorized as Category A, executing agency will not approve such project component. no. Criteria Yes No
1 Selected project component is an agriculture project involving large scale land clearing, deforestation or irrigation (more than 100 ha).
2 Selected project component is a large-scale groundwater pumping project (the amounts of pumping water is more than 10,000,000m3/year).
3 Selected project component requires large-scale land acquisition or resettlement (more than 200 persons).
4 Selected project component is located in the sensitive areas such as: protected area under DWLC, DFC and DFAR; and archaeological area.
5 Selected project component will generate adverse impact on indigenous community such as;
5.1 - Resettlement 5.2 - Land acquisition of more than 10% of indigenous people’s property
5.3 - Development in the land identified as socially important area for indigenous people
5.4 - Damage to the community property of indigenous people (such as cultural and religious important building)
Source: Prepared by JICA Survey Team based on the JICA Guidelines (2010)

The Preparatory Survey on the Project for Improvement of Agricultural Production and Productivity in Dry Zone Areas in Democratic Socialist Republic of Sri Lanka
Final Report
T 5-37
Table A 5.19 Indigenous People Planning Framework
Table of Contents
1. Introduction
2. Objectives of IPPF and Policy Framework
3. Identification of Affected Indigenous Peoples
4. Social Impact Assessment and IPP for Project Components
5. Consultation and Participation
6. Disclosure
7. Grievance Redress Mechanism
8. Institutional and Implementation Arrangements
9. Monitoring and Reporting Arrangements
Appendixes 1 Basic Data to be collected during Social Assessment 2 Institutions related to an IPP Implementation
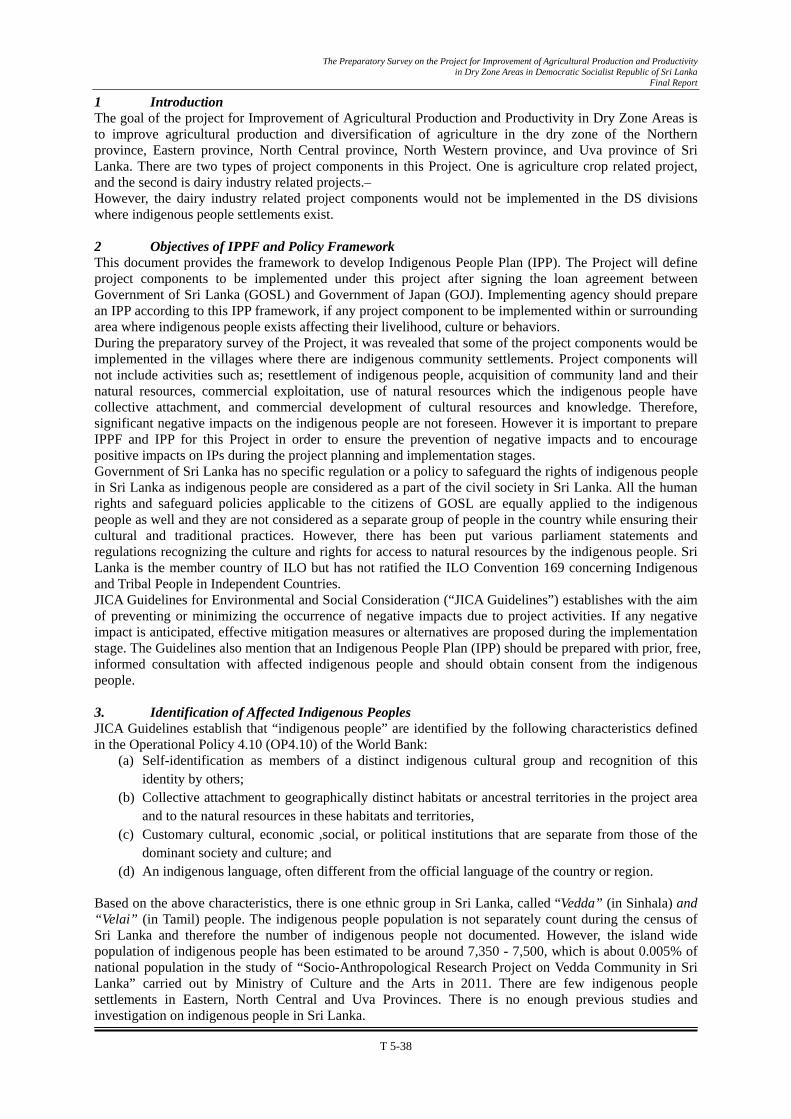
The Preparatory Survey on the Project for Improvement of Agricultural Production and Productivity in Dry Zone Areas in Democratic Socialist Republic of Sri Lanka
Final Report
T 5-38
1 Introduction The goal of the project for Improvement of Agricultural Production and Productivity in Dry Zone Areas is to improve agricultural production and diversification of agriculture in the dry zone of the Northern province, Eastern province, North Central province, North Western province, and Uva province of Sri Lanka. There are two types of project components in this Project. One is agriculture crop related project, and the second is dairy industry related projects. However, the dairy industry related project components would not be implemented in the DS divisions where indigenous people settlements exist. 2 Objectives of IPPF and Policy Framework This document provides the framework to develop Indigenous People Plan (IPP). The Project will define project components to be implemented under this project after signing the loan agreement between Government of Sri Lanka (GOSL) and Government of Japan (GOJ). Implementing agency should prepare an IPP according to this IPP framework, if any project component to be implemented within or surrounding area where indigenous people exists affecting their livelihood, culture or behaviors. During the preparatory survey of the Project, it was revealed that some of the project components would be implemented in the villages where there are indigenous community settlements. Project components will not include activities such as; resettlement of indigenous people, acquisition of community land and their natural resources, commercial exploitation, use of natural resources which the indigenous people have collective attachment, and commercial development of cultural resources and knowledge. Therefore, significant negative impacts on the indigenous people are not foreseen. However it is important to prepare IPPF and IPP for this Project in order to ensure the prevention of negative impacts and to encourage positive impacts on IPs during the project planning and implementation stages. Government of Sri Lanka has no specific regulation or a policy to safeguard the rights of indigenous people in Sri Lanka as indigenous people are considered as a part of the civil society in Sri Lanka. All the human rights and safeguard policies applicable to the citizens of GOSL are equally applied to the indigenous people as well and they are not considered as a separate group of people in the country while ensuring their cultural and traditional practices. However, there has been put various parliament statements and regulations recognizing the culture and rights for access to natural resources by the indigenous people. Sri Lanka is the member country of ILO but has not ratified the ILO Convention 169 concerning Indigenous and Tribal People in Independent Countries. JICA Guidelines for Environmental and Social Consideration (“JICA Guidelines”) establishes with the aim of preventing or minimizing the occurrence of negative impacts due to project activities. If any negative impact is anticipated, effective mitigation measures or alternatives are proposed during the implementation stage. The Guidelines also mention that an Indigenous People Plan (IPP) should be prepared with prior, free, informed consultation with affected indigenous people and should obtain consent from the indigenous people. 3. Identification of Affected Indigenous Peoples JICA Guidelines establish that “indigenous people” are identified by the following characteristics defined in the Operational Policy 4.10 (OP4.10) of the World Bank:
(a) Self-identification as members of a distinct indigenous cultural group and recognition of this identity by others;
(b) Collective attachment to geographically distinct habitats or ancestral territories in the project area and to the natural resources in these habitats and territories,
(c) Customary cultural, economic ,social, or political institutions that are separate from those of the dominant society and culture; and
(d) An indigenous language, often different from the official language of the country or region.
Based on the above characteristics, there is one ethnic group in Sri Lanka, called “Vedda” (in Sinhala) and “Velai” (in Tamil) people. The indigenous people population is not separately count during the census of Sri Lanka and therefore the number of indigenous people not documented. However, the island wide population of indigenous people has been estimated to be around 7,350 - 7,500, which is about 0.005% of national population in the study of “Socio-Anthropological Research Project on Vedda Community in Sri Lanka” carried out by Ministry of Culture and the Arts in 2011. There are few indigenous people settlements in Eastern, North Central and Uva Provinces. There is no enough previous studies and investigation on indigenous people in Sri Lanka.

The Preparatory Survey on the Project for Improvement of Agricultural Production and Productivity in Dry Zone Areas in Democratic Socialist Republic of Sri Lanka
Final Report
T 5-39
The indigenous people in Sri Lanka are traditionally hunters and gathers while paddy cultivation and Chena cultivation are the main economic engagements. Table 1 shows the present status of economic engagement among indigenous people in Sri Lanka.
Table 1 Current Economic Activities of indigenous Community Economic Activity % out of total population of
Vedda Paddy cultivation 37 Chena cultivation 22 Manual labour 19 Fishing 6 Army / Police 5
Source: Prepared by JICA Survey Team based on “Socio-Anthropological Research Project on Vedda Community in Sri Lanka”, Ministry of Culture and the Arts, 2011
According to the recent literature sources (Ministry of Culture and Arts, 2011), current indigenous settlements are located in following Grama Niladhari divisions (GNDs) as shown in Table 2.
Table 2 Existing indigenous people settlements in Sri Lanka Province DS Division GND Eastern Mahaoya Pollebedda
Koraleipattu North Mathurankernikulam, Kugnamkulam, Kirimichchi, Kathiraveli,
Dehiattakandiya Hennanigala Seruvila Uppooral
North central Dimbulagala Ellewewa, Dalukana, Yakkure, Kudawewa Welikanda Sewanapitiya, Mahawewa, Ginidamana
Uva Madulla Rathugala - Henebedda Bibile Nilgala Mahiyanganaya Dambana
Source: Prepared by JICA Survey Team based on “Socio-Anthropological Research Project on Vedda Community in Sri Lanka”, Ministry of Culture and the Arts (2011), and Ministry of Culture and the Arts
Some project components will be implemented in Mahaoya and Koraleipattu North DS Divisions in the Eastern province, and Madulla and Bibila DS Divisions in Uva province. Table 3 shows the available data of indigenous people settlements in the project area and this is the only available information up to date. Detailed surveys will be required to obtain information on the other settlements that are not given in this table.
Table 3 Indigenous People Settlement in the Project Area Province DSD GND
(Village) Economic Activities Type of Land
Ownership Language Religion
Eastern Echchilampattu DSD & Koraleipattu North DSD
(Vakarei) Paddy farming – 35% Chena – 5% Labourer – 25% Hunting – 5% Fishing 25% Other – 5%
State land deed -7.62% State land unauthorized – 12.8% Other – 0.3% Self owned – 41.46% Other pvt owner- 1.83% Land permit – 35.37% Half Share – 0.3% Multiple – 0.3%
Traditional – 2.81% Tamil/Sinhala – 96.9% Both – 0.28%
Hindu – 74% Catholic – 8.91% Traditional – 16.7% Hindu/ Traditional – 4.5%
Population Families
Total (Male/Female)
No data
1,207 (47.7%/52.3%)
Province DSD GND (Village)
Economic Activities Type of Land Ownership
Language Religion
Eastern Mahaoya (Pollebedda) Paddy – 10% Chena – 55% Labourer- 15% Honey cutting – 2% Army/Police- 10% Other – 8%
State land deed -17.36% State land unauthorized – 16.53% Self owned – 28.1% Other pvt owner-
Sinhala – 88% Traditional – 5% Other – 7%
Buddhist – 91% Traditional – 8.2%
Population Families Total
(Male/Female) 521 2,070
(52.8%/47.2%)

The Preparatory Survey on the Project for Improvement of Agricultural Production and Productivity in Dry Zone Areas in Democratic Socialist Republic of Sri Lanka
Final Report
T 5-40
8.26% Land permit – 28.9% Other – 0.83
Province DSD GND (Village)
Economic Activities Type of Land Ownership
Language Religion
Uva Madulla Galgamuwa GND (Rathugala)
Major economic activity is sustainable harvesting of forest resources and selling. Paddy – 5 % Chena – 72% Labour – 5% Honey cutting – 5% Army/police – 10% Businessman/Teaching/ skilled labour – 3%
State land deed -4.62% State land unauthorized – 13.85% Other – 1.54% Self owned – 40% Other pvt owner- 3.08% Land permit – 35.38% Share – 1.54%
Traditional – 5.8% Sinhala- 84.89 % Both – 9.3 %
No data
Population Families Total
(Male/Female) 106 No data
(No data)
Source: Prepared by JICA Survey Team based on “Socio-Anthropological Research Project on Vedda Community in Sri Lanka”, Ministry of Culture and the Arts, 2011. 4. Social Impact Assessment and IPP for Project Components Implementing agency will carry out a detailed social assessment, which will use a consultative approach and give voice to the indigenous people in the project area. The social assessment will be undertaken in two stages; 1) initial screening, and 2) detailed assessment. The objective of the initial screening is to identify the indigenous people living in the project area, according to the definition of indigenous people established on OP4.10 of World Bank. The objective of the detailed social assessment is to collect information and voice of indigenous people in the project area. Appendix 1 shows the data to be collected during the detailed social assessment. According to the detailed social assessment and prior, free, and informed consultation with indigenous people, an IPP will be prepared. IPP includes the following elements, as needed:
a) Summary of the social assessment b) Summary of results of the free, prior, and informed consultation with the affected
Indigenous Peoples’ communities c) Framework for ensuring free, prior, and informed consultation with the affected
indigenous peoples’ communities during project implementation d) Action plan of measures to ensure that the indigenous peoples receive social and
economic benefits that are culturally appropriate, including, if necessary, measures to enhance that capacity of the project implementing agencies
e) Action plan of measures to avoid, minimize, mitigate, or compensate for adverse impacts to the indigenous community
f) Cost estimates and financing plan for the IPP g) Grievance Redress Mechanism the affected indigenous peoples’ communities h) Mechanism and benchmarks for monitoring, evaluating, and reporting on the
implementation of the IPP
5. Consultation and Participation Consultations with indigenous people and participation of them are very important during the entire process of the project preparation and project implementing stages. Each Project Implementing Unit (PIU) under the implementing agency must conduct workshops and informed meetings with the indigenous community leaders, wider participants, government officers of GND (village) level and DS levels. At the workshops and meetings, the implementing agency has to explain clearly the project components and potential impact to the indigenous people. It is highly recommended that handouts will be prepared and given to the participants using an appropriate language which indigenous people can understand the content. Affected indigenous people will be informed and consulted in preparing IPP. The IPP prepared in

The Preparatory Survey on the Project for Improvement of Agricultural Production and Productivity in Dry Zone Areas in Democratic Socialist Republic of Sri Lanka
Final Report
T 5-41
consultation with affected indigenous people will be translated into Traditional language using Sinhala fonts and Tamil language2. Table 4 shows the activities required to prepare IPP during design stage and to implement IPP at the project implementing stage.
Table 4 Activities for inclusion of Indigenous People Issues Project Stage Actions to be required
Design Stage (Preparation of IPP)
Identify location of indigenous people settlement in project components area Identify indigenous community stakeholders in project components area Identify environmental and social issues of indigenous community and possible impact to
be generated by project components Discussion on prevention, mitigation, and compensation plan for possible negative impact Consultation with indigenous people for further suggestions to project components
activities and IPP Presentation of draft of IPP Finalizing IPP taking into consideration of the indigenous people comments and opinions Obtain consensus about IPP with affected indigenous people
Implementation Stage
Implementation of IPP Monitoring of IPP advance
Source: JICA Survey Team 6. Disclosure The implementing agency will submit IPPF and IPP for disclosure on JICA’s website. The Environmental and Social Management expert of PIU will provide information to the all affected indigenous people. In addition, a brochure with IPP information will be prepared for affected indigenous people. 7. Grievance Redress Mechanism The Project will have the Grievance Redressing Mechanism (GRM) for the affected persons, with emphasis on indigenous people and vulnerable people. The Project Implementing Unit (PIU) under the implementing agency will operate as the first actor of management of complaints. The complaint resolution process will have two stages: the first one will be initiated by the environmental and social management staff of the PIU, and the second stage by the Project Management Unit (PMU) under the executing agency. The functions of the grievance redress mechanism are the following:
1. Guide and give advice to people who visit the office asking for information about the objectives, scopes and benefits of the project
2. Guide people in registering their complaints, concerns or requests, and explain the procedures and stages at their disposal
3. Attend rapidly complains from local people 4. Conduct field inspections in order to verify the registered complaints, through third party
interviews and a survey of damages 5. Monitor the process of complaint resolution, from the date of its registration to its closing,
which is verified for the corresponding record in the complaint registry 6. Develop individual files for recorded and addressed cases, which shall contain the type of
complaint, field verification visits, and its resolution 7. Inform the complainant on the progress of the case resolution 8. Ensure that complaints are resolved rapidly; otherwise, guidance, advice, or information
should be sought out from the implementing agency.
8. Institutional and Implementation Arrangements Key institutional arrangements for preparation of Indigenous Peoples’ Plan (IPP) will include the affected indigenous people, environmental and social management expert of the PMU under the Ministry of Agriculture, PIUs under each project implementing agency (Provincial Councils), NGOs and JICA. Key 2 Indigenous people’s traditional language is developed as a spoken language which is derived from Sinhala language, but no developed written language. Therefore indigenous people in southern area use Sinhala as the written language, and the people in Tamil speaking areas speak and write in Tamil language.

The Preparatory Survey on the Project for Improvement of Agricultural Production and Productivity in Dry Zone Areas in Democratic Socialist Republic of Sri Lanka
Final Report
T 5-42
institutional arrangement for implementation of IPP will be included the actors mentioned above and other line agencies depending on the characteristics of project components. (See Appendix 2) There will be no land acquisition or resettlement activities take place during the project implementation stage and therefore it is not necessary to consider institutional arrangements on resettlement or land acquisition. Table 5 defines the institutional roles and responsibilities for the preparation and implementation of IPPs.
Table 5 Institutional Roles and Responsibilities on IPP Preparation and Implementation Activities Institution Role and responsibility
1 Finalization of sites /alignment for project components
Implementing Agency Will finalize the sites/selection of project components PMU Will approve project components proposed by
respective Implementing Agencies 2 Preliminary
screening PIU Will conduct preliminary screening
3 Planning of Social Impact Assessment
PIU Will plan Social Impact Assessment (SIA ) of the affected indigenous community based on preliminary screening, and in compliance with JICA policy
4 Social Impact Assessment
PIU Will collect and analyze required information in SIA, and will prepare SIA report
AIP Will be responsible for giving information to and participate with concerned officials
5 Recommendation for IPP preparation
PMU Based on SIA report, and in compliance with the JICA policy, PMU will recommend IPP preparation
6 Formulation of mitigation measures and development of action plan
PIU Will collect required information by consulting Indigenous people and their leaders and develop action plan with the involvement of PIA proposing suitable mitigation measures if any
7 Disclosure of IPP PIA (PIU) Will carry out information disclosure meetings to finalize IPP at community level
AIP Will participate in information disclosure meeting to give their opinions and comments for draft of IPP
Local NGOs Will contribute to carry out meeting under PIA instruction
PMU Will participate in information disclosure meeting JICA Will publish IPP in their web site
8 Budget and financing plan
PIU Will prepare budget and financing plan for implementation of IPP
PMU Will check allocation of budget for implementation of IPP by PIU
9 IPP approval from JICA
PMU Will submit IPP to JICA JICA Will review and approve the IPP
10 IPP implementation AIP Will participate each stage of IPP Implementing agency Will appoint team of experts for IPP implementation Line agencies and local NGOs
Will be appointed by implementing agency, if necessary.
JICA Will review monitoring report PMU: Project Management Unit, PIU: Project Implementing Unit, AIP: Affected Indigenous People, IPP: Indigenous People Plan Source: JICA Survey Team
9. Monitoring and Reporting Arrangements The PIU will form a monitoring team with qualified and experienced social expert, representative of indigenous people, regional officers from line agencies, and local NGOs. Monitoring system will take participatory monitoring approach. In IPP implementing stage, monitoring benchmark and monitoring report format will be defined. Monitoring report will be prepared and be submitted to the executing agency and JICA for review, approval, and disclosure.

The Preparatory Survey on the Project for Improvement of Agricultural Production and Productivity in Dry Zone Areas in Democratic Socialist Republic of Sri Lanka
Final Report
T 5-43
Appendix 1 of IPPF Basic Data to be collected during Social Assessment A. Demographic Data
1) Number of family, population, sex, Generation composition 2) Mobility of population (inflow, outflow, work outside of home village, etc.) 3) Employment, economic activities, income 4) Language 5) Education Level
B. Environmental Condition 1) Geology 2) Land use, Type of land ownership, Natural resources
C. Infrastructure 1) Social Infrastructure (road, electricity, water supply, public traffic system, etc.) 2) Social Service (government service, special support for poverty people)
D. Livelihood 1) History of the community 2) Property of each family (vehicle, motor bicycle, television, telephone, etc.) 3) Public health (portable water, sewage disposal, disease) 4) Community activities (mutual system, festival, etc.) 5) Stakeholders in the community 6) Community’s properties 7) Vulnerable people 8) Other specific characteristic of livelihood
E. Concerns and Problem 1) Religion, taboo 2) Gender 3) Dairy problem shared in the community
Source: JICA Guidelines for Environmental and Social Considerations (2010)
Appendix 2 of IPPF Institutions related to an IPP Implementation
Institution/Authority Responsibility Wild Life Conservation Department Responsible agency related to the activities dealing with wild
life habitats, resources and protected areas Forest Conservation Department Responsible agency related to the activities dealing with forest
resources, felling of trees Ministry of culture and Arts Responsible agency safeguarding cultural and traditional values
of Indigenous people Ministry of National heritage Responsible agency safeguarding cultural and traditional values
of Indigenous people and preserving their heritage Sri Lanka Cashew cooperation To establish and assist in the establishment of infrastructure
necessary for the purpose of development of cashew plantations, processing facilities and marketing.
To undertake activities pertaining to the cultivation processing and marketing of cashew and cashew products
Ministry of indigenous medicine Responsible in the activities related to the cultivation of herbs and extension activities associated with it.
Coconut cultivation board To provide necessary guidance and support to coconut growers among Indigenous people
To develop and assist in development of production and productivity of land under coconut
Sri Lanka Samurdhi Authority To assist low income indigenous people to eliminate poverty and strengthening them economically through the implementation of income generating projects
Disaster Management Centre Assist disaster management program related to IPP Ministry of Agriculture The main actor on improving agriculture related activities in
IPP Source: Prepared by JICA Survey Team based on the information obtained by the Ministry of Culture and the Arts

The Preparatory Survey on the Project for Improvement of Agricultural Production and Productivity in Dry Zone Areas in Democratic Socialist Republic of Sri Lanka
Final Report
T 5-44
Table A 5.20 Outline of an Abbreviated Resettlement Action Plan for Project Component3
3 The World Bank OP4.12 Annex A
An abbreviated plan covers the following minimum elements:
a) a census survey of displaced persons and valuation of assets; b) Description of compensation and other resettlement assistance to be provided; c) Consultations with displaced people about acceptable alternatives; d) Institutional responsibility for implementation and procedures for grievance redress; e) Arrangements for monitoring and implementation; and f) Time table and budget.

The Preparatory Survey on the Project for Improvement of Agricultural Production and Productivity in Dry Zone Areas in Democratic Socialist Republic of Sri Lanka
Final Report
T 5-45
Table A 5.21 Outline of an Annual Environmental and Social Performance Report to JICA
1. Basic Information
Name of Organization:
Completed by (Name):
Position in organization:
Reporting Period: From: To:
Completed in (MM/YY)
2. Subprojects using JICA Funds during the Reporting Period Name of Subproject approved during the reporting period
Industry Sector
Project Scope
Project Cost (JPY)
Approval Date
Environmental Category*
Reason of Categorization
Documents made (eg. EIA, RAP, IPP)
Any outstanding environmental IR or IP issues**
*Please refer Environmental and Social Categorization: Definition or 11.2.2 of JICA Guidelines for Environmental and Social Considerations
(April 2010) **IR = Involuntary Resettlement, IP = Indigenous People
3. Subprojects using JICA Funds to be Approved in the Next Financial Year Name of Subproject approved during the reporting period
Industry Sector
Project Scope
Project Cost (JPY)
Approval Date
Environmental Category*
Reason of Categorization
Documents made (eg. EIA, RAP, IPP)
Any outstanding environmental IR or IP issues**
*Please refer Environmental and Social Categorization: Definition or 11.2.2 of JICA Guidelines for Environmental and Social Considerations
(April 2010) **IR = Involuntary Resettlement, IP = Indigenous People
4. Environment and Social Management System (ESMS)
Please describe if ESMS of your organization has changed in anyway (e.g. establishment of a new division for environmental and social management) since JICA’s appraisal.

The Preparatory Survey on the Project for Improvement of Agricultural Production and Productivity in Dry Zone Areas in Democratic Socialist Republic of Sri Lanka
Final Report
T 5-46
Table A 5.22 Qualification and Job Description of Experts. 1 Foreign Expert Team Leader/ Project Management
Qualification Team Leader should possess a university degree in civil engineering, irrigation engineering or agricultural engineering with at least 15 years experience in planning, implementation and monitoring & evaluation of irrigation rehabilitation or irrigated agriculture projects including minimum 5 years in JICA funded loan or grant projects.
Job Description Team Leader will be responsible mainly to support PMU for his project management. Organizing and guiding each expert in management consultant team, preparation of overall & annual project work plans, preparation of project guidelines & procedures, coordination with relevant agencies including the JICA are the tasks of the Team Leader.
2 National Expert Co-Team Leader/Monitoring Engineer Qualification The expert should possess a university degree in civil engineering with at least 15 years working
experience in the field of design and construction supervision of irrigation & drainage development projects; Of the total experience, at least 5 years working experience in a donor funded rehabilitation project is must. Sufficient knowledge & experience in government procedures, rules and regulations related to contract administration, cash flow etc is essential.
Job Description (1) Take the responsibility for the technical aspect in the consultant team. (2) Give the necessary advise and guidance to the PIU and project consultant in the rehabilitation
work and monitoring the activities related the engineering. (3) Conducting the technical audit to all work carried out in the project (4) Support team leader for overall management of the consulting activities
3 Foreign Expert Agriculture Marketing Qualification The expert should possess a university degree in agriculture marketing with at least 10 years
working experience in the agricultural marketing field. Of the 10 years experience, at least 5 years should be in JICA funded loan or grant projects.
Job Description (1) Review and analyze the marketing situation related to agricultural products and develop the necessary guidelines aiming to incubate the entrepreneur in the agriculture sector mainly trading the OFC, Vegetable and Fruits.
(2) Prepare the guidelines for entrepreneurship development in agriculture business based on the field experience obtained during the project period.
4 Foreign Expert Agriculture Fruit Crop Management Qualification The expert should possess a university degree in agriculture with at least 10 years working
experience in the field of Fruit Crop management of which at least 5 years should be in JICA funded loan or grant projects.
Job Description (1) Review the existing situation of the fruit crops covering varieties, cultivation practices, management, harvesting etc
(2) Plan the necessary agricultural support activities for expansion of fruit crop (3) Review the existing training manual & materials in the country and modify where necessary to
suit the project requirements 5 National Expert Hydro Geologist Qualification The Hydro Geologist should possess a university degree in the similar discipline and have at least 8
years working experience in planning, design and construction supervision of hydro geological works in line with wells for pumping water for agricultural purposes. Working experience in donor funded projects which involved with construction of agro-wells or related activities will be an added qualification.
Job Description (1) Study the ground water situation in the target areas and accordingly make recommendations for digging agro wells
(2) Prepare the agro wells technical specifications and guiding and supervision of agro well construction program
(3) Coordinate with Water Resource Board of Sri Lanka to carry out his functions effectively and efficiently
6 National Expert Architect Qualification The Architect should possess a university degree in architectural science and have 8 years working
experience in planning, designing and supervision of building works in government sector. Working experience in donor funded projects as an Architect or similar capacity will be an added qualification.

The Preparatory Survey on the Project for Improvement of Agricultural Production and Productivity in Dry Zone Areas in Democratic Socialist Republic of Sri Lanka
Final Report
T 5-47
Job Description (1) Review and modify the existing design of buildings such as Dedicated Economic Centers, Training Centers, and Collecting Centers
(2) Supervise construction works of buildings and installation of training facilities (3) Assist the related program implementation.
7 National Expert Senior Agronomist Qualification The Senior Agronomist should possess a university degree with at least 10 years actual working
experience in the field of agriculture covering study, planning and implementation is essential. Of the total experience, at least 3 years should be in senior management level. Possessing Master Degree in Agriculture and having work experience in donor funded projects will be an added qualification.
Job description (1) Prepare and supervise implementation of the agricultural development program consisting of OFC, Vegetables and Fruits
(2) Prepare implementation guide lines, review and modify existing training manuals and materials to suit the project needs
(3) Coordination with implementing agencies and relevant individual actors in agriculture sector (4) Give necessary advise and monitoring the activities carried out in PIU and project consultant
8 National Expert Senior Livestock Expert Qualification Senior livestock expert should possess a university degree in veterinary science or agriculture
specialized in animal science with at least 10 years working experience in the field of livestock development activities, of which 3 years should be in senior management level. Working experience in donor funded projects and possessing Master Degree in relevant field will be an added qualification.
Job description (1) Review the existing situation of livestock sector in the project area in line with project objectives.
(2) Prepare and implement livestock program under the project (3) Monitoring of the activities carried out under PIU and give necessary advise (4) Preparation of guideline for sustainable production of feed concentrate made of agriculture by
product (5) Necessary central level coordination of breeding and goat program
9 National Expert Project Monitoring & Evaluation Qualification A university graduate in Project management, engineering or agriculture with at least 8 years
experience in government sector in which 3 years in senior management level and 5 years in the field of monitoring & evaluation of special projects. The graduates who have followed project management courses and having M&E work experience in donor funded development projects will earn an additional qualification.
Job description (1) Prepare and implement monitoring & evaluation plan for the project (2) Train and guide relevant staff for data collection and reporting, and (3) Prepare periodical M&E reports and forward to the management with recommendations
10 National Expert Procurement Qualification A graduate engineer with at least 08 years experience in which 05 years in relevant field of
Procurement or a certificate holder of recognized Procurement Course and having 10 years experience in relevant field of Procurement.
Job Description (1) Study the national procurement guidelines & JICA procurement guideline in line with the project and prepare the project procurement plan
(2) Receive, examine and processes requisitions, prepare bid specifications and other necessary documents related to purchasing, locate source of suppliers and place orders with appropriate bidders

The Preparatory Survey on the Project for Improvement of Agricultural Production and Productivity in Dry Zone Areas in Democratic Socialist Republic of Sri Lanka
Final Report
T 5-48
Table A 5.23 Breakdown of Total Project Cost
No. Item / Program Total Investmnent
Cost (Rs. mil.)
Eligible Portion Non-eligible Portion
Remarks F/C L/C Total
(JPY mil.)
(Rs. Mil.)
(JPY mil.)
(Rs. Mil.)
1. Mobilization of PMU and PIUs Mobilization of PMU and PIUs 176 105 0 105 0
2. Agricultural Crop Promotion Program 9,015 3,335 3,442 5,389 0 2-1 Productivity Improvement Program
(Agricultural Crop) 7,574 2,827 2,852 4,529 0
1) Rehabilitation of irrigation facility 3,885 1,512 1,360 2,323 0 i) Individual sub schemes 2,417 940 846 1,446 0 7 schemes ii) Major tank rehabilitation 137 53 48 82 0 5 schemes iii) Medium tank rehabilitation 489 190 171 292 0 32 schemes iv) Minor tank rehabilitation 842 327 295 503 0 71 schemes 2) Agro well provision 2,694 1061 920 1,611 0 5,671 nos for new
& rehab. 3) Micro irrigation system 206 53 118 123 0 4) Enhancement of supply chain of quality
seed and planting material 790 201 454 472 0
2-2 Logistic System Improvement and Entrepreneurs Development Program
1,323 461 552 790 0
1) Established of proper interface and incubation
341 107 161 204 0
2) Improvement of farmers' storage facility 231 69 116 138 0 3) Upgrading of DEC and construction of
collecting centre 86 26 43 51 0
4) Rural road and farm access road rehabilitation
655 255 229 392 0
5) Study tour 9 4 3 5 0 2-3 Program on Enhancement of Extension Services
and Ground Level Research 118 47 38 70 0
1) Training to extension officers 7 0 7 4 0 2) Training facility improvement 81 35 22 48 0 3) Overseas training 30 12 9 18 0
3. Livestock Product Promotion Program 1,042 303 536 627 0 3-1 Productivity Improvement Program of Milk 702 189 386 420 0
1) Milk production improvement program 702 189 386 420 0 3-2 Program on Market Development on Fresh Milk 187 58 91 112 0
1) Milk marketing program 161 58 65 97 0 2) Training of milk production and market
network improvement 26 0 26 15 0
3-3 Livestock Service Quality and Accessibility Improvement Program
153 56 59 95 0
1) Improvement of cold chain for semen transport
8 0 8 8 0
2) Livestock Training Program 7 0 7 4 0 3) Livestock services program 138 56 44 83 0
4. Sub-Total of 1 to 3 (Base Cost for Programs and PMU Mobilization)
10,233 3,743 3,978 6,121 0
5. Price Contingency of 4 1,276 328 728 763 0 FC:2.1%, LC:4.0%/year
6. Physical Contingency of 4 575 204 235 345 0 =(4+5) x 5% Sub-Total 1 to 6 12,084 4,275 4,941 7,229 0 7. Consulting Services 7-1 Base Cost 2,462 392 1,806 1,472 0 7-2 Price Contingency 359 29 310 214 0 FC:2.1%,
LC:4.0%/year 7-3 Physical Contingency 141 21 106 84 0 =(4+5) x 5% Sub-Total 7 2,962 442 2,222 1,770 0 Total 1 to 7 (Eligible Portion) 15,046 4,717 7,163 8,999 0 8. Administration and Other Cost 3,283 3,283
1) Administration Cost 704 704 incl. 4.0% escalation
2) Tax & Duty 1,890 1,890 3) Interest during Construction 674 674 0.01% for CS,
1.4% for others 4) Commitment Charge 15 15 0.1% of Eligible
portion GRAND TOTAL 1 to 8 18,329 4,717 7,163 8,999 3,283 Note : US$ 1.0 = JPY 79.0 Source : estimated by JICA Study Team = Rs. 132.0 JPY 1.0 = Rs. 0.598

The Preparatory Survey on the P
roject for Improvem
ent of Agricultural P
roduction and Productivity
in Dry Zone A
reas in Dem
ocratic Socialist Republic of Sri Lanka
Final R
eport
T 5-49
Table A
5.24 Cost B
reakdown for Program
Cost by Zone(1/3)
1.0US$ = 79 Yen = 132 Rs.
F/C L/C Total F/C L/C Total F/C L/C Total F/C L/C Total F/C L/C Total1. Mobilization of PMU and PIUs
Incorporated in the Summary
2. Agricultural Crop Promotion Program 2,241,955 1,284,704 3,526,659 1,528,896 991,578 2,520,474 1,189,410 756,880 1,946,291 613,018 408,865 1,021,883 5,573,279 3,442,027 9,015,3062-1 Productivity Improvement Program (Agricultural Crop) 1,970,878 1,111,658 3,082,537 1,174,617 745,258 1,919,876 1,051,102 657,056 1,708,158 526,678 337,698 864,376 4,723,276 2,851,670 7,574,946
1) Rehabilitation of irrigation facility 1,468,401 790,678 2,259,079 511,672 275,516 787,188 498,397 268,368 766,765 47,102 25,363 72,464 2,525,572 1,359,924 3,885,496i) Individual sub schemes 7 scheme 993,887 535,170 1,529,057 244,287 131,539 375,827 333,167 179,397 512,564 1,571,341 846,107 2,417,448 7 schemes
- Kurai Tank augmentation and Parangi aru 1 LS 269,335 145,026 414,361 269,335 145,026 414,361
- Welimaruthamadu Irrigation scheme 1 LS 80,759 43,485 124,244 80,759 43,485 124,244
- Muthayankaddu Tank Lift Irrigation Scheme 1 LS 395,959 213,208 609,167 395,959 213,208 609,167
- Vavunikulam Tank - Right & Left Banks Lift 1 LS 247,835 133,450 381,285 247,835 133,450 381,285
- Mahaweli System H scheme 1 LS 244,287 131,539 375,827 244,287 131,539 375,827
- Ingnimitiya scheme 1 LS 268,032 144,325 412,357 268,032 144,325 412,357
- Neelabemma Scheme (Phase II) 1 LS 65,135 35,072 100,207 65,135 35,072 100,207
ii) Major tank rehabilitation 5 scheme 25,349 13,649 38,998 52,523 28,282 80,805 11,461 6,172 17,633 0 0 0 89,333 48,103 137,436iii) Medium tank rehabilitation 32 scheme 271,901 146,408 418,310 30,057 16,184 46,241 12,882 6,937 19,819 2,870 1,545 4,415 317,710 171,075 488,785iv) Minor tank rehabilitation 71 scheme 177,264 95,450 272,714 184,805 99,510 284,315 140,887 75,862 216,749 44,232 23,817 68,049 547,188 294,640 841,827
2) Agro well provision 437,584 227,044 664,627 522,636 272,072 794,708 383,347 199,390 582,737 430,059 221,625 651,684 1,773,626 920,131 2,693,757- Construction of new agro wells 2,670 nos 230,100 123,900 354,000 280,598 151,091 431,688 204,306 110,011 314,317 217,229 116,969 334,198 932,232 501,971 1,434,204- Rehabilitation of agro wells 3,001 nos 129,420 69,688 199,107 156,975 84,525 241,500 115,089 61,971 177,060 122,334 65,872 188,206 523,817 282,056 805,873- Provision of pumps and accessories 5,671 set 78,064 33,456 111,520 85,064 36,456 121,520 63,952 27,408 91,360 90,496 38,784 129,280 317,576 136,104 453,680
3) Micro irrigation system 14,945 12,945 27,890 23,902 33,844 57,746 27,037 41,159 68,195 22,110 29,664 51,775 87,994 117,612 205,606- Sprinkler irrigation for 500m2 200 set 11,512 4,934 16,445 11,512 4,934 16,445 11,512 4,934 16,445 11,512 4,934 16,445 46,046 19,734 65,780- Drip irrigation system 2,248 ha 3,433 8,011 11,445 12,390 28,911 41,301 15,525 36,225 51,750 10,599 24,731 35,330 41,948 97,878 139,826
4) Enhancement of supply chain of quality seed and planting material 49,949 80,992 130,941 116,407 163,826 280,233 142,321 148,140 290,461 27,408 61,046 88,453 336,084 454,004 790,088i) Provision of equipment & machinery for seed laboratory 1,002 0 1,002 0 0 0 1,002 0 1,002 501 0 501 2,505 0 2,505
- Tool equipment & machinery 5 set 1,002 0 1,002 0 0 0 1,002 0 1,002 501 0 501 2,505 0 2,505
ii) Provision of seed farms 9,065 8,885 17,950 0 0 0 8,325 12,425 20,750 5,275 5,975 11,250 22,665 27,285 49,950- Vaunia farm 1 LS 6,875 7,375 14,250 6,875 7,375 14,250- Kantale farm 1 LS 2,190 1,510 3,700 2,190 1,510 3,700- Wariyapola seed farm 1 LS 4,000 6,000 10,000 4,000 6,000 10,000- Galgamuwa seed farm 1 LS 4,325 6,425 10,750 4,325 6,425 10,750- Okkampitiya farm 1 LS 5,275 5,975 11,250 5,275 5,975 11,250
iii) Farmer traing program on quality self-seed & planting material produsction 0 840 840 0 2,191 2,191 0 375 375 0 297 297 0 3,703 3,703- Quality self-seed production for OFCs 0 615 615 0 1,592 1,592 0 200 200 0 179 179 0 2,586 2,586- Certified seed production for OFCs 0 205 205 0 531 531 0 67 67 0 60 60 0 863 863- Quality planting material production for fruits 0 20 20 0 68 68 0 108 108 0 58 58 0 254 254
iv) Farmer training program on improvement of farm management etc. 0 24,690 24,690 0 29,460 29,460 0 57,420 57,420 0 27,540 27,540 0 139,110 139,110- Farm management improvement 43,200 day 0 7,200 7,200 0 8,640 8,640 0 18,000 18,000 0 9,360 9,360 0 43,200 43,200- OFCs production improvement 22,890 day 0 2,310 2,310 0 2,940 2,940 0 10,080 10,080 0 7,560 7,560 0 22,890 22,890- Fruits production improvement 29,820 day 0 7,980 7,980 0 9,240 9,240 0 11,340 11,340 0 1,260 1,260 0 29,820 29,820- Study tour 180 time 0 7,200 7,200 0 8,640 8,640 0 18,000 18,000 0 9,360 9,360 0 43,200 43,200
v) Supply of machinery and equipment 39,882 46,577 86,459 116,407 132,175 248,582 132,994 77,920 210,914 21,632 27,234 48,865 310,914 283,906 594,820- Manual highland seeder for pulses 368 no. 635 1,481 2,115 3,888 9,072 12,960 378 882 1,260 68 158 225 4,968 11,592 16,560 5 Ac/day- Highland weeder 368 no. 705 1,645 2,350 4,320 10,080 14,400 420 980 1,400 75 175 250 5,520 12,880 18,400- Ridger 184 no. 72 168 240 432 1,008 1,440 42 98 140 6 14 20 552 1,288 1,840- Ground nut decorticating machine 52 no. 21 49 70 120 280 400 12 28 40 3 7 10 156 364 520 15 kg/hr- Pulse splitting machine 134 no. 972 2,268 3,240 5,616 13,104 18,720 540 1,260 1,800 108 252 360 7,236 16,884 24,120 30-40 kg/hr- Pulse cleaning machine 134 no. 270 630 900 1,560 3,640 5,200 150 350 500 30 70 100 2,010 4,690 6,700- Grinding machine for flour making 397 no. 1,823 4,253 6,076 4,297 10,025 14,322 651 1,519 2,170 614 1,432 2,046 7,384 17,230 24,614- Barbed wire fence 1,942 km 10,982 25,626 36,608 22,968 53,592 76,560 8,791 20,513 29,304 8,527 19,897 28,424 51,269 119,627 170,896
y ( )
No. Program InputsQ'ty Unit
Amount (Rs.1,000)
RemarksZone-01 Zone-02 Zone-03 Zone-04 Total
Eligible Eligible Eligible Eligible Eligible

The Preparatory Survey on the P
roject for Improvem
ent of Agricultural P
roduction and Productivity
in Dry Zone A
reas in Dem
ocratic Socialist Republic of Sri Lanka
Final R
eport
T 5-50
Table A 5.24
Cost B
reakdown for Program
Cost by Zone (2/3)
1.0US$ = 79 Yen = 132 Rs.
F/C L/C Total F/C L/C Total F/C L/C Total F/C L/C Total F/C L/C Total- Electric fence (protect from elephants) 570 km 24,402 10,458 34,860 73,206 31,374 104,580 122,010 52,290 174,300 12,201 5,229 17,430 231,819 99,351 331,170 with solar system
2-2 Logistic System Improvement and Entrepreneurs Development Program 258,288 169,762 428,050 329,328 239,868 569,196 126,146 96,656 222,803 56,731 45,930 102,662 770,493 552,217 1,322,7101) Established of proper interface and incubation 45,219 40,877 86,097 36,815 33,475 70,289 65,430 59,084 124,515 32,043 28,035 60,077 179,507 161,471 340,978
i) Establishment of collecting points 45,219 40,877 86,097 36,815 33,475 70,289 65,430 59,084 124,515 32,043 28,035 60,077 179,507 161,471 340,978- Facilities for collecting point 108 place 40,877 40,877 81,755 33,475 33,475 66,949 59,084 59,084 118,169 28,035 28,035 56,069 161,471 161,471 322,942- Equipment for collecting points 108 set 4,342 0 4,342 3,340 0 3,340 6,346 0 6,346 4,008 0 4,008 18,036 0 18,036
2) Improvement of farmers' storage facility 31,050 31,050 62,100 63,300 63,300 126,600 10,950 10,950 21,900 10,350 10,350 20,700 115,650 115,650 231,300- Renovation of farmers' storage, onion 2,590 no 14,700 14,700 29,400 16,050 16,050 32,100 3,600 3,600 7,200 4,500 4,500 9,000 38,850 38,850 77,700- Renovation of farmers' storage, chili 5,120 no 16,350 16,350 32,700 47,250 47,250 94,500 7,350 7,350 14,700 5,850 5,850 11,700 76,800 76,800 153,600
3) Upgrading of DEC and construction of collecting centrei) Upgrading of DEC 0 0 0 43,000 43,000 86,000 0 0 0 0 0 0 43,000 43,000 86,000
- Dambulla at DA Matale 1 LS 32,000 32,000 64,000 32,000 32,000 64,000- Thambuttegama at Anuradapura 1 LS 11,000 11,000 22,000 11,000 11,000 22,000
4) Rural road and farm access road rehabilitation 180,424 97,152 277,576 184,619 99,410 284,030 48,172 25,939 74,111 12,745 6,862 19,607 425,960 229,363 655,324- Improvement of access roads to market 86.0 km 84,411 45,452 129,862 120,867 65,082 185,949 19,332 10,409 29,741 5,281 2,844 8,125 229,891 123,787 353,678- Improvement of farm roads 541.9 km 96,014 51,700 147,713 63,752 34,328 98,081 28,840 15,529 44,370 7,463 4,019 11,482 196,070 105,576 301,646
5) Study tour 1,594 683 2,277 1,594 683 2,277 1,594 683 2,277 1,594 683 2,277 6,376 2,732 9,108- To potential impact countries 1 LS 901 386 1,287 901 386 1,287 901 386 1,287 901 386 1,287 3,604 1,544 5,148- To active export countries 1 LS 693 297 990 693 297 990 693 297 990 693 297 990 2,772 1,188 3,960
2-3 Program on Enhancement of Extension Services and Ground Level Research 12,789 3,284 16,073 24,951 6,452 31,403 12,162 3,168 15,330 29,608 25,237 54,845 79,510 38,140 117,6501) Training to extension officers 0 1,502 1,502 0 2,888 2,888 0 1,386 1,386 0 1,155 1,155 0 6,930 6,930
i) Project Awareness 1,800 day 0 293 293 0 563 563 0 270 270 0 225 225 0 1,350 1,3502,520 day 0 546 546 0 1,050 1,050 0 504 504 0 420 420 0 2,520 2,520
ii) Best Practices in OFC Cultivation 540 day 0 117 117 0 225 225 0 108 108 0 90 90 0 540 540iii) Best Practices in Fruit Cultivation 540 day 0 117 117 0 225 225 0 108 108 0 90 90 0 540 540iv) Farm Business Management 900 day 0 195 195 0 375 375 0 180 180 0 150 150 0 900 900v) Exposure visits for experience sharing 540 day 0 234 234 0 450 450 0 216 216 0 180 180 0 1,080 1,080
2) Training facility improvement 8,631 0 8,631 16,635 0 16,635 8,004 0 8,004 25,450 22,300 47,750 58,720 22,300 81,020- DATC Bibile at Moneragala 4,000 6,000 10,000 4,000 6,000 10,000- ISTC Bindunuwewa at Badulla 14,700 16,300 31,000 14,700 16,300 31,000- Motor cycle 180 no 8,151 0 8,151 15,675 0 15,675 7,524 0 7,524 6,270 0 6,270 37,620 0 37,620- Personal computer 20 no 480 0 480 960 0 960 480 0 480 480 0 480 2,400 0 2,400
3) Overseas training 4,158 1,782 5,940 8,316 3,564 11,880 4,158 1,782 5,940 4,158 1,782 5,940 20,790 8,910 29,700- Overseas traing for OFCs 5 person 2,772 1,188 3,960 5,544 2,376 7,920 2,772 1,188 3,960 2,772 1,188 3,960 13,860 5,940 19,800- Overseas traing for fruit 5 person 1,386 594 1,980 2,772 1,188 3,960 1,386 594 1,980 1,386 594 1,980 6,930 2,970 9,900
3. Livestock Product Promotion Program 140,064 108,088 248,153 157,375 167,237 324,612 129,946 167,544 297,490 78,925 92,894 171,818 506,310 535,763 1,042,0733-1 Productivity Improvement Program of Semi-intensive and Intensive Farmer 69,777 60,379 130,156 89,258 113,899 203,157 97,799 138,487 236,286 59,004 72,985 131,989 315,839 385,750 701,588
1) Milk production improvement program 69,777 60,379 130,156 89,258 113,899 203,157 97,799 138,487 236,286 59,004 72,985 131,989 315,839 385,750 701,588i) Feeding Project
- Individual Fodder Development(Unit) 5 years 3,751 plot 5,310 5,310 10,620 11,700 11,700 23,400 12,000 12,000 24,000 8,500 8,500 17,000 37,510 37,510 75,020- Straw Bailing Unit 100 unit 50,528 21,655 72,182 52,399 22,457 74,856 46,785 20,051 66,835 37,428 16,041 53,468 187,139 80,203 267,342- Bio-mass Pelleting units 10 unit 7,486 3,208 10,694 14,971 6,416 21,387 7,486 3,208 10,694 7,486 3,208 10,694 37,428 16,041 53,468- Grass choppers 60 unit 6,370 2,730 9,100 10,010 4,290 14,300 5,460 2,340 7,800 5,460 2,340 7,800 27,300 11,700 39,000- Supply of seeds of pasture and legumes 60 pack 84 36 120 178 76 254 168 72 241 131 56 187 561 241 802 20 kg/pack
69,777 32,939 102,716 89,258 44,939 134,197 71,899 37,671 109,570 59,004 30,145 89,149 289,939 145,694 435,632ii) Breeding program
- Estrus Synchronization(head for 5years) 48,000 time 0 12,000 12,000 0 32,000 32,000 0 32,000 32,000 0 20,000 20,000 0 96,000 96,000- Artificial Insemination(times for 5 years) 200,000 time 0 12,800 12,800 0 33,000 33,000 0 33,400 33,400 0 20,800 20,800 0 100,000 100,000
Zone-01 Zone-02 Zone-03 Zone-04 Total
Eligible Eligible Eligible Eligible Eligible
No. Program InputsQ'ty Unit
Amount (Rs.1,000)
Remarks
ii) Farm management improvement
Sub-Total

The Preparatory Survey on the P
roject for Improvem
ent of Agricultural P
roduction and Productivity
in Dry Zone A
reas in Dem
ocratic Socialist Republic of Sri Lanka
Final R
eport
T 5-51
Table A 5.24
Cost B
reakdown for Program
Cost by Zone (3/3)
1.0US$ = 79 Yen = 132 Rs.
F/C L/C Total F/C L/C Total F/C L/C Total F/C L/C Total F/C L/C Total0 24,800 24,800 0 65,000 65,000 0 65,400 65,400 0 40,800 40,800 0 196,000 196,000
iii) Goat breeding program- Goat breeding farm 3,800 place 0 0 0 0 0 0 20,900 20,900 41,800 0 0 0 20,900 20,900 41,800- Breeding female goat 600 head 0 0 0 0 0 0 0 6,600 6,600 0 0 0 0 6,600 6,600- Provision & rehabilitation of facility for Thelahara 1 LS 5,000 5,000 10,000 0 0 0 5,000 5,000 10,000- Goat provision 3,452 head 0 2,400 2,400 0 3,600 3,600 0 2,556 2,556 0 1,800 1,800 0 10,356 10,356
0 2,400 2,400 0 3,600 3,600 25,900 35,056 60,956 0 1,800 1,800 25,900 42,856 68,756iv) Training for feeding improvement
- Production planning,financial management etc. 200 day 0 60 60 0 90 90 0 90 90 0 60 60 0 300 300- Awareness and utilization of crop residue 200 day 0 60 60 0 90 90 0 90 90 0 60 60 0 300 300- Technical training on products from crop residue 200 day 0 60 60 0 90 90 0 90 90 0 60 60 0 300 300- Improving nutritive quality of crop rsidue 200 day 0 60 60 0 90 90 0 90 90 0 60 60 0 300 300
0 240 240 0 360 360 0 360 360 0 240 240 0 1,200 1,200
3-2 Program on Market Development on Fresh Milk through Enhancement of Cooperative or Sm 42,055 31,519 73,574 35,505 29,990 65,495 14,348 18,348 32,696 4,263 11,269 15,532 96,171 91,126 187,2971) Milk marketing program
- Issuing Milk Canister 40L 210 no 0 777 777 0 867 867 0 748 748 0 748 748 0 3,140 3,140- Issuing Milk Canister 20L 3,000 no 0 4,544 4,544 0 5,942 5,942 0 6,291 6,291 0 4,194 4,194 0 20,970 20,970- Mobile Milk sale 20 unit 1,820 780 2,600 1,820 780 2,600 2,184 936 3,120 1,456 624 2,080 7,280 3,120 10,400- UHTmilk Processing 8 unit 37,428 16,041 53,468 28,071 12,030 40,101 9,357 4,010 13,367 0 0 0 74,856 32,081 106,937- Chilling Tank 1500 liters 10 no 2,807 1,203 4,010 5,614 2,406 8,020 2,807 1,203 4,010 2,807 1,203 4,010 14,035 6,015 20,051
42,055 23,344 65,399 35,505 22,025 57,530 14,348 13,188 27,536 4,263 6,769 11,032 96,171 65,326 161,4972) Training of milk production and market network improvement
- Clean milk production (1 day training) day 0 7,800 7,800 0 7,500 7,500 0 4,800 4,800 0 4,200 4,200 0 24,300 24,300- O&M of UHT processing plant (3 day training) day 0 135 135 0 165 165 0 135 135 0 105 105 0 540 540- Establishment of effective milk collection (3 day training) day 0 120 120 0 150 150 0 105 105 0 90 90 0 465 465- Market planning etc. (3 day training) day 0 120 120 0 150 150 0 120 120 0 105 105 0 495 495
0 8,175 8,175 0 7,965 7,965 0 5,160 5,160 0 4,500 4,500 0 25,800 25,800
3-3 Livestock Service Quality and Accessibility Improvement Program (Milk) 28,232 16,190 44,422 32,612 23,348 55,960 17,800 10,709 28,509 15,657 8,641 24,298 94,301 58,888 153,1881) Improvement of cold chain for semen transport
- Liquid Nitrogen Tank 5 no 0 390 390 0 780 780 0 390 390 0 390 390 0 1,950 1,950- Semen canister (Big) 5 no 0 650 650 0 1,300 1,300 0 650 650 0 650 650 0 3,250 3,250- Semen canister (Middle) 12 no 0 156 156 0 312 312 0 234 234 0 234 234 0 936 936- AI kits 100 set 0 499 499 0 749 749 0 416 416 0 416 416 0 2,080 2,080
0 1,695 1,695 0 3,141 3,141 0 1,690 1,690 0 1,690 1,690 0 8,216 8,2161) Livestock Training Program
i) Training of trainers 2,055 time 0 1,740 1,740 0 2,400 2,400 0 1,065 1,065 0 960 960 0 6,165 6,165ii) Training of input suppliers 500 time 0 188 188 0 233 233 0 180 180 0 150 150 0 750 750
0 1,928 1,928 0 2,633 2,633 0 1,245 1,245 0 1,110 1,110 0 6,915 6,9152) Livestock services program
i) Livestock service center- Construction of livestock service center 60 place 12,567 12,567 25,135 17,574 17,574 35,148 7,774 7,774 15,549 5,841 5,841 11,681 43,757 43,757 87,513- Pickup track 10 unit 12,532 0 12,532 12,532 0 12,532 8,354 0 8,354 8,354 0 8,354 41,772 0 41,772- Motor cycle 42 no 3,133 0 3,133 2,506 0 2,506 1,671 0 1,671 1,462 0 1,462 8,772 0 8,772
28,232 12,567 40,799 32,612 17,574 50,186 17,800 7,774 25,574 15,657 5,841 21,498 94,301 43,757 138,057
4. Consulting Services Incorporated in the Summary
5. Administration Cost of PMU & PDOA Incorporated in the Summary
2,382,019 1,392,792 3,774,812 1,686,271 1,158,815 2,845,086 1,319,357 924,424 2,243,781 691,942 501,759 1,193,701 6,079,669 3,977,790 10,057,459check 3,774,812 2,845,086 2,243,781 1,193,701 10,057,459 check
Eligible
RemarksZone-01 Zone-02 Zone-03 Zone-04 Total
Eligible Eligible Eligible Eligible
Sub-Total
GRAND TOTAL
No. Program InputsQ'ty Unit
Amount (Rs.1,000)
Sub-Total
Sub-Total
Sub-Total
Sub-Total
Sub-Total
Sub-Total
Sub-Total

The Preparatory Survey on the Project for Improvement of Agricultural Production and Productivity in Dry Zone Areas in Democratic Socialist Republic of Sri Lanka
Final Report
T 5-52
Table A 5.25 Breakdown of Consulting Service Cost
Item Unit Q'tyF/C (Yen 1,000) L/C (Rs.1,000) Total
Unit rate Amount Unit rate Amount
(Yen 1,000) (Rs.1000)
(1) Remuneration and salary Professional (A) MM 122 2,350 286,700 286,700 479,043Professional (B) MM 1,973 350 690,550 413,284 690,550Sub professional MM 3,463 150 519,450 310,883 519,450Supporting staff/Office Manager 3,508 Accountant/Office Manager MM 370 121 44,770 26,794 44,770
Office Clerk MM 444 80 35,520 21,258 35,520Secretary MM 444 50 22,200 13,286 22,200Computer operator MM 444 100 44,400 26,573 44,400Office Aid MM 444 30 13,320 7,972 13,320Driver MM 1,362 50 68,100 40,757 68,100
Sub-total (1) (round) 286,700 1,438,310 1,147,507 1,917,353(2) Direct cost
International air fare Trip 21 200 4,200 4,200 7,018Mobilization cost for Professional (A) Time 6 15 90 90 150Per Diem for Pro (A) Month 122 300 36,600 36,600 61,154Procurement of Vehicle No. 21 2,500 52,500 52,500 87,722Procurement of motorcycle No. 62 200 12,400 12,400 20,719Hotel accommodation for short term Pro (A) Month 12 300 3,600 2,155 3,600Accommodation for Pro (A) Month 72 300 21,600 12,927 21,600Out of station allowance for Pro (B) Day 5,919 2 11,838 7,085 11,838Lodging cost for Pro (B) MM 1,973 50 98,650 59,041 98,650Initial office set up cost place 6 1,000 6,000 3,591 6,000Office supply Month 444 50 22,200 13,286 22,200Office equipment procurement cost LS 1 10,000 10,000 5,985 10,000O&M for vehicle & motorcycle Month 66 1,782 117,612 70,389 117,612Vehicle rental charge Month 18 1,000 18,000 10,773 18,000Communication cost Month 74 50 3,700 2,214 3,700Report preparation cost Month 74 30 2,220 1,329 2,220Survey & Geological Investigation LS 1 20,000 20,000 11,970 20,000Baseline survey and M&E LS 1 10,000 10,000 5,985 10,000Ground water survey Location 60 200 12,000 7,182 12,000Contingency LS 1 10,000 10,000 5,985 10,000
Sub-total (2) (round) 105,790 367,420 325,685 544,183Grand Total for the Project 392,490 1,805,730 1,473,192 2,461,536
Exchange rate : 1.0 US$ = 79.0 Yen 1.0 US$ = 132.0 Rs.
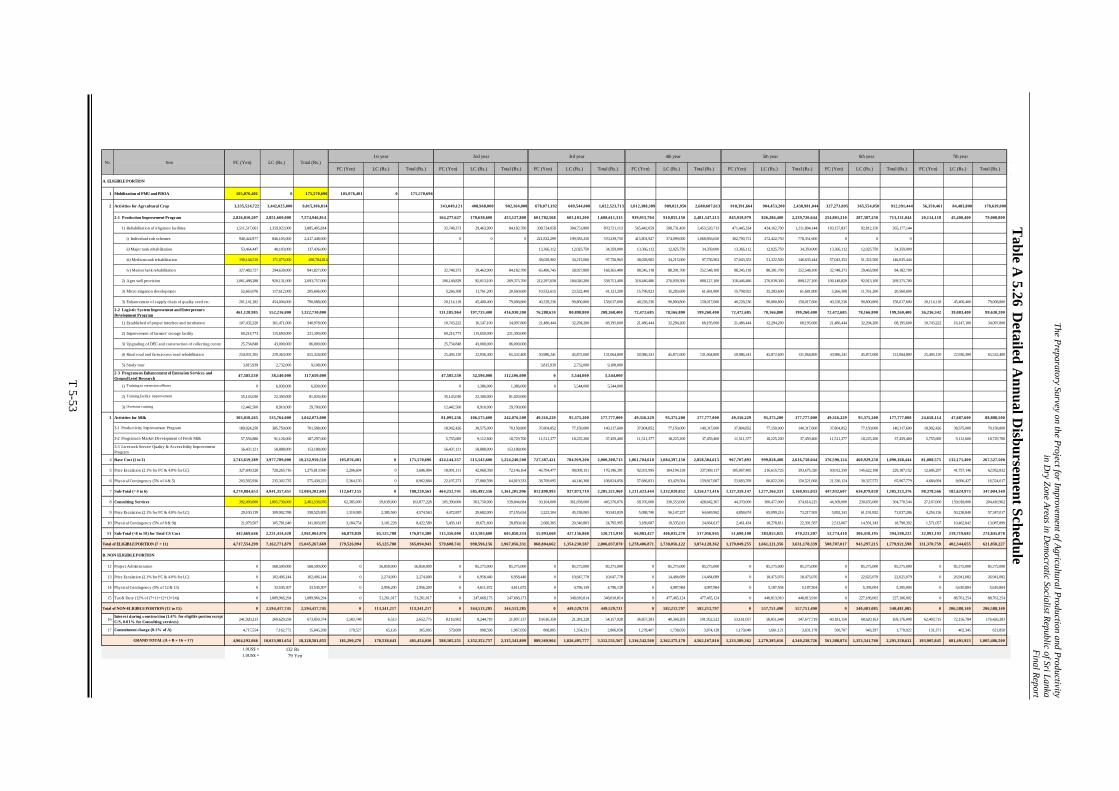
The Preparatory Survey on the P
roject for Improvem
ent of Agricultural P
roduction and Productivity
in Dry Zone A
reas in Dem
ocratic Socialist Republic of Sri Lanka
Final R
eport
T 5-53
Table A
5.26 Detailed A
nnual Disbursem
ent Schedule
FC (Yen) LC (Rs.) Total (Rs.) FC (Yen) LC (Rs.) Total (Rs.) FC (Yen) LC (Rs.) Total (Rs.) FC (Yen) LC (Rs.) Total (Rs.) FC (Yen) LC (Rs.) Total (Rs.) FC (Yen) LC (Rs.) Total (Rs.) FC (Yen) LC (Rs.) Total (Rs.)
A. ELIGIBLE PORTION
1 Mobilization of PMU and PDOA 105,076,401 0 175,570,696 105,076,401 0 175,570,696
2 Activities for Agrcultural Crop 3,335,524,722 3,442,025,000 9,015,306,814 343,049,121 408,968,000 982,164,000 678,071,192 689,544,000 1,822,523,713 1,012,388,389 989,021,950 2,680,607,613 918,391,664 904,453,200 2,438,981,044 327,273,895 365,554,050 912,391,444 56,350,461 84,483,800 178,639,000
2-1 Production Improvement Program 2,826,810,207 2,851,669,000 7,574,946,814 164,277,627 178,638,600 453,127,800 601,782,568 603,101,200 1,608,611,313 939,915,704 910,855,150 2,481,347,213 845,918,979 826,286,400 2,239,720,644 254,801,210 287,387,250 713,131,044 20,114,118 45,400,400 79,008,800
1) Rehabilitation of irrigation facilities 1,511,517,661 1,359,922,000 3,885,495,814 32,748,373 29,463,900 84,182,700 338,724,058 304,751,800 870,721,113 565,442,059 508,731,450 1,453,520,713 471,445,334 424,162,700 1,211,894,144 103,157,837 92,812,150 265,177,144
i) Individual sub schemes 940,424,977 846,105,000 2,417,448,000 0 0 0 221,832,299 199,583,250 570,239,750 415,801,927 374,099,000 1,068,856,650 302,790,751 272,422,750 778,351,600 0 0 0
ii) Major tank rehabilitation 53,464,447 48,103,000 137,436,000 13,366,112 12,025,750 34,359,000 13,366,112 12,025,750 34,359,000 13,366,112 12,025,750 34,359,000 13,366,112 12,025,750 34,359,000
iii) Medium tank rehabilitation 190,144,510 171,075,000 488,784,814 38,028,902 34,215,000 97,756,963 38,028,902 34,215,000 97,756,963 57,043,353 51,322,500 146,635,444 57,043,353 51,322,500 146,635,444
iv) Mainor tank rehabilitation 327,483,727 294,639,000 841,827,000 32,748,373 29,463,900 84,182,700 65,496,745 58,927,800 168,365,400 98,245,118 88,391,700 252,548,100 98,245,118 88,391,700 252,548,100 32,748,373 29,463,900 84,182,700
2) Agro well provision 1,061,488,288 920,131,000 2,693,757,000 106,148,829 92,013,100 269,375,700 212,297,658 184,026,200 538,751,400 318,446,486 276,039,300 808,127,100 318,446,486 276,039,300 808,127,100 106,148,829 92,013,100 269,375,700
3) Micro irrigation development 52,663,076 117,612,000 205,606,000 5,266,308 11,761,200 20,560,600 10,532,615 23,522,400 41,121,200 15,798,923 35,283,600 61,681,800 15,798,923 35,283,600 61,681,800 5,266,308 11,761,200 20,560,600
3) Enhancement of supply chain of quality seed etc. 201,141,182 454,004,000 790,088,000 20,114,118 45,400,400 79,008,800 40,228,236 90,800,800 158,017,600 40,228,236 90,800,800 158,017,600 40,228,236 90,800,800 158,017,600 40,228,236 90,800,800 158,017,600 20,114,118 45,400,400 79,008,800
461,128,985 552,216,000 1,322,710,000 131,185,964 197,733,400 416,930,200 76,288,624 80,898,800 208,368,400 72,472,685 78,166,800 199,260,400 72,472,685 78,166,800 199,260,400 72,472,685 78,166,800 199,260,400 36,236,342 39,083,400 99,630,200
1) Established of proper interface and incubation 107,432,220 161,471,000 340,978,000 10,743,222 16,147,100 34,097,800 21,486,444 32,294,200 68,195,600 21,486,444 32,294,200 68,195,600 21,486,444 32,294,200 68,195,600 21,486,444 32,294,200 68,195,600 10,743,222 16,147,100 34,097,800
2) Improvement of farmers' storage facility 69,214,773 115,650,000 231,300,000 69,214,773 115,650,000 231,300,000
3) Upgrading of DEC and construction of collecting centre 25,734,848 43,000,000 86,000,000 25,734,848 43,000,000 86,000,000
4) Rural road and farm access road rehabilitation 254,931,205 229,363,000 655,324,000 25,493,120 22,936,300 65,532,400 50,986,241 45,872,600 131,064,800 50,986,241 45,872,600 131,064,800 50,986,241 45,872,600 131,064,800 50,986,241 45,872,600 131,064,800 25,493,120 22,936,300 65,532,400
5) Study tour 3,815,939 2,732,000 9,108,000 3,815,939 2,732,000 9,108,000
47,585,530 38,140,000 117,650,000 47,585,530 32,596,000 112,106,000 0 5,544,000 5,544,000
1) Training to extension officers 0 6,930,000 6,930,000 0 1,386,000 1,386,000 0 5,544,000 5,544,000
2) Training facility improvement 35,143,030 22,300,000 81,020,000 35,143,030 22,300,000 81,020,000
3) Overseas training 12,442,500 8,910,000 29,700,000 12,442,500 8,910,000 29,700,000
3 Activities for Milk 303,018,265 535,764,000 1,042,073,000 81,095,236 106,575,600 242,076,500 49,316,229 95,375,200 177,777,000 49,316,229 95,375,200 177,777,000 49,316,229 95,375,200 177,777,000 49,316,229 95,375,200 177,777,000 24,658,114 47,687,600 88,888,500
189,024,258 385,750,000 701,588,000 18,902,426 38,575,000 70,158,800 37,804,852 77,150,000 140,317,600 37,804,852 77,150,000 140,317,600 37,804,852 77,150,000 140,317,600 37,804,852 77,150,000 140,317,600 18,902,426 38,575,000 70,158,800
57,556,886 91,126,000 187,297,000 5,755,689 9,112,600 18,729,700 11,511,377 18,225,200 37,459,400 11,511,377 18,225,200 37,459,400 11,511,377 18,225,200 37,459,400 11,511,377 18,225,200 37,459,400 5,755,689 9,112,600 18,729,700
56,437,121 58,888,000 153,188,000 56,437,121 58,888,000 153,188,000
4 Base Cost (1 to 3) 3,743,619,389 3,977,789,000 10,232,950,510 105,076,401 0 175,570,696 424,144,357 515,543,600 1,224,240,500 727,387,421 784,919,200 2,000,300,713 1,061,704,618 1,084,397,150 2,858,384,613 967,707,893 999,828,400 2,616,758,044 376,590,124 460,929,250 1,090,168,444 81,008,575 132,171,400 267,527,500
5 Price Escalation (2.1% for FC & 4.0% for LC) 327,699,328 728,265,716 1,275,813,960 2,206,604 0 3,686,984 18,001,111 42,068,358 72,146,164 46,794,477 98,008,151 176,196,391 92,031,995 184,194,138 337,969,117 105,967,485 216,615,725 393,675,320 50,012,359 145,622,198 229,187,152 12,685,297 41,757,146 62,952,832
6 Physical Contingency (5% of 4 & 5) 203,565,936 235,302,735 575,438,223 5,364,150 0 8,962,884 22,107,273 27,880,598 64,819,333 38,709,095 44,146,368 108,824,856 57,686,831 63,429,564 159,817,687 53,683,769 60,822,206 150,521,668 21,330,124 30,327,572 65,967,779 4,684,694 8,696,427 16,524,017
7 Sub-Total (= 4 to 6) 4,274,884,653 4,941,357,451 12,084,202,693 112,647,155 0 188,220,563 464,252,741 585,492,556 1,361,205,996 812,890,993 927,073,719 2,285,321,960 1,211,423,444 1,332,020,852 3,356,171,416 1,127,359,147 1,277,266,331 3,160,955,033 447,932,607 636,879,020 1,385,323,376 98,378,566 182,624,973 347,004,349
8 Consulting Services 392,490,000 1,805,730,000 2,461,536,076 62,385,000 59,639,000 163,877,228 105,390,000 363,750,000 539,844,684 50,104,000 361,658,000 445,376,076 58,705,000 330,553,000 428,642,367 44,370,000 300,477,000 374,614,215 44,369,000 230,635,000 304,770,544 27,167,000 159,018,000 204,410,962
9 Price Escalation (2.1% for FC & 4.0% for LC) 29,100,139 309,902,788 358,525,805 1,310,085 2,385,560 4,574,563 4,472,857 29,682,000 37,155,634 3,223,304 45,158,065 50,543,839 5,088,740 56,147,257 64,649,962 4,858,674 65,099,214 73,217,505 5,892,343 61,191,852 71,037,286 4,254,136 50,238,840 57,347,017
10 Physical Contingency (5% of 8 & 9)) 21,079,507 105,781,640 141,003,095 3,184,754 3,101,228 8,422,589 5,493,143 19,671,600 28,850,016 2,666,365 20,340,803 24,795,995 3,189,687 19,335,013 24,664,617 2,461,434 18,278,811 22,391,587 2,513,067 14,591,343 18,790,392 1,571,057 10,462,842 13,087,899
11 Sub-Total (=8 to 10) for Total CS Cost 442,669,646 2,221,414,428 2,961,064,976 66,879,839 65,125,788 176,874,380 115,356,000 413,103,600 605,850,334 55,993,669 427,156,868 520,715,910 66,983,427 406,035,270 517,956,945 51,690,108 383,855,025 470,223,307 52,774,410 306,418,195 394,598,222 32,992,193 219,719,682 274,845,878
Total of ELIGIBLE PORTION (7 + 11) 4,717,554,299 7,162,771,879 15,045,267,669 179,526,994 65,125,788 365,094,943 579,608,741 998,596,156 1,967,056,331 868,884,662 1,354,230,587 2,806,037,870 1,278,406,871 1,738,056,122 3,874,128,362 1,179,049,255 1,661,121,356 3,631,178,339 500,707,017 943,297,215 1,779,921,598 131,370,759 402,344,655 621,850,227
B. NON ELIGIBLE PORTION
12 Project Administration 0 568,500,000 568,500,000 0 56,850,000 56,850,000 0 85,275,000 85,275,000 0 85,275,000 85,275,000 0 85,275,000 85,275,000 0 85,275,000 85,275,000 0 85,275,000 85,275,000 0 85,275,000 85,275,000
13 Price Escalation (2.1% for FC & 4.0% for LC) 0 102,406,144 102,406,144 0 2,274,000 2,274,000 0 6,958,440 6,958,440 0 10,647,778 10,647,778 0 14,484,689 14,484,689 0 18,475,076 18,475,076 0 22,625,079 22,625,079 0 26,941,082 26,941,082
14 Physical Contingency (5% of 12 & 13) 0 33,545,307 33,545,307 0 2,956,200 2,956,200 0 4,611,672 4,611,672 0 4,796,139 4,796,139 0 4,987,984 4,987,984 0 5,187,504 5,187,504 0 5,395,004 5,395,004 0 5,610,804 5,610,804
15 Tax & Duty (12% of (7+11+12+13+14)) 0 1,889,966,294 1,889,966,294 0 51,261,017 51,261,017 0 247,668,173 247,668,173 0 348,810,814 348,810,814 0 477,465,124 477,465,124 0 448,813,910 448,813,910 0 227,186,002 227,186,002 0 88,761,254 88,761,254
Total of NON-ELIGIBLE PORTION (12 to 15) 0 2,594,417,745 2,594,417,745 0 113,341,217 113,341,217 0 344,513,285 344,513,285 0 449,529,731 449,529,731 0 582,212,797 582,212,797 0 557,751,490 557,751,490 0 340,481,085 340,481,085 0 206,588,140 206,588,140
16 241,920,213 269,629,258 673,850,374 1,583,748 6,513 2,652,775 8,116,902 8,244,719 21,807,137 19,616,358 21,381,228 54,157,928 36,857,283 40,368,203 101,952,523 53,161,057 58,851,648 147,677,719 60,181,150 68,620,163 169,176,008 62,403,715 72,156,784 176,426,283
17 4,717,554 7,162,772 15,045,268 179,527 65,126 365,095 579,609 998,596 1,967,056 868,885 1,354,231 2,806,038 1,278,407 1,738,056 3,874,128 1,179,049 1,661,121 3,631,178 500,707 943,297 1,779,922 131,371 402,345 621,850
4,964,192,066 10,033,981,654 18,328,581,055 181,290,270 178,538,643 481,454,030 588,305,251 1,352,352,757 2,335,343,809 889,369,904 1,826,495,777 3,312,531,567 1,316,542,560 2,362,375,178 4,562,167,810 1,233,389,362 2,279,385,616 4,340,238,726 561,388,874 1,353,341,760 2,291,358,612 193,905,845 681,491,923 1,005,486,500
1.0US$ = 132 Rs1.0US$ = 79 Yen
No. Item FC (Yen) LC (Rs.)5th year 6th year 7th year
Total (Rs.)2nd year 3rd year 4th year1st year
Interest during construction (1.4% for eligible portion exceptC/S, 0.01% for Consulting services)
GRAND TOTAL (A + B + 16 + 17)
Commitment charge (0.1% of A)
2-2 Logistic System Improvement and EnterprenursDevelopment Program
2-3 Program on Enhancement of Extension Services andGround Level Research
3-1 Productivity Improvement Program
3-2 Program on Market Development of Fresh Milk
3-3 Livestock Service Quality & Accessibility ImprovementProgram

The Preparatory Survey on the Project for Improvement of Agricultural Production and Productivity in Dry Zone Areas in Democratic Socialist Republic of Sri Lanka
Final Report
T 6-1
Table A 6.1 Economic Prices of Crops and Fertilizers
Note: * Amonia, CU3 and Hydro are applied to some vegetables. Source: JICA Survey Team
Item Unit Financial Item Unit Financial(Rs.) (Rs.)
Products Fertilizers- Paddy kg 25.9 Fertilizer for paddy- Maize kg 22.2 - Urea kg 49.3- Krakkan kg 60.0 - TSP kg 56.3- Green gram kg 170.0 - MOP kg 66.7- Black gram kg 160.0 - TDM kg 57.4- Cowpea kg 135.0 - Mixture ton 57.4- Gingelly kg 120.0 - Poultry manure ton - - Soybean kg 48.5 - Others ha - - Groundnut kg 99.0 Fertilizer for other crops- Red onion kg 87.0 - Urea kg 49.3- Big onion kg 67.0 - TSP kg 56.3- Chillies kg 100.0 - MOP kg 66.7- Pumpkin kg 20.0 - TDM kg 57.4- Brinjal kg 38.5 - Mixture kg 57.4- Bitter gourd kg 51.0 - Poultry manure ton 20,000.0- Capsicum kg 90.5 - Compost fertilizer ton 20,000.0- Tomato kg 48.5 - Others* ha 22,000.0- Banana kg 20.0- Pineapple fruit 42.5 Agro-chemicals- Pineapple kg 34.0 Herbicide- Papaw fruit 21.6 - Paddy ha 6,764.5- Papaw kg 33.2 - OFC (excluding onions and chillies) ha 3,818.0- Passion fruit kg 51.3 - Vegetables (including onions and chillies) ha 4,905.3- Mango kg 58.2 - Fruits ha 10,084.5- Orange fruit 9.6 Pesticide- Orange kg 76.8 - Paddy ha 3,494.3- Lime kg 60.0 - OFC (excluding onions and chillies) ha 3,477.7- Pomegranate kg 48.6 - Vegetables (including onions and chillies) ha 28,676.5- Guava kg 66.4 - Fruits ha 8,831.2
Hormone for pineapple ha 3,610.0Seeds, suckers and seedlings
- Paddy kg 64.0 Farm Machinery- Maize kg 588.3 - Land preparation ha 12,730.0- Krakkan kg 66.0 - Irrigation by pump ha 22,420.0- Green gram kg 263.0 - Threshing and winnowing ton 2,327.5- Black gram kg 178.0 - Transportation of production ton 361.0- Cowpea kg 154.0- Gingelly kg 183.0 Labour- Soybean kg 120.2 - Hired labour prn-day 481.0- Groundnut kg 111.0 - Family labour prn-day 481.0- Red onion kg 112.0- Big onion kg 3,738.9 Others- Chillies kg 1,758.6 - Support of tomato ha 42,655.0- Pumpkin kg 16,990.1 - Support of passion fruit ha 66,690.0- Brinjal kg 8,981.9- Bitter gourd kg 5,117.5- Capsicum kg 9,887.0- Tomato kg 26,315.5- Banana No. 21.6- Pineapple No. 5.3- Papaw No. 32.5- Passion fruit No. 16.2- Mango No. 108.2- Orange No. 108.2- Lime No. 162.2- Pomegranate No. 27.1- Guava No. 16.2

The Preparatory Survey on the Project for Improvement of Agricultural Production and Productivity in Dry Zone Areas in Democratic Socialist Republic of Sri Lanka
Final Report
T 6-2
Table A 6.2 Economic Price of Paddy
Source: JICA Survey Team
Table A 6.3 Economic Price of Maize Source: JICA Survey Team
Operation US$/ton Rs/Kg Operation US$/ton Rs/Kg1. Price Forecast of maize, Gulf Ports, USA, f.o.b. 185.0 185.02. Insurance, freight, etc. 60.03. Forecast 2012 c.i.f. price of maize, Colombo 245.0 185.0
31.7 23.94. Port handling, storage and losses 5% + 1.6 5% - 1.25. Transportation (port to wholesaler) + 2.0 - 2.06. Ex-wholesaler price 35.3 20.77. Local transportation (village to wholesaler) - 2.0 - 2.08. Merketing Margin 10% - 3.5 10% - 2.19. Local transportation (farm to village) - 1.0 - 1.010. Economic farm gate price 28.7 15.711. Average economic farm gate price of import and export parity 22.2
1. USA maice, forecast in nominal US$ in 2025, converted to 2012 constant price - Projection in 2025 230 - MUV index 2012-2025 1.24 - Projection in 2025 by constant price in 2012 185
4. 1US$=129.3Rs
Import Parity Export Parity
Operation US$/ton Rs/Kg Operation US$/ton Rs/Kg1. Price Forecast of rice, Bangkok, Thailand, f.o.b. 387.0 387.02. Quality Adjustment 95 (10% broken) 367.7 367.73. Insurance, freight, etc. 40.04. Forecast 2012 c.i.f. price of rice, Colombo 407.7 367.7
52.7 47.55. Port handling, storage and losses 5% + 2.6 5% - 2.46. Transportation (port to wholesaler) + 2.0 - 2.07. Ex-wholesaler price 57.3 43.28. Merketing Margin 10% - 5.7 10% - 4.39. Local transportation (village to wholesaler) - 2.0 - 2.010. Value of Milled Rice 49.6 36.811. Conversion of Paddy 68% 33.7 68% 25.112. Milling Cost - 2.5 - 2.513. Local transportation (farm to village) - 1.0 - 1.014. Economic farm gate price 30.2 21.615. Average economic farm gate price of import and export parity 25.9
1. Thai 5% broken rice, price forecast in nominal US$ in 2025, converted to 2012 constant price - Projection in 2025 480 - MUV index 2012-2025 1.24 - Projection in 2025 by constant price in 2012 387
4. 1US$=129.3Rs
Import Parity Export Parity

The Preparatory Survey on the Project for Improvement of Agricultural Production and Productivity in Dry Zone Areas in Democratic Socialist Republic of Sri Lanka
Final Report
T 6-3
Table A 6.4 Economic Price of Soybeans Source: JICA Survey Team
Table A 6.5 Economic Farmgate Prices of Fertilizers
Source: JICA Survey Team
Unit US$ Rs. US$ Rs. US$ Rs.1. Bulk Price in 2025 Forecast *1 US$/t 242.0 298.0 371.02. Freight to Colombo US$/t 60.0 60.0 60.03. c.i.f. Colombo US$/t 302.0 358.0 431.0
Rs./kg 39.0 46.3 55.74. Handling Cost *2 Rs./kg 8.2 8.0 9.05. Transportation Cost to the Study Area *2 Rs./kg 1.6 1.6 1.66. Profit Margin *2 Rs./kg 0.4 0.4 0.47. Farmgate Price Rs./kg 49.3 56.3 66.7
* 1US$=129.3Rs*1 World Bank Commodity Price Forecast in June/2012*2 From 4-7, the actual cost is provided by the National Fertilizer Secretariat,Ministry of Agrarian Development and Wild Life
Urea TSP MOP
Operation US$/ton Rs/Kg Operation US$/ton Rs/Kg1. Price Forecast of soybeans, Rotterdam, USA, f.o.b. 411.0 411.02. Insurance, freight, etc. 60.03. Forecast 2012 c.i.f. price of maize, Colombo 471.0 411.0
60.9 53.14. Port handling, storage and losses 5% + 3.0 5% - 2.75. Transportation (port to wholesaler) + 2.0 - 2.06. Ex-wholesaler price 65.9 48.57. Local transportation (village to wholesaler) - 2.0 - 2.08. Merketing Margin 10% - 6.6 10% - 4.89. Local transportation (farm to village) - 1.0 - 1.010. Economic farm gate price 56.4 40.611. Average economic farm gate price of import and export parity 48.5
1. USA soybeans, price forecast in nominal US$ in 2025, converted to 2012 constant price - Projection in 2025 510 - MUV index 2012-2025 1.24 - Projection in 2025 by constant price in 2012 411
4. 1US$=129.3Rs
Import Parity Export Parity

The Preparatory Survey on the P
roject for Improvem
ent of Agricultural P
roduction and Productivity
in Dry Zone A
reas in Dem
ocratic Socialist Republic of Sri Lanka
Final R
eport
T 6-4
Table A
6.6 E
conomic C
rop Budget of O
FC, Paddy and V
egetables per Hectare under
With-project C
onditions (OFC
)
Black gram Cowpea Green gram Soybean Groundnut
Unit Unit Unit Unit Unit UnitPrice Amount Value Price Amount Value Price Amount Value Price Amount Value Price Amount Value(Rs) (Rs) (Rs) (Rs) (Rs) (Rs) (Rs) (Rs) (Rs) (Rs)
A. Gross IncomeYield (kg) 160.0 1,800.0 288,000.0 135.0 1,500.0 202,500.0 170.0 1,800.0 306,000.0 48.5 2,500.0 121,234.3 99.0 2,500.0 247,500.0
B. Production Cost1) Seeds (kg) 263.0 30.0 7,890.0 154.0 35.0 5,390.0 263.0 24.0 6,312.0 120.2 50.0 6,007.5 111.0 154.0 17,094.02) Fertilizers
- Urea (kg) 49.3 65.0 3,203.8 49.3 65.0 3,203.8 49.3 65.0 3,203.8 49.3 100.0 4,928.9 49.3 65.0 3,203.8- TSP (kg) 56.3 100.0 5,631.9 56.3 100.0 5,631.9 56.3 100.0 5,631.9 56.3 150.0 8,447.9 56.3 100.0 5,631.9- MOP (kg) 66.7 75.0 5,002.4 66.7 75.0 5,002.4 66.7 75.0 5,002.4 66.7 50.0 3,334.9 66.7 75.0 5,002.4- TDM (kg) 57.4 0.0 0.0 57.4 0.0 0.0 57.4 0.0 0.0 57.4 0.0 0.0 57.4 0.0 0.0- Mixture (kg) 57.4 0.0 0.0 57.4 0.0 0.0 57.4 0.0 0.0 57.4 0.0 0.0 57.4 0.0 0.0- Poultry manure (ton) 20,000.0 0.0 0.0 20,000.0 0.0 0.0 20,000.0 0.0 0.0 20,000.0 0.0 0.0 20,000.0 0.0 0.0- Others (ha) 22,000.0 0.0 0.0 22,000.0 0.0 0.0 22,000.0 0.0 0.0 22,000.0 0.0 0.0 22,000.0 0.0 0.0 Sub-total 13,838.1 13,838.1 13,838.1 16,711.7 13,838.1
3) Agro-chemicals- Herbicide (ha) 3,818.0 1.0 3,818.0 3,818.0 0.0 0.0 3,818.0 1.0 3,818.0 3,818.0 0.0 0.0 3,818.0 0.0 0.0- Pesticide (ha) 3,477.7 1.0 3,477.7 3,477.7 1.0 3,477.7 3,477.7 1.0 3,477.7 3,477.7 1.0 3,477.7 3,477.7 1.0 3,477.7 Sub-total 7,295.7 3,477.7 7,295.7 3,477.7 3,477.7
4) Machinery- Land preparation (ha) 12,730.0 1.0 12,730.0 12,730.0 1.0 12,730.0 12,730.0 1.0 12,730.0 12,730.0 1.0 12,730.0 12,730.0 1.0 12,730.0- Irrigation by pump (ha) 22,420.0 0.0 0.0 22,420.0 0.0 0.0 22,420.0 0.0 0.0 22,420.0 0.0 0.0 22,420.0 0.0 0.0- Threshing and winnowing (ton) 2,327.5 1.8 4,189.5 2,327.5 1.5 3,491.3 2,327.5 1.8 4,189.5 2,327.5 2.5 5,818.8 2,327.5 2.5 5,818.8- Transportation of production (ton) 361.0 1.8 649.8 361.0 1.5 541.5 361.0 1.8 649.8 361.0 2.5 902.5 361.0 2.5 902.5 Sub-total 17,569.3 16,762.8 17,569.3 19,451.3 19,451.3
5) Human labor- Hired (psn) 481.0 27.0 12,987.0 481.0 12.0 5,772.0 481.0 40.0 19,240.0 481.0 32.0 15,392.0 481.0 32.0 15,392.0- Family (psn) 481.0 25.0 12,025.0 481.0 84.0 40,404.0 481.0 32.0 15,392.0 481.0 84.0 40,404.0 481.0 84.0 40,404.0 Sub-total 52.0 25,012.0 96.0 46,176.0 72.0 34,632.0 116.0 55,796.0 116.0 55,796.0
6) Support (Rs) 0.0 0.0 0.0 0.0 0.07) Miscellaneous (5%) 3,580.3 4,282.2 3,982.4 5,072.2 5,482.9
Total Cost- Including famliy labour (Rs) 75,185.3 89,926.7 83,629.4 106,516.3 115,139.9- Excluding family labour (Rs) 63,160.3 49,522.7 68,237.4 66,112.3 74,735.9
C. Net Returen- Including famliy labour (Rs) 212,814.7 112,573.3 222,370.6 14,718.0 132,360.1- Excluding family labour (Rs) 224,839.7 152,977.3 237,762.6 55,122.0 172,764.1

The Preparatory Survey on the P
roject for Improvem
ent of Agricultural P
roduction and Productivity
in Dry Zone A
reas in Dem
ocratic Socialist Republic of Sri Lanka
Final R
eport
T 6-5
Table A
6.6 E
conomic C
rop Budget of O
FC, Paddy and V
egetables per Hectare under
With-project C
onditions (OFC
and Paddy)
Chilli (Green) Red onion Big onion Paddy IrrigatedUnit Unit Unit Unit Unit
Price Amount Value Price Amount Value Price Amount Value Price Amount Value(Rs) (Rs) (Rs) (Rs) (Rs) (Rs) (Rs) (Rs)
A. Gross IncomeYield (kg) 100.0 11,000.0 1,100,000.0 87.0 15,500.0 1,348,500.0 67.0 18,000.0 1,206,000.0 25.9 5,500.0 142,419.7
B. Production Cost1) Seeds (kg) 1,758.6 1.8 3,077.6 112.0 1,406.2 157,494.4 3,738.9 7.7 28,789.5 64.0 139.3 8,915.22) Fertilizers
-Urea (kg) 49.3 255.0 12,568.6 49.3 139.0 6,851.1 49.3 200.0 9,857.7 49.3 274.0 13,505.1- TSP (kg) 56.3 145.0 8,166.3 56.3 290.0 16,332.6 56.3 185.0 10,419.1 56.3 101.0 5,688.3- MOP (kg) 66.7 130.0 8,670.8 66.7 0.0 0.0 66.7 0.0 0.0 66.7 89.0 5,936.1- TDM (kg) 57.4 0.0 0.0 57.4 0.0 0.0 57.4 0.0 0.0 57.4 0.0 0.0- Mixture (kg) 57.4 150.0 8,615.3 57.4 321.0 18,436.8 57.4 520.0 29,866.4 57.4 0.0 0.0- Poultry manure (ton) 20,000.0 0.0 0.0 20,000.0 0.0 0.0 20,000.0 0.0 0.0 20,000.0 0.0 0.0- Others (ha) 22,000.0 1.0 22,000.0 22,000.0 1.0 22,000.0 22,000.0 1.0 22,000.0 22,000.0 0.0 0.0 Sub-total 60,021.0 63,620.5 72,143.2 25,129.5
3) Agro-chemicals- Herbicide (ha) 4,905.3 0.0 0.0 4,905.3 1.0 4,905.3 4,905.3 1.0 4,905.3 6,764.5 1.0 6,764.5- Pesticide (ha) 28,676.5 1.0 28,676.5 28,676.5 1.0 28,676.5 28,676.5 1.0 28,676.5 3,494.3 1.0 3,494.3 Sub-total 28,676.5 33,581.8 33,581.8 10,258.8
4) Machinery- Land preparation (ha) 12,730.0 1.0 12,730.0 12,730.0 1.0 12,730.0 12,730.0 1.0 12,730.0 12,730.0 1.0 12,730.0- Irrigation by pump (ha) 22,420.0 0.0 0.0 22,420.0 0.0 0.0 22,420.0 0.0 0.0 22,420.0 0.0 0.0- Threshing and winnowing (ton) 2,327.5 0.0 0.0 2,327.5 0.0 0.0 2,327.5 0.0 0.0 2,327.5 5.5 12,801.3- Transportation of production (ton) 361.0 11.0 3,971.0 361.0 15.5 5,595.5 361.0 18.0 6,498.0 361.0 5.5 1,985.5 Sub-total 16,701.0 18,325.5 19,228.0 27,516.8
5) Human labor- Hired (psn) 481.0 146.0 70,226.0 481.0 175.0 84,175.0 481.0 210.0 101,010.0 481.0 32.0 15,392.0- Family (psn) 481.0 228.0 109,668.0 481.0 62.0 29,822.0 481.0 89.0 42,809.0 481.0 35.0 16,835.0 Sub-total 374.0 179,894.0 237.0 113,997.0 299.0 143,819.0 67.0 32,227.0
6) Support (Rs) 0.0 0.0 0.0 0.07) Miscellaneous (5%) 14,418.5 19,351.0 14,878.1 5,202.4
Total Cost- Including famliy labour (Rs) 302,788.6 406,370.2 312,439.6 109,249.6- Excluding family labour (Rs) 193,120.6 376,548.2 269,630.6 92,414.6
C. Net Returen- Including famliy labour (Rs) 797,211.4 942,129.8 893,560.4 33,170.1- Excluding family labour (Rs) 906,879.4 971,951.8 936,369.4 50,005.1

The Preparatory Survey on the P
roject for Improvem
ent of Agricultural P
roduction and Productivity
in Dry Zone A
reas in Dem
ocratic Socialist Republic of Sri Lanka
Final R
eport
T 6-6
Table A
6.6 E
conomic C
rop Budget of O
FC, Paddy and V
egetables per Hectare under
With-project C
onditions (Fruit Summ
ary)
Banana: 5-year Ave. Papaw: 4-year Average Passion fruit: 5-Yr Ave. Mango: 20-Yr Ave. Orange: 15-Yr Ave. Lime: 15-Yr Ave.Unit Unit Value Unit Value Unit Value Unit Value Unit Value Unit Value
Price Amount Price Amount Price Amount Price Amount Price Amount Price Amount(Rs) (Rs) (Rs) (Rs) (Rs) (Rs) (Rs) (Rs) (Rs) (Rs) (Rs) (Rs)
A. Gross IncomeYield (kg) 20.0 20,000.0 400,000.0 33.2 25,000.0 830,000.0 51.3 14,000.0 718,200.0 58.2 20,000.0 ######### 76.8 12,000.0 921,600.0 60.0 23,000.0 #########
B. Production Cost1) Suckers (kg) 21.6 220.0 4,757.9 32.5 281.3 9,136.4 16.2 225.0 3,644.6 108.2 5.3 568.2 108.2 37.5 4,054.8 162.2 46.7 7,571.52) Fertilizers 0.0 0.0 0.0 0.0 0.0 0.0 0.0 0.0 0.0 0.0 0.0 0.0
-Urea (kg) 49.3 425.0 20,949.6 49.3 553.7 27,290.6 49.3 332.5 16,388.1 49.3 140.1 6,905.3 49.3 223.1 10,994.6 49.3 284.1 14,002.2- TSP (kg) 56.3 283.4 15,958.7 56.3 320.3 18,038.2 56.3 592.6 33,372.6 56.3 170.2 9,585.6 56.3 276.5 15,574.2 56.3 301.3 16,967.0- MOP (kg) 66.7 885.0 59,030.7 66.7 1,167.0 77,838.7 66.7 296.3 19,761.4 66.7 76.8 5,122.4 66.7 125.9 8,399.5 66.7 79.9 5,330.8- TDM (kg)- Mixture (kg)- Compost (ton) 20,000.0 4.8 96,000.0 20,000.0 11.0 220,000.0 20,000.0 10.0 200,000.0 20,000.0 10.0 200,000.0 20,000.0 6.0 119,493.3 20,000.0 11.0 220,000.0- Others (ha) 22,000.0 0.0 0.0 22,000.0 0.0 0.0 22,000.0 1.0 22,000.0 22,000.0 0.0 0.0 22,000.0 0.0 0.0 22,000.0 0.0 0.0 Sub-total 191,939.0 343,167.5 291,522.1 221,613.3 154,461.7 256,300.0
3) Agro-chemicals 0.0 0.0 0.0 0.0- Herbicide (ha) 10,084.5 1.0 10,084.5 10,084.5 0.0 0.0 10,084.5 0.0 0.0 10,084.5 1.0 10,084.5 10,084.5 1.0 10,084.5 10,084.5 1.0 10,084.5- Pesticide (ha) 8,831.2 0.8 7,065.0 8,831.2 1.0 8,831.2 8,831.2 1.0 8,831.2 8,831.2 1.0 8,389.6 8,831.2 1.0 8,831.2 8,831.2 1.0 8,831.2- Hormone (ha) 3,610.0 0.0 0.0 3,610.0 0.0 0.0 3,610.0 0.0 0.0 3,610.0 0.0 0.0 3,610.0 0.0 0.0 3,610.0 0.0 0.0 Sub-total 17,149.5 8,831.2 8,831.2 18,474.1 18,915.7 18,915.7
4) Machinery 0.0 0.0 0.0 0.0 0.0 0.0 0.0 0.0 0.0 0.0 0.0 0.0Land preparation (ha) 12,730.0 0.2 2,546.0 12,730.0 0.3 3,182.5 12,730.0 0.2 2,546.0 12,730.0 0.1 636.5 12,730.0 0.1 848.7 12,730.0 0.1 848.7Irrigation by pump (ha) 22,420.0 1.0 22,420.0 22,420.0 1.0 22,420.0 22,420.0 1.0 22,420.0 22,420.0 1.0 22,420.0 22,420.0 1.0 22,420.0 22,420.0 1.0 22,420.0Transport produce per ton (ton) 361.0 20.0 7,220.0 361.0 25.0 9,025.0 361.0 14.0 5,054.0 361.0 20.0 7,220.0 361.0 12.0 4,332.0 361.0 23.0 8,303.0 Sub-total 32,186.0 34,627.5 30,020.0 30,276.5 27,600.7 31,571.7
5) Human labor- Hired (psn) 481.0 57.2 27,513.2 481.0 108.8 52,352.1 481.0 105.4 50,697.4 481.0 76.0 36,556.0 481.0 45.2 21,741.2 481.0 65.7 31,617.7- Family (psn) 481.0 87.8 42,231.8 481.0 167.7 80,644.4 481.0 163.8 78,787.8 481.0 119.6 57,527.6 481.0 71.1 34,215.1 481.0 102.7 49,382.7 Sub-total 0.0 145.0 69,745.0 0.0 276.5 132,996.5 0.0 269.2 129,485.2 0.0 195.6 94,083.6 0.0 116.3 55,956.3 0.0 168.4 81,000.4
6) Support- Poles and wires (ha) 66,690.0 0.0 0.0 66,690.0 0.0 0.0 70,200.0 0.0 0.0 66,690.0 0.1 3,334.5 0.0 0.0 0.0 0.0 0.0 0.0
7) Miscellaneous (5%) 0.0 0.0 15,788.9 0.0 0.0 26,438.0 0.0 0.0 23,175.2 0.0 0.0 18,417.5 0.0 0.0 13,049.5 0.0 0.0 19,768.0
Total Cost- Including famliy labour 0.0 83% 331,566.2 0.0 138% 555,197.0 0.0 121% 486,678.2 0.0 96% 386,767.8 0.0 68% 274,038.7 0.0 103% 415,127.2- Excluding family labour 0.0 84% 289,334.4 0.0 137% 474,552.7 0.0 118% 407,890.4 0.0 95% 329,240.2 0.0 69% 239,823.5 0.0 106% 365,744.5
C. Net Returen- Including famliy labour 0.0 16% 68,433.8 0.0 66% 274,803.0 0.0 55% 231,521.8 0.0 186% 777,232.2 0.0 155% 647,561.3 0.0 231% 964,872.8- Excluding family labour 0.0 79% 400,000.0 0.0 70% 355,447.3 0.0 61% 310,309.6 0.0 165% 834,759.8 0.0 134% 681,776.5 0.0 200% 1,014,255.5

The Preparatory Survey on the P
roject for Improvem
ent of Agricultural P
roduction and Productivity
in Dry Zone A
reas in Dem
ocratic Socialist Republic of Sri Lanka
Final R
eport
T 6-7
Table A
6.6 E
conomic C
rop Budget of O
FC, Paddy and V
egetables per Hectare under
With-project C
onditions (Banana)
Banana: 1st Year Banana: 2nd Year Banana: 3rd Year Banana: 4th Year Banana: 5th Year Banana: 5-year Ave.Unit Unit Value Value Value Value Value Value
Price Amount Amount Amount Amount Amount Amount(Rs) (Rs) (Rs) (Rs) (Rs) (Rs) (Rs)
A. Gross IncomeYield (kg) 20.0 0.0 0.0 23,000.0 460,000.0 35,000.0 700,000.0 26,000.0 520,000.0 16,000.0 320,000.0 20,000.0 400,000.0
B. Production Cost1) Suckers (kg) 21.6 1,100.0 23,789.7 0.0 0.0 0.0 0.0 0.0 0.0 0.0 0.0 220.0 4,757.92) Fertilizers
-Urea (kg) 49.3 462.0 22,771.3 415.8 20,494.2 415.8 20,494.2 415.8 20,494.2 415.8 20,494.2 425.0 20,949.6- TSP (kg) 56.3 308.0 17,346.4 277.2 15,611.7 277.2 15,611.7 277.2 15,611.7 277.2 15,611.7 283.4 15,958.7- MOP (kg) 66.7 962.0 64,163.8 865.8 57,747.4 865.8 57,747.4 865.8 57,747.4 865.8 57,747.4 885.0 59,030.7- Compost (ton) 20,000.0 8.0 160,000.0 0.0 0.0 8.0 160,000.0 8.0 160,000.0 0.0 0.0 4.8 96,000.0- Others (ha) 22,000.0 0.0 0.0 0.0 0.0 0.0 0.0 0.0 0.0 0.0 0.0 0.0 0.0 Sub-total 264,281.5 93,853.3 253,853.3 253,853.3 93,853.3 191,939.0
3) Agro-chemicals- Herbicide (ha) 10,084.5 1.0 10,084.5 1.0 10,084.5 1.0 10,084.5 1.0 10,084.5 1.0 10,084.5 1.0 10,084.5- Pesticide (ha) 8,831.2 0.0 0.0 1.0 8,831.2 1.0 8,831.2 1.0 8,831.2 1.0 8,831.2 0.8 7,065.0- Hormone (ha) 3,610.0 0.0 0.0 0.0 0.0 0.0 0.0 0.0 0.0 0.0 0.0 0.0 0.0 Sub-total 10,084.5 18,915.7 18,915.7 18,915.7 18,915.7 17,149.5
4) Machinery- Land preparation (ha) 12,730.0 1.0 12,730.0 0.0 0.0 0.0 0.0 0.0 0.0 0.0 0.0 0.2 2,546.0- Irrigation by pump (ha) 22,420.0 1.0 22,420.0 1.0 22,420.0 1.0 22,420.0 1.0 22,420.0 1.0 22,420.0 1.0 22,420.0- Transport produce per ton (ton) 361.0 0.0 0.0 23.0 8,303.0 35.0 12,635.0 26.0 9,386.0 16.0 5,776.0 20.0 7,220.0 Sub-total 35,150.0 30,723.0 35,055.0 31,806.0 28,196.0 32,186.0
5) Human labor- Hired (psn) 481.0 110.0 52,910.0 44.0 21,164.0 44.0 21,164.0 44.0 21,164.0 44.0 21,164.0 57.2 27,513.2- Family (psn) 481.0 171.0 82,251.0 67.0 32,227.0 67.0 32,227.0 67.0 32,227.0 67.0 32,227.0 87.8 42,231.8 Sub-total 281.0 135,161.0 111.0 53,391.0 111.0 53,391.0 111.0 53,391.0 111.0 53,391.0 145.0 69,745.0
6) Support- Poles and wires (ha) 66,690.0 0.0 0.0 0.0 0.0 0.0 0.0 0.0 0.0 0.0 0.0 0.0 0.0
7) Miscellaneous (5%) 23,423.3 9,844.2 18,060.8 17,898.3 9,717.8 15,788.9
Total Cost- Including famliy labour 491,890.0 206,727.2 379,275.8 375,864.3 204,073.8 331,566.2- Excluding family labour 409,639.0 174,500.2 347,048.8 343,637.3 171,846.8 289,334.4
C. Net Returen- Including famliy labour -491,890.0 253,272.8 320,724.2 144,135.7 115,926.2 68,433.8- Excluding family labour -409,639.0 285,499.8 352,951.2 176,362.7 148,153.2 110,665.6

The Preparatory Survey on the P
roject for Improvem
ent of Agricultural P
roduction and Productivity
in Dry Zone A
reas in Dem
ocratic Socialist Republic of Sri Lanka
Final R
eport
T 6-8
Table A
6.6 E
conomic C
rop Budget of O
FC, Paddy and V
egetables per Hectare under
With-project C
onditions (Papaw)
Papaw: 1st Year Papaw: 2nd Year Papaw: 3rd Year Papaw: 4th Year Papaw: 4-year AverageUnit Unit Value Value Value Value Value
Price Amount Amount Amount Amount Amount(Rs) (Rs) (Rs) (Rs) (Rs) (Rs)
A. Gross IncomeYield (kg) 33.2 0.0 0.0 32,500.0 1,079,000.0 36,000.0 1,195,200.0 31,500.0 1,045,800.0 25,000.0 830,000.0
B. Production Cost1) Seedlings (kg) 32.5 1,125.0 36,545.6 0.0 0.0 0.0 0.0 0.0 0.0 281.3 9,136.42) Fertilizers
-Urea (kg) 49.3 603.3 29,737.5 537.1 13,965.7 537.1 13,965.7 537.1 13,965.7 553.7 27,290.6- TSP (kg) 56.3 349.0 19,655.5 310.7 8,078.5 310.7 8,078.5 310.7 8,078.5 320.3 18,038.2- MOP (kg) 66.7 1,271.7 84,817.9 1,132.1 29,435.8 1,132.1 29,435.8 1,132.1 29,435.8 1,167.0 77,838.7- Compost (ton) 20,000.0 11.0 220,000.0 11.0 220,000.0 11.0 220,000.0 11.0 220,000.0 11.0 220,000.0- Others (ha) 22,000.0 0.0 0.0 0.0 0.0 0.0 0.0 0.0 0.0 0.0 Sub-total 354,210.9 271,480.0 271,480.0 271,480.0 343,167.5
3) Agro-chemicals- Herbicide (ha) 10,084.5 0.0 0.0 0.0 0.0 0.0 0.0 0.0 0.0 0.0 0.0- Pesticide (ha) 8,831.2 1.0 8,831.2 1.0 8,831.2 1.0 8,831.2 1.0 8,831.2 1.0 8,831.2- Hormone (ha) 3,610.0 0.0 0.0 0.0 0.0 0.0 0.0 0.0 0.0 0.0 0.0 Sub-total 8,831.2 8,831.2 8,831.2 8,831.2 8,831.2
4) Machinery- Land preparation (ha) 12,730.0 1.0 12,730.0 0.0 0.0 0.0 0.0 0.0 0.0 0.3 3,182.5- Irrigation by pump (ha) 22,420.0 1.0 22,420.0 1.0 22,420.0 1.0 22,420.0 1.0 22,420.0 1.0 22,420.0- Transport produce per ton (ton) 361.0 0.0 0.0 32.5 11,732.5 36.0 12,996.0 31.5 11,371.5 25.0 9,025.0 Sub-total 35,150.0 34,152.5 35,416.0 33,791.5 34,627.5
5) Human labor- Hired (psn) 481.0 112.8 83,474.8 102.0 75,498.7 118.5 87,694.7 102.0 75,498.7 108.8 52,352.1- Family (psn) 481.0 171.2 0.0 158.0 0.0 183.5 0.0 158.0 0.0 167.7 80,644.4 Sub-total 284.0 83,474.8 260.0 75,498.7 302.0 87,694.7 260.0 75,498.7 276.5 132,996.5
6) Support- Poles and wires (ha) 66,690.0 0.0 0.0 0.0 0.0 0.0 0.0 0.0 0.0 0.0 0.0
7) Miscellaneous (5%) 25,910.6 19,498.1 20,171.1 19,480.1 26,438.0
Total Cost- Including famliy labour 544,123.1 409,460.6 423,593.0 409,081.5 555,197.0- Excluding family labour 544,123.1 409,460.6 423,593.0 409,081.5 474,552.7
C. Net Returen- Including famliy labour -544,123.1 669,539.4 771,607.0 636,718.5 274,803.0- Excluding family labour -544,123.1 669,539.4 771,607.0 636,718.5 355,447.3

The Preparatory Survey on the P
roject for Improvem
ent of Agricultural P
roduction and Productivity
in Dry Zone A
reas in Dem
ocratic Socialist Republic of Sri Lanka
Final R
eport
T 6-9
Table A
6.6 E
conomic C
rop Budget of O
FC, Paddy and V
egetables per Hectare under
With-project C
onditions (Passion Fruit)
Passion fruit: 1st Year Passion fruit: 2nd Year Passion fruit: 3rd Year Passion fruit: 4th Year Passion fruit: 5th Year Passion fruit: 5-Yr Ave.Unit Unit Value Value Value Value Value Value
Price Amount Amount Amount Amount Amount Amount(Rs) (Rs) (Rs) (Rs) (Rs) (Rs) (Rs)
A. Gross IncomeYield (kg) 51.3 0.0 0.0 20,000.0 1,026,000.0 22,000.0 1,128,600.0 17,500.0 897,750.0 10,500.0 538,650.0 14,000.0 718,200.0
B. Production Cost1) Seedling (kg) 16.2 1,125.0 18,222.8 0.0 0.0 0.0 0.0 0.0 0.0 0.0 0.0 225.0 3,644.62) Fertilizers
-Urea (kg) 49.3 202.0 9,956.3 282.8 13,938.8 282.8 13,938.8 343.4 16,925.7 551.5 27,180.7 332.5 16,388.1- TSP (kg) 56.3 360.0 20,275.0 504.0 28,385.0 504.0 28,385.0 612.0 34,467.5 982.8 55,350.7 592.6 33,372.6- MOP (kg) 66.7 180.0 12,005.7 252.0 16,808.0 252.0 16,808.0 306.0 20,409.7 491.4 32,775.5 296.3 19,761.4- Compost (ton) 20,000.0 10.0 200,000.0 10.0 200,000.0 10.0 200,000.0 10.0 200,000.0 10.0 200,000.0 10.0 200,000.0- Others (ha) 22,000.0 1.0 22,000.0 1.0 22,000.0 1.0 22,000.0 1.0 22,000.0 1.0 22,000.0 1.0 22,000.0 Sub-total 264,237.0 281,131.8 281,131.8 293,802.9 337,306.9 291,522.1
3) Agro-chemicals- Herbicide (ha) 10,084.5 0.0 0.0 0.0 0.0 0.0 0.0 0.0 0.0 0.0 0.0 0.0 0.0- Pesticide (ha) 8,831.2 1.0 8,831.2 1.0 8,831.2 1.0 8,831.2 1.0 8,831.2 1.0 8,831.2 1.0 8,831.2- Hormone (ha) 3,610.0 0.0 0.0 0.0 0.0 0.0 0.0 0.0 0.0 0.0 0.0 0.0 0.0 Sub-total 8,831.2 8,831.2 8,831.2 8,831.2 8,831.2 8,831.2
4) Machinery- Land preparation (ha) 12,730.0 1.0 12,730.0 0.0 0.0 0.0 0.0 0.0 0.0 0.0 0.0 0.2 2,546.0- Irrigation by pump (ha) 22,420.0 1.0 22,420.0 1.0 22,420.0 1.0 22,420.0 1.0 22,420.0 1.0 22,420.0 1.0 22,420.0- Transport produce per ton (ton) 361.0 0.0 0.0 20.0 7,220.0 22.0 7,942.0 17.5 6,317.5 10.5 3,790.5 14.0 5,054.0 Sub-total 35,150.0 29,640.0 30,362.0 28,737.5 26,210.5 30,020.0
5) Human labor- Hired (psn) 481.0 139.0 66,859.0 94.0 45,214.0 98.0 47,138.0 98.0 47,138.0 98.0 47,138.0 105.4 50,697.4- Family (psn) 481.0 217.0 104,377.0 146.0 70,226.0 152.0 73,112.0 152.0 73,112.0 152.0 73,112.0 163.8 78,787.8 Sub-total 356.0 171,236.0 240.0 115,440.0 250.0 120,250.0 250.0 120,250.0 250.0 120,250.0 269.2 129,485.2
6) Support- Poles and wires (ha) 66,690.0 0.0 0.0 0.0 0.0 0.0 0.0 0.0 0.0 0.0 0.0 0.0 0.0
7) Miscellaneous (5%) 24,883.8 21,752.1 22,028.7 22,581.1 24,629.9 23,175.2
Total Cost- Including famliy labour 522,560.8 456,795.1 462,603.7 474,202.6 517,228.6 486,678.2- Excluding family labour 418,183.8 386,569.1 389,491.7 401,090.6 444,116.6 407,890.4
C. Net Returen- Including famliy labour -522,560.8 569,204.9 665,996.3 423,547.4 21,421.4 231,521.8- Excluding family labour -418,183.8 639,430.9 739,108.3 496,659.4 94,533.4 310,309.6

The Preparatory Survey on the P
roject for Improvem
ent of Agricultural P
roduction and Productivity
in Dry Zone A
reas in Dem
ocratic Socialist Republic of Sri Lanka
Final R
eport
T 6-10
Table A
6.6 Econom
ic Crop B
udget of OFC
, Paddy and Vegetables per H
ectare under W
ith-project Conditions (M
ango)
Mango: 1st Year Mango: 2nd Year Mango: 3rd Year Mango: 4th Year Mango: 5th Year Mango: 6th Year Mango: 7-20th Yr Ave. Mango: 20-Yr Ave.Unit Unit Value Value Value Value Value Value Value Value
Price Amount Amount Amount Amount Amount Amount Amount Amount(Rs) (Rs) (Rs) (Rs) (Rs) (Rs) (Rs) (Rs) (Rs)
A. Gross IncomeYield (kg) 58.2 0.0 0.0 0.0 0.0 0.0 0.0 0.0 0.0 6,800.0 395,760.0 6,800.0 395,760.0 27,600.0 1,606,320.0 20,000.0 1,164,000.0
B. Production Cost1) Seedling (kg) 108.2 105.0 11,363.5 0.0 0.0 0.0 0.0 0.0 0.0 0.0 0.0 0.0 0.0 0.0 0.0 5.3 568.22) Fertilizers
-Urea (kg) 49.3 42.0 2,070.1 42.0 2,070.1 42.0 2,070.1 42.0 2,070.1 69.0 3,400.9 87.0 4,288.1 177.0 8,724.1 140.1 6,905.3- TSP (kg) 56.3 51.0 2,872.3 51.0 2,872.3 51.0 2,872.3 51.0 2,872.3 84.0 4,730.8 106.0 5,969.9 215.0 12,108.7 170.2 9,585.6- MOP (kg) 66.7 23.0 1,534.1 23.0 1,534.1 23.0 1,534.1 23.0 1,534.1 38.0 2,534.5 48.0 3,201.5 97.0 6,469.7 76.8 5,122.4- Compost (ton) 20,000.0 10.0 200,000.0 10.0 200,000.0 10.0 200,000.0 10.0 200,000.0 10.0 200,000.0 10.0 200,000.0 10.0 200,000.0 10.0 200,000.0- Others (ha) 22,000.0 0.0 0.0 0.0 0.0 0.0 0.0 0.0 0.0 0.0 0.0 0.0 0.0 0.0 0.0 0.0 0.0 Sub-total 206,476.5 206,476.5 206,476.5 206,476.5 210,666.3 213,459.5 227,302.5 221,613.3
3) Agro-chemicals- Herbicide (ha) 10,084.5 1.0 10,084.5 1.0 10,084.5 1.0 10,084.5 1.0 10,084.5 1.0 10,084.5 1.0 10,084.5 1.0 10,084.5 1.0 10,084.5- Pesticide (ha) 8,831.2 0.0 0.0 1.0 8,831.2 1.0 8,831.2 1.0 8,831.2 1.0 8,831.2 1.0 8,831.2 1.0 8,831.2 1.0 8,389.6- Hormone (ha) 3,610.0 0.0 0.0 0.0 0.0 0.0 0.0 0.0 0.0 0.0 0.0 0.0 0.0 0.0 0.0 0.0 0.0 Sub-total 10,084.5 18,915.7 18,915.7 18,915.7 18,915.7 18,915.7 18,915.7 18,474.1
4) Machinery- Land preparation (ha) 12,730.0 1.0 12,730.0 0.0 0.0 0.0 0.0 0.0 0.0 0.0 0.0 0.0 0.0 0.0 0.0 0.1 636.5- Irrigation by pump (ha) 22,420.0 1.0 22,420.0 1.0 22,420.0 1.0 22,420.0 1.0 22,420.0 1.0 22,420.0 1.0 22,420.0 1.0 22,420.0 1.0 22,420.0- Transport produce per ton (ton) 361.0 0.0 0.0 0.0 0.0 0.0 0.0 0.0 0.0 6.8 2,454.8 6.8 2,454.8 27.6 9,963.6 20.0 7,220.0 Sub-total 35,150.0 22,420.0 22,420.0 22,420.0 24,874.8 24,874.8 32,383.6 30,276.5
5) Human labor- Hired (psn) 481.0 47.0 22,607.0 37.0 17,797.0 38.0 18,278.0 71.0 34,151.0 82.0 39,442.0 83.0 39,923.0 83.0 39,923.0 76.0 36,556.0- Family (psn) 481.0 73.0 35,113.0 57.0 27,417.0 59.0 28,379.0 111.0 53,391.0 127.0 61,087.0 131.0 63,011.0 131.0 63,011.0 119.6 57,527.6 Sub-total 120.0 57,720.0 94.0 45,214.0 97.0 46,657.0 182.0 87,542.0 209.0 100,529.0 214.0 102,934.0 214.0 102,934.0 195.6 94,083.6
6) Support- Poles and wires (ha) 66,690.0 1.0 66,690.0 0.0 0.0 0.0 0.0 0.0 0.0 0.0 0.0 0.0 0.0 0.0 0.0 0.1 3,334.5
7) Miscellaneous (5%) 19,374.2 14,651.3 14,723.5 16,767.7 17,749.3 18,009.2 19,076.8 18,417.5
Total Cost- Including famliy labour 406,858.7 307,677.5 309,192.6 352,121.9 372,735.1 378,193.2 400,612.6 386,767.8- Excluding family labour 371,745.7 280,260.5 280,813.6 298,730.9 311,648.1 315,182.2 337,601.6 329,240.2
C. Net Returen- Including famliy labour -406,858.7 -307,677.5 -309,192.6 -352,121.9 23,024.9 17,566.8 1,205,707.4 777,232.2- Excluding family labour -371,745.7 -280,260.5 -280,813.6 -298,730.9 84,111.9 80,577.8 1,268,718.4 834,759.8

The Preparatory Survey on the P
roject for Improvem
ent of Agricultural P
roduction and Productivity
in Dry Zone A
reas in Dem
ocratic Socialist Republic of Sri Lanka
Final R
eport
T 6-11
Table A
6.6 E
conomic C
rop Budget of O
FC, Paddy and V
egetables per Hectare under
With-project C
onditions (Orange)
Orange: 1st Year Orange: 2nd Year Orange: 3rd Year Orange: 4th Year Orange: 5th Year Orange: 6-8th Yr Ave. Orange: 9-15th Yr Ave. Orange: 15-Yr Ave.Unit Unit Value Value Value Value Value Value Value Value
Price Amount Amount Amount Amount Amount Amount Amount Amount(Rs) (Rs) (Rs) (Rs) (Rs) (Rs) (Rs) (Rs) (Rs)
A. Gross IncomeYield (fruit) 76.8 0.0 0.0 0.0 0.0 0.0 0.0 4,000.0 307,200.0 8,000.0 614,400.0 16,800.0 1,290,240.0 16,800.0 1,290,240.0 12,000.0 921,600.0
B. Production Cost1) Seedlings (kg) 108.2 562.0 60,821.9 0.0 0.0 0.0 0.0 0.0 0.0 0.0 0.0 0.0 0.0 0.0 0.0 37.5 4,054.82) Fertilizers
-Urea (kg) 49.3 90.0 4,436.0 88.0 4,337.4 133.0 6,555.4 175.0 8,625.5 220.0 10,843.5 264.0 13,012.2 264.0 13,012.2 223.1 10,994.6- TSP (kg) 56.3 112.0 6,307.8 110.0 6,195.1 164.0 9,236.4 218.0 12,277.6 274.0 15,431.5 327.0 18,416.4 327.0 18,416.4 276.5 15,574.2- MOP (kg) 66.7 51.0 3,401.6 50.0 3,334.9 74.0 4,935.7 100.0 6,669.8 124.0 8,270.6 149.0 9,938.0 149.0 9,938.0 125.9 8,399.5- Compost (ton) 20,000.0 5.6 112,400.0 6.0 120,000.0 6.0 120,000.0 6.0 120,000.0 6.0 120,000.0 6.0 120,000.0 6.0 120,000.0 6.0 119,493.3- Others (ha) 22,000.0 0.0 0.0 0.0 0.0 0.0 0.0 0.0 0.0 0.0 0.0 0.0 0.0 0.0 0.0 0.0 0.0 Sub-total 126,545.4 133,867.4 140,727.4 147,573.0 154,545.6 161,366.7 161,366.7 154,461.7
3) Agro-chemicals- Herbicide (ha) 10,084.5 1.0 10,084.5 1.0 10,084.5 1.0 10,084.5 1.0 10,084.5 1.0 10,084.5 1.0 10,084.5 1.0 10,084.5 1.0 10,084.5- Pesticide (ha) 8,831.2 1.0 8,831.2 1.0 8,831.2 1.0 8,831.2 1.0 8,831.2 1.0 8,831.2 1.0 8,831.2 1.0 8,831.2 1.0 8,831.2- Hormone (ha) 3,610.0 0.0 0.0 0.0 0.0 0.0 0.0 0.0 0.0 0.0 0.0 0.0 0.0 0.0 0.0 0.0 0.0 Sub-total 18,915.7 18,915.7 18,915.7 18,915.7 18,915.7 18,915.7 18,915.7 18,915.7
4) Machinery- Land preparation (ha) 12,730.0 1.0 12,730.0 0.0 0.0 0.0 0.0 0.0 0.0 0.0 0.0 0.0 0.0 0.0 0.0 0.1 848.7- Irrigation by pump (ha) 22,420.0 1.0 22,420.0 1.0 22,420.0 1.0 22,420.0 1.0 22,420.0 1.0 22,420.0 1.0 22,420.0 1.0 22,420.0 1.0 22,420.0- Transport produce per ton (ton) 361.0 0.0 0.0 0.0 0.0 0.0 0.0 4.0 1,444.0 8.0 2,888.0 16.8 6,064.8 16.8 6,064.8 12.0 4,332.0 Sub-total 35,150.0 22,420.0 22,420.0 23,864.0 25,308.0 28,484.8 28,484.8 27,600.7
5) Human labor- Hired (psn) 481.0 88.0 42,328.0 39.0 18,759.0 39.0 18,759.0 39.0 18,759.0 43.0 20,683.0 43.0 20,683.0 43.0 20,683.0 45.2 21,741.2- Family (psn) 481.0 139.0 66,859.0 60.0 28,860.0 60.0 28,860.0 60.0 28,860.0 68.0 32,708.0 68.0 32,708.0 68.0 32,708.0 71.1 34,215.1 Sub-total 227.0 109,187.0 99.0 47,619.0 99.0 47,619.0 99.0 47,619.0 111.0 53,391.0 111.0 53,391.0 111.0 53,391.0 116.3 55,956.3
6) Support- Poles and wires (ha) 66,690.0 0.0 0.0 0.0 0.0 0.0 0.0 0.0 0.0 0.0 0.0 0.0 0.0 0.0 0.0 0.0 0.0
7) Miscellaneous (5%) 17,531.0 11,141.1 11,484.1 11,898.6 12,608.0 13,107.9 13,107.9 13,049.5
Total Cost- Including famliy labour 368,150.9 233,963.3 241,166.2 249,870.2 264,768.3 275,266.1 275,266.1 274,038.7- Excluding family labour 301,291.9 205,103.3 212,306.2 221,010.2 232,060.3 242,558.1 242,558.1 239,823.5
C. Net Returen- Including famliy labour -368,150.9 -233,963.3 -241,166.2 57,329.8 349,631.7 1,014,973.9 1,014,973.9 647,561.3- Excluding family labour -301,291.9 -205,103.3 -212,306.2 86,189.8 382,339.7 1,047,681.9 1,047,681.9 681,776.5

The Preparatory Survey on the P
roject for Improvem
ent of Agricultural P
roduction and Productivity
in Dry Zone A
reas in Dem
ocratic Socialist Republic of Sri Lanka
Final R
eport
T 6-12
Table A
6.6 E
conomic C
rop Budget of O
FC, Paddy and V
egetables per Hectare under
With-project C
onditions (Lim
e)
Lime: 1st Year Lime: 2nd Year Lime: 3rd Year Lime: 4th Year Lime: 5th Year Lime: 6th Year Lime: 7-15th Yr Ave. Lime: 15-Yr Ave.Unit Unit Value Value Value Value Value Value Value Value
Price Amount Amount Amount Amount Amount Amount Amount Amount(Rs) (Rs) (Rs) (Rs) (Rs) (Rs) (Rs) (Rs) (Rs)
A. Gross IncomeYield (kg) 60.0 0.0 0.0 0.0 0.0 5,000.0 300,000.0 8,000.0 480,000.0 12,000.0 720,000.0 18,500.0 1,110,000.0 33,500.0 2,010,000.0 23,000.0 1,380,000.0
B. Production Cost1) Seedling (kg) 162.2 700.0 113,572.9 0.0 0.0 0.0 0.0 0.0 0.0 0.0 0.0 0.0 0.0 0.0 0.0 46.7 7,571.52) Fertilizers
-Urea (kg) 49.3 147.0 7,245.4 182.3 8,984.3 230.8 11,375.3 279.3 13,766.3 321.9 15,867.5 310.0 15,279.5 310.0 15,279.5 284.1 14,002.2- TSP (kg) 56.3 161.0 9,067.4 199.6 11,243.6 252.8 14,235.9 252.8 14,235.9 252.8 14,235.9 340.0 19,148.6 340.0 19,148.6 301.3 16,967.0- MOP (kg) 66.7 43.0 2,868.0 53.3 3,556.4 67.5 4,502.8 67.5 4,502.8 67.5 4,502.8 90.0 6,002.8 90.0 6,002.8 79.9 5,330.8- Compost (ton) 20,000.0 11.0 220,000.0 11.0 220,000.0 11.0 220,000.0 11.0 220,000.0 11.0 220,000.0 11.0 220,000.0 11.0 220,000.0 11.0 220,000.0- Others (ha) 22,000.0 0.0 0.0 0.0 0.0 0.0 0.0 0.0 0.0 0.0 0.0 0.0 0.0 0.0 0.0 0.0 Sub-total 239,180.9 243,784.3 250,114.0 252,505.0 254,606.1 260,430.9 260,430.9 256,300.0
3) Agro-chemicals- Herbicide (ha) 10,084.5 1.0 10,084.5 1.0 10,084.5 1.0 10,084.5 1.0 10,084.5 1.0 10,084.5 1.0 10,084.5 1.0 10,084.5 1.0 10,084.5- Pesticide (ha) 8,831.2 1.0 8,831.2 1.0 8,831.2 1.0 8,831.2 1.0 8,831.2 1.0 8,831.2 1.0 8,831.2 1.0 8,831.2 1.0 8,831.2- Hormone (ha) 3,610.0 0.0 0.0 0.0 0.0 0.0 0.0 0.0 0.0 0.0 0.0 0.0 0.0 0.0 0.0 0.0 0.0 Sub-total 18,915.7 18,915.7 18,915.7 18,915.7 18,915.7 18,915.7 18,915.7 18,915.7
4) Machinery- Land preparation (ha) 12,730.0 1.0 12,730.0 0.0 0.0 0.0 0.0 0.0 0.0 0.0 0.0 0.0 0.0 0.0 0.0 0.1 848.7- Irrigation by pump (ha) 22,420.0 1.0 22,420.0 1.0 22,420.0 1.0 22,420.0 1.0 22,420.0 1.0 22,420.0 1.0 22,420.0 1.0 22,420.0 1.0 22,420.0- Transport produce per ton (ton) 361.0 0.0 0.0 0.0 0.0 5.0 1,805.0 8.0 2,888.0 12.0 4,332.0 18.5 6,678.5 33.5 12,093.5 23.0 8,303.0 Sub-total 35,150.0 22,420.0 24,225.0 25,308.0 26,752.0 29,098.5 34,513.5 31,571.7
5) Human labor- Hired (psn) 481.0 90.0 43,290.0 34.0 16,354.0 46.0 22,126.0 54.0 25,974.0 62.0 29,822.0 70.0 33,670.0 70.0 33,670.0 65.7 31,617.7- Family (psn) 481.0 142.0 68,302.0 53.0 25,493.0 73.0 35,113.0 85.0 40,885.0 97.0 46,657.0 109.0 52,429.0 109.0 52,429.0 102.7 49,382.7 Sub-total 232.0 111,592.0 87.0 41,847.0 119.0 57,239.0 139.0 66,859.0 159.0 76,479.0 179.0 86,099.0 179.0 86,099.0 168.4 81,000.4
6) Support- Poles and wires (ha) 66,690.0 0.0 0.0 0.0 0.0 0.0 0.0 0.0 0.0 0.0 0.0 0.0 0.0 0.0 0.0 0.0 0.0
6) Miscellaneous (5%) 25,920.6 16,348.3 17,524.7 18,179.4 18,837.6 19,727.2 19,998.0 19,768.0
Total Cost- Including famliy labour 544,332.0 343,315.3 368,018.4 381,767.0 395,590.5 414,271.3 419,957.1 415,127.2- Excluding family labour 476,030.0 317,822.3 332,905.4 340,882.0 348,933.5 361,842.3 367,528.1 365,744.5
C. Net Returen- Including famliy labour -544,332.0 -343,315.3 -68,018.4 98,233.0 324,409.5 695,728.7 1,590,042.9 964,872.8- Excluding family labour -476,030.0 -317,822.3 -32,905.4 139,118.0 371,066.5 748,157.7 1,642,471.9 1,014,255.5

The Preparatory Survey on the P
roject for Improvem
ent of Agricultural P
roduction and Productivity
in Dry Zone A
reas in Dem
ocratic Socialist Republic of Sri Lanka
Final R
eport
T 6-13
Table A
6.7 E
conomic C
rop Budget of O
FC, Paddy and V
egetables per Hectare under
Without-project C
onditions (OFC
)
Black gram Cowpea Green gram Soybean GroundnutUnit Unit Unit Unit Unit Unit
Price Amount Value Price Amount Value Price Amount Value Price Amount Value Price Amount Value(Rs) (Rs) (Rs) (Rs) (Rs) (Rs) (Rs) (Rs) (Rs) (Rs)
A. Gross IncomeYield (kg) 160.0 960.0 153,600.0 135.0 1,030.0 139,050.0 170.0 951.0 161,670.0 135.0 1,630.0 220,050.0 170.0 1,290.0 219,300.0
B. Production Cost1) Seeds (kg) 263.0 24.7 6,496.1 154.0 25.2 3,880.8 263.0 24.0 6,312.0 154.0 54.4 8,377.6 263.0 154.0 40,502.02) Fertilizers
- Urea (kg) 49.3 0.0 0.0 49.3 0.0 0.0 49.3 0.0 0.0 49.3 0.0 0.0 49.3 0.0 0.0- TSP (kg) 56.3 0.0 0.0 56.3 0.0 0.0 56.3 0.0 0.0 56.3 0.0 0.0 56.3 0.0 0.0- MOP (kg) 66.7 0.0 0.0 66.7 0.0 0.0 66.7 0.0 0.0 66.7 0.0 0.0 66.7 0.0 0.0- TDM (kg) 57.4 0.0 0.0 57.4 0.0 0.0 57.4 0.0 0.0 57.4 0.0 0.0 57.4 0.0 0.0- Mixture (kg) 57.4 0.0 0.0 57.4 0.0 0.0 57.4 0.0 0.0 57.4 0.0 0.0 57.4 0.0 0.0- Poultry manure (ton) 20,000.0 0.0 0.0 20,000.0 0.0 0.0 20,000.0 0.0 0.0 20,000.0 0.0 0.0 20,000.0 0.0 0.0- Others (ha) 22,000.0 0.0 0.0 22,000.0 0.0 0.0 22,000.0 0.0 0.0 22,000.0 0.0 0.0 22,000.0 0.0 0.0 Sub-total 0.0 0.0 0.0 0.0 0.0
3) Agro-chemicals- Herbicide (ha) 3,818.0 1.0 3,818.0 3,818.0 0.0 0.0 3,818.0 1.0 3,818.0 3,818.0 0.0 0.0 3,818.0 0.0 0.0- Pesticide (ha) 3,477.7 1.0 3,477.7 3,477.7 1.0 3,477.7 3,477.7 1.0 3,477.7 3,477.7 1.0 3,477.7 3,477.7 1.0 3,477.7 Sub-total 7,295.7 3,477.7 7,295.7 3,477.7 3,477.7
4) Machinery- Land preparation (ha) 12,730.0 1.0 12,730.0 12,730.0 1.0 12,730.0 12,730.0 1.0 12,730.0 12,730.0 1.0 12,730.0 12,730.0 1.0 12,730.0- Irrigation by pump (ha) 22,420.0 0.0 0.0 22,420.0 0.0 0.0 22,420.0 0.0 0.0 22,420.0 0.0 0.0 22,420.0 0.0 0.0- Threshing and winnowing (ton) 2,327.5 1.0 2,234.4 2,327.5 1.0 2,397.3 2,327.5 1.0 2,213.5 2,327.5 1.6 3,793.8 2,327.5 1.3 3,002.5- Transportation of production (ton) 361.0 1.0 346.6 361.0 1.0 371.8 361.0 1.0 343.3 361.0 1.6 588.4 361.0 1.3 465.7 Sub-total 15,311.0 15,499.2 15,286.8 17,112.3 16,198.2
5) Human labor- Hired (psn) 481.0 27.0 12,987.0 481.0 12.0 5,772.0 481.0 40.0 19,240.0 481.0 32.0 15,392.0 481.0 32.0 15,392.0- Family (psn) 481.0 25.0 12,025.0 481.0 84.0 40,404.0 481.0 32.0 15,392.0 481.0 56.0 26,936.0 481.0 94.0 45,214.0 Sub-total 52.0 25,012.0 96.0 46,176.0 72.0 34,632.0 88.0 42,328.0 126.0 60,606.0
6) Support (Rs) 0.0 0.0 0.0 0.0 0.07) Miscellaneous (5%) 2,705.7 3,451.7 3,176.3 3,564.8 6,039.2
Total Cost- Including famliy labour (Rs) 12,025.0 40,404.0 15,392.0 74,860.3 126,823.1
C. Net Returen- Including famliy labour (Rs) 141,575.0 98,646.0 146,278.0 145,189.7 92,476.9

The Preparatory Survey on the P
roject for Improvem
ent of Agricultural P
roduction and Productivity
in Dry Zone A
reas in Dem
ocratic Socialist Republic of Sri Lanka
Final R
eport
T 6-14
Table A
6.7 E
conomic C
rop Budget of O
FC, Paddy and V
egetables per Hectare under
Without-project C
onditions (OFC
and Paddy)
Chilli (Green) Red onion Big onion Paddy IrrigatedUnit Unit Unit Unit Unit
Price Amount Value Price Amount Value Price Amount Value Price Amount Value(Rs) (Rs) (Rs) (Rs) (Rs) (Rs) (Rs) (Rs)
A. Gross IncomeYield (kg) 100.0 3,700.0 370,000.0 87.0 10,970.0 954,390.0 67.0 10,300.0 690,100.0 25.9 5,500.0 142,419.7
B. Production Cost1) Seeds (kg) 1,976.0 1.8 3,458.0 112.0 1,406.2 157,494.4 3,738.9 7.7 28,789.5 64.0 139.3 8,915.22) Fertilizers
-Urea (kg) 49.3 255.0 12,568.6 49.3 98.8 4,868.2 49.3 143.0 7,048.3 49.3 274.0 13,505.1- TSP (kg) 56.3 145.0 8,166.3 56.3 207.4 11,680.6 56.3 133.0 7,490.5 56.3 101.0 5,688.3- MOP (kg) 66.7 130.0 8,670.8 66.7 0.0 0.0 66.7 0.0 0.0 66.7 89.0 5,936.1- TDM (kg) 57.4 0.0 0.0 57.4 0.0 0.0 57.4 0.0 0.0 57.4 0.0 0.0- Mixture (kg) 57.4 150.0 8,615.3 57.4 229.6 13,187.2 57.4 377.0 21,653.2 57.4 0.0 0.0- Poultry manure (ton) 20,000.0 0.0 0.0 20,000.0 0.0 0.0 20,000.0 0.0 0.0 20,000.0 0.0 0.0- Others (ha) 22,000.0 1.0 22,000.0 22,000.0 0.0 0.0 22,000.0 0.0 0.0 22,000.0 0.0 0.0 Sub-total 60,021.0 29,736.1 36,191.9 25,129.5
3) Agro-chemicals- Herbicide (ha) 3,818.0 0.0 0.0 4,905.3 0.0 0.0 4,905.3 0.0 0.0 6,764.5 1.0 6,764.5- Pesticide (ha) 3,477.7 1.0 3,477.7 28,676.5 1.0 28,676.5 28,676.5 1.0 28,676.5 3,494.3 1.0 3,494.3 Sub-total 3,477.7 28,676.5 28,676.5 10,258.8
4) Machinery- Land preparation (ha) 12,730.0 1.0 12,730.0 12,730.0 1.0 12,730.0 12,730.0 1.0 12,730.0 12,730.0 1.0 12,730.0- Irrigation by pump (ha) 22,420.0 0.0 0.0 22,420.0 1.0 22,420.0 22,420.0 1.0 22,420.0 22,420.0 0.0 0.0- Threshing and winnowing (ton) 2,327.5 0.0 0.0 2,327.5 0.0 0.0 2,327.5 0.0 0.0 2,327.5 5.5 12,801.3- Transportation of production (ton) 361.0 11.0 3,971.0 361.0 11.0 3,960.2 361.0 10.3 3,718.3 361.0 5.5 1,985.5 Sub-total 16,701.0 39,110.2 38,868.3 27,516.8
5) Human labor- Hired (psn) 481.0 146.0 70,226.0 481.0 166.0 79,846.0 481.0 151.0 72,631.0 481.0 32.0 15,392.0- Family (psn) 481.0 228.0 109,668.0 481.0 54.0 25,974.0 481.0 64.0 30,784.0 481.0 35.0 16,835.0 Sub-total 179,894.0 220.0 105,820.0 215.0 103,415.0 67.0 32,227.0
6) Support (Rs) 0.0 0.0 0.0 0.07) Miscellaneous (5%) 13,177.6 18,041.9 11,797.1 5,202.4
Total Cost- Including famliy labour (Rs) 276,729.3 378,879.0 247,738.2 109,249.6
C. Net Returen- Including famliy labour (Rs) 93,270.7 575,511.0 442,361.8 33,170.1

The Preparatory Survey on the P
roject for Improvem
ent of Agricultural P
roduction and Productivity
in Dry Zone A
reas in Dem
ocratic Socialist Republic of Sri Lanka
Final R
eport
T 6-15
Table A
6.7 E
conomic C
rop Budget of O
FC, Paddy and V
egetables per Hectare under
Without-project C
onditions (Fruit Summ
ary)
Banana: 15-Year Ave. Papaw: 4-Yr Ave. Passion fruit: 5-Yr Ave. Mango: 20-Yr Ave. Orange: 15-Yr Ave. Lime: 15-year AverageUnit Unit Value Unit Value Unit Value Unit Value Unit Value Unit Value
Price Amount Price Amount Price Amount Price Amount Price Amount Price Amount(Rs) (Rs) (Rs) (Rs) (Rs) (Rs) (Rs) (Rs) (Rs) (Rs) (Rs) (Rs)
A. Gross IncomeYield (kg) 20.0 7,280.0 145,600.0 33.2 5,975.0 198,370.0 51.3 6,152.0 315,597.6 58.2 7,130.0 414,966.0 76.8 7,058.0 542,054.4 60.0 15,000.0 900,000.0
B. Production Cost1) Suckers (kg) 21.6 73.3 1,586.0 32.5 281.3 9,136.4 16.2 225.0 3,644.6 108.2 5.3 568.2 108.2 37.5 4,054.8 162.2 46.7 7,571.52) Fertilizers
- Urea (kg) 49.3 17.6 866.0 49.3 106.8 5,261.6 49.3 188.4 9,286.0 49.3 73.3 3,612.9 49.3 117.8 5,806.2 49.3 221.2 10,902.6- TSP (kg) 56.3 11.7 659.7 56.3 61.8 3,477.7 56.3 336.2 18,934.6 56.3 89.0 5,012.4 56.3 147.3 8,294.0 56.3 210.1 11,834.6- MOP (kg) 66.7 36.6 2,440.1 66.7 225.0 15,007.1 66.7 168.2 11,218.7 66.7 40.4 2,694.6 66.7 68.5 4,571.1 66.7 55.9 3,730.7- TDM (kg)- Mixture (kg)- Compost (ton) 20,000.0 0.7 13,333.3 20,000.0 2.5 50,000.0 20,000.0 2.0 40,000.0 20,000.0 10.0 200,000.0 20,000.0 6.0 119,493.3 20,000.0 11.0 220,000.0- Others (ha) 22,000.0 0.0 0.0 22,000.0 0.0 0.0 22,000.0 0.0 0.0 22,000.0 0.0 0.0 22,000.0 0.0 0.0 22,000.0 0.0 0.0 Sub-total 17,299.1 73,746.4 79,439.2 211,319.9 138,164.6 246,467.9
3) Agro-chemicals 0.0 0.0 0.0 0.0- Herbicide (ha) 10,084.5 0.0 0.0 10,084.5 0.0 0.0 10,084.5 0.0 0.0 10,084.5 0.1 504.2 10,084.5 0.0 0.0 10,084.5 1.0 10,084.5- Pesticide (ha) 8,831.2 0.1 588.7 8,831.2 0.3 2,207.8 8,831.2 1.0 8,831.2 8,831.2 1.0 8,389.6 8,831.2 1.0 8,831.2 8,831.2 1.0 8,831.2- Hormone (ha) 3,610.0 0.0 0.0 3,610.0 0.0 0.0 3,610.0 0.0 0.0 3,610.0 0.0 0.0 3,610.0 0.0 0.0 3,610.0 0.0 0.0 Sub-total 588.7 2,207.8 8,831.2 8,893.9 8,831.2 18,915.7
4) MachineryLand preparation (ha) 12,730.0 0.1 848.7 12,730.0 0.3 3,182.5 12,730.0 0.2 2,546.0 12,730.0 0.1 636.5 12,730.0 0.1 848.7 12,730.0 0.1 848.7Irrigation by pump (ha) 22,420.0 0.5 11,210.0 22,420.0 0.5 11,210.0 22,420.0 0.5 11,210.0 22,420.0 0.5 11,210.0 22,420.0 0.5 11,210.0 22,420.0 0.5 11,210.0Transport produce per ton (ha) 361.0 7.3 2,628.1 361.0 6.0 2,157.0 361.0 6.2 2,220.9 361.0 7.1 2,573.9 361.0 7.1 2,547.9 361.0 15.0 5,415.0 Sub-total 14,686.7 16,549.5 15,976.9 14,420.4 14,606.6 17,473.7
5) Human labor- Hired (psn) 481.0 38.7 18,637.1 481.0 44.5 21,404.5 481.0 86.4 41,558.4 481.0 43.9 21,115.9 481.0 41.9 20,137.9 481.0 43.9 21,131.9- Family (psn) 481.0 58.1 27,955.7 481.0 68.3 32,828.3 481.0 135.2 65,031.2 481.0 68.8 33,092.8 481.0 64.0 30,784.0 481.0 69.2 33,285.2 Sub-total 46,592.9 0.0 112.8 54,232.8 0.0 221.6 106,589.6 0.0 112.7 54,208.7 0.0 105.9 50,921.9 0.0 113.1 54,417.1
6) Support- Poles and wires (ha) 66,690.0 0.0 0.0 66,690.0 0.0 0.0 70,200.0 0.2 14,040.0 66,690.0 0.0 0.0 0.0 0.0 0.0 0.0 0.0 0.0
7) Miscellaneous (5%) 4,037.7 0.0 0.0 7,793.6 0.0 0.0 11,426.1 0.0 0.0 14,470.6 0.0 0.0 10,829.0 0.0 0.0 17,242.3
Total Cost- Including famliy labour 0.0 38% 84,791.1 0.0 73% 163,666.5 0.0 107% 239,947.5 0.0 136% 303,881.6 0.0 101% 227,408.0 0.0 161% 362,088.2
C. Net Returen- Including famliy labour 0.0 36% 60,808.9 0.0 21% 34,703.5 0.0 45% 75,650.1 0.0 66% 111,084.4 0.0 187% 314,646.4 0.0 319% 537,911.8

The Preparatory Survey on the P
roject for Improvem
ent of Agricultural P
roduction and Productivity
in Dry Zone A
reas in Dem
ocratic Socialist Republic of Sri Lanka
Final R
eport
T 6-16
Table A
6.7 E
conomic C
rop Budget of O
FC, Paddy and V
egetables per Hectare under
Without-project C
onditions (Banana)
Banana: 1st Year Banana: 2nd Year Banana: 3rd-7th Year Ave Banana: 8-12th Yr Ave. Banana: 13-15th Yr Ave. Banana: 15-Year Ave.Unit Unit Value Value Value Value Value Value
Price Amount Amount Amount Amount Amount Amount(Rs) (Rs) (Rs) (Rs) (Rs) (Rs) (Rs)
A. Gross IncomeYield (kg) 20.0 0.0 0.0 14,300.0 286,000.0 10,000.0 200,000.0 6,700.0 134,000.0 3,800.0 76,000.0 7,280.0 145,600.0
B. Production Cost1) Suckers (kg) 21.6 1,100.0 23,789.7 0.0 0.0 0.0 0.0 0.0 0.0 0.0 0.0 73.3 1,586.02) Fertilizers
-Urea (kg) 49.3 263.5 12,989.7 0.0 0.0 0.0 0.0 0.0 0.0 0.0 0.0 17.6 866.0- TSP (kg) 56.3 175.7 9,895.0 0.0 0.0 0.0 0.0 0.0 0.0 0.0 0.0 11.7 659.7- MOP (kg) 66.7 548.8 36,601.5 0.0 0.0 0.0 0.0 0.0 0.0 0.0 0.0 36.6 2,440.1- Compost (ton) 20,000.0 10.0 200,000.0 0.0 0.0 0.0 0.0 0.0 0.0 0.0 0.0 0.7 13,333.3- Others (ha) 22,000.0 0.0 0.0 0.0 0.0 0.0 0.0 0.0 0.0 0.0 0.0 0.0 0.0 Sub-total 259,486.2 0.0 0.0 0.0 0.0 17,299.1
3) Agro-chemicals- Herbicide (ha) 10,084.5 0.0 0.0 0.0 0.0 0.0 0.0 0.0 0.0 0.0 0.0 0.0 0.0- Pesticide (ha) 8,831.2 0.0 0.0 1.0 8,831.2 0.0 0.0 0.0 0.0 0.0 0.0 0.1 588.7- Hormone (ha) 3,610.0 0.0 0.0 0.0 0.0 0.0 0.0 0.0 0.0 0.0 0.0 0.0 0.0 Sub-total 0.0 8,831.2 0.0 0.0 0.0 588.7
4) MachineryLand preparation (ha) 12,730.0 1.0 12,730.0 0.0 0.0 0.0 0.0 0.0 0.0 0.0 0.0 0.1 848.7Irrigation by pump (ha) 22,420.0 0.5 11,210.0 0.5 11,210.0 0.5 11,210.0 0.5 11,210.0 0.5 11,210.0 0.5 11,210.0Transport produce per ton (ha) 361.0 0.0 0.0 14.3 5,162.3 10.0 3,610.0 6.7 2,418.7 3.8 1,371.8 7.3 2,628.1 Sub-total 23,940.0 16,372.3 14,820.0 13,628.7 12,581.8 14,686.7
5) Human labor- Hired (psn) 481.0 94.0 45,214.0 34.8 16,738.8 34.8 16,738.8 34.8 16,738.8 34.8 16,738.8 38.7 18,637.1- Family (psn) 481.0 141.0 67,821.0 52.2 25,108.2 52.2 25,108.2 52.2 25,108.2 52.2 25,108.2 58.1 27,955.7 Sub-total 235.0 113,035.0 87.0 41,847.0 87.0 41,847.0 87.0 41,847.0 87.0 41,847.0 96.9 46,592.9
6) Support- Poles and wires (ha) 66,690.0 0.0 0.0 0.0 0.0 0.0 0.0 0.0 0.0 0.0 0.0 0.0 0.0
7) Miscellaneous (5%) 21,012.5 3,352.5 2,833.4 2,773.8 2,721.4 4,037.7
Total Cost- Including famliy labour 441,263.4 70,403.0 59,500.4 58,249.5 57,150.2 84,791.1
C. Net Returen- Including famliy labour -441,263.4 215,597.0 140,499.7 75,750.5 18,849.8 60,808.9

The Preparatory Survey on the P
roject for Improvem
ent of Agricultural P
roduction and Productivity
in Dry Zone A
reas in Dem
ocratic Socialist Republic of Sri Lanka
Final R
eport
T 6-17
Table A
6.7 E
conomic C
rop Budget of O
FC, Paddy and V
egetables per Hectare under
Without-project C
onditions (Papaw)
Papaw: 1st Year Papaw: 2nd Year Papaw: 3rd Year Papaw: 4th Year Papaw: 4-Yr Ave.Unit Unit Value Value Value Value Value
Price Amount Amount Amount Amount Amount(Rs) (Rs) (Rs) (Rs) (Rs) (Rs)
A. Gross IncomeYield (kg) 33.2 0.0 0.0 7,700.0 255,640.0 8,600.0 285,520.0 7,600.0 252,320.0 5,975.0 198,370.0
B. Production Cost1) Seedlings (kg) 32.5 1,125.0 36,545.6 0.0 0.0 0.0 0.0 0.0 0.0 281.3 9,136.42) Fertilizers
-Urea (kg) 49.3 427.0 21,046.2 0.0 0.0 0.0 0.0 0.0 0.0 106.8 5,261.6- TSP (kg) 56.3 247.0 13,910.9 0.0 0.0 0.0 0.0 0.0 0.0 61.8 3,477.7- MOP (kg) 66.7 900.0 60,028.5 0.0 0.0 0.0 0.0 0.0 0.0 225.0 15,007.1- Compost (ton) 20,000.0 10.0 200,000.0 0.0 0.0 0.0 0.0 0.0 0.0 2.5 50,000.0- Others (ha) 22,000.0 0.0 0.0 0.0 0.0 0.0 0.0 0.0 0.0 0.0 Sub-total 294,985.6 0.0 0.0 0.0 73,746.4
3) Agro-chemicals- Herbicide (ha) 10,084.5 0.0 0.0 0.0 0.0 0.0 0.0 0.0 0.0 0.0 0.0- Pesticide (ha) 8,831.2 1.0 8,831.2 0.0 0.0 0.0 0.0 0.0 0.0 0.3 2,207.8- Hormone (ha) 3,610.0 0.0 0.0 0.0 0.0 0.0 0.0 0.0 0.0 0.0 0.0 Sub-total 8,831.2 0.0 0.0 0.0 2,207.8
4) Machinery- Land preparation (ha) 12,730.0 1.0 12,730.0 0.0 0.0 0.0 0.0 0.0 0.0 0.3 3,182.5- Irrigation by pump (ha) 22,420.0 0.5 11,210.0 0.5 11,210.0 0.5 11,210.0 0.5 11,210.0 0.5 11,210.0- Transport produce per ton (ha) 361.0 0.0 0.0 7.7 2,779.7 8.6 3,104.6 7.6 2,743.6 6.0 2,157.0 Sub-total 23,940.0 13,989.7 14,314.6 13,953.6 16,549.5
5) Human labor- Hired (psn) 481.0 85.0 40,885.0 31.0 14,911.0 31.0 14,911.0 31.0 14,911.0 44.5 21,404.5- Family (psn) 481.0 129.0 62,049.0 48.0 23,088.0 48.0 23,088.0 48.0 23,088.0 68.3 32,828.3 Sub-total 214.0 102,934.0 79.0 37,999.0 79.0 37,999.0 79.0 37,999.0 112.8 54,232.8
6) Support- Poles and wires (ha) 66,690.0 0.0 0.0 0.0 0.0 0.0 0.0 0.0 0.0 0.0 0.0
7) Miscellaneous (5%) 23,361.8 2,599.4 2,615.7 2,597.6 7,793.6
Total Cost- Including famliy labour 490,598.2 54,588.1 54,929.3 54,550.2 163,666.5
C. Net Returen- Including famliy labour -490,598.2 201,051.9 230,590.7 197,769.8 34,703.5

The Preparatory Survey on the P
roject for Improvem
ent of Agricultural P
roduction and Productivity
in Dry Zone A
reas in Dem
ocratic Socialist Republic of Sri Lanka
Final R
eport
T 6-18
Table A
6.7 E
conomic C
rop Budget of O
FC, Paddy and V
egetables per Hectare under
Without-project C
onditions (Passion Fruit)
Passion fruit: 1st Year Passion fruit: 2nd Year Passion fruit: 3rd Year Passion fruit: 4th Year Passion fruit: 5th Year Passion fruit: 5-Yr Ave.Unit Unit Value Value Value Value Value Value
Price Amount Amount Amount Amount Amount Amount(Rs) (Rs) (Rs) (Rs) (Rs) (Rs) (Rs)
A. Gross IncomeYield (kg) 51.3 0.0 0.0 9,050.0 464,265.0 9,650.0 495,045.0 7,240.0 371,412.0 4,820.0 247,266.0 6,152.0 315,597.6
B. Production Cost1) Seedling (kg) 16.2 1,125.0 18,222.8 0.0 0.0 0.0 0.0 0.0 0.0 0.0 0.0 225.0 3,644.62) Fertilizers
-Urea (kg) 49.3 133.0 6,555.4 133.0 6,555.4 201.0 9,907.0 271.0 13,357.2 204.0 10,054.9 188.4 9,286.0- TSP (kg) 56.3 238.0 13,404.0 238.0 13,404.0 358.0 20,162.3 483.0 27,202.3 364.0 20,500.3 336.2 18,934.6- MOP (kg) 66.7 119.0 7,937.1 119.0 7,937.1 179.0 11,939.0 242.0 16,141.0 182.0 12,139.1 168.2 11,218.7- Compost (ton) 20,000.0 10.0 200,000.0 0.0 0.0 0.0 0.0 0.0 0.0 0.0 0.0 2.0 40,000.0- Others (ha) 22,000.0 0.0 0.0 0.0 0.0 0.0 0.0 0.0 0.0 0.0 0.0 0.0 0.0 Sub-total 227,896.5 27,896.5 42,008.3 56,700.5 42,694.2 79,439.2
3) Agro-chemicals- Herbicide (ha) 10,084.5 0.0 0.0 0.0 0.0 0.0 0.0 0.0 0.0 0.0 0.0 0.0 0.0- Pesticide (ha) 8,831.2 1.0 8,831.2 1.0 8,831.2 1.0 8,831.2 1.0 8,831.2 1.0 8,831.2 1.0 8,831.2- Hormone (ha) 3,610.0 0.0 0.0 0.0 0.0 0.0 0.0 0.0 0.0 0.0 0.0 0.0 0.0 Sub-total 8,831.2 8,831.2 8,831.2 8,831.2 8,831.2 8,831.2
4) Machinery- Land preparation (ha) 12,730.0 1.0 12,730.0 0.0 0.0 0.0 0.0 0.0 0.0 0.0 0.0 0.2 2,546.0- Irrigation by pump (ha) 22,420.0 0.5 11,210.0 0.5 11,210.0 0.5 11,210.0 0.5 11,210.0 0.5 11,210.0 0.5 11,210.0- Transport produce per ton (ha) 361.0 0.0 0.0 9.1 3,267.1 9.7 3,483.7 7.2 2,613.6 4.8 1,740.0 6.2 2,220.9 Sub-total 23,940.0 14,477.1 14,693.7 13,823.6 12,950.0 15,976.9
5) Human labor- Hired (psn) 481.0 118.0 56,758.0 80.0 38,480.0 87.0 41,847.0 80.0 38,480.0 67.0 32,227.0 86.4 41,558.4- Family (psn) 481.0 185.0 88,985.0 125.0 60,125.0 136.0 65,416.0 125.0 60,125.0 105.0 50,505.0 135.2 65,031.2 Sub-total 303.0 145,743.0 205.0 98,605.0 223.0 107,263.0 205.0 98,605.0 172.0 82,732.0 221.6 106,589.6
6) Support- Poles and wires (ha) 66,690.0 1.0 66,690.0 0.0 0.0 0.0 0.0 0.0 0.0 0.0 0.0 0.2 14,040.0
7) Miscellaneous (5%) 24,566.2 7,490.5 8,639.8 8,898.0 7,360.4 11,426.1
Total Cost- Including famliy labour 604,874.6 217,425.2 246,852.0 246,983.3 205,072.8 304,978.7- Excluding family labour 515,889.6 157,300.2 181,436.0 186,858.3 154,567.8 239,947.5
C. Net Returen- Including famliy labour -604,874.6 246,839.8 248,193.0 124,428.7 42,193.2 10,618.9- Excluding family labour -515,889.6 306,964.8 313,609.0 184,553.7 92,698.2 75,650.1

The Preparatory Survey on the P
roject for Improvem
ent of Agricultural P
roduction and Productivity
in Dry Zone A
reas in Dem
ocratic Socialist Republic of Sri Lanka
Final R
eport
T 6-19
Table A
6.7 E
conomic C
rop Budget of O
FC, Paddy and V
egetables per Hectare under
Without-project C
onditions (Mango)
Mango: 1st Year Mango: 2nd Year Mango: 3rd Year Mango: 4th Year Mango: 5th Year Mango: 6th Year Mango: 7-20th Yr Ave. Mango: 20-Yr Ave.Unit Unit Value Value Value Value Value Value Value Value
Price Amount Amount Amount Amount Amount Amount Amount Amount(Rs) (Rs) (Rs) (Rs) (Rs) (Rs) (Rs) (Rs) (Rs)
A. Gross IncomeYield (kg) 58.2 0.0 0.0 0.0 0.0 0.0 0.0 0.0 0.0 1,400.0 81,480.0 4,000.0 232,800.0 9,800.0 570,360.0 7,130.0 414,966.0
B. Production Cost1) Seedling (kg) 108.2 105.0 11,363.5 0.0 0.0 0.0 0.0 0.0 0.0 0.0 0.0 0.0 0.0 0.0 0.0 5.3 568.22) Fertilizers
-Urea (kg) 49.3 18.0 887.2 27.0 1,330.8 36.0 1,774.4 36.0 1,774.4 45.0 2,218.0 58.0 2,858.7 89.0 4,386.7 73.3 3,612.9- TSP (kg) 56.3 22.0 1,239.0 33.0 1,858.5 44.0 2,478.1 44.0 2,478.1 55.0 3,097.6 70.0 3,942.4 108.0 6,082.5 89.0 5,012.4- MOP (kg) 66.7 10.0 667.0 15.0 1,000.5 20.0 1,334.0 20.0 1,334.0 25.0 1,667.5 32.0 2,134.3 49.0 3,268.2 40.4 2,694.6- Compost (ton) 20,000.0 10.0 200,000.0 10.0 200,000.0 10.0 200,000.0 10.0 200,000.0 10.0 200,000.0 10.0 200,000.0 10.0 200,000.0 10.0 200,000.0- Others (ha) 22,000.0 0.0 0.0 0.0 0.0 0.0 0.0 0.0 0.0 0.0 0.0 0.0 0.0 0.0 0.0 0.0 0.0 Sub-total 202,793.2 204,189.8 205,586.4 205,586.4 206,983.0 208,935.4 213,737.4 211,319.9
3) Agro-chemicals- Herbicide (ha) 10,084.5 1.0 10,084.5 0.0 0.0 0.0 0.0 0.0 0.0 0.0 0.0 0.0 0.0 0.0 0.0 0.1 504.2- Pesticide (ha) 8,831.2 0.0 0.0 1.0 8,831.2 1.0 8,831.2 1.0 8,831.2 1.0 8,831.2 1.0 8,831.2 1.0 8,831.2 1.0 8,389.6- Hormone (ha) 3,610.0 0.0 0.0 0.0 0.0 0.0 0.0 0.0 0.0 0.0 0.0 0.0 0.0 0.0 0.0 0.0 0.0 Sub-total 10,084.5 8,831.2 8,831.2 8,831.2 8,831.2 8,831.2 8,831.2 8,893.9
4) MachineryLand preparation (ha) 12,730.0 1.0 12,730.0 0.0 0.0 0.0 0.0 0.0 0.0 0.0 0.0 0.0 0.0 0.0 0.0 0.1 636.5Irrigation by pump (ha) 22,420.0 0.5 11,210.0 0.5 11,210.0 0.5 11,210.0 0.5 11,210.0 0.5 11,210.0 0.5 11,210.0 0.5 11,210.0 0.5 11,210.0Transport produce per ton (ha) 361.0 0.0 0.0 0.0 0.0 0.0 0.0 0.0 0.0 1.4 505.4 4.0 1,444.0 9.8 3,537.8 7.1 2,573.9 Sub-total 23,940.0 11,210.0 11,210.0 11,210.0 11,715.4 12,654.0 14,747.8 14,420.4
5) Human labor- Hired (psn) 481.0 47.0 22,607.0 37.0 17,797.0 38.0 18,278.0 46.0 22,126.0 51.0 24,531.0 43.0 20,683.0 44.0 21,164.0 43.9 21,115.9- Family (psn) 481.0 73.0 35,113.0 57.0 27,417.0 59.0 28,379.0 73.0 35,113.0 80.0 38,480.0 68.0 32,708.0 69.0 33,189.0 68.8 33,092.8 Sub-total 120.0 57,720.0 94.0 45,214.0 97.0 46,657.0 119.0 57,239.0 131.0 63,011.0 111.0 53,391.0 113.0 54,353.0 112.7 54,208.7
6) Support- Poles and wires (ha) 66,690.0 0.0 0.0 0.0 0.0 0.0 0.0 0.0 0.0 0.0 0.0 0.0 0.0 0.0 0.0 0.0 0.0
7) Miscellaneous (5%) 15,295.1 13,472.3 13,614.2 14,143.3 14,527.0 14,190.6 14,583.5 14,470.6
Total Cost- Including famliy labour 321,196.3 282,917.3 285,898.8 297,009.9 305,067.6 298,002.2 306,252.9 303,881.6- Excluding family labour 286,083.3 255,500.3 257,519.8 261,896.9 266,587.6 265,294.2 273,063.9 270,788.8
C. Net Returen- Including famliy labour -321,196.3 -282,917.3 -285,898.8 -297,009.9 -223,587.6 -65,202.2 264,107.1 111,084.4- Excluding family labour -286,083.3 -255,500.3 -257,519.8 -261,896.9 -185,107.6 -32,494.2 297,296.1 144,177.2

The Preparatory Survey on the P
roject for Improvem
ent of Agricultural P
roduction and Productivity
in Dry Zone A
reas in Dem
ocratic Socialist Republic of Sri Lanka
Final R
eport
T 6-20
Table A
6.7 E
conomic C
rop Budget of O
FC, Paddy and V
egetables per Hectare under
Without-project C
onditions (Orange)
Orange: 1st Year Orange: 2nd Year Orange: 3rd Year Orange: 4th Year Orange: 5th Year Orange: 6-8th Yr Ave. Orange: 9-15th Yr Ave. Orange: 15-Yr Ave.Unit Unit Value Value Value Value Value Value Value Value
Price Amount Amount Amount Amount Amount Amount Amount Amount(Rs) (Rs) (Rs) (Rs) (Rs) (Rs) (Rs) (Rs) (Rs)
A. Gross IncomeYield (fruit) 76.8 0.0 0.0 0.0 0.0 0.0 0.0 1,300.0 99,840.0 3,070.0 235,776.0 10,150.0 779,520.0 10,150.0 779,520.0 7,058.0 542,054.4
B. Production Cost1) Seedlings (kg) 108.2 562.0 60,821.9 0.0 0.0 0.0 0.0 0.0 0.0 0.0 0.0 0.0 0.0 0.0 0.0 37.5 4,054.82) Fertilizers
-Urea (kg) 49.3 48.0 2,365.9 66.0 3,253.0 59.0 2,908.0 96.0 4,731.7 128.0 6,308.9 137.0 6,752.5 137.0 6,752.5 117.8 5,806.2- TSP (kg) 56.3 75.0 4,224.0 82.0 4,618.2 73.0 4,111.3 120.0 6,758.3 159.0 8,954.8 170.0 9,574.3 170.0 9,574.3 147.3 8,294.0- MOP (kg) 66.7 51.0 3,401.6 37.0 2,467.8 33.0 2,201.0 55.0 3,668.4 72.0 4,802.3 78.0 5,202.5 78.0 5,202.5 68.5 4,571.1- Compost (ton) 20,000.0 5.6 112,400.0 6.0 120,000.0 6.0 120,000.0 6.0 120,000.0 6.0 120,000.0 6.0 120,000.0 6.0 120,000.0 6.0 119,493.3- Others (ha) 22,000.0 0.0 0.0 0.0 0.0 0.0 0.0 0.0 0.0 0.0 0.0 0.0 0.0 0.0 0.0 0.0 0.0 Sub-total 122,391.4 130,339.1 129,220.4 135,158.4 140,066.0 141,529.3 141,529.3 138,164.6
3) Agro-chemicals- Herbicide (ha) 10,084.5 0.0 0.0 0.0 0.0 0.0 0.0 0.0 0.0 0.0 0.0 0.0 0.0 0.0 0.0 0.0 0.0- Pesticide (ha) 8,831.2 1.0 8,831.2 1.0 8,831.2 1.0 8,831.2 1.0 8,831.2 1.0 8,831.2 1.0 8,831.2 1.0 8,831.2 1.0 8,831.2- Hormone (ha) 3,610.0 0.0 0.0 0.0 0.0 0.0 0.0 0.0 0.0 0.0 0.0 0.0 0.0 0.0 0.0 0.0 0.0 Sub-total 8,831.2 8,831.2 8,831.2 8,831.2 8,831.2 8,831.2 8,831.2 8,831.2
4) MachineryLand preparation (ha) 12,730.0 1.0 12,730.0 0.0 0.0 0.0 0.0 0.0 0.0 0.0 0.0 0.0 0.0 0.0 0.0 0.1 848.7Irrigation by pump (ha) 22,420.0 0.5 11,210.0 0.5 11,210.0 0.5 11,210.0 0.5 11,210.0 0.5 11,210.0 0.5 11,210.0 0.5 11,210.0 0.5 11,210.0Transport produce per ton (ha) 361.0 0.0 0.0 0.0 0.0 0.0 0.0 1.3 469.3 3.1 1,108.3 10.2 3,664.2 10.2 3,664.2 7.1 2,547.9 Sub-total 23,940.0 11,210.0 11,210.0 11,679.3 12,318.3 14,874.2 14,874.2 14,606.6
5) Human labor- Hired (psn) 481.0 59.0 28,379.0 34.0 16,354.0 34.0 16,354.0 38.0 18,278.0 38.0 18,278.0 39.0 18,759.0 44.0 21,164.0 41.9 20,137.9- Family (psn) 481.0 91.0 43,771.0 52.0 25,012.0 52.0 25,012.0 58.0 27,898.0 58.0 27,898.0 60.0 28,860.0 67.0 32,227.0 64.0 30,784.0 Sub-total 150.0 72,150.0 86.0 41,366.0 86.0 41,366.0 96.0 46,176.0 96.0 46,176.0 99.0 47,619.0 111.0 53,391.0 105.9 50,921.9
6) Support- Poles and wires (ha) 66,690.0 0.0 0.0 0.0 0.0 0.0 0.0 0.0 0.0 0.0 0.0 0.0 0.0 0.0 0.0 0.0 0.0
7) Miscellaneous (5%) 14,406.7 9,587.3 9,531.4 10,092.2 10,369.6 10,642.7 10,931.3 10,829.0
Total Cost- Including famliy labour 302,541.2 201,333.6 200,159.0 211,937.2 217,761.0 223,496.3 229,556.9 227,408.0
C. Net Returen- Including famliy labour -302,541.2 -201,333.6 -200,159.0 -112,097.2 18,015.0 556,023.7 549,963.1 314,646.4

The Preparatory Survey on the P
roject for Improvem
ent of Agricultural P
roduction and Productivity
in Dry Zone A
reas in Dem
ocratic Socialist Republic of Sri Lanka
Final R
eport
T 6-21
Table A
6.7 E
conomic C
rop Budget of O
FC, Paddy and V
egetables per Hectare under
Without-project C
onditions (Lim
e)
Lime: 1st Year Lime: 2nd Year Lime: 3rd Year Lime: 4th Year Lime: 5th Year Lime: 6th Year Lime: 7-15th Year Average Lime: 15-year AverageUnit Unit Value Value Value Value Value Value Value Value
Price Amount Amount Amount Amount Amount Amount Amount Amount(Rs) (Rs) (Rs) (Rs) (Rs) (Rs) (Rs) (Rs) (Rs)
A. Gross IncomeYield (kg) 60.0 0.0 0.0 0.0 0.0 3,400.0 204,000.0 5,100.0 306,000.0 7,800.0 468,000.0 12,500.0 750,000.0 21,800.0 1,308,000.0 15,000.0 900,000.0
B. Production Cost1) Seedling (kg) 162.2 700.0 113,572.9 0.0 0.0 0.0 0.0 0.0 0.0 0.0 0.0 0.0 0.0 0.0 0.0 46.7 7,571.52) Fertilizers
-Urea (kg) 49.3 52.0 2,563.0 103.0 5,076.7 156.0 7,689.0 230.0 11,336.4 309.0 15,230.2 182.0 8,970.5 254.0 12,519.3 221.2 10,902.6- TSP (kg) 56.3 57.0 3,210.2 114.0 6,420.4 170.0 9,574.3 208.0 11,714.4 243.0 13,685.6 200.0 11,263.9 240.0 13,516.7 210.1 11,834.6- MOP (kg) 66.7 15.0 1,000.5 30.0 2,000.9 46.0 3,068.1 54.0 3,601.7 65.0 4,335.4 53.0 3,535.0 64.0 4,268.7 55.9 3,730.7- Compost (ton) 20,000.0 11.0 220,000.0 11.0 220,000.0 11.0 220,000.0 11.0 220,000.0 11.0 220,000.0 11.0 220,000.0 11.0 220,000.0 11.0 220,000.0- Others (ha) 22,000.0 0.0 0.0 0.0 0.0 0.0 0.0 0.0 0.0 0.0 0.0 0.0 0.0 0.0 0.0 0.0 Sub-total 226,773.7 233,498.1 240,331.4 246,652.5 253,251.2 243,769.4 250,304.7 246,467.9
3) Agro-chemicals- Herbicide (ha) 10,084.5 1.0 10,084.5 1.0 10,084.5 1.0 10,084.5 1.0 10,084.5 1.0 10,084.5 1.0 10,084.5 1.0 10,084.5 1.0 10,084.5- Pesticide (ha) 8,831.2 1.0 8,831.2 1.0 8,831.2 1.0 8,831.2 1.0 8,831.2 1.0 8,831.2 1.0 8,831.2 1.0 8,831.2 1.0 8,831.2- Hormone (ha) 3,610.0 0.0 0.0 0.0 0.0 0.0 0.0 0.0 0.0 0.0 0.0 0.0 0.0 0.0 0.0 0.0 0.0 Sub-total 18,915.7 18,915.7 18,915.7 18,915.7 18,915.7 18,915.7 18,915.7 18,915.7
4) Machinery- Land preparation (ha) 12,730.0 1.0 12,730.0 0.0 0.0 0.0 0.0 0.0 0.0 0.0 0.0 0.0 0.0 0.0 0.0 0.1 848.7- Irrigation by pump (ha) 22,420.0 0.5 11,210.0 0.5 11,210.0 0.5 11,210.0 0.5 11,210.0 0.5 11,210.0 0.5 11,210.0 0.5 11,210.0 0.5 11,210.0- Transport produce per ton (ha) 361.0 0.0 0.0 0.0 0.0 3.4 1,227.4 5.1 1,841.1 7.8 2,815.8 12.5 4,512.5 21.8 7,869.8 15.0 5,415.0 Sub-total 23,940.0 11,210.0 12,437.4 13,051.1 14,025.8 15,722.5 19,079.8 17,473.7
5) Human labor- Hired (psn) 481.0 60.0 28,860.0 39.0 18,759.0 48.0 23,088.0 43.0 20,683.0 39.0 18,759.0 43.0 20,683.0 43.0 20,683.0 43.9 21,131.9- Family (psn) 481.0 94.0 45,214.0 60.0 28,860.0 76.0 36,556.0 68.0 32,708.0 60.0 28,860.0 68.0 32,708.0 68.0 32,708.0 69.2 33,285.2 Sub-total 154.0 74,074.0 99.0 47,619.0 124.0 59,644.0 111.0 53,391.0 99.0 47,619.0 111.0 53,391.0 111.0 53,391.0 113.1 54,417.1
6) Support- Poles and wires (ha) 66,690.0 0.0 0.0 0.0 0.0 0.0 0.0 0.0 0.0 0.0 0.0 0.0 0.0 0.0 0.0
6) Miscellaneous (5%) 22,863.8 15,562.1 16,566.4 16,600.5 16,690.6 16,589.9 17,084.6 17,242.3
Total Cost- Including famliy labour 480,140.1 326,804.9 347,895.0 348,610.8 350,502.3 348,388.5 358,775.7 362,088.2
C. Net Returen- Including famliy labour -480,140.1 -326,804.9 -143,895.0 -42,610.8 117,497.7 401,611.5 949,224.3 537,911.8

The Preparatory Survey on the Project for Improvement of Agricultural Production and Productivity in Dry Zone Areas in Democratic Socialist Republic of Sri Lanka
Final Report
T 6-22
Table A 6.8 Basic Production Data of Livestock Sector
Source: JICA Survey Team
Table A 6.9 Farm Budget of Livestock Sector by each Production Style
urce: JICA Survey Team
Unit AverageNumber
Minimum MaximumAverageNumber
Minimum Maximum
Number of Cows Head/Farm 6.86 2.00 17.00 6.86 8.00 20.00Number of Milking Cow Head/Farm 3.38 0.50 3.97 3.53 3.00 8.00Daily Milk Production per Milking Cow Liters/Day 2.43 2.50 22.00 6.10 10.00 25.00Lactation Length of Milking Cow per Year Days/Year 228 238 277 255 260 300
Present Condition Future Condition
A. Income(Rs/Litre) (Litre) (Rs) (Rs/Litre) (Litre) (Rs)
Daily Income from Milk per Productive Cow Rs/Day/Head 50.0 2.43 122 50.0 6.10 305.0Annual Income from Milk per Head Rs/Year/Head 50.0 554 27,700 50.0 1,552 77,623 Annual Income from Milk per Farm Rs/Year/Farm 50.0 1,873 93,626 50.0 5,488 274,392
(Rs/Head) (Head) (Rs/Farm) (Rs/Head) (Head) (Rs/Farm)
Stock Value of Cows Rs/Farm 35,000 6.86 240,100 42,000 6.86 288,120Average Income from Culling Rs/Year/Farm 10.0% 24,010 15.0% 43,218
B.Production cost
1. Feed Cost per Milking Cow (Rs/Year/Kg) (Kg) (Rs/Year/Kg) (Kg)
1.1 Concemtrates Rs/Year/Head 35.0 300.0 10,500 35.0 360.0 12,600.0 1.2 Fodder Rs/Year/Head 3.0 0.0 0 3.0 1,800.0 5,400.0 1.3 Fodder Pellets Rs/Year/Head 10.0 0.0 0 10.0 360.0 3,600.0 1.4 Straw baled Rs/Year/Head 5.0 0.0 0 5.0 1,800.0 9,000.0 Total Feed Cost for Lifestock Unit Rs/Year/Head 10,500.0 30,600.0 Total Feed Cost per Head Rs/Year/Head 10,500.0 0.75 7,875.0 30,600.0 0.75 22,950.0
(Rs/Year/Head) (Head) (Rs/Year/Head) (Head)
Feed Cost per Farm Rs/Year/Farm 7,875.0 3.38 26,617.5 22,950.0 3.53 81,127.3
2.Labour (Rs/Day) (Day) (Rs/Day)
2.1 Family Rs/Year/Farm 481 45.6 21,945.6 481 82.0 39,442.0 2.2 Hired Rs/Year/Farm 481 45.6 21,945.6 481 82.0 39,442.0
(Rs/Year/Head) (Head) (Rs/Year/Head) (Head)
3. Veterinary & drug cost Rs/Year/Farm 89.0 6.86 610.5 267.0 6.86 1,831.64.Breeding cost 4.1 AI Rs/Year/Farm 267.0 3.38 902.5 667.5 3.53 2,359.6 4.2 Synchronization+AI Rs/Year/Farm 0.0 3.38 0.0 0.0 3.53 0.0 4.3 Bull Rs/Year/Farm 0.0 3.38 0.0 0.0 3.53 0.05.water cost Rs/Year/Farm 89.0 6.86 610.5 222.5 6.86 1,526.46. Electrical cost Rs/Year/Farm 22.3 6.86 152.6 55.6 6.86 381.67. Salt Rs/Year/Farm 133.5 6.86 915.8 333.8 6.86 2,289.58. Bedding Rs/Year/Farm 222.5 6.86 1,526.4 556.3 6.86 3,815.99. Cleaning Rs/Year/Farm 222.5 6.86 1,526.4 556.3 6.86 3,815.910. Machinary use Rs/Year/Farm 950.0 6.86 6,517.0 2,375.0 6.86 16,292.5
Cost Rs/Year/Farm 83,270 192,324 Cost excluding Family Labour Rs/Year/Farm 61,325 152,882
Income from milk Rs/Year/Farm 93,626 80% 274,392 86%Income from culling Rs/Year/Farm 24,010 20% 43,218 14%Total income Rs/Year/Farm 117,636 317,610
Cost for Milk Rs/Year/Farm 66,275 80% 166,154 86%Cost for Culling Rs/Year/Farm 16,996 20% 26,170 14%
Net Return Rs/Year/Farm 34,366 125,286
Net Return for Milk Rs/Year/Farm 27,351 108,238 Production Amount (l/year) l/Year/Farm 1,873 5,488
Difference of With Project and Without ProjectProfit for Milk Rs/Year/Farm 80,887 Production Amount l/Year/Farm 3,615 Net Profit per Litre Rs/Year 22.4
Present Condition Future Condition

The Preparatory Survey on the Project for Improvement of Agricultural Production and Productivity in Dry Zone Areas in Democratic Socialist Republic of Sri Lanka
Final Report
T 6-23
Table A 6.10 Calculation of EIRR and B/C
Source: JICA Survey Team
2014 2015 2016 2017 2018 2019 2020 2021 2022 2023 2024 2025 2026 2027Economic Benefit 0% 0% 0% 0% 7% 14% 21% 28% 35% 42% 49% 56% 63% 70%Incremental Production of OFC and Fruits 0 0 0 0 609 1,218 1,827 2,435 3,044 3,653 4,262 4,871 5,480 6,089Incremental Production of Milk 0 0 0 0 0 185 370 554 739 924 1,109 1,293 1,478 1,663Total Benefit 0 0 0 0 609 1,403 2,197 2,989 3,783 4,577 5,371 6,164 6,958 7,752
Economic CostInitial Cost 393 1,237 3,571 3,448 2,509 1,130 377 0 0 0 0 0 0 0O&M Cost (2% of Civil Construction Cost) 0 4 16 52 86 111 122 127 127 127 127 127 127 127Total Cost 393 1,241 3,587 3,500 2,595 1,241 499 127 127 127 127 127 127 127
Balance -393 -1,241 -3,587 -3,500 -1,986 162 1,698 2,862 3,656 4,450 5,244 6,037 6,831 7,625
Sensitivity Analysis10% Cost Increase 432 1,365 3,946 3,850 2,855 1,365 549 140 140 140 140 140 140 14015% Benefit Decrease 0 0 0 0 518 1,193 1,867 2,541 3,216 3,890 4,565 5,239 5,914 6,589
Balance of Sensitivity AnalysisCase 1 -432 -1,365 -3,946 -3,850 -2,246 38 1,648 2,849 3,643 4,437 5,231 6,024 6,818 7,612Case 2 -393 -1,241 -3,587 -3,500 -2,077 -48 1,368 2,414 3,089 3,763 4,438 5,112 5,787 6,462Case 3 -432 -1,365 -3,946 -3,850 -2,337 -173 1,319 2,401 3,076 3,751 4,426 5,100 5,775 6,450
2028 2029 2030 2031 2032 2033 2034 2035 2036 2037 2038 2039 2040 2041 2042 2043 Total77% 84% 91% 98% 100% 100% 100% 100% 100% 100% 100% 100% 100% 100% 100% 100%
6,697 7,306 7,915 8,524 8,698 8,698 8,698 8,698 8,698 8,698 8,698 8,698 8,698 8,698 8,698 8,698 168,3061,848 1,848 1,848 1,848 1,848 1,848 1,848 1,848 1,848 1,848 1,848 1,848 1,848 1,848 1,848 1,848 37,883
8,545 9,154 9,763 10,372 10,546 10,546 10,546 10,546 10,546 10,546 10,546 10,546 10,546 10,546 10,546 10,546 206,189
0 316 0 0 0 0 0 0 0 0 0 316 0 0 0 -4,280 9,018127 127 127 127 127 127 127 127 127 127 127 127 127 127 127 127 3,312127 443 127 127 127 127 127 127 127 127 127 443 127 127 127 -4,153 12,330
8,418 8,711 9,636 10,245 10,419 10,419 10,419 10,419 10,419 10,419 10,419 10,103 10,419 10,419 10,419 14,699 193,860
140 487 140 140 140 140 140 140 140 140 140 487 140 140 140 -4,5687,263 7,781 8,299 8,816 8,964 8,964 8,964 8,964 8,964 8,964 8,964 8,964 8,964 8,964 8,964 8,964
8,405 8,667 9,623 10,232 10,406 10,406 10,406 10,406 10,406 10,406 10,406 10,059 10,406 10,406 10,406 15,114 192,6277,136 7,338 8,172 8,689 8,837 8,837 8,837 8,837 8,837 8,837 8,837 8,521 8,837 8,837 8,837 13,117 162,9317,124 7,294 8,159 8,677 8,824 8,824 8,824 8,824 8,824 8,824 8,824 8,477 8,824 8,824 8,824 13,532 161,698
Base CaseEIRR 25.1%B/C 3.77
EIRR B/CCase1 23.7% Case1 3.43Case2 22.8% Case2 3.21Case3 21.5% Case3 2.92

The Preparatory Survey on the Project for Improvement of Agricultural Production and Productivity in Dry Zone Areas in Democratic Socialist Republic of Sri Lanka
Final Report
COST ESTIMATION

C-1
ANNEX
COST ESTIMATE
CHAPTER 1 GENERAL INFORMATION
1.1 Basic Condition of Cost Estimate
The basic conditions and assumptions employed for the project cost estimate are as follows:
( 1 ) Cost estimate refers to the prices as of January 2012.
( 2 ) The following exchange rates applied for the cost estimate:
1 US Dollar (US$) = Rs. 132.0
= JPY 79.0
( 3 ) Base costs of labor, construction materials and equipment are collected from District Price Fixing Committee (PFC) of every District, Jan. 2012.
( 4 ) The main unit prices of civil works to be used for estimation of construction cost are the updated unit prices of PEACE Project, these were used in 2008 to 2010. Updating of the unit prices was carried out based on consumer prices indices of equipment, materials and labor between 2008, 2009 and 2010 to 2011 respectively.
( 5 ) The unit prices in 2011 adjusted by considering escalation were further converted to provincial level unit prices according to the base costs taken from PFC.
( 6 ) The all costs are estimated using Sri Lanka Rupee (LKR).
( 7 ) Price escalation rates are assumed to be 2.1%/annum for F/C and 4.0%/annum for L/C.
( 8 ) Physical contingency is principally set as 5.0%.
( 9 ) Tax (VAT) is 12% according to the Government regulation.
(10) Commitment charge of JICA is 0.1%.
(11) Interest for civil works and procurement during construction is 1.4% and that for consulting services is 0.01% of accumulated loan portion.
(11) The project cost is categorized into a foreign currency (F/C) portion and a local currency (L/C) portion as stimulated below:
Foreign currency (F/C) portion :
- Heavy equipment for construction, specific equipment and machinery, materials and goods imported from foreign countries
- Foreign consultants of the consulting services
Local currency (L/C) portion :
- Machinery, materials and goods produced/available in Sri Lanka

C-2
- Labor cost
- Local consultants of the consulting services
(12) Ratios of F/C and L/C for infrastructure works are estimated based on the similar type of project in Sri Lank and 65% for F/C and 35% for L/C are applied.
1.2 Base prices for labor, material and equipment
Unit prices for construction works in Sri Lanka are different according to the districts thus the same construction works in different district are different each other. Since the Project covers many districts as 11 districts in 5 provinces, average unit prices in a province from related districts in the province are applied, i.e. 5 unit prices in one work category are used for cost estimate for the Project.
The unit prices for construction works are obtained in the following manner:
The latest base prices for labor, materials and equipment of every district which have been issued on January 2012 from every District Price Fixing Committee were obtained. They are summarized in Table 1.
All the base prices of districts in the same province were averaged for the provincial average base prices.
1.3 Correcting Rates for Unit Prices among Provinces for Main Construction Work Items
Proportion of constitution of unit prices is assumed by referring similar projects in Sri Lanka as follows:
Fixed portion : 30%
Machine cost : 30%
Material cost : 25%
Labor cost : 15%
The correcting rates among provinces are obtained as follows:
Table 2 Correcting Rates for Unit Prices among Provinces
Province
Construction cost correcting rate
Fixed Equipment Material Labor Correcting rate for construction cost
30% 30% 25% 15% EP=1.00 NCP=1.00 NWP=1.00 NP=1.00 UvP1.00
EP 1.00 1.00 1.00 1.00 1.00 0.79 0.85 0.84 1.13
NCP 1.00 1.58 1.25 1.20 1.27 1.00 1.08 1.06 1.43
NWP 1.00 1.57 0.94 1.12 1.18 0.93 1.00 0.99 1.33
NP 1.00 1.52 1.09 1.08 1.19 0.94 1.01 1.00 1.35
U P 1.00 0.87 0.69 0.99 0.88 0.70 0.75 0.74 1.00
Source: JICA Survey Team

C-3
1.4 Unit Price for Main Work Items
1.4.1 Unit prices for construction work items
Unit prices for construction works actually applied for Engineering Estimates were obtained from various projects including PEACE project under JICA since 2006 to date. The obtained unit prices were adjusted based on year and place. Concerning price escalation, price indices published by ICTAD Bulletin of Construction Statistics, Jan. 2012 were used in order to convert from year of obtained unit prices to 2012 prices. The obtained unit prices were also adjusted based on the places where the projects were executed by using the correcting rate shown in Table 2.
Table 3 Price Indices for Escalation
Item Base Year Price Index
= 100
Price indices Escalation from
2007 2008 2009 2010 2011 2007
to 2011
2008 to
2011
2009 to
2011
2010 to
20111) Equipment
Small equipment 1990(AVG) 171.9 238.2 336.7 336.7 336.7 1.96 1.41 1.00 1.00
Heavy equipment 1990(AVG) 238.4 274.8 313.7 313.8 313.7 1.32 1.14 1.00 1.00
Fuel 1990(AVG) 586.3 781.8 684.0 713.4 713.4 1.22 0.91 1.04 1.00
2) Major materials
Cement 1990(AVG) 352.4 394.5 443.8 432.2 432.2 1.23 1.10 0.97 1.00
Cement blocks 1990(AVG) 365.7 395.3 430.9 445.4 460.8 1.26 1.17 1.07 1.03
Rubble 1990(AVG) 387.0 406.6 429.9 455.7 460.9 1.19 1.13 1.07 1.01
Metal 1990(AVG) 208.3 230.5 244.5 258.5 263.2 1.26 1.14 1.08 1.02
Sand 1990(AVG) 1,430.1 1,503.5 1,595.1 1,717.1 1,776.2 1.24 1.18 1.11 1.03
Bricks (machine cut) 1990(AVG) 314.7 352.3 359.6 359.9 361.8 1.15 1.03 1.01 1.01
Lime 1990(AVG) 319.4 367.9 387.1 394.5 398.6 1.25 1.08 1.03 1.01
Reinforcement steel 1990(AVG) 294.8 411.4 460.1 460.1 492.1 1.67 1.20 1.07 1.07
GI sheets 1990(AVG) 316.1 375.9 423.2 447.9 447.9 1.42 1.19 1.06 1.00
PVC pipes 1990(AVG) 427.9 504.6 658.9 632.5 657.0 1.54 1.30 1.00 1.04
Formwork timber 1990(AVG) 589.1 654.9 692.4 702.5 726.8 1.23 1.11 1.05 1.03
General timber 1990(AVG) 649.5 714.4 714.4 755.3 770.9 1.19 1.08 1.08 1.02
Bitumen 80/100, bulk price 1990(AVG) 301.6 446.8 540.5 532.0 515.9 1.71 1.15 0.95 0.97
Ready mixed concrete 1990(AVG) 262.9 290.2 322.0 322.9 340.1 1.29 1.17 1.06 1.05
High tensile steel wire 1990(AVG) 356.0 379.1 512.4 512.4 552.0 1.55 1.46 1.08 1.08
Pre-stressed bridge beams 1990(AVG) 415.7 421.0 516.3 516.3 706.8 1.70 1.68 1.37 1.37
Concrete lamp post 1990(AVG) 403.0 424.8 517.4 517.4 538.5 1.34 1.27 1.04 1.04
Reinforced concrete pipe 1990(AVG) 344.3 385.4 470.0 470.0 463.1 1.35 1.20 0.99 0.99
3) Labour cost
Skilled labor 1990(AVG) 290.1 304.7 338.9 340.3 363.5 1.25 1.19 1.07 1.07
Semiskilled labor 1990(AVG) 277.7 300.2 336.8 337.9 352.1 1.27 1.17 1.05 1.04
Unskilled labor 1990(AVG) 320.1 342.8 374.2 375.4 407.4 1.27 1.19 1.09 1.09
4) Construction works
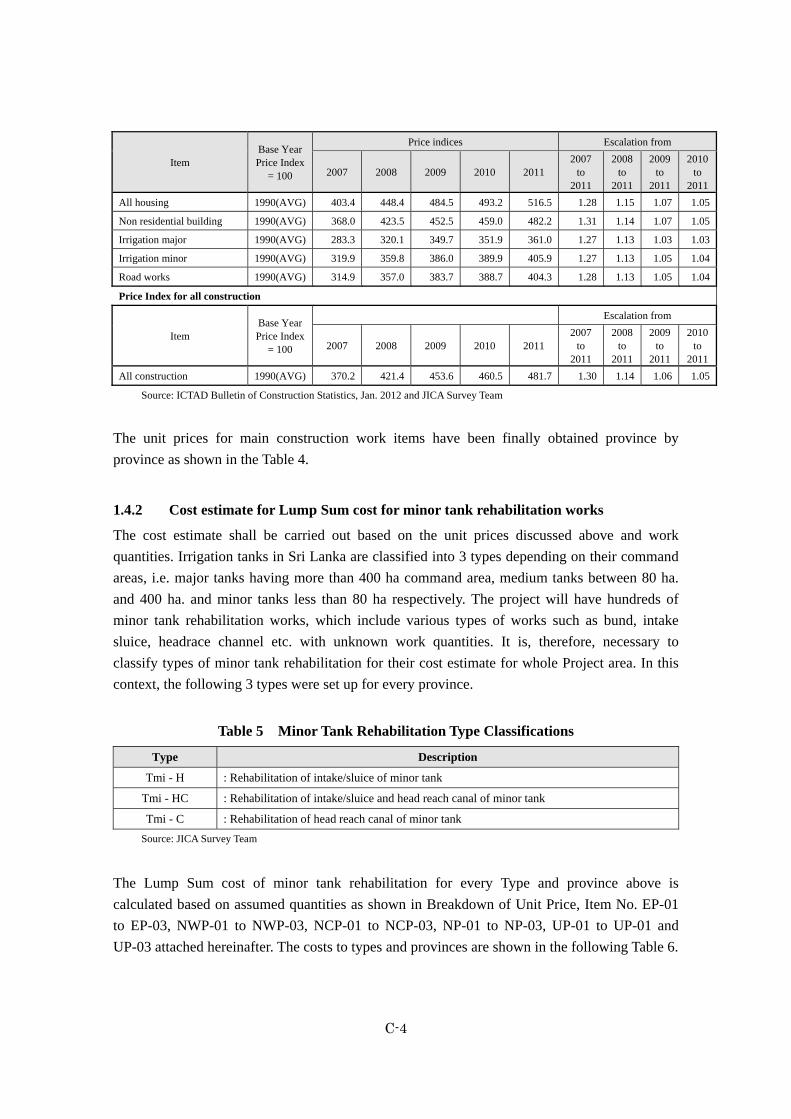
C-4
Item Base Year Price Index
= 100
Price indices Escalation from
2007 2008 2009 2010 2011 2007
to 2011
2008 to
2011
2009 to
2011
2010 to
2011All housing 1990(AVG) 403.4 448.4 484.5 493.2 516.5 1.28 1.15 1.07 1.05
Non residential building 1990(AVG) 368.0 423.5 452.5 459.0 482.2 1.31 1.14 1.07 1.05
Irrigation major 1990(AVG) 283.3 320.1 349.7 351.9 361.0 1.27 1.13 1.03 1.03
Irrigation minor 1990(AVG) 319.9 359.8 386.0 389.9 405.9 1.27 1.13 1.05 1.04
Road works 1990(AVG) 314.9 357.0 383.7 388.7 404.3 1.28 1.13 1.05 1.04
Price Index for all construction
Item Base Year Price Index
= 100
Escalation from
2007 2008 2009 2010 2011 2007
to 2011
2008 to
2011
2009 to
2011
2010 to
2011All construction 1990(AVG) 370.2 421.4 453.6 460.5 481.7 1.30 1.14 1.06 1.05
Source: ICTAD Bulletin of Construction Statistics, Jan. 2012 and JICA Survey Team
The unit prices for main construction work items have been finally obtained province by province as shown in the Table 4.
1.4.2 Cost estimate for Lump Sum cost for minor tank rehabilitation works
The cost estimate shall be carried out based on the unit prices discussed above and work quantities. Irrigation tanks in Sri Lanka are classified into 3 types depending on their command areas, i.e. major tanks having more than 400 ha command area, medium tanks between 80 ha. and 400 ha. and minor tanks less than 80 ha respectively. The project will have hundreds of minor tank rehabilitation works, which include various types of works such as bund, intake sluice, headrace channel etc. with unknown work quantities. It is, therefore, necessary to classify types of minor tank rehabilitation for their cost estimate for whole Project area. In this context, the following 3 types were set up for every province.
Table 5 Minor Tank Rehabilitation Type Classifications
Type Description
Tmi - H : Rehabilitation of intake/sluice of minor tank
Tmi - HC : Rehabilitation of intake/sluice and head reach canal of minor tank
Tmi - C : Rehabilitation of head reach canal of minor tank Source: JICA Survey Team
The Lump Sum cost of minor tank rehabilitation for every Type and province above is calculated based on assumed quantities as shown in Breakdown of Unit Price, Item No. EP-01 to EP-03, NWP-01 to NWP-03, NCP-01 to NCP-03, NP-01 to NP-03, UP-01 to UP-01 and UP-03 attached hereinafter. The costs to types and provinces are shown in the following Table 6.

C-5
Table 6 Lump Sum Cost for Tank Rehabilitation by Type and Province
Unit Rs.1,000/place
Tank Type
Province Description of Type of
Rehabilitation EP NCP NWP NP UP Rehab.
Type
Min
or T
ank
Tmi - H Rehabilitation of tank bund and/or intake of minor tank
1,807 2,286 2,124 2,097 1,596
Tmi - HC Rehabilitation of tank bund and/or intake and head reach of main canal from intake of minor tank
9,791 12,387 11,507 11,545 8,645
Tmi - C Rehabilitation for head reach of main canal from intake of minor tank
8,077 10,219 9,769 9,818 7,339
Source: JICA Survey Team
1.4.3 Construction Cost for Individual Schemes and Major and Medium Tank Rehabilitation
The projects having proposed cost of more than Rs. 100 million by District and/or DS Division are classified as individual schemes and there costs were calculated based on the proposed work quantities and unit prices set up by the JICA Survey Team as shown in Table 4. Some specific work items were referred from estimate by DS level workshops because no data available for such specific work items. The breakdowns of construction cost for individual schemes are shown hereafter in Item No. BC/IS-01 to BC/IS-07. As for the major or medium tank rehabilitation, the cost of every scheme was calculated according to the estimated work quantities prepared by District and/or DS Division and unit prices set up by the JICA Survey Team as well. The breakdowns of construction cost for major and medium tank rehabilitation are shown hereafter as Item No. BC/Ma-01 to BC/Ma-05 and BC/Me-01 to BC/Me-30.
1.4.4 Construction cost for Feeder Canal for OFC Extension
With rehabilitation of existing irrigation facilities such as tanks and their related facilities, OFC will be extended. So additional feeder canals and drainage canals for new OFC areas are necessary and their costs must be included. The cost of additional feeder canal for OFC in every region is as follows:
Table 7 Cost of Additional Feeder Canal for OFC
Unit Rs./haType of Canal EP NCP NWP NP UP
Feeder canal construction cost of extension for OFC 61,346 77,615 72,102 72,907 54,168Drainage canal construction cost of extension for OFC 21,088 26,681 24,786 25,063 18,621
Source: JICA Survey Team

C-6
(Unit Rs)No. 1 2 3 4 7 8 9 10 11 12 13
Province NCP
Item District Ampara Trincomalee BatricaloaAnura-
dhapuraKurunegala Puttalam Mannar Vavuniya Mullaitive Badulla Monaragala
1. Labour Cost (per day for 8 hrs.)Unskilled (Male) day 750 700 650 800 850 800 700 770 800 650 725
Unskilled (Female) day NA NA NA NA 800 650 NA 660 NA 650 725
day 850 800 700 950 850 850 800 825 850 675 750
Skilled, grade 2 day 1,000 900 1,200 850 1,000 1,000 950 1,000 900 1,150
Skilled, grade 1 day 1,100 1,100 1,000 1,300 1,100 1,250 1,200 1,100 1,200 1,050 1,200
Skilled, special grade day NA NA NA NA 1,250 1,400 NA NA NA 1,150 1,200
2. Material CostCement (SLS 107, 50kg) Bag 790 NA NA NA NA NA NA NA NA NA NA
Boulder, 12" - 18" Cu.m 883 890 759 NA NA 485 NA NA NA NA NA
Cu.m 972 1,002 1,224 1,237 671 636 1,100 1,075 1,075 707 813
Coarse aggregate (2") Cu.m 2,049 1,447 1,413 1,502 1,413 1,201 1,750 1,700 1,700 1,237 1,307
River sand for concrete Cu.m 1,413 1,272 883 2,756 2,650 1,413 1,300 3,000 1,200 565 883
Cu.m 353 177 459 212 141 212 250 210 300 124 177
Gravel for road Cu.m 1,060 212 530 318 265 300 210 210 300 265 318
100nos 550 700 550 750 700 600 750 850 700 500 620
Swan timber -class 1 Cu.m STC rate NA STC rate STC rate STC rate STC rate NA Quotated P. STC rate NA NA
Reinforce concre pipe D12", 8' long piece NA NA NA NA NA NA NA NA 3,885 NA NA
Reinforce concre pipe D24", 8' long piece NA NA NA NA NA NA NA NA 7,900 NA NA
Reinforce concre pipe D36", 8' long piece NA NA NA NA NA NA NA NA 8,500 NA NA
3. Equipment Costn (Including fuel, wager)Bull Dozer 4D hr. 1,800 3,000 2,200 3,200 4,034 2,400 4,000 3,200 4,500 2,200
Bull Dozer 8D hr. NA NA 3,000 NA NA NA NA 7,000 7,500 NA NA
hr. 2,500 2,700 2,800 4,550 3,963 3,300 4,000 3,750 3,500 NA 2,800
Excavator-PC60 hr. NA NA NA NA NA 3,500 NA 2,450 3,500 NA NA
Excavator-PC120 hr. NA 2,350 NA NA 4,727 NA 3,000 3,500 4,800 NA NA
Excavator-PC200 hr. NA NA 3,100 NA NA NA NA 5,100 5,500 NA NA
Front end roader hr. NA 2,800 1,700 3,850 2,738 1,900 3,000 4,600 4,000 NA 1,400
Tractor water tanker 4000Lit. day NA 3,500 2,800 13,000 7,229 2,800 NA 4,750 5,000 3,200 2,800
Concrete mixer-10/7 cu.ft day 4,576 3,822 NA NA 1,200 NA 4,500 3,650 4,000 NA NA
day 1,670 NA NA NA NA NA 3,000 3,650 4,000 NA NA
Vibrating roller hr. NA NA 1,500 NA 5,490 1,500 3,000 2,500 3,000 NA 1,500
day NA 6,750 NA NA 8,404 NA NA NA NA NA NA
Source : District Price Fixing Committee of evey District, Jan. 2012 (publish twice a year)
Road roller
Semiskilled
Earth
Brick
Motor Grader
Poker vibrator
Rubblr 6" - 9"
Eastern Province Northern Province Uva ProvinceNWPUnitTable 1 B
ase Cost of L
abor, Materials and E
quipment by D
istrict

C-7
EP NCP NWP NP UPUP-1 Clearing & Grubbing ha 28,605 NP 24,069 30,452 28,289 28,605 21,253
UP-2 Stripping of top soil m3 118 NP 99 126 117 118 88
UP-3 Forming bund from borrow of 1-2 km m3 362 EP 362 458 425 430 320
UP-3-1 Slope protection for tank bund m3 450 NP 379 479 445 450 334
UP-4 Gravel bedding for road / canal bund (B=3m, t=20cm) m 599 NP 504 638 592 599 445
UP-5 Excavation & backfilling m3 738 NP 621 786 730 738 548
UP-6 Desilting / excavation for canal m3 391 NP 329 416 387 391 291
UP-7 Concrete 1:3:6 (40) include. necessary works m3 17,283 NP 14,542 18,399 17,092 17,283 12,841
UP-8 Re-inforced concrete, incl. form etc. m3 30,970 EP 30,970 39,184 36,400 36,807 27,347
UP-9 Main canal lining m 12,780 NP 10,753 13,605 12,639 12,780 9,495
UP-9-1 Main canal lining for minor tank m 7,668 NP 6,452 8,163 7,583 7,668 5,697
UP-10 Desilting canal & reparing & canal lining m 9,935 EP 9,935 12,570 11,677 11,807 8,773
UP-11 Turnout of MC no 149,112 NP 125,466 158,741 147,466 149,112 110,787
UP-12 Culvert of MC no 288,174 NP 242,476 306,783 284,993 288,174 214,106
UP-13 Metalling & tarring of access road m 3,834 EP 3,834 4,851 4,506 4,557 3,385
UP-14 Field canal rehabilitation including structure m 2,869 NCP 2,268 2,869 2,665 2,695 2,002
UP-15 Building work m2 34,615 EP 34,615 43,795 40,685 41,139 30,565
UP-16 Agro well - Type 1 : 4m dia. 6m deep no 498,000 EP 498,000 630,075 585,321 591,855 439,734
UP-17 Agro well - Type 2 : 2.5m dia. 6m deep no 348,600 EP 348,600 441,053 409,725 414,299 307,814
UP-18 Sprinkler kit for 500m2 no 328,900 Common 328,900 328,900 328,900 328,900 328,900
UP-19 Feeder canal by concrete lining for OFC ha 61,346 EP 61,346 77,615 72,102 72,907 54,168
UP-20 Water pump for agro well ha 60,000 Common 60,000 60,000 60,000 60,000 60,000
UP-21 Drainage canal construction for OFC ha 21,088 EP 21,088 26,681 24,786 25,063 18,621
UP-22 Drying floor, 100m2 no 181,000 EP 181,000 229,003 212,737 215,112 159,823
UP-23 Collcting center building, 200m2 no 2,645,782 EP 2,645,782 3,347,472 3,109,702 3,144,417 2,336,226
UP-25 Electric fence (protect from elephants) km 581,000 Common 587,000 581,000 581,000 581,000 581,000
UP-26 Drip irrigation system ha 62,000 common 587,000 62,000 62,000 62,000 62,000Source : JICA Survey Team
BUP-05
BUP-06 based on quotation
70% of UP-16
Quotation
BUP-04
Quotation
BUP-02
BUP-03
BUP-07
PEACE PJT
PEACE PJT
PEACE PJT
PEACE PJT
PEACE PJT
BUP-01
PEACE PJT
PEACE PJT
PEACE PJT
PEACE PJT
UP-09x60%
PEACE PJT
PEACE PJT
PEACE PJT
PEACE PJT
PEACE PJT
PEACE PJT
PEACE PJT
Refence No. Work Item Unit BUP-01 BaseProvince
Apllied Unit Price by Province (Rs) Reference breakdown
Table 4 U
nit Prices of Main W
ork Items by Province

C-8
Headwork/intake
Canal Others Range Average Toatl
T3-H ● - 146 1.0 - 10.0 2.46 359.2T3-HC ● ● - 532 1.0 - 20.0 3.17 1,688.0T3-C ● - 24 0.3 - 12.0 3.26 78.3T2-H ● - 15 2.0 - 20.0 5.43 81.5
T2-HC ● ● - 51 2.0 - 87.0 19.81 1,010.5T2-C ● - 19 2.0 - 50.0 14.03 266.5T1-H ● - 0 - - 0.0
T1-HC ● ● - 1 - 90.00 90.0T1-C ● - 0 - - 0.0
788 - 3,574.0● ● ● 1 491.0
● ● 1 500.0
● Anicut 1 310.0
● ● 1 410.0
● ● ● 1 180.0
● Pump 1 225.0
● Pump 1 382.0
● ● ● 1 300.0● ● ● 1 82.0● ● ● 1 607.6● ● ● 1 28.6
3,516.1Source : JICA Survey Team based on long list fron DS Divisions
Proposed cost (Rs. Million)
TotalIndi
vidu
al S
chem
e w
ith c
ost o
f mor
e th
an 1
00 m
illio
n R
Improvements to Mahanaga Project Anicut & Canal
Restoration of Boileruwa Tank
Neelabemma Scheme - Improvement of Sub System (Phase III)
Improvements to Ingnimitiya scheme (LB Chl system)
System H in NCP
Subject work item for rehabilitation
System H in NWP
Con
glom
erat
e, c
ost l
ess t
han
100
mill
ion
Rs.
Augmentation of Kurai tank (Kurai GND)Rehabilitation of Welimaruthamadu Irrigation scheme (PallamaduGND)Reh of Vavunikulam Tank - Right Bank Lift Irrigation SystemRehabilitation of Muthayankaddu Irrigation Scheme (Lift IrrigationScheme)
Construction of Diversion weir across Parangi aru and inlet canal toKurai tank (Kurai GND)
Total
Covering areaType of
RehabilitationSymbol
Tank/Anicut TypeNumber of
scheme
Major A>400 ha
A<80haMinor
Medium 400>A>80ha
Scheme
Table 8 A
nalysis on the Costs proposed by D
S by Tank Rehabilitation Types

C-9
F/C L/C Total(JPY mil.) (Rs. Mil.) (JPY mil.) (Rs. Mil.)
1. Mobilization of PMU and PIUs
Mobilization of PMU and PIUs 176 105 0 105 0
2. Agricultural Crop Promotion Program 9,015 3,335 3,442 5,393 0
2-1 Productivity Improvement Program (Agricultural Crop) 7,574 2,827 2,852 4,533 0
1) Rehabilitation of irrigation facility 3,885 1,512 1,360 2,326 0
i) Individual sub schemes 2,417 940 846 1,447 0 7 schemes
ii) Major tank rehabilitation 137 53 48 82 0 5 schemes
iii) Medium tank rehabilitation 489 190 171 293 0 32 schemes
iv) Minor tank rehabilitation 842 327 295 504 0 71 schemes
2) Agro well provision 2,694 1,061 920 1,612 0 5,671 nos for new & rehab.
3) Micro irrigation system 206 53 118 123 0
4) Enhancement of supply chain of quality seed and planting material 790 201 454 472 0
2-2 Logistic System Improvement and Entrepreneurs Development Program 1,323 461 552 790 0
1) Established of proper interface and incubation 341 107 161 204 0
2) Improvement of farmers' storage facility 231 69 116 138 0
3) Upgrading of DEC and construction of collecting centre 86 26 43 51 0
4) Rural road and farm access road rehabilitation 655 255 229 392 0
5) Study tour 9 4 3 5 0
2-3 Program on Enhancement of Extension Services and Ground Level Research 118 47 38 70 0
1) Training to extension officers 7 0 7 4 0
2) Training facility improvement 81 35 22 48 0
3) Overseas training 30 12 9 18 0
3. Livestock Product Promotion Program 1,042 303 536 627 0
3-1 Productivity Improvement Program of Milk 702 189 386 420 0
1) Milk production improvement program 702 189 386 420 0
3-2 Program on Market Development on Fresh Milk 187 58 91 112 0
1) Milk marketing program 161 58 65 97 0
2) Training of milk production and market network improvement 26 0 26 15 0
3-3 Livestock Service Quality and Accessibility Improvement Program 153 56 59 95 0
1) Improvement of cold chain for semen transport 8 0 8 8 0
2) Livestock Training Program 7 0 7 4 0
3) Livestock services program 138 56 44 83 0
4. Sub-Total of 1 to 3 (Base Cost for Programs and PMU Mobilization) 10,233 3,743 3,978 6,125 0
5. Price Contingency of 4 1,548 402 876 926 0 FC:2.1%, LC:4.0%/year
6. Physical Contingency of 4 589 207 243 352 0 =(4+5) x 5%
Sub-Total 1 to 6 12,370 4,352 5,097 7,403 0
7. Consulting Services
7.1 Base Cost 2,462 392 1,806 1,473 0
7.2 Price Contingency 359 39 376 264 0 FC:2.1%, LC:4.0%/year
7.3 Physical Contingency 141 22 109 87 0 =(4+5) x 5%
Sub-Total 7 2,962 453 2,291 1,824 0
8. 712 426 0 426 0 0.01% for CS, 1.4% for others
9. 15 9 0 9 0 0.1% of Eligible portion
16,059 5,240 7,388 9,662 0
10. Administration and Other Cost 2,502 2,502
1) Administration Cost 582 582
2) Tax & Duty 1,920 1,920
18,561 5,240 7,388 9,662 2,502
Note : US$ 1.0 = JP 79.0 Source : estimated by JICA Study Team 11,108 = Rs 132.0
JPY 1.0 = Rs. 0.598
Commitment Charge
GRAND TOTAL 1 to 10
No.
Total 1 to 9 (Eligible Portion)
TotalInvestmnent
Cost (Rs. mil.)
Eligible Portion Non-eligiblePortion RemarksItem / Program
Interest during Constr
CHAPTER 2 PROJECT COST AND ITS BREAKDOWN
2.1 Total Project Cost

C-10
Non-eligibleportion
F/C L/C Total L/C1. Mobilization of PMU and PIUs 175,571 0 175,571
1) Vehicle and equipment 154,056 0 154,0562) Office equipment 21,515 0 21,515
2. Agricultural Crop Promotion Program 5,573,279 3,442,027 9,015,3062-1 Productivity Improvement Program (Agricultural Crop) 4,723,276 2,851,670 7,574,946
1) Rehabilitation of irrigation facility 2,525,572 1,359,924 3,885,496i) Individual sub schemes 1,571,341 846,107 2,417,448
ii) Major tank rehabilitation 89,333 48,103 137,436
iii) Medium tank rehabilitation 317,710 171,075 488,785
iv) Minor tank rehabilitation 547,188 294,640 841,827
2) Agro well provision 1,773,626 920,131 2,693,757
3) Micro irrigation system 87,994 117,612 205,606
4) Enhancement of supply chain of quality seed and planting material 336,084 454,004 790,088i) Provision of equipment & machinery for seed laboratory 2,505 0 2,505
ii) Provision of seed farms 22,665 27,285 49,950
iii) Farmer traing program on quality self-seed & planting material produ 0 3,703 3,703
iv) Farmer training program on improvement of farm management etc. 0 139,110 139,110
v) Supply of machinery and equipment 310,914 283,906 594,820
2-2 Logistic System Improvement and Entrepreneurs Development Program 770,493 552,217 1,322,7101) Established of proper interface and incubation 179,507 161,471 340,978
i) Establishment of collecting points 179,507 161,471 340,978
2) Improvement of farmers' storage facility 115,650 115,650 231,300
3) Upgrading of DEC and construction of collecting centre 43,000 43,000 86,000i) Upgrading of DEC 43,000 43,000 86,000
- Dambulla at DA Matale 32,000 32,000 64,000
- Thambuttegama at Anuradapura 11,000 11,000 22,000
4) Rural road and farm access road rehabilitation 425,960 229,363 655,324
5) Study tour 6,376 2,732 9,108
2-3 Program on Enhancement of Extension Services and Ground Level Research 79,510 38,140 117,6501) Training to extension officers 0 6,930 6,930
i) Project Awareness 0 1,350 1,350
0 2,520 2,520
ii) Best Practices in OFC Cultivation 0 540 540
iii) Best Practices in Fruit Cultivation 0 540 540
iv) Farm Business Management 0 900 900
v) Exposure visits for experience sharing 0 1,080 1,080
2) Training facility improvement 58,720 22,300 81,020- DATC Bibile at Moneragala 4,000 6,000 10,000
- ISTC Bindunuwewa at Badulla 14,700 16,300 31,000
- Motor cycle 37,620 0 37,620
- Personal computer 2,400 0 2,400
3) Overseas training 20,790 8,910 29,700- Overseas traing for OFCs 13,860 5,940 19,800
- Overseas traing for fruit 6,930 2,970 9,900
Summary of Cost Estimate for Project (1/2)
No. Program Inputs
Total Amount (Rs.1,000)
RemaksEligible Portion
ii) Farm management improvement
2.2 Summary of Cost Estimate for the Project

C-11
Non-eligibleportion
F/C L/C Total L/C
3. Livestock Product Promotion Program 506,310 535,763 1,042,0733-1 Productivity Improvement Program of Semi-intensive and Intensive Farmer 315,839 385,750 701,588
Milk 1) Milk production improvement program 315,839 385,750 701,588i) Feeding improvement program 289,939 145,694 435,632
- Individual Fodder Development(Unit) 5 years 37,510 37,510 75,020
- Straw Bailing Unit 187,139 80,203 267,342
- Bio-mass Pelleting units 37,428 16,041 53,468
- Grass choppers 27,300 11,700 39,000
- Supply of seeds of pasture and legumes 561 241 802
ii) Breeding program 0 196,000 196,000- Estrus Synchronization(head for 5years) 0 96,000 96,000
- Artificial Insemination(times for 5 years) 0 100,000 100,000
iii) Goat breeding program 25,900 42,856 68,756- Goat breeding farm 20,900 20,900 41,800
- Breeding female goat 0 6,600 6,600
- Provision & rehabilitation of facility for Thelahara 5,000 5,000 10,000
- Goat provision 0 10,356 10,356
iv) Training for feeding improvement 0 1,200 1,200- Production planning,financial management etc. 0 300 300
- Awareness and utilization of crop residue 0 300 300
- Technical training on products from crop residue 0 300 300
- Improving nutritive quality of crop rsidue 0 300 300
3-2 Program on Market Development on Fresh Milk 96,171 91,126 187,2971) Milk marketing program 96,171 65,326 161,497
- Issuing Milk Canister 40L 0 3,140 3,140
- Issuing Milk Canister 20L 0 20,970 20,970
- Mobile Milk sale 7,280 3,120 10,400
- UHTmilk Processing 74,856 32,081 106,937
- Chilling Tank 1500 liters 14,035 6,015 20,051
2) Training of milk production and market network improvement 0 25,800 25,800- Clean milk production (1 day training) 0 24,300 24,300
- O&M of UHT processing plant (3 day training) 0 540 540
- Establishment of effective milk collection (3 day training) 0 465 465
- Market planning etc. (3 day training) 0 495 495
3-3 Livestock Service Quality and Accessibility Improvement Program 94,301 58,888 153,1881) Improvement of cold chain for semen transport 0 8,216 8,216
- Liquid Nitrogen Tank 0 1,950 1,950
- Semen canister (Big) 0 3,250 3,250
- Semen canister (Middle) 0 936 936
- AI kits 0 2,080 2,080
2) Livestock Training Program 0 6,915 6,915i) Training of trainers 0 6,165 6,165
ii) Training of input suppliers 0 750 750
3) Livestock services program 94,301 43,757 138,057i) Livestock service center 94,301 43,757 138,057
- Construction of livestock service center 43,757 43,757 87,513
- Pickup track 41,772 0 41,772
- Motor cycle 8,772 0 8,772
6,255,161 3,977,790 10,232,951
4. Consulting Services 655,806 1,805,730 2,461,5361) Remuneration for Pro-A 479,043 479,0432) Remuneration for Pro-B 690,550 690,5503) Sun professional & office supporting staff 747,760 747,7604) Direct cost 176,763 367,420 544,183
5. Administration Cost 582,000
6,910,967 5,783,520 12,694,487 582,000 13,276,487Note : US$ 1.0 = JPY 79.0 = Rs. 132.0 JPY 1.0 = Rs. 0.598
TOTAL OF PROGRAMS COST AND MOBILIZATION COST (1 + 2 + 3)
GRAND TOTAL (1 to 5 )
Summary of Cost Estimate for Project (2/2)
No. Program Inputs
Total Amount (Rs.1,000)
RemaksEligible Portion

C-12
1.0US$ = 79 Yen = 132 Rs.
F/C L/C Total F/C L/C Total F/C L/C Total F/C L/C Total F/C L/C Total1. Mobilization of PMU and PIUs
Incorporated in the Summary
2. Agricultural Crop Promotion Program 2,241,955 1,284,704 3,526,659 1,528,896 991,578 2,520,474 1,189,410 756,880 1,946,291 613,018 408,865 1,021,883 5,573,279 3,442,027 9,015,3062-1 Productivity Improvement Program (Agricultural Crop) 1,970,878 1,111,658 3,082,537 1,174,617 745,258 1,919,876 1,051,102 657,056 1,708,158 526,678 337,698 864,376 4,723,276 2,851,670 7,574,946
1) Rehabilitation of irrigation facility 1,468,401 790,678 2,259,079 511,672 275,516 787,188 498,397 268,368 766,765 47,102 25,363 72,464 2,525,572 1,359,924 3,885,496i) Individual sub schemes 7 scheme 993,887 535,170 1,529,057 244,287 131,539 375,827 333,167 179,397 512,564 1,571,341 846,107 2,417,448 7 schemes
- Kurai Tank augmentation and Parangi aru 1 LS 269,335 145,026 414,361 269,335 145,026 414,361
- Welimaruthamadu Irrigation scheme 1 LS 80,759 43,485 124,244 80,759 43,485 124,244
- Muthayankaddu Tank Lift Irrigation Scheme 1 LS 395,959 213,208 609,167 395,959 213,208 609,167
- Vavunikulam Tank - Right & Left Banks Lift 1 LS 247,835 133,450 381,285 247,835 133,450 381,285
- Mahaweli System H scheme 1 LS 244,287 131,539 375,827 244,287 131,539 375,827
- Ingnimitiya scheme 1 LS 268,032 144,325 412,357 268,032 144,325 412,357
- Neelabemma Scheme (Phase II) 1 LS 65,135 35,072 100,207 65,135 35,072 100,207
ii) Major tank rehabilitation 5 scheme 25,349 13,649 38,998 52,523 28,282 80,805 11,461 6,172 17,633 0 0 0 89,333 48,103 137,436iii) Medium tank rehabilitation 32 scheme 271,901 146,408 418,310 30,057 16,184 46,241 12,882 6,937 19,819 2,870 1,545 4,415 317,710 171,075 488,785iv) Minor tank rehabilitation 71 scheme 177,264 95,450 272,714 184,805 99,510 284,315 140,887 75,862 216,749 44,232 23,817 68,049 547,188 294,640 841,827
2) Agro well provision 437,584 227,044 664,627 522,636 272,072 794,708 383,347 199,390 582,737 430,059 221,625 651,684 1,773,626 920,131 2,693,757- Construction of new agro wells 2,670 nos 230,100 123,900 354,000 280,598 151,091 431,688 204,306 110,011 314,317 217,229 116,969 334,198 932,232 501,971 1,434,204- Rehabilitation of agro wells 3,001 nos 129,420 69,688 199,107 156,975 84,525 241,500 115,089 61,971 177,060 122,334 65,872 188,206 523,817 282,056 805,873- Provision of pumps and accessories 5,671 set 78,064 33,456 111,520 85,064 36,456 121,520 63,952 27,408 91,360 90,496 38,784 129,280 317,576 136,104 453,680
3) Micro irrigation system 14,945 12,945 27,890 23,902 33,844 57,746 27,037 41,159 68,195 22,110 29,664 51,775 87,994 117,612 205,606- Sprinkler irrigation for 500m2 200 set 11,512 4,934 16,445 11,512 4,934 16,445 11,512 4,934 16,445 11,512 4,934 16,445 46,046 19,734 65,780- Drip irrigation system 2,248 ha 3,433 8,011 11,445 12,390 28,911 41,301 15,525 36,225 51,750 10,599 24,731 35,330 41,948 97,878 139,826
4) Enhancement of supply chain of quality seed and planting material 49,949 80,992 130,941 116,407 163,826 280,233 142,321 148,140 290,461 27,408 61,046 88,453 336,084 454,004 790,088i) Provision of equipment & machinery for seed laboratory 1,002 0 1,002 0 0 0 1,002 0 1,002 501 0 501 2,505 0 2,505
- Tool equipment & machinery 5 set 1,002 0 1,002 0 0 0 1,002 0 1,002 501 0 501 2,505 0 2,505
ii) Provision of seed farms 9,065 8,885 17,950 0 0 0 8,325 12,425 20,750 5,275 5,975 11,250 22,665 27,285 49,950- Vaunia farm 1 LS 6,875 7,375 14,250 6,875 7,375 14,250- Kantale farm 1 LS 2,190 1,510 3,700 2,190 1,510 3,700- Wariyapola seed farm 1 LS 4,000 6,000 10,000 4,000 6,000 10,000- Galgamuwa seed farm 1 LS 4,325 6,425 10,750 4,325 6,425 10,750- Okkampitiya farm 1 LS 5,275 5,975 11,250 5,275 5,975 11,250
iii) Farmer traing program on quality self-seed & planting material produsction 0 840 840 0 2,191 2,191 0 375 375 0 297 297 0 3,703 3,703- Quality self-seed production for OFCs 0 615 615 0 1,592 1,592 0 200 200 0 179 179 0 2,586 2,586- Certified seed production for OFCs 0 205 205 0 531 531 0 67 67 0 60 60 0 863 863- Quality planting material production for fruits 0 20 20 0 68 68 0 108 108 0 58 58 0 254 254
iv) Farmer training program on improvement of farm management etc. 0 24,690 24,690 0 29,460 29,460 0 57,420 57,420 0 27,540 27,540 0 139,110 139,110- Farm management improvement 43,200 day 0 7,200 7,200 0 8,640 8,640 0 18,000 18,000 0 9,360 9,360 0 43,200 43,200- OFCs production improvement 22,890 day 0 2,310 2,310 0 2,940 2,940 0 10,080 10,080 0 7,560 7,560 0 22,890 22,890- Fruits production improvement 29,820 day 0 7,980 7,980 0 9,240 9,240 0 11,340 11,340 0 1,260 1,260 0 29,820 29,820- Study tour 180 time 0 7,200 7,200 0 8,640 8,640 0 18,000 18,000 0 9,360 9,360 0 43,200 43,200
v) Supply of machinery and equipment 39,882 46,577 86,459 116,407 132,175 248,582 132,994 77,920 210,914 21,632 27,234 48,865 310,914 283,906 594,820- Manual highland seeder for pulses 368 no. 635 1,481 2,115 3,888 9,072 12,960 378 882 1,260 68 158 225 4,968 11,592 16,560 5 Ac/day- Highland weeder 368 no. 705 1,645 2,350 4,320 10,080 14,400 420 980 1,400 75 175 250 5,520 12,880 18,400- Ridger 184 no. 72 168 240 432 1,008 1,440 42 98 140 6 14 20 552 1,288 1,840- Ground nut decorticating machine 52 no. 21 49 70 120 280 400 12 28 40 3 7 10 156 364 520 15 kg/hr- Pulse splitting machine 134 no. 972 2,268 3,240 5,616 13,104 18,720 540 1,260 1,800 108 252 360 7,236 16,884 24,120 30-40 kg/hr- Pulse cleaning machine 134 no. 270 630 900 1,560 3,640 5,200 150 350 500 30 70 100 2,010 4,690 6,700- Grinding machine for flour making 397 no. 1,823 4,253 6,076 4,297 10,025 14,322 651 1,519 2,170 614 1,432 2,046 7,384 17,230 24,614- Barbed wire fence 1,942 km 10,982 25,626 36,608 22,968 53,592 76,560 8,791 20,513 29,304 8,527 19,897 28,424 51,269 119,627 170,896
COST BREAKDOWN for PROGRAM COST by ZONE (1/3)
No. Program Inputs Q'ty Unit
Amount (Rs.1,000)
RemarksZone-01 Zone-02 Zone-03 Zone-04 Total
Eligible Eligible Eligible Eligible Eligible
2.2.1 C
ost Estim
ate by Zones

C-13
1.0US$ = 79 Yen = 132 Rs.
F/C L/C Total F/C L/C Total F/C L/C Total F/C L/C Total F/C L/C Total- Electric fence (protect from elephants) 570 km 24,402 10,458 34,860 73,206 31,374 104,580 122,010 52,290 174,300 12,201 5,229 17,430 231,819 99,351 331,170 with solar system
2-2 Logistic System Improvement and Entrepreneurs Development Program 258,288 169,762 428,050 329,328 239,868 569,196 126,146 96,656 222,803 56,731 45,930 102,662 770,493 552,217 1,322,7101) Established of proper interface and incubation 45,219 40,877 86,097 36,815 33,475 70,289 65,430 59,084 124,515 32,043 28,035 60,077 179,507 161,471 340,978
i) Establishment of collecting points 45,219 40,877 86,097 36,815 33,475 70,289 65,430 59,084 124,515 32,043 28,035 60,077 179,507 161,471 340,978- Facilities for collecting point 108 place 40,877 40,877 81,755 33,475 33,475 66,949 59,084 59,084 118,169 28,035 28,035 56,069 161,471 161,471 322,942- Equipment for collecting points 108 set 4,342 0 4,342 3,340 0 3,340 6,346 0 6,346 4,008 0 4,008 18,036 0 18,036
2) Improvement of farmers' storage facility 31,050 31,050 62,100 63,300 63,300 126,600 10,950 10,950 21,900 10,350 10,350 20,700 115,650 115,650 231,300- Renovation of farmers' storage, onion 2,590 no 14,700 14,700 29,400 16,050 16,050 32,100 3,600 3,600 7,200 4,500 4,500 9,000 38,850 38,850 77,700- Renovation of farmers' storage, chili 5,120 no 16,350 16,350 32,700 47,250 47,250 94,500 7,350 7,350 14,700 5,850 5,850 11,700 76,800 76,800 153,600
3) Upgrading of DEC and construction of collecting centrei) Upgrading of DEC 0 0 0 43,000 43,000 86,000 0 0 0 0 0 0 43,000 43,000 86,000
- Dambulla at DA Matale 1 LS 32,000 32,000 64,000 32,000 32,000 64,000- Thambuttegama at Anuradapura 1 LS 11,000 11,000 22,000 11,000 11,000 22,000
4) Rural road and farm access road rehabilitation 180,424 97,152 277,576 184,619 99,410 284,030 48,172 25,939 74,111 12,745 6,862 19,607 425,960 229,363 655,324- Improvement of access roads to market 86.0 km 84,411 45,452 129,862 120,867 65,082 185,949 19,332 10,409 29,741 5,281 2,844 8,125 229,891 123,787 353,678- Improvement of farm roads 541.9 km 96,014 51,700 147,713 63,752 34,328 98,081 28,840 15,529 44,370 7,463 4,019 11,482 196,070 105,576 301,646
5) Study tour 1,594 683 2,277 1,594 683 2,277 1,594 683 2,277 1,594 683 2,277 6,376 2,732 9,108- To potential impact countries 1 LS 901 386 1,287 901 386 1,287 901 386 1,287 901 386 1,287 3,604 1,544 5,148- To active export countries 1 LS 693 297 990 693 297 990 693 297 990 693 297 990 2,772 1,188 3,960
2-3 Program on Enhancement of Extension Services and Ground Level Research 12,789 3,284 16,073 24,951 6,452 31,403 12,162 3,168 15,330 29,608 25,237 54,845 79,510 38,140 117,6501) Training to extension officers 0 1,502 1,502 0 2,888 2,888 0 1,386 1,386 0 1,155 1,155 0 6,930 6,930
i) Project Awareness 1,800 day 0 293 293 0 563 563 0 270 270 0 225 225 0 1,350 1,3502,520 day 0 546 546 0 1,050 1,050 0 504 504 0 420 420 0 2,520 2,520
ii) Best Practices in OFC Cultivation 540 day 0 117 117 0 225 225 0 108 108 0 90 90 0 540 540iii) Best Practices in Fruit Cultivation 540 day 0 117 117 0 225 225 0 108 108 0 90 90 0 540 540iv) Farm Business Management 900 day 0 195 195 0 375 375 0 180 180 0 150 150 0 900 900v) Exposure visits for experience sharing 540 day 0 234 234 0 450 450 0 216 216 0 180 180 0 1,080 1,080
2) Training facility improvement 8,631 0 8,631 16,635 0 16,635 8,004 0 8,004 25,450 22,300 47,750 58,720 22,300 81,020- DATC Bibile at Moneragala 4,000 6,000 10,000 4,000 6,000 10,000- ISTC Bindunuwewa at Badulla 14,700 16,300 31,000 14,700 16,300 31,000- Motor cycle 180 no 8,151 0 8,151 15,675 0 15,675 7,524 0 7,524 6,270 0 6,270 37,620 0 37,620- Personal computer 20 no 480 0 480 960 0 960 480 0 480 480 0 480 2,400 0 2,400
3) Overseas training 4,158 1,782 5,940 8,316 3,564 11,880 4,158 1,782 5,940 4,158 1,782 5,940 20,790 8,910 29,700- Overseas traing for OFCs 5 person 2,772 1,188 3,960 5,544 2,376 7,920 2,772 1,188 3,960 2,772 1,188 3,960 13,860 5,940 19,800- Overseas traing for fruit 5 person 1,386 594 1,980 2,772 1,188 3,960 1,386 594 1,980 1,386 594 1,980 6,930 2,970 9,900
3. Livestock Product Promotion Program 140,064 108,088 248,153 157,375 167,237 324,612 129,946 167,544 297,490 78,925 92,894 171,818 506,310 535,763 1,042,0733-1 Productivity Improvement Program of Semi-intensive and Intensive Farmer 69,777 60,379 130,156 89,258 113,899 203,157 97,799 138,487 236,286 59,004 72,985 131,989 315,839 385,750 701,588
1) Milk production improvement program 69,777 60,379 130,156 89,258 113,899 203,157 97,799 138,487 236,286 59,004 72,985 131,989 315,839 385,750 701,588i) Feeding Project
- Individual Fodder Development(Unit) 5 years 3,751 plot 5,310 5,310 10,620 11,700 11,700 23,400 12,000 12,000 24,000 8,500 8,500 17,000 37,510 37,510 75,020- Straw Bailing Unit 100 unit 50,528 21,655 72,182 52,399 22,457 74,856 46,785 20,051 66,835 37,428 16,041 53,468 187,139 80,203 267,342- Bio-mass Pelleting units 10 unit 7,486 3,208 10,694 14,971 6,416 21,387 7,486 3,208 10,694 7,486 3,208 10,694 37,428 16,041 53,468- Grass choppers 60 unit 6,370 2,730 9,100 10,010 4,290 14,300 5,460 2,340 7,800 5,460 2,340 7,800 27,300 11,700 39,000- Supply of seeds of pasture and legumes 60 pack 84 36 120 178 76 254 168 72 241 131 56 187 561 241 802 20 kg/pack
69,777 32,939 102,716 89,258 44,939 134,197 71,899 37,671 109,570 59,004 30,145 89,149 289,939 145,694 435,632ii) Breeding program
- Estrus Synchronization(head for 5years) 48,000 time 0 12,000 12,000 0 32,000 32,000 0 32,000 32,000 0 20,000 20,000 0 96,000 96,000- Artificial Insemination(times for 5 years) 200,000 time 0 12,800 12,800 0 33,000 33,000 0 33,400 33,400 0 20,800 20,800 0 100,000 100,000
ii) Farm management improvement
Sub-Total
COST BREAKDOWN for PROGRAM COST by ZONE (2/3)
No. Program InputsQ'ty Unit
Amount (Rs.1,000)
RemarksZone-01 Zone-02 Zone-03 Zone-04 Total
Eligible Eligible Eligible Eligible Eligible
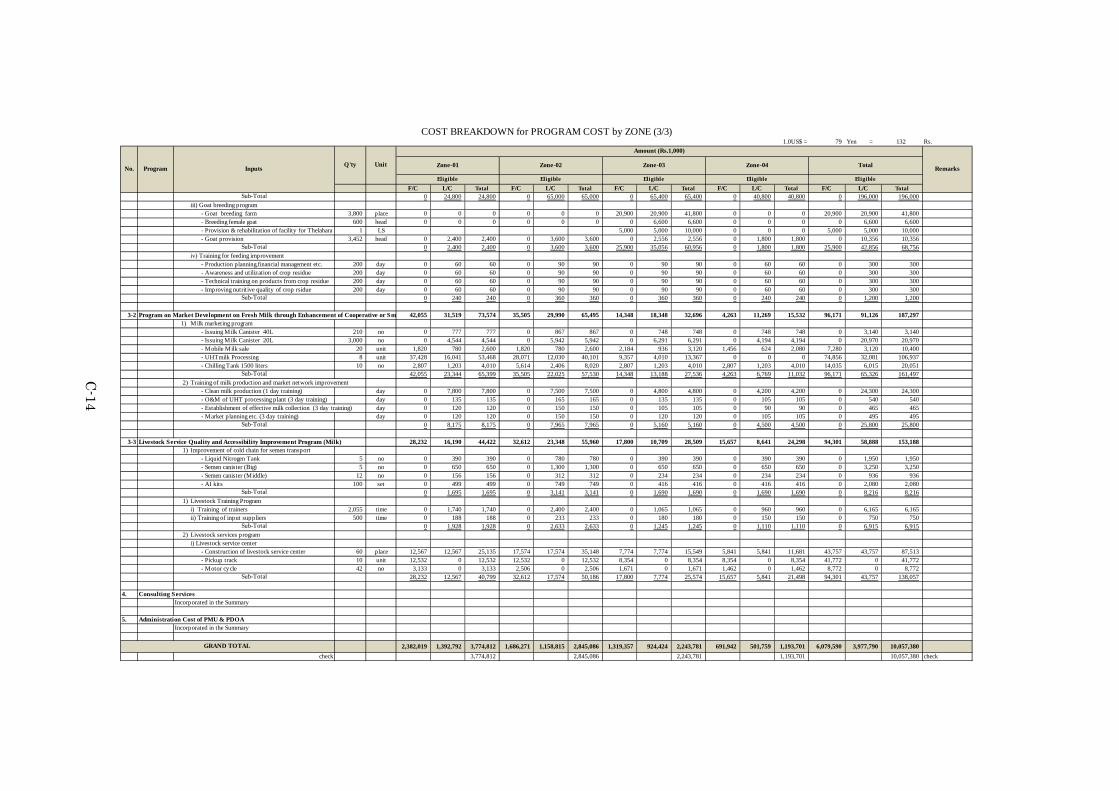
C-14
1.0US$ = 79 Yen = 132 Rs.
F/C L/C Total F/C L/C Total F/C L/C Total F/C L/C Total F/C L/C Total0 24,800 24,800 0 65,000 65,000 0 65,400 65,400 0 40,800 40,800 0 196,000 196,000
iii) Goat breeding program- Goat breeding farm 3,800 place 0 0 0 0 0 0 20,900 20,900 41,800 0 0 0 20,900 20,900 41,800- Breeding female goat 600 head 0 0 0 0 0 0 0 6,600 6,600 0 0 0 0 6,600 6,600- Provision & rehabilitation of facility for Thelahara 1 LS 5,000 5,000 10,000 0 0 0 5,000 5,000 10,000- Goat provision 3,452 head 0 2,400 2,400 0 3,600 3,600 0 2,556 2,556 0 1,800 1,800 0 10,356 10,356
0 2,400 2,400 0 3,600 3,600 25,900 35,056 60,956 0 1,800 1,800 25,900 42,856 68,756iv) Training for feeding improvement
- Production planning,financial management etc. 200 day 0 60 60 0 90 90 0 90 90 0 60 60 0 300 300- Awareness and utilization of crop residue 200 day 0 60 60 0 90 90 0 90 90 0 60 60 0 300 300- Technical training on products from crop residue 200 day 0 60 60 0 90 90 0 90 90 0 60 60 0 300 300- Improving nutritive quality of crop rsidue 200 day 0 60 60 0 90 90 0 90 90 0 60 60 0 300 300
0 240 240 0 360 360 0 360 360 0 240 240 0 1,200 1,200
3-2 Program on Market Development on Fresh Milk through Enhancement of Cooperative or Sm 42,055 31,519 73,574 35,505 29,990 65,495 14,348 18,348 32,696 4,263 11,269 15,532 96,171 91,126 187,2971) Milk marketing program
- Issuing Milk Canister 40L 210 no 0 777 777 0 867 867 0 748 748 0 748 748 0 3,140 3,140- Issuing Milk Canister 20L 3,000 no 0 4,544 4,544 0 5,942 5,942 0 6,291 6,291 0 4,194 4,194 0 20,970 20,970- Mobile Milk sale 20 unit 1,820 780 2,600 1,820 780 2,600 2,184 936 3,120 1,456 624 2,080 7,280 3,120 10,400- UHTmilk Processing 8 unit 37,428 16,041 53,468 28,071 12,030 40,101 9,357 4,010 13,367 0 0 0 74,856 32,081 106,937- Chilling Tank 1500 liters 10 no 2,807 1,203 4,010 5,614 2,406 8,020 2,807 1,203 4,010 2,807 1,203 4,010 14,035 6,015 20,051
42,055 23,344 65,399 35,505 22,025 57,530 14,348 13,188 27,536 4,263 6,769 11,032 96,171 65,326 161,4972) Training of milk production and market network improvement
- Clean milk production (1 day training) day 0 7,800 7,800 0 7,500 7,500 0 4,800 4,800 0 4,200 4,200 0 24,300 24,300- O&M of UHT processing plant (3 day training) day 0 135 135 0 165 165 0 135 135 0 105 105 0 540 540- Establishment of effective milk collection (3 day training) day 0 120 120 0 150 150 0 105 105 0 90 90 0 465 465- Market planning etc. (3 day training) day 0 120 120 0 150 150 0 120 120 0 105 105 0 495 495
0 8,175 8,175 0 7,965 7,965 0 5,160 5,160 0 4,500 4,500 0 25,800 25,800
3-3 Livestock Service Quality and Accessibility Improvement Program (Milk) 28,232 16,190 44,422 32,612 23,348 55,960 17,800 10,709 28,509 15,657 8,641 24,298 94,301 58,888 153,1881) Improvement of cold chain for semen transport
- Liquid Nitrogen Tank 5 no 0 390 390 0 780 780 0 390 390 0 390 390 0 1,950 1,950- Semen canister (Big) 5 no 0 650 650 0 1,300 1,300 0 650 650 0 650 650 0 3,250 3,250- Semen canister (Middle) 12 no 0 156 156 0 312 312 0 234 234 0 234 234 0 936 936- AI kits 100 set 0 499 499 0 749 749 0 416 416 0 416 416 0 2,080 2,080
0 1,695 1,695 0 3,141 3,141 0 1,690 1,690 0 1,690 1,690 0 8,216 8,2161) Livestock Training Program
i) Training of trainers 2,055 time 0 1,740 1,740 0 2,400 2,400 0 1,065 1,065 0 960 960 0 6,165 6,165ii) Training of input suppliers 500 time 0 188 188 0 233 233 0 180 180 0 150 150 0 750 750
0 1,928 1,928 0 2,633 2,633 0 1,245 1,245 0 1,110 1,110 0 6,915 6,9152) Livestock services program
i) Livestock service center- Construction of livestock service center 60 place 12,567 12,567 25,135 17,574 17,574 35,148 7,774 7,774 15,549 5,841 5,841 11,681 43,757 43,757 87,513- Pickup track 10 unit 12,532 0 12,532 12,532 0 12,532 8,354 0 8,354 8,354 0 8,354 41,772 0 41,772- Motor cycle 42 no 3,133 0 3,133 2,506 0 2,506 1,671 0 1,671 1,462 0 1,462 8,772 0 8,772
28,232 12,567 40,799 32,612 17,574 50,186 17,800 7,774 25,574 15,657 5,841 21,498 94,301 43,757 138,057
4. Consulting Services Incorporated in the Summary
5. Administration Cost of PMU & PDOA Incorporated in the Summary
2,382,019 1,392,792 3,774,812 1,686,271 1,158,815 2,845,086 1,319,357 924,424 2,243,781 691,942 501,759 1,193,701 6,079,590 3,977,790 10,057,380check 3,774,812 2,845,086 2,243,781 1,193,701 10,057,380 check
Sub-Total
Sub-Total
Sub-Total
Sub-Total
Sub-Total
Sub-Total
Sub-Total
Sub-Total
GRAND TOTAL
COST BREAKDOWN for PROGRAM COST by ZONE (3/3)
No. Program Inputs Q'ty Unit
Amount (Rs.1,000)
RemarksZone-01 Zone-02 Zone-03 Zone-04 Total
Eligible Eligible Eligible Eligible Eligible

C-15
1.0US$ = 79 Yen = 132 Rs.
Eligible Non-eligible Eligible Non-
eligible Eligible Non-eligible Eligible Non-
eligible1. Mobilization of PMU and PDOA
Incorporated in the Summary
2. Agricultural Crop Promotion Program 3,180,266 311,144 35,249 3,526,6592-1 Productivity Improvement Program (Agricultural Crop) 2,820,936 236,071 25,530 3,082,537
1) Rehabilitation of irrigation facility 2,259,079 0 0 2,259,079i) Individual sub schemes 4 scheme 1,529,057 1,529,057
- Kurai Tank augmentation and Parangi aru development LS 414,361 414,361
- Welimaruthamadu Irrigation scheme LS 124,244 124,244
- Muthayankaddu Tank Lift Irrigation Scheme LS 609,167 609,167
- Vavunikulam Tank - Right & Left Banks Lift Irrigation LS 381,285 381,285
ii) Major tank rehabilitation 2 scheme 38,998 38,998iii) Medium tank rehabilitation 26 scheme 418,310 418,310iv) Minor tank rehabilitation 25 scheme 272,714 272,714
2) Agro well provision 553,107 111,520 664,627- Construction of new agro wells 656 no 354,000 354,000- Rehabilitation of agro wells 738 no 199,107 199,107- Provision of pumps and accessories 1,394 set 80 111,520 111,520
3) Micro irrigation system 27,890 27,890- Sprinkler irrigation for 500m2 50 set 329 16,445 16,445- Drip irrigation system 184 ha 62 11,445 11,445
4) Enhancement of supply chain of quality seed and planting material 8,750 96,661 25,530 130,941i) Provision of equipment & machinery for seed laboratory 1,002 1,002
- Tool equipment & machinery 2 set 501 1,002 1,002
ii) Provision of seed farms 8,750 9,200 17,950- Vaunia farm 1 LS 7,750 6,500 14,250- Kantale farm 1 LS 1,000 2,700 3,700
iii) Farmer traing program on quality self-seed & planting material produsction 840 840- Quality self-seed production for OFCs 615 day 1.0 615 615- Certified seed production for OFCs 205 day 1.0 205 205- Quality planting material production for fruits 20 day 1.0 20 20
iv) Farmer training program on improvement of farm management etc. 24,690 24,690- Farm management improvement 7,200 day 1.0 7,200 7,200- OFCs production improvement 2,310 day 1.0 2,310 2,310- Fruits production improvement 7,980 day 1.0 7,980 7,980- Study tour 30 time 240 7,200 7,200
RemarksCivil works Equipment/ materialsAwareness/
Consulting/ Training Total
COST BREAKDOWN for ZONE-01 (1/4)
No. Program Inputs Q'ty Unit Unit Price(Rs.1,000)
Amount (Rs.1,000)
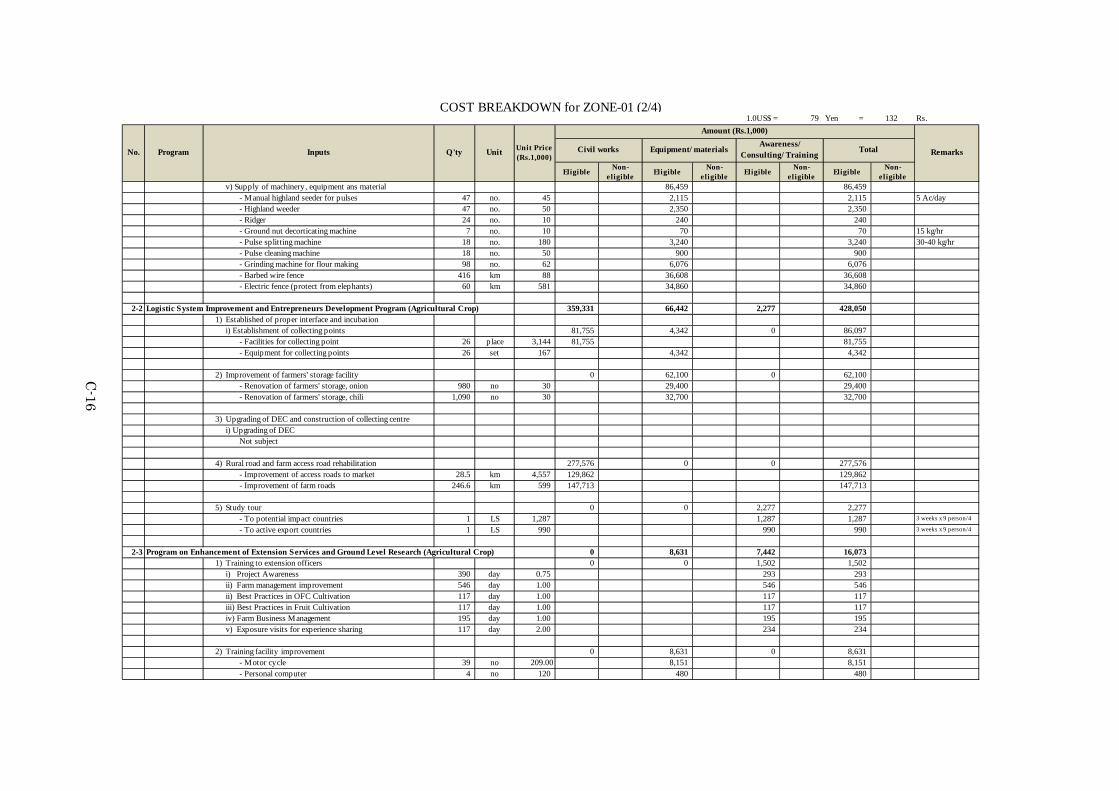
C-16
1.0US$ = 79 Yen = 132 Rs.
Eligible Non-eligible Eligible Non-
eligible Eligible Non-eligible Eligible Non-
eligiblev) Supply of machinery, equipment ans material 86,459 86,459
- Manual highland seeder for pulses 47 no. 45 2,115 2,115 5 Ac/day- Highland weeder 47 no. 50 2,350 2,350- Ridger 24 no. 10 240 240- Ground nut decorticating machine 7 no. 10 70 70 15 kg/hr- Pulse splitting machine 18 no. 180 3,240 3,240 30-40 kg/hr- Pulse cleaning machine 18 no. 50 900 900- Grinding machine for flour making 98 no. 62 6,076 6,076- Barbed wire fence 416 km 88 36,608 36,608- Electric fence (protect from elephants) 60 km 581 34,860 34,860
2-2 Logistic System Improvement and Entrepreneurs Development Program (Agricultural Crop) 359,331 66,442 2,277 428,0501) Established of proper interface and incubation
i) Establishment of collecting points 81,755 4,342 0 86,097- Facilities for collecting point 26 place 3,144 81,755 81,755- Equipment for collecting points 26 set 167 4,342 4,342
2) Improvement of farmers' storage facility 0 62,100 0 62,100- Renovation of farmers' storage, onion 980 no 30 29,400 29,400- Renovation of farmers' storage, chili 1,090 no 30 32,700 32,700
3) Upgrading of DEC and construction of collecting centrei) Upgrading of DEC
Not subject
4) Rural road and farm access road rehabilitation 277,576 0 0 277,576- Improvement of access roads to market 28.5 km 4,557 129,862 129,862- Improvement of farm roads 246.6 km 599 147,713 147,713
5) Study tour 0 0 2,277 2,277- To potential impact countries 1 LS 1,287 1,287 1,287 3 weeks x 9 person/4
- To active export countries 1 LS 990 990 990 3 weeks x 9 person/4
2-3 Program on Enhancement of Extension Services and Ground Level Research (Agricultural Crop) 0 8,631 7,442 16,0731) Training to extension officers 0 0 1,502 1,502
i) Project Awareness 390 day 0.75 293 293546 day 1.00 546 546
ii) Best Practices in OFC Cultivation 117 day 1.00 117 117iii) Best Practices in Fruit Cultivation 117 day 1.00 117 117iv) Farm Business Management 195 day 1.00 195 195v) Exposure visits for experience sharing 117 day 2.00 234 234
2) Training facility improvement 0 8,631 0 8,631- Motor cycle 39 no 209.00 8,151 8,151- Personal computer 4 no 120 480 480
Amount (Rs.1,000)
RemarksCivil works Equipment/ materialsAwareness/
Consulting/ Training Total
COST BREAKDOWN for ZONE-01 (2/4)
No. Program Inputs Q'ty Unit Unit Price(Rs.1,000)
ii) Farm management improvement

C-17
1.0US$ = 79 Yen = 132 Rs.
Eligible Non-eligible Eligible Non-
eligible Eligible Non-eligible Eligible Non-
eligible
3) Overseas training 5,940 5,940- Overseas traing for OFCs 1 person 3,960 3,960 3,960 12 month- Overseas traing for fruit 1 person 1,980 1,980 1,980 6 month
3. Livestock Product Promotion Program 35,755 177,255 35,143 248,1533-1 Productivity Improvement Program of Semi-intensive and Intensive Farmer (Milk) 10,620 94,496 25,040 130,156
1) Milk production improvement programi) Feeding Project
- Individual Fodder Development(Unit) 5 years 531 plot 20 10,620 10,620- Straw Bailing Unit 27 unit 2,673 72,182 72,182- Bio-mass Pelleting units 2 unit 5,347 10,694 10,694- Grass choppers 14 unit 650 9,100 9,100- Supply of seeds of pasture and legumes 9 pack 13 120 120 20 kg/pack
10,620 92,096 102,716ii) Breeding program
- Estrus Synchronization(head for 5years) 6,000 time 2 12,000 12,000- Artificial Insemination(times for 5 years) 25,600 time 1 12,800 12,800
0 24,800 24,800iii) Goat breeding program
- Goat breeding farm place 11 0 0- Breeding female goat head 11 0 0- Goat provision 800 head 3 2,400 2,400
2,400 2,400iv) Training for feeding improvement
- Production planning,financial management etc. 40 day 1.50 60 60- Awareness and utilization of crop residue 40 day 1.50 60 60- Technical training on products from crop residue 40 day 1.50 60 60- Improving nutritive quality of crop rsidue 40 day 1.50 60 60
240 240
3-2 Program on Market Development on Fresh Milk through Enhancement of Cooperative or Small and Medium Sca 0 65,399 8,175 73,5741) Milk marketing program
- Issuing Milk Canister 40L 52 no 15 777 777- Issuing Milk Canister 20L 650 no 7 4,544 4,544- Mobile Milk sale 5 unit 520 2,600 2,600- UHTmilk Processing 4 unit 13,367 53,468 53,468- Chilling Tank 1500 liters 2 no 2,005 4,010 4,010
0 65,399 65,3992) Training of milk production and market network improvement
- Clean milk production (1 day training) 6,500 time 1.2 7,800 7,800- O&M of UHT processing plant (3 day training) 45 time 3.0 135 135- Establishment of effective milk collection (3 day training 40 time 3.0 120 120- Market planning etc. (3 day training) 40 time 3.0 120 120
Amount (Rs.1,000)
RemarksCivil works Equipment/ materialsAwareness/
Consulting/ TrainingTotal
Sub-Total
Sub-Total
Sub-Total
Sub-Total
COST BREAKDOWN for ZONE-01 (3/4)
No. Program Inputs Q'ty Unit Unit Price(Rs.1,000)

C-18
1.0US$ = 79 Yen = 132 Rs.
Eligible Non-eligible Eligible Non-
eligible Eligible Non-eligible Eligible Non-
eligible8,175 8,175
3-3 Livestock Service Quality and Accessibility Improvement Program (Milk) 25,135 17,360 1,928 44,4221) Improvement of cold chain for semen transport
- Liquid Nitrogen Tank 1 no 390 390 390- Semen canister (Big) 1 no 650 650 650- Semen canister (Middle) 2 no 78 156 156- AI kits 24 set 20.8 499 499
1,695 1,6951) Livestock Training Program
i) Training of trainers 580 time 3.0 1,740 1,740 See detailii) Training of input suppliers 125 time 1.5 188 188 See detail
1,928 1,9282) Livestock services program
i) Livestock service center- Construction of livestock service center (100m2) 19 place 1,323 25,135 25,135 See detail- Pickup track 3 unit 4,177 12,532 12,532 See detail- Motor cycle 15 no 209 3,133 3,133 See detail
25,135 15,665 40,799
4. Consulting Services (Tentative estimate)Incorporated in the Summary
5. Administration Cost of PMU & PDOA (Tentative estimate)Incorporated in the Summary
3,216,021 488,399 70,391 3,774,812
RemarksCivil works Equipment/ materialsAwareness/
Consulting/ TrainingTotalQ'ty Unit Unit Price
(Rs.1,000)
Amount (Rs.1,000)
GRAND TOTAL
Sub-Total
Sub-Total
Sub-Total
Sub-Total
COST BREAKDOWN for ZONE-01 (4/4)
No. Program Inputs

C-19
1.0US$ = 79 Yen 132 Rs.
Eligible Non-eligible Eligible Non-
eligible Eligible Non-eligible Eligible Non-
eligible1. Mobilization of PMU and PIU
Incorporated in the Summary
2. Agricultural Crop Promotion Program 1,897,356 574,924 48,696 2,520,9752-1 Productivity Improvement Program (Agricultural Crop) 1,460,377 428,349 31,651 1,920,377
1) Rehabilitation of irrigation facility 787,188 0 0 787,188i) Individual sub schemes 1 scheme
- Mahaweli System H scheme LS 375,827 375,827ii) Major tank rehabilitation 2 scheme 80,805 80,805iii) Medium tank rehabilitation 3 scheme 46,241 46,241iv) Minor tank rehabilitation 22 scheme 284,315 284,315
2) Agro well provision 673,188 121,520 794,708- Construction of new agro wells 717 no 431,688 431,688- Rehabilitation of agro wells 802 no 241,500 241,500- Provision of pumps and accessories 1,519 set 80 121,520 121,520
3) Micro irrigation system 57,746 57,746- Sprinkler irrigation for 500m2 50 set 329 16,445 16,445- Drip irrigation system 664 ha 62 41,301 41,301
4) Enhancement of supply chain of quality seed and planting material 249,083 31,651 280,734i) Provision of equipment & machinery for seed laboratory 501 501
- Tool equipment & machinery 1 set 501 501 501
ii) Provision of seed farmsNot subject
iii) Farmer traing program on quality self-seed & planting material produsction 2,191 2,191- Quality self-seed production for OFCs 1,592 day 1.0 1,592 1,592- Certified seed production for OFCs 531 day 1.0 531 531- Quality planting material production for fruits 68 day 1.0 68 68
iv) Farmer training program on improvement of farm management etc. 29,460 29,460- Farm management improvement 8,640 day 1.0 8,640 8,640- OFCs production improvement 2,940 day 1.0 2,940 2,940- Fruits production improvement 9,240 day 1.0 9,240 9,240- Study tour 36 time 240 8,640 8,640
v) Supply of machinery, equipment ans material 248,582 248,582- Manual highland seeder for pulses 288 no. 45 12,960 12,960 5 Ac/day- Highland weeder 288 no. 50 14,400 14,400- Ridger 144 no. 10 1,440 1,440
COST BREAKDOWN for ZONE-02 (1/4)
No. ProjectComponents
Inputs Q'ty Unit Unit Price(Rs.1,000)
Amount (Rs.1,000)
RemarksCivil works Equipment/ materialsAwareness/
Consulting/ TrainingTotal

C-20
1.0US$ = 79 Yen 132 Rs.
Eligible Non-eligible Eligible Non-
eligible Eligible Non-eligible Eligible Non-
eligible- Ground nut decorticating machine 40 no. 10 400 400 15 kg/hr- Pulse splitting machine 104 no. 180 18,720 18,720 30-40 kg/hr- Pulse cleaning machine 104 no. 50 5,200 5,200- Grinding machine for flour making 231 no. 62 14,322 14,322- Barbed wire fence 870 km 88 76,560 76,560- Electric fence (protect from elephants) 180 km 581 104,580 104,580
2-2 Logistic System Improvement and Entrepreneurs Development Program (Agricultural Crop) 436,979 129,940 2,277 569,1961) Established of proper interface and incubation
i) Establishment of collecting points 66,949 3,340 0 70,289- Facilities for collecting point 20 place 3,347 66,949 66,949- Equipment for collecting points 20 set 167 3,340 3,340
2) Improvement of farmers' storage facility 0 126,600 0 126,600- Renovation of farmers' storage, onion 1,070 no 30 32,100 32,100- Renovation of farmers' storage, chili 3,150 no 30 94,500 94,500
3) Upgrading of DEC and construction of collecting centre 86,000 0 0 86,000i) Upgrading of DEC 86,000 0 0 86,000
- Dambulla at DA Matale 1 LS 64,000 64,000 Cold storage etc.
- Thambuttegama at Anuradapura 1 LS 22,000 22,000 Canopy, road etc
4) Rural road and farm access road rehabilitation 284,030 0 0 284,030- Improvement of access roads to market 48.5 km 3,834 185,949 185,949- Improvement of farm roads 194.6 km 504 98,081 98,081
5) Study tour 0 0 2,277 2,277- To potential impact countries 1 LS 1,287 1,287 1,287 3 weeks x 9 person/4
- To active export countries 1 LS 990 990 990 3 weeks x 9 person/4
2-3 Program on Enhancement of Extension Services and Ground Level Research (Agricultural Crop) 0 16,635 14,768 31,4031) Training to extension officers 0 2,888 2,888
i) Project Awareness 750 day 0.75 563 5631,050 day 1.00 1,050 1,050
ii) Best Practices in OFC Cultivation 225 day 1.00 225 225iii) Best Practices in Fruit Cultivation 225 day 1.00 225 225iv) Farm Business Management 375 day 1.00 375 375v) Exposure visits for experience sharing 225 day 2.00 450 450
2) Training facility improvement 0 16,635 0 16,635- Motor cycle 75 no 209.00 15,675 15,675- Personal computer 8 no 120 960 960
3) Overseas training 11,880 11,880- Overseas traing for OFCs 2 person 3,960 7,920 7,920 12 month- Overseas traing for fruit 2 person 1,980 3,960 3,960 6 month
ii) Farm management improvement
COST BREAKDOWN for ZONE-02 (2/4)
No. ProjectComponents
Inputs Unit Unit Price(Rs.1,000)
Amount (Rs.1,000)
RemarksCivil works Equipment/ materialsAwareness/
Consulting/ Training TotalQ'ty

C-21
1.0US$ = 79 Yen 132 Rs.
Eligible Non-eligible Eligible Non-
eligible Eligible Non-eligible Eligible Non-
eligible3. Livestock Product Promotion Program 58,548 190,106 75,958 324,612
3-1 Productivity Improvement Program of Semi-intensive and Intensive Farmer (Milk) 23,400 114,397 65,360 203,1571) Milk production improvement program
i) Feeding Project- Individual Fodder Development(Unit) 5 years 1,170 plot 20 23,400 23,400- Straw Bailing Unit 28 unit 2,673 74,856 74,856- Bio-mass Pelleting units 4 unit 5,347 21,387 21,387- Grass choppers 22 unit 650 14,300 14,300- Supply of seeds of pasture and legumes 19 pack 13 254 254 20 kg/pack
23,400 110,797 134,197ii) Breeding program
- Estrus Synchronization(head for 5years) 16,000 time 2 32,000 32,000- Artificial Insemination(times for 5 years) 66,000 time 1 33,000 33,000
0 65,000 65,000iii) Goad breeding program
- Goat breeding farm place 11 0 0- Breeding female goat head 11 0 0- Goat provision 1,200 head 3 3,600 3,600
3,600 3,600iv) Training for feeding improvement
- Production planning,financial management etc. 60 day 1.50 90 90- Awareness and utilization of crop residue 60 day 1.50 90 90- Technical training on products from crop residue 60 day 1.50 90 90- Improving nutritive quality of crop rsidue 60 day 1.50 90 90
360 360
3-2 Program on Market Development on Fresh Milk through Enhancement of Cooperative or Small and Medium Scale 0 57,530 7,965 65,4951) Milk marketing program
- Issuing Milk Canister 40L 58 no 15 867 867- Issuing Milk Canister 20L 850 no 7 5,942 5,942- Mobile Milk sale 5 unit 520 2,600 2,600- UHTmilk Processing 3 unit 13,367 40,101 40,101- Chilling Tank 1500 liters 4 no 2,005 8,020 8,020
0 57,530 57,5302) Training of milk production and market network improvement
- Clean milk production (1 day training) 6,250 time 1.2 7,500 7,500- O&M of UHT processing plant (3 day training) 55 time 3.0 165 165- Establishment of effective milk collection (3 day training 50 time 3.0 150 150- Market planning etc. (3 day training) 50 time 3.0 150 150
7,965 7,965
3-3 Livestock Service Quality and Accessibility Improvement Program (Milk) 35,148 18,179 2,633 55,9601) Improvement of cold chain for semen transport
- Liquid Nitrogen Tank 2 no 390 780 780- Semen canister (Big) 2 no 650 1,300 1,300
Sub-Total
Sub-Total
Sub-Total
Unit Unit Price(Rs.1,000)
Amount (Rs.1,000)
Sub-Total
Sub-Total
COST BREAKDOWN for ZONE-02 (3/4)
No.Project
Components Inputs Q'ty RemarksCivil works Equipment/ materials Awareness/Consulting/ Training
Total

C-22
1.0US$ = 79 Yen 132 Rs.
Eligible Non-eligible Eligible Non-
eligible Eligible Non-eligible Eligible Non-
eligible- Semen canister (Middle) 4 no 78 312 312- AI kits 36 set 20.8 749 749
3,141 3,1412) Livestock Training Program
i) Training of trainers 800 time 3.0 2,400 2,400ii) Training of input suppliers 155 time 1.5 233 233
2,633 2,6333) Livestock services program
i) Livestock service center- Construction of livestock service center (100m2) 21 place 1,674 35,148 35,148- Pickup track 3 unit 4,177 12,532 12,532- Motor cycle 12 no 209 2,506 2,506
35,148 15,038 50,186
4. Consulting Services (Tentative estimate)Incorporated in the Summary
5. Administration Cost of PMU & PDOA (Tentative estimate)Incorporated in the Summary
1,955,904 765,030 124,653 2,845,5872,845,587 check
Source : JICA Survey Team
GRAND TOTAL
COST BREAKDOWN for ZONE-02 (4/4)
No. ProjectComponents
Inputs Q'ty Unit
Sub-Total
Amount (Rs.1,000)
Sub-Total
Sub-Total
Unit Price(Rs.1,000) RemarksCivil works Equipment/ materials Awareness/
Consulting/ TrainingTotal

C-23
1.0US$ = 79 Yen 132 Rs.
Eligible Non-eligible Eligible Non-
eligible Eligible Non-eligible Eligible Non-
eligible1. Mobilization of PMU and PIU
Incorporated in the Summary1,945,790 for checking
2. Agricultural Crop Promotion Program 1,465,921 412,470 67,398 1,945,7902-1 Productivity Improvement Program (Agricultural Crop) 1,273,642 376,220 57,795 1,707,657
1) Rehabilitation of irrigation facility 766,765 766,765i) Individual sub schemes 2 scheme 512,564 512,564
- Ingnimitiya scheme LS 412,357 412,357
- Neelabemma Scheme (Phase II) LS 100,207 100,207
ii) Major tank rehabilitation 1 scheme 17,633 17,633iii) Medium tank rehabilitation 1 scheme 19,819 19,819iv) Minor tank rehabilitation 16 scheme 216,749 216,749
2) Agro well provision 491,377 91,360 582,737- Construction of new agro wells 537 no 314,317 314,317- Rehabilitation of agro wells 605 no 177,060 177,060- Provision of pumps and accessories 1,142 set 80 91,360 91,360
3) Micro irrigation system 68,195 68,195- Sprinkler irrigation for 500m2 50 set 329 16,445 16,445- Drip irrigation system 832 ha 62 51,750 51,750
4) Enhancement of supply chain of quality seed and planting material 15,500 216,665 57,795 289,960i) Provision of equipment & machinery for seed laboratory 501 501
- Tool equipment & machinery 1 set 501 501 501
ii) Provision of seed farms 15,500 5,250 20,750- Wariyapola seed farm 1 LS 7,500 2,500 10,000- Galgamuwa seed farm 1 LS 8,000 2,750 10,750
iii) Farmer traing program on quality self-seed & planting material produsction 375 375- Quality self-seed production for OFCs 200 day 1.0 200 200- Certified seed production for OFCs 67 day 1.0 67 67- Quality planting material production for fruits 108 day 1.0 108 108
iv) Farmer training program on improvement of farm management etc. 57,420 57,420- Farm management improvement 18,000 day 1.0 18,000 18,000- OFCs production improvement 10,080 day 1.0 10,080 10,080- Fruits production improvement 11,340 day 1.0 11,340 11,340- Study tour 75 time 240 18,000 18,000
COST BREAKDOWN for ZONE-03 (1/4)
No. ProjectComponents
Inputs Q'ty Unit Unit Price(Rs.1,000)
Amount (Rs.1,000)
RemarksCivil works Equipment/ materialsAwareness/
Consulting/ Training Total

C-24
1.0US$ = 79 Yen 132 Rs.
Eligible Non-eligible Eligible Non-
eligible Eligible Non-eligible Eligible Non-
eligiblev) Supply of machinery, equipment ans material 210,914 210,914
- Manual highland seeder for pulses 28 no. 45 1,260 1,260 5 Ac/day- Highland weeder 28 no. 50 1,400 1,400- Ridger 14 no. 10 140 140- Ground nut decorticating machine 4 no. 10 40 40 15 kg/hr- Pulse splitting machine 10 no. 180 1,800 1,800 30-40 kg/hr- Pulse cleaning machine 10 no. 50 500 500- Grinding machine for flour making 35 no. 62 2,170 2,170- Barbed wire fence 333 km 88 29,304 29,304- Electric fence (protect from elephants) 300 km 581 174,300 174,300
2-2 Logistic System Improvement and Entrepreneurs Development Program (Agricultural Crop) 192,280 28,246 2,277 222,8031) Established of proper interface and incubation 118,169 6,346 0 124,515
i) Establishment of collecting points 118,169 6,346 0 124,515- Facilities for collecting point 38 place 3,110 118,169 118,169- Equipment for collecting points 38 set 167 6,346 6,346
2) Improvement of farmers' storage facility 0 21,900 0 21,900- Renovation of farmers' storage, onion 240 no 30 7,200 7,200- Renovation of farmers' storage, chili 490 no 30 14,700 14,700
3) Upgrading of DEC and construction of collecting centrei) Upgrading of DEC
Not subject
4) Rural road and farm access road rehabilitation 74,111 0 0 74,111- Improvement of access roads to market 6.6 km 4,506 29,741 29,741- Improvement of farm roads 74.9 km 592 44,370 44,370
5) Study tour 0 0 2,277 2,277- To potential impact countries 1 LS 1,287 1,287 1,287 3 weeks x 9 person/4
- To active export countries 1 LS 990 990 990 3 weeks x 9 person/4
2-3 Program on Enhancement of Extension Services and Ground Level Research (Agricultural Crop) 0 8,004 7,326 15,3301) Training to extension officers 0 0 1,386 1,386
i) Project Awareness 360 day 0.75 270 270504 day 1.00 504 504
ii) Best Practices in OFC Cultivation 108 day 1.00 108 108iii) Best Practices in Fruit Cultivation 108 day 1.00 108 108iv) Farm Business Management 180 day 1.00 180 180v) Exposure visits for experience sharing 108 day 2.00 216 216
2) Training facility improvement 0 8,004 0 8,004- Motor cycle 36 no 209.00 7,524 7,524- Personal computer 4 no 120 480 480
Q'ty Unit
ii) Farm management improvement
COST BREAKDOWN for ZONE-03 (2/4)
No.Project
Components Inputs Unit Price(Rs.1,000)
Amount (Rs.1,000)
RemarksCivil works Equipment/ materials Awareness/Consulting/ Training
Total

C-25
1.0US$ = 79 Yen 132 Rs.
Eligible Non-eligible Eligible Non-
eligible Eligible Non-eligible Eligible Non-
eligible3) Overseas training 5,940 5,940
- Overseas traing for OFCs 1 person 3,960 3,960 3,960 12 month- Overseas traing for fruit 1 person 1,980 1,980 1,980 6 month
3. Livestock Product Promotion Program 49,549 127,377 120,565 297,4903-1 Productivity Improvement Program of Semi-intensive and Intensive Farmer (Milk) 34,000 88,126 114,160 236,286
1) Milk production improvement programi) Feeding Project
- Individual Fodder Development(Unit) 5 years 1,200 plot 20 24,000 24,000- Straw Bailing Unit 25 unit 2,673 66,835 66,835- Bio-mass Pelleting units 2 unit 5,347 10,694 10,694- Grass choppers 12 unit 650 7,800 7,800- Supply of seeds of pasture and legumes 18 pack 13 241 241 20 kg/pack
24,000 85,570 109,570ii) Breeding program
- Estrus Synchronization(head for 5years) 16,000 time 2 32,000 32,000- Artificial Insemination(times for 5 years) 66,800 time 1 33,400 33,400
0 65,400 65,400iii) Goat breeding program
- Goat breeding farm Thelahara 3,800 place 11 41,800 41,800- Breeding female goat Terahara 600 head 11 6,600 6,600- Provision & rehabilitation of facility for Thelahara 1 LS 10,000 10,000 10,000- Goat provision 852 head 3 2,556 2,556
10,000 2,556 48,400 60,956iv) Training for feeding improvement
- Production planning,financial management etc. 60 day 1.50 90 90- Awareness and utilization of crop residue 60 day 1.50 90 90- Technical training on products from crop residue 60 day 1.50 90 90- Improving nutritive quality of crop rsidue 60 day 1.50 90 90
360 360
3-2 Program on Market Development on Fresh Milk through Enhancement of Cooperative or Small and Medium Scale 0 27,536 5,160 32,6961) Milk marketing program
- Issuing Milk Canister 40L 50 no 15 748 748- Issuing Milk Canister 20L 900 no 7 6,291 6,291- Mobile Milk sale 6 unit 520 3,120 3,120- UHTmilk Processing 1 unit 13,367 13,367 13,367- Chilling Tank 1500 liters 2 no 2,005 4,010 4,010
0 27,536 27,5362) Training of milk production and market network improvement
- Clean milk production (1 day training) 4,000 time 1.2 4,800 4,800- O&M of UHT processing plant (3 day training) 45 time 3.0 135 135- Establishment of effective milk collection (3 day training) 35 time 3.0 105 105- Market planning etc. (3 day training) 40 time 3.0 120 120
5,160 5,160
Unit Unit Price(Rs.1,000)
Amount (Rs.1,000)
RemarksCivil works Equipment/ materialsAwareness/
Consulting/ Training TotalNo.Project
ComponentsInputs Q'ty
Sub-Total
Sub-Total
Sub-Total
Sub-Total
Sub-Total
Sub-Total
COST BREAKDOWN for ZONE-03 (3/4)

C-26
1.0US$ = 79 Yen 132 Rs.
Eligible Non-eligible Eligible Non-
eligible Eligible Non-eligible Eligible Non-
eligible
3-3 Livestock Service Quality and Accessibility Improvement Program (Milk) 15,549 11,715 1,245 28,5091) Improvement of cold chain for semen transport
- Liquid Nitrogen Tank 1 no 390 390 390- Semen canister (Big) 1 no 650 650 650- Semen canister (Middle) 3 no 78 234 234- AI kits 20 set 20.8 416 416
1,690 1,6902) Livestock Training Program
i) Training of trainers 355 time 3.0 1,065 1,065ii) Training of input suppliers 120 time 1.5 180 180
1,245 1,2453) Livestock services program
i) Livestock service center- Construction of livestock service center (100m2) 10 place 1,555 15,549 15,549- Pickup track 2 unit 4,177 8,354 8,354- Motor cycle 8 no 209 1,671 1,671
15,549 10,025 25,574
4. Consulting Services (Tentative estimate)Incorporated in the Summary
5. Administration Cost of PMU & PDOA (Tentative estimate)Incorporated in the Summary
1,515,470 539,847 187,963 2,243,2802,243,280 check
Source : JICA Survey Team
Civil works Equipment/ materialsAwareness/
Consulting/ TrainingTotalQ'ty Unit Unit Price
(Rs.1,000)
Sub-Total
Sub-Total
Sub-Total
GRAND TOTAL
COST BREAKDOWN for ZONE-03 (4/4)
No. ProjectComponents
Inputs
Amount (Rs.1,000)
Remarks

C-27
1.0US$ = 79 Yen = 132 Rs.
Eligible Non-eligible Eligible Non-
e ligible Eligible Non-e ligible Eligible Non-
eligible1. Mobilization of PMU and PIU
Incorporated in the Summary1,021,883 for checking
2. Agricultural Crop Promotion Program 709,045 275,629 37,209 1,021,8832-1 Productivity Improvement Program (Agricultural Crop) 601,369 235,171 27,837 864,376
1) Rehabilitation of irrigation facility 72,464 72,464i) Individual sub schemes 0 schemeii) Major tank rehabilitation 0 scheme 0iii) Medium tank rehabilitation 2 scheme 4,415 4,415iv) Minor tank rehabilitation 8 scheme 68,049 68,049
2) Agro well provision 522,404 129,280 651,684- Construction of new agro wells 760 no 334,198 334,198- Rehabilitation of agro wells 856 no 188,206 188,206- Provision of pumps and accessories 1,616 set 80 129,280 129,280
3) Micro irrigation system 51,775 51,775- Sprinkler irrigation for 500m2 50 set 329 16,445 16,445- Drip irrigation system 568 ha 62 35,330 35,330
4) Enhancement of supply chain of quality seed and planting material 6,500 54,116 27,837 88,453i) Provision of equipment & machinery for seed laboratory 501 501
- Tool equipment & machinery 1 set 501 501 501
ii) Provision of seed farms 6,500 4,750 11,250- Okkampitiya farm 1 LS 6,500 4,750 11,250 see detail
iii) Farmer traing program on quality self-seed & planting material produsction 297 297- Quality self-seed production for OFCs 179 day 1.0 179 179- Certified seed production for OFCs 60 day 1.0 60 60- Quality planting material production for fruits 58 day 1.0 58 58
iv) Farmer training program on improvement of farm management etc. 27,540 27,540- Farm management improvement 9,360 day 1.0 9,360 9,360- OFCs production improvement 7,560 day 1.0 7,560 7,560- Fruits production improvement 1,260 day 1.0 1,260 1,260- Study tour 39 time 240 9,360 9,360
v) Supply of machinery, equipment ans material 48,865 48,865- Manual highland seeder for pulses 5 no. 45 225 225 5 Ac/day- Highland weeder 5 no. 50 250 250- Ridger 2 no. 10 20 20- Ground nut decorticating machine 1 no. 10 10 10 15 kg/hr
COST BREAKDOWN for ZONE-04 (1/4)
No.Project
ComponentsInputs Q'ty Unit Unit Price
(Rs.1,000)
Amount (Rs.1,000)
RemarksCivil works Equipment/ materialsAwareness/
Consulting/ TrainingTotal

C-28
1.0US$ = 79 Yen = 132 Rs.
Eligible Non-eligible Eligible Non-
e ligible Eligible Non-e ligible Eligible Non-
eligible- Pulse splitting machine 2 no. 180 360 360 30-40 kg/hr- Pulse cleaning machine 2 no. 50 100 100- Grinding machine for flour making 33 no. 62 2,046 2,046- Barbed wire fence 323 km 88 28,424 28,424- Electric fence (protect from elephants) 30 km 581 17,430 17,430
2-2 Logistic System Improvement and Entrepreneurs Development Program (Agricultural Crop) 75,677 24,708 2,277 102,6621) Established of proper interface and incubation 56,069 4,008 0 60,077
i) Establishment of collecting points 56,069 4,008 0 60,077- Facilities for collecting point 24 place 2,336 56,069 56,069- Equipment for collecting points 24 set 167 4,008 4,008
2) Improvement of farmers' storage facility 0 20,700 0 20,700- Renovation of farmers' storage, onion 300 no 30 9,000 9,000- Renovation of farmers' storage, chili 390 no 30 11,700 11,700
3) Upgrading of DEC and construction of collecting centrei) Upgrading of DEC
Not subject
4) Rural road and farm access road rehabilitation 19,607 0 0 19,607- Improvement of access roads to market 2.4 km 3,385 8,125 8,125- Improvement of farm roads 25.8 km 445 11,482 11,482
5) Study tour 0 0 2,277 2,277- To potential impact countries 1 LS 1,287 1,287 1,287 3 weeks x 9 person/4
- To active export countries 1 LS 990 990 990 3 weeks x 9 person/4
2-3 Program on Enhancement of Extension Services and Ground Level Research (Agricultural Crop) 32,000 15,750 7,095 54,8451) Training to extension officers 0 0 1,155 1,155
i) Project Awareness 300 day 0.75 225 225420 day 1.00 420 420
ii) Best Practices in OFC Cultivation 90 day 1.00 90 90iii) Best Practices in Fruit Cultivation 90 day 1.00 90 90iv) Farm Business Management 150 day 1.00 150 150v) Exposure visits for experience sharing 90 day 2.00 180 180
2) Training facility improvement 32,000 15,750 0 47,750- DATC Bibile at Moneragala 1 LS 5,000 5,000 10,000- ISTC Bindunuwewa at Badulla 1 LS 27,000 4,000 31,000- Motor cycle 30 no 209.00 6,270 6,270- Personal computer 4 no 120 480 480
Q'ty Unit
Amount (Rs.1,000)
RemarksCivil works Equipment/ materialsAwareness/
Consulting/ TrainingTotal
ii) Farm management improvement
COST BREAKDOWN for ZONE-04 (2/4)
No.Project
ComponentsInputs Unit Price
(Rs.1,000)
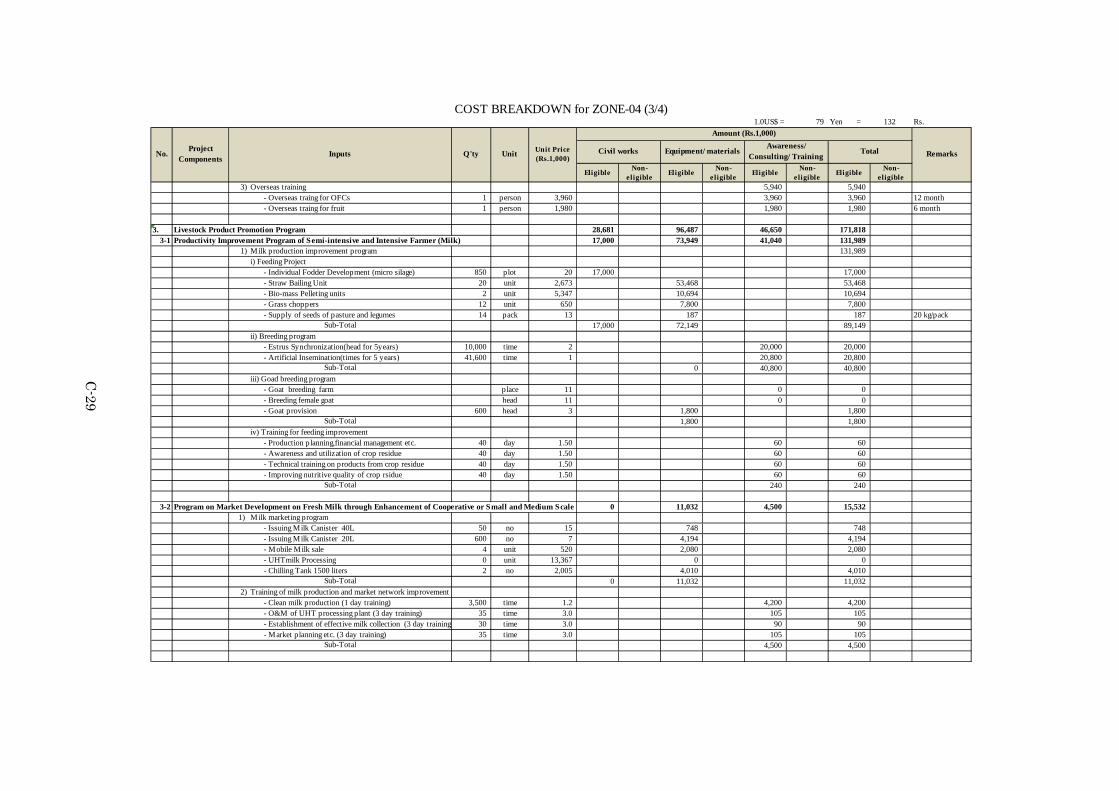
C-29
1.0US$ = 79 Yen = 132 Rs.
Eligible Non-eligible Eligible Non-
e ligible Eligible Non-e ligible Eligible Non-
eligible3) Overseas training 5,940 5,940
- Overseas traing for OFCs 1 person 3,960 3,960 3,960 12 month- Overseas traing for fruit 1 person 1,980 1,980 1,980 6 month
3. Livestock Product Promotion Program 28,681 96,487 46,650 171,8183-1 Productivity Improvement Program of Semi-intensive and Intensive Farmer (Milk) 17,000 73,949 41,040 131,989
1) Milk production improvement program 131,989i) Feeding Project
- Individual Fodder Development (micro silage) 850 plot 20 17,000 17,000- Straw Bailing Unit 20 unit 2,673 53,468 53,468- Bio-mass Pelleting units 2 unit 5,347 10,694 10,694- Grass choppers 12 unit 650 7,800 7,800- Supply of seeds of pasture and legumes 14 pack 13 187 187 20 kg/pack
17,000 72,149 89,149ii) Breeding program
- Estrus Synchronization(head for 5years) 10,000 time 2 20,000 20,000- Artificial Insemination(times for 5 years) 41,600 time 1 20,800 20,800
0 40,800 40,800iii) Goad breeding program
- Goat breeding farm place 11 0 0- Breeding female goat head 11 0 0- Goat provision 600 head 3 1,800 1,800
1,800 1,800iv) Training for feeding improvement
- Production planning,financial management etc. 40 day 1.50 60 60- Awareness and utilization of crop residue 40 day 1.50 60 60- Technical training on products from crop residue 40 day 1.50 60 60- Improving nutritive quality of crop rsidue 40 day 1.50 60 60
240 240
3-2 Program on Market Development on Fresh Milk through Enhancement of Cooperative or Small and Medium Scale 0 11,032 4,500 15,5321) Milk marketing program
- Issuing Milk Canister 40L 50 no 15 748 748- Issuing Milk Canister 20L 600 no 7 4,194 4,194- Mobile Milk sale 4 unit 520 2,080 2,080- UHTmilk Processing 0 unit 13,367 0 0- Chilling Tank 1500 liters 2 no 2,005 4,010 4,010
0 11,032 11,0322) Training of milk production and market network improvement
- Clean milk production (1 day training) 3,500 time 1.2 4,200 4,200- O&M of UHT processing plant (3 day training) 35 time 3.0 105 105- Establishment of effective milk collection (3 day training) 30 time 3.0 90 90- Market planning etc. (3 day training) 35 time 3.0 105 105
4,500 4,500
Unit Unit Price(Rs.1,000)
Amount (Rs.1,000)
RemarksCivil works Equipment/ materialsAwareness/
Consulting/ TrainingTotalNo.
ProjectComponents
Inputs Q'ty
COST BREAKDOWN for ZONE-04 (3/4)
Sub-Total
Sub-Total
Sub-Total
Sub-Total
Sub-Total
Sub-Total

C-30
1.0US$ = 79 Yen = 132 Rs.
Eligible Non-eligible Eligible Non-
e ligible Eligible Non-e ligible Eligible Non-
eligible3-3 Livestock Service Quality and Accessibility Improvement Program (Milk) 11,681 11,506 1,110 24,298
1) Improvement of cold chain for semen transport- Liquid Nitrogen Tank 1 no 390 390 390- Semen canister (Big) 1 no 650 650 650- Semen canister (Middle) 3 no 78 234 234- AI kits 20 set 20.8 416 416
1,690 1,6902) Livestock Training Program
i) Training of trainers 320 time 3.0 960 960ii) Training of input suppliers 100 time 1.5 150 150
1,110 1,1103) Livestock services program
i) Livestock service center- Construction of livestock service center (100m2) 10 place 1,168 11,681 11,681- Pickup track 2 unit 4,177 8,354 8,354- Motor cycle 7 no 209 1,462 1,462
11,681 9,816 21,498
4. Consulting Services (Tentative estimate)Incorporated in the Summary
5. Administration Cost of PMU & PDOA (Tentative estimate)Incorporated in the Summary
737,726 372,116 83,859 1,193,7011,193,701 for checking
Source : JICA Survey Team
Unit Unit Price(Rs.1,000)
Amount (Rs.1,000)
RemarksCivil works Equipment/ materialsAwareness/
Consulting/ TrainingTotal
GRAND TOTAL
Sub-Total
Sub-Total
Sub-Total
COST BREAKDOWN for ZONE-04 (4/4)
No.Project
ComponentsInputs Q'ty

C-31
1.0US$ = 79 Yen = 132 Rs.
1. Mobilization of PMU and PDOAIncorporated in the Summary
9,015,307 for checking2. Activities for Agricultural Crop 1,202,438 2,728,875 1,470,392 1,945,532 1,021,124 646,947 9,015,307
2-1 Productivity Improvement Program (Agricultural Crop) 957,923 2,469,530 1,070,369 1,708,158 864,376 504,591 7,574,9471) Rehabilitation of irrigation facility 340,672 2,050,159 279,610 766,765 72,464 375,827 3,885,496
i) Individual sub schemes scheme 4 1,529,057 2 512,564 1 375,827 7 2,417,448- Kurai Tank augmentation and Parangi aru scheme 1 414,361 1 414,361
- Welimaruthamadu Irrigation scheme scheme 1 124,244 1 124,244
- Muthayankaddu Tank Lift Irrigation Scheme scheme 1 609,167 1 609,167
- Vavunikulam Tank - Right & Left Banks Lift scheme 1 381,285 1 381,285
- Mahaweli System H scheme scheme 1 375,827 0 375,827
- Ingnimitiya scheme scheme 1 412,357 1 412,357
- Neelabemma Scheme (Existing) scheme 1 100,207 1 100,207
ii) Major tank rehabilitation scheme 3 85,465 0 0 1 34,338 1 17,633 0 0 0 0 5 137,436iii) Medium tank rehabilitation scheme 7 91,665 21 359,808 1 13,078 1 19,819 2 4,415 0 0 32 488,785iv) Minor tank rehabilitation scheme 16 163,542 14 161,294 17 232,194 16 216,749 8 68,049 0 0 71 841,827
2) Agro well provision 489,646 318,438 605,862 582,737 651,684 45,390 2,693,757- Construction of new agro wells nos 517 257,466 291 172,230 525 330,789 537 314,317 760 334,198 40 25,203 2,670 1,434,204- Rehabilitation of agro wells nos 580 144,420 327 96,768 590 185,872 605 177,060 856 188,206 43 13,547 3,001 805,873- Provision of pumps and accessories set 1,097 87,760 618 49,440 1,115 89,200 1,142 91,360 1,616 129,280 83 6,640 5,671 453,680
3) Micro irrigation system 22,227 17,202 32,371 68,195 51,775 13,837 205,606- Sprinkler irrigation for 500m2 set 29 9,538 31 10,196 28 9,209 50 16,445 50 16,445 12 3,947 200 65,780- Drip irrigation system ha 204 12,689 113 7,006 372 23,161 832 51,750 568 35,330 159 9,890 2,248 139,826 0
4) Enhancement of supply chain of quality seed and planting material 105,378 83,731 152,528 290,461 88,453 69,538 790,088i) Provision of equipment & machinery for seed laboratory 501 501 0 1,002 501 0 2,505
- Tool equipment & machinery set 1 501 1 501 0 0 2 1,002 1 501 0 0 5 2,505
ii) Provision of seed farms 3,700 14,250 0 20,750 11,250 0 49,950- Vaunia farm place 1 14,250 1 14,250- Kantale farm place 1 3,700 1 3,700- Wariyapola seed farm place 1 10,000 1 10,000- Galgamuwa seed farm place 1 10,750 1 10,750- Okkampitiya farm place 1 11,250 1 11,250
iii) Farmer traing program on quality self-seed & planting material produsction 900 517 923 375 297 692 3,703- Quality self-seed production for OFCs day 655 655 378 378 670 670 200 200 179 179 503 503 2,586 2,586- Certified seed production for OFCs day 219 219 126 126 224 224 67 67 60 60 168 168 863 863- Quality planting material production for fruits day 26 26 12 12 29 29 108 108 58 58 21 21 254 254
iv) Farmer training program on improvement of farm management etc. 17,248 15,191 12,405 57,420 27,540 9,306 139,110- Farm management improvement day 5,043 5,043 4,431 4,431 3,638 3,638 18,000 18,000 9,360 9,360 2,728 2,728 43,200 43,200- OFCs production improvement day 1,662 1,662 1,422 1,422 1,238 1,238 10,080 10,080 7,560 7,560 928 928 22,890 22,890- Fruits production improvement day 5,500 5,500 4,908 4,908 3,891 3,891 11,340 11,340 1,260 1,260 2,921 2,921 29,820 29,820- Study tour time 21 5,043 18 4,431 15 3,638 75 18,000 39 9,360 11 2,728 180 43,200
v) Supply of machinery, equipment ans material 83,029 53,272 139,200 210,914 48,865 59,540 594,820- Manual highland seeder for pulses no. 76 3,420 29 1,305 161 7,245 28 1,260 5 225 69 3,105 368 16,560- Highland weeder no. 76 3,800 29 1,450 161 8,050 28 1,400 5 250 69 3,450 368 18,400
TotalAmount Q 'ty Total
AmountTotal
Amount Q'ty TotalAmount Q 'ty Total
Amount Q 'ty
NCP NWP UP Mahaweli System H Total
Q'ty TotalAmount Q 'ty Total
Amount Q 'ty
COST BREAKDOWN for PROGRAMS by PROVINCE (1/4)
No. Program Inputs Unit
Amount in Rs.1,000
RemarksEP NP
2.2.2 C
ost Estim
ate by Provinces

C-32
- Ridger no. 38 380 14 140 81 810 14 140 2 20 35 350 184 1,840- Ground nut decorticating machine no. 11 110 4 40 22 220 4 40 1 10 10 100 52 520- Pulse splitting machine no. 28 5,040 11 1,980 58 10,440 10 1,800 2 360 25 4,500 134 24,120- Pulse cleaning machine no. 28 1,400 11 550 58 2,900 10 500 2 100 25 1,250 134 6,700- Grinding machine for flour making no. 84 5,208 61 3,782 129 7,998 35 2,170 33 2,046 55 3,410 397 24,614- Barbed wire fence km 334 29,392 256 22,528 487 42,856 333 29,304 323 28,424 209 18,392 1,942 170,896- Electric fence (protect from elephants) km 59 34,279 37 21,497 101 58,681 300 174,300 30 17,430 43 24,983 570 331,170
2-2 Logistic System Improvement and Entrepreneurs Development Program (Agricultural Crop) 230,790 247,105 383,208 222,044 101,903 137,661 1,322,7101) Established of proper interface and incubation
i) Establishment of collecting points 46,360 53,795 38,659 124,515 60,077 17,572 340,978 0- Facilities for collecting point place 14 44,022 16 51,123 11 36,822 38 118,169 24 56,069 5 16,737 108 322,942 adjusted- Equipment for collecting points set 14 2,338 16 2,672 11 1,837 38 6,346 24 4,008 5 835 108 18,036
2) Improvement of farmers' storage facility 49,200 38,220 70,890 21,900 20,700 30,390 231,300- Renovation of farmers' storage, onion no 591 17,730 603 18,090 599 17,970 240 7,200 300 9,000 257 7,710 2,590 77,700- Renovation of farmers' storage, chili no 1,049 31,470 671 20,130 1,764 52,920 490 14,700 390 11,700 756 22,680 5,120 153,600
3) Upgrading of DEC and construction of collecting centrei) Upgrading of DEC 0 0 86,000 0 0 0 86,000
- Dambulla at DA Matale 1 64,000 1 64,000- Thambuttegama at Anuradapura 1 22,000 1 22,000
4) Rural road and farm access road rehabilitation 133,713 153,572 186,140 74,111 19,607 88,181 655,324 0- Improvement of access roads to market km 21.0 70,065 17.0 67,013 27.0 120,523 6.6 29,741 2.4 8,125 12.0 58,210 86.0 353,678 adjusted- Improvement of farm roads km 134.0 63,647 151.0 86,559 109.0 65,617 74.9 44,370 25.8 11,482 47.0 29,971 541.7 301,646 adjusted
5) Study tour 1,518 1,518 1,518 1,518 1,518 1,518 9,108- To potential impact countries LS 1 858 1 858 1 858 1 858 1 858 1 858 1 5,148- To active export countries LS 1 660 1 660 1 660 1 660 1 660 1 660 1 3,960
2-3 Program on Enhancement of Extension Services and Ground Level Research (Agricultural Cr 13,725 12,240 16,815 15,330 54,845 4,695 117,6501) Training to extension officers 1,155 924 1,617 1,386 1,155 693 6,930
i) Project Awareness day 300 225 240 180 420 315 360 270 300 225 180 135 1,800 1,350day 420 420 336 336 588 588 504 504 420 420 252 252 2,520 2,520
ii) Best Practices in OFC Cultivation day 90 90 72 72 126 126 108 108 90 90 54 54 540 540iii) Best Practices in Fruit Cultivation day 90 90 72 72 126 126 108 108 90 90 54 54 540 540iv) Farm Business Management day 150 150 120 120 210 210 180 180 150 150 90 90 900 900v) Exposure visits for experience sharing day 90 180 72 144 126 252 108 216 90 180 54 108 540 1,080
2) Training facility improvement 6,630 5,376 9,258 8,004 47,750 4,002 81,020- DATC Bibile at Moneragala place 1 10,000 1 10,000- ISTC Bindunuwewa at Badulla place 1 31,000 1 31,000- Motor cycle no 30 6,270 24 5,016 42 8,778 36 7,524 30 6,270 18 3,762 180 37,620- Personal computer no 3 360 3 360 4 480 4 480 4 480 2 240 20 2,400
3) Overseas training 5,940 5,940 5,940 5,940 5,940 0 29,700- Overseas traing for OFCs person 1 3,960 1 3,960 1 3,960 1 3,960 1 3,960 0 0 5 19,800- Overseas traing for fruit person 1 1,980 1 1,980 1 1,980 1 1,980 1 1,980 0 0 5 9,900
Q 'ty TotalAmount
COST BREAKDOWN for PROGRAMS by PROVINCE (2/4)
Q'ty TotalAmount Q 'ty Total
Amount Q 'ty TotalAmountQ'ty Total
Amount Q 'ty TotalAmount Q 'ty Total
Amount
Amount in Rs.1,000
RemarksEP NP NCP NWP UP Mahaweli System H TotalNo. Program Inputs Unit
ii) Farm management improvement

C-33
3. Livestock Product Promotion Program 167,303 194,909 128,357 297,628 171,661 82,215 1,042,0733-1 Productivity Improvement Program of Semi-intensive and Intensive Farmer (Milk) 71,689 118,090 82,022 236,286 131,989 61,512 701,588
1) Milk production improvement programi) Feeding Project 49,301 95,436 52,672 109,570 89,149 39,504 435,632
- Individual Fodder Development(Unit) 5 years plot 201 4,020 500 10,000 571 11,429 1,200 24,000 850 17,000 429 8,571 3,751 75,020- Straw Bailing Unit unit 10 26,734 25 66,835 11 30,553 25 66,835 20 53,468 9 22,915 100 267,342- Bio-mass Pelleting units unit 2 10,694 2 10,694 1 6,111 2 10,694 2 10,694 1 4,583 10 53,468- Grass choppers unit 12 7,800 12 7,800 7 4,457 12 7,800 12 7,800 5 3,343 60 39,000- Supply of seeds of pasture and legumes pack 4 53 8 107 9 122 18 241 14 187 7 92 60 802
ii) Breeding program 20,400 20,400 28,000 65,400 40,800 21,000 196,000- Estrus Synchronization(head for 5years) time 5,000 10,000 5,000 10,000 6,857 13,714 16,000 32,000 10,000 20,000 5,143 10,286 48,000 96,000- Artificial Insemination(times for 5 years) time 20,800 10,400 20,800 10,400 28,571 14,286 66,800 33,400 41,600 20,800 21,429 10,714 200,000 100,000
iii) Goat breeding program 1,800 2,100 1,200 60,956 1,800 900 68,756- Goat breeding farm place 3,800 41,800 3,800 41,800- Breeding female goat head 600 6,600 600 6,600- Provision & rehabilitation of facility for Thelahara LS 1 10,000 1 10,000- Goat provision head 600 1,800 700 2,100 400 1,200 852 2,556 600 1,800 300 900 3,452 10,356
iv) Training for feeding improvement 188 154 150 360 240 108 1,200- Production planning,financial management etc. day 31 47 26 39 25 38 60 90 40 60 18 27 200 301- Awareness and utilization of crop residue day 31 47 26 39 25 37 60 90 40 60 18 27 200 300- Technical training on products from crop residue day 31 47 26 39 25 38 60 90 40 60 18 27 200 301- Improving nutritive quality of crop rsidue day 31 47 26 39 25 37 60 90 40 60 18 27 200 300
3-2 Program on Market Development on Fresh Milk through Enhancement of Cooperative or Sm 66,105 41,206 25,097 32,696 15,332 6,862 187,2971) Milk marketing program 61,805 37,766 19,077 27,536 11,032 4,282 161,497
- Issuing Milk Canister 40L no 10 150 50 748 29 427 50 748 50 748 21 320 210 3,140- Issuing Milk Canister 20L no 300 2,097 600 4,194 343 2,397 900 6,291 600 4,194 257 1,797 3,000 20,970- Mobile Milk sale unit 4 2,080 4 2,080 1 594 6 3,120 4 2,080 1 446 20 10,400- UHTmilk Processing unit 4 53,468 2 26,734 1 13,367 1 13,367 0 0 0 0 8 106,937- Chilling Tank 1500 liters no 2 4,010 2 4,010 1 2,292 2 4,010 2 4,010 1 1,719 10 20,051
2) Training of milk production and market network improvement 4,300 3,440 6,020 5,160 4,300 2,580 25,800- Clean milk production (1 day training) time 3,375 4,050 2,700 3,240 4,725 5,670 4,050 4,860 3,375 4,050 2,025 2,430 20,250 24,300- O&M of UHT processing plant (3 day training) time 30 90 24 72 42 126 36 108 30 90 18 54 180 540- Establishment of effective milk collection (3 day tra time 26 78 21 62 36 109 31 93 26 78 16 47 155 465- Market planning etc. (3 day training) time 28 83 22 66 39 116 33 99 28 83 17 50 165 495
3-3 Livestock Service Quality and Accessibility Improvement Program (Milk) 29,508 35,614 21,238 28,647 24,340 13,841 153,1881) Improvement of cold chain for semen transport 1,612 1,612 1,367 1,690 1,690 245 8,216
- Liquid Nitrogen Tank no 1 390 1 390 1 390 1 390 1 390 0 0 5 1,950- Semen canister (Big) no 1 650 1 650 1 650 1 650 1 650 0 0 5 3,250- Semen canister (Middle) no 2 156 2 156 1 89 3 234 3 234 1 67 12 936- AI kits set 20 416 20 416 11 238 20 416 20 416 9 178 100 2,080
2) Livestock Training Program 1,153 922 1,614 1,383 1,153 692 6,915i) Training of trainers time 343 1,028 274 822 480 1,439 411 1,233 343 1,028 206 617 2,055 6,165ii) Training of input suppliers time 83 125 67 100 117 175 100 150 83 125 50 75 500 750
Q 'ty TotalAmount Q 'ty Total
Amount Q 'ty TotalAmountQ 'ty Total
Amount Q 'ty TotalAmount Q'ty Total
Amount
RemarksEP NP NCP NWP UP Mahaweli System H Total
Q'ty TotalAmount
COST BREAKDOWN for PROGRAMS by PROVINCE (3/4)
No. Program Inputs Unit
Amount in Rs.1,000

C-34
3) Livestock services programi) Livestock service center 26,744 33,080 18,258 25,574 21,498 12,904 138,057
- Construction of livestock service center (100m2) place 12 16,927 16 22,219 7 12,529 10 15,549 10 11,681 5 8,608 60 87,513 (0)- Pickup track unit 2 8,354 2 8,354 1 4,774 2 8,354 2 8,354 1 3,580 10 41,772- Motor cycle no 7 1,462 12 2,506 5 955 8 1,671 7 1,462 3 716 42 8,772
4. Consulting ServicesIncorporated in the Summary
5. Administration Cost of PMU & PDOA Incorporated in the Summary
1,369,741 2,923,784 1,598,749 2,243,160 1,192,785 729,162 10,057,380
Source : JICA Survey Team
Q 'ty TotalAmount
Total
Q'ty TotalAmount Q 'ty Total
Amount Q 'ty TotalAmount Q'ty Total
Amount Q 'ty
EP NP NCP NWP UP Mahaweli System H
COST BREAKDOWN for PROGRAMS by PROVINCE (4/4)
No. Program Inputs Unit
Amount in Rs.1,000
Remarks
TotalAmount Q 'ty Total
Amount
GRAND TOTAL

C-35
1.0US$ = 79 Yen = 132 Rs.
Eligible Non-eligible Eligible Non-
eligible Eligible Non-eligible Eligible Non-
eligible1. Mobilization of PMU and PIU
Incorporated in the Summary
2. Agricultural Crop Promotion Program 935,631 254,385 26,761 1,216,7772-1 Productivity Improvement Program (Agricultural Crop) 743,558 196,217 18,148 957,923
1) Rehabilitation of irrigation facility 340,672 0 0 340,672i) Individual sub schemes scheme 0ii) Major tank rehabilitation 3 scheme 85,465 85,465iii) Medium tank rehabilitation 7 scheme 91,665 91,665iv) Minor tank rehabilitation 16 scheme 163,542 163,542
2) Agro well provision 401,886 87,760 489,646- Construction of new agro wells 517 no 257,466 257,466- Rehabilitation of agro wells 580 no 144,420 144,420- Provision of pumps and accessories 1,097 set 80 87,760 87,760
3) Micro irrigation system 22,227 22,227- Sprinkler irrigation for 500m2 29 set 329 9,538 9,538- Drip irrigation system 204 ha 62 12,689 12,689
4) Enhancement of supply chain of quality seed and planting material 1,000 86,230 18,148 105,378i) Provision of equipment & machinery for seed laboratory 501 501
- Tool equipment & machinery 1 set 501 501 501
ii) Provision of seed farms 1,000 2,700 3,700- Kantale farm 1 LS 1,000 2,700 3,700
iii) Farmer traing program on quality self-seed & planting material produsction 900 900- Quality self-seed production for OFCs 655 day 1.0 655 655- Certified seed production for OFCs 219 day 1.0 219 219- Quality planting material production for fruits 26 day 1.0 26 26
iv) Farmer training program on improvement of farm management etc. 17,248 17,248- Farm management improvement 5,043 day 1.0 5,043 5,043- OFCs production improvement 1,662 day 1.0 1,662 1,662- Fruits production improvement 5,500 day 1.0 5,500 5,500- Study tour 21 time 240 5,043 5,043
v) Supply of machinery, equipment ans material 83,029 83,029- Manual highland seeder for pulses 76 no. 45 3,420 3,420 5 Ac/day- Highland weeder 76 no. 50 3,800 3,800- Ridger 38 no. 10 380 380- Ground nut decorticating machine 11 no. 10 110 110 15 kg/hr- Pulse splitting machine 28 no. 180 5,040 5,040 30-40 kg/hr- Pulse cleaning machine 28 no. 50 1,400 1,400- Grinding machine for flour making 84 no. 62 5,208 5,208- Barbed wire fence 334 km 88 29,392 29,392- Electric fence (protect from elephants) 59 km 581 34,279 34,279
RemarksCivil works Equipment/ materialsAwareness/
Consulting/ TrainingTotal
COST BREAKDOWN for EASTERN PROVINCE (EP) (1/4)
No. Program Inputs Q'ty Unit Unit Price(Rs.1,000)
Amount (Rs.1,000)

C-36
Eligible Non-eligible Eligible Non-
eligible Eligible Non-eligible Eligible Non-
eligible
2-2 Logistic System Improvement and Entrepreneurs Development Program (Agricultural Crop) 192,073 51,538 1,518 245,1291) Established of proper interface and incubation
i) Establishment of collecting points 44,022 2,338 0 46,360- Facilities for collecting point 14 place 3,144 44,022 44,022- Equipment for collecting points 14 set 167 2,338 2,338
2) Improvement of farmers' storage facility 0 49,200 0 49,200- Renovation of farmers' storage, onion 591 no 30 17,730 17,730- Renovation of farmers' storage, chili 1,049 no 30 31,470 31,470
3) Upgrading of DEC and construction of collecting centrei) Upgrading of DEC
Not subject
4) Rural road and farm access road rehabilitation 148,052 0 0 148,052- Improvement of access roads to market 21.0 km 3,834 80,514 80,514- Improvement of farm roads 134.0 km 504 67,538 67,538
5) Study tour 0 0 1,518 1,518- To potential impact countries 1 LS 858 858 858 3 weeks x 9 person/6
- To active export countries 1 LS 660 660 660 3 weeks x 9 person/6
2-3 Program on Enhancement of Extension Services and Ground Level Research (Agricultural Crop) 0 6,630 7,095 13,7251) Training to extension officers 0 0 1,155 1,155
i) Project Awareness 300 day 0.75 225 225420 day 1.00 420 420
ii) Best Practices in OFC Cultivation 90 day 1.00 90 90iii) Best Practices in Fruit Cultivation 90 day 1.00 90 90iv) Farm Business Management 150 day 1.00 150 150v) Exposure visits for experience sharing 90 day 2.00 180 180
2) Training facility improvement 0 6,630 0 6,630- Motor cycle 30 no 209 6,270 6,270- Personal computer 3 no 120 360 360
3) Overseas training 5,940 5,940- Overseas traing for OFCs 1 person 3,960 3,960 3,960 12 month- Overseas traing for fruit 1 person 1,980 1,980 1,980 6 month
Amount (Rs.1,000)
RemarksCivil works Equipment/ materials Awareness/Consulting/ Training
Total
COST BREAKDOWN for EASTERN PROVINCE (EP) (2/4)
No. Program Inputs Q'ty Unit Unit Price(Rs.1,000)
ii) Farm management improvement

C-37
Eligible Non-eligible Eligible Non-
eligible Eligible Non-eligible Eligible Non-
eligible3. Livestock Product Promotion Program 19,895 120,315 26,041 166,250
3-1 Productivity Improvement Program of Semi-intensive and Intensive Farmer (Milk) 4,020 47,081 20,588 71,6891) Milk production improvement program
i) Feeding Project- Individual Fodder Development(Unit) 5 years 201 plot 20 4,020 4,020- Straw Bailing Unit 10 unit 2,673 26,734 26,734- Bio-mass Pelleting units 2 unit 5,347 10,694 10,694- Grass choppers 12 unit 650 7,800 7,800- Supply of seeds of pasture and legumes 4 pack 13 53 53 20 kg/pack
4,020 45,281 49,301ii) Breeding program
- Estrus Synchronization(head for 5years) 5,000 time 2 10,000 10,000- Artificial Insemination(times for 5 years) 20,800 time 1 10,400 10,400
0 20,400 20,400iii) Goat breeding program
- Goat breeding farm place 11 0 0- Breeding female goat head 11 0 0- Goat provision 600 head 3 1,800 1,800
1,800 1,800iv) Training for feeding improvement
- Production planning,financial management etc. 31 day 1.50 47 47- Awareness and utilization of crop residue 31 day 1.50 47 47- Technical training on products from crop residue 31 day 1.50 47 47- Improving nutritive quality of crop rsidue 31 day 1.50 47 47
188 188
3-2 Program on Market Development on Fresh Milk through Enhancement of Cooperative or Small and Medium Sca 0 61,805 4,300 66,1051) Milk marketing program
- Issuing Milk Canister 40L 10 no 15 150 150- Issuing Milk Canister 20L 300 no 7 2,097 2,097- Mobile Milk sale 4 unit 520 2,080 2,080- UHTmilk Processing 4 unit 13,367 53,468 53,468- Chilling Tank 1500 liters 2 no 2,005 4,010 4,010
0 61,805 61,8052) Training of milk production and market network improvement
- Clean milk production (1 day training) 3,375 time 1.2 4,050 4,050- O&M of UHT processing plant (3 day training) 30 time 3.0 90 90- Establishment of effective milk collection (3 day training 26 time 3.0 78 78- Market planning etc. (3 day training) 28 time 3.0 83 83
4,300 4,300
3-3 Livestock Service Quality and Accessibility Improvement Program (Milk) 15,875 11,428 1,153 28,4561) Improvement of cold chain for semen transport
- Liquid Nitrogen Tank 1 no 390 390 390- Semen canister (Big) 1 no 650 650 650- Semen canister (Middle) 2 no 78 156 156- AI kits 20 set 20.8 416 416
1,612 1,612
RemarksCivil works Equipment/ materialsAwareness/
Consulting/ Training TotalQ'ty Unit Unit Price(Rs.1,000)
Amount (Rs.1,000)
Sub-Total
Sub-Total
Sub-Total
Sub-Total
Sub-Total
Sub-Total
COST BREAKDOWN for EASTERN PROVINCE (EP) (3/4)
No. Program Inputs

C-38
1.0US$ = 79 Yen = 132 Rs.
Eligible Non-el igible Eligible Non-
eligible Eligible Non-eligible Eligible Non-
eligible1. Mobilization of PMU and PIU
Incorporated in the Summary
2. Agricultural Crop Promotion Program 2,545,128 173,183 24,090 2,742,4012-1 Productivity Improvement Program (Agricultural Crop) 2,326,907 126,915 15,708 2,469,530
1) Rehabilitation of irrigation facility 2,050,159 0 0 2,050,159i) Individual sub schemes 4 scheme 1,529,057 1,529,057
- Kurai Tank augmentation and Parangi aru development LS 414,361 414,361
- Welimaruthamadu Irrigation scheme LS 124,244 124,244
- Muthayankaddu Tank Lift Irrigation Scheme LS 609,167 609,167
- Vavunikulam Tank - Right & Left Banks Lift Irrigation LS 381,285 381,285
ii) Major tank rehabilitation scheme 0iii) Medium tank rehabilitation 21 scheme 359,808 359,808iv) Minor tank rehabilitation 14 scheme 161,294 161,294
2) Agro well provision 268,998 49,440 318,438- Construction of new agro wells 291 no 172,230 172,230- Rehabilitation of agro wells 327 no 96,768 96,768- Provision of pumps and accessories 618 set 80 49,440 49,440
3) Micro irrigation system 17,202 17,202- Sprinkler irrigation for 500m2 31 set 329 10,196 10,196- Drip irrigation system 113 ha 62 7,006 7,006
4) Enhancement of supply chain of quality seed and planting material 7,750 60,273 15,708 83,731i) Provision of equipment & machinery for seed laboratory 501 501
- Tool equipment & machinery 1 set 501 501 501
ii) Provision of seed farms 7,750 6,500 14,250- Vaunia farm 1 LS 7,750 6,500 14,250
iii) Farmer traing program on quality self-seed & planting material produsction 517 517- Quality self-seed production for OFCs 378 day 1.0 378 378- Certified seed production for OFCs 126 day 1.0 126 126- Quality planting material production for fruits 12 day 1.0 12 12
iv) Farmer training program on improvement of farm management etc. 15,191 15,191- Farm management improvement 4,431 day 1.0 4,431 4,431- OFCs production improvement 1,422 day 1.0 1,422 1,422- Fruits production improvement 4,908 day 1.0 4,908 4,908- Study tour 18 time 240 4,431 4,431
v) Supply of machinery, equipment ans material 53,272 53,272- Manual highland seeder for pulses 29 no. 45 1,305 1,305 5 Ac/day- Highland weeder 29 no. 50 1,450 1,450- Ridger 14 no. 10 140 140- Ground nut decorticating machine 4 no. 10 40 40 15 kg/hr- Pulse splitting machine 11 no. 180 1,980 1,980 30-40 kg/hr- Pulse cleaning machine 11 no. 50 550 550- Grinding machine for flour making 61 no. 62 3,782 3,782- Barbed wire fence 256 km 88 22,528 22,528- Electric fence (protect from elephants) 37 km 581 21,497 21,497
RemarksCivil works Equipment/ materials Awareness/Consulting/ Training
Total
COST BREAKDOWN for NORTH PROVINCE (NP) (1/4)
No. Program Inputs Q'ty Unit Unit Price(Rs.1,000)
Amount (Rs.1,000)

C-39
Eligible Non-el igible Eligible Non-
eligible Eligible Non-eligible Eligible Non-
eligible
2-2 Logistic System Improvement and Entrepreneurs Development Program (Agricultural Crop) 218,221 40,892 1,518 260,6311) Established of proper interface and incubation
i) Establishment of collecting points 50,311 2,672 0 52,983- Facilities for collecting point 16 place 3,144 50,311 50,311- Equipment for collecting points 16 set 167 2,672 2,672
2) Improvement of farmers' storage facility 0 38,220 0 38,220- Renovation of farmers' storage, onion 603 no 30 18,090 18,090- Renovation of farmers' storage, chili 671 no 30 20,130 20,130
3) Upgrading of DEC and construction of collecting centrei) Upgrading of DEC
Not subject
4) Rural road and farm access road rehabilitation 167,911 0 0 167,911- Improvement of access roads to market 17.0 km 4,557 77,462 77,462- Improvement of farm roads 151.0 km 599 90,449 90,449
5) Study tour 0 0 1,518 1,518- To potential impact countries 1 LS 858 858 858 3 weeks x 9 person/6
- To active export countries 1 LS 660 660 660 3 weeks x 9 person/6
2-3 Program on Enhancement of Extension Services and Ground Level Research (Agricultural Crop) 0 5,376 6,864 12,2401) Training to extension officers 0 0 924 924
i) Project Awareness 240 day 0.75 180 180336 day 1.00 336 336
ii) Best Practices in OFC Cultivation 72 day 1.00 72 72iii) Best Practices in Fruit Cultivation 72 day 1.00 72 72iv) Farm Business Management 120 day 1.00 120 120v) Exposure visits for experience sharing 72 day 2.00 144 144
2) Training facility improvement 0 5,376 0 5,376- Motor cycle 24 no 209.00 5,016 5,016- Personal computer 3 no 120 360 360
3) Overseas training 5,940 5,940- Overseas traing for OFCs 1 person 3,960 3,960 3,960 12 month- Overseas traing for fruit 1 person 1,980 1,980 1,980 6 month
Amount (Rs.1,000)
RemarksCivil works Equipment/ materialsAwareness/
Consulting/ Training Total
COST BREAKDOWN for NORTH PROVINCE (NP) (2/4)
No. Program Inputs Q'ty Unit Unit Price(Rs.1,000)
ii) Farm management improvement

C-40
Eligible Non-el igible Eligible Non-
eligible Eligible Non-eligible Eligible Non-
eligible3. Livestock Product Promotion Program 31,166 137,775 24,916 193,857
3-1 Productivity Improvement Program of Semi-intensive and Intensive Farmer (Milk) 10,000 87,536 20,554 118,0901) Milk production improvement program
i) Feeding Project- Individual Fodder Development(Unit) 5 years 500 plot 20 10,000 10,000- Straw Bailing Unit 25 unit 2,673 66,835 66,835- Bio-mass Pelleting units 2 unit 5,347 10,694 10,694- Grass choppers 12 unit 650 7,800 7,800- Supply of seeds of pasture and legumes 8 pack 13 107 107 20 kg/pack
10,000 85,436 95,436ii) Breeding program
- Estrus Synchronization(head for 5years) 5,000 time 2 10,000 10,000- Artificial Insemination(times for 5 years) 20,800 time 1 10,400 10,400
0 20,400 20,400iii) Goat breeding program
- Goat breeding farm place 11 0 0- Breeding female goat head 11 0 0- Goat provision 700 head 3 2,100 2,100
2,100 2,100iv) Training for feeding improvement
- Production planning,financial management etc. 26 day 1.50 39 39- Awareness and utilization of crop residue 26 day 1.50 39 39- Technical training on products from crop residue 26 day 1.50 39 39- Improving nutritive quality of crop rsidue 26 day 1.50 39 39
154 154
3-2 Program on Market Development on Fresh Milk through Enhancement of Cooperative or Small and Medium Sca 0 37,766 3,440 41,2061) Milk marketing program
- Issuing Milk Canister 40L 50 no 15 748 748- Issuing Milk Canister 20L 600 no 7 4,194 4,194- Mobile Milk sale 4 unit 520 2,080 2,080- UHTmilk Processing 2 unit 13,367 26,734 26,734- Chilling Tank 1500 liters 2 no 2,005 4,010 4,010
0 37,766 37,7662) Training of milk production and market network improvement
- Clean milk production (1 day training) 2,700 time 1.2 3,240 3,240- O&M of UHT processing plant (3 day training) 24 time 3.0 72 72- Establishment of effective milk collection (3 day training 21 time 3.0 62 62- Market planning etc. (3 day training) 22 time 3.0 66 66
3,440 3,440
3-3 Livestock Service Quality and Accessibility Improvement Program (Milk) 21,166 12,473 922 34,5611) Improvement of cold chain for semen transport
- Liquid Nitrogen Tank 1 no 390 390 390- Semen canister (Big) 1 no 650 650 650- Semen canister (Middle) 2 no 78 156 156- AI kits 20 set 20.8 416 416
1,612 1,612
RemarksCivil works Equipment/ materials Awareness/Consulting/ Training
TotalQ'ty Unit Unit Price(Rs.1,000)
Amount (Rs.1,000)
Sub-Total
Sub-Total
Sub-Total
Sub-Total
Sub-Total
Sub-Total
COST BREAKDOWN for NORTH PROVINCE (NP) (3/4)
No. Program Inputs

C-41
Eligible Non-el igible Eligible Non-
eligible Eligible Non-eligible Eligible Non-
eligible2) Livestock Training Program
i) Training of trainers 274 time 3.0 822 822 See detailii) Training of input suppliers 67 time 1.5 100 100 See detail
922 9223) Livestock services program
i) Livestock service center- Construction of livestock service center (100m2) 16 place 1,323 21,166 21,166 See detail- Pickup track 2 unit 4,177 8,354 8,354 See detail- Motor cycle 12 no 209 2,506 2,506 See detail
21,166 10,861 32,027
4. Consulting Services Incorporated in the Summary
5. Administration Cost of PMU & PDOA Incorporated in the Summary
2,576,295 310,958 49,006 2,936,258
Source : JICA Survey Team
RemarksCivil works Equipment/ materials Awareness/Consulting/ Training TotalQ'ty Unit Unit Price
(Rs.1,000)
Amount (Rs.1,000)
GRAND TOTAL
Sub-Total
Sub-Total
COST BREAKDOWN for NORTH PROVINCE (NP) (4/4)
No. Program Inputs

C-42
1.0US$ = 79 Yen 132 Rs.
Eligible Non-eligible Eligible Non-
eligible Eligible Non-eligible Eligible Non-
eligible1. Mobilization of PMU and PIU
Incorporated in the Summary1,484,708
2. Agricultural Crop Promotion Program 1,119,573 342,733 22,403 1,484,7082-1 Productivity Improvement Program (Agricultural Crop) 796,271 260,748 13,328 1,070,346
1) Rehabilitation of irrigation facility 279,610 0 0 279,610i) Individual sub schemes schemeii) Major tank rehabilitation 1 scheme 34,338 34,338iii) Medium tank rehabilitation 1 scheme 13,078 13,078iv) Minor tank rehabilitation 17 scheme 232,194 232,194
2) Agro well provision 516,662 89,200 605,862- Construction of new agro wells 525 no 330,789 330,789- Rehabilitation of agro wells 590 no 185,872 185,872- Provision of pumps and accessories 1,115 set 80 89,200 89,200
3) Micro irrigation system 32,348 32,348- Sprinkler irrigation for 500m2 28 set 329 9,209 9,209- Drip irrigation system 372 ha 62 23,138 23,138
4) Enhancement of supply chain of quality seed and planting material 139,200 13,328 152,528i) Provision of equipment & machinery for seed laboratory 0 0
- Tool equipment & machinery 0 set 501 0 0
ii) Provision of seed farmsNot subject
iii) Farmer traing program on quality self-seed & planting material produsction 923 923- Quality self-seed production for OFCs 670 day 1.0 670 670- Certified seed production for OFCs 224 day 1.0 224 224- Quality planting material production for fruits 29 day 1.0 29 29
iv) Farmer training program on improvement of farm management etc. 12,405 12,405- Farm management improvement 3,638 day 1.0 3,638 3,638- OFCs production improvement 1,238 day 1.0 1,238 1,238- Fruits production improvement 3,891 day 1.0 3,891 3,891- Study tour 15 time 240 3,638 3,638
v) Supply of machinery, equipment ans material 139,200 139,200- Manual highland seeder for pulses 161 no. 45 7,245 7,245 5 Ac/day- Highland weeder 161 no. 50 8,050 8,050- Ridger 81 no. 10 810 810- Ground nut decorticating machine 22 no. 10 220 220 15 kg/hr- Pulse splitting machine 58 no. 180 10,440 10,440 30-40 kg/hr- Pulse cleaning machine 58 no. 50 2,900 2,900- Grinding machine for flour making 129 no. 62 7,998 7,998- Barbed wire fence 487 km 88 42,856 42,856- Electric fence (protect from elephants) 101 km 581 58,681 58,681
RemarksCivil works Equipment/ materialsAwareness/
Consulting/ TrainingTotal
COST BREAKDOWN for NORTH CENTRAL PROVINCE (NCP) (1/4)
No.Project
ComponentsInputs Q'ty Unit Unit Price
(Rs.1,000)
Amount (Rs.1,000)

C-43
Eligible Non-eligible Eligible Non-
eligible Eligible Non-eligible Eligible Non-
eligible397,547
2-2 Logistic System Improvement and Entrepreneurs Development Program (Agricultural Crop) 323,302 72,727 1,518 397,5471) Established of proper interface and incubation
i) Establishment of collecting points 36,822 1,837 0 38,659- Facilities for collecting point 11 place 3,347 36,822 36,822- Equipment for collecting points 11 set 167 1,837 1,837
2) Improvement of farmers' storage facility 0 70,890 0 70,890- Renovation of farmers' storage, onion 599 no 30 17,970 17,970- Renovation of farmers' storage, chili 1,764 no 30 52,920 52,920
3) Upgrading of DEC and construction of collecting centre 86,000 0 0 86,000i) Upgrading of DEC 86,000 0 0 86,000
- Dambulla at DA Matale 1 LS 64,000 64,000 Cold storage etc.
- Thambuttegama at Anuradapura 1 LS 22,000 22,000 Canopy, road etc
4) Rural road and farm access road rehabilitation 200,479 0 0 200,479- Improvement of access roads to market 27.0 km 4,851 130,972 130,972- Improvement of farm roads 109.0 km 638 69,507 69,507
5) Study tour 0 0 1,518 1,518- To potential impact countries 1 LS 858 858 858 3 weeks x 9 person/6
- To active export countries 1 LS 660 660 660 3 weeks x 9 person/6
2-3 Program on Enhancement of Extension Services and Ground Level Research (Agricultural Crop) 0 9,258 7,557 16,8151) Training to extension officers 0 1,617 1,617
i) Project Awareness 420 day 0.75 315 315588 day 1.00 588 588
ii) Best Practices in OFC Cultivation 126 day 1.00 126 126iii) Best Practices in Fruit Cultivation 126 day 1.00 126 126iv) Farm Business Management 210 day 1.00 210 210v) Exposure visits for experience sharing 126 day 2.00 252 252
2) Training facility improvement 0 9,258 0 9,258- Motor cycle 42 no 209.00 8,778 8,778- Personal computer 4 no 120 480 480
3) Overseas training 5,940 5,940- Overseas traing for OFCs 1 person 3,960 3,960 3,960 12 month- Overseas traing for fruit 1 person 1,980 1,980 1,980 6 month
127,3033. Livestock Product Promotion Program 22,906 68,616 35,782 127,303
3-1 Productivity Improvement Program of Semi-intensive and Intensive Farmer (Milk) 11,429 42,443 28,148 82,0201) Milk production improvement program 82,020
i) Feeding Project- Individual Fodder Development(Unit) 5 years 571 plot 20 11,429 11,429- Straw Bailing Unit 11 unit 2,673 30,553 30,553- Bio-mass Pelleting units 1 unit 5,347 6,111 6,111- Grass choppers 7 unit 650 4,457 4,457- Supply of seeds of pasture and legumes 9 pack 13 122 122 20 kg/pack
11,429 41,243 52,672
RemarksCivil works Equipment/ materialsAwareness/
Consulting/ TrainingTotalQ'ty Unit Unit Price
(Rs.1,000)
Amount (Rs.1,000)
ii) Farm management improvement
Sub-Total
COST BREAKDOWN for NORTH CENTRAL PROVINCE (NCP) (2/4)
No.Project
ComponentsInputs

C-44
Eligible Non-eligible Eligible Non-
eligible Eligible Non-eligible Eligible Non-
eligibleii) Breeding program
- Estrus Synchronization(head for 5years) 6,857 time 2 13,714 13,714- Artificial Insemination(times for 5 years) 28,571 time 1 14,286 14,286
0 28,000 28,000iii) Goad breeding program
- Goat breeding farm place 11 0 0- Breeding female goat head 11 0 0- Goat provision 400 head 3 1,200 1,200
1,200 1,200iv) Training for feeding improvement
- Production planning,financial management etc. 25 day 1.50 37 37- Awareness and utilization of crop residue 25 day 1.50 37 37- Technical training on products from crop residue 25 day 1.50 37 37- Improving nutritive quality of crop rsidue 25 day 1.50 37 37
148 148
3-2 Program on Market Development on Fresh Milk through Enhancement of Cooperative or Small and Medium Scale 0 19,077 6,020 25,0971) Milk marketing program 25,097
- Issuing Milk Canister 40L 29 no 15 427 427- Issuing Milk Canister 20L 343 no 7 2,397 2,397- Mobile Milk sale 1 unit 520 594 594- UHTmilk Processing 1 unit 13,367 13,367 13,367- Chilling Tank 1500 liters 1 no 2,005 2,292 2,292
0 19,077 19,0772) Training of milk production and market network improvement
- Clean milk production (1 day training) 4,725 time 1.2 5,670 5,670- O&M of UHT processing plant (3 day training) 42 time 3.0 126 126- Establishment of effective milk collection (3 day training 36 time 3.0 109 109- Market planning etc. (3 day training) 39 time 3.0 116 116
6,020 6,020
3-3 Livestock Service Quality and Accessibility Improvement Program (Milk) 11,477 7,096 1,614 20,1861) Improvement of cold chain for semen transport
- Liquid Nitrogen Tank 1 no 390 390 390- Semen canister (Big) 1 no 650 650 650- Semen canister (Middle) 1 no 78 89 89- AI kits 11 set 20.8 238 238
1,367 1,3672) Livestock Training Program 20,186
i) Training of trainers 480 time 3.0 1,439 1,439 See detailii) Training of input suppliers 117 time 1.5 175 175 See detail
1,614 1,614
Unit Unit Price(Rs.1,000)
Amount (Rs.1,000)
RemarksCivil works Equipment/ materialsAwareness/
Consulting/ TrainingTotalNo.
ProjectComponents
Inputs Q'ty
COST BREAKDOWN for NORTH CENTRAL PROVINCE (NCP) (3/4)
Sub-Total
Sub-Total
Sub-Total
Sub-Total
Sub-Total
Sub-Total
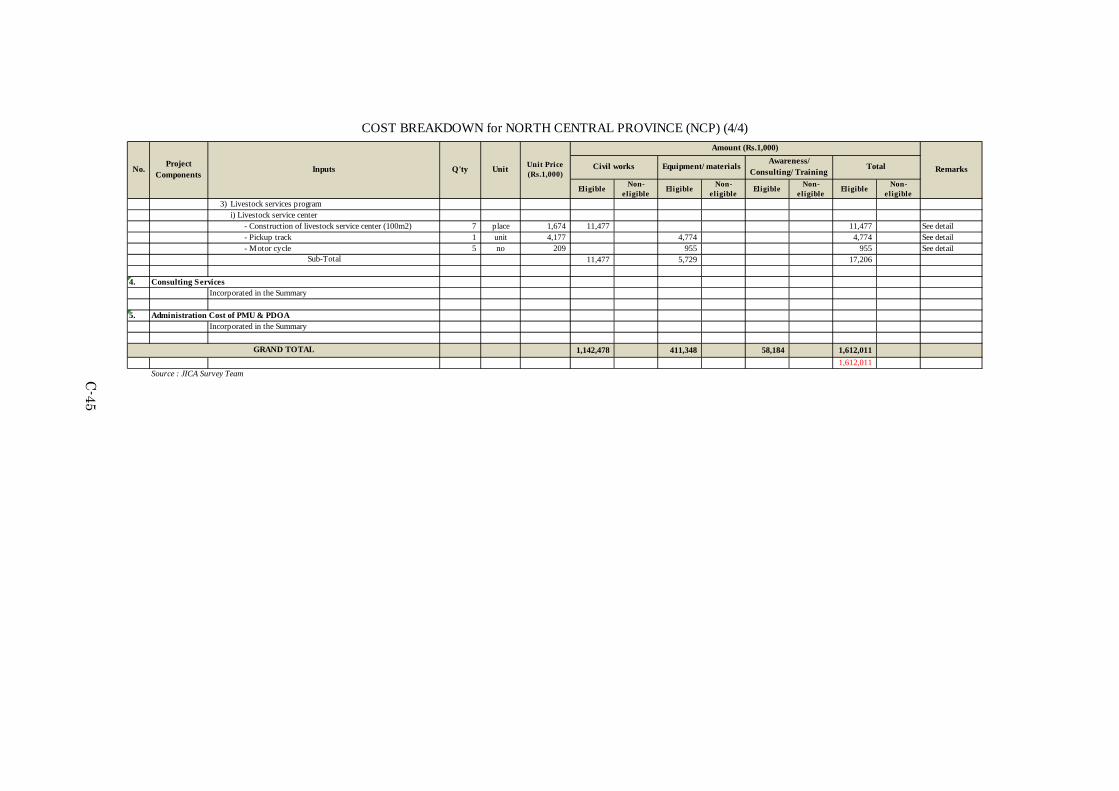
C-45
Eligible Non-eligible Eligible Non-
eligible Eligible Non-eligible Eligible Non-
eligible3) Livestock services program
i) Livestock service center- Construction of livestock service center (100m2) 7 place 1,674 11,477 11,477 See detail- Pickup track 1 unit 4,177 4,774 4,774 See detail- Motor cycle 5 no 209 955 955 See detail
11,477 5,729 17,206
4. Consulting Services Incorporated in the Summary
5. Administration Cost of PMU & PDOA Incorporated in the Summary
1,142,478 411,348 58,184 1,612,0111,612,011
Source : JICA Survey Team
RemarksCivil works Equipment/ materialsAwareness/
Consulting/ TrainingTotalQ'ty Unit Unit Price
(Rs.1,000)
Amount (Rs.1,000)
Sub-Total
GRAND TOTAL
COST BREAKDOWN for NORTH CENTRAL PROVINCE (NCP) (4/4)
No.Project
ComponentsInputs
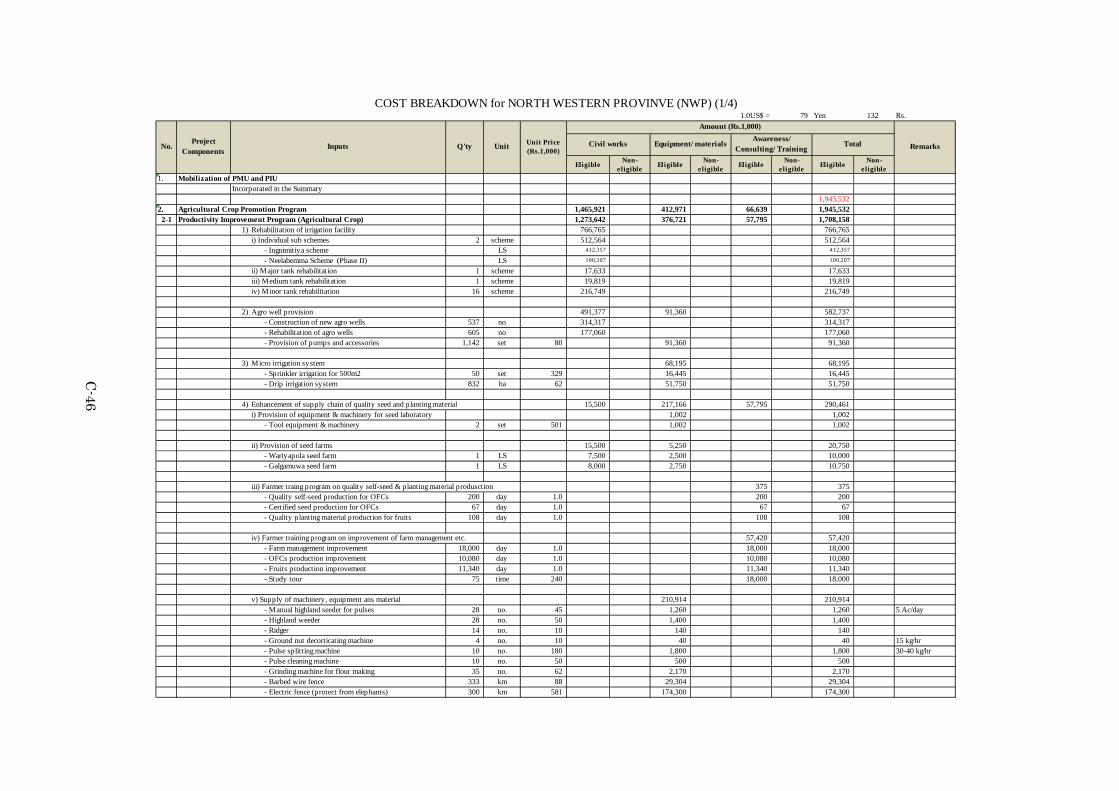
C-46
1.0US$ = 79 Yen 132 Rs.
Eligible Non-eligible Eligible Non-
eligible Eligible Non-eligible Eligible Non-
eligible1. Mobilization of PMU and PIU
Incorporated in the Summary1,945,532
2. Agricultural Crop Promotion Program 1,465,921 412,971 66,639 1,945,5322-1 Productivity Improvement Program (Agricultural Crop) 1,273,642 376,721 57,795 1,708,158
1) Rehabilitation of irrigation facility 766,765 766,765i) Individual sub schemes 2 scheme 512,564 512,564
- Ingnimitiya scheme LS 412,357 412,357
- Neelabemma Scheme (Phase II) LS 100,207 100,207
ii) Major tank rehabilitation 1 scheme 17,633 17,633iii) Medium tank rehabilitation 1 scheme 19,819 19,819iv) Minor tank rehabilitation 16 scheme 216,749 216,749
2) Agro well provision 491,377 91,360 582,737- Construction of new agro wells 537 no 314,317 314,317- Rehabilitation of agro wells 605 no 177,060 177,060- Provision of pumps and accessories 1,142 set 80 91,360 91,360
3) Micro irrigation system 68,195 68,195- Sprinkler irrigation for 500m2 50 set 329 16,445 16,445- Drip irrigation system 832 ha 62 51,750 51,750
4) Enhancement of supply chain of quality seed and planting material 15,500 217,166 57,795 290,461i) Provision of equipment & machinery for seed laboratory 1,002 1,002
- Tool equipment & machinery 2 set 501 1,002 1,002
ii) Provision of seed farms 15,500 5,250 20,750- Wariyapola seed farm 1 LS 7,500 2,500 10,000- Galgamuwa seed farm 1 LS 8,000 2,750 10,750
iii) Farmer traing program on quality self-seed & planting material produsction 375 375- Quality self-seed production for OFCs 200 day 1.0 200 200- Certified seed production for OFCs 67 day 1.0 67 67- Quality planting material production for fruits 108 day 1.0 108 108
iv) Farmer training program on improvement of farm management etc. 57,420 57,420- Farm management improvement 18,000 day 1.0 18,000 18,000- OFCs production improvement 10,080 day 1.0 10,080 10,080- Fruits production improvement 11,340 day 1.0 11,340 11,340- Study tour 75 time 240 18,000 18,000
v) Supply of machinery, equipment ans material 210,914 210,914- Manual highland seeder for pulses 28 no. 45 1,260 1,260 5 Ac/day- Highland weeder 28 no. 50 1,400 1,400- Ridger 14 no. 10 140 140- Ground nut decorticating machine 4 no. 10 40 40 15 kg/hr- Pulse splitting machine 10 no. 180 1,800 1,800 30-40 kg/hr- Pulse cleaning machine 10 no. 50 500 500- Grinding machine for flour making 35 no. 62 2,170 2,170- Barbed wire fence 333 km 88 29,304 29,304- Electric fence (protect from elephants) 300 km 581 174,300 174,300
RemarksCivil works Equipment/ materialsAwareness/
Consulting/ Training Total
COST BREAKDOWN for NORTH WESTERN PROVINVE (NWP) (1/4)
No.Project
Components Inputs Q'ty Unit Unit Price(Rs.1,000)
Amount (Rs.1,000)

C-47
Eligible Non-eligible Eligible Non-
eligible Eligible Non-eligible Eligible Non-
eligible2-2 Logistic System Improvement and Entrepreneurs Development Program (Agricultural Crop) 192,280 28,246 1,518 222,044
1) Established of proper interface and incubation 118,169 6,346 0 124,515i) Establishment of collecting points 118,169 6,346 0 124,515
- Facilities for collecting point 38 place 3,110 118,169 118,169- Equipment for collecting points 38 set 167 6,346 6,346
2) Improvement of farmers' storage facility 0 21,900 0 21,900- Renovation of farmers' storage, onion 240 no 30 7,200 7,200- Renovation of farmers' storage, chili 490 no 30 14,700 14,700
3) Upgrading of DEC and construction of collecting centrei) Upgrading of DEC
Not subject
4) Rural road and farm access road rehabilitation 74,111 0 0 74,111- Improvement of access roads to market 6.6 km 4,506 29,741 29,741- Improvement of farm roads 74.9 km 592 44,370 44,370
5) Study tour 0 0 1,518 1,518- To potential impact countries 1 LS 858 858 858 3 weeks x 9 person/6
- To active export countries 1 LS 660 660 660 3 weeks x 9 person/6
15,3302-3 Program on Enhancement of Extension Services and Ground Level Research (Agricultural Crop) 0 8,004 7,326 15,330
1) Training to extension officers 0 0 1,386 1,386i) Project Awareness 360 day 0.75 270 270
504 day 1.00 504 504ii) Best Practices in OFC Cultivation 108 day 1.00 108 108iii) Best Practices in Fruit Cultivation 108 day 1.00 108 108iv) Farm Business Management 180 day 1.00 180 180v) Exposure visits for experience sharing 108 day 2.00 216 216
2) Training facility improvement 0 8,004 0 8,004- Motor cycle 36 no 209.00 7,524 7,524- Personal computer 4 no 120 480 480
3) Overseas training 5,940 5,940- Overseas traing for OFCs 1 person 3,960 3,960 3,960 12 month- Overseas traing for fruit 1 person 1,980 1,980 1,980 6 month
297,6283. Livestock Product Promotion Program 49,549 127,377 120,703 297,628
3-1 Productivity Improvement Program of Semi-intensive and Intensive Farmer (Milk) 34,000 88,126 114,160 236,2861) Milk production improvement program 236,286
i) Feeding Project- Individual Fodder Development(Unit) 5 years 1,200 plot 20 24,000 24,000- Straw Bailing Unit 25 unit 2,673 66,835 66,835- Bio-mass Pelleting units 2 unit 5,347 10,694 10,694- Grass choppers 12 unit 650 7,800 7,800- Supply of seeds of pasture and legumes 18 pack 13 241 241 20 kg/pack
24,000 85,570 109,570
RemarksCivil works Equipment/ materials Awareness/Consulting/ Training TotalQ'ty Unit Unit Price
(Rs.1,000)
Amount (Rs.1,000)
ii) Farm management improvement
Sub-Total
COST BREAKDOWN for NORTH WESTERN PROVINVE (NWP) (2/4)
No. ProjectComponents
Inputs

C-48
Eligible Non-eligible Eligible Non-
eligible Eligible Non-eligible Eligible Non-
eligibleii) Breeding program
- Estrus Synchronization(head for 5years) 16,000 time 2 32,000 32,000- Artificial Insemination(times for 5 years) 66,800 time 1 33,400 33,400
0 65,400 65,400iii) Goat breeding program
- Goat breeding farm Thelahara 3,800 place 11 41,800 41,800- Breeding female goat Terahara 600 head 11 6,600 6,600- Provision & rehabilitation of facility for Thelahara 1 LS 10,000 10,000 10,000- Goat provision 852 head 3 2,556 2,556
10,000 2,556 48,400 60,956iv) Training for feeding improvement
- Production planning,financial management etc. 60 day 1.50 90 90- Awareness and utilization of crop residue 60 day 1.50 90 90- Technical training on products from crop residue 60 day 1.50 90 90- Improving nutritive quality of crop rsidue 60 day 1.50 90 90
360 360
3-2 Program on Market Development on Fresh Milk through Enhancement of Cooperative or Small and Medium Scale 0 27,536 5,160 32,6961) Milk marketing program 32,696
- Issuing Milk Canister 40L 50 no 15 748 748- Issuing Milk Canister 20L 900 no 7 6,291 6,291- Mobile Milk sale 6 unit 520 3,120 3,120- UHTmilk Processing 1 unit 13,367 13,367 13,367- Chilling Tank 1500 liters 2 no 2,005 4,010 4,010
0 27,536 27,5362) Training of milk production and market network improvement
- Clean milk production (1 day training) 4,050 time 1.2 4,860 4,860- O&M of UHT processing plant (3 day training) 36 time 3.0 108 108- Establishment of effective milk collection (3 day training) 31 time 3.0 93 93- Market planning etc. (3 day training) 33 time 3.0 99 99
5,160 5,160
3-3 Livestock Service Quality and Accessibility Improvement Program (Milk) 15,549 11,715 1,383 28,6471) Improvement of cold chain for semen transport
- Liquid Nitrogen Tank 1 no 390 390 390- Semen canister (Big) 1 no 650 650 650- Semen canister (Middle) 3 no 78 234 234- AI kits 20 set 20.8 416 416
1,690 1,6902) Livestock Training Program 28,647
i) Training of trainers 411 time 3.0 1,233 1,233 See detailii) Training of input suppliers 100 time 1.5 150 150 See detail
1,383 1,383
Unit Unit Price(Rs.1,000)
Amount (Rs.1,000)
RemarksCivil works Equipment/ materialsAwareness/
Consulting/ TrainingTotalNo.
ProjectComponents
Inputs Q'ty
COST BREAKDOWN for NORTH WESTERN PROVINVE (NWP) (3/4)
Sub-Total
Sub-Total
Sub-Total
Sub-Total
Sub-Total
Sub-Total
Sub-Total

C-49
Eligible Non-eligible Eligible Non-
eligible Eligible Non-eligible Eligible Non-
eligible3) Livestock services program
i) Livestock service center- Construction of livestock service center (100m2) 10 place 1,555 15,549 15,549 See detail- Pickup track 2 unit 4,177 8,354 8,354 See detail- Motor cycle 8 no 209 1,671 1,671 See detail
15,549 10,025 25,574
4. Consulting Services Incorporated in the Summary
5. Administration Cost of PMU & PDOA Incorporated in the Summary
1,515,470 540,348 187,342 2,243,1602,243,160
Source : JICA Survey Team
RemarksCivil works Equipment/ materialsAwareness/
Consulting/ TrainingTotalQ'ty Unit Unit Price
(Rs.1,000)
Amount (Rs.1,000)
Sub-Total
GRAND TOTAL
COST BREAKDOWN for NORTH WESTERN PROVINVE (NWP) (4/4)
No.Project
ComponentsInputs

C-50
1.0US$ = 79 Yen = 132 Rs.
Eligible Non-eligible Eligible Non-
eligible Eligible Non-eligible Eligible Non-
eligible1. Mobilization of PMU and PIU
Incorporated in the Summary1,021,124
2. Agricultural Crop Promotion Program 709,045 275,629 36,450 1,021,1242-1 Productivity Improvement Program (Agricultural Crop) 601,369 235,171 27,837 864,376
1) Rehabilitation of irrigation facility 72,464 72,464i) Individual sub schemes 0 schemeii) Major tank rehabilitation 0 scheme 0iii) Medium tank rehabilitation 2 scheme 4,415 4,415iv) Minor tank rehabilitation 8 scheme 68,049 68,049
651,6842) Agro well provision 522,404 129,280 651,684
- Construction of new agro wells 760 no 334,198 334,198- Rehabilitation of agro wells 856 no 188,206 188,206- Provision of pumps and accessories 1,616 set 80 129,280 129,280
51,7753) Micro irrigation system 51,775 51,775
- Sprinkler irrigation for 500m2 50 set 329 16,445 16,445- Drip irrigation system 568 ha 62 35,330 35,330
88,4534) Enhancement of supply chain of quality seed and planting material 6,500 54,116 27,837 88,453
i) Provision of equipment & machinery for seed laboratory 501 501- Tool equipment & machinery 1 set 501 501 501
ii) Provision of seed farms 6,500 4,750 11,250- Okkampitiya farm 1 LS 6,500 4,750 11,250 see detail
iii) Farmer traing program on quality self-seed & planting material produsction 297 297- Quality self-seed production for OFCs 179 day 1.0 179 179- Certified seed production for OFCs 60 day 1.0 60 60- Quality planting material production for fruits 58 day 1.0 58 58
iv) Farmer training program on improvement of farm management etc. 27,540 27,540- Farm management improvement 9,360 day 1.0 9,360 9,360- OFCs production improvement 7,560 day 1.0 7,560 7,560- Fruits production improvement 1,260 day 1.0 1,260 1,260- Study tour 39 time 240 9,360 9,360
v) Supply of machinery, equipment ans material 48,865 48,865- Manual highland seeder for pulses 5 no. 45 225 225 5 Ac/day- Highland weeder 5 no. 50 250 250- Ridger 2 no. 10 20 20- Ground nut decorticating machine 1 no. 10 10 10 15 kg/hr- Pulse splitting machine 2 no. 180 360 360 30-40 kg/hr- Pulse cleaning machine 2 no. 50 100 100- Grinding machine for flour making 33 no. 62 2,046 2,046- Barbed wire fence 323 km 88 28,424 28,424- Electric fence (protect from elephants) 30 km 581 17,430 17,430
RemarksCivil works Equipment/ materialsAwareness/
Consulting/ TrainingTotal
COST BREAKDOWN for UVA PROVINCE (1/4)
No.Project
Components Inputs Q'ty Unit Unit Price(Rs.1,000)
Amount (Rs.1,000)
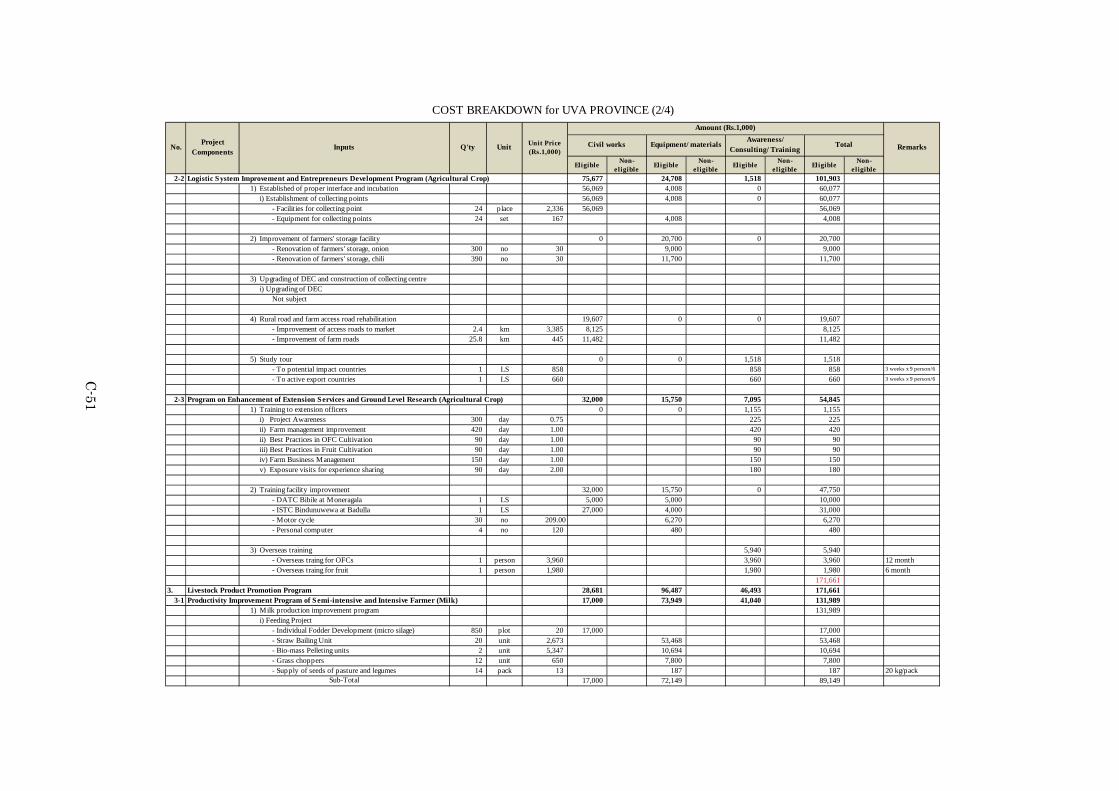
C-51
Eligible Non-eligible Eligible Non-
eligible Eligible Non-eligible Eligible Non-
eligible2-2 Logistic System Improvement and Entrepreneurs Development Program (Agricultural Crop) 75,677 24,708 1,518 101,903
1) Established of proper interface and incubation 56,069 4,008 0 60,077i) Establishment of collecting points 56,069 4,008 0 60,077
- Facilities for collecting point 24 place 2,336 56,069 56,069- Equipment for collecting points 24 set 167 4,008 4,008
2) Improvement of farmers' storage facility 0 20,700 0 20,700- Renovation of farmers' storage, onion 300 no 30 9,000 9,000- Renovation of farmers' storage, chili 390 no 30 11,700 11,700
3) Upgrading of DEC and construction of collecting centrei) Upgrading of DEC
Not subject
4) Rural road and farm access road rehabilitation 19,607 0 0 19,607- Improvement of access roads to market 2.4 km 3,385 8,125 8,125- Improvement of farm roads 25.8 km 445 11,482 11,482
5) Study tour 0 0 1,518 1,518- To potential impact countries 1 LS 858 858 858 3 weeks x 9 person/6
- To active export countries 1 LS 660 660 660 3 weeks x 9 person/6
2-3 Program on Enhancement of Extension Services and Ground Level Research (Agricultural Crop) 32,000 15,750 7,095 54,8451) Training to extension officers 0 0 1,155 1,155
i) Project Awareness 300 day 0.75 225 225420 day 1.00 420 420
ii) Best Practices in OFC Cultivation 90 day 1.00 90 90iii) Best Practices in Fruit Cultivation 90 day 1.00 90 90iv) Farm Business Management 150 day 1.00 150 150v) Exposure visits for experience sharing 90 day 2.00 180 180
2) Training facility improvement 32,000 15,750 0 47,750- DATC Bibile at Moneragala 1 LS 5,000 5,000 10,000- ISTC Bindunuwewa at Badulla 1 LS 27,000 4,000 31,000- Motor cycle 30 no 209.00 6,270 6,270- Personal computer 4 no 120 480 480
3) Overseas training 5,940 5,940- Overseas traing for OFCs 1 person 3,960 3,960 3,960 12 month- Overseas traing for fruit 1 person 1,980 1,980 1,980 6 month
171,6613. Livestock Product Promotion Program 28,681 96,487 46,493 171,661
3-1 Productivity Improvement Program of Semi-intensive and Intensive Farmer (Milk) 17,000 73,949 41,040 131,9891) Milk production improvement program 131,989
i) Feeding Project- Individual Fodder Development (micro silage) 850 plot 20 17,000 17,000- Straw Bailing Unit 20 unit 2,673 53,468 53,468- Bio-mass Pelleting units 2 unit 5,347 10,694 10,694- Grass choppers 12 unit 650 7,800 7,800- Supply of seeds of pasture and legumes 14 pack 13 187 187 20 kg/pack
17,000 72,149 89,149
Amount (Rs.1,000)
RemarksCivil works Equipment/ materialsAwareness/
Consulting/ TrainingTotal
COST BREAKDOWN for UVA PROVINCE (2/4)
No.Project
ComponentsInputs Q'ty Unit Unit Price
(Rs.1,000)
ii) Farm management improvement
Sub-Total

C-52
Eligible Non-eligible Eligible Non-
eligible Eligible Non-eligible Eligible Non-
eligibleii) Breeding program
- Estrus Synchronization(head for 5years) 10,000 time 2 20,000 20,000- Artificial Insemination(times for 5 years) 41,600 time 1 20,800 20,800
0 40,800 40,800iii) Goad breeding program
- Goat breeding farm place 11 0 0- Breeding female goat head 11 0 0- Goat provision 600 head 3 1,800 1,800
1,800 1,800iv) Training for feeding improvement
- Production planning,financial management etc. 40 day 1.50 60 60- Awareness and utilization of crop residue 40 day 1.50 60 60- Technical training on products from crop residue 40 day 1.50 60 60- Improving nutritive quality of crop rsidue 40 day 1.50 60 60
240 240
3-2 Program on Market Development on Fresh Milk through Enhancement of Cooperative or Small and Medium Scale 0 11,032 4,300 15,3321) Milk marketing program
- Issuing Milk Canister 40L 50 no 15 748 748- Issuing Milk Canister 20L 600 no 7 4,194 4,194- Mobile Milk sale 4 unit 520 2,080 2,080- UHTmilk Processing 0 unit 13,367 0 0- Chilling Tank 1500 liters 2 no 2,005 4,010 4,010
0 11,032 11,0322) Training of milk production and market network improvement
- Clean milk production (1 day training) 3,375 time 1.2 4,050 4,050- O&M of UHT processing plant (3 day training) 30 time 3.0 90 90- Establishment of effective milk collection (3 day training) 26 time 3.0 78 78- Market planning etc. (3 day training) 28 time 3.0 83 83
4,300 4,300
3-3 Livestock Service Quality and Accessibility Improvement Program (Milk) 11,681 11,506 1,153 24,3401) Improvement of cold chain for semen transport
- Liquid Nitrogen Tank 1 no 390 390 390- Semen canister (Big) 1 no 650 650 650- Semen canister (Middle) 3 no 78 234 234- AI kits 20 set 20.8 416 416
1,690 1,6902) Livestock Training Program 24,340
i) Training of trainers 343 time 3.0 1,028 1,028ii) Training of input suppliers 83 time 1.5 125 125
1,153 1,153
RemarksCivil works Equipment/ materialsAwareness/
Consulting/ TrainingTotalQ'ty Unit Unit Price
(Rs.1,000)
Amount (Rs.1,000)
Sub-Total
Sub-Total
Sub-Total
Sub-Total
Sub-Total
Sub-Total
Sub-Total
COST BREAKDOWN for UVA PROVINCE (3/4)
No.Project
ComponentsInputs

C-53
Eligible Non-eligible Eligible Non-
eligible Eligible Non-eligible Eligible Non-
eligible3) Livestock services program
i) Livestock service center- Construction of livestock service center (100m2) 10 place 1,168 11,681 11,681- Pickup track 2 unit 4,177 8,354 8,354- Motor cycle 7 no 209 1,462 1,462
11,681 9,816 21,498
4. Consulting Services Incorporated in the Summary
5. Administration Cost of PMU & PDOA Incorporated in the Summary
737,726 372,116 82,943 1,192,7851,192,785
Source : JICA Survey Team
Unit Unit Price(Rs.1,000)
Amount (Rs.1,000)
RemarksCivil works Equipment/ materialsAwareness/
Consulting/ TrainingTotalNo.
ProjectComponents
Inputs Q'ty
COST BREAKDOWN for UVA PROVINCE (4/4)
GRAND TOTAL
Sub-Total

C-54
1.0US$ = 79 Yen 132 Rs.
Eligible Non-e ligible Eligible Non-
eligible Eligible Non-eligible Eligible Non-
eligible1. Mobilization of PMU and PIU
Incorporated in the Summary646,947
2. Agricultural Crop Promotion Program 519,495 115,244 12,209 646,9472-1 Productivity Improvement Program (Agricultural Crop) 414,576 80,017 9,998 504,591
1) Rehabilitation of irrigation facility 375,827 0 0 375,827i) Individual sub schemes 1 scheme
- Mahaweli System H scheme LS 375,827 375,827ii) Major tank rehabilitation scheme 0iii) Medium tank rehabilitation scheme 0iv) Minor tank rehabilitation scheme 0
2) Agro well provision 38,750 6,640 45,390- Construction of new agro wells 40 no 25,203 25,203- Rehabilitation of agro wells 43 no 13,547 13,547- Provision of pumps and accessories 83 set 80 6,640 6,640
3) Micro irrigation system 13,837 13,837- Sprinkler irrigation for 500m2 12 set 329 3,947 3,947- Drip irrigation system 159 ha 62 9,890 9,890
4) Enhancement of supply chain of quality seed and planting material 59,540 9,998 69,538i) Provision of equipment & machinery for seed laboratory 0 0
- Tool equipment & machinery set 501 0 0
ii) Provision of seed farmsNot subject
iii) Farmer traing program on quality self-seed & planting material produsction 692 692- Quality self-seed production for OFCs 503 day 1.0 503 503- Certified seed production for OFCs 168 day 1.0 168 168- Quality planting material production for fruits 21 day 1.0 21 21
iv) Farmer training program on improvement of farm management etc. 9,306 9,306- Farm management improvement 2,728 day 1.0 2,728 2,728- OFCs production improvement 928 day 1.0 928 928- Fruits production improvement 2,921 day 1.0 2,921 2,921- Study tour 11 time 240 2,728 2,728
v) Supply of machinery, equipment ans material 59,540 59,540- Manual highland seeder for pulses 69 no. 45 3,105 3,105 5 Ac/day- Highland weeder 69 no. 50 3,450 3,450- Ridger 35 no. 10 350 350- Ground nut decorticating machine 10 no. 10 100 100 15 kg/hr- Pulse splitting machine 25 no. 180 4,500 4,500 30-40 kg/hr- Pulse cleaning machine 25 no. 50 1,250 1,250- Grinding machine for flour making 55 no. 62 3,410 3,410- Barbed wire fence 209 km 88 18,392 18,392- Electric fence (protect from elephants) 43 km 581 24,983 24,983
RemarksCivil works Equipment/ materialsAwareness/
Consulting/ TrainingTotal
COST BREAKDOWN for MAHAWELI SYSTEM H (1/4)
No.Project
ComponentsInputs Q'ty Unit Unit Price
(Rs.1,000)
Amount (Rs.1,000)
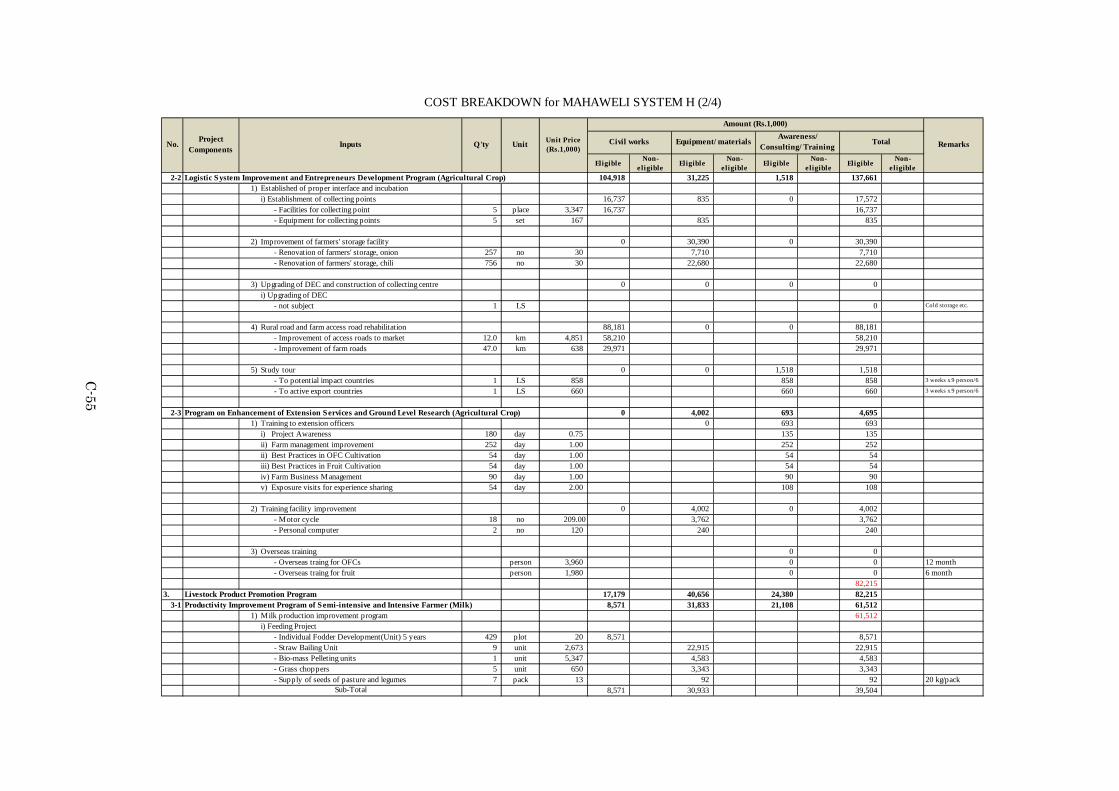
C-55
Eligible Non-e ligible Eligible Non-
eligible Eligible Non-eligible Eligible Non-
eligible2-2 Logistic System Improvement and Entrepreneurs Development Program (Agricultural Crop) 104,918 31,225 1,518 137,661
1) Established of proper interface and incubationi) Establishment of collecting points 16,737 835 0 17,572
- Facilities for collecting point 5 place 3,347 16,737 16,737- Equipment for collecting points 5 set 167 835 835
2) Improvement of farmers' storage facility 0 30,390 0 30,390- Renovation of farmers' storage, onion 257 no 30 7,710 7,710- Renovation of farmers' storage, chili 756 no 30 22,680 22,680
3) Upgrading of DEC and construction of collecting centre 0 0 0 0i) Upgrading of DEC
- not subject 1 LS 0 Cold storage etc.
4) Rural road and farm access road rehabilitation 88,181 0 0 88,181- Improvement of access roads to market 12.0 km 4,851 58,210 58,210- Improvement of farm roads 47.0 km 638 29,971 29,971
5) Study tour 0 0 1,518 1,518- To potential impact countries 1 LS 858 858 858 3 weeks x 9 person/6
- To active export countries 1 LS 660 660 660 3 weeks x 9 person/6
2-3 Program on Enhancement of Extension Services and Ground Level Research (Agricultural Crop) 0 4,002 693 4,6951) Training to extension officers 0 693 693
i) Project Awareness 180 day 0.75 135 135252 day 1.00 252 252
ii) Best Practices in OFC Cultivation 54 day 1.00 54 54iii) Best Practices in Fruit Cultivation 54 day 1.00 54 54iv) Farm Business Management 90 day 1.00 90 90v) Exposure visits for experience sharing 54 day 2.00 108 108
2) Training facility improvement 0 4,002 0 4,002- Motor cycle 18 no 209.00 3,762 3,762- Personal computer 2 no 120 240 240
3) Overseas training 0 0- Overseas traing for OFCs person 3,960 0 0 12 month- Overseas traing for fruit person 1,980 0 0 6 month
82,2153. Livestock Product Promotion Program 17,179 40,656 24,380 82,215
3-1 Productivity Improvement Program of Semi-intensive and Intensive Farmer (Milk) 8,571 31,833 21,108 61,5121) Milk production improvement program 61,512
i) Feeding Project- Individual Fodder Development(Unit) 5 years 429 plot 20 8,571 8,571- Straw Bailing Unit 9 unit 2,673 22,915 22,915- Bio-mass Pelleting units 1 unit 5,347 4,583 4,583- Grass choppers 5 unit 650 3,343 3,343- Supply of seeds of pasture and legumes 7 pack 13 92 92 20 kg/pack
8,571 30,933 39,504
Q'ty Unit Unit Price(Rs.1,000)
Amount (Rs.1,000)
RemarksCivil works Equipment/ materialsAwareness/
Consulting/ TrainingTotal
COST BREAKDOWN for MAHAWELI SYSTEM H (2/4)
No.Project
ComponentsInputs
ii) Farm management improvement
Sub-Total

C-56
Eligible Non-e ligible Eligible Non-
eligible Eligible Non-eligible Eligible Non-
eligibleii) Breeding program
- Estrus Synchronization(head for 5years) 5,143 time 2 10,286 10,286- Artificial Insemination(times for 5 years) 21,429 time 1 10,714 10,714
0 21,000 21,000iii) Goad breeding program
- Goat breeding farm place 11 0 0- Breeding female goat head 11 0 0- Goat provision 300 head 3 900 900
900 900iv) Training for feeding improvement
- Production planning,financial management etc. 18 day 1.50 27 27- Awareness and utilization of crop residue 18 day 1.50 27 27- Technical training on products from crop residue 18 day 1.50 27 27- Improving nutritive quality of crop rsidue 18 day 1.50 27 27
108 108
3-2 Program on Market Development on Fresh Milk through Enhancement of Cooperative or Small and Medium Scale 0 4,282 2,580 6,8621) Milk marketing program 6,862
- Issuing Milk Canister 40L 21 no 15 320 320- Issuing Milk Canister 20L 257 no 7 1,797 1,797- Mobile Milk sale 1 unit 520 446 446- UHTmilk Processing unit 13,367 0 0- Chilling Tank 1500 liters 1 no 2,005 1,719 1,719
0 4,282 4,2822) Training of milk production and market network improvement
- Clean milk production (1 day training) 2,025 time 1.2 2,430 2,430- O&M of UHT processing plant (3 day training) 18 time 3.0 54 54- Establishment of effective milk collection (3 day training 16 time 3.0 47 47- Market planning etc. (3 day training) 17 time 3.0 50 50
2,580 2,580
3-3 Livestock Service Quality and Accessibility Improvement Program (Milk) 8,608 4,542 692 13,8411) Improvement of cold chain for semen transport
- Liquid Nitrogen Tank no 390 0 0- Semen canister (Big) no 650 0 0- Semen canister (Middle) 1 no 78 67 67- AI kits 9 set 20.8 178 178
245 2452) Livestock Training Program 13,841
i) Training of trainers 206 time 3.0 617 617 See detailii) Training of input suppliers 50 time 1.5 75 75 See detail
692 692
RemarksCivil works Equipment/ materialsAwareness/
Consulting/ TrainingTotalQ'ty Unit Unit Price
(Rs.1,000)
Amount (Rs.1,000)
Sub-Total
Sub-Total
Sub-Total
Sub-Total
Sub-Total
Sub-Total
COST BREAKDOWN for MAHAWELI SYSTEM H (3/4)
No.Project
ComponentsInputs

C-57
Eligible Non-e ligible Eligible Non-
eligible Eligible Non-eligible Eligible Non-
eligible3) Livestock services program
i) Livestock service center- Construction of livestock service center (100m2) 5 place 1,674 8,608 8,608 See detail- Pickup track 1 unit 4,177 3,580 3,580 See detail- Motor cycle 3 no 209 716 716 See detail
8,608 4,297 12,904
4. Consulting Services Incorporated in the Summary
5. Administration Cost of PMU & PDOA Incorporated in the Summary
536,674 155,900 36,588 729,162729,162
Source : JICA Survey Team
Unit Unit Price(Rs.1,000)
Amount (Rs.1,000)
RemarksCivil works Equipment/ materialsAwareness/
Consulting/ TrainingTotalNo.
ProjectComponents
Inputs Q'ty
COST BREAKDOWN for MAHAWELI SYSTEM H (4/4)
Sub-Total
GRAND TOTAL

C-58
1.0US$ = 79 Yen = 132 Rs.
Eligible Non-eligible Eligible Non-eligible Eligible Non-eligible Eligible Non-eligible1. Mobilization of PMU and PIUs 0 175,571 0 175,571
Mobilization of PMU and PIUs1) Vehicle and equipment 0 154,056 0 154,056
- 4WD Vehicles 1 no 7,017.72 7,018 7,018 CIF excluding tax- 4WD pickup truck 24 no 5,012.66 120,304 120,304 CIF excluding tax- Motorcycles 80 no 334.18 26,734 26,734 CIF excluding tax
2) Office equipment 0 21,515 0 21,515- Desktop computer & software 48 set 100.00 4,800 4,800- Laptop computer & software 18 set 140.00 2,520 2,520- Laser printer (A4/A3) 12 no 125.00 1,500 1,500- Ink jet printer (A4/A3) 6 no 38.00 228 228- GIS software (arc view with spatial and network analysis 1 no 405.00 405 405- Photo copy machine 12 no 600.00 7,200 7,200- UPS (1000VA) 48 no 12.00 576 576- A0 plotter 5 no 400.00 2,000 2,000- GPS 12 no 68.00 816 816- Digital video Camera 6 no 100.00 600 600- Digital camera 12 no 30.00 360 360- Projector 6 no 85.00 510 510
4. Consulting Services (Tentative estimate) 2,461,536 2,461,5361) Remuneration and salary
i) Professional A 479,043 479,043ii) Professional B 690,550 690,550iii) Sub professional & supporting staff 747,760 747,760
1,917,353 1,917,3532) Direct cost 544,183 544,183
544,183 544,183
5. Administration Cost of PMU & PDOA (Tentative estimate) 566,700 566,700
1) Personnel cost - officers 3,888 men-month 75.00 291,600 291,60054 officers x 12 monthsx 6 years
2) Personnel cost - supporting staff 3,888 men-month 50.00 194,400 194,400 54 staff x 12 x 6
3) Monitoring and survey 1 LS 6,000.00 6,000 6,000For environment,Rs.500,000x12times
4) Operation and maintenance of vehicles / motor cycles 72 month 430.00 30,960 30,960 Fuel, oil, tyres servicesetc.
5) Office maintenance 72 month 270.00 19,440 19,440Communication, electric& water charges etc
6) Consumables and others 1 LS 24,300.00 24,300 24,300 5% of 1) & 2)0
Source : JICA Survey Team
COST BREAKDOWN OF MOBILIZATION, CONSULTING SERVICES AND ADMINISTRATION
No.Project
ComponentsInputs Q'ty Unit
Unit Price(Rs.1,000)
Amount (Rs.1,000)
Sub-Total
Sub-Total
Sub-Total
RemarksCivil works Equipment/ materialsAwareness/
Consulting/ TrainingTotal
2.2.3 C
ost of PMU
& PIU
s, Consulting Services and A
dministration

C-59
Civil EquipmentTraining Facilities Construction of Irrigation system ( a pump & 1 kmdistribution system &
micro irrigation for seed production)Set 1 2.00 2.00
Rehabilitation of storage facilities Sq.m 300 0.01 3.00 Provision of farm Machinery (Tractor, seeders, weeders etc.) Set 1 3.00 3.00 Integrated farmining demonstration units - New item No 1 2.00 2.00
Sub - Total 5.00 5.00 Construction of accommodation building for trainies LS 1 58.00 Construction of a well and internal water distibution lines Item 1 1.50 1.50 Development of demonstration plots with micro irrigation and fencingarrangemen - Demonstration plots with micro irrigation Ha 5 0.50 2.50 - Fencing km 3 1.00 3.00
Provision of mini van for transportation of trainees No 1 10.00 10.00
Provision of Training facilities Lot 1 1.00 1.00 Sub - Total 65.00 11.00
Provincial Seed Farms Irrigation canal Rehabilitation uner Okkampitiya Irri. System km 1.5 2.50 3.75 Construction of agro wells with water pump ( instead of regulator pond) No 2 0.50 1.00 Provision of sprinkler and drip irrigation kits Ha 3 0.50 1.50 Rehabilitation of storage facilities Sq m 70 0.03 1.75 Provision of basic farm Machinery - New Item Set 1 2.50 2.50 Provision of OFC seed processing machine - New item No 1 0.25 0.25 Provision of multipurpose OFC seeder - New item No 1 0.50 0.50
Sub - Total 8.00 3.25 Kurunegala Repairs & Capacity improvement to exist. Minor tank No 1 3.00 3.00
Rehab. of agro wells and provision of micro irrigation facilitie Ha 3 0.50 1.50 Const. of green and net houses Sq. m 1250 0.00 1.50 Reha. Storage facilities with cooling facilities Sq.M 30 0.05 1.50 Basic machinery for land preperation (tractor & implements set 1 2.50 2.50
Sub - Total 7.50 2.50 Kurunegala Establishment of irrigation system within the farm (2' pipe line) Ha 3 0.50 1.50
Assure water supply providing small canal from neareby irrigation tank km 1 - - Provision of fence km 4 1.00 4.00 Const. of green and net houses sq.m 1250 0.00 1.50 Basic machinery for land preperation Set 1 2.50 2.50 Provision of Water pump & accessories (high capacity) Set 1 0.25 0.25 Rehabilitation of Farm Manager Quarters - New Item No 1 1.00 1.00
Sub - Total 8.00 2.75 Vaunia Farm Vavuniya Provission of 3 Ph. Electricity Item allow 2.50
Provision of sprinkler and drip irrigation kits Ha 6 0.50 3.00 Basic machinery for land preperation Set 1 3.00 3.00 Deepening existing wells and construct several deep wells Item allow 3.75 - Deepening existing wells NoConstruct Deep wells with pumping unit No 3 0.50 1.50 Provision of water pumps for existing wells No 5 0.10 0.50
Sub - Total 7.75 6.50 Kantale Farm Trincomalee Provision of water pumps No 2 0.10 0.20
Provision of agro wells No 2 0.50 1.00 Provision of sprinkler and drip irrigation kits Ha 5 0.50 2.50
Sub - Total 1.00 2.70 Dambulla Matale Construction of cold storage Set 1 50.00 50.00
Construction of 48 new stalls for export marketing ( 14 Noscorrected as 48 Nos)
Nos 14 1.00 14.00
Sub - Total 64.00 - Thambuttegama Anuradhapura Construction of canopy Sq.m 500 0.04 20.00
Rehabilitation of Internal Roads Km 1 1.00 1.00 Construction of toilet facilities unit 5 0.20 1.00
Sub - Total 22.00 - Grand Total 188.25 33.70
Cost Breakdown of Government Building & Facilities
Type of Facilities Name of Facility District Work Item Unit QtyUnit Rate
(M.Rs)Amount (M.Rs)
Wariyapola SeedFarm
Galgamuwa SeedFarm
Dedicated EconomicCenter
DATC Bibile
ISTCBindunuwewa
Moneragala
Badulla
Okkampitiya Farm,Moneragala
Moneragala
2.2.4 Cost Breakdown of Government Building and Facilities

C-60
2.3 Cost for Irrigation Schemes
(1) Individual schemes
Description of Individual Schemes Name of sub
scheme District DS
Division Project feature Rehabilitation
Mahaweli System H Rehabilitation scheme
Anuradhapura Kurunegala
7 DSs Galgamuwa
Total farm area of System H : 39,900 ha About target area by the Project: Kalawewa reservoir capacity. : 123 MCM Command area: 25,360 ha RB canal : 50 km LB canal : 22 km Kalawewa Yoda Ela : 25.3 Kalawewa Goda Ela :3.7 km Balalu wewa Goda Ela : 2.1 km
Rehabilitation of damaged canal sections and structures in RB & LB main canals and improvement of head works and canal systems of 62 minor
Improvements to Ingnimitiya scheme
Puttalam Anamaduwa
Tank capacity : 72.6 MCM Command area : 2,643 ha. RB Main Canal : 21 km RB D Canal : 12 km RB Field Canal : 45 km LB Main Canal : 23 km LD D Canal : 14 km LB Field Canal : 49 km
Rehabilitation of 44 km of Main Canals, 26 km of D Canals and 94 km of Field Canals
Neelabemma Scheme (Phase I: Existing)
Puttalam Karuwalagaswewa
Tank capacity : N.A.(Anicut) Command area : 860 ha (Phase I) LB Feeder Canal : 12 km
Improvement of 12 km of Feeder canal and canal system under Kudaottupallama tank.
Kurai Tank augmentation and Parangi aru development Project
Manthai West
Murunkan
Kurai Tank Tank Capacity : Present – 2.5 MCM, Proposed – 4.0 MCM Command Area: 700 ha. RB & LB Main Canals : 6.0 kmProp. Upper LB Main Canal : 6.0 kmRB & LB Feeder Canals : 14.0 km Feeder Tanks : 28 Nos Field canals : 50.0 kmParangi Aru Anicut & Feeder CanalAnicut: Length – 55 m., Max. ht. – 3 m. Head Sluice: 4.5 m x 1.5 m Radial Gate Inlet Canal : 100 m, Feeder Canal – 7.5 km
Kurai Tank Augmentation of tank by raising 70 cm of tank bund & 75cm of spillway crest and improving of 3 sluices. Improvement or construction of 12 km of main canals, 14 km of feeder canals, 28 Nos feeder tanks and 50 km of field canals. Parangi Aru Anicut & Feeder Canal Construction of new anicut and 7.5 km supply canal for diversion water to Kurai tank.
Rehabilitation of Welimaruthamadu Irrigation scheme (Pallamadu GND)
Mannar Manthai West
Tank capacity : 3.4 MCM Command area : Present - 304 ha, Proposed - 726 ha RB & LB Main Canals : 2.0 km RB & LB Feeder Canals : 14.0 km Field Tanks : 15 Nos Field Canal : 40 km.
Rehabilitation of tank bund, 2 sluices and a spillway. Improvement or re-construction of 2 km of main canals, 14 km of feeder canals and 15 Nos feeder tanks.
Rehabilitation of Muthayank
Mullaitivue Oddusudan
Tank Capacity : 50.6 MCM Command Area : 2,468 ha. Main Canal : RB - 20.8 km, LB –
Rehabilitation of head works including strengthening of tank bund and repair and

C-61
Name of sub scheme
District DS Division
Project feature Rehabilitation
addu Tank Lift Irrigation Scheme
22.8 km RB Br. canal : 1.6 km RB & LB D Canal : 20.5 km RB & LB Field Canal : 173.6 km
reconditioning of two spill radial gates and two sluices. Rehabilitation of 43.6 km of Main Canals, 1.6 km of Branch Canals, 20.5 km of D Canals and 173.6 km of Field Canals Construction & reconstruction of 18 (13 for RB & 5 for LB) pumping stations for lift irrigation including supply of 24 water pumps and construction of 17 pump houses, 13,240 m of rising mains and 32.8 km of concrete lined irrigation canals
Rehabilitation of Vavunikulam Tank - Right & Left Banks Lift Irrigation System
Mullaitivue
Monthai East
Tank capacity : 43.5 MCM Command Area : 2,790 ha. Main Canal : RB - 19.6 km, LB – 11.4 km, RB Br. canal : 2.4 km RB & LB D Canal : 34.1 km RB & LB Field Canal : 81.9 km
Construction & reconstruction of 10 (6 for RB & 4 for LB) pumping stations for lift irrigation including supply of 17 water pumps and construction of 8 pump houses, 11,900 m of rising mains and 41.0 km of concrete lined irrigation canals
Source : JICA Survey Team and JBIS Pilot Study on Agricultural and Rural Rehabilitation in the North East and North Central Region of Sri Lanka, Final Report Supporting (1), Short Listed Scheme Outline, May 2004

C-62
Item No : BC/IS-01Scheme : Neelabemma Scheme-Improvement of Sub-System (Phase-I:Existing)Province : Northern West ProvinceDistrict : PuttalamDS Division : Navagathegama
No. Unit Unit Price (Rs) Q'ty Amount (Rs) Remarks Ref. No
1. Tank bund regabilitation1.1 Site clearing ha 0 UP-11.2 Clearing of top soil m3 117 0 UP-21.3 Excavation & backfilling m3 730 0 UP-51.4 Other works LS 0
0
2. Canal rehabilitation2.1 Concrete lining for field canal m 12,639 4,800 60,667,200 12km x 50% UP-92.2 Inprovement feeder canal m 2,665 3,000 7,995,000 UP-72.3 Improvement of related structures in MC and field canal ha 86,492 180 15,568,524 (UP-11 & UP-12 / 10ha) UP-11/UP-122.4 Other works LS 1 6,866,220 10% of sum of 2
91,096,944
3. Miscellaneous Works LS 1 9,109,694 10% of 1+2
100,206,638100,207,000 per scheme
sub-total
Total
Breakdown of Cost for Individual Scheme
Description of Works
sub-total
Round
Item No : BC/IS-02Scheme : Rehabilitation of Welimaruthamadhu TankProvince : Northern ProvinceDistrict : MannarDS Division : Manthai West
No. Unit Unit Price (Rs) Q'ty Amount (Rs) Remarks Ref. No
1. Tank rehabilitation1.1 Rip rap protection for tank m3 450 2,500 1,125,000 1000m UP-3-11.2 Spill rehabilitation (reforcement concrete) m3 36,807 270 9,937,821 160m long UP-81.3 Restoration of sluice LS 1 5,000,0001.4 Other works LS 1 3,212,564 20% of sum of 1 NP-08
19,275,385
2. Canal rehabilitation2.1 Concrete lining for supply canal m 12,780 3,200 40,896,000 UP-092.2 Gravel bedding for road m 599 3,200 1,916,800 UP-42.3 Improvement of related structures in MC and field canal nos 437,286 16 6,996,576 (UP-11 & UP-12 / 0.2 km) UP-11/UP-122.4 Inprovement feeder canal m 2,665 7,500 19,987,500 50% of proposal2.5 Other works LS 1 2,140,640 5% of sum of 2
71,937,5163. Minor tank rehabilitation
Type Tmi-H no 2,097,219 15 31,458,280 NP-01Miscellaneous Works LS 1 1,572,914 5% of 3
33,031,194
124,244,094124,244,000 per schemeRound
Breakdown of Cost for Individual Scheme
Description of Works
sub-total
Total
sub-total
sub-total

C-63
Item No : BC/IS-03Scheme : Kurai Tank Augmentation and Parangi Aru Development ProjectProvince : Northern ProvinceDistrict : MannarDS Division : Manthai West
No. Unit Unit Price (Rs) Q'ty Amount (Rs) Remarks Ref. No
1. Kurai Tank rehabilitation1.1 Stripping of top soil m3 118 15,300 1,805,400 UP-21.2 Type T1-CH tank rehabilitation (Rising tank top) m3 738 76,500 56,457,000 UP-51.3 Cmcrete works m3 36,807 400 14,722,697 UP-71.4 Tank sluice set 5,000,000 1 5,000,000 DS division1.5 Other works LS 1 15,597,019 20% of sum of 1
91,776,716
2. Parangi anicut construction2.1 Rock excavation m3 1,354 1300 1,760,200 REACE2.2 Excavation and backfilling m3 738 3,000 2,214,000 UP-52.3 Type T1-CH rehabilitation (reforcement concrete) m3 36,807 2,337 86,017,358 L=55m, H=1.8m UP-82.4 Radial gated head sluice set 25,000,000 1 25,000,000 DS division2.5 Other works LS 1 22,998,312 20% of sum of 1
137,989,870
3. Supply canal3.1 Concrete lining for supply canal m 12,780 7,500 95,850,000 UP-093.2 Gravel bedding for road m 599 7,500 4,492,500 UP-43.3 Improvement of related structures in supply canal ha 87,457 400 34,982,880 (UP-11 & UP-12 / 5ha) UP-11/UP-123.4 Other works LS 1 27,065,076 20% of sum of 2
162,390,456
4. Canal rehabilitation4.1 Gravel bedding for road m 599 10,450 6,259,550 UP-44.2 Improvement of related structures in MC and field canal ha 87,457 140 12,244,008 (UP-11 & UP-12 / 5ha) UP-11/UP-124.3 Other works LS 1 3,700,712 20% of sum of 2
88,056 22,204,270
414,361,312414,361,000 per scheme
Breakdown of Cost for Individual Scheme
Round
sub-total
Description of Works
sub-total
Total
sub-total
sub-total

C-64
Item No : BC/IS-04Scheme : Rehabilitation of Muthayankaddu Tank Irrigation SchemeProvince : Northern ProvinceDistrict : Mullaitivu RangeDS Division : NmuthuiyankadduNo. Unit Unit Price (Rs) Q'ty Amount (Rs) Remarks Ref. No
1. Headwork rehabilitation1.1 Strengthening of tank bund m3 340 60,000 20,400,000 UP-31.2 Riprap protection of U/S alope m3 5,000 1,000 5,000,000 Estimated by District1.3 Repair and reconditioning for spill radial gate LS 3,000,000 Estimated by District1.4 Repair and reconditioning for sluice gate LS 2,000,000 Estimated by District
30,400,000
2. Rehabilitation of Left Bank Canal System2.1 Recoditioning for main canal (earth works) m3 391 12,000 4,692,000 UP-62.2 Recoditioning for drainage canal (earth works) m3 391 10,000 3,910,000 UP-62.3 Recoditioning for field canal (earth works) m3 391 40,000 15,640,000 UP-62.4 Concrete lining for channel m 4,666 20,000 93,320,000 50% of proposal UP-7/equi2.5 Rehabilitation of structures LS 13,000,000 Estimated by District
130,562,000
3. Rehabilitation of Right Bank Canal System3.1 Recoditioning for main canal (earth works) m3 391 8,000 3,128,000 UP-63.2 Recoditioning for drainage canal (earth works) m3 391 6,000 2,346,000 UP-63.3 Recoditioning for field canal (earth works) m3 391 28,000 10,948,000 UP-63.4 Concrete lining for channel m 4,666 15,000 69,990,000 50% of proposal UP-7/equi3.5 Rehabilitation of structures LS 10,000,000 Estimated by District
96,412,000
4. Right Bank Area4.1 LS 13,426,000 Estimated by District4.2 LS 6,308,000 Estimated by District4.3 LS 20,710,000 Estimated by District4.4 LS 7,767,000 Estimated by District4.5 LS 36,784,000 Estimated by District4.6 LS 19,047,000 Estimated by District4.7 LS 19,364,000 Estimated by District4.8 LS 18,881,000 Estimated by District4.9 LS 11,177,000 Estimated by District
4.10 LS 24,879,000 Estimated by District4.11 LS 31,497,000 Estimated by District4.12 LS 15,296,000 Estimated by District4.13 LS 10,439,000 Estimated by District
235,575,0005. Left Bank Area
5.1 Pump house 1 for I.D farm LS 28,091,000 Estimated by District5.2 Pump house 3 for Block 1-90 acrs LS 25,318,000 Estimated by District5.3 LS 25,388,000 Estimated by District5.4 LS 18,562,000 Estimated by District5.5 LS 18,859,000 Estimated by District
116,218,000
609,167,000609,167,000
Total
Pump House 4 and related facilities rehabilitationPump House 5 and related facilities rehabilitationPump House 6 and related facilities rehabilitation
Pump House 2 and related facilities rehabilitationPump House 3 and related facilities rehabilitationPump House 4 and related facilities rehabilitation
Round
Description of Works
Pump House 5-1 and related facilities rehabilitation
Pump House 6 and related facilities rehabilitationPump House 7 and related facilities rehabilitation
Pump House 1 and related facilities rehabilitation
Breakdown of Cost for Individual Scheme
sub-total
Pump House 9 and related facilities rehabilitation
sub-total
Pump House 5-2 and related facilities rehabilitation (Balance)
Pump House 12 and related facilities rehabilitation
sub-total
sub-total
sub-total
Pump House 8 and related facilities rehabilitation
Pump House 10 and related facilities rehabilitationPump House 11 and related facilities rehabilitation

C-65
Item No : BC/IS-05Scheme : Rehabilitation of Inginimitiya SchemeProvince : Northern West ProvinceDistrict : PuttalamDS Division : Anamaduwa
No. Unit Unit Price (Rs) Q'ty Amount (Rs) Remarks Ref. No
1. Anicut rehabilitation1.1 Type T1-C rehabilitation no 0 Not subject
0
2. Canal rehabilitation2.1 Concrete lining for main canal (RB & LB) m 12,639 17,600 222,446,400 40% of total UP-092.2 Gravel bedding for canal road m 592 17,600 10,419,200 40% of total UP-42.3 Improvement of related structures in MC and field canal nos 432,459 20 8,649,180 (UP-11 & UP-12 / 0.5 km) UP-11/UP-122.4 Inprovement feeder canal m 2,665 48,000 127,920,000 40% of proposal UP-142.5 Other works LS 1 23,286,560 10% of sum of 2
392,721,3403. Miscellaneous Works LS 1 19,636,067 5% of 1+2
412,357,407412,357,000
Breakdown of Cost for Individual Scheme
Description of Works
sub-total
sub-total
TotalRound
Item No : BC/IS-06Scheme : Rehabilitation of Vavunikulam Lift Irrigation SchemeProvince : Northern ProvinceDistrict : Mullaitivu RangeDS Division : VavunikulamNo. Unit Unit Price (Rs) Q'ty Amount (Rs) Remarks Ref. No
1. Left Bank Main Canal1.1 Balance work of Selvapuram at 1.6 km LS 17,035,000 Estimated by District1.2 Selvapuram at 3.2 km LS 37,312,000 Estimated by District1.3 Balance works for Pandiyankulam of 4.8 km LS 23,900,000 Estimated by District1.4 Karumpulliyan of 5.6 km LS 52,442,000 Estimated by District
130,689,000
2. Right Bank Main Canal2.1 LS 42,025,000 Estimated by District2.2 LS 31,069,000 Estimated by District2.3 LS 65,923,000 Estimated by District2.4 LS 23,390,000 Estimated by District2.5 LS 59,091,000 Estimated by District2.6 LS 29,098,000 Estimated by District
250,596,000
381,285,000381,285,000
TotalRound
sub-total
Breakdown of Cost for Individual Scheme
Description of Works
Palinagar at 1.2 kmYogapuram east of 5.6 kmBarathinagar of 9.2 kmThirunagar of 10.4 kmYogapuram west of 13.6 km
sub-total
Kotthampiyakulambof 15.6 km
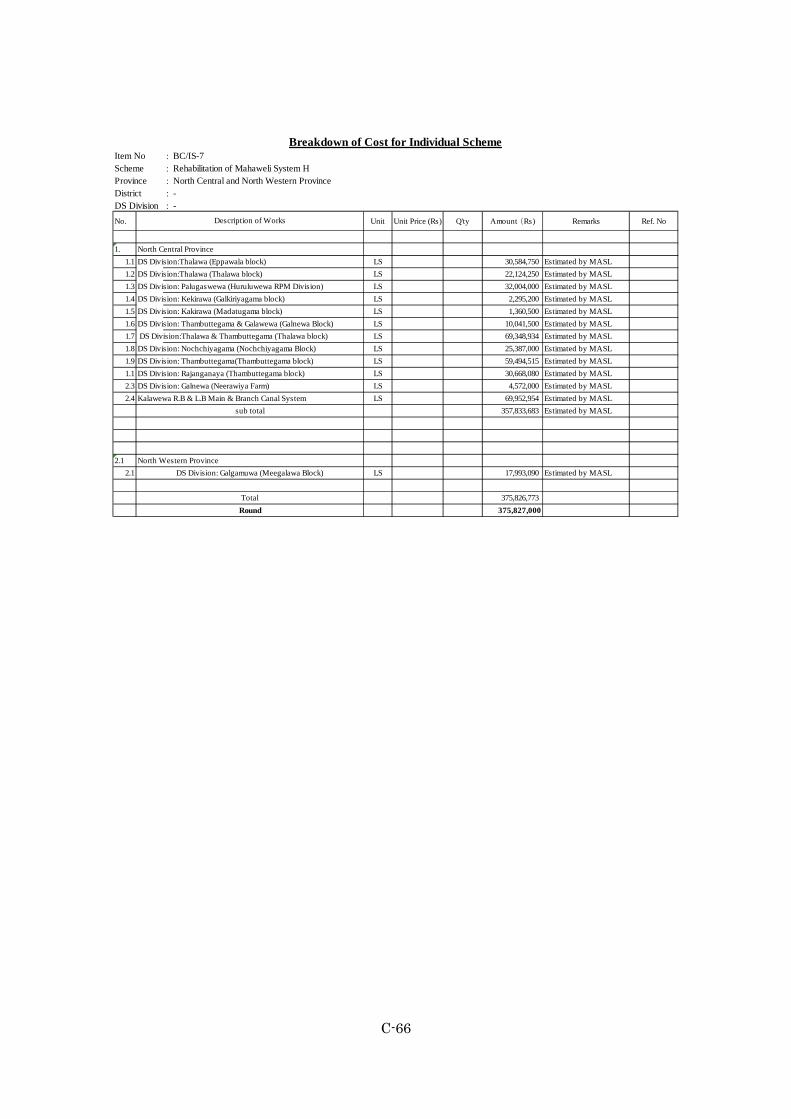
C-66
Item No : BC/IS-7Scheme : Rehabilitation of Mahaweli System HProvince : North Central and North Western ProvinceDistrict : -DS Division : -No. Unit Unit Price (Rs) Q'ty Amount (Rs) Remarks Ref. No
1. North Central Province1.1 DS Division:Thalawa (Eppawala block) LS 30,584,750 Estimated by MASL1.2 DS Division:Thalawa (Thalawa block) LS 22,124,250 Estimated by MASL1.3 DS Division: Palugaswewa (Huruluwewa RPM Division) LS 32,004,000 Estimated by MASL1.4 DS Division: Kekirawa (Galkiriyagama block) LS 2,295,200 Estimated by MASL1.5 DS Division: Kakirawa (Madatugama block) LS 1,360,500 Estimated by MASL1.6 DS Division: Thambuttegama & Galawewa (Galnewa Block) LS 10,041,500 Estimated by MASL1.7 DS Division:Thalawa & Thambuttegama (Thalawa block) LS 69,348,934 Estimated by MASL1.8 DS Division: Nochchiyagama (Nochchiyagama Block) LS 25,387,000 Estimated by MASL1.9 LS 59,494,515 Estimated by MASL1.1 LS 30,668,080 Estimated by MASL2.3 LS 4,572,000 Estimated by MASL2.4 LS 69,952,954 Estimated by MASL
357,833,683 Estimated by MASL
2.12.1 LS 17,993,090 Estimated by MASL
375,826,773 375,827,000
Breakdown of Cost for Individual Scheme
Description of Works
DS Division: Thambuttegama(Thambuttegama block)DS Division: Rajanganaya (Thambuttegama block)DS Division: Galnewa (Neerawiya Farm)Kalawewa R.B & L.B Main & Branch Canal System
sub total
North Western ProvinceDS Division: Galgamuwa (Meegalawa Block)
TotalRound

C-67
Major 1 Vahaneri Tank EP Batticaola KP South (Kiran) Tank Bund & Canals 46,467,000
Major 2 Yan oya scheme EP Trincomalee Kuchchaweli Anicut & Canals 17,124,000
Major 3 Mahadivulwewa EP Trincomalee Morawewa 21,874,000
Major 4 Tabbowa NWP Puttalam Karuwalagaswewa Tank Bund & Canals 17,633,000
Major 5 Manankatiya Tank NCP Anuradhapura Galenbindunuwewa Tank & Canal System 34,338,000
137,436,000
Medium 1 Borapola Tank EP Ampara Mahaoya Rehab. of 20 NosSt t d 3 k C l
24,125,000
Medium 2 Tampitiya Tank & Canal System EP Ampara Mahaoya Tank Bund & Canals 9,038,327
Medium 3 Ethabendiwewa EP Trincomalee Morawewa Tank Bund & Canals 8,340,951
Medium 4 Andankulam EP Trincomalee Town & Gravets LB & RB Channel system 13,900,284
Medium 5 Kurankupanchan EP Trincomalee Kinniya Canal system 12,967,968
Medium 6 Illankanthai Tank EP Trincomalee Muthur Tank Bund, Canals &R d
9,318,262
Medium 7 Ullai Kulam EP Trincomalee Muthur Tank Bund & Canals 13,974,373
Medium 8 Maha Andarawewa Tank NWP Puttalam Nawagattegama LB Canal System 19,818,883
Medium 9 Kokebe wewa NCP Anuradhapura Kahatagasdigiliya Tank Bund & Canals 13,078,000
Medium 10 Adampankulam (Vellankulam &Paliam GND)
NP Mannar Manthai West Augmentation 14,191,171
Medium 11Maruthamadu Anicut scheme(Pallamadu GND) NP Mannar Manthai West Anicut & Canals 34,073,418
Medium 12 Periyamadu Irrigation scheme(Periyamadu & Koyanagar GND)
NP Mannar Manthai West Canals 25,145,212
Medium 13ThatchchanamaruthamaduIrrigation Scheme (PalampiddyGND)
NP Mannar MaduD. Canals, Field canal &Drainage canals 9,195,199
Medium 14 Periya Pandivirichchan IrrigationScheme (Periya Pandivirichchan
NP Mannar Madu D. Canals, Field canal &Drainage canals
21,646,134
Medium 15 Mullikulam Irrigation Scheme(Iranai Illuppukulam GND)
NP Mannar Madu D. Canals, Field canal &Drainage canals
12,504,448
Medium 16 Ambalaperumalkulam Tank NP Mulattivu Thurkkai Canals 14,474,971
Medium 17 Iyankulam Tank NP Mulattivu Thurkkai Canals 29,543,254
Medium 18 Koddaikuddinakulam Tank NP Mulattivu Thurkkai Canals 25,460,235
Medium 19 Kollvilankulam Tank NP Mulattivu Thurkkai Canals 26,039,630
Medium 20 Mallavi Tank NP Mulattivu Thurkkai Canals 3,415,645
Medium 21 Muruthankulam Tank NP Mulattivu Thurkkai Canals 18,556,781
Medium 22 Palayamurukandykulam Tank NP Mulattivu Thurkkai Canals 18,186,701
Medium 23 Tenniyankulam Tank NP Mulattivu Thurkkai Canals 18,325,952
Medium 24 Therankandal Tank NP Mulattivu Thurkkai Canals 7,885,705
Medium 25 Maharambai Kulam NP Vavuniya Vavuniya Town Tank & Canal System 13,390,276
Medium 26 Moonayamadu Tank NP Vavuniya Vavuniya Town 10,460,865
Medium 27 Pampaimadu Tankm NP Vavuniya Vavuniya Town Canals 14,181,245
Medium 28 Vavuniya Tank NP Vavuniya Vavuniya Town Canal 20,356,822
Medium 29 Madukanda Irrigation Scheme NP Vavuniya Vavuniya South Tank & Canal System 16,935,996
Medium 30 Eropothan Irrigation Scheme NP Vavuniya Vavuniya South Tank & Canal System 5,838,004
Medium 31 Lunugala yoda Tank UP Monaragala Badalkumbura Tank & Canal System 4,047,175
Medium 32 Karadadara tank UP Monaragala Siyambalanduwa Tank & Canal System 367,925
488,784,814
Type of ImprovementCost including
OFC fieldarrangement
District DS DivisionScheme
Category No. Tank Name/Name of Scheme
Prov
ince
Total Major Schemes
Total Medium Schemes
(2) Major and Medium Schemes

C-68
Item No : BC/Ma-01Scheme : Rehabilitation of Vahaneri TankProvince : EPDistrict : BatticaolaDS Division : K.S. South
No. Unit Unit Price(Rs)
Q'ty Amount (Rs) Remarks Ref. No
1. Tank rehabilitation1.1 Site clearing ha 24,069 0.13 3,129 UP-11.2 Excavation top soil m3 99 2,600 258,148 UP-21.3 Slope protection m3 379 3,250 1,230,580 UP-3-11.4 Other works LS 149,186 10% of sum of 1
1,641,043
2. Main canal rehabilitation 65 km in total2.1 m3 329 20,000 6,579,919 1m3/m x 20km UP-62.2 Concrete lining m 10,753 1,000 10,753,372 UP-92.3 Other works LS 1 866,665 5% of sum of 3
18,199,956
3. Field canal arrangement for OFC in Yala3.1 ha 61,346 323 19,814,628 UP-193.2 Drainage canal construction for OFC ha 21,088 323 6,811,556 UP-21
26,626,184
46,467,18346,467,000 per scheme
Item No : BC/Ma-02Scheme : Yan Oya SchemeProvince : EPDistrict : TorincomaleeDS Division : Kuchachaweri
No. Unit Unit Price(Rs)
Q'ty Amount (Rs) Remarks Ref. No
1. Tank bund regabilitation1.11.21.31.4
0
2. Canal rehabilitation2.1 m 10,753 600 6,452,023 UP-92.2 Feeder canal rehabilitation m 2,268 600 1,360,563 200m x 3 palces UP-142.3 Other works LS 1 1,562,517 20% of sum of 3
9,375,104
3. Field canal arrangement for OFC in Yala3.1 ha 61,346 94 5,766,486 UP-193.2 Drainage canal construction for OFC ha 21,088 94 1,982,310 UP-21
7,748,797
17,123,90017,124,000 per scheme
Main canal lining
Field canal arrangement
sub-total
RoundTotal
sub-total
TotalRound
Description of Works
sub-total
Field canal arrangement
Breakdown of Cost for Major Scheme
Description of Works
sub-total
Desilting from main canal
sub-total
sub-total

C-69
Item No : BC/Ma-03Scheme : Mahadivulwewa schemeProvince : EPDistrict : TorincomaleeDS Division : Morawewa
No. Unit Unit Price(Rs)
Q'ty Amount (Rs) Remarks Ref. No
1. Tank bund regabilitation1.11.21.31.4
0
2. Canal rehabilitation2.1 m 10,753 1,000 10,753,372 2km in total UP-92.2 Feeder canal rehabilitation m 2,268 1,600 3,628,169 200m x 8 palces UP-142.3 Other works LS 1 2,876,308 20% of sum of 3
17,257,849
3. Field canal arrangement for OFC in Yala3.1 ha 61,346 56 3,435,354 UP-193.2 Drainage canal construction for OFC ha 21,088 56 1,180,951 UP-21
4,616,304
21,874,15321,874,000 per scheme
Item No : BC/Ma-04Scheme : Tobbowa schemeProvince : NWPDistrict : PuttalamDS Division : Morawewa
No. Unit Unit Price(Rs)
Q'ty Amount (Rs) Remarks Ref. No
1. Tank bund regabilitation1.1 Site clearing ha 28,289 0.13 3,678 UP-11.2 m3 730 8,000 5,838,819 UP-51.3 Slope protection m3 445 0 UP-3-11.4 Other works LS 584,250 10% of sum of 1
6,426,746
2. Canal rehabilitation2.1 m3 387 15,000 5,800,249 UP-62.2 m 2,665 2,400 6,396,517 20% of 12km UP-142.3 m3 219 3,000 656,867 30% of UP-52.4 Other works LS 1 1,291,423 20% of sum of 2
14,145,057
3. Field canal arrangement for OFC in Yala3.1 ha 72,102 36 2,595,677 UP-193.2 Drainage canal construction for OFC ha 24,786 36 892,300 UP-21
3,487,978
17,633,03517,633,000 per scheme
TotalRound
Total
sub-total
Main canal lining
sub-total
Field canal arrangement
Round
Drainage canala excavation
Description of Works
Excavation & backfilling
Field canal rehabilitation including structure
Field canal arrangement
sub-total
Desilting from main canal
sub-total
sub-total
Breakdown of Cost for Major Scheme
Description of Works
sub-total

C-70
Item No : BC/Ma-05Scheme : Manakatiya Tank schemeProvince : NCPDistrict : AnuradhapuraDS Division : Galenbindunuwewa
No. Unit Unit Price(Rs)
Q'ty Amount (Rs) Remarks Ref. No
1. Tank bund regabilitation1.1 m3 786 500 392,829 UP-51.2 m3 39,184 30 1,175,508 UP-51.3 Sluice gate 2 500,000 2 1,000,0001.4 Other works LS 513,667 20% of sum of 1
3,082,003
2. Canal rehabilitation2.1 m3 416 10,000 4,162,494 UP-62.2 m 2,869 0 UP-142.3 m3 219 15,000 3,284,336 30% of UP-52.4 Other works LS 1 1,489,366 20% of sum of 2
8,936,195
3. Field canal arrangement for OFC in Yala3.1 ha 77,615 214 16,609,640 UP-193.2 Drainage canal construction for OFC ha 26,681 214 5,709,796 UP-21
22,319,436
34,337,63434,338,000 per scheme
Field canal rehabilitation including structure
Excavation & backfilling
sub-total
Desilting from main canal
Breakdown of Cost for Major Scheme
sub-total
sub-total
Field canal arrangement
RoundTotal
Drainage canala excavation
Description of Works
Re-inforced concrete, incl. form etc.

C-71
Item No : BC/Me-01Scheme :
Province : EPDistrict : AmparaDS Division : Mahaoya
No. Unit Unit Price(Rs)
Q'ty Amount (Rs) Remarks Ref. No
1. Tank rehabilitation1.11.21.31.4
2. Main canal rehabilitation 3 km in total2.1 m3 329 3,000 986,988 1m3/m x 3km UP-62.2 Concrete lining m 10,753 1,500 16,130,058 3km x 50% UP-92.3 no 183,971 20 3,679,420 UP-11/UP-122.4 Other works LS 855,852 5% of sum of 3
21,652,318
3. Field canal arrangement for OFC in Yala3.1 ha 61,346 30 1,840,368 UP-193.2 Drainage canal construction for OFC ha 21,088 30 632,652 UP-21
2,473,020
24,125,33824,125,000 per scheme
Item No : BC/Me-02Scheme :
Province : EPDistrict : AmparaDS Division : Mahaoya
No. Unit Unit Price(Rs)
Q'ty Amount (Rs) Remarks Ref. No
1. Tank bund regabilitation1.1 Site clearing ha 24,069 1.00 24,069 UP-11.2 Excavation top soil m3 99 2,000 198,576 UP-21.3 Slope protection m3 379 2,500 946,600 UP-3-11.4 Other works LS 1 116,924 10% of sum of 1
1,286,168
2. Canal rehabilitation2.1 m 10,753 60 645,202 UP-92.2 Feeder canal rehabilitation m 2,268 55 124,718 200m x 3 palces UP-142.3 m3 186 3,000 558,872 30% of UP-52.4 Other works LS 1 240,815 20% of sum of 2
1,569,608
3. Field canal arrangement for OFC in Yala3.1 ha 61,346 75 4,600,920 UP-193.2 Drainage canal construction for OFC ha 21,088 75 1,581,631 UP-21
6,182,551
9,038,3279,038,000 per scheme
Borapola Tank scheme
Tampitiya Tank & Canal System
Drainage canala excavation
Main canal lining
sub-total
Field canal arrangement
sub-total
TotalRound
Breakdown of Cost for Medium Scheme
Description of Works
Desilting from main canal
sub-total
TotalRound
Breakdown of Cost for Medium Scheme
Description of Works
Field canal arrangement
sub-total
sub-total
Canal structure

C-72
Item No : BC/Me-03Scheme :
Province : EPDistrict : TrincomaleeDS Division : Morawewa
No. Unit Unit Price(Rs)
Q'ty Amount (Rs) Remarks Ref. No
1. Tank bund regabilitation1.1 Site clearing ha 24,069 1.00 24,069 UP-11.2 m3 621 10,000 6,209,694 UP-51.3 Slope protection m3 0 2,500 0 UP-3-11.4 Other works LS 1 623,376 10% of sum of 1
6,857,139
2. Canal rehabilitation2.1 m3 329 4,000 1,315,984 1m3/m UP-62.2 m 10,753 400 4,301,349 2000m x 20% UP-92.3 Other works LS 1 215,067 5% of sum of 22.4 5,832,400
3. Field canal arrangement for OFC in Yala3.1 ha 61,346 18 1,104,221 UP-193.2 Drainage canal construction for OFC ha 21,088 18 379,591 UP-21
1,483,812
8,340,9518,341,000 per scheme
Item No : BC/Me-04Scheme : AndankulamProvince : EPDistrict : TrincomaleeDS Division : Towan & Gravets
No. Unit Unit Price(Rs)
Q'ty Amount (Rs) Remarks Ref. No
1. Tank bund regabilitation1.1 m3 621 500 310,485 UP-51.2 m3 30,970 30 929,100 UP-81.3 Sluice gate set 500,000 1 500,0001.4 Other works LS 347,917 20% of sum of 1
2,087,502
2. Canal rehabilitation2.1 m3 329 10,000 3,289,960 UP-62.2 m 10,753 200 2,150,674 1000m x 20% UP-92.3 Other works LS 1 272,032 5% of sum of 2
5,712,666
3. Field canal arrangement for OFC in Yala3.1 ha 61,346 74 4,539,574 UP-193.2 Drainage canal construction for OFC ha 21,088 74 1,560,542 UP-21
6,100,117
13,900,28413,900,000 per scheme
Ethabendiwewa scheme
sub-total
Excavation & backfilling
Main canal lining
Field canal arrangement
sub-total
TotalRound
sub-total
Desilting from main canalMain canal lining
sub-total
sub-total
TotalRound
Breakdown of Cost for Medium Scheme
Description of Works
Re-inforced concrete, incl. form etc.
Breakdown of Cost for Medium Scheme
Description of Works
sub-total
Desilting from main canal
Field canal arrangement
Excavation & backfilling

C-73
Item No : BC/Me-05Scheme :
Province : EPDistrict : TrincomaleeDS Division : Kinniya
No. Unit Unit Price(Rs)
Q'ty Amount (Rs) Remarks Ref. No
1. Tank bund regabilitation1.1 m3 621 7,500 4,657,270 30% of 25000m3 UP-51.2 Other works LS 931,454 20% of sum of 1
5,588,724
2. Canal rehabilitation2.1 m3 621 3,000 1,862,908 UP-62.2 m 10,753 400 4,301,349 1000m x 20% UP-92.3 Other works LS 1 308,213 5% of sum of 2
6,472,470
3. Field canal arrangement for OFC in Yala3.1 ha 61,346 11 674,802 UP-193.2 Drainage canal construction for OFC ha 21,088 11 231,972 UP-21
906,774
12,967,96812,968,000 per scheme
Item No : BC/Me-06Scheme :
Province : EPDistrict : TrincomaleeDS Division : Muthur
No. Unit Unit Price(Rs)
Q'ty Amount (Rs) Remarks Ref. No
1. Tank bund regabilitation1.1 m3 621 500 310,485 UP-51.2 m3 30,970 66 2,044,020 for 60m spillway UP-81.3 m3 14,542 180 2,617,613 - do - UP-71.4 Other works LS 470,901 20% of sum of 1
5,443,019
2. Canal rehabilitation2.1 m3 329 7,400 2,434,570 1 m3/m UP-62.2 Other works LS 1 121,729 5% of sum of 2
2,556,299
3. Field canal arrangement for OFC in Yala3.1 ha 61,346 16 981,530 UP-193.2 Drainage canal construction for OFC ha 21,088 16 337,415 UP-21
1,318,944
9,318,2629,318,000 per scheme
Field canal arrangement
sub-total
TotalRound
sub-total
Breakdown of Cost for Medium Scheme
Description of Works
Excavation & backfilling
Re-inforced concrete, incl. form etc.
Desilting from main canal
Illankanthai Tank
sub-total
Concrete 1:3:6 (40) include. necessary works
Round
sub-total
Excavation & backfilling
Total
Desilting from main canalMain canal lining
sub-total
Kurankupanchan scheme
Description of Works
Field canal arrangement
sub-total
Breakdown of Cost for Medium Scheme

C-74
Item No : BC/Me-07Scheme :
Province : EPDistrict : TrincomaleeDS Division : Muthur
No. Unit Unit Price(Rs)
Q'ty Amount (Rs) Remarks Ref. No
1. Tank bund regabilitation1.1 m3 621 500 310,485 UP-51.2 m3 30,970 36 1,114,920 for 30m spillway UP-81.3 m3 14,542 90 1,308,807 - do - UP-71.4 Other works LS 1 285,081 20% of sum of 1
3,019,292
2. Canal rehabilitation2.1 m3 329 11,500 3,783,454 1 m3/m UP-62.2 m 10,753 560 6,021,888 2800m x 20% UP-92.3 Other works LS 1 490,267 5% of sum of 2
10,295,609
3. Field canal arrangement for OFC in Yala3.1 ha 61,346 8 490,765 UP-193.2 Drainage canal construction for OFC ha 21,088 8 168,707 UP-21
659,472
13,974,37313,974,000 per scheme
Item No : BC/Me-08Scheme :
Province : NWPDistrict : PuttalamDS Division : Nawagattegama
No. Unit Unit Price(Rs)
Q'ty Amount (Rs) Remarks Ref. No
1. Tank bund regabilitation1.11.21.31.4 Other works
2. Canal rehabilitation2.1 place 50,000 89 4,450,000 89 nos. various structures2.2 place 100,000 144 14,400,000 144 parts
18,850,000
3. Field canal arrangement for OFC in Yala3.1 ha 72,102 10 721,022 UP-193.2 Drainage canal construction for OFC ha 24,786 10 247,861 UP-21
968,883
19,818,88319,819,000 per scheme
sub-total
Field canal arrangement
sub-total
TotalRound
Maha Andarawewa Tank
Description of Works
sub-total
Desilting from main canalMain canal lining
sub-total
Breakdown of Cost for Medium Scheme
Description of Works
Excavation & backfilling
Excavation & backfilling
Re-inforced concrete, incl. form etc.
Field canal arrangement
sub-total
Breakdown of Cost for Medium Scheme
Ullai Kulam
Re-inforced concrete, incl. form etc.
Concrete 1:3:6 (40) include. necessary works
TotalRound
sub-total
Rehabilitation of existing structuresMain canal lining
Concrete 1:3:6 (40) include. necessary works

C-75
Item No : BC/Me-09Scheme :
Province : NCPDistrict : Anuradhapura
DS Division : Kahatagasdigiliya
No. Unit Unit Price(Rs)
Q'ty Amount (Rs) Remarks Ref. No
1. Tank bund regabilitation1.1 m31.2 m31.3 m31.4 Other works LS
2. Canal rehabilitation2.1 m3 416 10,000 4,162,494 estimated UP-62.2 m 13,605 500 6,802,643 - do - UP-92.3 Other works LS 1 548,257 5% of sum of 2
11,513,394
3. Field canal arrangement for OFC in Yala3.1 ha 77,615 15 1,164,227 UP-193.2 Drainage canal construction for OFC ha 26,681 15 400,219 UP-21
1,564,446
13,077,84113,078,000 per scheme
Item No : BC/Me-10Scheme :
Province : NPDistrict : Mannar
DS Division : Manthai West
No. Unit Unit Price(Rs)
Q'ty Amount (Rs) Remarks Ref. No
1. Tank bund regabilitation1.1 m3 450 12,000 5,400,000 2400mx5mx1m UP-3-11.21.31.4 Other works 540,000 10% of sum of 1
5,940,000
2. Canal rehabilitation2.1 m 12,780 400 5,112,000 2000m x 20% UP-92.2 no 218,643 10 2,186,430 UP-11/UP-122.3 Other works LS 1 364,922 5% of sum of 2
7,663,352
3. Field canal arrangement for OFC in Yala3.1 ha 72,907 6 437,442 UP-193.2 Drainage canal construction for OFC ha 25,063 6 150,377 UP-21
587,819
14,191,17114,191,000 per schemeRound
Adampankulam (Vellankulam & Paliam GND)
Concrete 1:3:6 (40) include. necessary works
sub-total
Supply canal liningCanal structure
Breakdown of Cost for Medium Scheme
Description of Works
Slope protection for tank bund
Re-inforced concrete, incl. form etc.
sub-total
Total
Desilting from main canalMain canal lining
sub-total
Field canal arrangement
sub-total
Total
sub-total
Field canal arrangement
Round
Kokebe wewa
Description of Works
Excavation & backfilling
Re-inforced concrete, incl. form etc.
Concrete 1:3:6 (40) include. necessary works
sub-total
Breakdown of Cost for Medium Scheme

C-76
Item No : BC/Me-11Scheme :
Province : NPDistrict : Mannar
DS Division : Manthai West Remarks:At present no cultivation under this scheme
No. Unit Unit Price(Rs)
Q'ty Amount (Rs) Remarks Ref. No
1. Anicut regabilitation1.1 m3 738 510 376,380 15m long UP-51.2 m3 36,807 75 2,760,506 UP-81.3 m3 17,283 150 2,592,450 UP-71.4 nos 2,097,219 5 10,486,093 Tmi-H1.5 Other works 810,771 10% of sum of 1
17,026,200
2. Canal rehabilitation2.1 Desilting of main canal m3 391 7,500 2,932,500 1 m3/m UP-62.1 m 12,780 750 9,585,000 7500m x 10% UP-92.2 no 218,643 12 2,623,716 UP-11/UP-122.3 Other works LS 1 1,514,122 10% of sum of 2
16,655,338
3. Field canal arrangement for OFC in Yala3.1 ha 72,907 4 291,628 UP-193.2 Drainage canal construction for OFC ha 25,063 4 100,251 UP-21
391,880
34,073,41834,073,000 per scheme
Remarks:At present no cultivation under this scheme
Item No : BC/Me-12Scheme :
Province : NPDistrict : MannarDS Division : Manthai West
No. Unit Unit Price(Rs)
Q'ty Amount (Rs) Remarks Ref. No
1. Tank regabilitation1.11.21.31.41.5
0
2. Canal rehabilitation2.1 Desilting of main canal m3 391 8,000 3,128,000 1 m3/m UP-62.2 m 12,780 800 10,224,000 8000m x 10% UP-92.3 m3 221 10,000 2,214,000 30% of UP-5, 5000m2.5 Other works LS 1 3,113,200 20% of sum of 2
18,679,200
3. Field canal arrangement for OFC in Yala3.1 ha 72,907 66 4,811,866 UP-193.2 Drainage canal construction for OFC ha 25,063 66 1,654,146 UP-21
6,466,012
25,145,21225,145,000 per scheme
sub-total
Main canal lining
sub-total
Field canal arrangement
sub-total
TotalRound
Drainage canala excavation
Breakdown of Cost for Medium Scheme
Periyamadu Irrigation scheme (Periyamadu & Koyanagar GND)
Description of Works
sub-total
Field canal arrangement
sub-total
TotalRound
Feeder tank rehabilitation
Excavation & backfilling
Re-inforced concrete, incl. form etc.
Concrete 1:3:6 (40) include. necessary works
sub-total
Main canal liningCanal structure
Breakdown of Cost for Medium Scheme
Maruthamadu Anicut scheme (Pallamadu GND)
Description of Works

C-77
Item No : BC/Me-13Scheme :
Province : NPDistrict : Mannar
DS Division : Madu
No. Unit Unit Price(Rs)
Q'ty Amount (Rs) Remarks Ref. No
1. Tank regabilitation1.11.21.31.41.5
0
2. Canal rehabilitation2.1 Desilting of main canal m3 391 2,000 782,000 1 m3/m UP-62.2 m 12,780 400 5,112,000 2000m x 20% UP-92.3 m3 221 8,000 1,771,200 30% of UP-5, 4000m2.5 Other works LS 1 550,300 5% of sum of 2
8,215,500
3. Field canal arrangement for OFC in Yala3.1 ha 72,907 10 729,071 UP-193.2 Drainage canal construction for OFC ha 25,063 10 250,628 UP-21
979,699
9,195,1999,195,000 per scheme
Item No : BC/Me-14Scheme :
Province : NPDistrict : Mannar
DS Division : Madu
No. Unit Unit Price(Rs)
Q'ty Amount (Rs) Remarks Ref. No
1. Tank regabilitation1.11.21.31.41.5
0
2. Canal rehabilitation2.1 Desilting of main canal m3 391 1,500 586,500 1 m3/m UP-62.2 m 12,780 400 5,112,000 2000m x 20% UP-92.3 m 2,695 3,000 8,084,906 UP-142.4 m3 221 10,000 2,214,000 30% of UP-5, 5000m2.5 Other works LS 1 3,199,481 20% of sum of 2
19,196,887
3. Field canal arrangement for OFC in Yala3.1 ha 72,907 25 1,822,677 UP-193.2 Drainage canal construction for OFC ha 25,063 25 626,571 UP-21
2,449,247
21,646,13421,646,000 per scheme
Drainage canala excavation
sub-total
Field canal arrangement
sub-total
TotalRound
sub-total
Main canal liningField canal rehabilitation including structure
sub-total
TotalRound
Breakdown of Cost for Medium Scheme
Periya Pandivirichchan Irrigation Scheme (Periya Pandivirichchan
Description of Works
sub-total
Main canal liningDrainage canala excavation
sub-total
Field canal arrangement
Breakdown of Cost for Medium Scheme
Thatchchanamaruthamadu Irrigation Scheme (Palampiddy GND)
Description of Works

C-78
Item No : BC/Me-15Scheme :
Province : NPDistrict : Mannar
DS Division : Madu
No. Unit Unit Price(Rs)
Q'ty Amount (Rs) Remarks Ref. No
1. Tank regabilitation1.11.21.31.41.5
0
2. Canal rehabilitation2.1 Desilting of main canal m3 391 1,500 586,500 1 m3/m UP-62.2 m 12,780 300 3,834,000 1500m x 20% UP-92.3 m 2,695 2,000 5,389,937 10000m x 20% UP-142.4 m3 221 4,000 885,600 30% of UP-5, 2000m2.5 Other works LS 1 534,802 5% of sum of 2
11,230,839
3. Field canal arrangement for OFC in Yala3.1 ha 72,907 13 947,792 UP-193.2 Drainage canal construction for OFC ha 25,063 13 325,817 UP-21
1,273,608
12,504,44812,504,000 per scheme
Item No : BC/Me-16Scheme :
Province : NPDistrict : Mulattivu
DS Division : Thurkkai
No. Unit Unit Price(Rs)
Q'ty Amount (Rs) Remarks Ref. No
1. Tank regabilitation1.11.21.31.41.5
0
2. Canal rehabilitation2.1 Desilting of main canal m3 391 1,600 625,600 1 m3/m UP-62.2 m 12,780 320 4,089,600 1600m x 20% UP-92.3 m 2,695 1,600 4,311,950 8000m x 20% UP-142.4 m3 0 02.5 Other works LS 1 451,357 5% of sum of 2
9,478,507
3. Field canal arrangement for OFC in Yala3.1 ha 72,907 51 3,718,260 UP-193.2 Drainage canal construction for OFC ha 25,063 51 1,278,204 UP-21
4,996,464
14,474,97114,475,000 per scheme
TotalRound
Main canal liningField canal rehabilitation including structure
Drainage canala excavation
sub-total
Field canal arrangement
sub-total
Description of Works
sub-total
Field canal arrangement
sub-total
TotalRound
Breakdown of Cost for Medium Scheme
Ambalaperumalkulam Tank
sub-total
Main canal liningField canal rehabilitation including structure
Drainage canala excavation
sub-total
Breakdown of Cost for Medium Scheme
Description of Works
Mullikulam Irrigation Scheme (Iranai Illuppukulam GND)

C-79
Item No : BC/Me-17Scheme :
Province : NPDistrict : Mulattivu
DS Division : Thurkkai
No. Unit Unit Price(Rs)
Q'ty Amount (Rs) Remarks Ref. No
1. Tank regabilitation1.11.21.31.41.5
0
2. Canal rehabilitation2.1 Desilting of main canal m3 391 1,500 586,500 1 m3/m UP-62.2 m 12,780 300 3,834,000 1500m x 20% UP-92.3 m 2,695 5,200 14,013,837 26000m x 20% UP-142.4 m3 221 8,000 1,771,200 4000m2.5 Other works LS 1 1,010,277 5% of sum of 2
21,215,814
3. Field canal arrangement for OFC in Yala3.1 ha 72,907 85 6,197,100 UP-193.2 Drainage canal construction for OFC ha 25,063 85 2,130,340 UP-21
8,327,440
29,543,25429,543,000 per scheme
Item No : BC/Me-18Scheme :
Province : NPDistrict : Mulattivu
DS Division : Thurkkai
No. Unit Unit Price(Rs)
Q'ty Amount (Rs) Remarks Ref. No
1. Tank regabilitation1.11.21.31.41.5
0
2. Canal rehabilitation2.1 Desilting of main canal m3 391 1,810 707,710 1 m3/m UP-62.2 m 12,780 362 4,626,360 1810m x 20% UP-92.3 m 2,695 940 2,533,270 4700m x 20% UP-142.4 no 218,643 45 9,838,935 various structures UP-11&122.5 Other works LS 1 3,541,255 20% of sum of 2
21,247,530
3. Field canal arrangement for OFC in Yala3.1 ha 72,907 43 3,135,004 UP-193.2 Drainage canal construction for OFC ha 25,063 43 1,077,701 UP-21
4,212,705
25,460,23525,460,000 per scheme
sub-total
TotalRound
Main canal liningField canal rehabilitation including structure
Structure
sub-total
Field canal arrangement
sub-total
Breakdown of Cost for Medium Scheme
Koddaikuddinakulam Tank
Description of Works
Drainage canala excavation
sub-total
Field canal arrangement
sub-total
TotalRound
sub-total
Main canal liningField canal rehabilitation including structure
Breakdown of Cost for Medium Scheme
Iyankulam Tank
Description of Works

C-80
Item No : BC/Me-19Scheme :
Province : NPDistrict : Mulattivu
DS Division : Thurkkai
No. Unit Unit Price(Rs)
Q'ty Amount (Rs) Remarks Ref. No
1. Tank regabilitation1.11.21.31.41.5
0
2. Canal rehabilitation2.1 Desilting of main canal m3 391 6,500 2,541,500 1 m3/m UP-62.2 m 12,780 1,300 16,614,000 6500m x 20% UP-92.3 m 0 02.4 no 218,643 10 2,186,430 various structures UP-11&122.5 Other works LS 1 1,067,097 5% of sum of 2
19,867,527
3. Field canal arrangement for OFC in Yala3.1 ha 72,907 63 4,593,145 UP-193.2 Drainage canal construction for OFC ha 25,063 63 1,578,958 UP-21
6,172,103
26,039,63026,040,000 per scheme
Item No : BC/Me-20Scheme :
Province : NPDistrict : Mulattivu
DS Division : Thurkkai
No. Unit Unit Price(Rs)
Q'ty Amount (Rs) Remarks Ref. No
1. Tank regabilitation1.11.21.31.41.5
0
2. Canal rehabilitation2.1 Desilting of main canal m3 391 3,000 1,173,000 1 m3/m UP-62.2 m 0 02.3 m 0 02.4 no 288,174 3 864,522 Culvert UP-11&122.5 Other works LS 1 101,876 5% of sum of 2
966,398
3. Field canal arrangement for OFC in Yala3.1 ha 72,907 25 1,822,677 UP-193.2 Drainage canal construction for OFC ha 25,063 25 626,571 UP-21
2,449,247
3,415,6453,416,000 per scheme
Breakdown of Cost for Medium Scheme
Kollvilankulam Tank
Description of Works
sub-total
Main canal liningField canal rehabilitation including structure
Structure
sub-total
Field canal arrangement
sub-total
TotalRound
Breakdown of Cost for Medium Scheme
Mallavi Tank
Description of Works
sub-total
Main canal liningField canal rehabilitation including structure
Structure
sub-total
Field canal arrangement
sub-total
TotalRound

C-81
Item No : BC/Me-21Scheme :
Province : NPDistrict : Mulattivu
DS Division : Thurkkai
No. Unit Unit Price(Rs)
Q'ty Amount (Rs) Remarks Ref. No
1. Tank regabilitation1.1 set 1,000,000 1 1,000,0001.2 LS 1 200,000 20% of sum of 1
1,200,000
2. Canal rehabilitation2.1 Desilting of main canal m3 391 2,000 782,000 1 m3/m UP-62.2 m 12,780 400 5,112,000 2000m x 20% UP-92.3 m 2,695 700 1,886,478 3500m x 20% UP-142.4 no 218,643 11 2,405,073 various structures UP-11&122.5 Other works LS 1 509,278 5% of sum of 2
10,694,829
3. Field canal arrangement for OFC in Yala3.1 ha 72,907 68 4,957,680 UP-193.2 Drainage canal construction for OFC ha 25,063 68 1,704,272 UP-21
6,661,952
18,556,78118,557,000 per scheme
Item No : BC/Me-22Scheme :
Province : NPDistrict : Mulattivu
DS Division : Thurkkai
No. Unit Unit Price(Rs)
Q'ty Amount (Rs) Remarks Ref. No
1. Tank regabilitation1.1 m3 36,807 18 662,521 48m long UP-81.2 LS 1 132,504 20% of sum of 1
795,026
2. Canal rehabilitation2.1 Desilting of main canal m3 02.2 m 12,780 260 3,322,800 1300mx20% UP-92.3 m 2,695 300 808,491 1500mx20% UP-142.4 no 218,643 22 4,810,146 various structures UP-11&122.5 Other works LS 1 1,788,287 20% of sum of 2
10,729,724
3. Field canal arrangement for OFC in Yala3.1 ha 72,907 68 4,957,680 UP-193.2 Drainage canal construction for OFC ha 25,063 68 1,704,272 UP-21
6,661,952
18,186,70118,187,000 per scheme
Breakdown of Cost for Medium Scheme
Maruthankulam Tank
Description of Works
Sluice
Other works
sub-total
Main canal liningField canal rehabilitation including structure
Structure
sub-total
Field canal arrangement
sub-total
TotalRound
Breakdown of Cost for Medium Scheme
Palayamurukandykulam Tank
Description of Works
Raising spill (with re-inforcement concrete)
Other works
sub-total
Main canal liningField canal rehabilitation including structure
Structure
sub-total
Field canal arrangement
sub-total
TotalRound

C-82
Item No : BC/Me-23Scheme :
Province : NPDistrict : Mulattivu
DS Division : Thurkkai
No. Unit Unit Price(Rs)
Q'ty Amount (Rs) Remarks Ref. No
1. Tank regabilitation1.11.2
0
2. Canal rehabilitation2.1 Desilting of main canal m32.2 m2.3 m 2,695 1,200 3,233,962 6000mx20% UP-142.4 no 218,643 39 8,527,077 various structures (30%) UP-11&122.5 Other works LS 1 2,352,208 20% of sum of 2
14,113,247
3. Field canal arrangement for OFC in Yala3.1 ha 72,907 43 3,135,004 UP-193.2 Drainage canal construction for OFC ha 25,063 43 1,077,701 UP-21
4,212,705
18,325,95218,326,000 per scheme
Item No : BC/Me-24Scheme :
Province : NPDistrict : Mulattivu
DS Division : Thurkkai
No. Unit Unit Price(Rs)
Q'ty Amount (Rs) Remarks Ref. No
1. Tank regabilitation1.11.2
0
2. Canal rehabilitation2.1 Desilting of main canal m32.2 m 12,780 300 3,834,000 1500mx20% UP-92.3 m2.4 no 288,174 1 288,174 Over crossing UP-122.5 Other works LS 1 824,435 20% of sum of 2
4,946,609
3. Field canal arrangement for OFC in Yala3.1 ha 72,907 30 2,187,212 UP-193.2 Drainage canal construction for OFC ha 25,063 30 751,885 UP-21
2,939,096
7,885,7057,886,000 per scheme
Breakdown of Cost for Medium Scheme
Tenniyankulam Tank
Description of Works
sub-total
Main canal liningField canal rehabilitation including structure
Structure
sub-total
Field canal arrangement
sub-total
TotalRound
Breakdown of Cost for Medium Scheme
Therankandal Tank
Description of Works
sub-total
Main canal liningField canal rehabilitation including structure
Structure
sub-total
Field canal arrangement
sub-total
TotalRound

C-83
Item No : BC/Me-25Scheme :
Province : NPDistrict : VavuniyaDS Division : Vavuniya Town
No. Unit Unit Price(Rs)
Q'ty Amount (Rs) Remarks Ref. No
1. Tank regabilitation1.1 m3 36,807 23 828,152 60m long UP-81.2 LS 1 165,630 20% of sum of 1
993,782
2. Canal rehabilitation2.1 Desilting of main canal m3 391 2,000 782,000 2000m UP-62.2 m 12,780 400 5,112,000 2000mx20% UP-92.3 m3 221 5,000 1,107,000 2500m2.4 no 218,643 10 2,186,430 Various structures UP-11&122.5 Other works LS 1 1,837,486 20% of sum of 2
11,024,916
3. Field canal arrangement for OFC in Yala3.1 ha 72,907 14 1,020,699 UP-193.2 Drainage canal construction for OFC ha 25,063 14 350,880 UP-21
1,371,578
13,390,27613,390,000 per scheme
Item No : BC/Me-26Scheme :
Province : NPDistrict : VavuniyaDS Division : Vavuniya Town
No. Unit Unit Price(Rs)
Q'ty Amount (Rs) Remarks Ref. No
1. Tank regabilitation1.1 m3 36,807 75 2,760,506 100m long UP-81.2 LS 1 552,101 20% of sum of 1
3,312,607
2. Canal rehabilitation2.1 Desilting of main canal m3 391 2,000 782,000 1500m UP-62.2 m 12,780 300 3,834,000 1500mx20% UP-92.3 m3 221 4,000 885,600 2000m UP-5 x 30%2.4 no2.5 Other works LS 1 275,080 5% of sum of 2
5,776,680
3. Field canal arrangement for OFC in Yala3.1 ha 72,907 14 1,020,699 UP-193.2 Drainage canal construction for OFC ha 25,063 14 350,880 UP-21
1,371,578
10,460,86510,461,000 per scheme
Breakdown of Cost for Medium Scheme
Maharambai Kulam
Description of Works
Raising spill (with re-inforcement concrete)
Other works
sub-total
D canal liningDrainage canala excavation
Structure
sub-total
Field canal arrangement
sub-total
TotalRound
Breakdown of Cost for Medium Scheme
Moonayamadu Tank
Description of Works
Raising spill (with re-inforcement concrete)
Other works
sub-total
Main canal liningDrainage canala excavation
Structure
sub-total
Field canal arrangement
sub-total
TotalRound

C-84
Item No : BC/Me-27Scheme :
Province : NPDistrict : VavuniyaDS Division : Vavuniya Town
No. Unit Unit Price(Rs)
Q'ty Amount (Rs) Remarks Ref. No
1. Tank regabilitation1.1 m3 391 4,000 1,564,000 2000m long excavation UP-61.2 LS 1 312,800 20% of sum of 1
1,876,800
2. Canal rehabilitation2.1 Desilting of main canal m3 391 2,000 782,000 2000m UP-62.2 m 12,780 400 5,112,000 2000mx20% UP-92.3 m3 221 8,000 1,771,200 4000m UP-5 x 30%2.4 m 2,695 500 1,347,484 2500mx20%2.5 Other works LS 1 450,634 5% of sum of 2
9,463,318
3. Field canal arrangement for OFC in Yala3.1 ha 72,907 29 2,114,305 UP-193.2 Drainage canal construction for OFC ha 25,063 29 726,822 UP-21
2,841,127
14,181,24514,181,000 per scheme
Item No : BC/Me-28Scheme :
Province : NPDistrict : VavuniyaDS Division : Vavuniya Town
No. Unit Unit Price(Rs)
Q'ty Amount (Rs) Remarks Ref. No
1. Tank regabilitation1.1 Excavation of top soil m3 118 2,000 236,000 UP-21.2 Tank bund formation m3 430 10,000 4,302,241 UP-31.3 m3 36,807 56 2,070,379 150m long, 0.5m rising UP-81.2 LS 1 330,431 5% of sum of 1
6,939,051
2. Canal rehabilitation2.1 Desilting of main canal m32.2 no 218,643 25 5,466,075 various structures UP-11&122.3 m3 221 4,000 885,600 2000m UP-5 x 30%2.4 m 2,695 1,000 2,694,969 5000mx20% UP-142.5 Other works LS 1 452,332 5% of sum of 2
9,498,976
3. Field canal arrangement for OFC in Yala3.1 ha 72,907 40 2,916,282 UP-193.2 Drainage canal construction for OFC ha 25,063 40 1,002,513 UP-21
3,918,795
20,356,82220,357,000 per scheme
Breakdown of Cost for Medium Scheme
Pampaimadu Tankm
Description of Works
Spillway improvement
Other works
sub-total
Main canal liningDrainage canala excavation
Field canal rehabilitation including structure
sub-total
Field canal arrangement
sub-total
TotalRound
Breakdown of Cost for Medium Scheme
Vavuniya Tank
Description of Works
Spillway improvement (reinforcement concrete)
Other works
sub-total
Structure
Drainage canala excavation
Field canal rehabilitation including structure
sub-total
Field canal arrangement
sub-total
TotalRound

C-85
Item No : BC/Me-29Scheme :
Province : NPDistrict : VavuniyaDS Division : Vavuniya South
No. Unit Unit Price(Rs)
Q'ty Amount (Rs) Remarks Ref. No
1. Tank regabilitation1.11.21.31.2
2. Canal rehabilitation2.1 Desilting of D canal m3 391 1,500 586,500 1500m UP-62.2 m 12,780 300 3,834,000 1500mx20% UP-92.3 m3 221 9,000 1,992,600 6000m UP-5 x 30%2.4 m 2,695 400 1,077,987 2000mx20% UP-142.5 no 218,643 25 5,466,075 UP-11&122.6 Other works LS 1 647,858 5% of sum of 2
13,605,020
3. Field canal arrangement for OFC in Yala3.1 ha 72,907 34 2,478,840 UP-193.2 Drainage canal construction for OFC ha 25,063 34 852,136 UP-21
3,330,976
#REF!#REF! per scheme
Item No : BC/Me-30Scheme :
Province : NPDistrict : VavuniyaDS Division : Vavuniya South
No. Unit Unit Price(Rs)
Q'ty Amount (Rs) Remarks Ref. No
1. Tank regabilitation1.11.21.31.2
2. Canal rehabilitation2.1 Desilting of D canal m32.2 m2.3 m3 221 4,000 885,600 2000m UP-5 x 30%2.4 m 2,695 300 808,491 1500mx20% UP-142.5 no 218,643 10 2,186,430 UP-11&122.6 Other works LS 1 194,026 5% of sum of 2
4,074,547
3. Field canal arrangement for OFC in Yala3.1 ha 72,907 18 1,312,327 UP-193.2 Drainage canal construction for OFC ha 25,063 18 451,131 UP-21
1,763,458
5,838,0045,838,000 per scheme
Breakdown of Cost for Medium Scheme
Madukanda Irrigation Scheme
Description of Works
Main canal liningDrainage canala excavation
Field canal rehabilitation including structure
sub-total
Field canal arrangement
sub-total
TotalRound
Structure
Breakdown of Cost for Medium Scheme
Eropothan Irrigation Scheme
Description of Works
sub-total
TotalRound
Main canal liningDrainage canala excavation
Field canal rehabilitation including structure
Structure
sub-total
Field canal arrangement

C-86
Item No : BC/Me-31Scheme :
Province : UPDistrict : MonaragalaDS Division : Badalkumbura
No. Unit Unit Price(Rs)
Q'ty Amount (Rs) Remarks Ref. No
1. Tank regabilitation1.1 to be done by RAP1.21.31.2
2. Canal rehabilitation2.1 to be done by RAP2.22.32.42.52.6
0
3. Field canal arrangement for OFC in Yala3.1 ha 54,168 55 2,979,240 UP-193.2 Drainage canal construction for OFC ha 19,417 55 1,067,935 UP-21
4,047,175
4,047,175
Item No : BC/Me-32Scheme :
Province : UPDistrict : MonaragalaDS Division : Siyambalanduwa
No. Unit Unit Price(Rs)
Q'ty Amount (Rs) Remarks Ref. No
1. Tank regabilitation1.1 to be done by RAP1.21.31.2
2. Canal rehabilitationto be done by RAP
0
3. Field canal arrangement for OFC in Yala3.1 ha 54,168 5 270,840 UP-193.2 Drainage canal construction for OFC ha 19,417 5 97,085 UP-21
367,925
367,925
Breakdown of Cost for Medium Scheme
Lunugala yoda Tank
Description of Works
sub-total
Field canal arrangement
sub-total
Total
Breakdown of Cost for Medium Scheme
Karadadara tank
Description of Works
sub-total
Field canal arrangement
sub-total
Total
B

C-87
Item No : EP-01Item : Rehabilitation of Minor Tank / Anicut, Type : Tmi-H in EPProvince : Eastern Province
No. Unit Unit Price(Rs)
Q'ty Amount (Rs) Remarks Ref. No
1. Earth Works1.1 Clearing of top soil m3 99 100 9,929 UP-21.2 Forming bund from borrow of 1-2 km m3 362 360 130,320 UP-31.3 Excavation & backfilling m3 621 300 186,291 UP-51.4 Other works LS 1 19,622 10% of 1.1+1.2
346,1622. Concrete Works
2.1 Concrete 1:3:6 (40) include. necessary works m3 14,542 27 395,542 UP-72.2 Re-inforced concrete, incl. form etc. m3 30,970 19 589,669 UP-82.3 Main canal lining m 6,452 30 193,560 UP-9-12.4 Other works LS 1 117,877 10% of 1.1+1.2
1,296,6483. Miscellaneous Works LS 1 164,281 10% of 1+2
1,807,0911,807,000 per number
Item No : EP-02Item : Rehabilitation of Minor Tank / Anicut, Type : Tmi-CH in EPProvince : Eastern Province
No. Unit Unit Price(Rs)
Q'ty Amount (Rs) Remarks Ref. No
1. Earth Works1.1 Clearing of top soil m3 99 100 9,929 UP-21.2 Forming bund from borrow of 1-2 km m3 362 360 130,320 UP-31.3 Excavation & backfilling for tank m3 621 200 124,194 UP-51.4 Excavation & backfilling for main canal m3 621 360 223,549 UP-41.5 Other works LS 1 23,348 10% of 1.1+1.2
511,3402. Concrete Works
2.1 Concrete 1:3:6 (40) include. necessary works m3 14,542 27 392,634 UP-72.2 Re-inforced concrete, incl. form etc. m3 30,970 19 588,430 UP-82.3 Main canal lining m 6,452 1,030 6,645,560 UP-9-12.4 Other works LS 1 762,662 10% of 1.1+1.2
8,389,2863. Miscellaneous Works LS 1 890,063 10% of 1+2
9,790,6899,791,000 per number
Item No : EP-03Item : Rehabilitation of Minor Tank / Anicut, Type : Tmi-C in EPProvince : Eastern Province
No. Unit Unit Price(Rs)
Q'ty Amount (Rs) Remarks Ref. No
1. Earth Works1.1 Clearing of top soil m3 99 0 0 UP-21.2 Excavation & backfilling for tank m3 362 0 0 UP-31.3 Excavation & backfilling for tank m3 621 0 0 UP-51.4 Excavation & backfilling for main canal m3 621 360 223,549 UP-41.5 Other works LS 1 22,355 10% of 1.1+1.2
245,9042. Concrete Works
2.1 Concrete 1:3:6 (40) include. necessary works m3 14,542 0 0 UP-72.2 Re-inforced concrete, incl. form etc. m3 30,970 0 0 UP-82.3 Main canal lining m 6,452 1,000 6,452,000 UP-9-12.4 Other works LS 1 645,200 10% of 1.1+1.2
7,097,2003. Miscellaneous Works LS 1 734,310 10% of 1+2
8,077,4148,077,000 per number
sub-total
Round
Description of Works
sub-total
sub-total
Round
sub-total
sub-total
Round
Breakdown of Lamp Sum Price for Minor Tank Rehabilitation
Description of Works
Description of Works
sub-total
(3) Breakdown of Lamp Sum Cost for Minor Tank Rehabilitation by Province

C-88
Item No : NCP-01Item : Rehabilitation of Minor Tank / Anicut, Type : Tmi-H in NCPProvince : North Central Province
No. Unit Unit Price(Rs)
Q'ty Amount (Rs) Remarks Ref. No
1. Earth Works1.1 Clearing of top soil m3 126 100 12,562 UP-21.2 Forming bund from borrow of 1-2 km m3 458 360 164,882 UP-31.3 Excavation & backfilling m3 786 300 235,697 UP-51.4 Other works LS 1 24,826 10% of 1.1+1.2
437,9682. Concrete Works
2.1 Concrete 1:3:6 (40) include. necessary works m3 18,399 27 500,455 UP-72.2 Re-inforced concrete, incl. form etc. m3 39,184 19 746,056 UP-82.3 Main canal lining m 8,163 30 244,890 UP-9-12.4 Other works LS 1 149,140 10% of 1.1+1.2
1,640,5403. Miscellaneous Works LS 1 207,851 10% of 1+2
2,286,3592,286,000 per number
Item No : NCP-02Item : Rehabilitation of Minor Tank / Anicut, Type : Tmi-HC in NCPProvince : North Central Province
No. Unit Unit Price(Rs)
Q'ty Amount (Rs) Remarks Ref. No
1. Earth Works1.1 Clearing of top soil m3 126 100 12,562 UP-21.2 Forming bund from borrow of 1-2 km m3 458 360 164,882 UP-31.3 Excavation & backfilling for tank m3 786 200 157,131 UP-51.4 Excavation & backfilling for main canal m3 786 360 282,837 UP-41.5 Other works LS 1 29,540 10% of 1.1+1.2
646,9522. Concrete Works
2.1 Concrete 1:3:6 (40) include. necessary works m3 18,399 27 496,775 UP-72.2 Re-inforced concrete, incl. form etc. m3 39,184 19 744,488 UP-82.3 Main canal lining m 8,163 1,030 8,407,890 UP-9-12.4 Other works LS 1 964,915 10% of 1.1+1.2
10,614,0683. Miscellaneous Works LS 1 1,126,102 10% of 1+2
12,387,12312,387,000 per number
Item No : NCP-03Item : Rehabilitation of Minor Tank / Anicut, Type : Tmi-C in NCPProvince : North Central Province
No. Unit Unit Price(Rs)
Q'ty Amount (Rs) Remarks Ref. No
1. Earth Works1.1 Clearing of top soil m3 126 0 0 UP-21.2 Earth Works m3 458 0 0 UP-31.3 Excavation & backfilling for tank m3 786 0 0 UP-51.4 Excavation & backfilling for main canal m3 786 360 282,837 UP-41.5 Other works LS 1 28,284 10% of 1.1+1.2
311,1212. Concrete Works
2.1 Concrete 1:3:6 (40) include. necessary works m3 18,399 0 0 UP-72.2 Re-inforced concrete, incl. form etc. m3 39,184 0 0 UP-82.3 Main canal lining m 8,163 1,000 8,163,000 UP-9-12.4 Other works LS 1 816,300 10% of 1.1+1.2
8,979,3003. Miscellaneous Works LS 1 929,042 10% of 1+2
10,219,46310,219,000 per number
sub-total
Round
Description of Works
Round
sub-total
sub-total
Description of Works
sub-total
Breakdown of Lamp Sum Price for Minor Tank Rehabilitation
Description of Works
sub-total
sub-total
Round

C-89
Item No : NWP-01Item : Rehabilitation of Tank / Anicut, Type : Tmi-H in NWPProvince : North West Province
No. Unit Unit Price(Rs)
Q'ty Amount (Rs) Remarks Ref. No
1. Earth Works1.1 Clearing of top soil m3 117 100 11,670 UP-21.2 Forming bund from borrow of 1-2 km m3 425 360 153,171 UP-31.3 Excavation & backfilling m3 730 300 218,956 UP-51.4 Other works LS 1 23,063 10% of 1.1+1.2
406,8592. Concrete Works
2.1 Concrete 1:3:6 (40) include. necessary works m3 17,092 27 464,908 UP-72.2 Re-inforced concrete, incl. form etc. m3 36,400 19 693,063 UP-82.3 Main canal lining m 7,583 30 227,490 UP-9-12.4 Other works LS 1 138,546 10% of 1.1+1.2
1,524,0073. Miscellaneous Works LS 1 193,087 10% of 1+2
2,123,9532,124,000 per number
Item No : NWP-02Item : Rehabilitation of Tank / Anicut, Type : Tmi-HC in NWPProvince : North West Province
No. Unit Unit Price(Rs)
Q'ty Amount (Rs) Remarks Ref. No
1. Earth Works1.1 Clearing of top soil m3 117 100 11,670 UP-21.2 Forming bund from borrow of 1-2 km m3 425 360 153,171 UP-31.3 Excavation & backfilling for tank m3 730 200 145,970 UP-51.4 Excavation & backfilling for main canal m3 730 360 262,747 UP-41.5 Other works LS 1 27,442 10% of 1.1+1.2
601,0002. Concrete Works
2.1 Concrete 1:3:6 (40) include. necessary works m3 17,092 27 461,489 UP-72.2 Re-inforced concrete, incl. form etc. m3 36,400 19 691,607 UP-82.3 Main canal lining m 7,583 1,030 7,810,490 UP-9-12.4 Other works LS 1 896,359 10% of 1.1+1.2
9,859,9463. Miscellaneous Works LS 1 1,046,095 10% of 1+2
11,507,04011,507,000 per number
Item No : NWP-03Item : Rehabilitation of Tank / Anicut, Type : Tmi-C in NWPProvince : North West Province
No. Unit Unit Price(Rs)
Q'ty Amount (Rs) Remarks Ref. No
1. Earth Works1.1 Clearing of top soil m3 117 0 0 UP-21.2 Excavation & backfilling for tank m3 425 0 0 UP-31.3 Excavation & backfilling for tank m3 730 0 0 UP-51.4 Excavation & backfilling for main canal m3 730 360 262,747 UP-41.5 Other works LS 1 26,275 10% of 1.1+1.2
289,0222. Concrete Works
2.1 Concrete 1:3:6 (40) include. necessary works m3 17,092 0 0 UP-72.2 Re-inforced concrete, incl. form etc. m3 36,400 0 0 UP-82.3 Main canal lining m 7,583 1,030 7,810,490 UP-9-12.4 Other works LS 1 781,049 10% of 1.1+1.2
8,591,5393. Miscellaneous Works LS 1 888,056 10% of 1+2
9,768,6179,769,000 per number
sub-total
sub-total
Round
Round
Description of Works
Breakdown of Lamp Sum Price for Minor Tank Rehabilitation
Description of Works
sub-total
sub-total
sub-total
Round
Description of Works
sub-total

C-90
Item No : NP-01Item : Rehabilitation of Tank / Anicut, Type : Tmi-H in NPProvince : Northern Province
No. Unit Unit Price(Rs)
Q'ty Amount (Rs) Remarks Ref. No
1. Earth Works1.1 Clearing of top soil m3 118 100 11,800 UP-21.2 Forming bund from borrow of 1-2 km m3 430 360 154,881 UP-31.3 Excavation & backfilling m3 599 300 179,700 UP-51.4 Other works LS 1 19,150 10% of 1.1+1.2
365,5312. Concrete Works
2.1 Concrete 1:3:6 (40) include. necessary works m3 17,283 27 470,098 UP-72.2 Re-inforced concrete, incl. form etc. m3 36,807 19 700,800 UP-82.3 Main canal lining m 7,668 30 230,040 UP-9-12.4 Other works LS 1 140,094 10% of 1.1+1.2
1,541,0323. Miscellaneous Works LS 1 190,656 10% of 1+2
2,097,2192,097,000 per number
Item No : NP-02Item : Rehabilitation of Tank / Anicut, Type : Tmi-HC NPProvince : Northern Province
No. Unit Unit Price(Rs)
Q'ty Amount (Rs) Remarks Ref. No
1. Earth Works1.1 Clearing of top soil m3 118 100 11,800 UP-21.2 Clearing of top soil m3 430 360 154,881 UP-31.3 Excavation & backfilling for tank m3 599 200 119,800 UP-51.4 Excavation & backfilling for main canal m3 599 360 215,640 UP-41.5 Other works LS 1 22,744 10% of 1.1+1.2
524,8652. Concrete Works
2.1 Concrete 1:3:6 (40) include. necessary works m3 17,283 27 466,641 UP-72.2 Re-inforced concrete, incl. form etc. m3 36,807 19 699,328 UP-82.3 Main canal lining m 7,668 1,030 7,898,040 UP-9-12.4 Other works LS 1 906,401 10% of 1.1+1.2
9,970,4103. Miscellaneous Works LS 1 1,049,527 10% of 1+2
11,544,80211,545,000 per number
Item No : NP-03Item : Rehabilitation of Tank / Anicut, Type : Tmi-C in NPProvince : Northern Province
No. Unit Unit Price(Rs)
Q'ty Amount (Rs) Remarks Ref. No
1. Earth Works
1.1 Clearing of top soil m3 118 0 0 UP-2
1.2 Excavation & backfilling for tank m3 430 0 0 UP-31.3 Excavation & backfilling for tank m3 599 0 0 UP-51.4 Excavation & backfilling for main canal m3 599 360 215,640 UP-41.5 Other works LS 1 21,564 10% of 1.1+1.2
237,2042. Concrete Works
2.1 Concrete 1:3:6 (40) include. necessary works m3 17,283 0 0 UP-72.2 Re-inforced concrete, incl. form etc. m3 36,807 0 0 UP-82.3 Main canal lining m 7,668 1,030 7,898,040 UP-9-12.4 Other works LS 1 789,804 10% of 1.1+1.2
8,687,8443. Miscellaneous Works LS 1 892,505 10% of 1+2
9,817,5539,818,000 per number
sub-total
sub-total
Round
Description of Works
sub-total
sub-total
Round
Description of Works
Breakdown of Lamp Sum Price for Minor Tank Rehabilitation
Description of Works
sub-total
sub-total
Round

C-91
Item No : UP-01Item : Rehabilitation of Tank / Anicut, Type : Tmi-H in UPProvince : Uva Province
No. Unit Unit Price(Rs)
Q'ty Amount (Rs) Remarks Ref. No
1. Earth Works1.1 Clearing of top soil m3 88 100 8,767 UP-21.2 Forming bund from borrow of 1-2 km m3 320 360 115,073 UP-31.3 Excavation & backfilling m3 548 300 164,495 UP-51.4 Other works LS 1 17,326 10% of 1.1+1.2
305,6612. Concrete Works
2.1 Concrete 1:3:6 (40) include. necessary works m3 12,841 27 349,271 UP-72.2 Re-inforced concrete, incl. form etc. m3 27,347 19 520,678 UP-82.3 Main canal lining m 5,697 30 170,910 UP-9-12.4 Other works LS 1 104,086 10% of 1.1+1.2
1,144,9453. Miscellaneous Works LS 1 145,061 10% of 1+2
1,595,6661,596,000 per number
Item No : UP-02Item : Rehabilitation of Tank / Anicut, Type : Tmi-HC in NPProvince : Uva Province
No. Unit Unit Price(Rs)
Q'ty Amount (Rs) Remarks Ref. No
1. Earth Works1.1 Clearing of top soil m3 88 100 8,767 UP-21.2 Clearing of top soil m3 320 360 115,073 UP-31.3 Excavation & backfilling for tank m3 548 200 109,663 UP-51.4 Excavation & backfilling for main canal m3 548 360 197,394 UP-41.5 Other works LS 1 20,616 10% of 1.1+1.2
451,5132. Concrete Works
2.1 Concrete 1:3:6 (40) include. necessary works m3 12,841 27 346,703 UP-72.2 Re-inforced concrete, incl. form etc. m3 27,347 19 519,584 UP-82.3 Main canal lining m 5,697 1,030 5,867,910 UP-9-12.4 Other works LS 1 673,420 10% of 1.1+1.2
7,407,6173. Miscellaneous Works LS 1 785,913 10% of 1+2
8,645,0438,645,000 per number
Item No : UP-03Item : Rehabilitation of Tank / Anicut, Type : Tmi-C in NPProvince : Uva Province
No. Unit Unit Price(Rs)
Q'ty Amount (Rs) Remarks Ref. No
1. Earth Works1.1 Clearing of top soil m3 88 0 0 UP-21.2 Excavation & backfilling for tank m3 320 0 0 UP-31.3 Excavation & backfilling for tank m3 548 0 0 UP-51.4 Excavation & backfilling for main canal m3 548 360 197,394 UP-41.5 Other works LS 1 19,739 10% of 1.1+1.2
217,1332. Concrete Works
2.1 Concrete 1:3:6 (40) include. necessary works m3 12,841 0 0 UP-72.2 Re-inforced concrete, incl. form etc. m3 27,347 0 0 UP-82.3 Main canal lining m 5,697 1,030 5,867,910 UP-9-12.4 Other works LS 1 586,791 10% of 1.1+1.2
6,454,7013. Miscellaneous Works LS 1 667,183 10% of 1+2
7,339,0177,339,000 per number
sub-total
sub-total
Round
Description of Works
sub-total
sub-total
Round
Description of Works
Breakdown of Lamp Sum Price for Minor Tank Rehabilitation
Description of Works
sub-total
sub-total
Round

C-92
Item No : BUP-01Item : Construction of agro-well, 6m dia. 6m depthProvince : Eastern Province
No. Unit Unit Price(Rs)
Q'ty Amount (Rs) Remarks Ref. No
1. Earth Works1.1 Site clearing LS 5,000 1 5,000 PEACE PJT 20111.2 Excavation of soil m3 136 34 4,570 PEACE PJT 20111.3 Excavation of rock m3 1,354 14 18,956 PEACE PJT 20111.4 Other works LS 5,705 20% of sum of 1
28,5262. Concrete Works
2.1 Random rubble masonry with cement and mortar m3 6,893 8 55,144 PEACE PJT 20112.2 Thik brick masonry with cement and mortar m3 10,400 25 260,000 PEACE PJT 20112.3 Re-inforced concrete, incl. form etc. m3 11,176 2 17,882 PEACE PJT 20112.4 Other works LS 1 133,210 40% of sum of 2
466,2363. Miscellaneous Works LS 1 97,038 20% of 1+2
591,799592,000 per number
Item No : BUP-02Item : Construction of water harvesting pondProvince : Eastern Province
No. Unit Unit Price(Rs)
Q'ty Amount (Rs) Remarks Ref. No
1. Earth Works1.1 Site clearing LS 1,000 1 1,000 PEACE PJT 20111.2 Excavation of soil m3 136 180 24,480 PEACE PJT 20111.3 Excavation of rock m3 1,354 0 0 PEACE PJT 20111.4 Other works LS 2,548 10% of sum of 1
25,4802. Concrete Works
2.1 Random rubble masonry with cement and mortar m3 6,893 20 137,860 PEACE PJT 20112.2 Thik brick masonry with cement and mortar m3 10,400 0 0 PEACE PJT 20112.3 Re-inforced concrete, incl. form etc. m3 11,176 16 178,816 PEACE PJT 20112.4 Other works LS 1 31,668 10% of sum of 2
348,3443. Miscellaneous Works LS 1 17,417 5% of 1+2
391,241391,000 per number
Item No : BUP-03Item : Construction of drying floorProvince : Eastern Province
No. Unit Unit Price(Rs)
Q'ty Amount (Rs) Remarks Ref. No
1. Earth Works1.1 Site clearing LS 1,000 1 1,000 PEACE PJT 20111.2 Excavation of soil m3 136 30 4,080 PEACE PJT 20111.3 Excavation of rock m3 1,354 0 0 PEACE PJT 20111.4 Other works LS 508 10% of sum of 1
5,0802. Concrete Works
2.1 Random rubble masonry with cement and mortar m3 6,893 20 137,860 PEACE PJT 20112.2 Thik brick masonry with cement and mortar m3 10,400 0 0 PEACE PJT 20112.3 Re-inforced concrete, incl. form etc. m3 11,176 15 167,640 PEACE PJT 20112.4 Other works LS 1 30,550 10% of sum of 2
336,0503. Miscellaneous Works LS 1 16,803 5% of 1+2
357,933358,000 per number
sub-total
Breakdown of Unit Price
Description of Works
sub-total
TotalRound
Description of Works
sub-total
sub-total
RoundTotal
Breakdown of Unit Price
Description of Works
sub-total
sub-total
Round
Breakdown of Unit Price
Total
2.4 Breakdown of Major Unit Prices

C-93
Item No : BUP-04Item : Feeder canal construction for OFC (including structure)Province : Eastern Province
No. Unit Unit Price(Rs)
Q'ty Amount (Rs) Remarks Ref. No
1. Earth Works1.1 Site clearing ha 24,069 0.01 241 UP-11.2 Excavation soil m3 329 8.10 2,665 UP-61.3 Other works LS 1 291 10% of sum of 1
3,1962. Concrete Works
2.1 Re-inforced concrete, incl. form etc. m3 30,970 1.49 45,990 UP-82.2 m3 14,542 0.29 4,217 UP-72.3 Other works LS 1 5,021 10% of sum of 1
55,2283. Miscellaneous Works LS 1 2,921 5% of 1+2
61,346 per ha
Item No : BUP-05Item : Collecting center building, 200 m2Province : Eastern Province
No. Unit Unit Price(Rs)
Q'ty Amount (Rs) Remarks Ref. No
1. Earth Works1.1 Site clearing ha 21,088 0.02 506 UP-11.2 Excavation soil m3 329 17.50 5,757 UP-61.3 Other works LS 1 626 10% of sum of 1
6,8902. Concrete Works
2.1 Re-inforced concrete, incl. form etc. m3 30,970 57.63 1,784,646 UP-82.2 m3 14,542 10.00 145,423 UP-72.3 Gravel bedding m3 504 100.00 50,4012.4 Other works LS 1 193,007 10% of sum of 1
2,173,4773. Truss & roofing
3.1 Steel truss ton 93,333 2.390 223,104 L-75x75x9,3.2 Roof m2 833 240 200,0001.3 Other works LS 1 42,310 10% of sum of 1
465,414
2,645,782
Item No : BUP-06Item : Provision of electric fenceProvince : Common
No. Unit Unit Price(Rs)
Q'ty Amount (Rs) Remarks Ref. No
1. Supply and installation of electric fence km 250,000 1 250,000 3 strand fence
2. Supply of chemically treated timber post km 265,000 1 265,000 for 1 above
3. Supply and installation of fence control equipment with solar power km 19,000 1 19,000 Rs.550,000/30kmsystem
4. Other orks LS 1 47,000 10% of 1 to 3
581,000 per km
Item No : BUP-07Item : Provision of drip irrigation systemProvince : Common
No. Unit Unit Price(Rs)
Q'ty Amount (Rs) Remarks Ref. No
per 1.2 ha
1. Supply and installation of water tank of 1,000 liter nos 16,200 1 16,200 1000 liter tank
2. Supply and installation of support for water tank LS 20,000 1 20,000 steel angle
3. Supply of soft polyethlene pipe D20mm m 80 400 32,000
4. Other orks LS 1 6,220 10% of 1 to 3
74,420 per 1.2 ha62,000 per 1 ha
Description of Works
Total
Description of Works
sub-total
Total
sub-total
Concrete 1:3:6 (40) include. necessary works
sub-total
sub-total
Total
Total per ha
sub-total
Total
Description of Works
Concrete 1:3:6 (40) include. necessary works
Description of Works
Breakdown of Unit Price
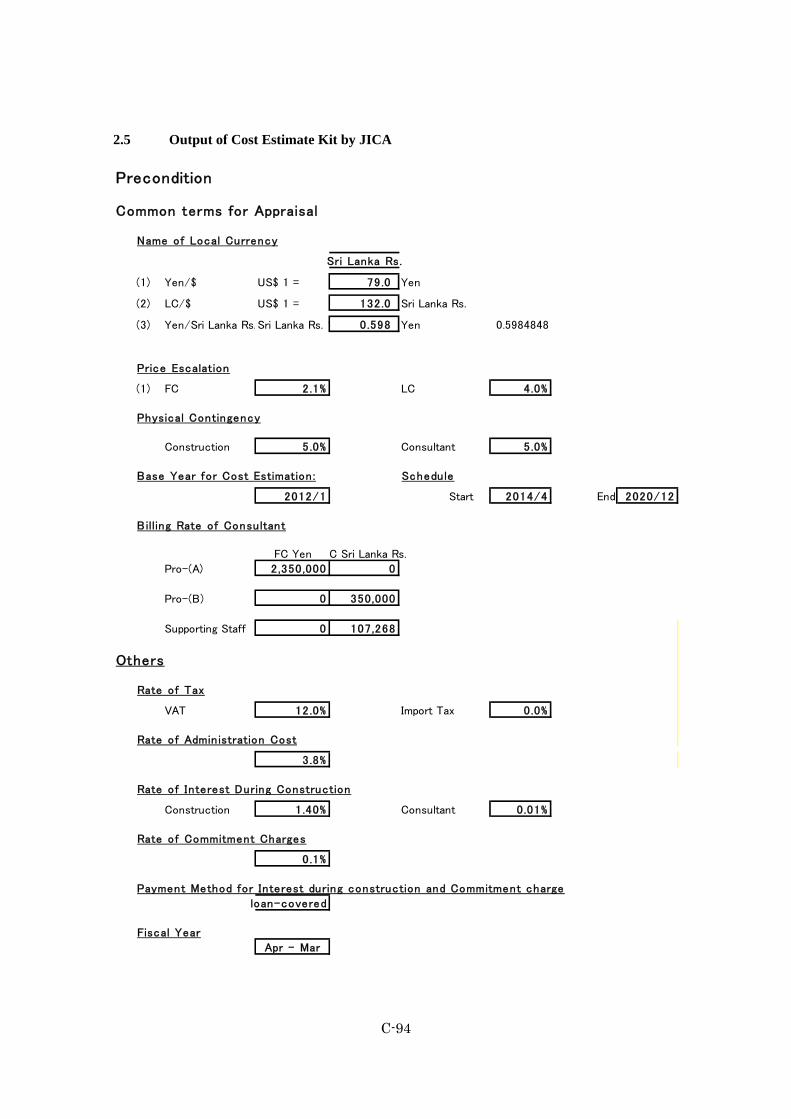
C-94
Precondition
Common terms for Appraisal
Name of Local Currency
Sri Lanka Rs.
(1) Yen/$ US$ 1 = 79.0 Yen
(2) LC/$ US$ 1 = 132.0 Sri Lanka Rs.
(3) Yen/Sri Lanka Rs.Sri Lanka Rs. 1 0 .598 Yen 0.5984848
Price Escalation
(1) FC 2.1% LC 4.0%
Physical Contingency
Construction 5.0% Consultant 5 .0%
Base Year for Cost Estimation : Schedule
2012/1 Start 2014/4 End 2020/12
Billing Rate of Consultant
FC Yen C Sri Lanka Rs.
Pro-(A) 2 ,350,000 0
Pro-(B) 0 350,000
Supporting Staff 0 107,268
Others
Rate of Tax
VAT 12.0% Import Tax 0.0%
Rate of Admin istration Cost
3 .8%
Rate of Interest During Construction
Construction 1.40% Consultant 0.01%
Rate of Commitment Charges
0.1%
Payment Method for Interest during construction and Commitment charge
loan-covered
Fiscal Year
Apr - Mar
2.5 Output of Cost Estimate Kit by JICA

C-95
US $ =yen 79
Sri Lanka Rs. =yen 0.59848
Local Total
Sri Lanka Rs. yen
0 0
Civil Work Package-1 (LCB): Kurai tank augmentation & Parangi aru 借款対象率 100
Foreign Local Foreign Local
yen Sri Lanka Rs. yen Sri Lanka Rs. yen
Kurai tank bund rehabilitation LS 1 35,702,244 32,121,851 54,926,529
Parangi anicut rehabilitation LS 1 53,679,715 48,296,455 82,584,177
Supply canal LS 1 63,171,836 56,836,660 97,187,440
Canal rehabilitation LS 8,637,727 7,771,495 13,288,812
Total 161,191,523 145,026,459 247,986,958
Civil Work Package-2 (LCB): Welimaruthamadu Irrigation 借款対象率 100
Foreign Local Foreign Local
yen Sri Lanka Rs. yen Sri Lanka Rs. yen
Tank bund rehabilitation 1 LS 7,498,356 6,746,385 11,535,932
Canal rehabilitation 1 LS 27,984,557 25,178,131 43,053,165
Miscellaneous works 1 LS 12,849,531 11,560,918 19,768,509
Total 48,332,444 43,485,433 74,357,606
Civil Work Package-3 (LCB) : Muthayankaddu Tank Lift Irrigation 借款対象率 100
Foreign Local Foreign Local
yen Sri Lanka Rs. yen Sri Lanka Rs. yen
Headwork rehabilitation LS 1 11,825,965 10,640,000 18,193,792
Rehabilitation of left bank canalrehabilitation LS 1 50,790,185 45,696,700 78,138,746
Rehabilitation of right bankcanal rehabilitation LS 1 37,505,425 33,744,200 57,700,654
Right bank area pump system LS 1 91,641,502 82,451,250 140,986,926
Left bank area pump system LS 1 45,210,197 40,676,300 69,554,149
Total 236,973,273 213,208,450 364,574,266
Civil Work Package-4 (LCB) : Vavunikulam Tank - Right & Left Bank Lift 借款対象率 100
Foreign Local Foreign Local
yen Sri Lanka Rs. yen Sri Lanka Rs. yen
Left bank main canal LS 1 50,839,589 45,741,150 78,214,753
Right bank main canal LS 1 97,484,851 87,708,600 149,976,694
Total 148,324,440 133,449,750 228,191,447
Total
item unit Quantity
Unit Price CostTotal
item unit Quantity
Unit Price Cost
Cost Breakdown for Package
item
Land Acquisition Cost
item unit Quantity
Unit Price CostTotal
Totalitem unit Quantity
Unit Price Cost

C-96
Civil Work Package-5 (LCB) : Mahaweli System H 借款対象率 100
Foreign Local Foreign Local
yen Sri Lanka Rs. yen Sri Lanka Rs. yen
North central province LS 1 139,201,597 125,241,789 214,156,303
North western province LS 1 6,999,528 6,297,582 10,768,505
Total 146,201,125 131,539,371 224,924,807
Civil Work Package-6 (LCB) : Ingnimitiva scheme 借款対象率 100
Foreign Local Foreign Local
yen Sri Lanka Rs. yen Sri Lanka Rs. yen
Canal rehabilitation LS 1 152,773,314 137,452,469 235,035,868
Miscellaneous works LS 1 7,638,666 6,872,623 11,751,793
Total 160,411,980 144,325,092 246,787,661
Civil Work Package-7 (LCB) : Neelabemma scheme 借款対象率 100
Foreign Local Foreign Local
yen Sri Lanka Rs. yen Sri Lanka Rs. yen
Tank bund rehabilitation LS 1 0 0 0
Canal rehabilitation LS 1 35,437,804 31,883,930 54,519,699
Miscellaneous works LS 1 3,543,780 3,188,393 5,451,970
Total 38,981,585 35,072,323 59,971,669
Civil Work Package-8 (LCB) : Major tank rehabilitation 借款対象率 100
Foreign Local Foreign Local
yen Sri Lanka Rs. yen Sri Lanka Rs. yen
Vahaneri tank LS 1 18,076,221 16,263,450 27,809,570
Yan oya scheme LS 1 6,661,441 5,993,400 10,248,372
Mahadivulwewa LS 1 8,509,248 7,655,900 13,091,152
Tabbowa LS 1 6,859,449 6,171,550 10,552,998
Manankatiya LS 1 13,357,894 12,035,800 20,550,606
Total 53,464,253 48,120,100 82,252,697
Civil Work Package-9 (LCB) : Medium tank rehabilitation 借款対象率 100
Foreign Local Foreign Local
yen Sri Lanka Rs. yen Sri Lanka Rs. yen
Eastern province no 7 35,658,785 32,082,750 54,859,669
Northern province no 21 139,969,630 125,932,800 215,337,892
North central province no 1 4,698,487 4,577,300 7,826,921
North western province no 1 7,709,829 6,936,650 11,861,275
Uva province no 2 1,717,488 1,545,250 2,642,289
Total 189,754,218 171,074,750 292,528,047
item unit Quantity
Unit Price CostTotal
Total
item unit Quantity
Unit Price CostTotal
item unit Quantity
Unit Price Cost
Total
item unit Quantity
Unit Price CostTotal
item unit Quantity
Unit Price Cost

C-97
Civil Work Package-10 (LCB) : Minor tank rehabilitation 借款対象率 100
Foreign Local Foreign Local
yen Sri Lanka Rs. yen Sri Lanka Rs. yen
Eastern province no 16 63,619,801 57,239,700 97,876,616
Northern province no 14 62,745,302 56,452,900 96,531,233
North central province no 17 90,326,252 81,267,900 138,963,465
North western province no 16 84,317,962 75,862,150 129,719,942
Uva province no 8 26,471,878 23,817,150 40,725,966
Total 327,481,194 294,639,800 503,817,221
Civil Work Package-11 (LCB) : Agro well provision 借款対象率 100
Foreign Local Foreign Local
yen Sri Lanka Rs. yen Sri Lanka Rs. yen
Eastern province no 1,097 193,104,300 166,988,100 293,043,338
Northern province no 618 125,355,646 108,981,300 190,578,774
North central province no 1,115 238,356,420 207,591,350 362,595,691
North western province no 1,142 229,425,542 199,389,950 348,756,440
Uva province no 1,616 257,381,471 221,625,400 390,019,840
MASL no 83 17,855,950 15,554,500 27,165,007
Total 1,061,479,329 920,130,600 1,612,159,091
Civil Work Package-12 (LCB) : Rural & access road rehabilitation 借款対象率 100
Foreign Local Foreign Local
yen Sri Lanka Rs. yen Sri Lanka Rs. yen
Eastern province Km 155 52,015,962 46,799,550 80,024,556
Northern province Km 168 59,741,351 53,750,200 91,909,771
North central province Km 136 72,410,694 65,149,000 111,401,067
North western province Km 82 28,830,068 25,938,850 44,353,951
Uva province Km 28 7,627,358 6,862,450 11,734,397
MASL Km 59 34,303,467 30,863,350 52,774,565
Total 254,928,900 229,363,400 392,198,308
Procurement of equipment (1) (LCB) : Vehicle & equipment for PMU & PIUs 借款対象率 100
Foreign Local Foreign Local
yen Sri Lanka Rs. yen Sri Lanka Rs. yen
4WD Vehicles no 1 4,200,000 0 4,200,000 0 4,200,000
4WD pickup truck no 24 3,000,000 0 72,000,000 0 72,000,000
Motorcycles no 80 200,000 0 16,000,000 0 16,000,000
Office equipment LS 1 12,876,297 12,876,297 0 12,876,297
Total 105,076,297 0 105,076,297
Totalitem unit Quantity
Unit Price Cost
Total
item unit Quantity
Unit Price CostTotal
item unit Quantity
Unit Price Cost
Totalitem unit Quantity
Unit Price Cost

C-98
Procurement of equipment (2) (LCB) : Micro irrigation system 借款対象率 100
Foreign Local Foreign Local
yen Sri Lanka Rs. yen Sri Lanka Rs. yen
Eastern province LS 1 6,274,045 11,743,700 13,302,415
Northern province LS 1 5,529,357 7,963,000 10,295,053
North central province LS 1 8,016,400 18,975,400 19,372,798
North western province LS 1 16,180,805 41,158,500 40,813,344
Uva province LS 1 13,232,692 29,664,500 30,986,302
MASL LS 1 3,429,231 8,107,100 8,281,168
Total 52,662,529 117,612,200 123,051,079
Procurement of equipment (3) (LCB) : Farm machinery & equipment 借款対象率 100
Foreign Local Foreign Local
yen Sri Lanka Rs. yen Sri Lanka Rs. yen
Eastern province LS 1 14,907,359 58,120,300 49,691,196
Northern province LS 1 9,564,668 37,290,400 31,882,227
North central province LS 1 24,992,525 97,440,000 83,308,416
North western province LS 1 37,868,343 147,639,800 126,227,811
Uva province LS 1 8,773,418 34,205,500 29,244,725
MASL LS 1 10,690,050 41,678,000 35,633,499
Total 106,796,362 416,374,000 355,987,874
Soft component (1) : Agricultural crop promotion program 借款対象率 100
Foreign Local Foreign Local
yen Sri Lanka Rs. yen Sri Lanka Rs. yenProduction improvementprogram LS 1 15,063,742 170,097,000 116,863,394
Logistic system improvement& other program LS 1 285,196,110 190,852,931 399,417,173
Enhancement of extensionservice program LS 1 47,585,145 38,140,000 70,411,172
Total 347,844,996 399,089,931 586,691,739
Soft component (2) : Livestock product promotion program 借款対象率 100
Foreign Local Foreign Local
yen Sri Lanka Rs. yen Sri Lanka Rs. yenProduction improvementprogram LS 1 189,023,325 385,750,000 419,886,386
Market development program LS 1 57,556,420 91,126,000 112,093,509
Laivestock service qualityprogram LS 1 56,437,262 58,888,000 91,679,954
0
Total 303,017,007 535,764,000 623,659,849
item unit Quantity
Unit Price CostTotal
Totalitem unit Quantity
Unit Price Cost
Total
item unit Quantity
Unit Price CostTotal
item unit Quantity
Unit Price Cost

C-99
Implementation ScheduleMonth
4 5 6 7 8 9 10 11 12 1 2 3 4 5 6 7 8 9 10 11 12 1 2 3 4 5 6 7 8 9 10 11 12 1 2 3 4 5 6 7 8 9 10 11 12 1 2 3 4 5 6 7 8 9 10 11 12 1 2 3 4 5 6 7 8 9 10 11 12 1 2 3 4 5 6 7 8 9 10 11 12 1 2 3 4 5 6 7 8 9 10 11 12 1 2 3
0
1 1
1 1
1 1 1 1 1 1 1 1 1 1 10
1 1 1 1 1 1 1 1 1 1 1 1 1 1 1 1 1 1 1 1 1 1 1 1 1 1 1 1 1 1 1 1 1 1 1 1 1 1 1 1 1 1 1 1 1 1 1 1 1 1 1 1 1 1 1 1 1 1 1 1 1 1 1 1 1 1 1 1 1 1 1 1 72
0
0
241 1 1 1 1 1 1 1 1 1 1 1 1 1 1 1 1 1 1 1 1 1 1 1
141 1 1 1 1 1 1 1 1 1 1 1 1 1 1 1 1 1 1 1
361 1 1 1 1 1 1 1 1 1 1 1 1 1 1 1 1 1 1 1 1 1 1 1 1 1 1 1 1 1 1 1 1 1 1 1
241 1 1 1 1 1 1 1 1 1 1 1 1 1 1 1 1 1 1 1 1 1 1 1
241 1 1 1 1 1 1 1 1 1 1 1 1 1 1 1 1 1 1 1 1 1 1 1
241 1 1 1 1 1 1 1 1 1 1 1 1 1 1 1 1 1 1 1 1 1 1 1
201 1 1 1 1 1 1 1 1 1 1 1 1 1 1 1 1 1 1 1
481 1 1 1 1 1 1 1 1 1 1 1 1 1 1 1 1 1 1 1 1 1 1 1 1 1 1 1 1 1 1 1 1 1 1 1 1 1 1 1 1 1 1 1 1 1 1 1
481 1 1 1 1 1 1 1 1 1 1 1 1 1 1 1 1 1 1 1 1 1 1 1 1 1 1 1 1 1 1 1 1 1 1 1 1 1 1 1 1 1 1 1 1 1 1 1
481 1 1 1 1 1 1 1 1 1 1 1 1 1 1 1 1 1 1 1 1 1 1 1 1 1 1 1 1 1 1 1 1 1 1 1 1 1 1 1 1 1 1 1 1 1 1 1
391 1 1 1 1 1 1 1 1 1 1 1 1 1 1 1 1 1 1 1 1 1 1 1 1 1 1 1 1 1 1 1 1 1 1 1 1 1 1
481 1 1 1 1 1 1 1 1 1 1 1 1 1 1 1 1 1 1 1 1 1 1 1 1 1 1 1 1 1 1 1 1 1 1 1 1 1 1 1 1 1 1 1 1 1 1 1
101 1 1 1 1 1 1 1 1 1
571 1 1 1 1 1 1 1 1 1 1 1 1 1 1 1 1 1 1 1 1 1 1 1 1 1 1 1 1 1 1 1 1 1 1 1 1 1 1 1 1 1 1 1 1 1 1 1 1 1 1 1 1 1 1 1 1
541 1 1 1 1 1 1 1 1 1 1 1 1 1 1 1 1 1 1 1 1 1 1 1 1 1 1 1 1 1 1 1 1 1 1 1 1 1 1 1 1 1 1 1 1 1 1 1 1 1 1 1 1 1
661 1 1 1 1 1 1 1 1 1 1 1 1 1 1 1 1 1 1 1 1 1 1 1 1 1 1 1 1 1 1 1 1 1 1 1 1 1 1 1 1 1 1 1 1 1 1 1 1 1 1 1 1 1 1 1 1 1 1 1 1 1 1 1 1 1
661 1 1 1 1 1 1 1 1 1 1 1 1 1 1 1 1 1 1 1 1 1 1 1 1 1 1 1 1 1 1 1 1 1 1 1 1 1 1 1 1 1 1 1 1 1 1 1 1 1 1 1 1 1 1 1 1 1 1 1 1 1 1 1 1 1
12 12 12 9
Soft component (2) : Livestock product promotion program
0 0 9 12Soft component (1) : Agricultural crop promotion program
0 0 9 12 12 12 12 9
0 2 12
Civil Work Package-3 (LCB) : Muthayankaddu Tank Lift Irrigat
0 0 0 12 12 12 0 0
Civil Work Package-1 (LCB): Kurai tank augmentation & Paran
0 0 0 12 12 0 0 0
0 0 0 0 0 0
Implementation
0Land Acquisition
0
Signing of Loan Agreement
2013 2014 2015 2016 2019 2020
Pledge
2017 2018
Civil Work Package-6 (LCB) : Ingnimitiva scheme
Civil Work Package-7 (LCB) : Neelabemma scheme
Civil Work Package-8 (LCB) : Major tank rehabilitation
Civil Work Package-9 (LCB) : Medium tank rehabilitation
0
0
0
Consulting Services
Civil Work Package-4 (LCB) : Vavunikulam Tank - Right & Lef
Civil Work Package-5 (LCB) : Mahaweli System H
Civil Work Package-2 (LCB): Welimaruthamadu Irrigation
0
0 0
0 0 0 12 12 0 0 0
0 2 12 10 0
0 0
0 0 2 12 6 0 0 0
0 0 12 12 0
3 0
0 0 9 12 12 12 3 0
0 9 12 12 12
3 0
0 0 0 12 12 12 3 0
0 0 9 12 12
Civil Work Package-10 (LCB) : Minor tank rehabilitation
Civil Work Package-11 (LCB) : Agro well provision
Civil Work Package-12 (LCB) : Rural & access road rehabilita
Procurement of equipment (1) (LCB) : Vehicle & equipment for
Procurement of equipment (2) (LCB) : Micro irrigation system
12 3 0
0 10 0 0 0 0 0 0
0 0 9 12 12
12
12 12 0
Procurement of equipment (3) (LCB) : Farm machinery & equi
0 0 6 12 12 12 12 0
0 0 9 12 12

C-100
US $ = yen 79Sri Lanka Rs. = yen 0.59848
CombinedTotal
Unit Qty. Rate Amount Rate Amount ('000)('000) ('000) Yen
A Remuneration1 Professional (A) M/M 122 2,350,000 286,700 286,7002 Professional (B) M/M 1973 0 350,000 690,550 413,2803 Supporting Staff M/M 6971 0 107,268 747,765 447,523
Subtotal of A 286,700 1,438,315 1,147,503
0B Direct Cost 0
1 International air fare Trip 21 200,000 4,200 0 4,2002 Mobilization cost for Professional (A Time 6 15,000 90 0 903 Per Diem for Pro (A) Month 122 300,000 36,600 0 36,6004 Procurement of Vehicle No. 21 2,500,000 52,500 0 52,5005 Procurement of motorcycle No. 62 200,000 12,400 0 12,4006 Hotel accommodation for short term Month 12 0 300,000 3,600 2,1557 Accommodation for Pro (A) Month 72 0 300,000 21,600 12,9278 Out of station allowance for Pro (B) Day 5919 0 2,000 11,838 7,0859 Lodging cost for Pro (B) MM 1973 0 50,000 98,650 59,040
10 Initial office set up cost place 6 0 1,000,000 6,000 3,59111 Office supply Month 444 0 50,000 22,200 13,28612 Office equipment procurement cost LS 1 0 10,000,000 10,000 5,98513 O&M for vehicle & motorcycle Month 66 0 1,782,000 117,612 70,38814 Vehicle rental charge Month 18 0 1,000,000 18,000 10,77315 Communication cost Month 74 0 50,000 3,700 2,21416 Report preparation cost Month 74 0 30,000 2,220 1,32917 Survey & Geological Investigation LS 1 0 20,000,000 20,000 11,97018 Baseline survey and M&E LS 1 0 10,000,000 10,000 5,98519 Ground water survey Location 60 0 200,000 12,000 7,18220 Contingency LS 1 0 10,000,000 10,000 5,985
000
Subtotal of B 105,790 367,420 325,684
Total 392,490 1,805,735 1,473,186
Cost Breakdown for the Consulting Services
Sri Lanka Rs.(Yen)Local PortionForeign Portion

C-101
Manning Schedule for the Consulting Services
PositionF/C Yen C/ Sri Lanka R4 5 6 7 8 9 10 11 12 1 2 3 4 5 6 7 8 9 10 11 12 1 2 3 4 5 6 7 8 9 10 11 12 1 2 3 4 5 6 7 8 9 10 11 12 1 2 3 4 5 6 7 8 9 10 11 12 1 2 3 4 5 6 7 8 9 10 11 12 1 2 3 4 5 6 7 8 9 10 11 12 1 2 3
1. PMU Central
A 1 Project Director 2350000 0 0
A 2 Team Leader / Project Management 2350000 0 1 1 1 1 1 1 1 1 1 1 1 1 1 1 1 1 1 1 1 1 1 1 1 1 1 1 1 1 1 1 1 1 1 1 1 1 1 1 1 1 1 1 1 1 1 1 1 1 1 1 1 1 1 1 1 1 1 1 58
A 3 Agriculture Expert (Marketing) 2350000 0 1 1 1 1 1 1 1 1 1 1 1 1 1 1 1 1 1 1 1 1 1 1 1 1 1 1 1 1 1 1 1 1 1 1 1 1 1 1 1 1 1 1 1 1 44
A 4 Agriculture Expert (Fruits Crop Management) 2350000 0 1 1 1 1 1 1 1 1 8
A 5 Specialist as required 2350000 0 1 1 1 1 1 1 1 1 1 1 1 1 12
B 1 Co-Team Leader / Sr.Monitoring Engineer 0 350000 1 1 1 1 1 1 1 1 1 1 1 1 1 1 1 1 1 1 1 1 1 1 1 1 1 1 1 1 1 1 1 1 1 1 1 1 1 1 1 1 1 1 1 1 1 1 1 1 1 1 1 1 1 1 1 1 1 1 1 1 1 1 1 63
B 2 Architect 0 350000 1 1 1 1 1 1 1 1 1 1 1 1 12
B 3 Sr.Livestock Expert 0 350000 1 1 1 1 1 1 1 1 1 1 1 1 1 1 1 1 1 1 1 1 1 1 1 1 1 1 1 1 1 1 1 1 1 1 1 1 1 1 1 1 1 1 1 1 1 1 1 1 1 1 1 1 1 1 1 1 1 1 1 1 1 1 1 1 1 1 1 1 1 1 1 1 1 1 1 75
B 4 Sr.Agronomist 0 350000 1 1 1 1 1 1 1 1 1 1 1 1 1 1 1 1 1 1 1 1 1 1 1 1 1 1 1 1 1 1 1 1 1 1 1 1 1 1 1 1 1 1 1 1 1 1 1 1 1 1 1 1 1 1 1 1 1 1 1 1 1 1 1 1 1 1 1 1 1 1 1 1 1 1 1 75
B 5 Project monitoring and evaluation 0 350000 1 1 1 1 1 1 1 1 1 1 1 1 1 1 14
B 6 Hydrogeologist 0 350000 1 1 1 1 1 1 6
B 7 Accountant / Financial Management 0 350000 0
B 8 Procurement Specialist 0 350000 1 1 1 1 1 1 1 1 1 1 1 1 12
B 9 Specialist as required 0 350000 1 1 1 1 1 1 1 1 1 1 10
2. PIU NorthB 10 Sr. Design/Construction Engineer (North) 0 350000 1 1 1 1 1 1 1 1 1 1 1 1 1 1 1 1 1 1 1 1 1 1 1 1 1 1 1 1 1 1 1 1 1 1 1 1 1 1 1 1 1 1 1 1 1 1 1 1 1 1 1 1 1 1 1 1 1 1 58
B 11 Design/Construction Engineer (Mullaitive) 0 350000 1 1 1 1 1 1 1 1 1 1 1 1 1 1 1 1 1 1 1 1 1 1 1 1 1 1 1 1 1 1 1 1 1 1 1 1 1 1 1 1 1 1 1 1 1 1 1 1 1 1 1 1 1 1 1 1 1 1 58
B 12 Design/Construction Engineer (Mannar) 0 350000 1 1 1 1 1 1 1 1 1 1 1 1 1 1 1 1 1 1 1 1 1 1 1 1 1 1 1 1 1 1 1 1 1 1 1 1 1 1 1 1 1 1 1 1 1 1 1 1 1 1 50
B 13 Mechanical Engineer 0 350000 1 1 1 1 1 1 1 1 1 1 1 1 1 1 1 1 1 1 1 1 1 21
B 14 Surveyor 0 350000 1 1 1 1 1 1 1 1 1 1 1 1 1 1 1 15
B 15 Agriculture Marketing 0 350000 1 1 1 1 1 1 1 1 1 1 1 1 1 1 1 1 1 1 1 1 1 1 1 1 1 1 1 1 1 1 1 1 1 1 1 1 1 1 1 1 1 1 1 1 1 1 1 1 1 1 1 1 1 1 1 1 1 1 1 1 1 1 1 1 1 1 1 1 1 1 1 1 72
B 16 Agriculture Extension (OFC & Vegetable) 0 350000 1 1 1 1 1 1 1 1 1 1 1 1 1 1 1 1 1 1 1 1 1 1 1 1 1 1 1 1 1 1 1 1 1 1 1 1 1 1 1 1 1 1 1 1 1 1 1 1 1 1 1 1 1 1 1 1 1 1 1 1 1 1 1 1 1 1 1 1 1 1 1 1 72
B 17 Agriculture Extension (Fruits) 0 350000 1 1 1 1 1 1 1 1 1 1 1 1 1 1 1 1 1 1 1 1 1 1 1 1 1 1 1 1 1 1 1 1 1 1 1 1 1 1 1 1 1 1 1 1 1 1 1 1 1 1 1 1 1 1 1 1 1 1 1 1 1 1 1 1 1 1 1 1 1 1 1 1 72
B 18 Livestock Expert 0 350000 1 1 1 1 1 1 1 1 1 1 1 1 1 1 1 1 1 1 1 1 1 1 1 1 24
3. PIU East 0
B 19 Design/Construction Engineer (East) 0 350000 1 1 1 1 1 1 1 1 1 1 1 1 1 1 1 1 1 1 1 1 1 1 1 1 1 1 1 1 1 1 1 1 1 1 1 1 1 1 1 1 1 1 1 1 1 1 1 1 1 1 1 51
B 20 Agriculture Marketing 0 350000 1 1 1 1 1 1 1 1 1 1 1 1 1 1 1 1 1 1 1 1 1 1 1 1 1 1 1 1 1 1 1 1 1 1 1 1 1 1 1 1 1 1 1 1 1 1 1 1 1 1 1 1 1 1 1 1 1 1 1 1 1 1 1 1 1 1 1 1 1 1 1 1 1 1 74
B 21 Agriculture Extension (OFC & Vegetable) 0 350000 1 1 1 1 1 1 1 1 1 1 1 1 1 1 1 1 1 1 1 1 1 1 1 1 1 1 1 1 1 1 1 1 1 1 1 1 1 1 1 1 1 1 1 1 1 1 1 1 1 1 1 1 1 1 1 1 1 1 1 1 1 1 1 1 1 1 1 1 1 1 1 1 1 1 74
B 22 Agriculture Extension (Fruits) 0 350000 1 1 1 1 1 1 1 1 1 1 1 1 1 1 1 1 1 1 1 1 1 1 1 1 1 1 1 1 1 1 1 1 1 1 1 1 1 1 1 1 1 1 1 1 1 1 1 1 1 1 1 1 1 1 1 1 1 1 1 1 1 1 1 1 1 1 1 1 1 1 1 1 1 1 74
B 23 Livestock Expert 0 350000 1 1 1 1 1 1 1 1 1 1 1 1 1 1 1 1 1 1 1 1 1 1 1 1 1 1 26
4. PIU North Central 0
B 24 Design/Construction Engineer 1 0 350000 1 1 1 1 1 1 1 1 1 1 1 1 1 1 1 1 1 1 1 1 1 1 1 1 1 1 1 1 1 1 1 1 1 1 1 1 1 1 1 1 1 1 1 1 1 1 1 1 1 1 1 51
B 25 Design/Construction Engineer 2 0 350000 1 1 1 1 1 1 1 1 1 1 1 1 1 1 1 1 1 1 1 1 1 1 1 1 1 1 1 1 1 1 1 1 1 1 1 1 1 1 1 1 1 1 1 1 1 1 1 1 1 1 1 51
B 26 Agriculture Marketing 0 350000 1 1 1 1 1 1 1 1 1 1 1 1 1 1 1 1 1 1 1 1 1 1 1 1 1 1 1 1 1 1 1 1 1 1 1 1 1 1 1 1 1 1 1 1 1 1 1 1 1 1 1 1 1 1 1 1 1 1 1 1 1 1 1 1 1 1 1 1 1 1 1 1 1 1 74
B 27 Agriculture Extension (OFC & Vegetable) 0 350000 1 1 1 1 1 1 1 1 1 1 1 1 1 1 1 1 1 1 1 1 1 1 1 1 1 1 1 1 1 1 1 1 1 1 1 1 1 1 1 1 1 1 1 1 1 1 1 1 1 1 1 1 1 1 1 1 1 1 1 1 1 1 1 1 1 1 1 1 1 1 1 1 1 1 74
B 28 Agriculture Extension (Fruits) 0 350000 1 1 1 1 1 1 1 1 1 1 1 1 1 1 1 1 1 1 1 1 1 1 1 1 1 1 1 1 1 1 1 1 1 1 1 1 1 1 1 1 1 1 1 1 1 1 1 1 1 1 1 1 1 1 1 1 1 1 1 1 1 1 1 1 1 1 1 1 1 1 1 1 1 1 74
B 29 Livestock Expert 0 350000 1 1 1 1 1 1 1 1 1 1 1 1 1 1 1 1 1 1 1 1 1 1 1 1 1 1 26
5. PIU North WestB 30 Design/Construction Engineer (NWP 1) 0 350000 1 1 1 1 1 1 1 1 1 1 1 1 1 1 1 1 1 1 1 1 1 1 1 1 1 1 1 1 1 1 1 1 1 1 1 1 1 1 1 1 1 1 1 1 1 1 1 1 1 1 1 51
B 31 Design/Construction Engineer (NWP 2) 0 350000 1 1 1 1 1 1 1 1 1 1 1 1 1 1 1 1 1 1 1 1 1 1 1 1 1 1 1 1 1 1 1 1 1 1 1 1 1 1 1 1 1 1 1 1 1 1 1 1 1 1 1 51
B 32 Surveyor 0 350000 1 1 1 1 1 1 1 1 1 1 1 1 1 1 1 1 1 17
B 33 Agriculture Marketing 0 350000 1 1 1 1 1 1 1 1 1 1 1 1 1 1 1 1 1 1 1 1 1 1 1 1 1 1 1 1 1 1 1 1 1 1 1 1 1 1 1 1 1 1 1 1 1 1 1 1 1 1 1 1 1 1 1 1 1 1 1 1 1 1 1 1 1 1 1 1 1 1 1 1 1 1 74
B 34 Agriculture Extension (OFC & Vegetable) 0 350000 1 1 1 1 1 1 1 1 1 1 1 1 1 1 1 1 1 1 1 1 1 1 1 1 1 1 1 1 1 1 1 1 1 1 1 1 1 1 1 1 1 1 1 1 1 1 1 1 1 1 1 1 1 1 1 1 1 1 1 1 1 1 1 1 1 1 1 1 1 1 1 1 1 1 74
B 35 Agriculture Extension (Fruits) 0 350000 1 1 1 1 1 1 1 1 1 1 1 1 1 1 1 1 1 1 1 1 1 1 1 1 1 1 1 1 1 1 1 1 1 1 1 1 1 1 1 1 1 1 1 1 1 1 1 1 1 1 1 1 1 1 1 1 1 1 1 1 1 1 1 1 1 1 1 1 1 1 1 1 1 1 74
B 36 Livestock Expert 0 350000 1 1 1 1 1 1 1 1 1 1 1 1 1 1 1 1 1 1 1 1 1 1 1 1 1 1 26
6. PIU UvaB 37 Agriculture Marketing 0 350000 1 1 1 1 1 1 1 1 1 1 1 1 1 1 1 1 1 1 1 1 1 1 1 1 1 1 1 1 1 1 1 1 1 1 1 1 1 1 1 1 1 1 1 1 1 1 1 1 1 1 1 1 1 1 1 1 1 1 1 1 1 1 1 1 1 1 1 1 1 1 1 1 1 1 74
B 38 Agriculture Extension (OFC & Vegetable) 0 350000 1 1 1 1 1 1 1 1 1 1 1 1 1 1 1 1 1 1 1 1 1 1 1 1 1 1 1 1 1 1 1 1 1 1 1 1 1 1 1 1 1 1 1 1 1 1 1 1 1 1 1 1 1 1 1 1 1 1 1 1 1 1 1 1 1 1 1 1 1 1 1 1 1 1 74
B 39 Agriculture Extension (Fruits) 0 350000 1 1 1 1 1 1 1 1 1 1 1 1 1 1 1 1 1 1 1 1 1 1 1 1 1 1 1 1 1 1 1 1 1 1 1 1 1 1 1 1 1 1 1 1 1 1 1 1 1 1 1 1 1 1 1 1 1 1 1 1 1 1 1 1 1 1 1 1 1 1 1 1 1 1 74
B 40 Livestock Expert 0 350000 1 1 1 1 1 1 1 1 1 1 1 1 1 1 1 1 1 1 1 1 1 1 1 1 1 1 26
[Total of Pro-A] 122
[Total of Pro-B] 1,973
[Total of Pro-A+Pro-B] 2,095
Total Cost of FC for Each Month(Pro-A) 286,700,000
Total Cost of FC for Each Month(Pro-B) 0
Total Cost of LC for Each Month(Pro-A) 0
Total Cost of LC for Each Month(Pro-B) 690,550,000
1. PMU Central
C 1 Clerk 0 107268 1 1 1 1 1 1 1 1 1 1 1 1 1 1 1 1 1 1 1 1 1 1 1 1 1 1 1 1 1 1 1 1 1 1 1 1 1 1 1 1 1 1 1 1 1 1 1 1 1 1 1 1 1 1 1 1 1 1 1 1 1 1 1 1 1 1 1 1 1 1 1 1 1 1 74
C 2 Secretary 0 107268 1 1 1 1 1 1 1 1 1 1 1 1 1 1 1 1 1 1 1 1 1 1 1 1 1 1 1 1 1 1 1 1 1 1 1 1 1 1 1 1 1 1 1 1 1 1 1 1 1 1 1 1 1 1 1 1 1 1 1 1 1 1 1 1 1 1 1 1 1 1 1 1 1 1 74
C 3 Computer operator 0 107268 1 1 1 1 1 1 1 1 1 1 1 1 1 1 1 1 1 1 1 1 1 1 1 1 1 1 1 1 1 1 1 1 1 1 1 1 1 1 1 1 1 1 1 1 1 1 1 1 1 1 1 1 1 1 1 1 1 1 1 1 1 1 1 1 1 1 1 1 1 1 1 1 1 1 74
C 4 Office aid 0 107268 1 1 1 1 1 1 1 1 1 1 1 1 1 1 1 1 1 1 1 1 1 1 1 1 1 1 1 1 1 1 1 1 1 1 1 1 1 1 1 1 1 1 1 1 1 1 1 1 1 1 1 1 1 1 1 1 1 1 1 1 1 1 1 1 1 1 1 1 1 1 1 1 1 1 74
C 5 Driver 1 0 107268 1 1 1 1 1 1 1 1 1 1 1 1 1 1 1 1 1 1 1 1 1 1 1 1 1 1 1 1 1 1 1 1 1 1 1 1 1 1 1 1 1 1 1 1 1 1 1 1 1 1 1 1 1 1 1 1 1 1 1 1 1 1 1 1 1 1 1 1 1 1 1 1 1 1 74
C 6 Driver 2 0 107268 1 1 1 1 1 1 1 1 1 1 1 1 1 1 1 1 1 1 1 1 1 1 1 1 1 1 1 1 1 1 1 1 1 1 1 1 1 1 1 1 1 1 1 1 1 1 1 1 1 1 1 1 1 1 1 1 1 1 1 1 1 1 1 1 1 1 1 1 1 1 1 1 1 1 74
C 7 Driver 3 0 107268 1 1 1 1 1 1 1 1 1 1 1 1 1 1 1 1 1 1 1 1 1 1 1 1 1 1 1 1 1 1 1 1 1 1 1 1 1 1 1 1 1 1 1 1 1 1 1 1 1 1 1 1 1 1 1 1 1 1 1 1 1 1 1 1 1 1 1 1 1 1 1 1 1 1 74
Total
000
103,600,000
16226
39,950,000
2018 2020
17296
2019
313
079,100,000
4153157
9,400,00000
53,550,000
24237,600,000
00
111,300,000
20373393
47,000,00000
130,550,000
23318341
54,050,00000
64,400,000
44654,050,000
00
148,050,000
44,650,000
23423
19184203
BillingRate 2014 2015 2016 2017

C-102
2. PIU North
C 8 Engineer Assistant (Kurai 1) 0 107268 1 1 1 1 1 1 1 1 1 1 1 1 1 1 1 1 1 1 1 1 1 1 1 1 1 1 1 1 1 1 1 1 1 1 1 1 1 1 1 1 1 1 1 1 1 1 1 1 1 1 1 1 1 1 1 1 1 1 1 1 1 1 1 1 1 65
C 9 Engineer Assistant (Kurai 2) 0 107268 1 1 1 1 1 1 1 1 1 1 1 1 1 1 1 1 1 1 1 1 1 1 1 1 1 1 26
C 10 Engineer Assistant (Welimaruthamadu 1) 0 107268 1 1 1 1 1 1 1 1 1 1 1 1 1 1 1 1 1 1 1 1 1 1 1 1 1 1 1 1 1 1 1 1 1 1 1 1 1 1 1 1 1 1 1 1 1 1 1 1 1 1 50
C 11 Engineer Assistant (Welimaruthamadu 2) 0 107268 1 1 1 1 1 1 1 1 1 1 1 1 1 1 1 1 1 1 1 1 1 1 1 1 1 1 26
C 12 Engineer Assistant (Muthayakaddu 1) 0 107268 1 1 1 1 1 1 1 1 1 1 1 1 1 1 1 1 1 1 1 1 1 1 1 1 1 1 1 1 1 1 1 1 1 1 1 1 1 1 1 1 1 1 1 1 1 1 1 1 1 1 1 1 1 1 1 1 1 1 1 1 1 1 1 1 1 65
C 13 Engineer Assistant (Muthayakaddu 2) 0 107268 1 1 1 1 1 1 1 1 1 1 1 1 1 1 1 1 1 1 1 1 1 1 1 1 1 1 26
C 14 Engineer Assistant (Vavunikulam 1) 0 107268 1 1 1 1 1 1 1 1 1 1 1 1 1 1 1 1 1 1 1 1 1 1 1 1 1 1 1 1 1 1 1 1 1 1 1 1 1 1 1 1 1 1 1 1 1 1 1 1 1 1 50
C 15 Engineer Assistant (Vavunikulam 2) 0 107268 1 1 1 1 1 1 1 1 1 1 1 1 1 1 1 1 1 1 1 1 1 1 1 1 1 1 26
C 16 Field supervisor 1 0 107268 1 1 1 1 1 1 1 1 1 1 1 1 1 1 1 1 1 1 1 1 1 1 1 1 1 1 1 1 1 1 1 1 1 1 34
C 17 Field supervisor 2 0 107268 1 1 1 1 1 1 1 1 1 1 1 1 1 1 1 1 1 1 1 1 1 1 1 1 1 1 1 1 1 1 1 1 1 1 34
C 18 Field supervisor 3 0 107268 1 1 1 1 1 1 1 1 1 1 1 1 1 1 1 1 1 1 1 1 1 1 1 1 1 1 1 1 1 1 1 1 1 1 34
C 19 Field supervisor 4 0 107268 1 1 1 1 1 1 1 1 1 1 1 1 1 1 1 1 1 1 1 1 1 1 1 1 1 1 1 1 1 1 1 1 1 1 34
C 20 Field supervisor 5 0 107268 1 1 1 1 1 1 1 1 1 1 1 1 1 1 1 1 1 1 1 1 1 1 1 1 1 1 1 1 1 1 1 1 1 1 34
C 21 Field supervisor 6 0 107268 1 1 1 1 1 1 1 1 1 1 1 1 1 1 1 1 1 1 1 1 1 1 1 1 1 1 1 1 1 1 1 1 1 1 34
C 22 Field supervisor 7 0 107268 1 1 1 1 1 1 1 1 1 1 1 1 1 1 1 1 1 1 1 1 1 1 1 1 1 1 1 1 1 1 1 1 1 1 34
C 23 Field supervisor 8 0 107268 1 1 1 1 1 1 1 1 1 1 1 1 1 1 1 1 1 1 1 1 1 1 1 1 1 1 1 1 1 1 1 1 1 1 34
C 24 Field supervisor 9 0 107268 1 1 1 1 1 1 1 1 1 1 1 1 1 1 1 1 1 1 1 1 1 1 1 1 1 1 1 1 1 1 1 1 1 1 34
C 25 Field supervisor 10 0 107268 1 1 1 1 1 1 1 1 1 1 1 1 1 1 1 1 1 1 1 1 1 1 1 1 1 1 1 1 1 1 1 1 1 1 34
C 26 Field supervisor 11 0 107268 1 1 1 1 1 1 1 1 1 1 1 1 1 1 1 1 1 1 1 1 1 1 1 1 1 1 1 1 1 1 1 1 1 1 34
C 27 Field supervisor 12 0 107268 1 1 1 1 1 1 1 1 1 1 1 1 1 1 1 1 1 1 1 1 1 1 1 1 1 1 1 1 1 1 1 1 1 1 34
C 28 Field supervisor 13 0 107268 1 1 1 1 1 1 1 1 1 1 1 1 1 1 1 1 1 1 1 1 1 1 1 1 1 1 1 1 1 1 1 1 1 1 34
C 29 Field supervisor 14 0 107268 1 1 1 1 1 1 1 1 1 1 1 1 1 1 1 1 1 1 1 1 1 1 1 1 1 1 1 1 1 1 1 1 1 1 34
C 30 Field supervisor 15 0 107268 1 1 1 1 1 1 1 1 1 1 1 1 1 1 1 1 1 1 1 1 1 1 1 1 1 1 1 1 1 1 1 1 1 1 34
C 31 Field supervisor 16 0 107268 1 1 1 1 1 1 1 1 1 1 1 1 1 1 1 1 1 1 1 1 1 1 1 1 1 1 1 1 1 1 1 1 1 1 34
C 32 CAD operator 1 0 107268 1 1 1 1 1 1 1 1 1 1 1 1 1 1 1 1 1 1 1 1 1 1 1 1 1 1 1 1 1 1 1 1 1 1 1 1 1 1 1 1 1 1 1 1 1 1 1 1 1 1 1 1 1 1 1 1 1 1 1 1 1 1 1 63
C 33 CAD operator 2 0 107268 1 1 1 1 1 1 1 1 1 1 1 1 1 1 1 1 1 1 1 1 1 1 1 1 1 1 1 1 1 1 1 1 1 1 1 1 1 1 1 1 1 1 1 1 1 1 1 1 48
C 34 CAD operator 3 0 107268 1 1 1 1 1 1 1 1 1 1 1 1 1 1 1 1 1 1 1 1 1 1 1 1 1 1 1 1 1 1 1 1 1 1 1 1 36
C 35 CAD operator 4 0 107268 1 1 1 1 1 1 1 1 1 1 1 1 1 1 1 1 1 1 1 1 1 1 1 1 1 1 1 1 1 1 1 1 1 1 1 1 36
C 36 CAD operator 5 0 107268 1 1 1 1 1 1 1 1 1 1 1 1 1 1 1 1 1 1 1 1 1 1 1 1 1 1 1 1 1 1 1 1 1 1 1 1 36
C 37 Agricultural assistant 1 (OFC) 0 107268 1 1 1 1 1 1 1 1 1 1 1 1 1 1 1 1 1 1 1 1 1 1 1 1 1 1 1 1 1 1 1 1 1 1 1 1 1 1 1 1 1 1 1 1 1 1 1 1 1 1 1 1 1 1 1 1 1 1 1 1 1 1 1 1 1 1 66
C 38 Agricultural assistant 2 (Fruit) 0 107268 1 1 1 1 1 1 1 1 1 1 1 1 1 1 1 1 1 1 1 1 1 1 1 1 1 1 1 1 1 1 1 1 1 1 1 1 1 1 1 1 1 1 1 1 1 1 1 1 1 1 1 1 1 1 1 1 1 1 1 1 1 1 1 1 1 1 66
C 39 Livestock assistant 0 107268 1 1 1 1 1 1 1 1 1 1 1 1 1 1 1 1 1 1 1 1 1 1 1 1 1 1 1 1 1 1 1 1 1 1 1 1 1 1 1 1 1 1 1 1 1 1 1 1 1 1 1 1 1 1 1 1 1 1 1 1 1 1 1 1 1 1 66
C 40 Accounting/Office manager/Procurement 0 107268 1 1 1 1 1 1 1 1 1 1 1 1 1 1 1 1 1 1 1 1 1 1 1 1 1 1 1 1 1 1 1 1 1 1 1 1 1 1 1 1 1 1 1 1 1 1 1 1 1 1 1 1 1 1 1 1 1 1 1 1 1 1 1 1 1 1 1 1 1 1 1 1 1 1 74
C 41 Clerk 0 107268 1 1 1 1 1 1 1 1 1 1 1 1 1 1 1 1 1 1 1 1 1 1 1 1 1 1 1 1 1 1 1 1 1 1 1 1 1 1 1 1 1 1 1 1 1 1 1 1 1 1 1 1 1 1 1 1 1 1 1 1 1 1 1 1 1 1 1 1 1 1 1 1 1 1 74
C 42 Secretary 0 107268 1 1 1 1 1 1 1 1 1 1 1 1 1 1 1 1 1 1 1 1 1 1 1 1 1 1 1 1 1 1 1 1 1 1 1 1 1 1 1 1 1 1 1 1 1 1 1 1 1 1 1 1 1 1 1 1 1 1 1 1 1 1 1 1 1 1 1 1 1 1 1 1 1 1 74
C 43 Computer operator 0 107268 1 1 1 1 1 1 1 1 1 1 1 1 1 1 1 1 1 1 1 1 1 1 1 1 1 1 1 1 1 1 1 1 1 1 1 1 1 1 1 1 1 1 1 1 1 1 1 1 1 1 1 1 1 1 1 1 1 1 1 1 1 1 1 1 1 1 1 1 1 1 1 1 1 1 74
C 44 Office aid 0 107268 1 1 1 1 1 1 1 1 1 1 1 1 1 1 1 1 1 1 1 1 1 1 1 1 1 1 1 1 1 1 1 1 1 1 1 1 1 1 1 1 1 1 1 1 1 1 1 1 1 1 1 1 1 1 1 1 1 1 1 1 1 1 1 1 1 1 1 1 1 1 1 1 1 1 74
C 45 Driver 1 0 107268 1 1 1 1 1 1 1 1 1 1 1 1 1 1 1 1 1 1 1 1 1 1 1 1 1 1 1 1 1 1 1 1 1 1 1 1 1 1 1 1 1 1 1 1 1 1 1 1 1 1 1 1 1 1 1 1 1 1 1 1 1 1 1 1 1 1 1 1 1 1 1 1 1 1 74
C 46 Driver 2 0 107268 1 1 1 1 1 1 1 1 1 1 1 1 1 1 1 1 1 1 1 1 1 1 1 1 1 1 1 1 1 1 1 1 1 1 1 1 1 1 1 1 1 1 1 1 1 1 1 1 1 1 1 1 1 1 1 1 1 1 1 1 1 1 1 1 1 1 1 1 1 1 1 1 1 1 74
C 47 Driver 3 0 107268 1 1 1 1 1 1 1 1 1 1 1 1 1 1 1 1 1 1 1 1 1 1 1 1 1 1 1 1 1 1 1 1 1 1 1 1 1 1 1 1 1 1 1 1 1 1 1 1 1 1 1 1 1 1 1 1 1 1 1 1 1 1 62
C 48 Driver 4 0 107268 1 1 1 1 1 1 1 1 1 1 1 1 1 1 1 1 1 1 1 1 1 1 1 1 1 1 1 1 1 1 1 1 1 1 1 1 1 1 1 1 1 1 1 1 1 1 1 1 1 1 50
C 49 Driver 5 0 107268 1 1 1 1 1 1 1 1 1 1 1 1 1 1 1 1 1 1 1 1 1 1 1 1 1 1 1 1 1 1 1 1 1 1 1 1 1 1 1 1 1 1 1 1 1 1 1 1 1 1 50
3. PIU East
C 50 Engineer Assistant (East 1) 0 107268 1 1 1 1 1 1 1 1 1 1 1 1 1 1 1 1 1 1 1 1 1 1 1 1 1 1 1 1 1 1 1 1 1 1 1 1 1 1 1 1 1 1 1 1 1 1 1 1 1 1 1 1 1 1 1 1 1 1 1 1 1 1 1 1 1 65
C 51 Engineer Assistant (East 2) 0 107268 1 1 1 1 1 1 1 1 1 1 1 1 1 1 1 1 1 1 1 1 1 1 1 1 1 1 1 1 1 1 1 1 1 1 1 1 1 1 1 1 1 1 1 1 1 1 1 1 1 1 50
C 52 Field supervisor 1 0 107268 1 1 1 1 1 1 1 1 1 1 1 1 1 1 1 1 1 1 1 1 1 1 1 1 1 1 1 1 1 1 1 1 1 1 1 1 36
C 53 Field supervisor 2 0 107268 1 1 1 1 1 1 1 1 1 1 1 1 1 1 1 1 1 1 1 1 1 1 1 1 1 1 1 1 1 1 1 1 1 1 1 1 36
C 54 Field supervisor 3 0 107268 1 1 1 1 1 1 1 1 1 1 1 1 1 1 1 1 1 1 1 1 1 1 1 1 1 1 1 1 1 1 1 1 1 1 1 1 36
C 55 CAD operator 1 0 107268 1 1 1 1 1 1 1 1 1 1 1 1 1 1 1 1 1 1 1 1 1 1 1 1 1 1 1 1 1 1 1 1 1 1 1 1 1 1 1 1 1 1 1 1 1 1 1 1 1 1 1 1 1 1 1 1 1 1 1 1 1 1 1 63
C 56 CAD operator 2 0 107268 1 1 1 1 1 1 1 1 1 1 1 1 1 1 1 1 1 1 1 1 1 1 1 1 1 1 1 1 1 1 1 1 1 1 1 1 36
C 57 CAD operator 3 0 107268 1 1 1 1 1 1 1 1 1 1 1 1 1 1 1 1 1 1 1 1 1 1 1 1 1 1 1 1 1 1 1 1 1 1 1 1 36
C 58 Agricultural assistant 1 (OFC) 0 107268 1 1 1 1 1 1 1 1 1 1 1 1 1 1 1 1 1 1 1 1 1 1 1 1 1 1 1 1 1 1 1 1 1 1 1 1 1 1 1 1 1 1 1 1 1 1 1 1 1 1 1 1 1 1 1 1 1 1 1 1 1 1 1 1 1 1 66
C 59 Agricultural assistant 2 (Fruit) 0 107268 1 1 1 1 1 1 1 1 1 1 1 1 1 1 1 1 1 1 1 1 1 1 1 1 1 1 1 1 1 1 1 1 1 1 1 1 1 1 1 1 1 1 1 1 1 1 1 1 1 1 1 1 1 1 1 1 1 1 1 1 1 1 1 1 1 1 66
C 60 Livestock assistant 0 107268 1 1 1 1 1 1 1 1 1 1 1 1 1 1 1 1 1 1 1 1 1 1 1 1 1 1 1 1 1 1 1 1 1 1 1 1 1 1 1 1 1 1 1 1 1 1 1 1 1 1 1 1 1 1 1 1 1 1 1 1 1 1 1 1 1 1 66
C 61 Accounting/Office manager/Procurement 0 107268 1 1 1 1 1 1 1 1 1 1 1 1 1 1 1 1 1 1 1 1 1 1 1 1 1 1 1 1 1 1 1 1 1 1 1 1 1 1 1 1 1 1 1 1 1 1 1 1 1 1 1 1 1 1 1 1 1 1 1 1 1 1 1 1 1 1 1 1 1 1 1 1 1 1 74
C 62 Clerk 0 107268 1 1 1 1 1 1 1 1 1 1 1 1 1 1 1 1 1 1 1 1 1 1 1 1 1 1 1 1 1 1 1 1 1 1 1 1 1 1 1 1 1 1 1 1 1 1 1 1 1 1 1 1 1 1 1 1 1 1 1 1 1 1 1 1 1 1 1 1 1 1 1 1 1 1 74
C 63 Secretary 0 107268 1 1 1 1 1 1 1 1 1 1 1 1 1 1 1 1 1 1 1 1 1 1 1 1 1 1 1 1 1 1 1 1 1 1 1 1 1 1 1 1 1 1 1 1 1 1 1 1 1 1 1 1 1 1 1 1 1 1 1 1 1 1 1 1 1 1 1 1 1 1 1 1 1 1 74
C 64 Computer operator 0 107268 1 1 1 1 1 1 1 1 1 1 1 1 1 1 1 1 1 1 1 1 1 1 1 1 1 1 1 1 1 1 1 1 1 1 1 1 1 1 1 1 1 1 1 1 1 1 1 1 1 1 1 1 1 1 1 1 1 1 1 1 1 1 1 1 1 1 1 1 1 1 1 1 1 1 74
C 65 Office aid 0 107268 1 1 1 1 1 1 1 1 1 1 1 1 1 1 1 1 1 1 1 1 1 1 1 1 1 1 1 1 1 1 1 1 1 1 1 1 1 1 1 1 1 1 1 1 1 1 1 1 1 1 1 1 1 1 1 1 1 1 1 1 1 1 1 1 1 1 1 1 1 1 1 1 1 1 74
C 66 Driver 1 0 107268 1 1 1 1 1 1 1 1 1 1 1 1 1 1 1 1 1 1 1 1 1 1 1 1 1 1 1 1 1 1 1 1 1 1 1 1 1 1 1 1 1 1 1 1 1 1 1 1 1 1 1 1 1 1 1 1 1 1 1 1 1 1 1 1 1 1 1 1 1 1 1 1 1 1 74
C 67 Driver 2 0 107268 1 1 1 1 1 1 1 1 1 1 1 1 1 1 1 1 1 1 1 1 1 1 1 1 1 1 1 1 1 1 1 1 1 1 1 1 1 1 1 1 1 1 1 1 1 1 1 1 1 1 1 1 1 1 1 1 1 1 1 1 1 1 1 1 1 1 1 1 1 1 1 1 1 1 74
C 68 Driver 3 0 107268 1 1 1 1 1 1 1 1 1 1 1 1 1 1 1 1 1 1 1 1 1 1 1 1 1 1 1 1 1 1 1 1 1 1 1 1 1 1 1 1 1 1 1 1 1 1 1 1 1 1 50
C 69 Driver 4 0 107268 1 1 1 1 1 1 1 1 1 1 1 1 1 1 1 1 1 1 1 1 1 1 1 1 1 1 1 1 1 1 1 1 1 1 1 1 1 1 1 1 1 1 1 1 1 1 1 1 1 1 50
4. PIU North Central
C 70 Engineer Assistant 0 107268 1 1 1 1 1 1 1 1 1 1 1 1 1 1 1 1 1 1 1 1 1 1 1 1 1 1 1 1 1 1 1 1 1 1 1 1 1 1 1 1 1 1 1 1 1 1 1 1 1 1 1 1 1 1 1 1 1 1 1 1 1 1 1 1 1 65
C 71 Engineer Assistant 0 107268 1 1 1 1 1 1 1 1 1 1 1 1 1 1 1 1 1 1 1 1 1 1 1 1 1 1 1 1 1 1 1 1 1 1 1 1 1 1 1 1 1 1 1 1 1 1 1 1 1 1 50
C 72 Field supervisor 1 0 107268 1 1 1 1 1 1 1 1 1 1 1 1 1 1 1 1 1 1 1 1 1 1 1 1 1 1 1 1 1 1 1 1 1 1 1 1 36
C 73 Field supervisor 2 0 107268 1 1 1 1 1 1 1 1 1 1 1 1 1 1 1 1 1 1 1 1 1 1 1 1 1 1 1 1 1 1 1 1 1 1 1 1 36
C 74 Field supervisor 3 0 107268 1 1 1 1 1 1 1 1 1 1 1 1 1 1 1 1 1 1 1 1 1 1 1 1 1 1 1 1 1 1 1 1 1 1 1 1 36
C 75 Field supervisor 4 0 107268 1 1 1 1 1 1 1 1 1 1 1 1 1 1 1 1 1 1 1 1 1 1 1 1 1 1 1 1 1 1 1 1 1 1 1 1 36
C 76 CAD operator 1 0 107268 1 1 1 1 1 1 1 1 1 1 1 1 1 1 1 1 1 1 1 1 1 1 1 1 1 1 1 1 1 1 1 1 1 1 1 1 1 1 1 1 1 1 1 1 1 1 1 1 1 1 1 1 1 1 1 1 1 1 1 1 1 1 1 63
C 77 CAD operator 2 0 107268 1 1 1 1 1 1 1 1 1 1 1 1 1 1 1 1 1 1 1 1 1 1 1 1 1 1 1 1 1 1 1 1 1 1 1 1 36
C 78 CAD operator 3 0 107268 1 1 1 1 1 1 1 1 1 1 1 1 1 1 1 1 1 1 1 1 1 1 1 1 1 1 1 1 1 1 1 1 1 1 1 1 36
C 79 Agricultural assistant 1 (OFC) 0 107268 1 1 1 1 1 1 1 1 1 1 1 1 1 1 1 1 1 1 1 1 1 1 1 1 1 1 1 1 1 1 1 1 1 1 1 1 1 1 1 1 1 1 1 1 1 1 1 1 1 1 1 1 1 1 1 1 1 1 1 1 1 1 1 1 1 1 66
C 80 Agricultural assistant 2 (Fruit) 0 107268 1 1 1 1 1 1 1 1 1 1 1 1 1 1 1 1 1 1 1 1 1 1 1 1 1 1 1 1 1 1 1 1 1 1 1 1 1 1 1 1 1 1 1 1 1 1 1 1 1 1 1 1 1 1 1 1 1 1 1 1 1 1 1 1 1 1 66
C 81 Livestock assistant 0 107268 1 1 1 1 1 1 1 1 1 1 1 1 1 1 1 1 1 1 1 1 1 1 1 1 1 1 1 1 1 1 1 1 1 1 1 1 1 1 1 1 1 1 1 1 1 1 1 1 1 1 1 1 1 1 1 1 1 1 1 1 1 1 1 1 1 1 66
C 82 Accounting/Office manager/Procurement 0 107268 1 1 1 1 1 1 1 1 1 1 1 1 1 1 1 1 1 1 1 1 1 1 1 1 1 1 1 1 1 1 1 1 1 1 1 1 1 1 1 1 1 1 1 1 1 1 1 1 1 1 1 1 1 1 1 1 1 1 1 1 1 1 1 1 1 1 1 1 1 1 1 1 1 1 74
C 83 Clerk 0 107268 1 1 1 1 1 1 1 1 1 1 1 1 1 1 1 1 1 1 1 1 1 1 1 1 1 1 1 1 1 1 1 1 1 1 1 1 1 1 1 1 1 1 1 1 1 1 1 1 1 1 1 1 1 1 1 1 1 1 1 1 1 1 1 1 1 1 1 1 1 1 1 1 1 1 74
C 84 Secretary 0 107268 1 1 1 1 1 1 1 1 1 1 1 1 1 1 1 1 1 1 1 1 1 1 1 1 1 1 1 1 1 1 1 1 1 1 1 1 1 1 1 1 1 1 1 1 1 1 1 1 1 1 1 1 1 1 1 1 1 1 1 1 1 1 1 1 1 1 1 1 1 1 1 1 1 1 74
C 85 Computer operator 0 107268 1 1 1 1 1 1 1 1 1 1 1 1 1 1 1 1 1 1 1 1 1 1 1 1 1 1 1 1 1 1 1 1 1 1 1 1 1 1 1 1 1 1 1 1 1 1 1 1 1 1 1 1 1 1 1 1 1 1 1 1 1 1 1 1 1 1 1 1 1 1 1 1 1 1 74
C 86 Office aid 0 107268 1 1 1 1 1 1 1 1 1 1 1 1 1 1 1 1 1 1 1 1 1 1 1 1 1 1 1 1 1 1 1 1 1 1 1 1 1 1 1 1 1 1 1 1 1 1 1 1 1 1 1 1 1 1 1 1 1 1 1 1 1 1 1 1 1 1 1 1 1 1 1 1 1 1 74
C 87 Driver 1 0 107268 1 1 1 1 1 1 1 1 1 1 1 1 1 1 1 1 1 1 1 1 1 1 1 1 1 1 1 1 1 1 1 1 1 1 1 1 1 1 1 1 1 1 1 1 1 1 1 1 1 1 1 1 1 1 1 1 1 1 1 1 1 1 1 1 1 1 1 1 1 1 1 1 1 1 74
C 88 Driver 2 0 107268 1 1 1 1 1 1 1 1 1 1 1 1 1 1 1 1 1 1 1 1 1 1 1 1 1 1 1 1 1 1 1 1 1 1 1 1 1 1 1 1 1 1 1 1 1 1 1 1 1 1 1 1 1 1 1 1 1 1 1 1 1 1 1 1 1 1 1 1 1 1 1 1 1 1 74
C 89 Driver 3 0 107268 1 1 1 1 1 1 1 1 1 1 1 1 1 1 1 1 1 1 1 1 1 1 1 1 1 1 1 1 1 1 1 1 1 1 1 1 1 1 1 1 1 1 1 1 1 1 1 1 1 1 50

C-103
5. PIU North West
C 90 Engineer Assistant (Ingimitia) 0 107268 1 1 1 1 1 1 1 1 1 1 1 1 1 1 1 1 1 1 1 1 1 1 1 1 1 1 1 1 1 1 1 1 1 1 1 1 1 1 1 1 1 1 1 1 1 1 1 1 1 1 1 1 1 1 1 1 1 1 1 1 1 1 1 1 1 65
C 91 Engineer Assistant (Neelabemma) 0 107268 1 1 1 1 1 1 1 1 1 1 1 1 1 1 1 1 1 1 1 1 1 1 1 1 1 1 1 1 1 1 1 1 1 1 1 1 1 1 1 1 1 1 1 1 1 1 1 1 1 1 50
C 92 Engineer Assistant (NWP) 0 107268 1 1 1 1 1 1 1 1 1 1 1 1 1 1 1 1 1 1 1 1 1 1 1 1 1 1 1 1 1 1 1 1 1 1 1 1 1 1 1 1 1 1 1 1 1 1 1 1 1 1 50
C 93 Field supervisor 1 0 107268 1 1 1 1 1 1 1 1 1 1 1 1 1 1 1 1 1 1 1 1 1 1 1 1 1 1 1 1 1 1 1 1 1 1 1 1 36
C 94 Field supervisor 2 0 107268 1 1 1 1 1 1 1 1 1 1 1 1 1 1 1 1 1 1 1 1 1 1 1 1 1 1 1 1 1 1 1 1 1 1 1 1 36
C 95 Field supervisor 3 0 107268 1 1 1 1 1 1 1 1 1 1 1 1 1 1 1 1 1 1 1 1 1 1 1 1 1 1 1 1 1 1 1 1 1 1 1 1 36
C 96 Field supervisor 4 0 107268 1 1 1 1 1 1 1 1 1 1 1 1 1 1 1 1 1 1 1 1 1 1 1 1 1 1 1 1 1 1 1 1 1 1 1 1 36
C 97 Field supervisor 5 0 107268 1 1 1 1 1 1 1 1 1 1 1 1 1 1 1 1 1 1 1 1 1 1 1 1 1 1 1 1 1 1 1 1 1 1 1 1 36
C 98 Field supervisor 6 0 107268 1 1 1 1 1 1 1 1 1 1 1 1 1 1 1 1 1 1 1 1 1 1 1 1 1 1 1 1 1 1 1 1 1 1 1 1 36
C 99 Field supervisor 7 0 107268 1 1 1 1 1 1 1 1 1 1 1 1 1 1 1 1 1 1 1 1 1 1 1 1 1 1 1 1 1 1 1 1 1 1 1 1 36
C 100 Field supervisor 8 0 107268 1 1 1 1 1 1 1 1 1 1 1 1 1 1 1 1 1 1 1 1 1 1 1 1 1 1 1 1 1 1 1 1 1 1 1 1 36
C 101 Field supervisor 9 0 107268 1 1 1 1 1 1 1 1 1 1 1 1 1 1 1 1 1 1 1 1 1 1 1 1 1 1 1 1 1 1 1 1 1 1 1 1 36
C 102 CAD operator 1 0 107268 1 1 1 1 1 1 1 1 1 1 1 1 1 1 1 1 1 1 1 1 1 1 1 1 1 1 1 1 1 1 1 1 1 1 1 1 1 1 1 1 1 1 1 1 1 1 1 1 1 1 1 1 1 1 1 1 1 1 1 1 1 1 1 63
C 103 CAD operator 2 0 107268 1 1 1 1 1 1 1 1 1 1 1 1 1 1 1 1 1 1 1 1 1 1 1 1 1 1 1 1 1 1 1 1 1 1 1 1 36
C 104 CAD operator 3 0 107268 1 1 1 1 1 1 1 1 1 1 1 1 1 1 1 1 1 1 1 1 1 1 1 1 1 1 1 1 1 1 1 1 1 1 1 1 36
C 105 Agricultural assistant 1 (OFC) 0 107268 1 1 1 1 1 1 1 1 1 1 1 1 1 1 1 1 1 1 1 1 1 1 1 1 1 1 1 1 1 1 1 1 1 1 1 1 1 1 1 1 1 1 1 1 1 1 1 1 1 1 1 1 1 1 1 1 1 1 1 1 1 1 1 1 1 1 66
C 106 Agricultural assistant 2 (Fruit) 0 107268 1 1 1 1 1 1 1 1 1 1 1 1 1 1 1 1 1 1 1 1 1 1 1 1 1 1 1 1 1 1 1 1 1 1 1 1 1 1 1 1 1 1 1 1 1 1 1 1 1 1 1 1 1 1 1 1 1 1 1 1 1 1 1 1 1 1 66
C 107 Livestock assistant 0 107268 1 1 1 1 1 1 1 1 1 1 1 1 1 1 1 1 1 1 1 1 1 1 1 1 1 1 1 1 1 1 1 1 1 1 1 1 1 1 1 1 1 1 1 1 1 1 1 1 1 1 1 1 1 1 1 1 1 1 1 1 1 1 1 1 1 1 66
C 108 Accounting/Office manager/Procurement 0 107268 1 1 1 1 1 1 1 1 1 1 1 1 1 1 1 1 1 1 1 1 1 1 1 1 1 1 1 1 1 1 1 1 1 1 1 1 1 1 1 1 1 1 1 1 1 1 1 1 1 1 1 1 1 1 1 1 1 1 1 1 1 1 1 1 1 1 1 1 1 1 1 1 1 1 74
C 109 Clerk 0 107268 1 1 1 1 1 1 1 1 1 1 1 1 1 1 1 1 1 1 1 1 1 1 1 1 1 1 1 1 1 1 1 1 1 1 1 1 1 1 1 1 1 1 1 1 1 1 1 1 1 1 1 1 1 1 1 1 1 1 1 1 1 1 1 1 1 1 1 1 1 1 1 1 1 1 74
C 110 Secretary 0 107268 1 1 1 1 1 1 1 1 1 1 1 1 1 1 1 1 1 1 1 1 1 1 1 1 1 1 1 1 1 1 1 1 1 1 1 1 1 1 1 1 1 1 1 1 1 1 1 1 1 1 1 1 1 1 1 1 1 1 1 1 1 1 1 1 1 1 1 1 1 1 1 1 1 1 74
C 111 Computer operator 0 107268 1 1 1 1 1 1 1 1 1 1 1 1 1 1 1 1 1 1 1 1 1 1 1 1 1 1 1 1 1 1 1 1 1 1 1 1 1 1 1 1 1 1 1 1 1 1 1 1 1 1 1 1 1 1 1 1 1 1 1 1 1 1 1 1 1 1 1 1 1 1 1 1 1 1 74
C 112 Office aid 0 107268 1 1 1 1 1 1 1 1 1 1 1 1 1 1 1 1 1 1 1 1 1 1 1 1 1 1 1 1 1 1 1 1 1 1 1 1 1 1 1 1 1 1 1 1 1 1 1 1 1 1 1 1 1 1 1 1 1 1 1 1 1 1 1 1 1 1 1 1 1 1 1 1 1 1 74
C 113 Driver 1 0 107268 1 1 1 1 1 1 1 1 1 1 1 1 1 1 1 1 1 1 1 1 1 1 1 1 1 1 1 1 1 1 1 1 1 1 1 1 1 1 1 1 1 1 1 1 1 1 1 1 1 1 1 1 1 1 1 1 1 1 1 1 1 1 1 1 1 1 1 1 1 1 1 1 1 1 74
C 114 Driver 2 0 107268 1 1 1 1 1 1 1 1 1 1 1 1 1 1 1 1 1 1 1 1 1 1 1 1 1 1 1 1 1 1 1 1 1 1 1 1 1 1 1 1 1 1 1 1 1 1 1 1 1 1 1 1 1 1 1 1 1 1 1 1 1 1 1 1 1 1 1 1 1 1 1 1 1 1 74
C 115 Driver 3 0 107268 1 1 1 1 1 1 1 1 1 1 1 1 1 1 1 1 1 1 1 1 1 1 1 1 1 1 1 1 1 1 1 1 1 1 1 1 1 1 1 1 1 1 1 1 1 1 1 1 1 1 50
C 116 Driver 4 0 107268 1 1 1 1 1 1 1 1 1 1 1 1 1 1 1 1 1 1 1 1 1 1 1 1 1 1 1 1 1 1 1 1 1 1 1 1 1 1 38
6. PIU Uva
C 117 Agricultural assistant 1 (OFC) 0 107268 1 1 1 1 1 1 1 1 1 1 1 1 1 1 1 1 1 1 1 1 1 1 1 1 1 1 1 1 1 1 1 1 1 1 1 1 1 1 1 1 1 1 1 1 1 1 1 1 1 1 1 1 1 1 1 1 1 1 1 1 1 1 1 1 1 1 66
C 118 Agricultural assistant 2 (Fruit) 0 107268 1 1 1 1 1 1 1 1 1 1 1 1 1 1 1 1 1 1 1 1 1 1 1 1 1 1 1 1 1 1 1 1 1 1 1 1 1 1 1 1 1 1 1 1 1 1 1 1 1 1 1 1 1 1 1 1 1 1 1 1 1 1 1 1 1 1 66
C 119 Livestock assistant 0 107268 1 1 1 1 1 1 1 1 1 1 1 1 1 1 1 1 1 1 1 1 1 1 1 1 1 1 1 1 1 1 1 1 1 1 1 1 1 1 1 1 1 1 1 1 1 1 1 1 1 1 1 1 1 1 1 1 1 1 1 1 1 1 1 1 1 1 66
C 120 Accounting/Office manager/Procurement 0 107268 1 1 1 1 1 1 1 1 1 1 1 1 1 1 1 1 1 1 1 1 1 1 1 1 1 1 1 1 1 1 1 1 1 1 1 1 1 1 1 1 1 1 1 1 1 1 1 1 1 1 1 1 1 1 1 1 1 1 1 1 1 1 1 1 1 1 1 1 1 1 1 1 1 1C 121 Clerk 0 107268 1 1 1 1 1 1 1 1 1 1 1 1 1 1 1 1 1 1 1 1 1 1 1 1 1 1 1 1 1 1 1 1 1 1 1 1 1 1 1 1 1 1 1 1 1 1 1 1 1 1 1 1 1 1 1 1 1 1 1 1 1 1 1 1 1 1 1 1 1 1 1 1 1 1C 122 Secretary 0 107268 1 1 1 1 1 1 1 1 1 1 1 1 1 1 1 1 1 1 1 1 1 1 1 1 1 1 1 1 1 1 1 1 1 1 1 1 1 1 1 1 1 1 1 1 1 1 1 1 1 1 1 1 1 1 1 1 1 1 1 1 1 1 1 1 1 1 1 1 1 1 1 1 1 1C 123 Computer operator 0 107268 1 1 1 1 1 1 1 1 1 1 1 1 1 1 1 1 1 1 1 1 1 1 1 1 1 1 1 1 1 1 1 1 1 1 1 1 1 1 1 1 1 1 1 1 1 1 1 1 1 1 1 1 1 1 1 1 1 1 1 1 1 1 1 1 1 1 1 1 1 1 1 1 1 1C 124 Office aid 0 107268 1 1 1 1 1 1 1 1 1 1 1 1 1 1 1 1 1 1 1 1 1 1 1 1 1 1 1 1 1 1 1 1 1 1 1 1 1 1 1 1 1 1 1 1 1 1 1 1 1 1 1 1 1 1 1 1 1 1 1 1 1 1 1 1 1 1 1 1 1 1 1 1 1 1C 125 Driver 1 0 107268 1 1 1 1 1 1 1 1 1 1 1 1 1 1 1 1 1 1 1 1 1 1 1 1 1 1 1 1 1 1 1 1 1 1 1 1 1 1 1 1 1 1 1 1 1 1 1 1 1 1 1 1 1 1 1 1 1 1 1 1 1 1 1 1 1 1 1 1 1 1 1 1 1 1C 126 Driver 2 0 107268 1 1 1 1 1 1 1 1 1 1 1 1 1 1 1 1 1 1 1 1 1 1 1 1 1 1 1 1 1 1 1 1 1 1 1 1 1 1 1 1 1 1 1 1 1 1 1 1 1 1 1 1 1 1 1 1 1 1 1 1 1 1 1 1 1 1 1 1 1 1 1 1 1 1
0 0 0
0 0 0
[Total of Supporting Staff] 6,971
Total Cost of LC for Each Month(SS) 747,765,228
Grand Total 9,066
1,209
1,522129,687,012
801
1,04385,921,668
423
58045,374,364
1,500
1,893160,902,000
1,434
1,775153,822,312
412
61544,194,416
1,192
1,638127,863,456

C-104
Annural Distribution of Cost
FC LC Total FC LC Total FC LC Total FC LC Total FC LC Total FC LC Total FC LC Total FC LC Total FC LC Total
1Civil Work Package-1 (LCB): Kurai tankaugmentation & Parangi aru
100% 100% 100% 0% 0% 0% 0% 0% 0% 50% 50% 50% 50% 50% 50% 0% 0% 0% 0% 0% 0% 0% 0% 0%
2Civil Work Package-2 (LCB):Welimaruthamadu Irrigation
100% 100% 100% 0% 0% 0% 10% 10% 10% 60% 60% 60% 30% 30% 30% 0% 0% 0% 0% 0% 0% 0% 0% 0%
3Civil Work Package-3 (LCB) :Muthayankaddu Tank Lift Irrigation
100% 100% 100% 0% 0% 0% 0% 0% 0% 33% 33% 33% 33% 33% 33% 33% 33% 33% 0% 0% 0% 0% 0% 0%
4Civil Work Package-4 (LCB) :Vavunikulam Tank - Right & Left BankLift
100% 100% 100% 0% 0% 0% 8% 8% 8% 50% 50% 50% 42% 42% 42% 0% 0% 0% 0% 0% 0% 0% 0% 0%
5Civil Work Package-5 (LCB) : MahaweliSystem H
100% 100% 100% 0% 0% 0% 0% 0% 0% 50% 50% 50% 50% 50% 50% 0% 0% 0% 0% 0% 0% 0% 0% 0%
6Civil Work Package-6 (LCB) : Ingnimitivascheme
100% 100% 100% 0% 0% 0% 0% 0% 0% 50% 50% 50% 50% 50% 50% 0% 0% 0% 0% 0% 0% 0% 0% 0%
7Civil Work Package-7 (LCB) :Neelabemma scheme
100% 100% 100% 0% 0% 0% 10% 10% 10% 60% 60% 60% 30% 30% 30% 0% 0% 0% 0% 0% 0% 0% 0% 0%
8Civil Work Package-8 (LCB) : Major tankrehabilitation
100% 100% 100% 0% 0% 0% 19% 19% 19% 25% 25% 25% 25% 25% 25% 25% 25% 25% 6% 6% 6% 0% 0% 0%
9Civil Work Package-9 (LCB) : Mediumtank rehabilitation
100% 100% 100% 0% 0% 0% 19% 19% 19% 25% 25% 25% 25% 25% 25% 25% 25% 25% 6% 6% 6% 0% 0% 0%
10Civil Work Package-10 (LCB) : Minortank rehabilitation
100% 100% 100% 0% 0% 0% 19% 19% 19% 25% 25% 25% 25% 25% 25% 25% 25% 25% 6% 6% 6% 0% 0% 0%
11Civil Work Package-11 (LCB) : Agro wellprovision
100% 100% 100% 0% 0% 0% 0% 0% 0% 31% 31% 31% 31% 31% 31% 31% 31% 31% 8% 8% 8% 0% 0% 0%
12Civil Work Package-12 (LCB) : Rural &access road rehabilitation
100% 100% 100% 0% 0% 0% 19% 19% 19% 25% 25% 25% 25% 25% 25% 25% 25% 25% 6% 6% 6% 0% 0% 0%
13Procurement of equipment (1) (LCB) :Vehicle & equipment for PMU & PIUs
100% 100% 100% 100% 100% 100% 0% 0% 0% 0% 0% 0% 0% 0% 0% 0% 0% 0% 0% 0% 0% 0% 0% 0%
14Procurement of equipment (2) (LCB) :Micro irrigation system
100% 100% 100% 0% 0% 0% 16% 16% 16% 21% 21% 21% 21% 21% 21% 21% 21% 21% 21% 21% 21% 0% 0% 0%
15Procurement of equipment (3) (LCB) :Farm machinery & equipment
100% 100% 100% 0% 0% 0% 11% 11% 11% 22% 22% 22% 22% 22% 22% 22% 22% 22% 22% 22% 22% 0% 0% 0%
16Soft component (1) : Agricultural croppromotion program
100% 100% 100% 0% 0% 0% 14% 14% 14% 18% 18% 18% 18% 18% 18% 18% 18% 18% 18% 18% 18% 14% 14% 14%
17Soft component (2) : Livestock productpromotion program
100% 100% 100% 0% 0% 0% 14% 14% 14% 18% 18% 18% 18% 18% 18% 18% 18% 18% 18% 18% 18% 14% 14% 14%
Land Acquisition 0% 0% 0% 0% 0% 0% 0% 0%Consultant 100% 100% 100% 14% 8% 10% 20% 20% 20% 17% 20% 19% 18% 18% 18% 14% 16% 15% 13% 11% 12% 4% 7% 6%
2016 2017 2018 2019 20202015Item Total 2013 2014

C-105
Annual Fund RequirementBase Year for Cost Estimation: Jan, 2012 FC & Total: million JPYExchange Rates Sri Lanka Rs. = Yen 0.59848 LC : million Sri Lanka Rs.Price Escalation: FC: 2.1% LC: 4.0%Physical Contingency 5%Physical Contingency for Consultant 5%
FC LC Total FC LC Total FC LC Total FC LC Total FC LC Total FC LC Total FC LC Total FC LC TotalA. ELIGIBLE PORTIONⅠ) Procurement / Construction 4,352 5,097 7,402 115 0 115 318 414 566 1,284 1,415 2,131 1,266 1,427 2,120 910 1,099 1,568 348 559 682 110 183 220
Civil Work Package-1 (LCB): Kurai tank augmentat 161 145 248 0 0 0 0 0 0 81 73 124 81 73 124 0 0 0 0 0 0 0 0 0
Civil Work Package-2 (LCB): Welimaruthamadu Irr 48 43 74 0 0 0 5 4 7 29 26 45 14 13 22 0 0 0 0 0 0 0 0 0
Civil Work Package-3 (LCB) : Muthayankaddu Tank 237 213 365 0 0 0 0 0 0 79 71 122 79 71 122 79 71 122 0 0 0 0 0 0
Civil Work Package-4 (LCB) : Vavunikulam Tank - 148 133 228 0 0 0 12 11 19 74 67 114 62 56 95 0 0 0 0 0 0 0 0 0
Civil Work Package-5 (LCB) : Mahaweli System H 146 132 225 0 0 0 0 0 0 73 66 112 73 66 112 0 0 0 0 0 0 0 0 0
Civil Work Package-6 (LCB) : Ingnimitiva scheme 160 144 247 0 0 0 0 0 0 80 72 123 80 72 123 0 0 0 0 0 0 0 0 0
Civil Work Package-7 (LCB) : Neelabemma schem 39 35 60 0 0 0 4 4 6 23 21 36 12 11 18 0 0 0 0 0 0 0 0 0
Civil Work Package-8 (LCB) : Major tank rehabilita 53 48 82 0 0 0 10 9 15 13 12 21 13 12 21 13 12 21 3 3 5 0 0 0
Civil Work Package-9 (LCB) : Medium tank rehabil 190 171 293 0 0 0 36 32 55 47 43 73 47 43 73 47 43 73 12 11 18 0 0 0
Civil Work Package-10 (LCB) : Minor tank rehabilit 327 295 504 0 0 0 61 55 94 82 74 126 82 74 126 82 74 126 20 18 31 0 0 0
Civil Work Package-11 (LCB) : Agro well provision 1,061 920 1,612 0 0 0 0 0 0 327 283 496 327 283 496 327 283 496 82 71 124 0 0 0
Civil Work Package-12 (LCB) : Rural & access roa 255 229 392 0 0 0 48 43 74 64 57 98 64 57 98 64 57 98 16 14 25 0 0 0
Procurement of equipment (1) (LCB) : Vehicle & eq 105 0 105 105 0 105 0 0 0 0 0 0 0 0 0 0 0 0 0 0 0 0 0 0
Procurement of equipment (2) (LCB) : Micro irrigati 53 118 123 0 0 0 8 19 19 11 25 26 11 25 26 11 25 26 11 25 26 0 0 0
Procurement of equipment (3) (LCB) : Farm mach 107 416 356 0 0 0 12 46 40 24 93 79 24 93 79 24 93 79 24 93 79 0 0 0
Soft component (1) : Agricultural crop promotion pr 348 399 587 0 0 0 47 54 80 63 73 107 63 73 107 63 73 107 63 73 107 47 54 80
Soft component (2) : Livestock product promotion p 303 536 624 0 0 0 41 73 85 55 97 113 55 97 113 55 97 113 55 97 113 41 73 85
Base cost for JICA financing 3,743 3,978 6,124 105 0 105 285 351 495 1,126 1,152 1,815 1,087 1,117 1,755 765 827 1,260 286 404 528 89 127 165
Price escalation 402 876 926 4 0 4 18 44 45 98 196 215 119 242 264 102 219 233 45 128 121 16 47 44
Physical contingency 207 243 352 5 0 5 15 20 27 61 67 101 60 68 101 43 52 75 17 27 32 5 9 10
Ⅱ) Consulting services 453 2,291 1,824 60 164 158 86 418 336 76 443 341 83 415 331 66 383 295 61 287 232 21 182 130
Base cost 392 1,806 1,473 55 144 141 77 354 289 67 360 283 71 325 266 56 288 228 50 207 174 17 126 93
Price escalation 39 376 264 2 12 9 5 44 31 6 61 42 8 70 50 7 76 53 8 66 47 3 47 31
Physical contingency 22 109 87 3 8 8 4 20 16 4 21 16 4 20 16 3 18 14 3 14 11 1 9 6
Total (Ⅰ+Ⅱ) 4,805 7,388 9,227 175 164 273 404 832 902 1,361 1,857 2,472 1,349 1,842 2,452 976 1,482 1,863 408 846 914 132 365 350
B. NON ELIGIBLE PORTIONa Procurement / Construction 0 0 0 0 0 0 0 0 0 0 0 0 0 0 0 0 0 0 0 0 0 0 0 0
Base cost for JICA financing 0 0 0 0 0 0 0 0 0 0 0 0 0 0 0 0 0 0 0 0 0 0 0 0
Price escalation 0 0 0 0 0 0 0 0 0 0 0 0 0 0 0 0 0 0 0 0 0 0 0 0
Physical contingency 0 0 0 0 0 0 0 0 0 0 0 0 0 0 0 0 0 0 0 0 0 0 0 0
b Land Acquisition 0 0 0 0 0 0 0 0 0 0 0 0 0 0 0 0 0 0 0 0 0 0 0 0
Base cost 0 0 0 0 0 0 0 0 0 0 0 0 0 0 0 0 0 0 0 0 0 0 0 0
Price escalation 0 0 0 0 0 0 0 0 0 0 0 0 0 0 0 0 0 0 0 0 0 0 0 0
Physical contingency 0 0 0 0 0 0 0 0 0 0 0 0 0 0 0 0 0 0 0 0 0 0 0 0
c Administration cost 0 582 348 0 17 10 0 57 34 0 156 93 0 155 93 0 118 70 0 58 35 0 22 13
d VAT 0 1,920 1,149 0 57 34 0 188 112 0 514 308 0 510 305 0 388 232 0 190 114 0 73 44
e Import Tax 0 0 0 0 0 0 0 0 0 0 0 0 0 0 0 0 0 0 0 0 0 0 0 0
Total (a+b+c+d+e) 0 2,502 1,497 0 74 44 0 245 146 0 670 401 0 665 398 0 505 302 0 248 148 0 95 57
TOTAL (A+B) 4,805 9,890 10,724 175 238 317 404 1,077 1,048 1,361 2,528 2,873 1,349 2,507 2,850 976 1,987 2,166 408 1,093 1,063 132 460 407
C. Interest during Construction 426 0 426 2 0 2 10 0 10 40 0 40 70 0 70 93 0 93 104 0 104 108 0 108
Interest during Construction(Const.) 425 0 425 2 0 2 10 0 10 40 0 40 70 0 70 93 0 93 104 0 104 108 0 108
Interest during Construction (Consul.) 1 0 1 0 0 0 0 0 0 0 0 0 0 0 0 0 0 0 0 0 0 0 0 0
D. Commitment Charge 9 0 9 0 0 0 1 0 1 2 0 2 2 0 2 2 0 2 1 0 1 0 0 0
GRAND TOTAL (A+B+C+D) 5,240 9,890 11,159 177 238 319 414 1,077 1,059 1,403 2,528 2,915 1,422 2,507 2,922 1,071 1,987 2,260 513 1,093 1,167 240 460 515
E. JICA finance portion incl. IDC (A + C + D) 5,240 7,388 9,661 177 164 275 414 832 913 1,403 1,857 2,514 1,422 1,842 2,524 1,071 1,482 1,958 513 846 1,019 240 365 459
2020Item Total 2014 2015 2016 2017 2018 2019

C-106
TotalJICA
Portion Others TotalJICA
Portion Others TotalJICA
Portion Others
Civil Work Package-1 (LCB) 161 161 0 145 145 0 248 248 0
Civil Work Package-2 (LCB) 48 48 0 43 43 0 74 74 0
Civil Work Package-3 (LCB) 237 237 0 213 213 0 365 365 0
Civil Work Package-4 (LCB) 148 148 0 133 133 0 228 228 0
Civil Work Package-5 (LCB) 146 146 0 132 132 0 225 225 0
Civil Work Package-6 (LCB) 160 160 0 144 144 0 247 247 0
Civil Work Package-7 (LCB) 39 39 0 35 35 0 60 60 0
Civil Work Package-8 (LCB) 53 53 0 48 48 0 82 82 0
Civil Work Package-9 (LCB) 190 190 0 171 171 0 292 292 0
Civil Work Package-10 (LCB) 327 327 0 295 295 0 504 504 0
Civil Work Package-11 (LCB) 1,061 1,061 0 920 920 0 1,612 1,612 0
Civil Work Package-12 (LCB) 255 255 0 229 229 0 392 392 0
Procurement of equipment (1) (LCB) 105 105 0 0 0 0 105 105 0
Procurement of equipment (2) (LCB) 53 53 0 118 118 0 123 123 0
Procurement of equipment (3) (LCB) 107 107 0 416 416 0 356 356 0
Soft component (Agricultural crop) 348 348 0 399 399 0 587 587 0
Soft component (Livestock) 303 303 0 536 536 0 624 624 0
Price Escalation 402 402 0 876 876 0 926 926 0
Physical Contingency 207 207 0 243 243 0 352 352 0
Consulting Services 453 453 0 2,291 2,291 0 1,824 1,824 0
Land Acquisition 0 0 0 0 0 0 0 0 0
Administration Cost 0 0 0 582 0 582 348 0 348
VAT 0 0 0 1,920 0 1,920 1,149 0 1,149
Import Tax 0 0 0 0 0 0 0 0 0
Interest during construction 426 426 0 0 0 0 426 426 0
Commitment Charge 9 9 0 0 0 0 9 9 0
Total 5,240 5,240 0 9,890 7,388 2,502 11,159 9,661 1,497
TotalLocal Currency PortionForeign Currency PortionBreakdown of Cost

C-107
Breakdownof Cost
Total JICA Portion Others
2014 319 275 442015 1,059 913 1462016 2,915 2,514 4012017 2,922 2,524 3982018 2,260 1,958 3022019 1,167 1,019 1482020 515 459 57Total 11,159 9,661 1,497