Embed Size (px)
Citation preview

Importance of Soil Nutrients
in Grazing Systems
Fiona Leech South East Local Land Services
Yass

2
Major Nutrients Nitrogen Phosphorus Potassium Sulphur Calcium Magnesium
Micro Nutrients Molybdenum Zinc Copper Iron Boron Nickel Chlorine * Manganese
*More likely to be associated with toxic levels.
Major & Micro Nutrients for Plant Growth
Law of the Minimum
S
N
P K
Plant growth likened to a bucket holding water
Max plant growth
What is the major factor holding back your pasture growth??
Min plant growth

0
10
20
30
40
50
60
70
80
90
100
0 50 100 150 200 250 300 350 400 450 500 550 600 650 700 750 800
PBI: 281-840 Critical P = 55
Phosphorus Buffer Index (PBI)
Phos
phor
us (C
olw
ell)
PBI: 141- 280 Critical P = 40
Critical Phosphorus (Colwell) for Different PBI categories
PBI: 71-140 Critical P = 34
Above critical – no response to P

3.5 0
5
10
15
20
25
30
35
40
45
<5 5 - 8 >8
No.
of p
addo
cks
Sulphur mg/kg
Frequency of Sulphur KCl40 Healthy Soils Project
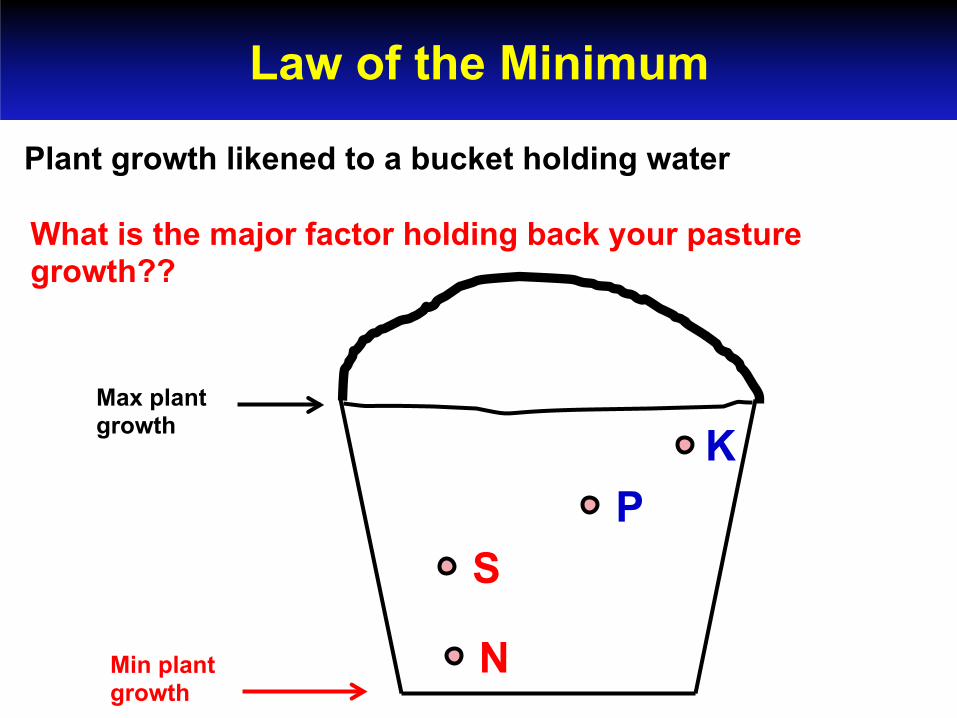
Control -P -Ca -K -Mg -N (all nutrients)
Growth of annual ryegrass in unlimed topsoil from “Kia-Ora” (1 Sep. 03)
SOIL NUTRIENT STATUS Importance of Phosphorus (P)
Source: Richard Simpson/CSIRO Agriculture
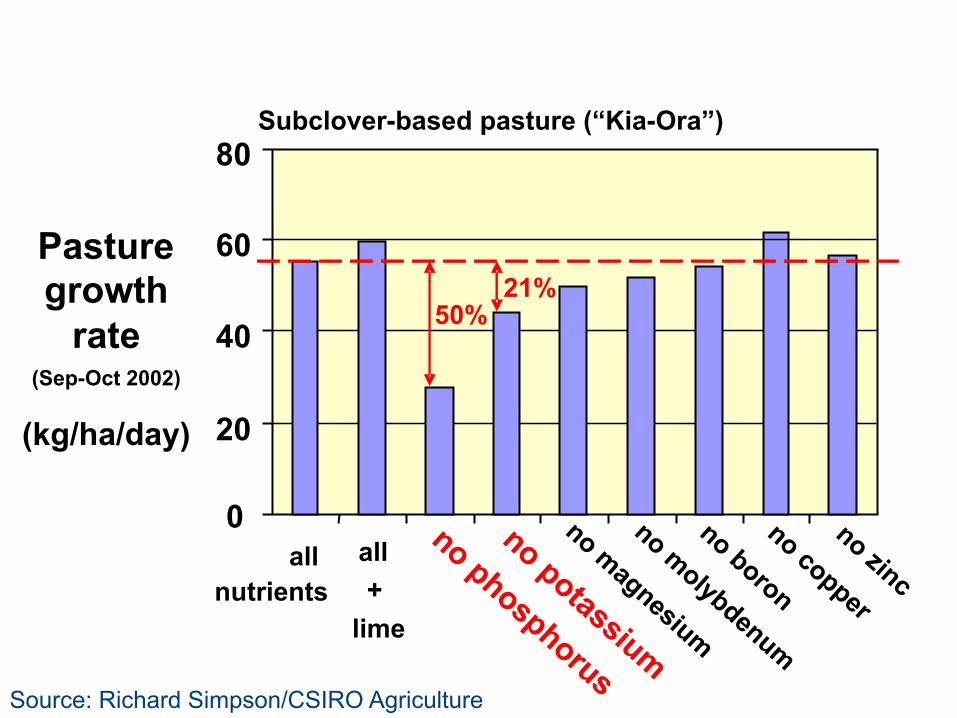
0
20
40
60
80
all nutrients
all +
lime
Pasture growth
rate (Sep-Oct 2002)
(kg/ha/day)
Subclover-based pasture (“Kia-Ora”)
50% 21%
Source: Richard Simpson/CSIRO Agriculture

http://tinyurl.com/h4vda5d
“Making Better Fertilizer Decisions for Grazed Pastures in Australia”
available on the web
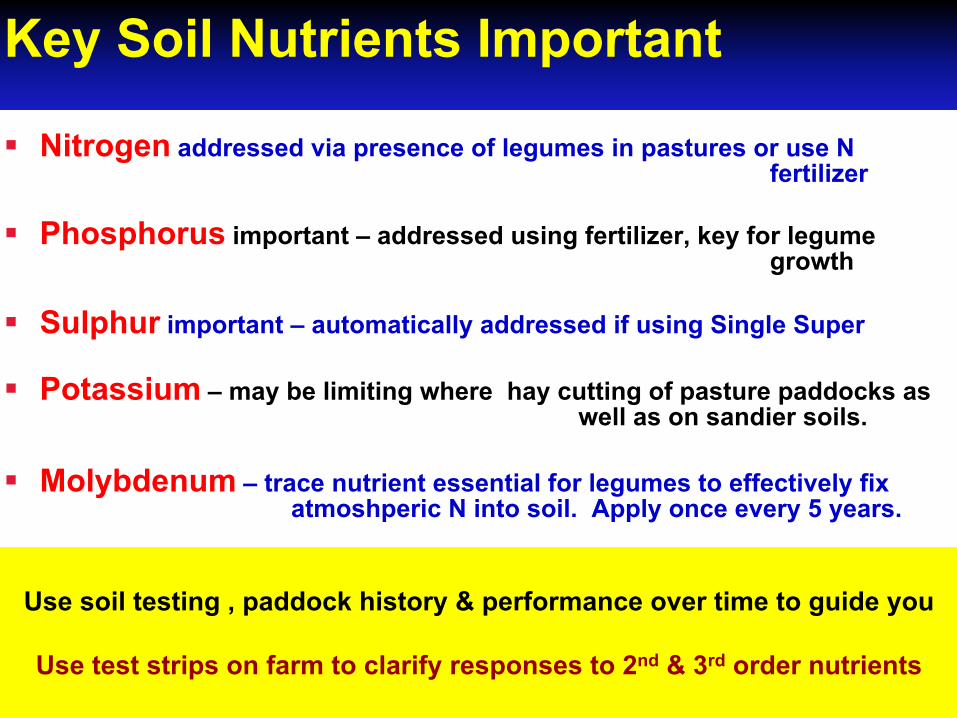
Key Soil Nutrients Important
§ Nitrogen addressed via presence of legumes in pastures or use N fertilizer
§ Phosphorus important – addressed using fertilizer, key for legume growth
§ Sulphur important – automatically addressed if using Single Super § Potassium – may be limiting where hay cutting of pasture paddocks as
well as on sandier soils.
§ Molybdenum – trace nutrient essential for legumes to effectively fix atmoshperic N into soil. Apply once every 5 years.
Use soil testing , paddock history & performance over time to guide you
Use test strips on farm to clarify responses to 2nd & 3rd order nutrients

Native Pasture & Alternative Fertilizer Trial – 6 year summary
Fiona Leech
South East Local Land Services, Yass
Binalong Landcare Group – sub Group of Harden-Murrumburrah Landcare
Technical Support:
Donna Reid, Rob Gorman, Phil Graham, Vicki Saville, Jacinta Christie, Bev Orchard,
Rob Smith, Janelle Jenkins, Richard Simpson, Adam Stefanski, Alan Richardson, Jo Powells, Vicki Saville, Matthew Lieschke, Felicity Roos, Michelle Borland, Colin Shields, Dan Hartwell
Melissa Henry, Jonathon Berryman and Hollie Baileau

Binalong & Bookham

Trial Details
§ 3 Sites - – “Glenroy”, Binalong – 6 years data – “Kia-Ora”, Bookham – 6 years data – “Te Kooti”, Bookham – 5 years data
§ 11 Treatments / 3 replicates
§ Small plots (10 m x 2 m)

§ A range of mineral & liquid fertilizers, rock phosphates, organic & compost materials (eg. manures) & microbial-based products (eg. microbial teas)
§ Applied (2009 to current) according to fertilizer company recommendations
§ Comparisons made to the single superphosphate treatment & effectiveness relative to nil control
Fertilizer Treatments Control (nil)
Single Superphosphate
Agri-ash
Trio-min/ Eco-min Balance
Groundswell Compost
SEP Pig Manure
YLAD Compost Mineral Blend
YLAD Compost Tea
BioAg Blend
Ecology Fluid Fertilizer/ Dical 64/ Gypsum
Urea

Spreading of fertilizers - autumn

Pasture Lock-up “Glenroy”: 15 May 2013 in preparation for winter/spring
biomass measurements

Oct 2012 – Spring Pasture Quality Measurements
SINGLE SUPERPHOSPHATE CONTROL

‘Kia-Ora’ Bookham 1st Sept 2015
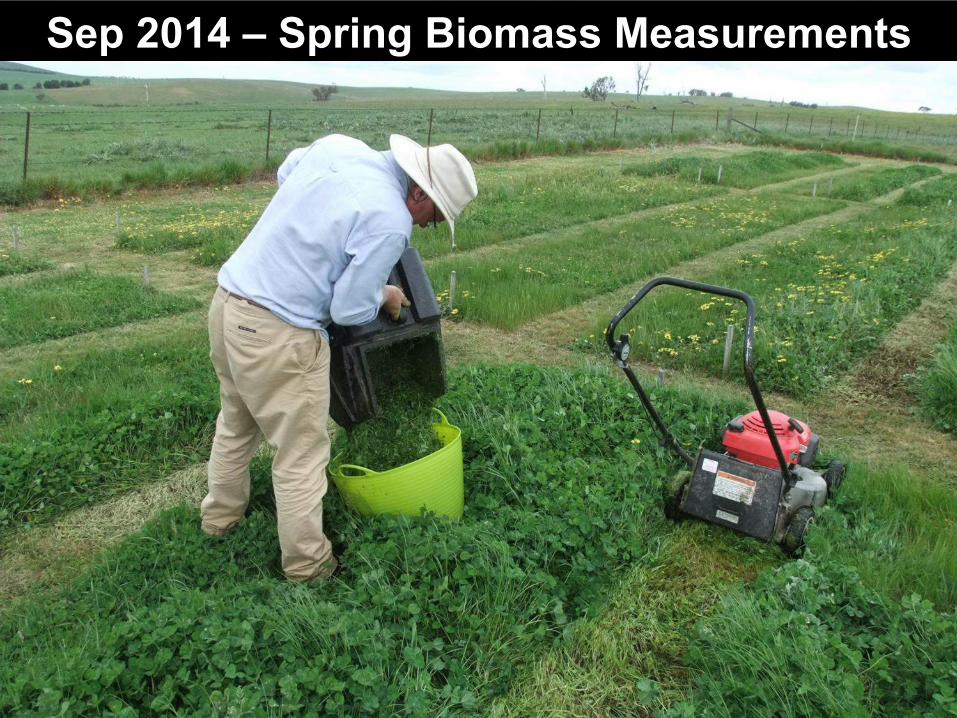
Sep 2014 – Spring Biomass Measurements

Nov 2010 - Spring Biomass Measurements

Nov 2012 – Annual Chemical & Microbial
Soil Testing

RESULTS for 2009 - 2014: Spring Herbage Mass – GLENROY
* indicates significant difference from control in that year P ≤ 5% (using multiple comparison tests)
-50
50
150
250
350
450
Single Super Agri-ash Trio-min/ Eco-min Balance
SEP Pig Manure
Groundswell Compost
YLAD Comp Min Blend
YLAD Compost Tea
BioAg Blend Ecology FF/Dical 64
Urea
Dry
Mat
ter %
abo
ve th
e C
ontr
ol
2009 2010 2011 2012 2013 2014
* *
* * * * * * *
*
* * * * * * *
* *
*
* * * * *

RESULTS for 2009 - 2014: Spring Herbage Mass – KIA-ORA
* indicates significant difference from control in that year P ≤ 5% (using multiple comparison tests)
-50
50
150
250
350
450
Single Super Agri-ash Trio-min/ Eco-min Balance
SEP Pig Manure
Groundswell Compost
YLAD Comp Min Blend
YLAD Compost Tea
BioAg Blend Ecology FF/Dical 64
Urea
Dry
mat
ter (
%) a
bove
the
Con
trol
2009 2010 2011 2012 2013 2014
* * * * * * * * * * * * * * *
* * * *
* *
* *
* *
*
* * *
* *

RESULTS for 2009 - 2013: Spring Herbage Mass – TE KOOTI
* indicates significant difference from control in that year P ≤ 5% (using multiple comparison tests)
-50
50
150
250
350
450
Single Super Agri-ash Trio-min/ Eco-min Balance
SEP Pig Manure
Groundswell Compost
YLAD Comp Min Blend
YLAD Compost Tea
BioAg Blend Ecology FF/Dical 64
Urea
Dry
mat
ter (
%) a
bove
the
Con
trol
2009 2010 2011 2012 2013
* * * * * * * * * * * * * * * *
* * * * * * *
*
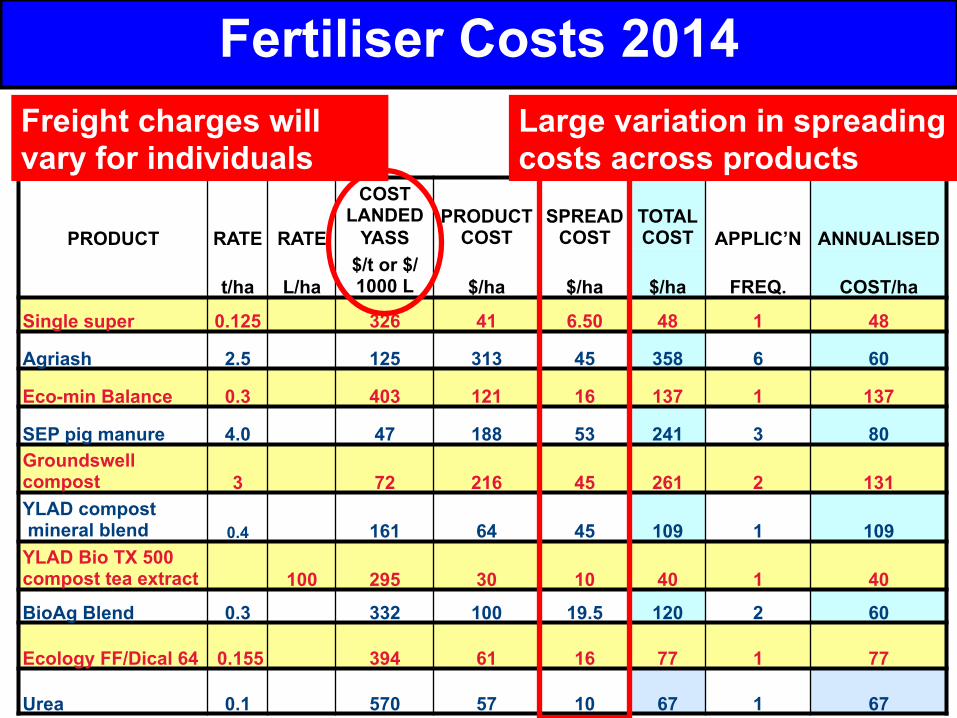
Fertiliser Costs 2014
PRODUCT RATE RATE
COST LANDED
YASS PRODUCT
COST SPREAD
COST TOTALCOST APPLIC’N ANNUALISED
t/ha L/ha $/t or $/1000 L $/ha $/ha $/ha FREQ. COST/ha
Single super 0.125 326 41 6.50 48 1 48
Agriash 2.5 125 313 45 358 6 60
Eco-min Balance 0.3 403 121 16 137 1 137
SEP pig manure 4.0 47 188 53 241 3 80 Groundswell compost 3 72 216 45 261 2 131 YLAD compost mineral blend 0.4 161 64 45 109 1 109 YLAD Bio TX 500 compost tea extract 100 295 30 10 40 1 40
BioAg Blend 0.3 332 100 19.5 120 2 60
Ecology FF/Dical 64 0.155 394 61 16 77 1 77
Urea 0.1 570 57 10 67 1 67
Freight charges will vary for individuals
Large variation in spreading costs across products

FERTILIZER
PRODUCT
Annualised cost of product landed at Yass & spread on farm $/ha
2009
2010
2011
2012
2013
2014
Average Annualised Cost ($/ha)
Application frequency
Single Super 44.33 43.50 51.63 46.50 49.75 47.25 47.16 Annual Agri-ash
35.33 35.33 35.33 50.42 53.75
59.58 44.95 6 years
Trio-min/Eco-min Balance 170.50 121.00 128.37 130.68
135.40
136.95
137.15
Annual
SEP Pig Manure 68.05 68.05 68.05 80.00 80.33
80.33 74.14
3 years
Groundswell Compost 116.00 116.00 116.00 117.50 122.00
130.50 119.67
2 years
YLAD Compost Mineral Blend
Glenroy 188.80 194.25 195.21 115.84 115.00 101.66 151.79 Annual Kia-Ora 188.80 194.25 221.32 147.74 115.00 109.37 162.75 Annual Te Kooti 188.80 194.25 195.21 133.35 115.00 n/a 165.32 Annual YLAD Compost Tea 39.30 39.30 39.50 39.50 39.50 39.50 39.43 Annual BioAg Blend
134.74 49.50 52.85 53.90 55.65
59.55 67.70 2 years
Ecology Fluid Fertiliser/Dical 64/Gypsum 59.00 59.00 69.84 70.24 77.37
77.37 68.80
Annual
Urea 71.70 20.67 71.00 75.00 74.50 67.00 63.31 Annual
2009-14 Average Annualised Cost ($/ha)

COST EFFECTIVENESS - Glenroy 2012 & 2014
Cost of additional pasture grown above the Control
0
2
4
6
8
10
Sing
le S
uper
SEP
Pig
Man
ure
Agr
i-ash
Bio
Ag
Ble
nd
Sing
le S
uper
Agr
i-ash
Bio
Ag
Ble
nd
Ecol
ogy/
Dic
al 6
4
SEP
Pig
Man
ure
YLA
D C
omp
Min
B
lend
cent
s/kg
DM
/ha
2012 2014 13.1 12.1

COST EFFECTIVENESS – Kia-Ora 2012 & 2014
Cost of additional pasture grown above the Control
0
2
4
6
8
10
Sing
le S
uper
Agr
iash
SEP
Pig
Man
ure
Bio
Ag
Ble
nd
Ecol
ogy/
Dic
al 6
4
YLA
D C
omp
Min
B
lend
Sing
le S
uper
Ecol
ogy/
Dic
al 6
4
Bio
Ag
Ble
nd
Agr
i-ash
SEP
Pig
Man
ure
YLA
D C
omp
Min
B
lend
cent
s/kg
DM
/ha
2012 2014
13.3
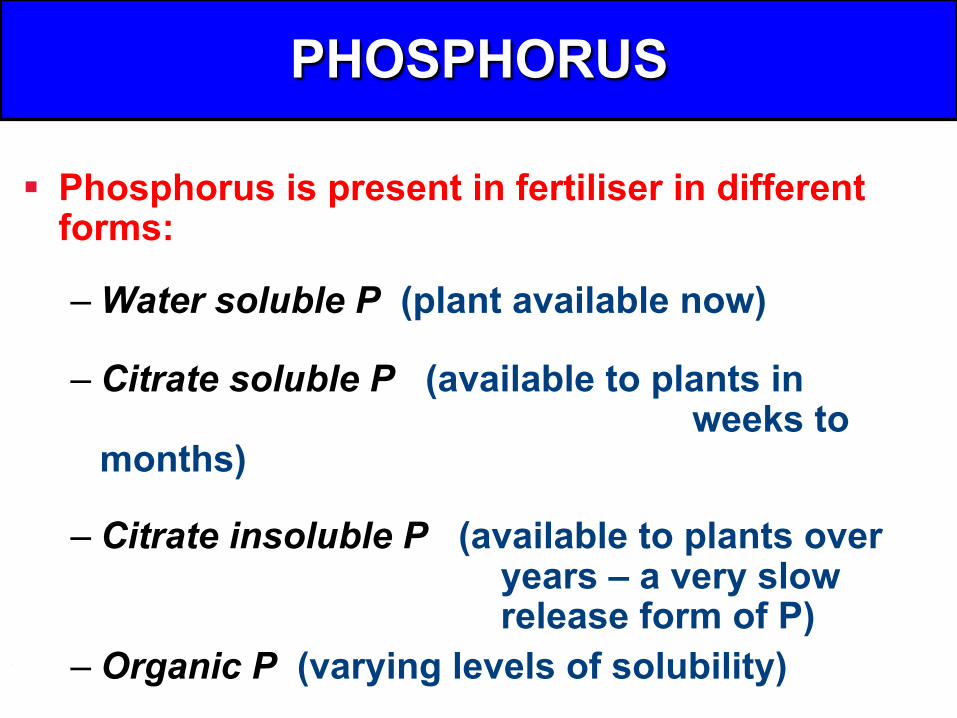
PHOSPHORUS
§ Phosphorus is present in fertiliser in different
forms:
– Water soluble P (plant available now)
– Citrate soluble P (available to plants in weeks to months)
– Citrate insoluble P (available to plants over years – a very slow release form of P)
– Organic P (varying levels of solubility)

Treatment Water Soluble
Phosphorus
Citrate Soluble
Phosphorus
Insoluble Phosphorus
Total Phosphorus
Total Sulphur
Control Nil Nil Nil Nil Nil Single Super 51 13 2 66 83 Agri-ash Nil 28 137 165 21 Trio-min/Eco-min Balance
1 6 10 17 13
SEP Pig Manure 6 83 88 177 34 Groundswell Compost 1 9 11 20 15 YLAD Compost Mineral Blend
- Glenroy No laboratory analysis undertaken on fertilizer applied - Kia-Ora <1 3 46 49 71 YLAD Compost Tea <1 <1 <1 <1 BioAg Blend <1 2 70 72 29 Ecology FF/Dical 64 <1 8 64 72 22 Urea Nil Nil Nil Nil Nil
Products containing significant amounts of P & S (kg/ha)
Dominant form(s) of P in product (kg/ha)
Total P & S applied after 6 years

P cycle in grazing systems
INORGANIC P
adsorbed
mineral
precipitated
OUTPUTS
INPUTS
0.5 - 2 kg/ha
10 - 30 kg/ha RESIDUES
labile
passive
resistant ORGANIC P
Pfert losses ??
Bacteria Fungi Nematodes Protozoa
MICROBIAL P
SOIL SOLUTION P
run-off
erosion leaching
Source: Richardson, AR et.al. 2009, Crop and Pasture Science 60:124-143

Average Spring herbage yield (2009-2014) v’s Phosphorus & Sulphur applied
High P Low P
-20
0
20
40
60
80
100
120
140
160
180
200
SEP Pig Manure Agri-ash BioAg Blend Ecology FF/Dical 64 Single Super YLAD Comp Min Blend Groundswell Compost Trio-min/ Eco-min Balance YLAD Compost Tea Urea
Aver
age
DM
% a
bove
Con
trol
(200
9-14
) Glenroy
Kia-Ora
P 177 S 34 P 165
S 21 P 72 S 29
P 72 S 22
P 66 S 83
P 49 S 71
P 20 S 15
P 17 S 13 P<1
S<1
P Nil S Nil

Sep 2014 – Pasture Quality scoring & sampling Glenroy

PASTURE QUALITY – GLENROY Spring Sampling Period - 2012
0
5
10
15
20
25
9.0
9.5
10.0
10.5
11.0
11.5
12.0
Con
trol
Sing
le S
uper
Agr
i-ash
Trio
-min
/Eco
-min
Bal
ance
SEP
Pig
Man
ure
Gro
unds
wel
l Com
post
YLA
D C
omp
Min
Ble
nd
YLA
D C
ompo
st T
ea
Bio
Ag
Ble
nd
Ecol
ogy
FF/ D
ical
64
Ure
a
Cru
de P
rote
in (%
)
Met
abol
isab
le E
nerg
y (M
J/kg
DM
)
2012 ME 2012 Protein
* *
* * * *
* * * * *

PASTURE QUALITY – GLENROY Winter+Spring Sampling Period – 2014
0
5
10
15
20
25
9.0
9.5
10.0
10.5
11.0
11.5
12.0 C
ontr
ol
Sing
le S
uper
Agr
i-ash
Trio
-min
/Eco
-min
Bal
ance
SEP
Pig
Man
ure
Gro
unds
wel
l Com
post
YLA
D C
omp
Min
Ble
nd
YLA
D C
ompo
st T
ea
Bio
Ag
Ble
nd
Ecol
ogy
FF/ D
ical
64
Ure
a
Cru
de P
rote
in (%
)
Met
abol
isab
le E
nerg
y (M
J/kg
DM
)
2014 ME 2014 Protein
* * * * * *
* * * * *
*

PASTURE QUALITY – KIA-ORA Spring Sampling Period - 2012
0
5
10
15
20
25
9.0
9.5
10.0
10.5
11.0
11.5
12.0 C
ontr
ol
Sing
le S
uper
Agr
i-ash
Trio
-min
/Eco
-min
Bal
ance
SEP
Pig
Man
ure
Gro
unds
wel
l Com
post
YLA
D C
omp
Min
B
lend
YLA
D C
ompo
st T
ea
Bio
Ag
Ble
nd
Ecol
ogy
FF/ D
ical
64
Ure
a
Cru
de P
rote
in (%
)
Met
abol
isab
le E
nerg
y (M
J/kg
DM
)
2012 ME 2012 Protein
* *
* *

PASTURE QUALITY – KIA-ORA Winter+Spring Sampling Period - 2014
0
5
10
15
20
25
9.0
9.5
10.0
10.5
11.0
11.5
12.0 C
ontr
ol
Sing
le S
uper
Agr
i-ash
Trio
-min
/Eco
-min
Bal
ance
SEP
Pig
Man
ure
Gro
unds
wel
l Com
post
YLA
D C
omp
Min
B
lend
YLA
D C
ompo
st T
ea
Bio
Ag
Ble
nd
Ecol
ogy
FF/ D
ical
64
Ure
a
Cru
de P
rote
in (%
)
Met
abol
isab
le E
nerg
y (M
J/kg
DM
)
2014 ME 2014 Protein
* * *
* * *

$/ha ranking based on livestock performance for 2 selected years.
Kia Ora Glenroy 2012 2014 2012 2014 Agri-ash 269 175 81 96 BioAg Blend 100 459 8 126 Control 0 0 0 0 Groundswell Compost
-‐70 -‐51 -‐116 -‐112
Ecology/Dical 64 61 534 -‐65 114 Trio-min/Eco-min -‐105 -‐77 -‐138 -‐69 SEP Pig Manure 226 211 98 69 Single Super 210 505 170 235 Urea -‐66 -‐63 -‐60 -‐39 YLA`D Compost Mineral Blend
36 52 -‐153 12
YLAD Compost Tea
-‐40 -‐39 -‐39 -‐39

Available Soil Phosphorus (Colwell) Results 2008 – 2014
0.0
5.0
10.0
15.0
20.0
25.0
30.0
35.0
Control Single Super Agri-ash Trio-min/ Eco-min Balance
SEP Pig Manure
Groundswell Compost
YLAD Comp Min Blend
YLAD Compost
Tea
BioAg Blend Ecology FF/Dical 64
Urea
Avai
l P (C
olw
ell)
(mg/
kg) 2008 2009 2010 2011 2012 2013 2014
*****
******
**** *
0.0
5.0
10.0
15.0
20.0
25.0
30.0
35.0
Control Single Super Agri-ash Trio-min/ Eco-min Balance
SEP Pig Manure
Groundswell Compost
YLAD Comp Min Blend
YLAD Compost
Tea
BioAg Blend Ecology FF/Dical 64
Urea
Avai
l P (C
olw
ell)(
mg/
kg)
****** *****
* *
GLENROY
KIA-ORA
* Denotes significant difference from the control (P ≤ 5%)
*
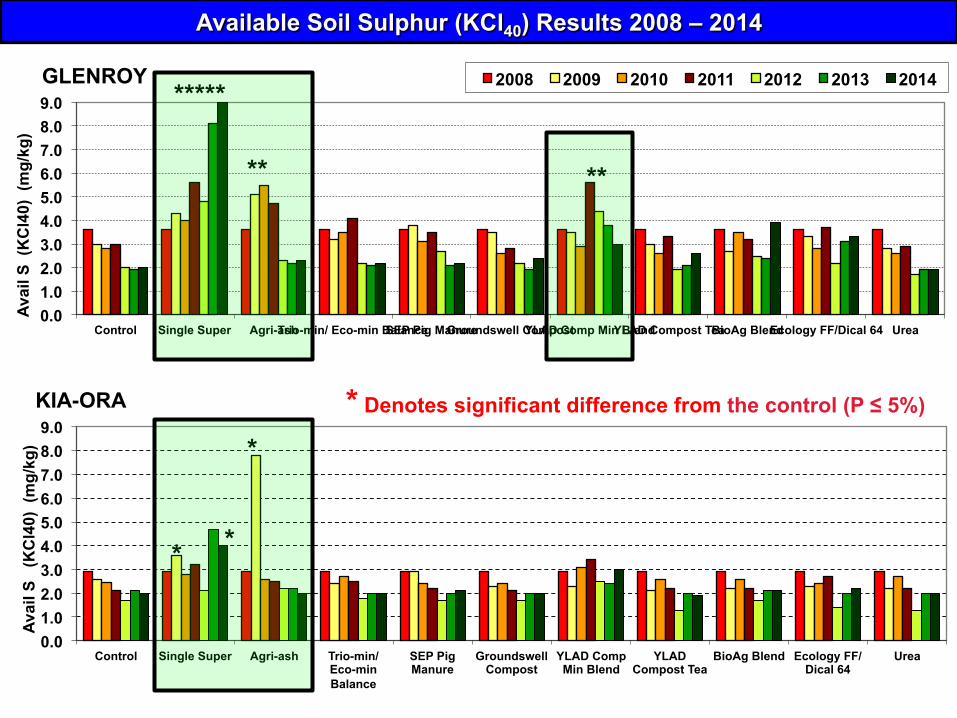
Available Soil Sulphur (KCl40) Results 2008 – 2014
0.0 1.0 2.0 3.0 4.0 5.0 6.0 7.0 8.0 9.0
Control Single Super Agri-ash Trio-min/ Eco-min Balance SEP Pig Manure Groundswell Compost YLAD Comp Min Blend YLAD Compost Tea BioAg Blend Ecology FF/Dical 64 Urea
Avai
l S (
KC
l40)
(m
g/kg
)
2008 2009 2010 2011 2012 2013 2014 GLENROY
**
*****
**
0.0 1.0 2.0 3.0 4.0 5.0 6.0 7.0 8.0 9.0
Control Single Super Agri-ash Trio-min/ Eco-min Balance
SEP Pig Manure
Groundswell Compost
YLAD Comp Min Blend
YLAD Compost Tea
BioAg Blend Ecology FF/Dical 64
Urea
Avai
l S
(KC
l40)
(m
g/kg
)
* Denotes significant difference from the control (P ≤ 5%) KIA-ORA
*
* *

§ When starting from a low soil fertility status can you afford to wait for a pasture growth response when using products that consist mostly of insoluble P?? – Answer based on a business decision and/or a personal
philosophical decision
§ Sulphur is particularly holding back pasture growth in many products & likely that if additional S is applied growth would improve. – Recognise this would result in a higher cost
SUMMARY -

Soil pH (CaCl) & Aluminium (Al) %
§ Initial soil pH levels 4.0 - 4.2 ; initial soil Al % levels 15 - 33%
§ Products significantly raising pH(CaCl) higher than Control & significantly lowering Al % below Control : (statistical analysis based on multiple pair-wise comparison tests P ≤ 5%)
§ No other products changed soil pH / Al % and certainly none of them made it worse
KEYpH & Al % Al % only

Soil Microbial Results
§ 6 years of monitoring using: § FDA Microbial Activity Test and § Biomass Carbon Test
§ No product has consistently resulted in higher or lower soil microbial status compared to the Control to date

Where is the project going …
§ No product applied after 2014.
§ Spring herbage mass & soil nutrient status measured in 2015 & 2016 as fertilizers run down.
§ ADDITIONAL SOIL MICROBIAL MEASUREMENTS :
Soil microbial diversity has been determined based on soil DNA taken from plots in 6th year of trial (Spring 2014 from 2 trial sites).
Data currently being analysed for presentation.

Funding Received - $216K
Special thanks to our trial co-operators: Bruce & Noelene Hazell, Gary & Hansie Armour
and Geoff & Fiona Henderson

YOUTUBE CLIPS available for …
‘Alternative Fertilizer & Pasture Productivity’ Seminar held at Bookham Hall on
1st September 2015
Web address:
http://southeast.lls.nsw.gov.au/our-region/key-projects/alternative-fertilizers-field-research-project

§ Total Carbon - no significant differences
§ Sodium % (compared to Control) – Glenroy (2013) Pig & EFF/Dical 64 higher – Kia-Ora (2012) YLAD Comp Min Blend sig lower
§ Ca:Mg ratio (compared to Control (2-3G; 1-2 K)) – Glenroy - higher in Agriash all years (5-9) - higher in BioAg 2010 -14 (5-6) - higher In YLAD Comp Min Blend 2010 -14 (7-9)
– Kia-Ora - higher in Agriash 2009-10, 2012-13 (2-4) - higher in YLAD Comp Min Blend 2012-14 (2-3)
Additional Elements of Interest

§ Electrical Conductivity (compared to Control) – Glenroy - higher in Agriash 2010 - higher in Pig Manure 2010 & 2012 - higher in Single Super 2012 -14
– Kia-Ora - higher in Agriash 2014 - higher in Single Super 2013 -14
- higher in YLAD Comp Min Blend 2014
§ Calcium (cmol) (compared to Control) – Glenroy - higher in Agriash all years - higher in BioAg 2009-11 - higher in YLAD Comp Min Blend all years – Kia-Ora - higher in Agriash all years - higher in YLAD Comp Min Blend 2010-14

§ Potassium (cmol) (compared to Control) – Glenroy - lower in Single Super 2014
– Kia-Ora - lower in Agriash 2013-14 - lower in Ecology FF/Dical 64 2014
- higher in YLAD Comp Min Blend 2014
§ Magnesium (cmol) (compared to Control) – Glenroy - higher in Pig Manure in 2010,2012-14
– Kia-Ora – no significant differences

§ FDA (compared to Control) – Glenroy – no significant differences
– Kia-Ora - higher in BioAg 2009
§ Biomass Carbon (compared to Control) – Glenroy - no significant differences
– Kia-Ora - higher in Agriash 2010

How do I choose an appropriate fertilizer for my pasture-grazing situation?
1. Decide your objective for pasture growth & soil fertility.
2. Determine soil nutrient deficiencies/toxicities from soil test & paddock history.
to ensure you are making money from superphosphate

How do I choose an appropriate fertilizer for my pasture-grazing situation?
3. IDENTIFY suitable fertilizers based on nutrient analysis.
4. ASK suppliers for evidence of product performance.
→ TEST STRIPS are a useful way to compare: new product vs nil control vs standard practice.
→ Always exclude from grazing for 6-8wks in spring to see differences
5. COST fertilizers also accounting for freight and spreading.
6. CHOOSE product based on steps 1 -5.

How do I choose an appropriate fertilizer for my pasture-grazing situation?
7. RATES of fertilizer application can be determined with help of:
http://www.mla.com.au/Extension-and-training/Tools-and-calculators/Phosphorus-tool
8. MONITOR soil fertility ANNUALLY in key paddock(s) to determine nutrient changes. Always align with grazing records.
to ensure you are making money from superphosphate