Embed Size (px)
Citation preview

Implications for a Low Return Environment
Christopher M Ruth, CFA, CPA
Chief Market Strategist

What are the major implications and risks for a low return environment?
2
Answer: Beyond the obvious for low returns that disappoint, the longer term dangers lie
below the surface.
This material is for use in one-on-one presentations with eligible investors only.

A primary risk is the pressure to “stretch” for returns.
3
Whether it is corporate cash and short-term fixed income investment portfolios or pension plans, the
need to maximize investment returns can sometimes lead to dangerous places.
This material is for use in one-on-one presentations with eligible investors only.

How quickly history can be forgotten!
Auction Rate Securities
AAA Rated Sub-prime Mortgage Pools
CMO Pools and Related Derivatives
Money Market Funds That “Break the Buck”
………To Name a Few……….
4
This material is for use in one-on-one presentations with eligible investors only.

For many investment professionals expected to take reasonable and prudent investment
risks, the most appropriate investment game plan is to:
5
Preserve Principal First, Grow Prudently Second.
This material is for use in one-on-one presentations with eligible investors only.

Insert Picture of U.S. Golf Open Leader Board
6Source: usopen website
This material is for use in one-on-one presentations with eligible investors only.

Risk Management Is Key
While we can’t eliminate investment risk, in a low return environment risk management becomes
especially critical due to a muted upside potential.
7
This material is for use in one-on-one presentations with eligible investors only.

Risk Management is Key
8
This material is for use in one-on-one presentations with eligible investors only.

Minimize Asymmetrical Risk
9
This material is for use in one-on-one presentations with eligible investors only.

Identify Investments with Symmetrical Risk Characteristics or a Slight Positive Bias for Symmetrical Risk
10
This material is for use in one-on-one presentations with eligible investors only.
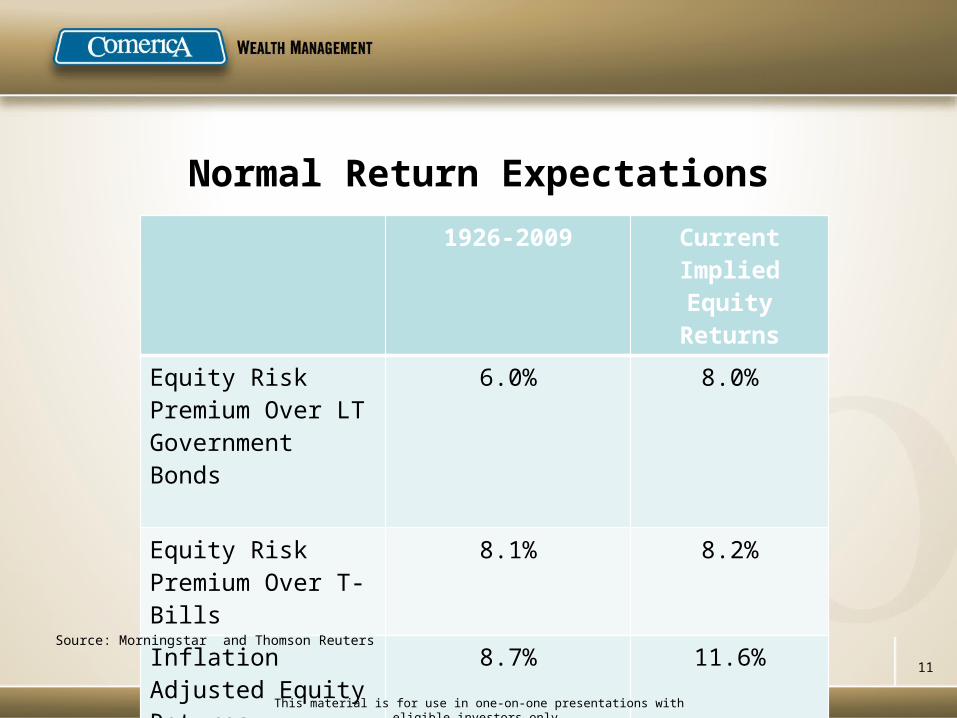
Normal Return Expectations
1926-2009 Current Implied Equity Returns
Equity Risk Premium Over LT Government Bonds
6.0% 8.0%
Equity Risk Premium Over T-Bills
8.1% 8.2%
Inflation Adjusted Equity Returns
8.7% 11.6%
Source: Morningstar and Thomson Reuters
11
This material is for use in one-on-one presentations with eligible investors only.

Normal Return Expectations(1958-2010)
Real GDP % % Return S&P 500
Median 3.28% 8.15%
Average 3.12% 7.27%
Standard Deviation 2.30% 13.45%
Source: St. Louis Federal Reserve12
This material is for use in one-on-one presentations with eligible investors only.

Comparative AnalysisS&P 500 Performance During Periods of Real GDP
Growth Under 3%(1958-2010)
Se-ries1
-25.00
-20.00
-15.00
-10.00
-5.00
0.00
5.00
10.00
15.00
20.00
Source: St. Louis Federal Reserve 13Real GDP S&P 500
This material is for use in one-on-one presentations with eligible investors only.

Comparative AnalysisS&P 500 Performance
During Periods of Real GDP Growth Under 3%(1958-2010)
Real GDP(Yr./Yr. % Change)
S&P 500 *Total Return
Average 0.87% -0.32%
Median 1.41% 4.06%
Standard Deviation 1.81% 13.83%
% of Time Period S&P 500 Return is above 4%
50.0%
14*Calculations performed by Comerica Asset Management Group, based on data obtained from St. Louis Federal Reserve
This material is for use in one-on-one presentations with eligible investors only.

Comparative AnalysisGlobal Economic Growth and Returns For MSCI ACWI
(1997-2011)
-40
-30
-20
-10
0
10
20
30
40
50
Source: International Monetary Fund and Thomson Reuters 15Global GDP MSCI ACWI
This material is for use in one-on-one presentations with eligible investors only.

Comparative AnalysisGlobal Economic Growth and Returns For MSCI ACWI
(1997-2011)
Global Real GDP(Yr./Yr. % Change)
MSCI ACWITotal Return
Average 3.4% 8.9%
Median 3.9% 11.4%
Standard Deviation 1.9% 21.6%
16*Calculations performed by Comerica Asset Management Group, based on data obtained from International Monetary Fund and Thomson Reuters
This material is for use in one-one presentations with eligible investors only.

Comparative AnalysisReturns For the MSCI ACWI
When Global Economic Growth is Below 3%(1997-2011)
MSCI ACWITotal Return
Average -2.9%
Median -18.2%
Standard Deviation 33.1%
% of Time Returns for the MSCI ACWI were positive
40.0%
17*Calculations performed by Comerica Asset Management Group, based on data obtained from International Monetary Fund and Thomson Reuters
This material is for use in one-one presentations with eligible investors only.

U.S. Investment Grade (5 year) tightening to Treasuries pauses due to heavy new issue supply. Domestic economy showing strength in
the first quarter of 2012 helps corporates outperform recently.
18Source: Bloomberg
This material is for use in one-one presentations with eligible investors only.

A-rated financial credits (top) perform well recently though still spread over twice as much over Treasury yields (bottom) as
compared to AA-rated industrial credits (middle).
Source: Bloomberg19
This material is for use in one-on-one presentations with eligible investors only.

German 10-year bunds (bottom) outperform US Treasury 10-year Notes (top) as Euro zone economy weakens.
Source: Bloomberg 20
This material is for use in one-on-one presentations with eligible investors only.

Italian 10-year yields (middle) and Spanish 10-year yields (top) off the highs of late 2011 though move higher recently as both
economies fall back into recession. Both near historically wide spreads versus German 10-year yields (bottom).
Source: Bloomberg 21
This material is for use in one-on-one presentations with eligible investors only.

10-year tax-exempt, AAA-rated yields as a percentage of 10-year Treasury yields continue to show relative value of owning municipals.
Source: Bloomberg22
This material is for use in one-on-one presentations with eligible investors only.

With the Federal Reserve pledge to hold Fed Funds rate at near zero through 2014, there is little value in the yield curve within two-year maturities.
Corporate securities add incremental yield and extending duration instead of reducing quality is recommended.
Source: Bloomberg23
This material is for use in one-on-one presentations with eligible investors only.

Liability Driven Investments (LDI) Strategies Make Sense Where Appropriate
If a significant duration mismatch exists between investments and liabilities, LDI may make the most sense.
LDI is one of the very few scenarios where we see the need to purchase long-duration bonds based on the
current low yield environment.
24
This material is for use in one-on-one presentations with eligible investors only.

Dividends Are Another Important Consideration
For accounts that can accept equity risk, high-quality dividend paying stocks should be considered.
We believe we will continue to be in a more traditional period where dividend income comprises a large portion
of total equity investment returns (we think that a return to the 1990’s is unlikely).
25
This material is for use in one-on-one presentations with eligible investors only.

Alternative Investments May Also Be Appropriate
For accounts that can utilize alternative investments, we recommend them for both
absolute return and diversification benefits.
26
This material is for use in one-on-one presentations with eligible investors only.

Focus on Quality
It will provide better principal protection in volatile markets.
27
This material is for use in one-on-one presentations with eligible investors only.

Disclosure
This is not a complete analysis of every material fact regarding any company, industry or security. The information and materials herein has been obtained from sources we consider to be reliable but Comerica Wealth Management does not warrant, or guarantee, its completeness or accuracy. Materials prepared by Comerica Wealth Management personnel are based on public information. Facts and views presented in this material have not been reviewed by, and may not reflect information known to, professionals in other business areas of Comerica Wealth Management, including investment banking personnel.
The views expressed are those of the author at the time of writing and are subject to change without notice. We do not assume any liability for losses that may result from the reliance by any person upon any such information or opinions. This material has been distributed for general educational/informational purposes only, and should not be considered as investment advice or a recommendation for any particular security, strategy or investment product, or as personalized investment advice.
Past performance is not indicative of future results. The material is not intended as an offer or solicitation for the purchase or sale of any financial instrument. The investments and strategies discussed herein may not be suitable for all clients. The material is not intended to provide, and should not be relied on for, accounting, legal or tax advice, or investment recommendations.
Comerica’s Wealth Management team consists of various divisions of Comerica Bank, affiliates of Comerica Bank including Comerica Bank & Trust, N.A., and subsidiaries of Comerica Bank including World Asset Management, Inc.; Wilson, Kemp & Associates, Inc.; Comerica Securities, Inc.; and Comerica Insurance Services, Inc. and its affiliated insurance agencies. World Asset Management, Inc., Wilson, Kemp, & Associates, Inc., and Comerica Securities, Inc. are federally Registered Investment Advisors. Registrations do not imply a certain level of skill or training.
Securities and other non-deposit investment products offered through Comerica are not insured by the FDIC; are not deposits or other obligations of, or guaranteed by, Comerica Bank or any of its affiliates; and are subject to investment risks, including possible loss of the principal invested. Past performance is not indicative of future results. Information presented is for general information only and is subject to change. Comerica Bank and its affiliates do not provide tax or legal advice. Please consult with your tax and legal advisors regarding your specific situation.
28