Embed Size (px)
Citation preview

Strategies for Managing your Agency’s Investments
Tim Johnson, CFAManaging DirectorSenior Fixed Income Strategist
April 17, 2013
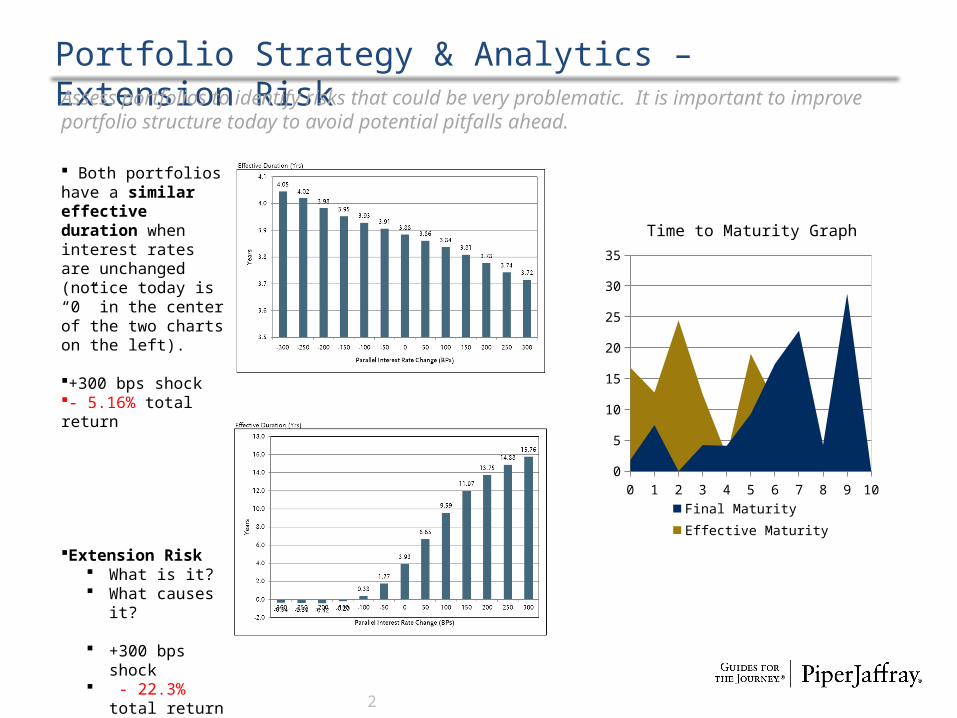
Portfolio Strategy & Analytics – Extension Risk
2
Assess portfolios to identify risks that could be very problematic. It is important to improve portfolio structure today to avoid potential pitfalls ahead.
Both portfolios have a similar effective duration when interest rates are unchanged (notice today is “0” in the center of the two charts on the left).
+300 bps shock- 5.16% total return
Extension Risk What is it? What causes
it?
+300 bps shock
- 22.3% total return
0 1 2 3 4 5 6 7 8 9 100
5
10
15
20
25
30
35
Final Maturity Effective Maturity
Time to Maturity Graph

Portfolio Strategy & Analytics – Coupon Type
Coupon Type Matters………
3

Par Value Mkt Value Cash Ann Income Quality CouponMaturity
(Yrs) Avg LifeCurr
Yield YTW Mod Dur Eff Dur Conv
Before 1,000,000 1,000,229 0 6,250 Aaa 0.625 4.992 5.000 0.625 0.622 4.904 4.935 0.132
After 711,000 1,000,166 0 63,101 Aaa 8.875 4.947 4.917 6.331 0.613 4.231 4.250 0.107Difference -289,000 -63 0 56,851 8.250 -0.044 -0.083 5.706 -0.009 -0.674 -0.684 -0.025
Sell the current .625% 5yr Treasury and BUY 5yr 8.875% coupon.
Improve total return performance by up to +187 basis points in +50 to +300 basis point shock environments.
Increase Annual Income by $56k
Decrease Effective Duration by .6 years.
Yield and market value neutralYield Chg
(bps) Before After Diff
-300 16.699 14.336 -2.363
-250 13.828 11.892 -1.936
-200 11.043 9.517 -1.526
-150 8.329 7.201 -1.128
-100 5.687 4.943 -0.744
-50 3.120 2.746 -0.374
0 0.622 0.605 -0.017
50 -1.811 -1.484 0.327
100 -4.179 -3.519 0.660
150 -6.481 -5.502 0.979
200 -8.722 -7.435 1.288
250 -10.906 -9.321 1.585300 -13.027 -11.156 1.871
Portfolio Strategy & Analytics – Bond Coupon
Source: Bondedge
Average Coupon Matters………

5
Portfolio Strategy & Analytics – Fixed vs Floating
Fixed Rate Bullet vs Floating Rate Bullet
Source: Bondedge
Ann Income Quality Coupon
Maturity (Yrs)
Avg Life
Curr Yield YTW
Mod Dur Eff Dur Conv
Fixed Rate - Bullet 31,000 A1 3.100 9.764 9.750 3.100 3.099 8.309 8.565 0.419
Floater - Bullet 12,811 A1 1.281 9.917 9.917 1.278 1.254 9.415 0.102 -0.008Difference -18,189 -1.819 0.153 0.167 -1.822 -1.845 1.106 -8.463 -0.427
The Floater bond will yield 185 basis points less than the Fixed Rate bond.The Floater bond will currently have a lower Annual Income and Coupon.
Yield Chg (bps)Fixed Rate
- BulletFloater -
Bullet Diff
-300 32.886 6.915 -25.972
-250 27.266 4.644 -22.622
-200 21.950 2.830 -19.120
-150 16.881 1.804 -15.077 If interest rates are flat or fall, the Fixed Rate bond outperforms.-100 12.048 1.385 -10.663
-50 7.452 1.341 -6.110
0 3.078 1.298 -1.780
50 -1.087 1.263 2.350
100 -5.053 1.195 6.248
150 -8.828 1.134 9.962 If interest rates rise, the Floater bond outperforms.200 -12.428 1.077 13.505
250 -15.862 1.014 16.876300 -19.122 0.946 20.068

6
Portfolio Strategy & Analytics – Fixed vs Cushion Callable
Fixed Rate Bullet vs Fixed Cushion Callable
Source: Bondedge
Ann Income Quality Coupon
Maturity (Yrs)
Avg Life
Curr Yield YTW
Mod Dur Eff Dur Conv
Fixed Rate - Bullet 31,000 A1 3.100 9.750 9.750 3.084 3.039 8.302 8.552 0.418
Fixed - Callable 50,000 A1 5.000 9.933 0.417 4.966 3.392 7.799 2.924 -2.353Difference 19,000 1.900 0.183 -9.333 1.882 0.353 -0.503 -5.629 -2.771
The Callable bond will yield 35 basis points more than the Fixed Rate bond.The Callable bond will have a higher Annual Income and Coupon.
Yield Chg (bps) Before After Diff
-300 32.774 4.767 -28.006
-250 27.164 4.576 -22.587
-200 21.857 4.344 -17.513
-150 16.797 4.055 -12.742 If interest rates fall, the Fixed Rate bond outperforms.-100 11.972 3.924 -8.048
-50 7.384 3.646 -3.737
0 3.017 3.369 0.352
50 -1.142 1.257 2.399
100 -5.102 -1.892 3.210
150 -8.872 -5.397 3.475 If interest rates are flat or rise, the Callable bond outperforms.200 -12.466 -8.914 3.553
250 -15.897 -12.235 3.662300 -19.152 -15.355 3.797

7
Portfolio Strategy & Analytics – Cushion Callable vs Floating
Fixed Cushion Callable vs Floating Rate Bullet
Source: Bondedge
Ann Income Quality Coupon
Maturity (Yrs)
Avg Life
Curr Yield YTW
Mod Dur Eff Dur Conv
Fixed - Callable 50,000 A1 5.000 9.933 0.417 4.966 3.392 7.799 2.924 -2.353
Floater - Bullet 12,811 A1 1.281 9.917 9.917 1.281 1.281 9.400 0.073 -0.009Difference -37,189 -3.719 -0.017 9.500 -3.685 -2.111 1.602 -2.851 2.343
The Floater bond will yield 211 basis points less than the Fixed Callable bond.The Floater bond will have a lower Annual Income and Coupon.
Yield Chg (bps)Fixed -
CallableFloater -
Bullet Diff
-300 4.767 6.960 2.192
-250 4.576 4.685 0.109
-200 4.344 2.856 -1.488
-150 4.055 1.797 -2.258 If interest rates are flat or fall, the Callable bond outperforms.-100 3.924 1.355 -2.569
-50 3.646 1.327 -2.319
0 3.369 1.299 -2.070
50 1.257 1.280 0.023
100 -1.892 1.224 3.116
150 -5.397 1.176 6.573 If interest rates rise, the Floater bond outperforms.200 -8.914 1.134 10.048
250 -12.235 1.085 13.319300 -15.355 1.030 16.384

8
Portfolio Strategy & AnalyticsFed Funds and 30 year Treasury – yields on top and spreads below.

Piper Jaffray is a leading investment bank and asset management firm. Founded in 1895, Piper Jaffray Companies is an investment bank and asset management firm headquartered in Minneapolis with offices across the U.S. and in London and Zurich. Securities brokerage and investment banking services are offered in the United States through Piper Jaffray & Co., member FINRA, NYSE and SIPC, and in Europe through Piper Jaffray Ltd., authorised and regulated by the Financial Services Authority. Asset management products and services are offered through three separate investment advisory affiliates registered with the U.S. Securities and Exchange Commission: Advisory Research Inc.; FAMCO, Inc.; and Piper Jaffray Investment Management LLC.
© 2013 Piper Jaffray Companies. 800 Nicollet Mall, Minneapolis, Minnesota 55402-7020.
Prices, yields, and availability are for illustrative purposes only and subject to change with market conditions. The information contained in this communication has been compiled by Piper Jaffray & Co. from sources believed to be reliable, but no representation or warranty, express or implied, is made by Piper Jaffray & Co., its affiliates or any other person as to its accuracy, completeness or correctness. All opinions and estimates contained in this communication constitute Piper Jaffray & Co.’s judgment as of the date of this communication, are subject to change without notice and are provided in good faith but without legal responsibility. Piper Jaffray & Co. may buy from or sell to customers on a principal basis in the securities or related derivatives that are the subject of this communication. Piper Jaffray & Co. has or may have proprietary positions in the securities or in related derivatives that are the subject of this communication.
Material based on data from sources deemed reliable; accuracy/completeness not guaranteed. Not for use as a primary basis of investment decisions; not to be construed to meet needs of any investor, subject to change. Not a representation or solicitation of an offer to sell or buy any security. Securities may not be eligible for solicitation in all states. Piper Jaffray, its officers or family members may own, buy, or sell these securities. Piper Jaffray may make a market in the company's common stock. Past performance does not guarantee future results.
Disclosures