Embed Size (px)
Citation preview

Implementing Sustainable Stormwater
Initiatives at Eco-U
2008 Capstone Class
Environmental Science and Policy
December 19, 2008
University of Wisconsin – Green Bay

Page 1
Table of Contents
Introduction ......................................................................................................................................3
Chapter 1 Public Education, Outreach, Participation & Involvement ............................................7
Chapter 2 IS Green Roof Project ..................................................................................................26
Chapter 3 Exploring the Use of Low Impact Development Techniques at UWGB .....................44
Chapter 4 Using ArcGIS and WinSLAMM..................................................................................72

Page 2
ABSTRACT
The goal of this year’s graduate capstone class in Environmental Science and Policy was
to build upon past works and collaborate with campus coordinators with the intent of
implementing sustainable initiatives on the University of Wisconsin-Green Bay campus. The
main focus of this section was to help the university exceed the requirements of its Municipal
Storm Water permit of 40% Total Suspended Sediment by 2013. We targeted three areas:
education & outreach, design of control devices, and modeling stormwater pollution. In the first
section we focused on stormwater education and remediation. We established a basic
educational lecture that was delivered to numerous general education classes and we performed a
series of outreach programs intended to create awareness of stormwater impacts on the waters of
Wisconsin. Now established, these programs can be replicated annually. In order to ameliorate
the impacts of stormwater pollution running off the campus, we designed numerous control
devices. The first is a green roof over the Instructional Services building. Pending approval of
funding, this is scheduled to be implemented in the spring of 2009. We also designed and
planned several additional control devices that could potentially be placed on campus to meet
future stormwater requirements. Finally we analyzed the cost and effectiveness of each control
device to develop optimal management strategies. These proactive measures combine
educational awareness with sustainable management strategies and will serve to meet future
stormwater regulations as well as exemplify the University’s commitment towards
environmental sustainability.

Page 3
INTRODUCTION
Our 2008 Capstone graduate class decided to review stormwater recommendations made
by the 2005 class, whose report (Forsberg, et. al. 2005) contains background on permitting
regulations and delineates the process that UWGB will follow as it becomes its own stormwater
permitting body. The students focused on ways to help the University meet the required
reductions in total suspended solids (TSS) of 20% by 2008, and 40% by 2013, as stipulated by
MS4 permit requirements. They investigated best management practices that include use of rain
gardens, bioretention cells, treatment trains, wet detention ponds, constructed wetlands,
infiltration basins and trenches, and porous pavement. A few of these options were
recommended for use on the UWGB campus. We decided to evaluate the effectiveness of
several of these best management practices and supplement current education and outreach
efforts.
MS4 background and Clean Water Act
MS4 permits were created by a section of the Clean Water Act of 1987, with Phase I
communities going into effect in 1990, and Phase II communities going into effect in 2000.
Phase I permits were for municipalities which had populations greater than 100,000, and
Wisconsin began regulating these municipalities in 1994. In August of 2004, as part of NR216
(WDNR 2004) Phase II changes, any entity with a population over 100,000 became its own MS4
permitting body. UWGB was discharging its stormwater directly into Green Bay or into Mahon
Creek, which flows into Green Bay (Forsberg 2005). As a result, UWGB was required to
become its own MS4 permitting body, instead of having it handled through the City of Green
Bay as was previously done.

Page 4
Additional Regulations
The purpose of the MS4 stormwater permit, as well as the Natural Resources Codes 216
and 151, is to help control non-point source pollution and improve water quality. These codes
are important because recently, municipalities have built their stormwater systems to get rid of
water as quickly as possible. As a result, any pollutants carried along with the water, such as
oils, litter, fertilizers, salts, phosphorous, nitrogen, and soil particles were carried without
treatment as into the nearest water body. Natural Resources Code 216 deals with Municipal
stormwater as part of the Wisconsin Pollution Detection and Elimination System (WPDES)
stormwater permits.
Implications for Municipalities
The most recent version of the MS4 permit, requiring the 20% reduction in TSS, became
effective January 19, 2006 and will expire on December 31, 2010. The required 40% TSS
removal will take effect in 2013. The University of Green Bay has already met their 40% TSS
reduction. However, it is expected that this requirement will become even more stringent in the
future, compelling UWGB to implement additional stormwater best management practices.
Capstone 2008 Project Goals
The 2008 Capstone stormwater group decided to focus on three different areas:
education, design, and SLAMM modeling/Cost analysis. The education section identified
different opportunities to inform students about all aspects of stormwater management and
funding was sought for the Instructional Services Green Roof project. The design group
investigated various designs for the green roof over UWGB IS building, porous pavement for

Page 5
part of Wood Hall parking lot, and bioretention cells to treat stormwater from Wood Hall parking
lot and Weidner Center parking lots. The final objective was to use WinSLAMM, an urban
stormwater modeling program, to model the various control devices developed by the previous
group and evaluate their effectiveness in removing pollutants.

Page 6
References
Forsberg, A. A., McCuskey, J. A., Waltman, C. S. (2005) University of Wisconsin-Green
Bay stormwater management: regulations and best management practices. UWGB
Environmental Science and Policy 763 semester project.
WI Department of Natural Resources “Chapter NR 151” (July, 2004). Retrieved December 15,
2008, from http://www.legis.state.wi.us/rsb/code/nr/nr151.pdf and
http://dnr.wi.gov/runoff/rules/nr151.htm
WI Department of Natural Resources “Chapter NR 216” (July, 2004). Retrieved December 15,
2008, from http://www.legis.state.wi.us/rsb/code/nr/nr216.pdf and
http://dnr.wi.gov/runoff/rules/nr216.htm

Page 7
Chapter 1
Stormwater Management -
Public Education, Outreach, Participation & Involvement
Lindsay Calvert
Katherine Disterhaft
Trisha A. Cooper

Page 8
Introduction
Stormwater management is quickly becoming critical as municipalities attempt to
maintain and manage declining fresh water resources. Municipalities now find that increasingly,
these water supplies are contaminated with chemical compounds from fertilizers, herbicides,
pesticides, animal wastes, car oils and fluids, and many household hazardous wastes. New water
quality restrictions and regulations are taking effect through federal and state mandate. As part
of changes to the Clean Water Act and Wisconsin Administrative Codes NR 216.07 and NR 151,
the UWGB campus must meet stormwater runoff permitting requirements as a Municipal
Separate Storm Sewer System (MS4). These codes focus on stormwater especially because in
the past, municipalities built stormwater systems with the specific objective of removing
stormwater runoff as quickly as possible. Only within the last ten years has it become apparent
that stormwater runoff picks up many pollutants and sediment that is then carried directly into
“waters of the state.” In the case of the University, stormwater runoff adds total suspended
solids, phosphorus, nitrogen and other pollutants into the bay of Green Bay and into Mahon
Creek. The purpose of MS4 permitting is to help improve the water quality from this nonpoint
source pollution. Compliance of MS4 permitting requires the university to meet several criteria.
These stormwater permit criteria consist of the following:
A) Public education and outreach.
B) Public involvement and participation.
C) Illicit discharge detection and elimination.
D) Construction site pollution control.
E) Post-construction site storm water management.
F) Pollution Prevention.
G) Development and maintenance of a storm sewer system map.

Page 9
Graduate students began work on achieving some of these stormwater management guidelines.
Three key objectives for the public education team were:
1) Assist the UWGB campus in achieving MS4 compliance.
2) Achieve measurable results that comply with general permitting requirements.
3) Achieve funding to cover expenses of campus sustainability projects that meet the
pollution prevention criteria of MS4 compliance.
Toward that end, Team 1 (Public Education, Outreach, Participation and Involvement) began
taking several steps to achieve public education and outreach and implement public involvement
and participation activities on stormwater issues on the University of Wisconsin - Green Bay
campus.
Methods
As previously listed, the MS4 regulations include a stipulation that the institution should
engage in education and outreach on stormwater issues. Our team took a multi-pronged
approach to this goal. Although the results have sometimes been mixed, public education
campaigns have resulted in measurable improvements in stormwater quality in residential areas
(Dietz et. al., 2004). We chose to target students both inside and outside the classroom with in-
class presentations and information tabling which have been shown to be some of the most
effective methods at reaching students (Silverman, 2007). For education inside the classroom,
we identified mandatory general education courses offered in the fall semester of 2008 at the
University of Wisconsin-Green Bay. In order to cover the maximum number of students in a
minimum amount of time, we targeted those courses with the highest student enrollments,

Page 10
between 115 to 250 students. Twenty letters of request for donation of class time (3-5 minutes)
were emailed to professors (Figure 1). Thirteen professors responded, and 14 classes were
visited. Graduate students gave power point presentations that gave students a basic background
on stormwater issues and addressed simple actions students could take to prevent and control
water pollution (Figure 2). The length of the presentation and the amount of material provided
was restricted in order to respect the professor's limited class time. It is difficult to assess the
exact number of students that were present for the presentations since many professors do not
take enrollment on a daily basis and, for various reasons, students may not attend the class on the
day of the presentation. For the class presentations, we have estimated presenting to between
1200 to 1780 students, if one uses 70% attendance and 100 % attendance for classes that varied
in enrollment numbers.
Dear Professor:
As part of the 2008 graduate capstone course Seminar in Environmental Sciences and Policy, second-
year graduate students have been working with campus staff and faculty in order to help the UWGB
campus meet required guidelines as a Municipal Separate Storm Sewer System (MS4). Compliance of
these guidelines requires the university to conduct public education and outreach on stormwater
issues. As part of other steps the students are taking to assist the campus in meeting these guidelines,
we are also seeking permission from selected professors for a donation of classroom time. We would
like to come in during your class and spend 3-5 minutes talking to students on stormwater issues. We
realize the inconvenience this may cause, but please consider this interruption not as part of a class
project only, but also as a conscientious effort benefiting the campus through environmental education
and meeting state requirements.
Attached please find our public education stormwater power point. This short power point covers
some of the main stormwater topics that we would want to discuss. We will be following up soon with
a phone call to set up dates and times. Please consider donating class time for this effort.
Figure 1 - Letter to Professors

Page 11
Figure 2 - Slides from Presentations

Page 12
In addition to directly addressing classes, an outreach event was organized for public
participation and involvement. Press releases and email notices inviting students to the
stormwater event and asking for participation were sent out during the previous week (Figures 3
and 4). The event included two different activities organized for the same date. First, a special
public appearance was made by "Ronnie Raindrop" a mascot to the stormwater group. The
mascot idea was developed to create the public's association of rain and stormwater. Used
several times throughout presentations, educational material, background photos in flyers and
posters, as well as a public appearance of Ronnie, we believe the mascot helped to create a tie-in
of stormwater to rain (see Figure 5). The mascot also increased public attention and initiated
stormwater inquiries and discussions. Additionally during the outreach event, an information
booth and poster were set up in a central location during high student activity. Informational
brochures were distributed by Ronnie Raindrop and other graduate students. Approximately 250
stormwater brochures were distributed to the UWGB public (Figure 6). Capstone students also
spoke with students, staff, and faculty about stormwater issues, answering questions and offering
additional stormwater information.

Page 13
Figure 3 - Press Release
Figure 4 - Email to Graduate ES&P Students and PEAC members
For Immediate Release
November 5, 2008
The University of Wisconsin-Green Bay - Beginning Monday, November 10, 2008, The University of
Wisconsin-Green Bay will be holding a Storm Water Event Week on the University campus
sponsored by the Environmental Science and Policy second-year graduate students in collaboration
with Public and Environmental Affairs Council. Events will include –
Storm Water drain stenciling – Graduate and undergraduate students will be spray-painting
storm sewer drains on the University campus with the message “Dump No Waste – Drains
to Bay” or “Dump No Waste – Drains to Stream” since the campus storm water drains
directly into these water sources.
Special public events include student engagement by the “Storm Water Raindrop” on
Monday at the Student Union between 11:30 and 1:00. “Raindrop” will be passing out
informational literature on storm water and graduate students will be on hand to answer
questions and discuss storm water issues and concerns.
Graduate students will also be addressing undergraduate students during regular class time
in order to increase awareness of new and stricter water quality guidelines.
The University of Wisconsin-Green Bay is now required to meet new water quality restrictions as a
Municipal Separate Storm Sewer System (MS4) as mandated by Wisconsin Statutes 283.37, and
Wisconsin Admin Codes NR 151 and NR 216.
ALL HANDS ON DECK – here is a request for all Capstone and Perspectives students to come
and support our own efforts on campus.
WE NEED PEOPLE TO HELP WALK AROUND TO THE STORM SEWER DRAINS ON CAMPUS AND
PAINT THE DRAINS WITH THE “DUMP NO WASTE” STENCILS! THIS MEANS YOU OF COURSE! It
will be a great opportunity to get something done for the campus and the community. So if you
are available, please send an email and tell us what time you are available to help get this job
done. Let’s say Monday (only) between the hours of 10 a.m. and 4 p.m. since it gets dark early
now, and one of our own told me that 6 a.m. isn’t even on their clock.

Page 14
Figure 5 - Ronnie Raindrop Mascot (in various appearances)

Page 15
Storm drain stenciling, a complimentary stormwater activity, was planned and organized
for the same day as the Ronnie Raindrop appearance and the stormwater tabling event. Storm
drain stenciling was an activity arranged and conducted in collaboration with the UWGB student
organization Public and Environmental Affairs Council (PEAC). PEAC had been working on
the details of stenciling the storm drain when student members, who were also capstone students,
decided to work on the project in cooperation, meeting environmental objectives from both
PEAC and capstone. PEAC covered the costs of printing colored stormwater handouts that were
prepared for the special event. Several students responded to the public announcements and
emails and volunteered their time. Approximately 120 UWGB storm drains were stenciled with
the phrase "Dump No Waste, Drains to Bay." In applicable cases, stenciling stated "River" or
"Stream" depending on the water resource. Some professors gave extra credit to students
participating in the stenciling event and this increased participation and awareness.

Page 16
Some funding opportunities were researched to assist covering the expenses of campus

Page 17
environmental projects as well. Specifically, funding was sought for the Instructional Services

Page 18
Green Roof project which was being researched by other team members within the stormwater

Page 19
group. A formal request was made to the Student Government Association (SGA) meeting using

Page 20
a short explanatory presentation covering the details of the design and layout aspects of the IS

Page 21
green
roofing and followed by a short question and answer period. We expect SGA to take a vote on
funding the project in January when they resume after winter break.

Page 22
Figure 6 - Stormwater Education Handout (Front & Back)

Page 23
Discussion
In 1976, the United Nations created a goal statement for environmental education.
Environmental education’s purpose is to create a world population who is aware and concerned
about environmental problems; global citizens who have knowledge, skills, attitudes,
motivations, and commitment to work towards solving existing environmental problems while
preventing new ones. In 1978 during the world’s first intergovernmental conference on
environmental education the following objectives were created:
To foster clear awareness of and concern about economic, social,
political, and ecological interdependence in urban and rural areas;
To provide every person with opportunities to acquire the knowledge,
values, attitudes, commitment, and skills needed to protect and
improve the environment;
To create new patterns of behavior of individuals, groups, and society
as a whole towards the environment (North American Association for
Environmental Education, 2000).
These ideas have been the founding guidance of environmental education programs
occurring globally. Environmental education is often about social actions and learning to make a
difference (i.e. choosing to buy sustainable, local produce because it benefits a community on
multiple levels rather than simply returning immature fish to the lake when caught because it is
against the law to keep them). Understanding the rationale for environmental choices and
behavior are critical to the education process in environmental education. An example of the

Page 24
strength of this type of learning is made clear in "Exploring the Environment and Issues of Social
Concern." This article explains how children teach adults, their parents, about sustainability
practices (Griffin-Wiesner & Maser, 2008). Griffin-Wiesner and Maser observe that children
learn new concepts such as stormwater and how they can help prevent stormwater pollution.
These same children then return home and tell their friends and family about their new
discovery. This creates awareness and produces potential change in the behavior of others.
Creating change in the behavior of individuals is the imperative in environmental education; so
too it is the critical point in teaching students about stormwater at a higher education facility.
In talking to students during the stenciling and stormwater events, we found that most
students did not know what stormwater was and did not know they could play a part in
protecting the water quality of stormwater. One important point was that most students did not
understand the differences between stormwater and sewage water. Many students do not
understand that stormwater flows directly into water resources; once it disappears down the
storm drain, it effectively disappears from thought as well. Also, we found that there was a wide
range of interest levels in water quality issues. Some students simply did not care about water
quality or stormwater. We did find that many students were interested in water issues for
environmental reasons.
It was surprising to learn how often educated adults did not know what stormwater was,
did not understand the importance, and did not know the impact their actions at home had on
water quality. Continued stormwater and water quality education would certainly have a positive
effect on facilitating change in individual actions and behaviors toward water management. One
cannot change behaviors if there is no understanding of the need to change.

Page 25
Additionally, we found that most professors were open to having graduate students come
into their classes for short presentations. An explanatory letter was necessary for some
professors to understand that presenters were assisting the university in attaining mandatory
public education rather than that students were only looking to attain individual class credits.
Comments from professors and lecturers were always positive. Many were surprised at how
well the topic fit into the subject matter of health, economics, and business. More than one
professor thought presenting during each new semester course would be a positive action.
Class presentations were almost always positively received by the students. Keeping the
discussion short and to the point seemed critical in maintaining students’ attention and interest.
While we did not have the benefit of additional time for questions and answers, comments by
professors and lecturers indicated that students appreciated the presentation and seemed to
benefit from it. We suggest that these presentations continue each semester and an additional
two or three minutes for more in-depth coverage be sought from the lecturing professor, if at all
possible.
Recommendations
Through the efforts and accomplishments of this year's capstone group, the Public
Education team would like to offer several recommendations related to education, outreach, and
funding.
Continue class presentations. We consider it important that classroom education efforts are
continued on an annual basis. This effort will inform and educate students and will help to
change behaviors that may cause stormwater pollution. Not only is there evidence that this

Page 26
approach has an impact (Dietz et al., 2004) but there are some unique advantages to
continuing this effort in a university environment.
o First, because of the inherent turnover in a university, continuing education efforts
are not only required to achieve and maintain a high level of awareness, but also
to provide a continuous stream of educated individuals into the community.
o Second, it is an indirect method of incorporating sustainability education into
Eco-U's "green" objectives.
o Third, it will assist the UWGB campus in attaining MS4 permit requirements.
Survey student body. As a way to refine and target the information provided in classrooms
and at information tables, we suggest surveying the student population to determine the
current level of knowledge and understanding of stormwater and water quality issues. This
survey would also create a baseline of student knowledge and allow future public education
and outreach efforts to be more effectively defined and tailored to fit the level of
understanding and the general perspective of the student.
Conduct annual stormwater public events. Maintenance and renewal of storm drain
stenciling must continue yet consistent budget cuts leave limited funds available to
accomplish this goal. An annual event contributes to overall stormwater awareness as well
as providing a means of accomplishing storm drain maintenance and stenciling efforts by
Eco-U.

Page 27
Incorporate sustainability into a project based course. The incorporation of sustainability
into other project based courses could offer significant advantages to campus sustainability.
Project based classes provide practical learning opportunities and a chance to expand
UWGB's green mission. Depending on the purpose of the class, project based coursework
can provide students with concrete insights into specific processes, introduce new material
through discovery learning, or the chance to integrate the concepts of a subject while learning
to implement those concepts (Helle et al., 2006). In a time where students have greater
access to raw information than ever before, project based learning provides opportunities for
using information in useful ways and teaching critical problem-solving skills that will make
our graduates better prepared.
The capstone class, for example, has been designed to encourage active integration
and implementation of knowledge. As an example, part of the capstone project this year has
focused on designing modifications to the green roof over the IS building. Included in this
project was significant research on stormwater issues, mitigation strategies, green roof
designs, mapping, and specific site characteristics, among many other related research
avenues. Because of this project based course, capstone students will gain hands-on
experience while the university will benefit from a green roof that works more efficiently,
provides more aesthetically-pleasing and useful open green space and also demonstrates
green roof technology for the community. This type of project based learning could be
useful both at the graduate and undergraduate level and would benefit both the students and
the university. This would also provide the UW Green Bay Sustainability Committee with a
constant stream of ideas for improvements and a method for them to carry out projects.

Page 28
Incorporate sustainability as a general education requirement. As sustainability becomes an
imperative, UWGB administration should consider offering sustainability courses as part of
the general education requirement. More and more, sustainability is becoming very much a
part of our daily lives through business, economics, education, health, and global awareness.
The understanding of human impact and the mitigation of that impact on our limited natural
resources should be a required learning objective within general education, especially when
attending "Eco-U."
Continue acquirement of outside funding specifically for sustainability and water quality
issues. It is recommended that the UWGB campus seek outside funding specifically for
sustainable projects on campus. Due to state budget restrictions, this additional stream of
funding could enable more ambitious and long-term projects, and would allow students and
staff the freedom to implement projects and programs that may be otherwise restricted by
state administrative regulations and policies. Allocation of state funding is necessary to
cover mandatory stormwater expenses as an MS4 yet we found that there was little flexibility
in funding to accomplish these goals; alternative funding methods must be developed.
Additionally, because students have a wealth of imagination, energy, and ability to
think "outside the box" it is suggested that students have the opportunity, through project
classes, to pursue creative funding opportunities. Project classes that are focused on grants
and funding for sustainability projects would not only give students hands-on experience in
researching, preparing, and writing grant proposals but also present opportunities for the
campus to be an environmental leader. As a higher education facility that offers
undergraduate and graduate degrees in environmental sciences and as a campus that is the

Page 29
only environmental campus in the northeast Wisconsin area, UWGB should aggressively
seek opportunities to implement and highlight its environmental curriculum.
Conclusion
The capstone class of 2008 is proud to be a part of Eco-U. We acknowledge the
limitations of state funding for environmentally progressive projects and programs, and we
understand the difficulties of achieving and maintaining environmental leadership, yet as part of
a higher education facility it is our deep conviction that UWGB should strive to attain certain
goals as part of retaining the Eco-U moniker. Since we are discussing sustainability, we would
like to take this opportunity to remind the administration that students represent unlimited
sources of energy, imagination, creativity, and determination. A certain type of renewal resource
that is still relatively untapped, so to speak. Past capstone classes have developed incredible
ideas, concepts, and recommendations. And while capstone students continue on into the future,
we hope that Eco-U's administration and faculty will carry UWGB into the future as well and
implement some of these ideas and concepts and not just leave them to the archives.

Page 30
References
Dietz, M. E., Clausen, J. C., & Filchak, K. K. (2004). Education and Changes in Residential
Nonpoint Source Pollution. Environmental Management. 34(5) 684-690.
Environmental Education versus Environmental Activism from North Arizona University.
Retrieved on December 15, 2008 from http://www4.nau.edu/eeop/ureo/eevact.htm
Griffin-Wiesner, J. and Maser, C. 2008. Exploring the Environment and Issues of Social
Concern [Excerpted from Teaching Kids to Change the World: Lessons to Inspire Social
Responsibility]. Curriculum Review v. 47 no. 6. p. 7-9.
Helle, L., Tynjala, P., & Olkinuora, E. (2006). Project-based learning in post-secondary
education - theory, practice and rubber sling shots. Higher Education, 51, 287-314. doi:
10.1007/s10734-004-6386-5.
Luzar, E. J. & Cosse, K. J. (1998). Willingness to pay or intention to pay: The attitude-behavior
relationship in contingent valuation. Journal of Socio-Economics, 27, 3, 427-444.
North American Association for Environmental Education. (2000). Environmental Education
Materials: Guidelines for Excellence. Retrieved December 15, 2008 at
http://www.csu.edu/cerc/documents/EnvironmentalEducationMaterials.pdf.
Silverman, D. A. (2007). Organ Donation Awareness Campaigns in the PR Campaigns Course.
Journalism and Mass Communication Educator, 61(4) 411-428.
Wisconsin Department of Natural Resources. (2004). Chapter NR 151: Runoff Management.
Retrieved December 15, 2008, from http://www.legis.state.wi.us/rsb/code/nr/nr151.pdf.
Wisconsin Department of Natural Resources (2004). Chapter NR 216: Stormwater Discharge
Permits. Retrieved December 15, 2008, from
http://www.legis.state.wi.us/rsb/code/nr/nr216.pdf.

Page 31
Appendix A
Submission of Request for Funding to Student Government Association
Storm Water at the University of Wisconsin Green Bay
WHEREAS the University of Wisconsin, Green Bay needs to meet its MS4 permit requirement
from the Department of Natural Resources (DNR), as well as, Governor Doyle’s campus
sustainability challenge, and
WHEREAS education of the campus community is an integral part of meeting these MS4 permit
requirements, and
WHEREAS the Environmental Science, Policy & Planning Graduate Capstone class hopes to
provide an ongoing educational and storm water management opportunity to the UWGB campus
by installing a green roof over part of the Instructional Services building, thereby facilitating
UWGB’s ability to remain in compliance with the DNR’s MS4 permit, and
WHEREAS the Graduate Capstone class believes that providing financial assistance to the
UWGB Facilities Management team will allow the green roof project to proceed in the spring of
2009, despite budgetary constraints, thereby meeting DNR MS4 requirements for education, as
well as helping UWGB move towards meeting Governor Doyle’s environmental sustainability
challenge for our campus.
THEREFORE BE IT RESOLVED that SGA will request from SUFAC five thousand dollars to
be allocated towards the creation of a green roof and educational sign.
THEREFORE BE IT RESOLVED the UWGB student senate will receive quarterly updates from
the UWGB Facilities Management team in order to make sure the fees are being allocated
according to the original intent of the project.
Author: UWGB Graduate Capstone Storm Water Group
Sponsor: Molly Collard and Shea Sternhagen

Page 32
Chapter 2
Instructional Services Green Roof Project
Alice Billings

Page 33
Abstract
Greenroofs have been used throughout human existence. Greenroofs reverse the effects
of human development by restoring the pervious footprint of a building. This allows the building
to exist for the benefit of society at the same time that it restores the ecosystem for the benefit of
the larger environment. Greenroofs remediate stormwater runoff problems and reduce a
building's carbon footprint. We currently have an opportunity to bring the benefits of greenroof
technology to the UWGB campus. We are planning to create a greenroof over the IS building
which is low maintenance but which is also accessible to the public. The recommended plot is a
very suitable site for the installation of the amended current greenroof best management
practices (BMP). This will be beneficial as the improved site will be very attractive with less
work than is currently required.

Page 34
Introduction
Greenroofs have been used throughout human existence. Norwegians long ago covered
their homes with sod for insulation and planted them with grasses to make them more stable.
During the middle ages, roof gardens were an important feature in wealthy homes, and one of the
wonders of the ancient world was the hanging gardens of Babylon. By recalling the rich history
of greenroof use for human habitation, and by pointing to the environmental benefits gained by
employing this sustainable building technology, it is hoped that this trend will gain momentum in
both urban and rural settings in the United States (Getter 2006).
In the industrial world, modern building practices have introduced significant amounts of
impervious surface area into our ecological landscape. In the United States, it is estimated that
10% of residential developments and 71% to 95% of industrial areas and shopping centers are
covered with impervious surfaces (Ferguson 1998). Before human development began
disturbing natural habitats, soil and vegetation constituted part of a balanced ecosystem that
managed precipitation effectively (Getter 2006). Greenroofs reverse the effects of human
development by restoring the pervious footprint of a building. This allows the building to exist
for the benefit of society at the same time that it restores the ecosystem for the benefit of the
larger environment. Several aspects of greenroof design create this balance. One of the most
important aspects is the drainage and water storage layer.
A standard roof surface replaces a natural habitat's pervious footprint with a man made
impervious one, resulting in an increased volume and rate of stormwater runoff. In rural settings
this can lead to swiftly flowing rivulets or streams which are more likely to create erosion events
in their stream banks. In urban settings, an increased stormwater flow rate can overwhelm local

Page 35
sewer systems, causing them to overflow and spill untreated sewage into human habitats. In
New York City, about half of all rainfall events result in a combined sewage overflow event
(CSO). These CSO events dump 40 billion gallons of untreated wastewater into New York’s
surface waters annually (Cheney 2003). Whether the stormwater runoff is occurring in urban or
rural settings, it is collecting pollutants from the impervious surfaces it contacts and, regardless
of any other damage caused, it is carrying those pollutants untreated into our sources of potable
water.
One way in which greenroofs remediate stormwater runoff problems is by reducing the
volume of the runoff. Stormwater is soaked up by the soil and the plants, and if there is more
water than these can hold, it is held temporarily in the water storage layer. Kolb reported that
45% of all rainfall which hits greenroofs is recycled through evaporation and transpiration. This
means that the amount of stormwater from rainfall events which reaches the ground off of a
greenroof is reduced in volume by approximately half compared to the amount which reaches the
ground off of an impervious standard roof (Kolb 2004). Another way in which greenroofs
address the stormwater runoff problem is by delaying the runoff. The water must flow through
the soil barrier before it can get to the storage layer, and this process reduces the flow rate
compared to the runoff rate from an impervious roof (Kolb 2004). By slowing the stormwater
flow rate, we can greatly reduce the amount of stream bank erosion and the number of sewer
overflow events.
Another way in which greenroofs remediate problems from modern building practices is
by reducing a building's carbon footprint. This happens through extending the life of the existing
roof by reducing its UV exposure. Ultra violet rays are one of the main sources of roof
deterioration. Sometimes the life of the roof can be doubled compared to what it would be

Page 36
without greenroof remediation. Replacing a roof less often means a reduction in the amount of
materials and man hours required to maintain a roof, and this equates to a lower carbon footprint.
Lowering a building's carbon footprint also happens through deflecting the sun's light, and
through plant transpiration. Greenroofs provide an opportunity for sunlight to be absorbed by
plants instead of hitting and warming the building. Greenroofs also allow stormwater to be
stored in the greenroof soil. The absorbed light causes the plants to transpire the stored water
which cools the building resulting in reduced energy consumption and also in a reduced carbon
footprint for that building. Greenroof components such as planting media, shade from plants and
transpiration can reduce solar gain for a building by 90% compared to buildings without
greenroofs (Cheney 2003).
Habitat loss for wildlife is also remediated by greenroofs. As is the case with stormwater,
a standard roof surface replaces a building’s living footprint with a nonliving one. When a
greenroof is installed, that living footprint is restored (Getter 2006). While larger animals will
probably not migrate to a green rooftop, many birds, insects, spiders, butterflies and squirrels are
happier up there as the rooftop habitat is often more secluded from human contact than ground
level habitat is. Keeping these aspects of the ecosystem strong goes a long way toward keeping
the resources we depend upon secure.
We currently have an opportunity to bring the benefits of greenroof technology to the
UWGB campus. The Instructional Services (IS) building has a rooftop sitting at ground level
and planted with grass. This roof is not designed to current best management practices and is
planted with turf grass which is not thriving in this location. Campus facilities management
director Chris Hatfield would like to retrofit best management practices into this location and
replace the dead grass with plants which will thrive there. To facilitate the retrofitting of best
Page 37
management practices, a preliminary test plot has been designated, and all of the planned work
will occur there. When the retrofit of BMP's has proved successful, then as State budgets allow,
greenroof technology will be expanded to the rest of the UWGB campus. Modern green roofs
are categorized as either intensive or extensive. Intensive green roofs require intensive
maintenance similar to ground level landscaping. Extensive green roofs require more minimal
maintenance and are typically not accessible to the public. We are planning to create a
combination of these two ideas in an extensive greenroof which is accessible to the public.
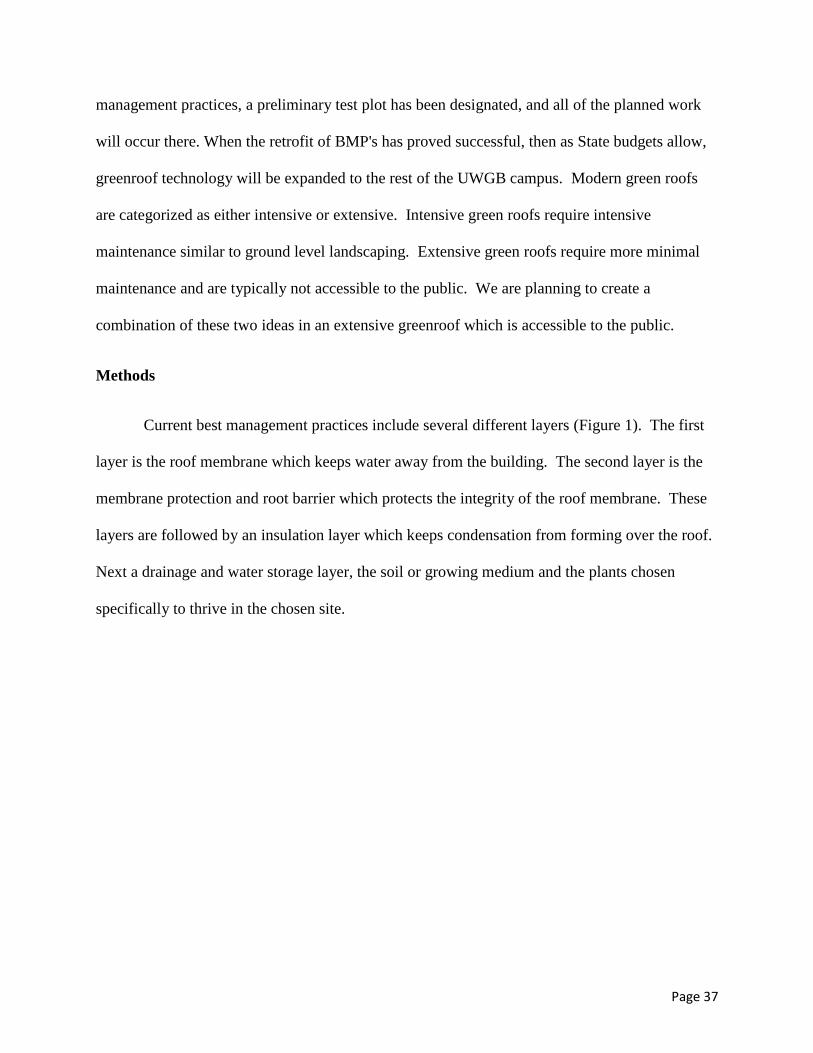
Methods
Current best management practices include several different layers (Figure 1). The first
layer is the roof membrane which keeps water away from the building. The second layer is the
membrane protection and root barrier which protects the integrity of the roof membrane. These
layers are followed by an insulation layer which keeps condensation from forming over the roof.
Next a drainage and water storage layer, the soil or growing medium and the plants chosen
specifically to thrive in the chosen site.

Page 38
Figure 1. Current Best management practices model (www.greenroofs.com)
Here we see the designated test plot location. The line of dead grass is obvious and marks
the location of the IS roofline.
Figure 2. Picture of test plot site.

Page 39
A UWGB alumnus, Neil Diboll, owns Prairie Nursery which has established many
greenroofs in Wisconsin. He has recommended we draw appropriate plant species from the sand
prairie plant list and refine the plant choice when soil samples are completed.
Diboll Prairie Nursery figure
Wildflowers:
Butterflyweed, Sky Blue Aster, Smooth Aster, Frost Aster, White Aster, Canada Milk Vetch, Lanceleaf
Coreopsis, Purple Prairie Clover, Pale Purple Coneflower, Showy Sunflower, Downy Sunflower, Rough
Blazingstar, Lupine, Dotted Mint, Beardtongue, Black Eyed Susan, Stiff Goldenrod, Showy Goldenrod,
Ohio Spiderwort, Hoary Vervain
Grasses:
Sideoats Grama, Little Bluestem, Prairie Dropseed
Soil samples tests such as ribboning for clay content, sedimentation, pH and mineral
analysis will be performed, with the help of Dr. Fermanich, on ten 2 inch soil cores from the test
plot site to determine soil characteristics and continuity of characteristics across the whole site.
These results will be used to finalize plant choices.
Community involvement will be an important factor in the success of this greenroof.
Professors, alumni, graduate and undergraduate students and community members are taking
part in making this project happen. This is an unexpected bonus, and a good sign for the
greenroof's success, however it is also an important part of UWGB's efforts to meet its MS4
stormwater permitting goals.
Because of the current budget difficulties facing the State of Wisconsin, alternative
funding for this greenroof has been sought. A presentation has been made to the UWGB SGA,
and at the beginning of the spring 2009 semester the project will be proposed to SUFAC for
funding through their Naturewise program. Other sources of funding are also being investigated.

Page 40
Funding for the greenroof has been requested from the SGA. Here is an itemized list of expected
expenses.
1. Removal of existing dead grass and preparation of the site = $ 0.00
2. Addition of soil to the prepared surface
127 cubic yards of soil at a cost of $12.00 per cubic yard = $ 1,500.00
3. Addition of mulch to the soil surface =$ 0.00
4. Addition of plants to the site
Cost of seed, potting soil, containers = $ 500.00
Cost of purchased mature plants = $1500.00
5. Addition of a stone border at the west facing edge of the plot = $1,000.00
6. Addition of a sign = $500.00
Total = $ 5000.00

Page 41
Results
Current best management practices will have to be modified in order to improve the IS
greenroof performance while accommodating existing conditions. The siting of the IS greenroof
test plot and the state of current conditions in that area were determined with the help of Chris
Hatfield of Facilities Management. The existing roof membrane has been determined to be in
good condition during recent construction in another area. The planned modifications will not
disturb this membrane for fear of tearing it, therefore the protection layer and the insulation layer
will not be installed. The IS greenroof at its western edge slopes down toward the Bay of Green
Bay, and this slope functions as a natural drainage for the site. Because of this natural benefit, it
is difficult to justify the expense of adding the drainage and storage layer, and it will be left out.
The current plan calls for removal of the dead grass, addition of soil to total nine inches, the
addition of mulch for weed control and moisture retention, and the addition of appropriate plants.
Soil tests will be used to determine the best plants for the proposed site. Clay content,
pH, mineral content and continuity of consistency of the soil will be examined. Based on the
performance of the existing grass, the expectation is that the best approximation of site
conditions is described as sand prairie. The appropriate choice of plants for this site and the
retrofitting of current BMP's will create a site which has a lower carbon footprint as it will
require no watering, pre-emergent weed treatments, fertilizer or mowing and only minimal
maintenance.
Community involvement has been an unexpected bonus of this project. Former UWGB
alum, Neil Diboll, who owns Prairie Nursery in Westfield Wisconsin, has offered to assist us in
choosing the best possible plant species to thrive in our site conditions. Dr. Dornbush has

Page 42
offered to have students assist in growing the greenroof plants in the Lab Sciences greenhouse.
Dr. Fermanich has offered to have a community planting of the site included in the scheduled
2009 UWGB Earth Day events. Elements of the plant growing process will coincide with
research which another graduate student is doing and so our work will benefit other research
projects on campus. There is even a local Eagle Scout who will earn one of his final merit
badges by building the information sign for us. All educational efforts surrounding this
greenroof will count for the educational component of UWGB's MS4 stormwater permitting
requirements which will aid Jill Fermanich in her work here on campus. Student involvement
has also been requested through Student Government funding which will involve the UWGB
student body in this project. Other sources of community funding and involvement are being
explored.
Discussion and Conclusion
Facilities management would very much like to replace the existing grass and trees with a
more sustainable option; however, doing this over the whole of the existing IS plaza presents
some formidable problems. First, the height of the curbs surrounding the planting beds might
have to be raised in order to accommodate the appropriate depth of soil. They would certainly
have to be rebuilt in order to allow for adequate drainage from the planters. Also, full sized,
beautiful trees would have to be removed in order for the new plantings to be installed. This
would raise legitimate objections and would be difficult to justify when the proposed BMP’s are
untested for retrofitting in this location. Removing large trees is also not a recommended step in
maintaining carbon neutrality. In order to move forward with implementing successful new
green roof technology unhampered by the previously mentioned difficulties, a test plot was
recommended.
Page 43
There is a rectangle of land over the west part of the IS roof which is an ideal place to
create a green roof test plot. Current best management practices will be adapted to this site’s
specific conditions. Because it is preferable not to disturb the existing well functioning roof
membrane, excavation for grass removal will be done to as shallow a depth as possible. Also,
because the natural grade of the land allows stormwater to run off to the west down a gentle
grass covered slope, it is difficult to justify the expense of the drainage/water storage layer. This
layer will therefore not be retrofitted to this site. The test plot retrofitting will include removal of
dead grass, addition of soil, addition of mulch and addition of drought tolerant, shallow rooting,
low growing, low flammability plants.
In conclusion, the recommended plot is a very suitable site for the installation of the
amended current best management practices. Current best management practices can easily be
amended to fit the existing site without compromising the existing membrane performance. This
will be beneficial for Facilities Management as the improved site will be very attractive with less
work than is currently required. The successful implementation of current BMP’s in this site will
be a useful springboard for more adaptive greenroof retrofitting at other locations on the UWGB
campus.
Recommendations
Our recommendations are to implement the modified best management practices in the
Spring of 2009, using the recommended plant species suggested by Mr. Diboll and purchased
through SGA Naturewise funding.
To prepare for a spring 2009 installation of the proposed greenroof, the following steps
should be undertaken:

Page 44
1. Soil cores taken in January 2009 to determine soil type, and consistency of that type
within the overall site.
2. From the soil test results, plan which plant species to use, create a specific plan and
present this plan for the approval of Chris Hatfield and all of Facilities Management staff.
3. When approval is granted, planting seeds in the Lab Sciences greenhouse before classes
resume in January 2009 in preparation for planting on Earth Day in April, 2009.
4. When the snow melts and before planting day apply soil and mulch to the site, arrange
final preparation of the paths and stone borders.

Page 45
References
Cheney, C. and C. Rosenzweig. 2003. Green roofs and environmental restoration: Towards an
ecological infrastructure for New York City. p. 63-74. In Proc. of 1st North American
Green
Roof Conference: Greening Rooftops for Sustainable Communities, Chicago. 29-30 May 2003.
The Cardinal Group, Toronto.
Cibula, N., 2008, Personal Communication
Cibulka, D., 2008, UWGB ENVS&P Graduate Student
Diboll, N., 2008, Sand Prairie Plant List, Prairie Nursery.
Dornbush, M., 2008, Personal Communication
Ecogeek- Clean Technologies, 2008, Available at: www.ecogeek.org
Environmental Protection Agency, 2008, Available at: www.epa.gov
Ferguson, B.K. 1998. Introduction to stormwater management: Concept, purpose, design. Wiley,
New York.
Fermanich, K., 2008, Personal Communication
Hahn, P., UWGB, ENVS&P Graduate Student, GIS, 2008
Hatfield, C., 2008, Personal Communication
Kristin L. Getter and D. Bradley Rowe, 2006, The Role of Extensive Green Roofs in Sustainable
Development, American Society for Horticultural Science, vol. 41, p.1276–1285.
Kolb, W. 2004. Good reasons for roof planting – green roofs and rainwater. Acta Hort.
643:295-300.
Monterusso, M. A., Rowe, D. B., Rugh, C. L., 2005, Establishment and Persistence of Sedum

Page 46
spp. and Native Taxa for Green Roof Applications, Amercian Society for Horticulture
Science, vol. 40, p. 391-396.
Nicholaus D. VanWoert, D. Bradley Rowe, Jeffrey A. Andresen, Clayton L. Rugh, R. Thomas
Fernandez and Lan Xiao,2005, Green Roof Stormwater Retention Effects of Roof
Surface, Slope, and Media Depth, Journal of Environmental Quality, vol. 34, p.1036-
1044.
Nyuk Hien Wong, Yu Chena, Chui Leng Ongb and Angelia Siab, 2003, Investigation of Thermal
Benefits of Rooftop Garden in the Tropical Environment, Building and Environment,
vol .38, issue 2.
The Resource Portal for Green Roofs, 2008, www.greenroofs.com

Page 47
Appendix A
Flowers Plant Rooting Flower Bloom
Species Common Name Height Depth Color Time Notes
Allium cernuum Nodding Pink Onion 1 - 2' 1 - 2' White July-Aug Self sows
Allium stellatum Prairie Onion 1 - 2' 1 - 2' Lavender July-Aug
Goes dormant in summer
Coreopsis lanceolata Lanceleaf Coreopsis 1 - 2' 1 - 2' Yellow June-July Self sows
Coreopsis palmata Stiff Coreopsis 2 - 3' 1 - 2' Yellow June-Aug Creeps by rhizomes
Dodecatheon meadia Shooting Star 1 - 2' 1' White May-June
Goes dormant in summer
Geum triflorum Prairie Smoke 6" 1' Pink May-June Slow growing
Helianthus occidentalis Western Sunflower 2 - 3' 1' Yellow July-Aug Creeps by rhizomes
Liatris aspera Rough Blazingstar 2 - 5' 2' + Pink Aug-Sept.
Liatris squarrosa Scaly Blazingstar 1 - 2' 2' + Pink Aug-Sept.
Penstemon digitalis Smooth Penstemon 2 - 3' 1 - 2' White June-July
Penstemon ovatus Broad Leaved Penstemon 1 - 3' 1' Blue
May-July
Phlox pilosa Downy Phlox 1 - 2' 1' Pink May-June Short lived (3-5 years)
Ruellia humilis Wild Petunia 1 - 2' 1 - 2' Violet June-Aug
Solidago rigida Stiff Goldenrod 3 - 5' 2' Yellow Aug-Sept. Self sows
Solidago speciosa Showy Goldenrod 1 - 3' 2' Yellow Aug-Sept.
Tradescantia bracteata Prairie Spiderwort 1 - 2' 1 - 2' Blue June-July Creeps by rhizomes
Tradescantis occidentalis Western Spiderwort 1' 1 - 2' Pink
June-July Creeps by rhizomes
Verbena stricta Hoary Vervain 2 - 4' 1 - 2' Blue July-Sept Short lived (3-5 years)
Grasses Plant Rooting Flower Bloom
Species Common Name Height Depth Color Time
Bouteloua curtipendula Side Oats Grama 2 - 3' 1 - 2' Straw Aug-Sept
Eragrostis spectabilis Purple Lovegrass 1 - 2' 1 - 2' Pink July-Sept
Festuca ovina Blue Fescue 1 - 2' 1 - 2' Straw June-July
Koeleria macrantha Junegrass 2 - 3' 1 - 2' Gold May-June

Page 48
Appendix B
Establishing a green Roof Neil Diboll
FIVE STEPS TO SUCCESSFUL PRAIRIEMEADOW ESTABLISHMENT
Prairie meadows are becoming an increasingly popular alternative to traditional high maintenance
landscapes.
the prairie creates a haven for the native plants and animals with which we share this beautiful planet.
Prairie meadows require no fertilizers or fungicides, and few if any herbicides.
With prairie seedlings, significant long term savings result due to greatly reduced maintenance
requirements. Any additional initial costs are usually recovered by the second year. Maintenance
savings continue to accrue in following years, yielding very low “life cycle” costs for prairie meadows.
Because native prairie flowers and grasses are almost exclusively perennials, they return to bloom year
after year. A properly installed and maintained prairie meadow is a self-sustaining plant community
that will provide landscape beauty for decades to come.
1) Site Selection Sunny, well-ventilated, with low weed densities 2) Plant Selection Match plants to the soil and growing conditions 3) Site Preparation Kill ALL the weeds before planting! 4) Planting Time & Method Spring vs. fall, no-till vs. broadcast, nurse crops 5) Post-Planting Management Mowing and burning
1. Site Selection
The area to be planted to prairie must be sunny, open, and well-ventilated. Prairie plants require at
least a half a day of full sun. Full sun is best, especially for wet soils or heavy clay soils. Good air
movement is also critical, as prairie plants are adapted to open sites that are not subject to stagnant air.
Poor air circulation in closed in areas can lead to fungal diseases, which are seldom a problem on sunny,
open sites. Beware of planting meadows in locations with adjacent weedy vegetation that cannot be
eliminated or controlled. Although an established prairie meadow is resistant to invasion by most
weeds, three to four years of growth is required for full development.
2. Plant Selection
Every plant is adapted to a certain set of growing conditions. Some will grow only on well-drained
sandy or gravelly soils, while others prefer heavy clay. Some require moist soils, while others demand
dry growing conditions. A few species can grow in almost any soil, be it dry sand, rich loam, or damp
clay.
it is essential to select plants that are adapted to the specific site conditions.

Page 49
it is very important to include a wide variety of different flowers and grasses to ensure year-round
interest in the prairie meadow.
3. Site Preparation
Sod removal on lawns with no weeds, using a sod-cutter is recommended for our site
Irrigating the planting in the spring and summer of the first year during germination can greatly improve
seedling development and survival, and is strongly recommended.
4. Planting Time and Method
Prairie seeds can be successfully planted during the following times:
Spring thaw through June 30
September 1 through soil freeze-up (“Dormant Seeding”) Planting in July and August is generally not recommended. Drought is common during this time, and
late-planted seeds often do not have sufficient time to develop strong root systems before the onset of
winter. If irrigation is available, planting can be extended until July 15.
The success of your planting is a direct function of the quality of the seed you plant.
We plan to plant seeds of specific species and grow them ourselves in the Lab Sciences green house to
be ready to plant at the end of April 2009.
5.Post-Planting Management
As we are making specific plantings and not broadcasting seed, we will not have the same problems
which a seeded prairie faces. We will have to make sure some water is given to the young plants in the
summer so they can build their root base, then we will have to prune back dead plant matter each
spring.
Results
For Full Sun to One Half Day Full Sun
Criteria for Green Roof Plants
1) Drought Tolerant 2) Shallow Rooting Zone (Note: Plants listed below with roots deeper than 6" can still thrive in green roof situations) 3) Low Growing 4) Low Flammability

Page 50
Chapter 3
Exploring the Use of
Low Impact Development Techniques at UWGB
Linda Filo
Julie Maas
Chandala Nagendrappa
Sarah Wingert

Page 51
ABSTRACT
We considered porous pavement for part of Wood Hall parking lot and bioretention cells
to treat stormwater from Wood Hall parking lot and Weidner Center parking lots. We selected
these locations because they are located within Basin 15, which the EarthTech report identified
as the largest basin with the least existing amount of stormwater control. We investigated porous
pavement and used the RECARGA model to evaluate different bioretention cell designs. We
selected porous concrete as the best porous pavement option. For Wood Hall, the best-
performing bioretention cell design consisted of a three inch ponding zone, two foot rooting
zone, and a two foot storage zone. The design for the Weidner Center was the same except for a
three foot storage zone. Recommendations regarding the use of these designs are outlined.
INTRODUCTION
In 2005, EarthTech performed a stormwater pollution analysis for UWGB that estimated
the annual sediment and phosphorus loadings for all storm sewer outfalls on campus (Bachhuber
and Hanson 2008). This report includes estimates of loading under baseline conditions and
existing conditions; the former assumes no best management practices are in place, while the
latter includes the influence of existing stormwater best management practices (BMPs). The
report found that UWGB’s current stormwater BMPs reduce the campus total suspended solids
(TSS) load by 42.4% (Bachhuber and Hanson 2008). This means UWGB is already in
compliance with the Wisconsin Department of Natural Resources’ MS4 General Permit, which
states that UWGB must reduce its TSS load by 20% before 2008 and 40% before 2013
(Rasmussen 2005). Despite this success, we discovered that some areas of campus still have
little to no stormwater control.

Page 52
UWGB currently employs three BMPs to control stormwater: impervious surface
disconnection, grass swales, and four wet detention ponds (Figure 3.1). Stormwater
disconnection refers to the technique of directing runoff from impervious surfaces, such as
parking lots, to adjacent pervious surfaces, such as wooded or grassy areas. This technique can
increase infiltration of precipitation and reduce stormwater volume. Depending on the size of
the pervious area, the runoff may then be funneled into the stormwater sewer system. Grass
Swales along roads and parking lots can reduce the pollutant load of stormwater, and allow for
some infiltration. They can be directed into the storm sewer or other forms of stormwater
treatment, such as wet detention ponds. Wet detention ponds collect and treat stormwater in a
constructed basin by allowing suspended solids to settle before the water is discharged into a
stream. Thus, wet detention ponds can reduce pollutant loads and stormwater peak volumes
during a rain event (Bachhuber and Hanson 2008). UWGB has four detention ponds on campus
(Figure 3.1).

Page 53
Figure 3.1: Existing Stormwater BMPs and Drainage Basins as
Identified by EarthTech (2008)
EarthTech identified 21 drainage basins within the UWGB
campus (Figure 3.1). The three stormwater BMPs are not equally
distributed within these basins. Basin 15, highlighted in blue on
Figure 3.2, is the largest sub-basin (76.5 acres), and is 34.7% impervious (Bachhuber and
Hanson 2008). The runoff from this basin eventually drains into a single storm sewer outfall that
empties directly into Green Bay. EarthTech found that only 0.1% of TSS and 0.3% of total
phosphorus (TP) loadings are controlled by existing management in this basin (Figure 3.3)
(Bachhuber and Hanson 2008). The only BMP employed in Basin 15 is impervious area
disconnection.

Page 54
Figure 3.2: Basin 15, highlighted in blue, is the largest sub-basin on
campus. Map adapted from EarthTech report (2008).
Table 3.1: Without stormwater control, Basin 15 discharges 9.36 tons per year of TSS and
55.91 pounds per year of phosphorus into Green Bay. Very little of this runoff is controlled
by existing BMPs in the basin.
pervious
pavement in
Wood Hall PL
TSS TP
Base Condition 9.38 tons/yr 55.91 lbs/yr
Existing Management 9.36 tons/yr 55.76 lbs/yr
Percent Control 0.10% 0.30%

Page 55
Project Objectives
We decided to investigate the use of two low-impact development techniques in Basin
15, since it is the largest basin with the least amount of stormwater management. The techniques
we examined are porous pavement and bioretention, both of which are not currently used on
campus. Low impact development techniques are relatively recent developments, but research
has revealed promising results for stormwater management (Dietz 2007). Though Basin 15 does
not have a wet detention pond, we did not consider this alternative due to input from the campus
Facilities Management Department, which was not interested in developing another detention
pond on campus at the time this project was conceptualized. A goal of our larger stormwater
project was to investigate stormwater control techniques that have a possibility of being used in
the future, in Basin 15 or elsewhere on UWGB’s campus. Thus, the objectives of the design
aspect of this project were to:
1. explore the feasibility of porous pavement and bioretention for use at UWGB;
2. identify possible locations in Basin 15 where these practices could be installed; and
3. tailor the design of the chosen techniques to control stormwater runoff in Basin 15, so
they can be further analyzed using Source Loading and Management Model
(see Chapter 4)
Low-Impact Development
The concept of low-impact development (LID) was developed in Prince George’s
County, Maryland, in the early 1990s (EPA 2000). LID is a micro-scale approach that reduces
surface water impacts associated with runoff from impervious surfaces by maintaining the pre-
development hydrology of a site (Dietz 2007). LID techniques aim to increase infiltration,

Page 56
groundwater recharge, and water storage, and reduce runoff volumes by keeping precipitation
on-site (EPA 2000). This decreases the amount of stormwater that enters unimpeded into rivers
and lakes through storm drains. Since they are designed to control stormwater at the source, LID
techniques differ from conventional stormwater management practices, which tend to utilize
large facilities at the base of a drainage basin (EPA 2000). A well-planned site could have
several LID practices operating at once. This may completely eliminate the need for a large-
scale traditional stormwater management practice, like a wet detention pond.
There are many LID practices. Examples include vegetated roofs, grass swales, cluster
development, minimized pavement widths, open space conservation, preservation of existing site
conditions, infiltration trenches, disconnected downspouts and sewers, low impact landscaping,
pervious pavement, and bioretention (EPA 2007). Of these, bioretention, green roofs, grass
swales, and pervious pavement have received the most attention (EPA 2000). For this reason,
and also because they were recommended by the 2005 Capstone report, we chose to examine the
use of bioretention and pervious pavement in Basin 15.
Bioretention
Bioretention cells are planted gardens that infiltrate stormwater from impervious
surfaces, such as parking lots and roof tops. They are placed in shallow depressions to
encourage the collection of runoff, and often include a pretreatment step to filter out large
sediments, such as a forebay or grassy swale (Figures 3.4 and 3.5). Bioretention cells are
basically rain gardens, but unlike rain gardens, some bioretention cells have an underdrain that is
“online”, or connected to the stormwater sewer system (Atchison, Potter, and Severson 2006).

Page 57
Figure 3.4: Bioretention cell and forebay designed to receive runoff from a nearby parking
lot (Virginia Tech University)
Bioretention cells can substantially reduce both the pollutant load and volume of runoff
following a rain event through biological, physical, and chemical processes (Winogradoff 2002;
Atchison, Potter, and Severson 2006). Such processes include infiltration into the soil media,
settling of suspended solids, evapotranspiration through plant leaves, filtration of runoff through
mulch and soil, assimilation of nutrients and other pollutants by plants, nitrification,
dentrification, and decomposition of organic compounds by bacteria (Winogradoff 2002).
Infiltration of stormwater through the soil has the added benefit of recharging the aquifer
underlying the bioretention cell. Bioretention cells have been shown to effectively reduce
stormwater peak flow volumes regardless of season (Bioretention System 2008).

Page 58
Not surprisingly, bioretention cells get their name from their ability to retain pollutants
(Table 3.2) (Atchinson, Potter, and Severson 2006). Early and recent studies have demonstrated
a high retention of metals in bioretention cells, including copper, zinc, and lead (Dietz 2007). On
the other hand, the ability of bioretention cells to contain nutrients, such as nitrate and total
phosphorus, has received mixed results. Some studies have even documented the net export of
total phosphorus (Dietz 2007). The net export of phosphorus from some bioretention cells has
been attributed to several sources. These include: 1) high phosphorus content of the surrounding
soil, 2) erosion of phosphorus-containing soil after construction of the bioretention cell, and
3) leaching of phosphorus from the mulch and engineered soil media within the bioretention cell
(Dietz 2007). To avoid unwittingly exporting phosphorus from a bioretention cell, it is important
not to plant vegetation that requires the use of fertilizers.
Figure 3.5: Typical layout of a bioretention cell capturing runoff from a
parking lot (WDNR 2006)

Page 59
Table 3.2: Typical Pollutant Removal Rates for Bioretention Cells
(Atchison, Potter, Severson 2006)
The typical components of a bioretention cell are the pretreatment zone, ponding zone,
plant & mulch surface layer, root zone, underdrain, and storage zone. A description of each is as
follows (Figure 3.6) (Winogradoff 2002; Atchison, Potter, Severson 2006):
The pretreatment zone typically consists of runoff over grass swales, which allows large
particles to settle out before reaching the bioretention cell.
The ponding zone stores water temporarily on the surface of the cell and allows
particulates to settle out.
As mentioned previously, the plants are responsible for pollutant and nutrient uptake.
Also, their roots aid in maintaining infiltration capacity by loosening the soil and creating
pathways for percolating water. Plant selection should include native plants that can
tolerate inundated conditions, which excludes most upland plants. Obligate wetland
plants are also not recommended due to the possibility of extended dry conditions,
especially if the rooting zone soil is sandy.
Along with the plants, a mulch layer can be included on the surface of the bioretention
cell to reduce soil erosion and provide a site for microbiological growth and adsorption of
heavy metals.
Page 60
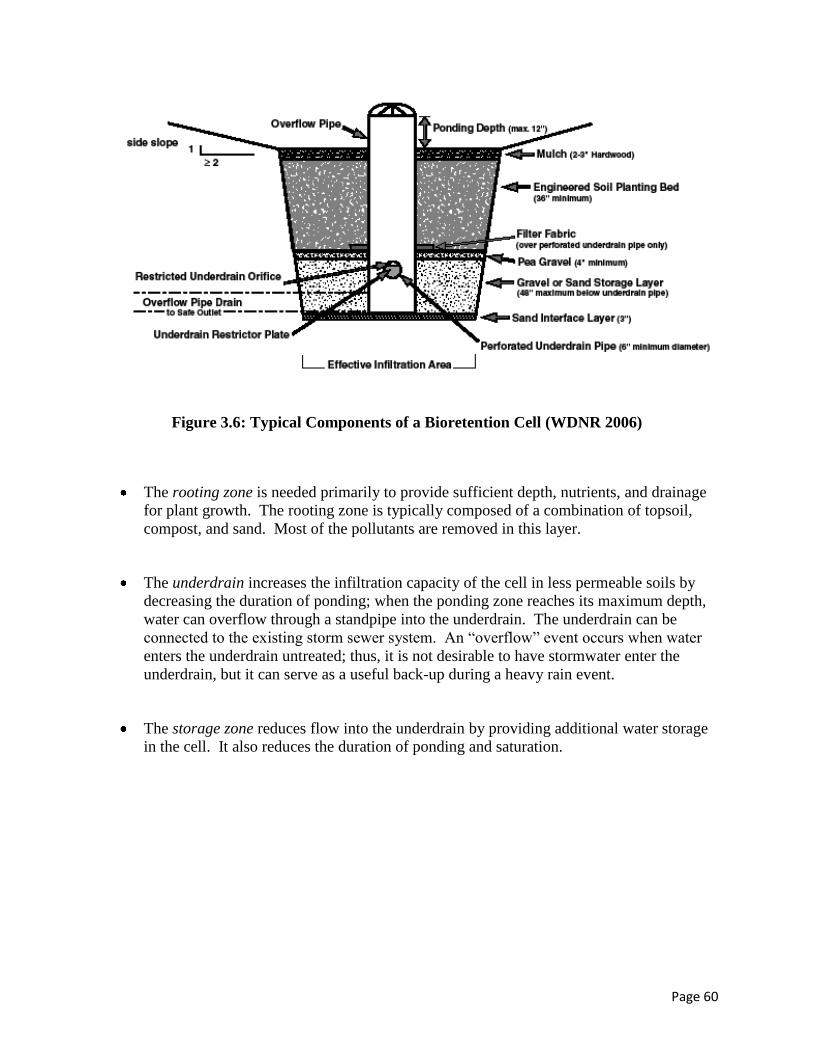
Figure 3.6: Typical Components of a Bioretention Cell (WDNR 2006)
The rooting zone is needed primarily to provide sufficient depth, nutrients, and drainage
for plant growth. The rooting zone is typically composed of a combination of topsoil,
compost, and sand. Most of the pollutants are removed in this layer.
The underdrain increases the infiltration capacity of the cell in less permeable soils by
decreasing the duration of ponding; when the ponding zone reaches its maximum depth,
water can overflow through a standpipe into the underdrain. The underdrain can be
connected to the existing storm sewer system. An “overflow” event occurs when water
enters the underdrain untreated; thus, it is not desirable to have stormwater enter the
underdrain, but it can serve as a useful back-up during a heavy rain event.
The storage zone reduces flow into the underdrain by providing additional water storage
in the cell. It also reduces the duration of ponding and saturation.

Page 61
Porous Pavement
Urban development has had an adverse effect on both the quantity and quality of surface
waters. During rainfall events, impervious areas, such as roadways, driveways, and rooftops,
cause water to run off surfaces faster and in greater amounts than from undeveloped pervious
areas, such as grasslands and forests. The increase in runoff can cause an increase in overland
and stream bank erosion, as the water rapidly travels to surface water sources. Surface waters, in
turn, experience irregular flow rates and higher sediment loadings. Impervious areas also reduce
infiltration, impacting groundwater aquifers. The result is an increase in surface water
temperature and pollutant load, which have detrimental effects on aquatic habitats. The most
common urban storm water pollutants include sediment, nutrients, oil and grease, bacteria, and
heavy metals.
As urban areas expand, the problems associated with urban runoff and water quality
continue to grow. Because of their ability to allow water to infiltrate into the surface, permeable
pavements can be an effective means of approaching a solution to these problems. Permeable
pavements, also referred to as porous pavements, are alternatives to the traditional impervious
asphalt and concrete pavements. Pervious pore spaces in the permeable pavement surface allow
for water to infiltrate into the pavement during rainfall events. Water passes through several
layers of pervious material where it is temporarily stored. In areas underlain with highly
permeable soils, the captured water slowly infiltrates into the sub-soil. In areas containing soils
of lower permeability, water can leave the pavement though an underdrain system. (Pratt et al.,
1989; Hunt et al., 2002; Bratteo and Booth, 2003; Bean et al., 2005).
Because of their ability to allow water to quickly infiltrate through the surface, permeable
pavements allow for reductions in runoff quantity and peak runoff rates Even in areas where the

Page 62
underlying soil is not ideal for permeable pavements, the installation of under drains has still
been shown to reflect these reductions (Pratt et al., 1989). As a result, permeable pavements have
been regarded as an effective tool in helping with storm water control (Watanabe 1995). The
evaporation rates, drainage rates, and retention properties on permeable pavements are largely
dependent on the particle size distribution of the bedding material.
Permeable pavements also affect the water quality of stormwater runoff. Permeable
pavements have been shown to cause a significant decrease in several heavy metal
concentrations as well as suspended solids (Pratt et al. 1989). Removal rates are dependent upon
the material used for the pavers and sub-base material, as well as the surface void space (Pratt et
al., 1989). Metal pollutant concentrations within pavements themselves decrease rapidly with
depth.
A typical cross-section of the pervious pavement used in parking lots consists of a
pervious concrete layer with a thickness of 4 to 6 inches, a permeable base with a
thickness up to 18 inches, and a permeable subgrade. The surface component of pervious
paving can be:
Porous asphalt or porous concrete.
Concrete or plastic grid structures filled with unvegetated gravel or vegetated soil,
Concrete modular pavers with gapped joints that allow water to percolate through.
If the subgrade permeability is low, drainage pipes can be used to drain water, but
drainage pipes increase the cost of a pervious pavement system (Figure 3.7). Typical pervious
concrete mix designs used in the United States consist of cement, single-sized coarse aggregate
(generally a size between one inch and the No. 4 sieve), and a water to cement ratio ranging from

Page 63
0.27 to 0.43. Reported properties of pervious concrete in the United States indicate that the 28-
day compressive strength of pervious concrete ranges from 800 psi to 3,000 psi, with void ratios
ranging from 14% to 31%, and permeability ranging from 36 to 864 inches/hour.
Figure 3.7 Typical Cross Section of Pervious Pavement System (UNHSC 2008)
Basin 15: Control Locations
For our project, we focused on two of the largest sources of stormwater runoff in
Basin 15: the Weidner Center parking lots and the Wood Hall parking lot. The Wood Hall
parking lot was focused on most extensively because it is slated for repairs sometime between
2009 and 2011 by the Facilities Management 6 Year Plan. We located our bioretention cells
near existing storm pipes that drain the respective parking lots. This would allow for the the
possibility of “online” bioretention cells (cells connected to the storm system through an
underdrain). We placed one bioretention cell in the disc golf course near the Wood Hall parking
lot, and another in front of a storm outfall near Weidner Hall (Figure 3.2).

Page 64
Pervious pavement was investigated as a storm water management technology for the
Wood Hall parking lot on the UWGB campus. Because the use of pervious pavement is limited
to low traffic areas, we chose an infrequently-used portion of the Wood Hall parking to evaluate
as a potential site for installation. At present, pervious pavement is only recommended for low-
traffic applications due to a lower load-bearing capacity compared to traditional pavement
(Dietz 2007). This portion is located in the west half of the Wood Hall parking lot. Though not
located in Basin 15 (this part of the Wood Hall parking lot is in Basin 4), the lot could be re-
graded to accept runoff from other parts of the parking lot that are in Basin 15.
METHODS
Bioretention Cells
There are many different components included in the design of a bioretention cell and
each one affects the cell’s performance. To guide our design of bioretention cells to reduce
stormwater runoff from the Wood Hall and Weidner Center parking lots, and to ensure
compliance with state requirements, we researched literature, including technical notes and
relevant government regulations.
We also used the RECARGA model (Figure 3.8), a software program developed by the
UW Madison Department of Civil Engineering and recommended by the Wisconsin Department
of Natural Resources, to evaluate different designs.

Page 65
The RECARGA model evaluates user-provided inputs to predict how much stormwater a
particular design could be expected to retain, i.e., how much runoff would be reduced. We
investigated the following required inputs:
• Tributary Area: Total area, in acres, of the drainage area (“sub-basin”) that we were
focusing on during a particular RECARGA run. These values were determined by our
colleagues in the SLAMM modeling group, who used ArcGIS to draw the tributary area
boundaries onto air photo layers and calculate the area. The areas of our two tributaries,
or sub-basins, were:
• Wood Hall: 14.4625 acres
• Weidner Center: 9.4596 acres
Figure 3.8 The RECARGA Model

Page 66
• Percent Impervious: Percent of tributary land surface that is vegetated or undeveloped.
The area of impervious surface in each tributary was determined by using the ArcGIS
methods described in the previous section. Using this area, we calculated the percent of
impervious surface in each sub-basin.
• Wood Hall: 30.19% impervious
• Weidner Center: 57.02% impervious
• Pervious Curve Number (CN): Value used by RECARGA to estimate run-off. The
pervious CN is based on many variables, including soil type, precipitation, and land use.
We obtained this value by referring to Technical Release 55 (NRCS 1986). We used a
pervious CN value of 74 for each of our sub-basins.
• Precipitation: The RECARGA model uses hourly precipitation records to predict how a
particular design would perform under specific conditions. We contacted several
regional climate specialists to obtain these records and chose to use a dataset that contains
266 days of consecutive hourly precipitation from Madison, Wisconsin in 1981. This
dataset was provided with the RECARGA software.
• Simulation Type: The RECARGA model offers options to predict bioretention cell
performance based on a single precipitation event or a longer, continuous, period of time.
We used the continuous simulation type because it predicts performance of our designs
over the entire time period contained in our precipitation dataset.
• Native Soil Properties: The existing soil at a bioretention site influences the overall
effectiveness of the cell. United States Department of Agriculture soil surveys indicate
that campus soils are clayey silt loams, however, the soils in our sites, those adjacent to
the Wood Hall and Weidner Center parking lots, are classified as “fill”. We made an

Page 67
assumption that the soil had been excavated from a development project on campus and
entered a “silt loam” classification with a hydraulic conductivity of 0.1 inches/hour into
RECARGA for this input.
• Regional Evapotranspiration Rate: Rate at which water is evaporated from the ground
surface and transpired from vegetation. We used a rate of 0.13 inches/day because this is
a typical value used in the region (Atchison, et. al. 2006).
• Ponding Zone Depth, Rooting Zone thickness and properties, Storage Zone thickness and
properties: We consulted literature and WDNR requirements to select appropriate and
acceptable materials and specifications for these inputs. For the rooting zone, we
indicated that we would use a standard engineered soil mix, primarily sandy loam, with a
hydraulic conductivity of 0.5 inches per hour. For the storage zone, we indicated that we
would use a typical engineered soil mix, primarily loamy sand, with a hydraulic
conductivity of 4.8 inches per hour.
To determine the ideal thickness for the ponding zone, rooting zone, and storage
zone, we ran the RECARGA model many times, which allowed us to evaluate the
performance offered by different combinations of these design components for each site.
The results of these comparisons are described in the following section.
• Perforated underdrain: For bioretention cells, WDNR recommends an underdrain with a
diameter that is no less than six inches (2006). To determine the required underdrain
diameter, the RECARGA model requires an underdrain flow rate. To calculate the
underdrain flow rate necessary to drain the cell within 24 hours after a rain event, we
divided the proposed ponding depth by 24 hours and subtracted the hydraulic
conductivity of the native soil. RECARGA then calculated the required diameter of the

Page 68
underdrain to meet this flow rate. For all of the designs we ran, a six inch underdrain was
sufficient.
Porous Pavement
To understand how porous pavement might contribute to stormwater management
practices at UWGB, we researched literature on the subject and spoke with members of the
facilities team to get their input about how management and operations would respond to the
product. We determined appropriate values for design components, including cement content,
coarse aggregate composition, water:cement ratio, field infiltration rate, compressive strength,
and compacted thickness. We then shared these values with our colleagues to enter into the
WinSLAMM modeling program to predict the performance of porous pavement on the UWGB
campus.
RESULTS
Bioretention
After running the RECARGA model numerous times to compare different design options
for each site, we evaluated the output to understand how the different design components interact
and affect overall performance.
Wood Hall Bioretention Cell
Increasing the size of the bioretention cell decreases the number of overflows and the
amount of runoff in the sub-basin. The current percent of runoff for the Wood Hall sub-basin is
about 29%. Increasing the size of the bioretention cell can substantially reduce the amount of
runoff. However, a complete reduction would require an extremely large cell (approximately
15% of the sub-basin area). The large size of such a cell can be attributed to the fact that the
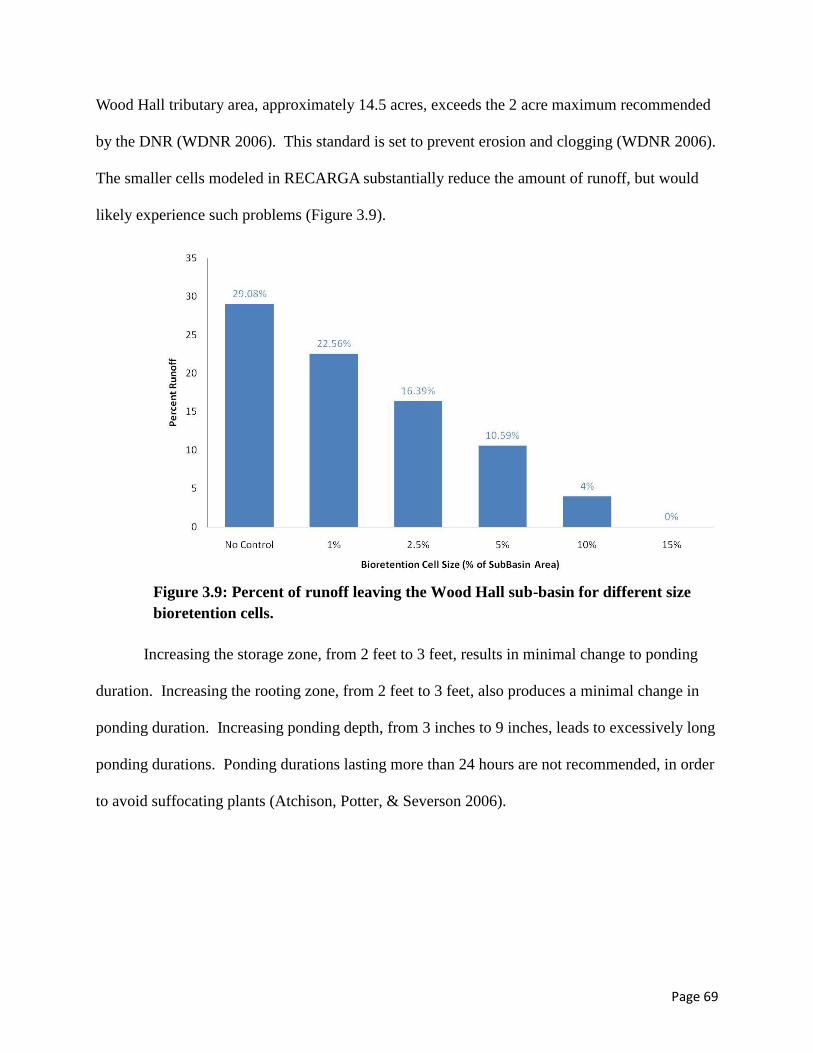
Page 69
Wood Hall tributary area, approximately 14.5 acres, exceeds the 2 acre maximum recommended
by the DNR (WDNR 2006). This standard is set to prevent erosion and clogging (WDNR 2006).
The smaller cells modeled in RECARGA substantially reduce the amount of runoff, but would
likely experience such problems (Figure 3.9).
Increasing the storage zone, from 2 feet to 3 feet, results in minimal change to ponding
duration. Increasing the rooting zone, from 2 feet to 3 feet, also produces a minimal change in
ponding duration. Increasing ponding depth, from 3 inches to 9 inches, leads to excessively long
ponding durations. Ponding durations lasting more than 24 hours are not recommended, in order
to avoid suffocating plants (Atchison, Potter, & Severson 2006).
Figure 3.9: Percent of runoff leaving the Wood Hall sub-basin for different size
bioretention cells.

Page 70
Weidner Center Bioretention Cell
The current percent of runoff coming from the Weidner Center parking lots is about 46%.
Runoff is higher in the Weidner Center sub-basin because there are more impervious surfaces in
a smaller area. The percentage of impervious area is 57.02%, compared to 30.19% in the Wood
Hall sub-basin. The tributary area for the Weidner Center, which is about 9.5 acres, also exceeds
the 2 acre maximum recommended by the DNR. Additionally, the amount of space available for
a bioretention cell is more limited, and the 10% and 15% size options are not feasible as a single
cell in our identified location. The smaller cells can still reduce runoff but, as with the smaller
biorention cells for Wood Hall, would still be subject to erosion and clogging (Figure 3.10).
Figure 3.10: Percent of runoff leaving the Weidner Center sub-basin for different size
bioretention cells.

Page 71
Increasing the depth of the storage zone from 2 feet to 3 feet dramatically decreases the
ponding duration, but increasing the depth from 3 feet to 4 feet results in negligible change.
Increasing the rooting zone from 2 feet to 3 feet produces almost no change in ponding duration.
Increasing the ponding depth from 3 inches to 9 inches creates excessive ponding durations,
which is detrimental to plant survivability.
Design Summary
Based on the results obtained from the RECARGA model, we selected a 3 inch ponding
zone and a 2 foot rooting zone for both locations (Figure 3.11). Additionally, we selected a
2 foot storage zone for the Wood Hall bioretention cell and a 3 foot storage zone for the Weidner
Center bioretention cell (Figure 3.11). These designs are only likely be effective in the form of
multiple small cells that receive runoff from smaller tributary areas.
Figure 3.11: Selected designs for bioretention cells

Page 72
Plants for the bioretention cells should be native species that are tolerant of drought and
flood conditions. Salt tolerant plants may also be necessary if runoff contains salt-based de-icers
(WDNR 2006). Appropriate plant selections can be made with the help of a guidebook
developed by Shaw and Schmidt (2003). Typical maintenance of bioretention cells includes
watering plants when necessary during the first year, monthly inspections and debris removal,
and yearly additions of mulch (WDNR 2006).
Porous Pavement
Studies have shown that porous pavement systems dramatically reduce surface runoff
volumes and peak discharge (Dietz 2007). Porous pavement is suitable for cold weather
climates, as it will continue to infiltrate through winter months. (Roseen et al. 2008). We
selected porous concrete as the best pavement option for UWGB because it is well suited for
subsoils with low permeability, due to a higher void content. Research also indicates that, as
with any storm water management technique or device, permeable paving performs well over
time if properly installed and maintained. Vacuuming twice per year to prevent clogging and
plowing snow with the blade slightly higher than normal are recommended (Dietz 2007).
Table 3.3 clarifies some common misconceptions about porous pavements.

Page 73
CONCLUSION AND RECOMMENDATIONS
Possible Stormwater Control Options Based on Results:
• Install several small bioretention cells around each parking lot to reduce cost
• would require regrading and new piping infrastructure.
• Combine the use of small bioretention cell with other practices, such as grass swale
drainage, disconnection, and porous pavement in low-traffic areas or sidewalks within
Basin 15.
• During repair of Wood Hall parking lot:
• re-grade lot so runoff flows into woods located to the south (disconnected from
storm drains) OR
• re-grade so west half of lot drains into Basin 4 (woods west of the basin)
• would reduce the contribution of Basin 15 to Green Bay
• would make bioretention more feasible by reducing runoff volume.
General Recommendations
Table 3.3: Misconceptions about porous pavements (From Roseen et al. 2008).
Misconceptions Truth
Freezes faster Has demonstrated increased speed in thawing due to flow
through by melt water
No infiltration in winter Can have increased IR in winter
Weaker material Pavement system is stronger despite weaker material
Higher Cost New development can be cheaper
Higher Maintenance Yes for sweeping, lower winter maintenance for PA
Slippery Developed to have higher friction than traditional asphalt
Cannot plow, salt, or de-ice Can be plowed and de-iced, however no sand is
recommend
More prone to frost heaving Reduced compared to traditional asphalt due to vadose
zone disconnect
Lower life span Increased life span due to reduced freeze thaw

Page 74
• Future plans for parking lot construction should incorporate a proactive approach to
stormwater control to avoid the hassles of retrofitting
• i.e. bioretention cell islands within new lots
• Completely inventory all stormwater drains, including direction of water flow so
contributing areas can be estimated accurately
• Incorporate pervious pavement in a test situation somewhere on campus, such as a small,
low-traffic section of a parking lot or sidewalk

Page 75
References
Atchison, D. A., Potter, K., and Severson, L. 2006 Design Guidelines for Stormwater
Bioretention Facilities. University of Wisconsin – Madison Civil and Environmental
Engineering. University of Wisconsin Water Resources Institute Publication No. WIS-
WRI-06-01. Madison (WI). 40 pages.
Bachhuber, J. and Hanson, J. (2008) University of Wisconsin-Green Bay Campus Memo
Report: Stormwater Pollution Analysis Method and Results. EarthTech Report. Pgs 1-
11.
Bean, E.Z. 2005 A field study to evaluate permeable pavement surface infiltration rates, runoff
quantity, runoff quality, and exfiltrate quality. Master’s thesis, North Carolina State
University.
Bioretention System (Bio II). (2008) University of New Hampshire Stormwater Center. Durham,
NH. http://www.unh.edu/erg/cstev/fact_sheets/bio_ii_fact_sheet_08.pdf
Brattebo, B.O. and Booth, D.B. 2003 Long-term stormwater quantity and quality performance of
permeable pavement systems. Water Research Volume 37, page 4369-4376.
Brown County Land Conservation Department (BCLCD). 2007 Nutrient Management Plan
Criteria 590, Sections 23 and 26, City of Green Bay T24N R21E. Available online
http://www.co.brown.wi.us/land_conservation/NutrientManagementMaps.htm. Accessed
December 18, 2008.
Dietz, M.E. 2007 Low Impact Development practices: A Review of Current Research and
Recommendations for Future Directions. Water, Air, and Soil Pollution 186: 351-363.
Fach, S. and Geiger, W.F. 2005 Effective pollutant retention capacity of permeable pavements
for infiltrated road runoffs determined by laboratory tests. Abstract. 1 page.
Hunt, B., Stevens, S., and Mayes, D. 2002. Permeable pavement use and research at two sites in
eastern North Carolina. 9th
International Conference on Urban Drainage. American
Society of Civil Engineers.
Natural Resources Conservation Service (NRCS). Urban hydrology for small watersheds:
Washington, D.C.: United States Department of Agriculture; 1986 June. USDA NRCS
Technical Report 55. 164 pages.
Pervious Concrete Pavement for Stormwater Management. (2008) University of New Hampshire
Stormwater Center. www.unh.edu/erg/cstev/.
Porous Asphalt Fact Sheet. (2008) University of New Hampshire Stormwater Center.
www.unh.edu/erg/cstev/.

Page 76
Pratt, C.J., Mantle, J.D. 1989 Urban stormwater reduction and quality improvement through the
use of permeable pavements. Water Science and Technology Vol. 21, No. 8/9, p 769-778.
Rasmussen, Russ. (2005) State of Wisconsin Correspondence/Memorandum. Bureau of
Watershed Management. June 6, 2005.
Roseen, R.M., Houle, K.M., Briggs, J.F., Ballestero, T.P., & Houle, J.J. Pervious Concrete and
Porous Asphalt Pavements Performance for Stormwater Management in Northern
Climates. Presented at The seventh annual North American Surface Water Quality
Conference and Exposition August 3–7, 2008 Orlando, FL.
Shaw, D. & Schmidt, R. 2003 Plants for stormwater design: Species selection for the upper
Midwest. Minnesota Pollution Control Agency. St. Paul, MN
http://www.pca.state.mn.us/publications/manuals/stormwaterplants.html
WDNR 2006 Bioretention for Infiltration Conservation Practice Standard (1004).
Wisconsin Department of Natural Resources (WDNR). Bioretention for infiltration (1004):
Conservation Practice Standard. July 2006. 11 pages.
U.S. EPA (2000) Low Impact Development: a Literature Review. Office of Water. Washington,
D.C. EPA-841-B-00-005.
U.S. EPA. (2007) Reducing Stormwater Costs through Low ImpactDevelopment (LID) Strategies
and Practices. Nonpoint Source Control Branch. Washington, D.C. EPA 841-F-07-006.
University of New Hampshire Stormwater Center (UNHSC). 2008 Pervious Concrete Pavement
for Stormwater Management. Fact Sheet. 1 page. Available online:
http://www.unh.edu/erg/cstev/pubs_specs_info/unhsc_pervious_concrete_fact_sheet_4_08.
pdf. Accessed December 18, 2008.
Watanabe, S. 1995 Study on storm water control by permeable pavement and infiltration pipes.
Water Science and Technology, Vol. 32, No. 1, p 25-32.
Winogradoff, D. (2002) The Bioretention Manual. Prince George’s County. MD Department of
Environmental Resources. Watershed Protection Branch, MD Department of
Environmental Protection. Landover, MD.
Wisconsin Department of Natural Resources. (2006) Biofiltration for Infiltration. Conservation
Practice Standard 1004. July 2006. Pgs 1-11.

77
Chapter 4
Using Arc-GIS and WinSLAMM to
Determine Optimal Stormwater Treatment Scenarios
Daniel Cibulka
Lawrence Eslinger
Phil Hahn
78
Abstract
We used a geographic information system (ARC-GIS) and an urban stormwater simulation
model (WinSLAMM) to evaluate possible stormwater management options within the University
of Wisconsin-Green Bay (UWGB) campus. Arc-GIS was used to determine land use
composition and area for two regions on campus – the Weidner Center parking lot and the Wood
Hall parking lot. Data regarding these two sub-basins were modeled in WinSLAMM. The
model calculated annual Total Suspended Solids (TSS) and Total Phosphorus (TP) yields within
each sub-basin under existing conditions. We then tested various pollution control devices to
determine optimal management strategies for pollutants. Finally, a cost analysis was used to
estimate the most cost-effective management practice for stormwater treatment within the
UWGB campus.
WinSLAMM results and the cost analysis suggests that a bioretention device is best
suited to remediate stormwater pollution from the Weidner Center parking lot sub-basin. We
recommend a bioretention device ranging between 2.5-5% of the contributing sub-basin
drainage area. Pro-active steps, such as continual stormwater remediation, will assist in meeting
future stormwater regulations as well as exemplifying UWGB’s commitment towards
environmental sustainability and educational opportunities.
Introduction:
Although the UWGB campus has already met Wisconsin Department of Natural
Resources MS4 requirements to reduce pollutant loadings from impervious surfaces, there has
been increased interest in further reducing the impact the university has on the Bay of Green

79
Bay. Besides the campus mission of promoting sustainability, the facilities management
department has been exploring ways to reduce stormwater while adopting technology that
reduces labor and resources. Following an interest by professors and graduate students in the
Environmental Science and Policy Capstone course, a plan of action was adopted to address the
possible inclusion of additional stormwater management practices on campus.
In 2005, an EarthTech Inc. report identified 21 drainage basins on the UWGB campus
(Bachhuber and Hanson 2005). Through the use of urban watershed modeling, researchers used
WinSLAMM (Windows based Source Loading and Management Model) to estimate annual
Total Suspended Solids (TSS) and Total Phosphorus (TP) loads from each basin. The report
identified Basin 15, which encompasses a large portion of west-campus, as the second largest
contributor of TSS (9.38 tons/year) and the largest contributor of TP (55.76 lbs./year) in
stormwater pollutant runoff from campus. The report also stated that the basin currently has very
little control to reduce pollutant yields (0.1% for TSS and 0.0% for TP).
The modeling program EarthTech used in their 2005 study, WinSLAMM (Windows-
based Source Loading and Management Model), is a commonly used stormwater modeling
program that was originally developed by Robert Pitt and John Voorhees as part of the
Environmental Protection Agency’s street cleaning program in the 1970’s (Pitt and Voorhees
2002). The urban watershed model has been continuously updated since then to identify and
quantify stormwater pollutants exported from numerous types of urban landscapes.
WinSLAMM has many functions that allow the user flexibility in analyzing the urban watershed.
They include:
Ability to analyze up to 6 land use types and 14 source areas

80
Ability to simulate runoff volume and loading for 16 pollutants
Numerous BMP options for the user to add to the landscape
Ability to run simulations of different management scenarios
Ability to analyze and compare the cost of management scenarios
According to the authors, WinSLAMM is unique from other models in that it is able to
more accurately analyze small storm hydrology, which research has shown can contribute
towards significant pollutant loading in urban areas (Bannerman, et al. 1983). Along with
accurately analyzing smaller storm events, WinSLAMM is also able to calculate a “first flush”
relationship for each type of urban landscape. The “first flush” phenomenon holds that large
proportions of pollutants are washed off during the initial runoff from a storm event (Deletic
1998). Therefore, the first flush is very economical to target in current storm water management
strategies (Goonetillke et al. 2002). From research Pitt and Voorhees (2002) have done, they
argue that stormwater models operating without a first-flush structure show a linear increase in
pollutant loading, while this relationship is actually exponential in nature. WinSLAMM is able
to account for these “first flush” pollution loads and, therefore, can more accurately estimate
total pollution reduction from various control devices.
In this component of the Capstone Stormwater Project, we decided to actively
concentrate on possible solutions for pollution control in Basin 15, given its high pollutant load
and potential for implementation of best management practices. Two parking lots within the
basin were specifically isolated as preferred areas to remediate stormwater – the Weidner Center
parking lot and the Wood Hall parking lot (Figure 1). These parking lots are fairly large (Table
1) and individually contribute substantial quantities of pollutants during runoff events.
Conveniently, both parking lots have storm drains that travel either under or onto the campus’

81
disc golf course. These easily accessible drains were thought to be prime locations for a
bioretention device which, along with cleansing the stormwater, would provide a vivid reminder
of the University’s environmental agenda, provide educational opportunities, and enhance the
natural beauty of the campus. Because the Wood Hall parking lot is scheduled to be resurfaced
in the near future, we also considered porous pavement options.
The objectives of this study were to:
• Characterize area, land use, and current pollutant yield of UWGB Basin 15, and the
Weidner Center and Wood Hall Sub-Basins using Arc-GIS and WinSLAMM.
• Model various sized bioretention devices and porous pavement options to determine
reduction of pollutants (TSS, TP) achieved through each control device within respective
Sub-Basins.
• Use a Cost Analysis to determine the best management scenario.
Methods:
To begin stormwater assessment, land use from Basin 15 needed to be both characterized
and quantified. EarthTech had previously identified the boundaries of Basin 15 in their 2005
study. We delineated the Weidner Center and Wood Hall parking lot sub-basins within Basin
15 using storm sewer maps, air photos, and field assessments. These areas were then digitized as
shapefiles in Arc-Map (ArcMap Version 9.2, ESRI 2006). Land use areas for the entire campus
were developed by EarthTech Inc. (Bachhuber and Hanson 2005) and are available as ArcMap
shapefiles. We used these files to calculate land use in each sub-basin. Best locations for the
bioretention cells were determined using storm sewer maps, air photos, and field assessments.

82
To model pollutant export from Basin 15 and the two smaller sub-basins, WinSLAMM
version 9.3.0 software was obtained through PV & Associates (www.winslamm.com).
Parameter files were uploaded through the United States Geological Survey website (USGS
2008). These files simulate rainfall, determine pollutant concentrations on various land surfaces,
and direct the pollutant exports from the landscape in WinSLAMM. These files were used by
EarthTech Inc. during their 2005 investigation of stormwater on the UWGB campus and are
specific to the Green Bay area. Files used in this study include:
WisReg – Green Bay 1969.ran (1 year rainfall file)
WI_GEO01.ppd
WI_SL06 Dec06.rsv
WI_AVG01.psc
WI_DLV01.prr
WI_Res and Other Urban Dec06.std
WI_Com Inst Indust Dec06.std
After uploading parameter files, land use information was input from Arc-GIS into the
model. Existing pollutant yields were established for Basin 15, first to ensure that similar results
to EarthTech’s 2005 study were achieved, and secondly to develop a baseline for the Basin.
Existing conditions were also established for the Weidner Center and Wood Hall sub-basins.
Following the characterization of existing pollutant yields, bioretention cell and porous
pavement scenarios were added to the model to determine pollutant reduction from these
devices. A total of eight bioretention cells were modeled - four in the Weidner Center sub-basin
and four in the Wood Hall sub-basin. The four sizes consisted of 1%, 2.5%, 5%, and 15% of the
respective sub-basin. These device sizes were developed using RECARGA (Chapter 3 of this
83
document). WinSLAMM was then used to determine the pollutant reduction that occurred from
each device within each sub-basin. The overall pollutant reduction each device had for the entire
Basin 15 was calculated as well.
The proposed porous pavement options were located in the western portion of wood hall
(Appendix C). This location was selected because it is a relatively unused and the lot is
scheduled to be resurfaced between 2009 and 2012 (UWGB Master Plan 2005). The sizes of
porous pavement were developed using Duluthstreams.org tool-kit (Duluthstreams.org 2008,
Chapter 3 of this document) and air photos. Scenario I was 48,787 ft.2 and Scenario II was
125,000 ft.2. For the WinSLAMM modeling, it was assumed that the entire Wood Hall parking
lot would be resloped so that runoff drains into the porous pavement. Since the west portion of
the Wood Hall parking lot drains to Basin 4, these scenarios were modeled for Basin 4 plus the
area of the Wood Hall parking lot that is in Basin 15.
Following the delineation of sub-basins and modeling of stormwater treatment scenarios,
we used a cost analysis to evaluate the efficiencies of the proposed pollution remediation
devices. The approximate costs for construction of a bioretention cell were provided by Robert
E. Lee and Associates (Jared Schmidt personal communication), and are represented in Table 1.

84
Table 1. Estimated costs of materials needed to construct a bioretention device.
Cost Unit
Excavation $5.00 - $6.00 cubic yard
Bioretention Media (Root & Storage) $17.50 - $25.00 cubic yard
Gravel (Under-drain bed) $15.00 - $20.00 cubic yard
Under-drain pipe $20.00 linear foot
Filter Fabric $2.00 square yard
Mulch $35.00 cubic yard
Plants $3.50 - $5.50 square foot
For total cost calculations of the proposed bioretention cells, we used the highest
estimated costs for materials in order to determine the maximum cost of each device. Therefore,
the University will be able to identify costly items, and use resources available to the campus in
order to reduce costs for some of the needed materials.
We applied the cost of the bioretention media (mixture of soil, sand, etc.) to the root and
storage zones in each bioretention device. Therefore, gravel was not incorporated into the cost
determination. A thin layer of gravel will be needed to surround the under-drain pipe, however,
the exact dimensions of that layer were uncertain, and since the cost of the bioretention media
was just five dollars more per cubic yard, we chose to exclude the costs associated with the
gravel layer. We assumed that the under-drain pipe would be covered by filter fabric extending
two feet outside of the pipe. Therefore, when calculating the cost for filter fabric, we multiplied
the length of the under-drain pipe (ft.) by two, which results in the square footage of filter fabric
needed. Mulch was not incorporated in any cost calculations, but the associated dollar estimate
was included in Table 1 to provide the University with an idea of cost for mulch from an

85
independent supplier. To determine the cost for plants, we assumed one plant would be planted
per square foot. Therefore, the surface area of each proposed bioretention device (ft.2) was
multiplied by $5.50 to estimate the total cost associated with plants. An example of the total cost
calculation for the 1% Weidner Center bioretention device is shown below:
Surface area of Weidner Center 1% bioretention device = 4,121 ft.2
Total depth of bioretention device = 5.75 ft.
Total area (ft.3) = 4,121 ft.
2 x 5.75 ft. = 23,695.75 ft.
3
1 yd3 = 27 ft
3
Total area (yd3) = 23,695.75 ft.
3 / 27 ≈ 878 yd
3
Excavation Cost = 878 yd3 x $6.00 = $5,268
Bioretention Media Area (yd3) = 4,121 ft.
2 x 5 ft. = 20,605 ft.
3 / 27 ≈ 764 yd
3
Note: The top 0.75 ft. (9 in.) of the cell consists of a 6 in. drain pipe and a 3 in. ponding
zone which contains no media.
Bioretention Media Cost = $19,100
Under-drain pipe length (ft.) = 45.25 ft. (“Typical Width” from RECARGA) x 2 = 90.5 ft.
Under-drain pipe Cost = 90.5 ft. x $20.00 = $1,810
Filter Fabric (ft.2) = 90.5 ft. (pipe length) x 2 ft. (outside of pipe) = 181 ft.
2
Filter Fabric Cost = 181 ft.2 x $2.00 = $362
Plants Cost = 4,121 ft.2 (surface area of bioretention device) x $5.50 = $22,665.50
Total Cost = $5,268 (Excavation) + $19,100 (Bioretention Media) + $1,810 (Under-drain pipe)
+ $362 (Filter Fabric) + $22,665.50 (Plants Cost) = 49,205.50
It is evident that the cost of plants consumes a large portion of the total cost. The
associated cost for plants can be dramatically decreased depending upon the size and quality of
86
the plants and the spacing between them (Jared Schmidt personal communication). There is also
an opportunity for the University to use the on-campus greenhouse to grow some of the plants,
which may further reduce costs.
The approximate cost for installation of porous pavement in the Wood Hall parking lot
was determined to be $16.25 per square foot, and was derived from a combination of sources
including duluthstreams.org and the Environmental Protection Agency (EPA). Therefore, the
total cost associated with installing the porous pavement was calculated simply by multiplying
the square footage associated with each modeled scenario by $16.25.
To compare the efficiencies of the proposed pollution remediation devices, we calculated
the associated cost required for each device to remove one pound of total suspended solids
(TSS).
Results:
Basin 15 is Institutional land use type which contains several academic builds and large
areas of impervious surfaces, mainly streets and parking lots. The Wood Hall sub-basin is
characterized by large proportions of landscaped area and impervious pavement (Table 2,
Appendix A). The Weidner Center sub-basin has a smaller total area than the Wood Hall sub-
basin and is characterized by a higher proportion of impervious pavement and less landscaped
area (Table 2, Appendix A). Both sub-basins are dominated by parking lot and landscaped area
and have very small percentages of other land use types. The proposed bioretention cell locations
were placed in open, low-traffic, areas along existing drainage pipes (Appendix B).

87
Table 2. Land use (acres) for Basin 15 and sub-basins.
Basin 15
(acres)
Weidner Center
Sub-Basin
(acres)
Wood Hall Sub-
Basin (acres)
Landscape 49.98 4.07 10.1
Parking 9.67 4.28 3.92
Road 4.87 0.65 0.26
Roof 6.72 0.06 0
Sidewalk 5.34 0.41 0.19
Total
Impervious 26.6 5.39 4.37
Total Size 76.58 9.46 14.46
WinSLAMM was used first to calculate baseline, or existing conditions within Basin 15
and the two smaller sub-basins (Table 3). Although the Weidner Center sub-basin is smaller in
size compared to the Wood Hall sub-basin (9.46 vs 14.46 acres), the TSS yield was greater and
the TP yield was comparable to that of the larger sub-basin.
Table 3. Baseline pollution conditions of Total Suspended Solids (TSS) and Total Phosphorous (TP) for
Basin 15 and the two sub-basins.
WinSLAMM Summary - Existing Conditions
Location
TSS
(lbs/year)
TP
(lbs/year)
Basin 15 18,799.50 55.91
Weidner Center Sub-basin 3,611.64 7.81
Wood Hall Sub-basin 3,062.86 8.99

88
The WinSLAMM results show that the small devices can control a substantial amount of
TSS and TP from the contributing sub-basins and the larger ponds obtained nearly complete
control of both TSS and TP (Figure 1). Next, the model shows pollutant reductions (TSS, TP)
from Basin 15 under varying scenarios in which bioretention devices were placed in the Weidner
Center and Wood Hall sub-basin, and porous pavement was placed within the Wood Hall sub-
basin. A total of 10 scenarios were run – eight bioretention devices (four sizes placed in the
Weidner Center sub-basin and four sizes placed in the Wood Hall sub-basin) and two porous
pavement options. When placed in either sub-basin, bioretention devices captured a substantial
amount of TSS at the smaller device sizes (1% and 2.5% of sub-basin). As device size increased
to the larger sizes (5% and 15% of sub-basin), the rate of TSS removal decreased (Figure 2).
Devices placed in the Weidner Center sub-basin continuously out-performed devices placed in
the Wood Hall sub-basin in all size categories for TSS removal (Figure 2).
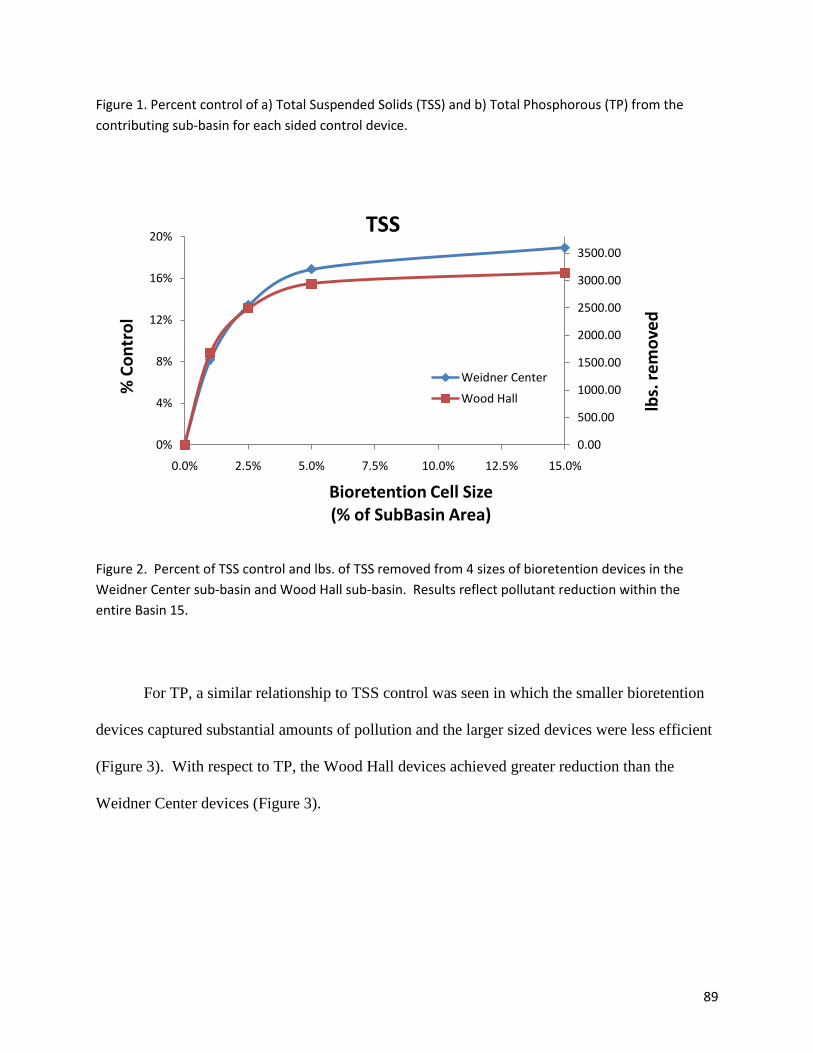
89
Figure 1. Percent control of a) Total Suspended Solids (TSS) and b) Total Phosphorous (TP) from the
contributing sub-basin for each sided control device.
Figure 2. Percent of TSS control and lbs. of TSS removed from 4 sizes of bioretention devices in the
Weidner Center sub-basin and Wood Hall sub-basin. Results reflect pollutant reduction within the
entire Basin 15.
For TP, a similar relationship to TSS control was seen in which the smaller bioretention
devices captured substantial amounts of pollution and the larger sized devices were less efficient
(Figure 3). With respect to TP, the Wood Hall devices achieved greater reduction than the
Weidner Center devices (Figure 3).
0.00
500.00
1000.00
1500.00
2000.00
2500.00
3000.00
3500.00
0%
4%
8%
12%
16%
20%
0.0% 2.5% 5.0% 7.5% 10.0% 12.5% 15.0%
lbs.
re
mo
ved
% C
on
tro
l
Bioretention Cell Size (% of SubBasin Area)
TSS
Weidner Center
Wood Hall

90
Figure 3. Percent of TP control and lbs. of TP removed from 4 sizes of bioretention devices in the
Weidner Center sub-basin and Wood Hall sub-basin. Results reflect pollutant reduction within the
entire Basin 15.
The WinSLAMM output was examined closer to identify and quantify contributing
source areas for TSS and TP. In Basin 15 streets are the largest contributor of TSS, while the
landscaped area within the basin contributes the largest percentage of TP (Table 4). Within the
Weidner Center sub-basin, there exists a, proportionally, large amount of parking space. This
parking area is the largest contributing source of both TSS and TP for the sub-basin (Table 4). In
the Wood Hall sub-basin a proportionally large amount of landscaped land exists. Here, parking
space exports the largest percentage of TSS, but landscaped area is the culprit of the largest
percentage of TP export (Table 4)
0.00
2.00
4.00
6.00
8.00
10.00
0%
4%
8%
12%
16%
20%
0.0% 2.5% 5.0% 7.5% 10.0% 12.5% 15.0%
lbs.
re
mo
ved
% C
on
tro
l
Bioretention Cell Size (% of SubBasin Area)
Weidner Center
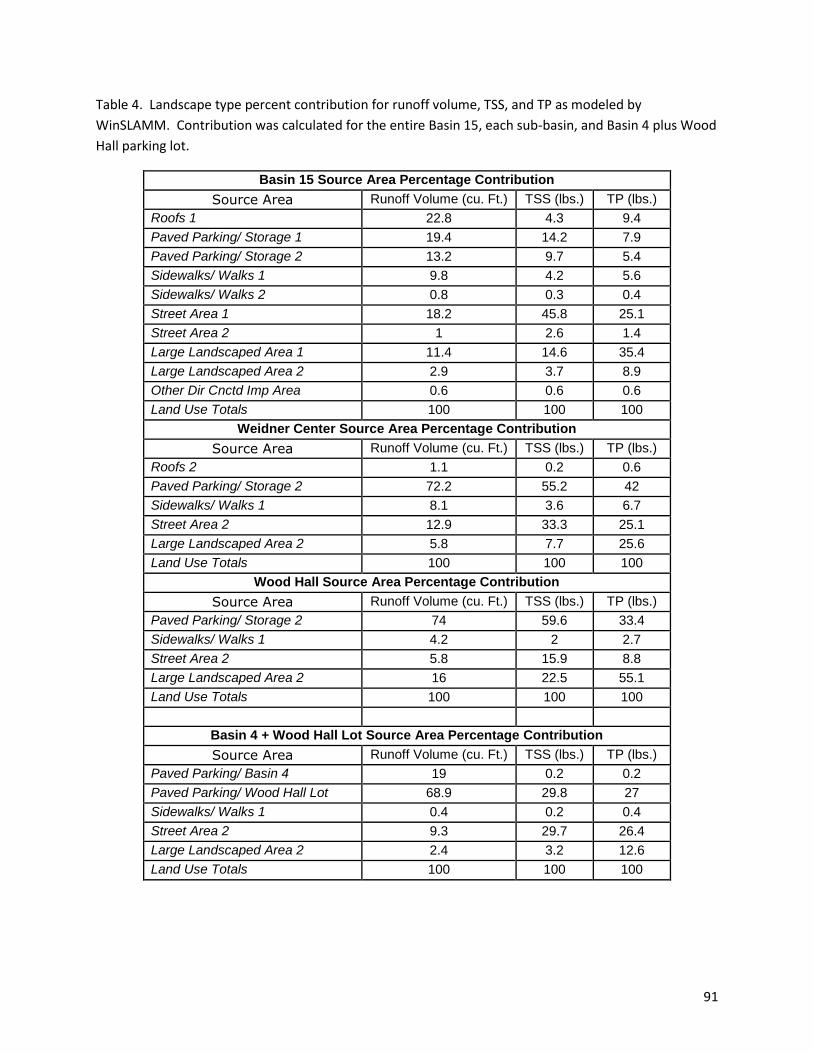
91
Table 4. Landscape type percent contribution for runoff volume, TSS, and TP as modeled by
WinSLAMM. Contribution was calculated for the entire Basin 15, each sub-basin, and Basin 4 plus Wood
Hall parking lot.
Basin 15 Source Area Percentage Contribution
Source Area Runoff Volume (cu. Ft.) TSS (lbs.) TP (lbs.)
Roofs 1 22.8 4.3 9.4
Paved Parking/ Storage 1 19.4 14.2 7.9
Paved Parking/ Storage 2 13.2 9.7 5.4
Sidewalks/ Walks 1 9.8 4.2 5.6
Sidewalks/ Walks 2 0.8 0.3 0.4
Street Area 1 18.2 45.8 25.1
Street Area 2 1 2.6 1.4
Large Landscaped Area 1 11.4 14.6 35.4
Large Landscaped Area 2 2.9 3.7 8.9
Other Dir Cnctd Imp Area 0.6 0.6 0.6
Land Use Totals 100 100 100
Weidner Center Source Area Percentage Contribution
Source Area Runoff Volume (cu. Ft.) TSS (lbs.) TP (lbs.)
Roofs 2 1.1 0.2 0.6
Paved Parking/ Storage 2 72.2 55.2 42
Sidewalks/ Walks 1 8.1 3.6 6.7
Street Area 2 12.9 33.3 25.1
Large Landscaped Area 2 5.8 7.7 25.6
Land Use Totals 100 100 100
Wood Hall Source Area Percentage Contribution
Source Area Runoff Volume (cu. Ft.) TSS (lbs.) TP (lbs.)
Paved Parking/ Storage 2 74 59.6 33.4
Sidewalks/ Walks 1 4.2 2 2.7
Street Area 2 5.8 15.9 8.8
Large Landscaped Area 2 16 22.5 55.1
Land Use Totals 100 100 100
Basin 4 + Wood Hall Lot Source Area Percentage Contribution
Source Area Runoff Volume (cu. Ft.) TSS (lbs.) TP (lbs.)
Paved Parking/ Basin 4 19 0.2 0.2
Paved Parking/ Wood Hall Lot 68.9 29.8 27
Sidewalks/ Walks 1 0.4 0.2 0.4
Street Area 2 9.3 29.7 26.4
Large Landscaped Area 2 2.4 3.2 12.6
Land Use Totals 100 100 100

92
Following the modeling of bioretention devices in both sub-basins, WinSLAMM was
used to analyze pollutant removal by porous pavement in the Wood Hall sub-basin. The baseline
conditions for both porous pavement options are identical. The larger scenario achieves higher
control of both TSS and TP (Figure 4). This relationship is unlike the bioretention cells in that as
the square feet of the device increases, a linear increase in pollutant removal is seen.
Figure 4. Percent control (primary axis) and lbs. removed (secondary axis) of a) TSS and b) TP for the
porous pavement scenarios.
Once modeling of bioretention devices and porous pavement was complete, a cost
analysis was performed on the different options. The proposed bioretention devices were much
less expensive and more cost-effective at TSS removal than the porous pavement options (Table
5). The Weidner Center sub-basin bioretention devices were more efficient in treating TSS than
the Wood Hall sub-basin devices, as evident by the cheaper cost per pound of TSS removal over

93
all bioretention cell sizes (Table 5, Figure 5). The Weidner Center sub-basin bioretention
devices were also less expensive than the Wood Hall devices (Table 5, Figure 5).
Figure 5. Total cost of each bioretention cell plotted against the percent Total Suspended Solids (TSS) for
Basin 15. Data points are each size (1%, 2.5%, 5%, and 15% of the total area of each contributing sub-
basin).
0
200000
400000
600000
800000
1000000
1200000
0 5 10 15 20
Tota
l Co
st in
Do
llars
% TSS Control of Basin 15
Weidner Center
Wood Hall

94
Table 5. Cost analysis of the proposed pollution control devices by the cost per pound of Total
Suspended Solids (TSS) removed.
Control Type Control Option $ per pound of TSS Removal Total Cost
Bioretention Cell Weidner 1% $32.00 $49,205.50
Bioretention Cell Weidner 2.5% $47.88 $120,958.00
Bioretention Cell Weidner 5% $75.59 $239,869.50
Bioretention Cell Weidner 15% $200.50 $713,508.00
Bioretention Cell Wood 1% $39.90 $66,383.00
Bioretention Cell Wood 2.5% $66.30 $163,620.50
Bioretention Cell Wood 5% $111.64 $324,775.50
Bioretention Cell Wood 15% $311.02 $966,596.50
Porous Pavement Scenario 1 $1,826.70 $792,788.75
Porous Pavement Scenario 2 $1,818.49 $2,031,250.00
Discussion:
The results from the WinSLAMM models show that the larger bioretention cells (>2.5%)
meet or exceed the 80% reduction of TSS from the contributing drainage basin, recommended by
researchers (Pitt and Voorhees 2002) and the WDNR (2004). The small ponds, however, do not
meet these recommendations. A device that does not meet the suggested control may not be a
viable option for best management practices.

95
TSS control was similar for both sub-basins, but slightly greater in the Weidner Center
sub-basin for each size device modeled. Pollution control appeared to be most efficient between
the 2.5-5% device sizes. The Wood Hall devices achieved greater reduction in TP than the
Weidner Center devices. However, this was likely due to the larger landscaped area in the Wood
Hall sub-basin.
According to Bannerman et al. (1993), most stormwater pollution comes from streets and
parking lots. Our results are similar for the Weidner Center sub-basin in that the majority of TSS
and TP come from paved parking, with streets making a substantial contribution as well. In this
sub-basin, landscape and parking make up 35% and 37%, respectively, of the total land-use. In
the Wood Hall sub-basin, 59% of TSS is exported from paved parking, while 55% of TP is
exported from landscaped areas and 33% is exported from parking. This is likely due to the
large proportion of landscape in this sub-basin (69%) and smaller amount of parking space
(27%).
Based upon the cost analyses, the 1% control device in the Weidner center sub-basin
achieves the most cost effective pollution reduction of TSS (Table 2). However, since this
device achieves only 43% reduction in TSS within the sub-basin, it may not be the best
management decision. Usually very large control devices are not financially or spatially
practical, so they may need to be divided into several smaller devices. We did not investigate
other locations for bioretention cells, but this may be required if the University decides to
implement several smaller devices. Other options may be to implement a multi-chambered
“treatment train” (Greb et al. 2000) or a combination of several control devices. A previous
Capstone class highlighted different stormwater treatment scenarios that use grassy swales that

96
lead to a bioretention cell or a multi-control treatment train (Forsberg et al. 2005). These options
may be worth investigating before the University implements any sort of control device.
Porous pavement would offer reduction in pollution control from Basin 15 by redirecting
runoff from the Wood Hall parking lot to Basin 4 (Appendix 3). However, cost analysis of the
porous pavement determined that cost per pound of TSS reduction was significantly greater than
the bioretention options. The estimated cost to implement porous pavement was also much
greater and may not be a feasible option. However, when the Wood Hall lot is resurfaced it may
be advisable to redirect the runoff into Basin 4 and 18. These basins have more natural
vegetation and are better able to treat runoff naturally. Porous pavement may be cost effective to
implement into newly constructed parking lots and this option should be considered in future
plans.
Conclusions / Recommendations:
A comprehensive map of stormwater drains and pipes is needed. The maps that are
currently available are outdated and lacking vital stormwater data.
Porous pavement, although a fascinating method of treating stormwater, is not
recommended for the Wood Hall parking lot due to its large cost. It may be a feasible
option for newly created parking lots or in a smaller scale to serve as an educational
model, but for the purposes of reducing the most pollution with the smallest financial
burden a bioretention device is more practical in this location.
A bioretention device sized between 2.5% and 5% of the contributing area is the most
cost-effective and spatially reasonable option for stormwater treatment. To capture the
most pollution possible, it is recommended this device be placed within the Weidner

97
Center sub-basin. This device should be carefully planned as to not interfere with users
of the UWGB disc golf course and should be designed to complement the natural beauty
of the grounds and the rest of the arboretum.
Further research should be performed to investigate whether one device between 2.5%
and 5% or several smaller devices (adding up to between 2.5% and 5%) would best treat
stormwater. A “treatment train” design such as a grassy swale leading to a bioretention
device may allow a smaller device to be created and also save money in the process.

98
References
Bachhuber, J. and J. Hanson. 2005. University of Wisconsin Green Bay Campus: Stormwater
Pollution Analysis and Results. EarthTech Inc.
Bannerman, R., Baun, K., Bohn, M., Hughes, P.E., and D.A. Graczyk. Evaluation of Urban
Nonpoint Source Pollution Management in Milwaukee County, Wisconsin. Volume 1.
Grant No. P005432-01-5, PB 84-114164. US Environmental Protection Agency, Water
Planning Division. November 1983.
Bannerman, R.T., D.W. Owens, R.B. Dodds, and N.J. Hornewer. 1993. Sources of pollutants in
Wisconsin Stromwater. Water Science and Technology 28: 241-259.
Deletic, A. 1998. The first flush load of urban surface runoff. Water Research. 32: 2462-2470.
Forsberg, A.A., J.A. McCuskey, and C.S. Waltman. 2005. University of Wisconsin-Green Bay
stormwater management: regulations and best management practices. In: 2005 Capstone
Seminar Project: “Building on the UW-Green Bay Master Plan: Promoting Sustainability.
Available:
http://www.uwgb.edu/esp/Courses/Capstone05/
Goonetilleke, A, E Thomas, Simon Ginn, and Dale Gilbert. 2005. Understanding the role of
land use in urban stormwater quality management. Journal of Environmental
Management 74: 31-42.
Pitt, R. and J. Voorhees. 2002. Wet-Weather Flow in the Urban Watershed: Technology and
Management. Edited by R. Field and D. Sullivan. CRC Press. Boca Raton, FL. 24 pp.
USGS. 2008. Wisconsin Water Science Center Website. Available:
http://wi.water.usgs.gov/slamm/

99
Appendix A: Basin 15 on the University of Wisconsin-Green Bay campus. Land use within the
Weidner Center and Wood Hall sub-basins is shown.

100
Appendix B: Proposed locations and relative sizes for the bioretention cells in the Weidner Center
(above) and Wood Hall (below) sub-basins.

101
Appendix C: Location and relative sizes of the two porous pavement scenarios in the Wood Hall parking
lot.

102
Appendix D: WinSLAMM results for existing condition, and under various scenarios in which
bioretention devices were placed within the Wood Hall sub-basin. Modeling results are reported for
two scales – Basin 15 and the Wood Hall sub-basin. % Add. Control (Campus) refers to the additional
percentage of pollution control the entire campus would receive if such a device were implemented.
Basin 15 - Wood Hall TSS
Conditions Existing Wood 1% Wood 2.5% Wood 5% Wood 15%
Basin 15 Export 18,799.50 17,135.95 16,331.80 15,890.30 15,691.70
Control (lbs) - 1,633.27 2,425.82 2,866.36 3,062.86
% Control (Basin 15) - 8.85 13.13 15.47 16.53
% Add. Control (Campus) - 1.70 2.60 3.20 3.40
Basin 15 - Wood Hall TP
Conditions Existing Wood 1% Wood 2.5% Wood 5% Wood 15%
Basin 15 Export 55.91 51.93 49.42 47.88 46.82
Control (lbs) - 3.98 6.49 8.03 9.09
% Control (Basin 15) - 7.12 11.61 14.36 16.26
% Add. Control (Campus) - 1.87 3.05 3.78 4.28
Wood Hall Sub-Basin TSS
Conditions Existing Wood 1% Wood 2.5% Wood 5% Wood 15%
Sub-basin export 3,062.86 1429.59 637.04 196.5 0
Control (lbs) - 1,633.27 2,425.82 2,866.36 3,062.86
% Control (Sub-Basin) - 53.32 79.20 93.58 100.00
Wood Hall Sub-Basin TP
Conditions Existing Wood 1% Wood 2.5% Wood 5% Wood 15%
Sub-basin export 8.99 5.08 2.6 1.05 0
Control (lbs) - 3.92 6.39 7.94 8.99
% Control (Sub-Basin) - 43.54 71.09 88.33 100.00

103
Appendix E: WinSLAMM results for existing condition, and under various scenarios in which
bioretention devices were placed within the Weidner Center sub-basin. Modeling results are reported
for two scales – Basin 15 and the Weidner Center sub-basin. % Add. Control (Campus) refers to the
additional percentage of pollution control the entire campus would receive if such a device were
implemented.
Basin 15 - Weidner Center Sub-Basin TSS
Conditions Existing Weidner 1% Weidner 2.5% Weidner 5% Weidner 15%
Basin 15 Export 18,799.50 17,261.86 16,272.98 15,626.28 15,420.88
Control (lbs) - 1,537.64 2,526.52 3,173.22 3,558.62
% Control (Basin 15) - 8.18 13.44 16.88 18.93
% Add. Control (Campus) - 1.70 2.80 3.40 3.90
Basin 15 - Weidner Center Sub-Basin TP
Conditions Existing Weidner 1% Weidner 2.5% Weidner 5% Weidner 15%
Basin 15 Export 55.91 53.01 50.88 49.39 48.32
Control (lbs) - 2.92 4.98 6.45 7.51
% Control (Basin 15) - 5.19 9.00 11.66 13.58
% Add. Control (Campus) - 1.37 2.34 3.03 3.53
Weidner Center Sub-Basin TSS
Conditions Existing Weidner 1% Weidner 2.5% Weidner 5% Weidner 15%
Sub-basin export 3,611.64 2,071.40 1,110.22 474.32 94.95
Control (lbs) - 1,540.24 2,501.42 3,137.32 3,516.69
% Control (Sub-Basin) - 42.65 69.26 86.87 97.37
Weidner Center Sub-Basin TP
Conditions Existing Weidner 1% Weidner 2.5% Weidner 5% Weidner 15%
Sub-basin export 7.81 4.89 2.83 1.36 0.30
Control (lbs) - 2.92 4.98 6.45 7.51
% Control (Sub-Basin) - 37.36 63.75 82.60 96.20
Appendix F: WinSLAMM results for existing condition, and the two scenarios in which porous pavement
were placed within the Wood Hall parking lot. % Add. Control (Campus) refers to the additional
percentage of pollution control the entire campus would receive if such a device were implemented.

104
Porous Pavement Basin 4 + Wood Hall Parking Lot
Existing Scenario I Scenario II
TSS Export 3612 3177 2495
TSS (lbs.) removed - 434 1117
% TSS Control - 12% 31%
TP Export 6.562 5.85 4.72
TP (lbs.) removed - 0.72 1.84
% TP Control - 11% 28%
% Add. TSS Control (Campus) - 0.5% 1.2%
% Add. TP Control (Campus) - 0.3% 0.7%